Recently Published Bulletin Reports
Erebus (Antarctica) Lava lake remains active; most thermal alerts recorded since 2019
Rincon de la Vieja (Costa Rica) Frequent phreatic explosions during July-December 2023
Bezymianny (Russia) Explosion on 18 October 2023 sends ash plume 8 km high; lava flows and incandescent avalanches
Kilauea (United States) Low-level lava effusions in the lava lake at Halema’uma’u during July-December 2022
Nyamulagira (DR Congo) Lava flows and thermal activity during May-October 2023
Bagana (Papua New Guinea) Explosions, ash plumes, ashfall, and lava flows during April-September 2023
Mayon (Philippines) Lava flows, pyroclastic flows, ash emissions, and seismicity during April-September 2023
Nishinoshima (Japan) Eruption plumes and gas-and-steam plumes during May-August 2023
Krakatau (Indonesia) White gas-and-steam plumes and occasional ash plumes during May-August 2023
Villarrica (Chile) Strombolian activity, gas-and-ash emissions, and crater incandescence during April-September 2023
Merapi (Indonesia) Frequent incandescent avalanches during April-September 2023
Ebeko (Russia) Moderate explosive activity with ash plumes continued during June-November 2023
Erebus (Antarctica) — January 2024  Cite this Report
Erebus
Antarctica
77.53°S, 167.17°E; summit elev. 3794 m
All times are local (unless otherwise noted)
Lava lake remains active; most thermal alerts recorded since 2019
The lava lake in the summit crater of Erebus has been active since at least 1972. Located in Antarctica overlooking the McMurdo Station on Ross Island, it is the southernmost active volcano on the planet. Because of the remote location, activity is primarily monitored by satellites. This report covers activity during 2023.
The number of thermal alerts recorded by the Hawai'i Institute of Geophysics and Planetology’s MODVOLC Thermal Alerts System increased considerably in 2023 compared to the years 2020-2022 (table 9). In contrast to previous years, the MODIS instruments aboard the Aqua and Terra satellites captured data from Erebus every month during 2023. Consistent with previous years, the lowest number of anomalous pixels were recorded in January, November, and December.
Table 9. Number of monthly MODIS-MODVOLC thermal alert pixels recorded at Erebus during 2017-2023. See BGVN 42:06 for data from 2000 through 2016. The table was compiled using data provided by the HIGP – MODVOLC Thermal Alerts System.
| Year |
Jan |
Feb |
Mar |
Apr |
May |
Jun |
Jul |
Aug |
Sep |
Oct |
Nov |
Dec |
SUM |
| 2017 |
0 |
21 |
9 |
0 |
0 |
1 |
11 |
61 |
76 |
52 |
0 |
3 |
234 |
| 2018 |
0 |
21 |
58 |
182 |
55 |
17 |
137 |
172 |
103 |
29 |
0 |
0 |
774 |
| 2019 |
2 |
21 |
162 |
151 |
55 |
56 |
75 |
53 |
29 |
19 |
1 |
0 |
624 |
| 2020 |
0 |
2 |
16 |
18 |
4 |
4 |
1 |
3 |
18 |
3 |
1 |
6 |
76 |
| 2021 |
0 |
9 |
1 |
0 |
2 |
56 |
46 |
47 |
35 |
52 |
5 |
3 |
256 |
| 2022 |
1 |
13 |
55 |
22 |
15 |
32 |
39 |
19 |
31 |
11 |
0 |
0 |
238 |
| 2023 |
2 |
33 |
49 |
82 |
41 |
32 |
70 |
64 |
42 |
17 |
5 |
11 |
448 |
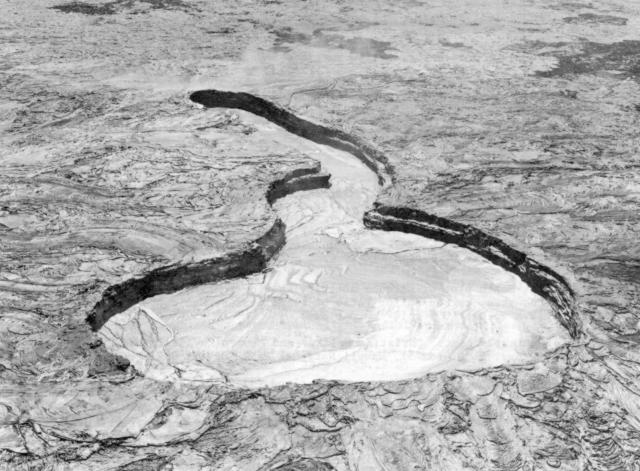
Sentinel-2 infrared images showed one or two prominent heat sources within the summit crater, accompanied by adjacent smaller sources, similar to recent years (see BGVN 46:01, 47:02, and 48:01). A unique image was obtained on 25 November 2023 by the OLI-2 (Operational Land Imager-2) on Landsat 9, showing the upper part of the volcano surrounded by clouds (figure 32).
Geologic Background. Mount Erebus, the world's southernmost historically active volcano, overlooks the McMurdo research station on Ross Island. It is the largest of three major volcanoes forming the crudely triangular Ross Island. The summit of the dominantly phonolitic volcano has been modified by one or two generations of caldera formation. A summit plateau at about 3,200 m elevation marks the rim of the youngest caldera, which formed during the late-Pleistocene and within which the modern cone was constructed. An elliptical 500 x 600 m wide, 110-m-deep crater truncates the summit and contains an active lava lake within a 250-m-wide, 100-m-deep inner crater; other lava lakes are sometimes present. The glacier-covered volcano was erupting when first sighted by Captain James Ross in 1841. Continuous lava-lake activity with minor explosions, punctuated by occasional larger Strombolian explosions that eject bombs onto the crater rim, has been documented since 1972, but has probably been occurring for much of the volcano's recent history.
Information Contacts: Hawai'i Institute of Geophysics and Planetology (HIGP) - MODVOLC Thermal Alerts System, School of Ocean and Earth Science and Technology (SOEST), Univ. of Hawai'i, 2525 Correa Road, Honolulu, HI 96822, USA (URL: http://modis.higp.hawaii.edu/); Copernicus Browser, Copernicus Data Space Ecosystem, European Space Agency (URL: https://dataspace.copernicus.eu/browser/); NASA Earth Observatory, EOS Project Science Office, NASA Goddard Space Flight Center, Goddard, Maryland, USA (URL: https://earthobservatory.nasa.gov/images/152134/erebus-breaks-through).
Rincon de la Vieja (Costa Rica) — January 2024 Cite this Report
Rincon de la Vieja
Costa Rica
10.83°N, 85.324°W; summit elev. 1916 m
All times are local (unless otherwise noted)
Frequent phreatic explosions during July-December 2023
Rincón de la Vieja is a volcanic complex in Costa Rica with a hot convecting acid lake that exhibits frequent weak phreatic explosions, gas-and-steam emissions, and occasional elevated sulfur dioxide levels (BGVN 45:10, 46:03, 46:11). The current eruption period began June 2021. This report covers activity during July-December 2023 and is based on weekly bulletins and occasional daily reports from the Observatorio Vulcanologico Sismologica de Costa Rica-Universidad Nacional (OVSICORI-UNA).
Numerous weak phreatic explosions continued during July-December 2023, along with gas-and-steam emissions and plumes that rose as high as 3 km above the crater rim. Many weekly OVSICORI-UNA bulletins included the previous week's number of explosions and emissions (table 9). For many explosions, the time of explosion was given (table 10). Frequent seismic activity (long-period earthquakes, volcano-tectonic earthquakes, and tremor) accompanied the phreatic activity.
Table 9. Number of reported weekly phreatic explosions and gas-and-steam emissions at Rincón de la Vieja, July-December 2023. Counts are reported for the week before the Weekly Bulletin date; not all reports included these data. Courtesy of OVSICORI-UNA.
| OVSICORI Weekly Bulletin |
Number of explosions |
Number of emissions |
| 28 Jul 2023 |
6 |
14 |
| 4 Aug 2023 |
10 |
12 |
| 1 Sep 2023 |
13 |
11 |
| 22 Sep 2023 |
12 |
13 |
| 29 Sep 2023 |
6 |
11 |
| 6 Oct 2023 |
12 |
5 |
| 13 Oct 2023 |
7 |
9 |
| 20 Oct 2023 |
1 |
15 |
| 27 Oct 2023 |
3 |
23 |
| 3 Nov 2023 |
3 |
10 |
| 17 Nov 2023 |
0 |
Some |
| 24 Nov 2023 |
0 |
14 |
| 8 Dec 2023 |
4 |
16 |
| 22 Dec 2023 |
8 |
18 |
Table 10. Summary of activity at Rincón de la Vieja during July-December 2023. Weak phreatic explosions and gas emissions are noted where the time of explosion was indicated in the weekly or daily bulletins. Height of plumes or emissions are distance above the crater rim. Courtesy of OVSICORI-UNA.
| Date |
Time |
Description of Activity |
| 1 Jul 2023 |
0156 |
Explosion. |
| 2 Jul 2023 |
0305 |
Explosion. |
| 4 Jul 2023 |
0229, 0635 |
Event at 0635 produced a gas-and-steam plume that rose 700 m and drifted W; seen by residents in Liberia (21 km SW). |
| 9 Jul 2023 |
1843 |
Explosion. |
| 21 Jul 2023 |
0705 |
Explosion. |
| 26 Jul 2023 |
1807 |
Explosion. |
| 28 Jul 2023 |
0802 |
Explosion generated a gas-and-steam plume that rose 500 m. |
| 30 Jul 2023 |
1250 |
Explosion. |
| 31 Jul 2023 |
2136 |
Explosion. |
| 11 Aug 2023 |
0828 |
Explosion. |
| 18 Aug 2023 |
1304 |
Explosion. |
| 21 Aug 2023 |
1224 |
Explosion generated gas-and-steam plumes rose 500-600 m. |
| 22 Aug 2023 |
0749 |
Explosion generated gas-and-steam plumes rose 500-600 m. |
| 24 Aug 2023 |
1900 |
Explosion. |
| 25 Aug 2023 |
0828 |
Event produced a steam-and-gas plume that rose 3 km and drifted NW. |
| 27-28 Aug 2023 |
0813 |
Four small events; the event at 0813 on 28 August lasted two minutes and generated a steam-and-gas plume that rose 2.5 km. |
| 1 Sep 2023 |
1526 |
Explosion generated plume that rose 2 km and ejected material onto the flanks. |
| 2-3 Sep 2023 |
- |
Small explosions detected in infrasound data. |
| 4 Sep 2023 |
1251 |
Gas-and-steam plume rose 1 km and drifted W. |
| 7 Nov 2023 |
1113 |
Explosion. |
| 8 Nov 2023 |
0722 |
Explosion. |
| 12 Nov 2023 |
0136 |
Small gas emissions. |
| 14 Nov 2023 |
0415 |
Small gas emissions. |
According to OVSICORI-UNA, during July-October the average weekly sulfur dioxide (SO2) flux ranged from 68 to 240 tonnes/day. However, in mid-November the flux increased to as high as 334 tonnes/day, the highest value measured in recent years. The high SO2 flux in mid-November was also detected by the TROPOMI instrument on the Sentinel-5P satellite (figure 43).
Geologic Background. Rincón de la Vieja, the largest volcano in NW Costa Rica, is a remote volcanic complex in the Guanacaste Range. The volcano consists of an elongated, arcuate NW-SE-trending ridge constructed within the 15-km-wide early Pleistocene Guachipelín caldera, whose rim is exposed on the south side. Sometimes known as the "Colossus of Guanacaste," it has an estimated volume of 130 km3 and contains at least nine major eruptive centers. Activity has migrated to the SE, where the youngest-looking craters are located. The twin cone of Santa María volcano, the highest peak of the complex, is located at the eastern end of a smaller, 5-km-wide caldera and has a 500-m-wide crater. A Plinian eruption producing the 0.25 km3 Río Blanca tephra about 3,500 years ago was the last major magmatic eruption. All subsequent eruptions, including numerous historical eruptions possibly dating back to the 16th century, have been from the prominent active crater containing a 500-m-wide acid lake located ENE of Von Seebach crater.
Information Contacts: Observatorio Vulcanológico Sismológica de Costa Rica-Universidad Nacional (OVSICORI-UNA), Apartado 86-3000, Heredia, Costa Rica (URL: http://www.ovsicori.una.ac.cr/); NASA Global Sulfur Dioxide Monitoring Page, Atmospheric Chemistry and Dynamics Laboratory, NASA Goddard Space Flight Center (NASA/GSFC), 8800 Greenbelt Road, Goddard MD 20771, USA (URL: https://so2.gsfc.nasa.gov/).
Bezymianny (Russia) — November 2023 Cite this Report
Bezymianny
Russia
55.972°N, 160.595°E; summit elev. 2882 m
All times are local (unless otherwise noted)
Explosion on 18 October 2023 sends ash plume 8 km high; lava flows and incandescent avalanches
Bezymianny, located on Russia’s Kamchatka Peninsula, has had eruptions since 1955 characterized by dome growth, explosions, pyroclastic flows, ash plumes, and ashfall. Activity during November 2022-April 2023 included gas-and-steam emissions, lava dome collapses generating avalanches, and persistent thermal activity. Similar eruptive activity continued from May through October 2023, described here based on information from weekly and daily reports of the Kamchatka Volcano Eruptions Response Team (KVERT), notices from Tokyo VAAC (Volcanic Ash Advisory Center), and from satellite data.
Overall activity decreased after the strong period of activity in late March through April 2023, which included ash explosions during 29 March and 7-8 April 2023 that sent plumes as high as 10-12 km altitude, along with dome growth and lava flows (BGVN 48:05). This reduced activity can be seen in the MIROVA thermal detection system graph (figure 56), which was consistent with data from the MODVOLC thermal detection system and with Sentinel-2 satellite images that showed persistent hotspots in the summit crater when conditions allowed observations. A renewed period of strong activity began in mid-October 2023.
Activity increased significantly on 17 October 2023 when large collapses began during 0700-0830 on the E flanks of the lava dome and continued to after 0930 the next day (figure 57). Ash plumes rose to an altitude of 4.5-5 km, extending 220 km NNE by 18 October. A large explosion at 1630 on 18 October produced an ash plume that rose to an altitude of 11 km (8 km above the summit) and drifted NNE and then NW, extending 900 km NW within two days at an altitude of 8 km. Minor ashfall was noted in Kozyrevsk (45 km WNW). At 0820 on 20 October an ash plume was identified in satellite images drifting 100 km ENE at altitudes of 4-4.5 km.
Lava flows and hot avalanches from the dome down the SE flank continued over the next few days, including 23 October when clear conditions allowed good observations (figures 58 and 59). A large thermal anomaly was observed over the volcano through 24 October, and in the summit crater on 30 October (figure 60). Strong fumarolic activity continued, with numerous avalanches and occasional incandescence. By the last week of October, volcanic activity had decreased to a level consistent with that earlier in the reporting period.
Aviation warnings were frequently updated during 17-20 October. KVERT issued a Volcano Observatory Notice for Aviation (VONA) on 17 October at 1419 and 1727 (0219 and 0527 UTC) raising the Aviation Color Code (ACC) from Yellow to Orange (second highest level). The next day, KVERT issued a VONA at 1705 (0505 UTC) raising the ACC to Red (highest level) but lowered it back to Orange at 2117 (0917 UTC). After another decrease to Yellow and back to Orange, the ACC was reduced to Yellow on 20 October at 1204 (0004 UTC). In addition, the Tokyo VAAC issued a series of Volcanic Ash Advisories beginning on 16 October and continuing through 30 October.
Geologic Background. The modern Bezymianny, much smaller than its massive neighbors Kamen and Kliuchevskoi on the Kamchatka Peninsula, was formed about 4,700 years ago over a late-Pleistocene lava-dome complex and an edifice built about 11,000-7,000 years ago. Three periods of intensified activity have occurred during the past 3,000 years. The latest period, which was preceded by a 1,000-year quiescence, began with the dramatic 1955-56 eruption. This eruption, similar to that of St. Helens in 1980, produced a large open crater that was formed by collapse of the summit and an associated lateral blast. Subsequent episodic but ongoing lava-dome growth, accompanied by intermittent explosive activity and pyroclastic flows, has largely filled the 1956 crater.
Information Contacts: Kamchatka Volcanic Eruptions Response Team (KVERT), Far Eastern Branch, Russian Academy of Sciences, 9 Piip Blvd., Petropavlovsk-Kamchatsky, 683006, Russia (URL: http://www.kscnet.ru/ivs/kvert/); Kamchatka Volcanological Station, Kamchatka Branch of Geophysical Survey, (KB GS RAS), Klyuchi, Kamchatka Krai, Russia (URL: http://volkstat.ru/); Tokyo Volcanic Ash Advisory Center (VAAC), 1-3-4 Otemachi, Chiyoda-ku, Tokyo 100-8122, Japan (URL: http://ds.data.jma.go.jp/svd/vaac/data/); Hawai'i Institute of Geophysics and Planetology (HIGP) - MODVOLC Thermal Alerts System, School of Ocean and Earth Science and Technology (SOEST), Univ. of Hawai'i, 2525 Correa Road, Honolulu, HI 96822, USA (URL: http://modis.higp.hawaii.edu/); MIROVA (Middle InfraRed Observation of Volcanic Activity), a collaborative project between the Universities of Turin and Florence (Italy) supported by the Centre for Volcanic Risk of the Italian Civil Protection Department (URL: http://www.mirovaweb.it/); Copernicus Browser, Copernicus Data Space Ecosystem, European Space Agency (URL: https://dataspace.copernicus.eu/browser/).chr
Kilauea (United States) — January 2023 Cite this Report
Kilauea
United States
19.421°N, 155.287°W; summit elev. 1222 m
All times are local (unless otherwise noted)
Low-level lava effusions in the lava lake at Halema’uma’u during July-December 2022
Kīlauea is the southeastern-most volcano in Hawaii and overlaps the E flank of the Mauna Loa volcano. Its East Rift Zone (ERZ) has been intermittently active for at least 2,000 years. An extended eruption period began in January 1983 and was characterized by open lava lakes and lava flows from the summit caldera and the East Rift Zone. During May 2018 magma migrated into the Lower East Rift Zone (LERZ) and opened 24 fissures along a 6-km-long NE-trending fracture zone that produced lava flows traveling in multiple directions. As lava emerged from the fissures, the lava lake at Halema'uma'u drained and explosions sent ash plumes to several kilometers altitude (BGVN 43:10).
The current eruption period started during September 2021 and has recently been characterized by lava effusions, spatter, and sulfur dioxide emissions in the active Halema’uma’u lava lake (BGVN 47:08). Lava effusions, some spatter, and sulfur dioxide emissions have continued during this reporting period of July through December 2022 using daily reports, volcanic activity notices, and abundant photo, map, and video data from the US Geological Survey's (USGS) Hawaiian Volcano Observatory (HVO).
Summary of activity during July-December 2022. Low-level effusions have continued at the western vent of the Halema’uma’u crater during July through early December 2022. Occasional weak ooze-outs (also called lava break outs) would occur along the margins of the crater floor. The overall level of the active lava lake throughout the reporting period gradually increased due to infilling, however it stagnated in mid-September (table 13). During September through November, activity began to decline, though lava effusions persisted at the western vent. By 9 December, the active part of the lava lake had completely crusted over, and incandescence was no longer visible.
Table 13. Summary of measurements taken during overflights at Kīlauea that show a gradual increase in the active lava lake level and the volume of lava effused since 29 September 2021. Lower activity was reported during September-October. Data collected during July-December 2022. Courtesy of HVO.
| Date: |
Level of the active lava lake (m): |
Cumulative volume of lava effused (million cubic meters): |
| 7 Jul 2022 |
130 |
95 |
| 19 Jul 2022 |
133 |
98 |
| 4 Aug 2022 |
136 |
102 |
| 16 Aug 2022 |
137 |
104 |
| 12 Sep 2022 |
143 |
111 |
| 5 Oct 2022 |
143 |
111 |
| 28 Oct 2022 |
143 |
111 |
Activity during July 2022. Lava effusions were reported from the western vent in the Halema’uma’u crater, along with occasional weak ooze-outs along the margins of the crater floor. The height of the lava lake was variable due to deflation-inflation tilt events; for example, the lake level dropped approximately 3-4 m during a summit deflation-inflation event reported on 1 July. Webcam images taken during the night of 6-12 July showed intermittent low-level spattering at the western vent that rose less than 10 m above the vent (figure 519). Measurements made during an overflight on 7 July indicated that the crater floor was infilled about 130 m and that 95 million cubic meters of lava had been effused since 29 September 2021. A single, relatively small lava ooze-out was active to the S of the lava lake. Around midnight on 8 July there were two brief periods of lava overflow onto the lake margins. On 9 July lava ooze-outs were reported near the SE and NE edges of the crater floor and during 10-11 July they occurred near the E, NE, and NW edges. On 16 July crater incandescence was reported, though the ooze-outs and spattering were not visible. On 18 July overnight webcam images showed incandescence in the western vent complex and two ooze-outs were reported around 0000 and 0200 on 19 July. By 0900 there were active ooze-outs along the SW edge of the crater floor. Measurements made from an overflight on 19 July indicated that the crater floor was infilled about 133 m and 98 million cubic meters of lava had erupted since 29 September 2021 (figure 520). On 20 July around 1600 active ooze-outs were visible along the N edge of the crater, which continued through the next day. Extensive ooze-outs occurred along the W margin during 24 July until 1900; on 26 July minor ooze-outs were noted along the N margin. Minor spattering was visible on 29 July along the E margin of the lake. The sulfur dioxide emission rates ranged 650-2,800 tons per day (t/d), the higher of which was measured on 8 July (figure 519).
Activity during August 2022. The eruption continued in the Halema’uma’u crater at the western vent. According to HVO the lava in the active lake remained at the level of the bounding levees. Occasional minor ooze-outs were observed along the margins of the crater floor. Strong nighttime crater incandescence was visible after midnight on 6 August over the western vent cone. During 6-7 August scattered small lava lobes were active along the crater floor and incandescence persisted above the western vent through 9 August. During 7-9 August HVO reported a single lava effusion source was active along the NW margin of the crater floor. Measurements from an overflight on 4 August indicated that the crater floor was infilled about 136 m total and that 102 million cubic meters of lava had been erupted since the start of the eruption. Lava breakouts were reported along the N, NE, E, S, and W margins of the crater during 10-16 August. Another overflight survey conducted on 16 August indicated that the crater floor infilled about 137 m and 104 million cubic meters of lava had been erupted since September 2021. Measured sulfur dioxide emissions rates ranged 1,150-2,450 t/d, the higher of which occurred on 8 August.
Activity during September 2022. During September, lava effusion continued from the western vent into the active lava lake and onto the crater floor. Intermittent minor ooze-outs were reported through the month. A small ooze-out was visible on the W crater floor margin at 0220 on 2 September, which showed decreasing surface activity throughout the day, but remained active through 3 September. On 3 September around 1900 a lava outbreak occurred along the NW margin of the crater floor but had stopped by the evening of 4 September. Field crews monitoring the summit lava lake on 9 September observed spattering on the NE margin of the lake that rose no higher than 10 m, before falling back onto the lava lake crust (figure 521). Overflight measurements on 12 September indicated that the crater floor was infilled a total of 143 m and 111 million cubic meters of lava had been erupted since September 2021. Extensive breakouts in the W and N part of the crater floor were reported at 1600 on 20 September and continued into 26 September. The active part of the lava lake dropped by 10 m while other parts of the crater floor dropped by several meters. Summit tiltmeters recorded a summit seismic swarm of more than 80 earthquakes during 1500-1800 on 21 September, which occurred about 1.5 km below Halema’uma’u; a majority of these were less than Mw 2. By 22 September the active part of the lava lake was infilled about 2 m. On 23 September the western vent areas exhibited several small spatter cones with incandescent openings, along with weak, sporadic spattering (figure 522). The sulfur dioxide emission rate ranged from 930 t/d to 2,000 t/d, the higher of which was measured on 6 September.
Activity during October 2022. Activity during October declined slightly compared to previous months, though lava effusions persisted from the western vent into the active lava lake and onto the crater floor during October (figure 523). Slight variations in the lava lake were noted throughout the month. HVO reported that around 0600 on 3 October the level of the lava lake has lowered slightly. Overflight measurements taken on 5 October indicated that the crater floor was infilled a total of about 143 m and that 111 million cubic meters of lava had been effused since September 2021. During 6-7 October the lake gradually rose 0.5 m. Sulfur dioxide measurements made on 22 October had an emission rate of 700 t/d. Another overflight taken on 28 October showed that there was little to no change in the elevation of the crater floor: the crater floor was infilled a total of 143 m and 111 million cubic meters of lava had erupted since the start of the eruption.
Activity during November 2022. Activity remained low during November, though HVO reported that lava from the western vent continued to effuse into the active lava lake and onto the crater floor throughout the month. The rate of sulfur dioxide emissions during November ranged from 300-600 t/d, the higher amount of which occurred on 9 November.
Activity during December 2022. Similar low activity was reported during December, with lava effusing from the western vent into the active lava lake and onto the crater floor. During 4-5 December the active part of the lava lake was slightly variable in elevation and fluctuated within 1 m. On 9 December HVO reported that lava was no longer erupting from the western vent in the Halema’uma’u crater and that sulfur dioxide emissions had returned to near pre-eruption background levels; during 10-11 December, the lava lake had completely crusted over, and no incandescence was visible (figure 524). Time lapse camera images covering the 4-10 December showed that the crater floor showed weak deflation and no inflation. Some passive events of crustal overturning were reported during 14-15 December, which brought fresh incandescent lava to the lake surface. The sulfur dioxide emission rate was approximately 200 t/d on 14 December. A smaller overturn event on 17 December and another that occurred around 0000 and into the morning of 20 December were also detected. A small seismic swarm was later detected on 30 December.
Geologic Background. Kilauea overlaps the E flank of the massive Mauna Loa shield volcano in the island of Hawaii. Eruptions are prominent in Polynesian legends; written documentation since 1820 records frequent summit and flank lava flow eruptions interspersed with periods of long-term lava lake activity at Halemaumau crater in the summit caldera until 1924. The 3 x 5 km caldera was formed in several stages about 1,500 years ago and during the 18th century; eruptions have also originated from the lengthy East and Southwest rift zones, which extend to the ocean in both directions. About 90% of the surface of the basaltic shield volcano is formed of lava flows less than about 1,100 years old; 70% of the surface is younger than 600 years. The long-term eruption from the East rift zone between 1983 and 2018 produced lava flows covering more than 100 km2, destroyed hundreds of houses, and added new coastline.
Information Contacts: Hawaiian Volcano Observatory (HVO), U.S. Geological Survey, PO Box 51, Hawai'i National Park, HI 96718, USA (URL: http://hvo.wr.usgs.gov/).
Nyamulagira (DR Congo) — November 2023 Cite this Report
Nyamulagira
DR Congo
1.408°S, 29.2°E; summit elev. 3058 m
All times are local (unless otherwise noted)
Lava flows and thermal activity during May-October 2023
Nyamulagira (also known as Nyamuragira) is a shield volcano in the Democratic Republic of Congo with the summit truncated by a small 2 x 2.3 km caldera with walls up to about 100 m high. Documented eruptions have occurred within the summit caldera, as well as from numerous flank fissures and cinder cones. The current eruption period began in April 2018 and has more recently been characterized by summit crater lava flows and thermal activity (BGVN 48:05). This report describes lava flows and variable thermal activity during May through October 2023, based on information from the Observatoire Volcanologique de Goma (OVG) and various satellite data.
Lava lake activity continued during May. The MIROVA (Middle InfraRed Observation of Volcanic Activity) system recorded moderate-to-strong thermal activity throughout the reporting period; activity was more intense during May and October and relatively weaker from June through September (figure 95). The MODVOLC thermal algorithm, detected a total of 209 thermal alerts. There were 143 hotspots detected during May, eight during June, nine during September, and 49 during October. This activity was also reflected in infrared satellite images, where a lava flow was visible in the NW part of the crater on 7 May and strong activity was seen in the center of the crater on 4 October (figure 96). Another infrared satellite image taken on 12 May showed still active lava flows along the NW margin of the crater. According to OVG lava effusions were active during 7-29 May and moved to the N and NW parts of the crater beginning on 9 May. Strong summit crater incandescence was visible from Goma (27 km S) during the nights of 17, 19, and 20 May (figure 97). On 17 May there was an increase in eruptive activity, which peaked at 0100 on 20 May. Notable sulfur dioxide plumes drifted NW and W during 19-20 May (figure 98). Drone footage acquired in partnership with the USGS (United States Geological Survey) on 20 May captured images of narrow lava flows that traveled about 100 m down the W flank (figure 99). Data from the Rumangabo seismic station indicated a decreasing trend in activity during 17-21 May. Although weather clouds prevented clear views of the summit, a strong thermal signature on the NW flank was visible in an infrared satellite image on 22 May, based on an infrared satellite image. On 28 May the lava flows on the upper W flank began to cool and solidify. By 29 May seismicity returned to levels similar to those recorded before the 17 May increase. Lava effusion continued but was confined to the summit crater; periodic crater incandescence was observed.
Low-level activity was noted during June through October. On 1 June OVG reported that seismicity remained at lower levels and that crater incandescence had been absent for three days, though infrared satellite imagery showed continued lava effusion in the summit crater. The lava flows on the flanks covered an estimated 0.6 km2. Satellite imagery continued to show thermal activity confined to the lava lake through October (figure 96), although no lava flows or significant sulfur dioxide emissions were reported.
Geologic Background. Africa's most active volcano, Nyamulagira (also known as Nyamuragira), is a massive high-potassium basaltic shield about 25 km N of Lake Kivu and 13 km NNW of the steep-sided Nyiragongo volcano. The summit is truncated by a small 2 x 2.3 km caldera that has walls up to about 100 m high. Documented eruptions have occurred within the summit caldera, as well as from the numerous flank fissures and cinder cones. A lava lake in the summit crater, active since at least 1921, drained in 1938, at the time of a major flank eruption. Recent lava flows extend down the flanks more than 30 km from the summit as far as Lake Kivu; extensive lava flows from this volcano have covered 1,500 km2 of the western branch of the East African Rift.
Information Contacts: Observatoire Volcanologique de Goma (OVG), Departement de Geophysique, Centre de Recherche en Sciences Naturelles, Lwiro, D.S. Bukavu, DR Congo; Hawai'i Institute of Geophysics and Planetology (HIGP) - MODVOLC Thermal Alerts System, School of Ocean and Earth Science and Technology (SOEST), Univ. of Hawai'i, 2525 Correa Road, Honolulu, HI 96822, USA (URL: http://modis.higp.hawaii.edu/); MIROVA (Middle InfraRed Observation of Volcanic Activity), a collaborative project between the Universities of Turin and Florence (Italy) supported by the Centre for Volcanic Risk of the Italian Civil Protection Department (URL: http://www.mirovaweb.it/); NASA Global Sulfur Dioxide Monitoring Page, Atmospheric Chemistry and Dynamics Laboratory, NASA Goddard Space Flight Center (NASA/GSFC), 8800 Greenbelt Road, Goddard, Maryland, USA (URL: https://so2.gsfc.nasa.gov/); Copernicus Browser, Copernicus Data Space Ecosystem, European Space Agency (URL: https://dataspace.copernicus.eu/browser/); Charles Balagizi, Goma Volcano Observatory, Departement de Geophysique, Centre de Recherche en Sciences Naturelles, Lwiro, D.S. Bukavu, DR Congo.
Bagana (Papua New Guinea) — October 2023 Cite this Report
Bagana
Papua New Guinea
6.137°S, 155.196°E; summit elev. 1855 m
All times are local (unless otherwise noted)
Explosions, ash plumes, ashfall, and lava flows during April-September 2023
The remote volcano of Bagana is located in central Bougainville Island, Papua New Guinea. Recorded eruptions date back to 1842 and activity has consisted of effusive activity that has built a small lava dome in the summit crater and occasional explosions that produced pyroclastic flows. The most recent eruption has been ongoing since February 2000 and has produced occasional explosions, ash plumes, and lava flows. More recently, activity has been characterized by ongoing effusive activity and ash emissions (BGVN 48:04). This report updates activity from April through September 2023 that has consisted of explosions, ash plumes, ashfall, and lava flows, using information from the Darwin Volcanic Ash Advisory Center (VAAC) and satellite data.
An explosive eruption was reported on 7 July that generated a large gas-and-ash plume to high altitudes and caused significant ashfall in local communities; the eruption plume had reached upper tropospheric (16-18 km altitude) altitudes by 2200, according to satellite images. Sulfur dioxide plumes were detected in satellite images on 8 July and indicated that the plume was likely a mixture of gas, ice, and ash. A report issued by the Autonomous Bougainville Government (ABG) (Torokina District, Education Section) on 10 July noted that significant ash began falling during 2000-2100 on 7 July and covered most areas in the Vuakovi, Gotana (9 km SW), Koromaketo, Laruma (25 km W) and Atsilima (27 km NW) villages. Pyroclastic flows also occurred, according to ground-based reports; small deposits confined to one drainage were inspected by RVO during an overflight on 17 July and were confirmed to be from the 7 July event. Ashfall continued until 10 July and covered vegetation, which destroyed bushes and gardens and contaminated rivers and streams.
RVO reported another eruption on 14 July. The Darwin VAAC stated that an explosive event started around 0830 on 15 July and produced an ash plume that rose to 16.5 km altitude by 1000 and drifted N, according to satellite images. The plume continued to drift N and remained visible through 1900, and by 2150 it had dissipated.
Ashfall likely from both the 7 and 15 July events impacted about 8,111 people in Torokina (20 km SW), including Tsito/Vuakovi, Gotana, Koromaketo, Kenaia, Longkogari, Kenbaki, Piva (13 km SW), and Atsinima, and in the Tsitovi district, according to ABG. Significant ashfall was also reported in Ruruvu (22 km N) in the Wakunai District of Central Bougainville, though the thickness of these deposits could not be confirmed. An evacuation was called for the villages in Wakunai, where heavy ashfall had contaminated water sources; the communities of Ruruvu, Togarau, Kakarapaia, Karauturi, Atao, and Kuritaturi were asked to evacuate to a disaster center at the Wakunai District Station, and communities in Torokina were asked to evacuate to the Piva District station. According to a news article, more than 7,000 people needed temporary accommodations, with about 1,000 people in evacuation shelters. Ashfall had deposited over a broad area, contaminating water supplies, affecting crops, and collapsing some roofs and houses in rural areas. Schools were temporarily shut down. Intermittent ash emissions continued through the end of July and drifted NNW, NW, and SW. Fine ashfall was reported on the coast of Torokina, and ash plumes also drifted toward Laruma and Atsilima.
A small explosive eruption occurred at 2130 on 28 July that ejected material from the crater vents, according to reports from Torokina, in addition to a lava flow that contained two lobes. A second explosion was detected at 2157. Incandescence from the lava flow was visible from Piva as it descended the W flank around 2000 on 29 July (figure 47). The Darwin VAAC reported that a strong thermal anomaly was visible in satellite images during 30-31 July and that ash emissions rose to 2.4 km altitude and drifted WSW on 30 July. A ground report from RVO described localized emissions at 0900 on 31 July.
The Darwin VAAC reported that ash plumes were identified in satellite imagery at 0800 and 1220 on 12 August and rose to 2.1 km and 3 km altitude and drifted NW and W, respectively. A news report stated that aid was sent to more than 6,300 people that were adversely affected by the eruption. Photos taken during 17-19 August showed ash emissions rising no higher than 1 km above the summit and drifting SE. A small explosion generated an ash plume during the morning of 19 August. Deposits from small pyroclastic flows were also captured in the photos. Satellite images captured lava flows and pyroclastic flow deposits. Two temporary seismic stations were installed near Bagana on 17 August at distances of 7 km WSW (Vakovi station) and 11 km SW (Kepox station). The Kepox station immediately started to record continuous, low-frequency background seismicity.
Satellite data. Little to no thermal activity was detected during April through mid-July 2023; only one anomaly was recorded during early April and one during early June, according to MIROVA (Middle InfraRed Observation of Volcanic Activity) data (figure 48). Thermal activity increased in both power and frequency during mid-July through September, although there were still some short gaps in detected activity. MODVOLC also detected increased thermal activity during August; thermal hotspots were detected a total of five times on 19, 20, and 27 August. Weak thermal anomalies were also captured in infrared satellite images on clear weather days throughout the reporting period on 7, 12, and 17 April, 27 May, 1, 6, 16, and 31 July, and 19 September (figure 48); a strong thermal anomaly was visible on 31 July. Distinct sulfur dioxide plumes that drifted generally NW were intermittently captured by the TROPOMI instrument on the Sentinel-5P satellite and sometimes exceeded two Dobson Units (DUs) (figure 49).
Geologic Background. Bagana volcano, in a remote portion of central Bougainville Island, is frequently active. This massive symmetrical cone was largely constructed by an accumulation of viscous andesitic lava flows. The entire edifice could have been constructed in about 300 years at its present rate of lava production. Eruptive activity is characterized by non-explosive effusion of viscous lava that maintains a small lava dome in the summit crater, although occasional explosive activity produces pyroclastic flows. Lava flows with tongue-shaped lobes up to 50 m thick and prominent levees descend the flanks on all sides.
Information Contacts: Rabaul Volcano Observatory (RVO), Geohazards Management Division, Department of Mineral Policy and Geohazards Management (DMPGM), PO Box 3386, Kokopo, East New Britain Province, Papua New Guinea; Darwin Volcanic Ash Advisory Centre (VAAC), Bureau of Meteorology, Northern Territory Regional Office, PO Box 40050, Casuarina, NT 0811, Australia (URL: http://www.bom.gov.au/info/vaac/); MIROVA (Middle InfraRed Observation of Volcanic Activity), a collaborative project between the Universities of Turin and Florence (Italy) supported by the Centre for Volcanic Risk of the Italian Civil Protection Department (URL: http://www.mirovaweb.it/); Hawai'i Institute of Geophysics and Planetology (HIGP) - MODVOLC Thermal Alerts System, School of Ocean and Earth Science and Technology (SOEST), Univ. of Hawai'i, 2525 Correa Road, Honolulu, HI 96822, USA (URL: http://modis.higp.hawaii.edu/); NASA Global Sulfur Dioxide Monitoring Page, Atmospheric Chemistry and Dynamics Laboratory, NASA Goddard Space Flight Center (NASA/GSFC), 8800 Greenbelt Road, Goddard, Maryland, USA (URL: https://so2.gsfc.nasa.gov/); Copernicus Browser, Copernicus Data Space Ecosystem, European Space Agency (URL: https://dataspace.copernicus.eu/browser/); Autonomous Bougainville Government, P.O Box 322, Buka, AROB, PNG (URL: https://abg.gov.pg/); Andrew Tupper (Twitter: @andrewcraigtupp); Simon Carn, Geological and Mining Engineering and Sciences, Michigan Technological University, 1400 Townsend Drive, Houghton, MI 49931, USA (URL: http://www.volcarno.com/, Twitter: @simoncarn); Radio NZ (URL: https://www.rnz.co.nz/news/pacific/494464/more-than-7-000-people-in-bougainville-need-temporary-accommodation-after-eruption); USAID, 1300 Pennsylvania Ave, NW, Washington DC 20004, USA (URL: https://www.usaid.gov/pacific-islands/press-releases/aug-08-2023-united-states-provides-immediate-emergency-assistance-support-communities-affected-mount-bagana-volcanic-eruptions).
Mayon (Philippines) — October 2023 Cite this Report
Mayon
Philippines
13.257°N, 123.685°E; summit elev. 2462 m
All times are local (unless otherwise noted)
Lava flows, pyroclastic flows, ash emissions, and seismicity during April-September 2023
Mayon is located in the Philippines and has steep upper slopes capped by a small summit crater. Historical eruptions date back to 1616 CE that have been characterized by Strombolian eruptions, lava flows, pyroclastic flows, and mudflows. Eruptions mostly originated from a central conduit. Pyroclastic flows and mudflows have commonly descended many of the approximately 40 drainages that surround the volcano. The most recent eruption occurred during June through October 2022 and consisted of lava dome growth and gas-and-steam emissions (BGVN 47:12). A new eruption was reported during late April 2023 and has included lava flows, pyroclastic density currents, ash emissions, and seismicity. This report covers activity during April through September 2023 based on daily bulletins from the Philippine Institute of Volcanology and Seismology (PHIVOLCS).
During April through September 2023, PHIVOLCS reported near-daily rockfall events, frequent volcanic earthquakes, and sulfur dioxide measurements. Gas-and-steam emissions rose 100-900 m above the crater and drifted in different directions. Nighttime crater incandescence was often visible during clear weather and was accompanied by incandescent avalanches of material. Activity notably increased during June when lava flows were reported on the S, SE, and E flanks (figure 52). The MIROVA graph (Middle InfraRed Observation of Volcanic Activity) showed strong thermal activity coincident with these lava flows, which remained active through September (figure 53). According to the MODVOLC thermal algorithm, a total of 110 thermal alerts were detected during the reporting period: 17 during June, 40 during July, 27 during August, and 26 during September. During early June, pyroclastic density currents (PDCs) started to occur more frequently.
Low activity was reported during much of April and May; gas-and-steam emissions rose 100-900 m above the crater and generally drifted in different directions. A total of 52 rockfall events and 18 volcanic earthquakes were detected during April and 147 rockfall events and 13 volcanic events during May. Sulfur dioxide flux measurements ranged between 400-576 tons per day (t/d) during April, the latter of which was measured on 29 April and between 162-343 t/d during May, the latter of which was measured on 13 May.
Activity during June increased, characterized by lava flows, pyroclastic density currents (PDCs), crater incandescence and incandescent rockfall events, gas-and-steam emissions, and continued seismicity. Weather clouds often prevented clear views of the summit, but during clear days, moderate gas-and-steam emissions rose 100-2,500 m above the crater and drifted in multiple directions. A total of 6,237 rockfall events and 288 volcanic earthquakes were detected. The rockfall events often deposited material on the S and SE flanks within 700-1,500 m of the summit crater and ash from the events drifted SW, S, SE, NE, and E. Sulfur dioxide emissions ranged between 149-1,205 t/d, the latter of which was measured on 10 June. Short-term observations from EDM and electronic tiltmeter monitoring indicated that the upper slopes were inflating since February 2023. Longer-term ground deformation parameters based on EDM, precise leveling, continuous GPS, and electronic tilt monitoring indicated that the volcano remained inflated, especially on the NW and SE flanks. At 1000 on 5 June the Volcano Alert Level (VAL) was raised to 2 (on a 0-5 scale). PHIVOLCS noted that although low-level volcanic earthquakes, ground deformation, and volcanic gas emissions indicated unrest, the steep increase in rockfall frequency may indicate increased dome activity.
A total of 151 dome-collapse PDCs occurred during 8-9 and 11-30 June, traveled 500-2,000 m, and deposited material on the S flank within 2 km of the summit crater. During 8-9 June the VAL was raised to 3. At approximately 1947 on 11 June lava flow activity was reported; two lobes traveled within 500 m from the crater and deposited material on the S (Mi-isi), SE (Bonga), and E (Basud) flanks. Weak seismicity accompanied the lava flow and slight inflation on the upper flanks. This lava flow remained active through 30 June, moving down the S and SE flank as far as 2.5 km and 1.8 km, respectively and depositing material up to 3.3 km from the crater. During 15-16 June traces of ashfall from the PDCs were reported in Sitio Buga, Nabonton, City of Ligao and Purok, and San Francisco, Municipality of Guinobatan. During 28-29 June there were two PDCs generated by the collapse of the lava flow front, which generated a light-brown ash plume 1 km high. Satellite monitors detected significant concentrations of sulfur dioxide beginning on 29 June. On 30 June PDCs primarily affected the Basud Gully on the E flank, the largest of which occurred at 1301 and lasted eight minutes, based on the seismic record. Four PDCs generated between 1800 and 2000 that lasted approximately four minutes each traveled 3-4 km on the E flank and generated an ash plume that rose 1 km above the crater and drifted N and NW. Ashfall was recorded in Tabaco City.
Similar strong activity continued during July; slow lava effusion remained active on the S and SE flanks and traveled as far as 2.8 km and 2.8 km, respectively and material was deposited as far as 4 km from the crater. There was a total of 6,983 rockfall events and 189 PDCs that affected the S, SE, and E flanks. The volcano network detected a total of 2,124 volcanic earthquakes. Continuous gas-and-steam emissions rose 200-2,000 m above the crater and drifted in multiple directions. Sulfur dioxide emissions averaged 792-4,113 t/d, the latter of which was measured on 28 July. During 2-4 July three PDCs were generated from the collapse of the lava flow and resulting light brown plumes rose 200-300 m above the crater. Continuous tremor pulses were reported beginning at 1547 on 3 July through 7 July at 1200, at 2300 on 8 July and going through 0300 on 10 July, and at 2300 on 16 July, as recorded by the seismic network. During 6-9 July there were 10 lava flow-collapse-related PDCs that generated light brown plumes 300-500 m above the crater. During 10-11 July light ashfall was reported in some areas of Mabinit, Legazpi City, Budiao and Salvacion, Daraga, and Camalig, Albay. By 18 July the lava flow advanced 600 m on the E flank as well.
During 1733 on 18 July and 0434 on 19 July PHIVOLCS reported 30 “ashing” events, which are degassing events accompanied by audible thunder-like sounds and entrained ash at the crater, which produced short, dark plumes that drifted SW. These events each lasted 20-40 seconds, and plume heights ranged from 150-300 m above the crater, as recorded by seismic, infrasound, visual, and thermal monitors. Three more ashing events occurred during 19-20 July. Short-term observations from electronic tilt and GPS monitoring indicate deflation on the E lower flanks in early July and inflation on the NW middle flanks during the third week of July. Longer-term ground deformation parameters from EDM, precise leveling, continuous GPS, and electronic tilt monitoring indicated that the volcano was still generally inflated relative to baseline levels. A short-lived lava pulse lasted 28 seconds at 1956 on 21 July, which was accompanied by seismic and infrasound signals. By 22 July, the only lava flow that remained active was on the SE flank, and continued to extend 3.4 km, while those on the S and E flanks weakened markedly. One ashing event was detected during 30-31 July, whereas there were 57 detected during 31 July-1 August; according to PHIVOLCS beginning at approximately 1800 on 31 July eruptive activity was dominated by phases of intermittent ashing, as well as increased in the apparent rates of lava effusion from the summit crater. The ashing phases consisted of discrete events recorded as low-frequency volcanic earthquakes (LFVQ) typically 30 seconds in duration, based on seismic and infrasound signals. Gray ash plume rose 100 m above the crater and generally drifted NE. Shortly after these ashing events began, new lava began to effuse rapidly from the crater, feeding the established flowed on the SE, E, and E flanks and generating frequent rockfall events.
Intensified unrest persisted during August. There was a total of 4,141 rockfall events, 2,881 volcanic earthquakes, which included volcanic tremor events, 32 ashing events, and 101 PDCs detected throughout the month. On clear weather days, gas-and-steam emissions rose 300-1,500 m above the crater and drifted in different directions (figure 54). Sulfur dioxide emissions averaged 735-4,756 t/d, the higher value of which was measured on 16 August. During 1-2 August the rate of lava effusion decreased, but continued to feed the flows on the SE, S, and E flanks, maintaining their advances to 3.4 km, 2.8 km, and 1.1 km from the crater, respectively (figure 55). Rockfall and PDCs generated by collapses at the lava flow margins and from the summit dome deposited material within 4 km of the crater. During 3-4 August there were 10 tremor events detected that lasted 1-4 minutes. Short-lived lava pulse lasted 35 seconds and was accompanied by seismic and infrasound signals at 0442 on 6 August. Seven collapses were recorded at the front of the lava flow during 12-14 August.
During September, similar activity of slow lava effusion, PDCs, gas-and-steam emissions, and seismicity continued. There was a total of 4,452 rockfall events, 329 volcanic earthquakes, which included volcanic tremor events, two ashing events, and 85 PDCs recorded throughout the month. On clear weather days, gas-and-steam emissions rose 100-1,500 m above the crater and drifted in multiple directions. Sulfur dioxide emissions averaged 609-2,252 t/d, the higher average of which was measured on 6 September. Slow lava effusion continued advancing on the SE, S, and E flanks, maintaining lengths of 3.4 km, 2.8 km, and 1.1 km, respectively. Rockfall and PDC events generated by collapses along the lava flow margins and at the summit dome deposited material within 4 km of the crater.
Geologic Background. Symmetrical Mayon, which rises above the Albay Gulf NW of Legazpi City, is the most active volcano of the Philippines. The steep upper slopes are capped by a small summit crater. Recorded eruptions since 1616 CE range from Strombolian to basaltic Plinian, with cyclical activity beginning with basaltic eruptions, followed by longer periods of andesitic lava flows. Eruptions occur predominately from the central conduit and have also produced lava flows that travel far down the flanks. Pyroclastic density currents and mudflows have commonly swept down many of the approximately 40 ravines that radiate from the summit and have often damaged populated lowland areas. A violent eruption in 1814 killed more than 1,200 people and devastated several towns.
Information Contacts: Philippine Institute of Volcanology and Seismology (PHIVOLCS), Department of Science and Technology, University of the Philippines Campus, Diliman, Quezon City, Philippines (URL: http://www.phivolcs.dost.gov.ph/); MIROVA (Middle InfraRed Observation of Volcanic Activity), a collaborative project between the Universities of Turin and Florence (Italy) supported by the Centre for Volcanic Risk of the Italian Civil Protection Department (URL: http://www.mirovaweb.it/); Hawai'i Institute of Geophysics and Planetology (HIGP) - MODVOLC Thermal Alerts System, School of Ocean and Earth Science and Technology (SOEST), Univ. of Hawai'i, 2525 Correa Road, Honolulu, HI 96822, USA (URL: http://modis.higp.hawaii.edu/); Copernicus Browser, Copernicus Data Space Ecosystem, European Space Agency (URL: https://dataspace.copernicus.eu/browser/); William Rogers, Legazpi City, Albay Province, Philippines.
Nishinoshima (Japan) — October 2023 Cite this Report
Nishinoshima
Japan
27.247°N, 140.874°E; summit elev. 100 m
All times are local (unless otherwise noted)
Eruption plumes and gas-and-steam plumes during May-August 2023
Nishinoshima, located about 1,000 km S of Tokyo, is a small island in the Ogasawara Arc in Japan. The island is the summit of a massive submarine volcano that has prominent submarine peaks to the S, W, and NE. Eruptions date back to 1973 and the current eruption period began in October 2022. Recent activity has consisted of small ash plumes and fumarolic activity (BGVN 48:07). This report covers activity during May through August 2023, using information from monthly reports of the Japan Meteorological Agency (JMA) monthly reports and satellite data.
Activity during May through June was relatively low. The Japan Coast Guard (JCG) did overflights on 14 and 22 June and reported white gas-and-steam emissions rising 600 m and 1,200 m from the central crater of the pyroclastic cone, respectively (figure 125). In addition, multiple white gas-and-steam emissions rose from the inner rim of the W side of the crater and from the SE flank of the pyroclastic cone. Discolored brown-to-green water was observed around almost the entire perimeter of the island; on 22 June light green discolored water was observed off the S coast of the island.
Observations from the Himawari meteorological satellite confirmed an eruption on 9 and 10 July. An eruption plume rose 1.6 km above the crater and drifted N around 1300 on 9 July. Satellite images acquired at 1420 and 2020 on 9 July and at 0220 on 10 July showed continuing emissions that rose 1.3-1.6 km above the crater and drifted NE and N. The Tokyo VAAC reported that an ash plume seen by a pilot and identified in a satellite image at 0630 on 21 July rose to 3 km altitude and drifted S.
Aerial observations conducted by JCG on 8 August showed a white-and-gray plume rising from the central crater of the pyroclastic cone, and multiple white gas-and-steam emissions were rising from the inner edge of the western crater and along the NW-SE flanks of the island (figure 126). Brown-to-green discolored water was also noted around the perimeter of the island.
Intermittent low-to-moderate power thermal anomalies were recorded in the MIROVA graph (Middle InfraRed Observation of Volcanic Activity), showing an increase in both frequency and power beginning in July (figure 127). This increase in activity coincides with eruptive activity on 9 and 10 July, characterized by eruption plumes. According to the MODVOLC thermal alert algorithm, one thermal hotspot was recorded on 20 July. Weak thermal anomalies were also detected in infrared satellite imagery, accompanied by strong gas-and-steam plumes (figure 128).
Geologic Background. The small island of Nishinoshima was enlarged when several new islands coalesced during an eruption in 1973-74. Multiple eruptions that began in 2013 completely covered the previous exposed surface and continued to enlarge the island. The island is the summit of a massive submarine volcano that has prominent peaks to the S, W, and NE. The summit of the southern cone rises to within 214 m of the ocean surface 9 km SSE.
Information Contacts: Japan Meteorological Agency (JMA), 1-3-4 Otemachi, Chiyoda-ku, Tokyo 100-8122, Japan (URL: http://www.jma.go.jp/jma/indexe.html); Tokyo Volcanic Ash Advisory Center (VAAC), 1-3-4 Otemachi, Chiyoda-ku, Tokyo 100-8122, Japan (URL: http://ds.data.jma.go.jp/svd/vaac/data/); MIROVA (Middle InfraRed Observation of Volcanic Activity), a collaborative project between the Universities of Turin and Florence (Italy) supported by the Centre for Volcanic Risk of the Italian Civil Protection Department (URL: http://www.mirovaweb.it/); Copernicus Browser, Copernicus Data Space Ecosystem, European Space Agency (URL: https://dataspace.copernicus.eu/browser/).
Krakatau (Indonesia) — October 2023 Cite this Report
Krakatau
Indonesia
6.1009°S, 105.4233°E; summit elev. 285 m
All times are local (unless otherwise noted)
White gas-and-steam plumes and occasional ash plumes during May-August 2023
Krakatau is located in the Sunda Strait between Java and Sumatra, Indonesia. Caldera collapse during the catastrophic 1883 eruption destroyed Danan and Perbuwatan cones and left only a remnant of Rakata. The post-collapse cone of Anak Krakatau (Child of Krakatau) was constructed within the 1883 caldera at a point between the former Danan and Perbuwatan cones; it has been the site of frequent eruptions since 1927. The current eruption period began in May 2021 and has recently consisted of Strombolian eruptions and ash plumes (BGVN 48:07). This report describes lower levels of activity consisting of ash and white gas-and-steam plumes during May through August 2023, based on information provided by the Indonesian Center for Volcanology and Geological Hazard Mitigation, referred to as Pusat Vulkanologi dan Mitigasi Bencana Geologi (PVMBG), MAGMA Indonesia, and satellite data.
Activity was relatively low during May and June. Daily white gas-and-steam emissions rose 25-200 m above the crater and drifted in different directions. Five ash plumes were detected at 0519 on 10 May, 1241 on 11 May, 0920 on 12 May, 2320 on 12 May, and at 0710 on 13 May, and rose 1-2.5 km above the crater and drifted SW. A webcam image taken on 12 May showed ejection of incandescent material above the vent. A total of nine ash plumes were detected during 6-11 June: at 1434 and 00220 on 6 and 7 June the ash plumes rose 500 m above the crater and drifted NW, at 1537 on 8 June the ash plume rose 1 km above the crater and drifted SW, at 0746 and at 0846 on 9 June the ash plumes rose 800 m and 3 km above the crater and drifted SW, respectively, at 0423, 1431, and 1750 on 10 June the ash plumes rose 2 km, 1.5 km, and 3.5 km above the crater and drifted NW, respectively, and at 0030 on 11 June an ash plume rose 2 km above the crater and drifted NW. Webcam images taken on 10 and 11 June at 0455 and 0102, respectively, showed incandescent material ejected above the vent. On 19 June an ash plume at 0822 rose 1.5 km above the crater and drifted SE.
Similar low activity of white gas-and-steam emissions and few ash plumes were reported during July and August. Daily white gas-and-steam emissions rose 25-300 m above the crater and drifted in multiple directions. Three ash plumes were reported at 0843, 0851, and 0852 on 20 July that rose 500-2,000 m above the crater and drifted NW.
The MIROVA (Middle InfraRed Observation of Volcanic Activity) graph of MODIS thermal anomaly data showed intermittent low-to-moderate power thermal anomalies during May through August 2023 (figure 140). Although activity was often obscured by weather clouds, a thermal anomaly was visible in an infrared satellite image of the crater on 12 May, accompanied by an eruption plume that drifted SW (figure 141).
Geologic Background. The renowned Krakatau (frequently mis-named as Krakatoa) volcano lies in the Sunda Strait between Java and Sumatra. Collapse of an older edifice, perhaps in 416 or 535 CE, formed a 7-km-wide caldera. Remnants of that volcano are preserved in Verlaten and Lang Islands; subsequently the Rakata, Danan, and Perbuwatan cones were formed, coalescing to create the pre-1883 Krakatau Island. Caldera collapse during the catastrophic 1883 eruption destroyed Danan and Perbuwatan, and left only a remnant of Rakata. This eruption caused more than 36,000 fatalities, most as a result of tsunamis that swept the adjacent coastlines of Sumatra and Java. Pyroclastic surges traveled 40 km across the Sunda Strait and reached the Sumatra coast. After a quiescence of less than a half century, the post-collapse cone of Anak Krakatau (Child of Krakatau) was constructed within the 1883 caldera at a point between the former Danan and Perbuwatan cones. Anak Krakatau has been the site of frequent eruptions since 1927.
Information Contacts: Pusat Vulkanologi dan Mitigasi Bencana Geologi (PVMBG, also known as Indonesian Center for Volcanology and Geological Hazard Mitigation, CVGHM), Jalan Diponegoro 57, Bandung 40122, Indonesia (URL: http://www.vsi.esdm.go.id/); MAGMA Indonesia, Kementerian Energi dan Sumber Daya Mineral (URL: https://magma.esdm.go.id/v1); MIROVA (Middle InfraRed Observation of Volcanic Activity), a collaborative project between the Universities of Turin and Florence (Italy) supported by the Centre for Volcanic Risk of the Italian Civil Protection Department (URL: http://www.mirovaweb.it/); Copernicus Browser, Copernicus Data Space Ecosystem, European Space Agency (URL: https://dataspace.copernicus.eu/browser/).
Villarrica (Chile) — October 2023 Cite this Report
Villarrica
Chile
39.42°S, 71.93°W; summit elev. 2847 m
All times are local (unless otherwise noted)
Strombolian activity, gas-and-ash emissions, and crater incandescence during April-September 2023
Villarrica, in central Chile, consists of a 2-km-wide caldera that formed about 3,500 years ago and is located at the base of the presently active cone at the NW margin of a 6-km-wide caldera. Historical eruptions eruptions date back to 1558 and have been characterized by mild-to-moderate explosive activity with occasional lava effusions. The current eruption period began in December 2014 and has recently consisted of nighttime crater incandescence, ash emissions, and seismicity (BGVN 48:04). This report covers activity during April through September 2023 and describes occasional Strombolian activity, gas-and-ash emissions, and nighttime crater incandescence. Information for this report primarily comes from the Southern Andes Volcano Observatory (Observatorio Volcanológico de Los Andes del Sur, OVDAS), part of Chile's National Service of Geology and Mining (Servicio Nacional de Geología y Minería, SERNAGEOMIN) and satellite data.
Seismicity during April consisted of long period (LP) events and tremor (TRE); a total of 9,413 LP-type events and 759 TR-type events were detected throughout the month. Nighttime crater incandescence persisted and was visible in the degassing column. Sulfur dioxide data was obtained using Differential Absorption Optical Spectroscopy Equipment (DOAS) that showed an average value of 1,450 ± 198 tons per day (t/d) during 1-15 April and 1,129 ± 201 t/d during 16-30 April, with a maximum daily value of 2,784 t/d on 9 April. Gas-and-steam emissions of variable intensities rose above the active crater as high as 1.3 km above the crater on 13 April. Strombolian explosions were not observed and there was a slight decrease in the lava lake level.
There were 14,123 LP-type events and 727 TR-type events detected during May. According to sulfur dioxide measurements taken with DOAS equipment, the active crater emitted an average value of 1,826 ± 482 t/d during 1-15 May and 912 ± 41 t/d during 16-30 May, with a daily maximum value of 5,155 t/d on 13 May. Surveillance cameras showed continuous white gas-and-steam emissions that rose as high as 430 m above the crater on 27 May. Nighttime incandescence illuminated the gas column less than 300 m above the crater rim was and no pyroclastic emissions were reported. A landslide was identified on 13 May on the E flank of the volcano 50 m from the crater rim and extending 300 m away; SERNAGEOMIN noted that this event may have occurred on 12 May. During the morning of 27 and 28 May minor Strombolian explosions characterized by incandescent ejecta were recorded at the crater rim; the last reported Strombolian explosions had occurred at the end of March.
Seismic activity during June consisted of five volcano-tectonic (VT)-type events, 21,606 LP-type events, and 2,085 TR-type events. The average value of sulfur dioxide flux obtained by DOAS equipment was 1,420 ± 217 t/d during 1-15 June and 2,562 ± 804 t/d, with a maximum daily value of 4,810 t/d on 17 June. White gas-and-steam emissions rose less than 480 m above the crater; frequent nighttime crater incandescence was reflected in the degassing plume. On 12 June an emission rose 100 m above the crater and drifted NNW. On 15 June one or several emissions resulted in ashfall to the NE as far as 5.5 km from the crater, based on a Skysat satellite image. Several Strombolian explosions occurred within the crater; activity on 15 June was higher energy and ejected blocks 200-300 m on the NE slope. Surveillance cameras showed white gas-and-steam emissions rising 480 m above the crater on 16 June. On 19 and 24 June low-intensity Strombolian activity was observed, ejecting material as far as 200 m from the center of the crater to the E.
During July, seismicity included 29,319 LP-type events, 3,736 TR-type events, and two VT-type events. DOAS equipment recorded two days of sulfur dioxide emissions of 4,220 t/d and 1,009 t/d on 1 and 13 July, respectively. Constant nighttime incandescence was also recorded and was particularly noticeable when accompanied by eruptive columns on 12 and 16 July. Minor explosive events were detected in the crater. According to Skysat satellite images taken on 12, 13, and 16 July, ashfall deposits were identified 155 m S of the crater. According to POVI, incandescence was visible from two vents on the crater floor around 0336 on 12 July. Gas-and-ash emissions rose as high as 1.2 km above the crater on 13 July and drifted E and NW. A series of gas-and-steam pulses containing some ash deposited material on the upper E flank around 1551 on 13 July. During 16-31 July, average sulfur dioxide emissions of 1,679 ± 406 t/d were recorded, with a maximum daily value of 2,343 t/d on 28 July. Fine ash emissions were also reported on 16, 17, and 23 July.
Seismicity persisted during August, characterized by 27,011 LP-type events, 3,323 TR-type events, and three VT-type events. The average value of sulfur dioxide measurements taken during 1-15 August was 1,642 ± 270 t/d and 2,207 ± 4,549 t/d during 16-31 August, with a maximum daily value of 3,294 t/d on 27 August. Nighttime crater incandescence remained visible in degassing columns. White gas-and-steam emissions rose 480 m above the crater on 6 August. According to a Skysat satellite image from 6 August, ash accumulation was observed proximal to the crater and was mainly distributed toward the E slope. White gas-and-steam emissions rose 320 m above the crater on 26 August. Nighttime incandescence and Strombolian activity that generated ash emissions were reported on 27 August.
Seismicity during September was characterized by five VT-type events, 12,057 LP-type events, and 2,058 TR-type events. Nighttime incandescence persisted. On 2 September an ash emission rose 180 m above the crater and drifted SE at 1643 (figure 125) and a white gas-and-steam plume rose 320 m above the crater. According to the Buenos Aires VAAC, periods of continuous gas-and-ash emissions were visible in webcam images from 1830 on 2 September to 0110 on 3 September. Strombolian activity was observed on 2 September and during the early morning of 3 September, the latter event of which generated an ash emission that rose 60 m above the crater and drifted 100 m from the center of the crater to the NE and SW. Ashfall was reported to the SE and S as far as 750 m from the crater. The lava lake was active during 3-4 September and lava fountaining was visible for the first time since 26 March 2023, according to POVI. Fountains captured in webcam images at 2133 on 3 September and at 0054 on 4 September rose as high as 60 m above the crater rim and ejected material onto the upper W flank. Sulfur dioxide flux of 1,730 t/d and 1,281 t/d was measured on 3 and 4 September, respectively, according to data obtained by DOAS equipment.
Strong Strombolian activity and larger gas-and-ash plumes were reported during 18-20 September. On 18 September activity was also associated with energetic LP-type events and notable sulfur dioxide fluxes (as high as 4,277 t/d). On 19 September Strombolian activity and incandescence were observed. On 20 September at 0914 ash emissions rose 50 m above the crater and drifted SSE, accompanied by Strombolian activity that ejected material less than 100 m SSE, causing fall deposits on that respective flank. SERNAGEOMIN reported that a Planet Scope satellite image taken on 20 September showed the lava lake in the crater, measuring 32 m x 35 m and an area of 0.001 km2. Several ash emissions were recorded at 0841, 0910, 1251, 1306, 1312, 1315, and 1324 on 23 September and rose less than 150 m above the crater. The sulfur dioxide flux value was 698 t/d on 23 September and 1,097 t/d on 24 September. On 24 September the Volcanic Alert Level (VAL) was raised to Orange (the third level on a four-color scale). SENAPRED maintained the Alert Level at Yellow (the middle level on a three-color scale) for the communities of Villarrica, Pucón (16 km N), Curarrehue, and Panguipulli.
During 24-25 September there was an increase in seismic energy (observed at TR-events) and acoustic signals, characterized by 1 VT-type event, 213 LP-type events, and 124 TR-type events. Mainly white gas-and-steam emissions, in addition to occasional fine ash emissions were recorded. During the early morning of 25 September Strombolian explosions were reported and ejected material 250 m in all directions, though dominantly toward the NW. On 25 September the average value of sulfur dioxide flux was 760 t/d. Seismicity during 25-30 September consisted of five VT-type events, 1,937 LP-type events, and 456 TR-type events.
During 25-29 September moderate Strombolian activity was observed and ejected material as far as the crater rim. In addition, ash pulses lasting roughly 50 minutes were observed around 0700 and dispersed ENE. During 26-27 September a TR episode lasted 6.5 hours and was accompanied by discrete acoustic signals. Satellite images from 26 September showed a spatter cone on the crater floor with one vent that measured 10 x 14 m and a smaller vent about 35 m NE of the cone. SERNAGEOMIN reported an abundant number of bomb-sized blocks up to 150 m from the crater, as well as impact marks on the snow, which indicated explosive activity. A low-altitude ash emission was observed drifting NW around 1140 on 28 September, based on webcam images. Between 0620 and 0850 on 29 September an ash emission rose 60 m above the crater and drifted NW. During an overflight taken around 1000 on 29 September scientists observed molten material in the vent, a large accumulation of pyroclasts inside the crater, and energetic degassing, some of which contained a small amount of ash. Block-sized pyroclasts were deposited on the internal walls and near the crater, and a distal ash deposit was also visible. The average sulfur dioxide flux measured on 28 September was 344 t/d. Satellite images taken on 29 September ashfall was deposited roughly 3 km WNW from the crater and nighttime crater incandescence remained visible. The average sulfur dioxide flux value from 29 September was 199 t/d. On 30 September at 0740 a pulsating ash emission rose 1.1 km above the crater and drifted NNW (figure 126). Deposits on the S flank extended as far as 4.5 km from the crater rim, based on satellite images from 30 September.
Infrared MODIS satellite data processed by MIROVA (Middle InfraRed Observation of Volcanic Activity) showed intermittent thermal activity during April through September, with slightly stronger activity detected during late September (figure 127). Small clusters of thermal activity were detected during mid-June, early July, early August, and late September. According to the MODVOLC thermal alert system, a total of four thermal hotspots were detected on 7 July and 3 and 23 September. This activity was also intermittently captured in infrared satellite imagery on clear weather days (figure 128).
Geologic Background. The glacier-covered Villarrica stratovolcano, in the northern Lakes District of central Chile, is ~15 km south of the city of Pucon. A 2-km-wide caldera that formed about 3,500 years ago is located at the base of the presently active, dominantly basaltic to basaltic andesite cone at the NW margin of a 6-km-wide Pleistocene caldera. More than 30 scoria cones and fissure vents are present on the flanks. Plinian eruptions and pyroclastic flows that have extended up to 20 km from the volcano were produced during the Holocene. Lava flows up to 18 km long have issued from summit and flank vents. Eruptions documented since 1558 CE have consisted largely of mild-to-moderate explosive activity with occasional lava effusion. Glaciers cover 40 km2 of the volcano, and lahars have damaged towns on its flanks.
Information Contacts: Servicio Nacional de Geología y Minería (SERNAGEOMIN), Observatorio Volcanológico de Los Andes del Sur (OVDAS), Avda Sta María No. 0104, Santiago, Chile (URL: http://www.sernageomin.cl/); Proyecto Observación Villarrica Internet (POVI) (URL: http://www.povi.cl/); Sistema y Servicio Nacional de Prevención y Repuesta Ante Desastres (SENAPRED), Av. Beauchef 1671, Santiago, Chile (URL: https://web.senapred.cl/); Buenos Aires Volcanic Ash Advisory Center (VAAC), Servicio Meteorológico Nacional-Fuerza Aérea Argentina, 25 de mayo 658, Buenos Aires, Argentina (URL: http://www.smn.gov.ar/vaac/buenosaires/inicio.php); MIROVA (Middle InfraRed Observation of Volcanic Activity), a collaborative project between the Universities of Turin and Florence (Italy) supported by the Centre for Volcanic Risk of the Italian Civil Protection Department (URL: http://www.mirovaweb.it/); Hawai'i Institute of Geophysics and Planetology (HIGP) - MODVOLC Thermal Alerts System, School of Ocean and Earth Science and Technology (SOEST), Univ. of Hawai'i, 2525 Correa Road, Honolulu, HI 96822, USA (URL: http://modis.higp.hawaii.edu/); Copernicus Browser, Copernicus Data Space Ecosystem, European Space Agency (URL: https://dataspace.copernicus.eu/browser/).
Merapi (Indonesia) — October 2023 Cite this Report
Merapi
Indonesia
7.54°S, 110.446°E; summit elev. 2910 m
All times are local (unless otherwise noted)
Frequent incandescent avalanches during April-September 2023
Merapi, located just north of the major city of Yogyakarta in central Java, Indonesia, has had activity within the last 20 years characterized by pyroclastic flows and lahars accompanying growth and collapse of the steep-sided active summit lava dome. The current eruption period began in late December 2020 and has more recently consisted of ash plumes, intermittent incandescent avalanches of material, and pyroclastic flows (BGVN 48:04). This report covers activity during April through September 2023, based on information from Balai Penyelidikan dan Pengembangan Teknologi Kebencanaan Geologi (BPPTKG), the Center for Research and Development of Geological Disaster Technology, a branch of PVMBG which specifically monitors Merapi. Additional information comes from the Pusat Vulkanologi dan Mitigasi Bencana Geologi (PVMBG, also known as Indonesian Center for Volcanology and Geological Hazard Mitigation, CVGHM), MAGMA Indonesia, the Darwin Volcanic Ash Advisory Centre (VAAC), and various satellite data.
Activity during April through September 2023 primarily consisted of incandescent avalanches of material that mainly affected the SW and W flanks and traveled as far as 2.3 km from the summit (table 25) and white gas-and-steam emissions that rose 10-1,000 m above the crater.
Table 25. Monthly summary of avalanches and avalanche distances recorded at Merapi during April through September 2023. The number of reported avalanches does not include instances where possible avalanches were heard but could not be visually confirmed as a result of inclement weather. Data courtesy of BPPTKG (April-September 2023 daily reports).
| Month |
Average number of avalanches per day |
Distance avalanches traveled (m) |
| Apr 2023 |
19 |
1,200-2,000 |
| May 2023 |
22 |
500-2,000 |
| Jun 2023 |
18 |
1,200-2,000 |
| Jul 2023 |
30 |
300-2,000 |
| Aug 2023 |
25 |
400-2,300 |
| Sep 2023 |
23 |
600-2,000 |
BPPTKG reported that during April and May white gas-and-steam emissions rose 10-750 m above the crater, incandescent avalanches descended 500-2,000 m on the SW and W flanks (figure 135). Cloudy weather often prevented clear views of the summit, and sometimes avalanches could not be confirmed. According to a webcam image, a pyroclastic flow was visible on 17 April at 0531. During the week of 28 April and 4 May a pyroclastic flow was reported on the SW flank, traveling up to 2.5 km. According to a drone overflight taken on 17 May the SW lava dome volume was an estimated 2,372,800 cubic meters and the dome in the main crater was an estimated 2,337,300 cubic meters.
During June and July similar activity persisted with white gas-and-steam emissions rising 10-350 m above the crater and frequent incandescent avalanches that traveled 300-2,000 m down the SW, W, and S flanks (figure 136). Based on an analysis of aerial photos taken on 24 June the volume of the SW lava dome was approximately 2.5 million cubic meters. A pyroclastic flow was observed on 5 July that traveled 2.7 km on the SW flank. According to the Darwin VAAC multiple minor ash plumes were identified in satellite images on 19 July that rose to 3.7 km altitude and drifted S and SW. During 22, 25, and 26 July a total of 17 avalanches descended as far as 1.8 km on the S flank.
Frequent white gas-and-steam emissions continued during August and September, rising 10-450 m above the crater. Incandescent avalanches mainly affected the SW and W flanks and traveled 400-2,300 m from the vent (figure 137). An aerial survey conducted on 10 August was analyzed and reported that estimates of the SW dome volume was 2,764,300 cubic meters and the dome in the main crater was 2,369,800 cubic meters.
Frequent and moderate-power thermal activity continued throughout the reporting period, according to a MIROVA (Middle InfraRed Observation of Volcanic Activity) analysis of MODIS satellite data (figure 138). There was an increase in the number of detected anomalies during mid-May. The MODVOLC thermal algorithm recorded a total of 47 thermal hotspots: six during April, nine during May, eight during June, 15 during July, four during August, and five during September. Some of this activity was captured in infrared satellite imagery on clear weather days, sometimes accompanied by incandescent material on the SW flank (figure 139).
Geologic Background. Merapi, one of Indonesia's most active volcanoes, lies in one of the world's most densely populated areas and dominates the landscape immediately north of the major city of Yogyakarta. It is the youngest and southernmost of a volcanic chain extending NNW to Ungaran volcano. Growth of Old Merapi during the Pleistocene ended with major edifice collapse perhaps about 2,000 years ago, leaving a large arcuate scarp cutting the eroded older Batulawang volcano. Subsequent growth of the steep-sided Young Merapi edifice, its upper part unvegetated due to frequent activity, began SW of the earlier collapse scarp. Pyroclastic flows and lahars accompanying growth and collapse of the steep-sided active summit lava dome have devastated cultivated lands on the western-to-southern flanks and caused many fatalities.
Information Contacts: Balai Penyelidikan dan Pengembangan Teknologi Kebencanaan Geologi (BPPTKG), Center for Research and Development of Geological Disaster Technology (URL: http://merapi.bgl.esdm.go.id/, Twitter: @BPPTKG); MAGMA Indonesia, Kementerian Energi dan Sumber Daya Mineral (URL: https://magma.esdm.go.id/v1); Pusat Vulkanologi dan Mitigasi Bencana Geologi (PVMBG, also known as Indonesian Center for Volcanology and Geological Hazard Mitigation, CVGHM), Jalan Diponegoro 57, Bandung 40122, Indonesia (URL: http://www.vsi.esdm.go.id/); Darwin Volcanic Ash Advisory Centre (VAAC), Bureau of Meteorology, Northern Territory Regional Office, PO Box 40050, Casuarina, NT 0811, Australia (URL: http://www.bom.gov.au/info/vaac/); MIROVA (Middle InfraRed Observation of Volcanic Activity), a collaborative project between the Universities of Turin and Florence (Italy) supported by the Centre for Volcanic Risk of the Italian Civil Protection Department (URL: http://www.mirovaweb.it/); Hawai'i Institute of Geophysics and Planetology (HIGP) - MODVOLC Thermal Alerts System, School of Ocean and Earth Science and Technology (SOEST), Univ. of Hawai'i, 2525 Correa Road, Honolulu, HI 96822, USA (URL: http://modis.higp.hawaii.edu/); Copernicus Browser, Copernicus Data Space Ecosystem, European Space Agency (URL: https://dataspace.copernicus.eu/browser/); Øystein Lund Andersen (URL: https://www.oysteinlundandersen.com/, https://twitter.com/oysteinvolcano).
Ebeko
Russia
50.686°N, 156.014°E; summit elev. 1103 m
All times are local (unless otherwise noted)
Moderate explosive activity with ash plumes continued during June-November 2023
Ebeko, located on the N end of Paramushir Island in Russia’s Kuril Islands just S of the Kamchatka Peninsula, consists of three summit craters along a SSW-NNE line at the northern end of a complex of five volcanic cones. Observed eruptions date back to the late 18th century and have been characterized as small-to-moderate explosions from the summit crater, accompanied by intense fumarolic activity. The current eruptive period began in June 2022, consisting of frequent explosions, ash plumes, and thermal activity (BGVN 47:10, 48:06). This report covers similar activity during June-November 2023, based on information from the Kamchatka Volcanic Eruptions Response Team (KVERT) and satellite data.
Moderate explosive activity continued during June-November 2023 (figures 50 and 51). According to visual data from Severo-Kurilsk, explosions sent ash 2-3.5 km above the summit (3-4.5 km altitude) during most days during June through mid-September. Activity after mid-September was slightly weaker, with ash usually reaching less than 2 km above the summit. According to KVERT the volcano in October and November was, with a few exceptions, either quiet or obscured by clouds that prevented satellite observations. KVERT issued Volcano Observatory Notices for Aviation (VONA) on 8 and 12 June, 13 and 22 July, 3 and 21 August, and 31 October warning of potential aviation hazards from ash plumes drifting 3-15 km from the volcano. Based on satellite data, KVERT reported a persistent thermal anomaly whenever weather clouds permitted viewing.
Geologic Background. The flat-topped summit of the central cone of Ebeko volcano, one of the most active in the Kuril Islands, occupies the northern end of Paramushir Island. Three summit craters located along a SSW-NNE line form Ebeko volcano proper, at the northern end of a complex of five volcanic cones. Blocky lava flows extend west from Ebeko and SE from the neighboring Nezametnyi cone. The eastern part of the southern crater contains strong solfataras and a large boiling spring. The central crater is filled by a lake about 20 m deep whose shores are lined with steaming solfataras; the northern crater lies across a narrow, low barrier from the central crater and contains a small, cold crescentic lake. Historical activity, recorded since the late-18th century, has been restricted to small-to-moderate explosive eruptions from the summit craters. Intense fumarolic activity occurs in the summit craters, on the outer flanks of the cone, and in lateral explosion craters.
Information Contacts: Kamchatka Volcanic Eruptions Response Team (KVERT), Far Eastern Branch, Russian Academy of Sciences, 9 Piip Blvd., Petropavlovsk-Kamchatsky, 683006, Russia (URL: http://www.kscnet.ru/ivs/kvert/).
Search Bulletin Archive by Publication Date
Select a month and year from the drop-downs and click "Show Issue" to have that issue displayed in this tab.
The default month and year is the latest issue available.
Scientific Event Alert Network Bulletin - Volume 12, Number 04 (April 1987)
Managing Editor: Lindsay McClelland
Aira (Japan)
Fewer summit explosions
Alaid (Russia)
Fumarolic activity in crater
Arenal (Costa Rica)
Earthquake swarm preceded 18 March eruption
Atmospheric Effects (1980-1989) (Unknown)
Ruiz aerosols remain in stratosphere
Bagana (Papua New Guinea)
Ash emissions and summit glow continue
Chikurachki (Russia)
Fumarolic activity observed
Chirinkotan (Russia)
Ash and gas columns observed
Chirpoi (Russia)
Fumarolic activity
Etna (Italy)
Phreatic explosions from Southeast Crater kills two, injures seven
Fuss Peak (Russia)
Moderate fumarolic activity
Gamkonora (Indonesia)
Explosions, minor ashfall on flanks
Izu-Oshima (Japan)
Steam emission; tremor and strain changes; earthquake swarms
Kanlaon (Philippines)
Ash eruption follows increased seismicity
Ketoi (Russia)
Fumarolic activity
Kilauea (United States)
Lava advance continues, three more houses destroyed
Kiska (United States)
Plume on satellite image
Kolokol Group (Russia)
Weak gas emission from the Berg and Trezubetz domes
Langila (Papua New Guinea)
Ash cloud to 3 km height
Lascar (Chile)
Three explosions emitted ash clouds in September 1986
Lokon-Empung (Indonesia)
Diminished activity; continuous white plume
Mahawu (Indonesia)
Tectonic earthquakes, plume, elevated lake temperature
Makushin (United States)
Correction: 2 March ash plume was from Akutan
Manam (Papua New Guinea)
Main crater emitting ash; some lava from S crater
Merapi (Indonesia)
Lava dome, largest since 1973, appears stable
Moyorodake [Medvezhia] (Japan - administered by Russia)
Intense fumarolic activity
Rabaul (Papua New Guinea)
Low seismicity; deflation in E part of caldera
Raususan [Mendeleev] (Japan - administered by Russia)
Intense fumarolic and solfataric activity
Rincon de la Vieja (Costa Rica)
Phreatic eruption; lahars
Ruiz, Nevado del (Colombia)
Continued moderate-high seismicity; acid rain kills birds
Sangeang Api (Indonesia)
About 50 small explosions daily
Sarychev Peak (Russia)
Lava flow and gas emissions
Semeru (Indonesia)
Continued small Vulcanian explosions
Semisopochnoi (United States)
Plume; possible ash deposits
Tao-Rusyr Caldera (Russia)
No fumarolic activity
Tomariyama [Golovnin] (Japan - administered by Russia)
Moderate fumarolic and solfataric activity
Ushishur (Russia)
Fumarolic activity
Whakaari/White Island (New Zealand)
Continued ash emission
Aira
Japan
31.5772°N, 130.6589°E; summit elev. 1117 m
All times are local (unless otherwise noted)
Fewer summit explosions
No explosions . . . were recorded in February or most of March but on 30 March at 2304 the 14th recorded explosion of 1987 occurred. Ash emissions without recorded explosion events had continued. The maximum ash cloud height was 1,300 m on 20 March. A total of 3 g/m2 of ash accumulated in March at [KLMO]. No ash had accumulated in February.
Geologic Background. The Aira caldera in the northern half of Kagoshima Bay contains the post-caldera Sakurajima volcano, one of Japan's most active. Eruption of the voluminous Ito pyroclastic flow accompanied formation of the 17 x 23 km caldera about 22,000 years ago. The smaller Wakamiko caldera was formed during the early Holocene in the NE corner of the caldera, along with several post-caldera cones. The construction of Sakurajima began about 13,000 years ago on the southern rim and built an island that was joined to the Osumi Peninsula during the major explosive and effusive eruption of 1914. Activity at the Kitadake summit cone ended about 4,850 years ago, after which eruptions took place at Minamidake. Frequent eruptions since the 8th century have deposited ash on the city of Kagoshima, located across Kagoshima Bay only 8 km from the summit. The largest recorded eruption took place during 1471-76.
Information Contacts: JMA; UPI.
Alaid
Russia
50.861°N, 155.565°E; summit elev. 2285 m
All times are local (unless otherwise noted)
Fumarolic activity in crater
In November 1986, the main fumarolic activity was concentrated in one large vent in the crater. The vent's outer slopes were hot and snow-free while most of the crater area was covered in snow that had fallen September-October. No consistent snow patches had been seen in the crater during autumn 1982 overflights.
A scoria cone had formed within the summit crater during the large 1981 eruption (Fedotov and others, 1981, 1982). During aerial observations in September 1982, fumarolic activity was concentrated at three new vents at the site of this cone. Geologists believed that these vents formed during a brief eruption on 2 March 1982, detected by the GMS satellite. The changed vent distribution was thought to have been the result of an eruption between 1982 and 1986 that was not observed. The volcano is remote and its weather is often poor.
References. Fedotov, S.A., Ivanov, B.V., Avdeiko, G.P., Flerov, G.B., Andreyev, V.N., Dvigalo, V.N., Dubik, Y.M., Cherkov, A.M., 1981, 1981 eruption of the Alaid volcano: Volcanology and Seismology no. 5, p. 82-87.
Fedotov, S.A., Ivanov, B.V., Flerov, G.B., Avdeiko, G.P., Budnikov, V.A., Andreev, V.N., Gordeev, E.I., Dvigalo, V.N., Shirokov, V.A., 1982, Eruption of Alaid volcano (Kurile Islands) in 1981: Volcanology and Seismology, no. 6, p. 9-27.
Geologic Background. The highest and northernmost volcano of the Kuril Islands, Alaid is a symmetrical stratovolcano when viewed from the north, but has a 1.5-km-wide summit crater that is breached open to the south. This basaltic to basaltic andesite volcano is the northernmost of a chain constructed west of the main Kuril archipelago. Numerous pyroclastic cones are present the lower flanks, particularly on the NW and SE sides, including an offshore cone formed during the 1933-34 eruption. Strong explosive eruptions have occurred from the summit crater beginning in the 18th century. Reports of eruptions in 1770, 1789, 1821, 1829, 1843, 1848, and 1858 were considered incorrect by Gorshkov (1970). Explosive eruptions in 1790 and 1981 were among the largest reported in the Kuril Islands.
Information Contacts: G. Steinberg and B. Piskunov, Yuzhno-Sakhalinsk.
Arenal (Costa Rica) — April 1987 Cite this Report
Arenal
Costa Rica
10.463°N, 84.703°W; summit elev. 1670 m
All times are local (unless otherwise noted)
Earthquake swarm preceded 18 March eruption
Activity was at a low level during January with a total of 106 explosions (C-type earthquakes) recorded (figure 9). Daily maximum tremor amplitudes increased slightly. A significant increase in explosive (Strombolian type) activity occurred 11-14 February. A total of 377 explosion earthquakes were recorded in February; tremor remained at January levels.
The number of explosions decreased in March but their energy increased considerably; 231 events were recorded. Bombs were ejected at velocities of >100 m/s reaching 1,800 m NW and 1,000 m W of the active crater. Several explosions were recorded at seismic stations >100 km from the volcano. Daily maximum amplitudes showed a significant increase.
On 7 and 8 March, a shallow earthquake swarm was registered by National Seismological Network stations. The 15 tectonic-like events had epicenters 15 km E of Arenal. Three earthquakes were felt by residents of La Fortuna (figure 10) at MM II-IV. The strongest reached magnitude 4.2 (figure 9). On 18 March a large ash eruption occurred.
Geologic Background. Conical Volcán Arenal is the youngest stratovolcano in Costa Rica and one of its most active. The 1670-m-high andesitic volcano towers above the eastern shores of Lake Arenal, which has been enlarged by a hydroelectric project. Arenal lies along a volcanic chain that has migrated to the NW from the late-Pleistocene Los Perdidos lava domes through the Pleistocene-to-Holocene Chato volcano, which contains a 500-m-wide, lake-filled summit crater. The earliest known eruptions of Arenal took place about 7000 years ago, and it was active concurrently with Cerro Chato until the activity of Chato ended about 3500 years ago. Growth of Arenal has been characterized by periodic major explosive eruptions at several-hundred-year intervals and periods of lava effusion that armor the cone. An eruptive period that began with a major explosive eruption in 1968 ended in December 2010; continuous explosive activity accompanied by slow lava effusion and the occasional emission of pyroclastic flows characterized the eruption from vents at the summit and on the upper western flank.
Information Contacts: R. Barquero and Guillermo Alvarado, ICE.
Atmospheric Effects (1980-1989) (Unknown) — April 1987 Cite this Report
Atmospheric Effects (1980-1989)
Unknown
Unknown, Unknown; summit elev. m
All times are local (unless otherwise noted)
Ruiz aerosols remain in stratosphere
Lidar in Hawaii, Virginia, and Germany continued to detect stratospheric aerosols from the November 1985 eruption of Ruiz (figure 40). Data from Mauna Loa, Hawaii showed a continuing gradual decline in both total backscatter and the thickness of the zone of enhanced aerosols. From Hampton, VA, the aerosol layer was quite uniform from the tropopause upward, with little sublayering evident. Altitudes of peak backscattering measured from Garmisch-Partenkirchen, Germany, which had increased slightly in February and March, returned to January levels. Backscattering ratios have remained stable.
Geologic Background. The enormous aerosol cloud from the March-April 1982 eruption of Mexico's El Chichón persisted for years in the stratosphere, and led to the Atmospheric Effects section becoming a regular feature of the Bulletin. Descriptions of the initial dispersal of major eruption clouds remain with the individual eruption reports, but observations of long-term stratospheric aerosol loading will be found here.
Information Contacts: Thomas DeFoor, Mauna Loa Observatory, P. O. Box 275, Hilo, HI 96720 USA; Horst Jäger, Fraunhofer-Institut für Atmosphärische Umweltforschung, Kreuzeckbahnstrasse 19, D-8100 Garmisch-Partenkirchen, West Germany; William Fuller, NASA Langley Research Center, Hampton, VA 23665 USA.
Bagana (Papua New Guinea) — April 1987 Cite this Report
Bagana
Papua New Guinea
6.137°S, 155.196°E; summit elev. 1855 m
All times are local (unless otherwise noted)
Ash emissions and summit glow continue
The activity level in April appeared similar to that in March. Moderate to strong white, gray, and brown emissions were reported. Summit glow was seen occasionally and was especially bright on 1 April. Seismic recording was patchy in April; recordings were made on only 6 days, down from 16 days in March. Increased seismic activity on 12 and 15 March was followed by a period of stronger activity beginning 27 March that probably persisted through 1 or 2 April. Seismicity was at a low level on 6 April but had increased considerably by 16 April when ~60 events were recorded. Activity then subsided and from 23 to 26 April very few volcanic earthquakes were recorded.
Geologic Background. Bagana volcano, in a remote portion of central Bougainville Island, is frequently active. This massive symmetrical cone was largely constructed by an accumulation of viscous andesitic lava flows. The entire edifice could have been constructed in about 300 years at its present rate of lava production. Eruptive activity is characterized by non-explosive effusion of viscous lava that maintains a small lava dome in the summit crater, although occasional explosive activity produces pyroclastic flows. Lava flows with tongue-shaped lobes up to 50 m thick and prominent levees descend the flanks on all sides.
Information Contacts: C. McKee and P. Lowenstein, RVO.
Chikurachki (Russia) — April 1987 Cite this Report
Chikurachki
Russia
50.324°N, 155.461°E; summit elev. 1781 m
All times are local (unless otherwise noted)
Fumarolic activity observed
The 19 November ash and lava eruption was preceded by increased fumarolic activity seen during overflights on 12 and 14 November. Intense vapor and gas emission occurred from much of the upper volcano, obscuring the crater. Pyroclastic flows on the upper slopes were covered with snow but those near the foot of the volcano were snow-free. No explosions were noted.
Geologic Background. Chikurachki, the highest volcano on Paramushir Island in the northern Kuriles, is a relatively small cone constructed on a high Pleistocene edifice. Oxidized basaltic-to-andesitic scoria deposits covering the upper part of the young cone give it a distinctive red color. Frequent basaltic Plinian eruptions have occurred during the Holocene. Lava flows have reached the sea and formed capes on the NW coast; several young lava flows are also present on the E flank beneath a scoria deposit. The Tatarinov group of six volcanic centers is located immediately to the south, and the Lomonosov cinder cone group, the source of an early Holocene lava flow that reached the saddle between it and Fuss Peak to the west, lies at the southern end of the N-S-trending Chikurachki-Tatarinov complex. In contrast to the frequently active Chikurachki, the Tatarinov centers are extensively modified by erosion and have a more complex structure. Tephrochronology gives evidence of an eruption around 1690 CE from Tatarinov, although its southern cone contains a sulfur-encrusted crater with fumaroles that were active along the margin of a crater lake until 1959.
Information Contacts: G. Steinberg and B. Piskunov, Yuzhno-Sakhalinsk.
Chirinkotan (Russia) — April 1987 Cite this Report
Chirinkotan
Russia
48.98°N, 153.48°E; summit elev. 724 m
All times are local (unless otherwise noted)
Ash and gas columns observed
Chirinkotan was observed from the air 11, 12, and 31 October, and 2 November. A thick gas and ash column reached 700-800 m above the crater, and drifted 6-8 km downwind on 11 October. Intense gas emission occurred throughout the crater. On 12 October gas emission was less intense but a gas cloud reached 400-600 km high and was 3-4 km long despite a strong wind. By 31 October fumarolic activity had diminished significantly. On the E crater slope a few groups of large fumaroles were observed. A gas plume 200 m in diameter was 250 m high and 800-900 m long. Flank ashfall had been covered by snow that fell 12-13 October. Activity was similar on 2 November.
Geologic Background. The small, mostly unvegetated 3-km-wide island of Chirinkotan occupies the far end of an E-W volcanic chain that extends nearly 50 km W of the central part of the main Kuril Islands arc. It is the emergent summit of a volcano that rises 3000 m from the floor of the Kuril Basin. A small 1-km-wide caldera about 300-400 m deep is open to the SW. Lava flows from a cone within the breached crater reached the shore of the island. Historical eruptions have been recorded since the 18th century. Lava flows were observed by the English fur trader Captain Snow in the 1880s.
Information Contacts: G. Steinberg and B. Piskunov, Yuzhno-Sakhalinsk.
Chirpoi
Russia
46.532°N, 150.871°E; summit elev. 742 m
All times are local (unless otherwise noted)
Fumarolic activity
Weak fumarolic activity was occurring from the crater of Snow volcano during a 6 November aerial survey.
Geologic Background. Chirpoi, a small island lying between the larger islands of Simushir and Urup, contains a half dozen volcanic edifices constructed within an 8-9 km wide, partially submerged caldera. The southern rim of the caldera is exposed on nearby Brat Chirpoev Island. The symmetrical Cherny volcano, which forms the central cone of the island, erupted twice during the 18th and 19th centuries. The youngest volcano, Snow, originated between 1770 and 1810. It is composed almost entirely of lava flows, many of which have reached the sea on the southern coast. No recorded eruptions are known from Brat Chirpoev, but its youthful morphology suggests recent Strombolian activity.
Information Contacts: G. Steinberg and B. Piskunov, Yuzhno-Sakhalinsk.
Etna
Italy
37.748°N, 14.999°E; summit elev. 3357 m
All times are local (unless otherwise noted)
Phreatic explosions from Southeast Crater kills two, injures seven
An explosion from Southeast Crater on 17 April ejected tephra that killed two people and injured seven others.
During the first half of March, Northeast Crater occasionally emitted gas and vapor, sometimes with ash. During the second half of the month only weak fumarolic activity occurred from Northeast Crater, but more or less intense gas emission episodes that occasionally ejected ash occurred from the central crater's Bocca Nuova. Low-level volcanic tremor occurred during the same period but no earthquakes were recorded. Ten microshocks (M 1.0) occurred 23-25 March.
Sudden increases in sporadic tremor, lasting ~ 10-15 minutes, began 1 April. Geologists attributed the tremor to deep phreatomagmatic explosions. Activity increased during the first few days of April, reaching a maximum of 10 episodes of sporadic tremor on the 6th. The episodes lasted 30-40 minutes each and occurred at ~ 2-hour intervals. On 8 April > 50 microearthquakes were recorded. Only weak gas emission occurred from the central crater's E vent through early April. However, on 8 April at 0835 a violent phreatic explosion from that vent fed a 1-km-high eruption column. Abundant tephra was strewn to 300 m from the crater rim, with maximum dispersion to the NE. Geologists believed that similar explosions had probably occurred during the second half of March. The 8 April explosion was followed by a long period of relative seismic quiescence when only weak sporadic tremor was recorded. Beginning 12 April, 4-5 episodes of sporadic tremor were recorded daily.
Following several days of forceful gas emissions from Southeast Crater, tremor duration increased to a maximum of 30 minutes on the morning of 17 April. At 1335 a moderate-intensity phreatic explosion launched tephra SSE, killing two and injuring seven of the ~ 30 tourists who, the press reported, were standing ~500 m from the crater. A similar explosion on 12 September 1979 had killed 9 tourists and injured 23 others near the central crater's Bocca Nuova (04:09). The 17 April ejecta appeared to be older volcanic material. Tephra fragments 150 m from the crater rim reached diameters of 15 cm and at 250 m were a maximum of 5 cm. IIV geologists suggested that conditions for the 8 and [17] April explosions resulted from the collapse of the internal vent walls and subsequent gas accumulation.
Immediately after the [17] April explosion an increase in tremor was noted. The next day, three episodes of periodic tremor were recorded, each lasting ~ 90-120 minutes. Levels of tremor 2-3x normal continued through the end of the month. Only small quantities of gas were emitted from the central crater during the days following the fatal explosion. Weak Strombolian activity [from Southeast Crater] was observed during the night of 25 April and the morning of 26 April [and 10-16 May]. Vapor emission resumed after the end of the Strombolian activity.
Geologic Background. Mount Etna, towering above Catania on the island of Sicily, has one of the world's longest documented records of volcanism, dating back to 1500 BCE. Historical lava flows of basaltic composition cover much of the surface of this massive volcano, whose edifice is the highest and most voluminous in Italy. The Mongibello stratovolcano, truncated by several small calderas, was constructed during the late Pleistocene and Holocene over an older shield volcano. The most prominent morphological feature of Etna is the Valle del Bove, a 5 x 10 km caldera open to the east. Two styles of eruptive activity typically occur, sometimes simultaneously. Persistent explosive eruptions, sometimes with minor lava emissions, take place from one or more summit craters. Flank vents, typically with higher effusion rates, are less frequently active and originate from fissures that open progressively downward from near the summit (usually accompanied by Strombolian eruptions at the upper end). Cinder cones are commonly constructed over the vents of lower-flank lava flows. Lava flows extend to the foot of the volcano on all sides and have reached the sea over a broad area on the SE flank.
Information Contacts: R. Romano, T. Caltabiano, D. Condarelli, O. Consoli, and G. Frazzetta, IIV; S. Gresta and C. Sturiale, Univ di Catania; La Republica, Rome; AP.
Fuss Peak
Russia
50.267°N, 155.246°E; summit elev. 1742 m
All times are local (unless otherwise noted)
Moderate fumarolic activity
Between 12 October and 2 November 1986, moderate fumarolic activity was observed in the E part of the summit crater. The fumaroles fell along a N-S line that divided the crater. The rest of the crater was snow-covered.
Geologic Background. Fuss Peak in the northern Kuriles forms a peninsula that lies across a low isthmus on the SW coast of Paramushir Island. The volcano rises 2800 m from the floor of the Sea of Okhotsk to a height of 1742 m. This isolated symmetrical andesitic stratovolcano has a 700-m-wide, steep-walled crater that is 300 m deep. A deep notch cuts the NW rim of the crater to the level of the crater floor, at the head of a canyon that reaches the coast. Well-preserved lava flows occupy the middle and lower flanks, particularly on the E and SE sides. Only one unambiguous historical eruption, in 1854, is known. Reports of eruptions in 1737, 1793, 1857, and 1859 are false (Gorshkov, 1970). Murayama (1987) also listed an eruption in 1742 (only earthquakes and a tsunami are cited by Sapper, 1917) and "smoke" emission in 1933.
Information Contacts: G. Steinberg and B. Piskunov, Yuzhno-Sakhalinsk.
Gamkonora (Indonesia) — April 1987 Cite this Report
Gamkonora
Indonesia
1.38°N, 127.53°E; summit elev. 1635 m
All times are local (unless otherwise noted)
Explosions, minor ashfall on flanks
Since 6 April, Gamkonora had shown signs of restlessness. On 13 April, a dark plume, probably containing ash, was observed at 1130, reaching 700 m height. Small explosions occurred on 21, 24, 25, and 26 April, with reports of minor ashfall on the flanks. No plume heights were available, owing to poor weather. A VSI observer has been sent to Gamkonora.
Previous activity was reported on 16-17 February 1983.
Geologic Background. The shifting of eruption centers on Gamkonora, the highest peak of Halmahera, has produced an elongated series of summit craters along a N-S trending rift. Youthful-looking lava flows originate near the cones of Gunung Alon and Popolojo, south of Gamkonora. Since its first recorded eruption in the 16th century, typical activity has been small-to-moderate explosive eruptions. Its largest recorded eruption, in 1673, was accompanied by tsunamis that inundated villages.
Information Contacts: VSI; T. Casadevall, USGS & VSI.
Izu-Oshima
Japan
34.724°N, 139.394°E; summit elev. 746 m
All times are local (unless otherwise noted)
Steam emission; tremor and strain changes; earthquake swarms
Since the 18 December explosion, no additional eruptive activity has been reported. Steam jets rose daily to 10 m above some of the November fissures and white clouds usually extended 50 m above the summit.
Seismicity declined steadily after the November eruptive event and continued to decline through March. There was no change in the distribution of epicenters, which were concentrated in a zone trending NNW-SSE on the island. Volcanic tremor resumed on 1 January, after 10 days of quiet, occurring at almost regular 1-hour intervals (figure 6) [but see 12:1]. Periodic tremor had declined by February but continued at [January] amplitudes. Durations of tremor episodes ranged from 10 to 30 minutes. The tremor source (estimated from amplitude at each seismometer) appeared to be below the central cone (Mihara-yama).
Periodic tremor was accompanied by step-like strain changes, recorded by a borehole strainmeter 108 m below sea level, 5 km N of Mihara-yama. Step-like expansion began on 1 January, reversing to contraction on 22 January [see also 12:1]. Other strainmeters had shown gradual contraction since the 21 November eruptive activity, before strain virtually ceased.
UPI reported that earthquake swarms began 6 May off the NW coast of the island, 10-20 km below the ocean floor. Of the 1,571 total recorded earthquakes 6-12 May [but see 12:6], 895 occurred on the 11th, the day of the largest event (M 5.1).
Geologic Background. Izu-Oshima volcano in Sagami Bay, east of the Izu Peninsula, is the northernmost of the Izu Islands. The broad, low stratovolcano forms an 11 x 13 km island constructed over the remnants of three older dissected stratovolcanoes. It is capped by a 4-km-wide caldera with a central cone, Miharayama, that has been the site of numerous recorded eruptions datining back to the 7th century CE. More than 40 cones are located within the caldera and along two parallel rift zones trending NNW-SSE. Although it is a dominantly basaltic volcano, strong explosive activity has occurred at intervals of 100-150 years throughout the past few thousand years. A major eruption in 1986 produced spectacular lava fountains up to 1,600 m high and a 16-km-high eruption column; more than 12,000 people were evacuated from the island.
Information Contacts: JMA; UPI.
Kanlaon (Philippines) — April 1987 Cite this Report
Kanlaon
Philippines
10.4096°N, 123.13°E; summit elev. 2422 m
All times are local (unless otherwise noted)
Ash eruption follows increased seismicity
Increased seismicity and thermal activity were followed by a small ash eruption.
On 30 March the number of volcanic earthquakes reached 9/day, an increase from the previous level of 1-3/day. Seismicity continued at moderate to low levels until 22 April when 74 low-frequency volcanic events were recorded and steam emission increased. Steam plume height increased to 150-200 m from a normal of 50-100 m, and 40-50% of the vent opening was filled with steam. PHIVOLCS officially informed the Secretary of Science, Department of Science and Technology that the condition of the volcano was unstable but since no harmonic tremor was being recorded, only a mild ash ejection was expected if activity increased.
On the morning of 24 April a fresh ash deposit ~1-2 km wide and 6.5 km long extended down the SW flank. No eruption signals were recorded by seismometers and no sounds were heard by nearby residents. A sulfur smell was reported from the Cabagnaan Observatory (approximately 6 km SW of the crater) on the same day.
Geochemical studies of the Mambucal aquapool, mudpool, and sulfur spring (9.5 km NNW of the summit) showed increasing sulfate and chloride concentrations starting 19 February.
Geologic Background. Kanlaon volcano (also spelled Canlaon) forms the highest point on the Philippine island of Negros. The massive andesitic stratovolcano is covered with fissure-controlled pyroclastic cones and craters, many of which are filled by lakes. The largest debris avalanche known in the Philippines traveled 33 km SW from Kanlaon. The summit contains a 2-km-wide, elongated northern caldera with a crater lake and a smaller but higher active vent, Lugud crater, to the south. Eruptions recorded since 1866 have typically consisted of phreatic explosions of small-to-moderate size that produce minor local ashfall.
Information Contacts: PHIVOLCS.
Ketoi
Russia
47.35°N, 152.475°E; summit elev. 1172 m
All times are local (unless otherwise noted)
Fumarolic activity
Moderate fumarolic activity was noted on the outer N slope of Pallas Peak's main crater area during an 11 October aerial survey.
Geologic Background. The circular 10-km-wide Ketoi island, which rises across the 19-km-wide Diana Strait from Simushir Island, hosts of one of the most complex volcanic structures of the Kuril Islands. The rim of a 5-km-wide Pleistocene caldera is exposed only on the NE side. A younger stratovolcano forming the NW part of the island is cut by a horst-and-graben structure containing two solfatara fields. A 1.5-km-wide freshwater lake fills an explosion crater in the center of the island. Pallas Peak, a large andesitic cone in the NE part of the caldera, is truncated by a 550-m-wide crater containing a brilliantly colored turquoise crater lake. Lava flows from Pallas Peak overtop the caldera rim and descend nearly 5 km to the SE coast. The first historical eruption of Pallas Peak, during 1843-46, was its largest.
Information Contacts: G. Steinberg and B. Piskunov, Yuzhno-Sakhalinsk.
Kilauea (United States) — April 1987 Cite this Report
Kilauea
United States
19.421°N, 155.287°W; summit elev. 1222 m
All times are local (unless otherwise noted)
Lava advance continues, three more houses destroyed
The flow that entered the ocean on 9 April continued intermittently until 1400 on 21 April. Advance into the ocean has been sporadic and relatively minor in overall volume. Lava flows continued to advance, covering the November Kapa'ahu flow and spreading W over new ground. The main flow front continued to advance W into Hawaii Volcanoes National Park, overrunning more of . . . Hwy 130 and the entrance road to Royal Gardens subdivision. About 1.6 km of Highway 130 had been covered by late April. The small untouched area (kipuka) surrounded by the November lava flow has been slowly invaded and three more homes were destroyed by early May. A broad flow on the W side of the 1984 lava slowly advanced S and reached 43 m elevation (figure 48). Brush fires set by this flow generated heavy smoke, but have not threatened the Royal Gardens subdivision.
The level of the lava pond over the vent (figure 49) fluctuated from overflowing on 16-17 April to as much as 5 m below the rim. The pond was ~150 x 250 m, including the neck that leads to the main tube system. Tumescence occurring on the flanks of the ~52-m-high shield preceded lava breakouts and formation of fissures that emitted short aa flows. However, most movement of lava was through the underground tube system to the SE, visible through windows or skylights from ~660-40 m elevation.
There was no significant change in summit tilt. Harmonic tremor persisted in the East rift zone with some minor changes in amplitude at intervals of a few hours. Short tremor bursts 1-3 minutes in duration occurred intermittently. The number of microearthquakes in the summit area and East rift zone was slightly above average. Earthquakes of M 1.5-3.0 occurred beneath the SE flank of Mauna Loa (Kaoiki fault) and the S flank of Kīlauea.
Geologic Background. Kilauea overlaps the E flank of the massive Mauna Loa shield volcano in the island of Hawaii. Eruptions are prominent in Polynesian legends; written documentation since 1820 records frequent summit and flank lava flow eruptions interspersed with periods of long-term lava lake activity at Halemaumau crater in the summit caldera until 1924. The 3 x 5 km caldera was formed in several stages about 1,500 years ago and during the 18th century; eruptions have also originated from the lengthy East and Southwest rift zones, which extend to the ocean in both directions. About 90% of the surface of the basaltic shield volcano is formed of lava flows less than about 1,100 years old; 70% of the surface is younger than 600 years. The long-term eruption from the East rift zone between 1983 and 2018 produced lava flows covering more than 100 km2, destroyed hundreds of houses, and added new coastline.
Information Contacts: C. Heliker and R. Koyanagi, HVO.
Kiska (United States) — April 1987 Cite this Report
Kiska
United States
52.103°N, 177.602°E; summit elev. 1220 m
All times are local (unless otherwise noted)
Plume on satellite image
From a 15 April NOAA 9 satellite image (at 1704), Steven Shivers (USGS) noted a narrow plume drifting ~60 km E from the volcano. No reports of an eruption have been received from airplane pilots or ground observers.
Geologic Background. Conical Kiska volcano is the westernmost historically active volcano of the 2500-km-long Aleutian arc. The volcano lies at the northern tip of the elongated Kiska Island, across a low isthmus containing East Kiska and West Kiska lakes. A 400-m-wide elliptical crater, breached to the north, caps the 1220-m-high stratovolcano. The volcano is surrounded on three sides by sea cliffs up to 450 m high and overlies an older volcanic center exposed to the south. A massive submarine debris-avalanche deposit extends 40 km to the NNW. The southern part of the NE-SW-trending island, the westernmost of the Rat Island group, has been glaciated, but all lava flows post-date the last major glaciation. Young, steep-sided blocky lava flows, primarily on the N and SW flanks, have originated from vents at locations ranging from the summit to near sea level. A flank cinder cone and associated lava flows were erupted in 1962 at Sirius Point on the northern coast. The island contains one of the best harbors in the Aleutian Islands, but is uninhabited.
Information Contacts: J. Reeder, ADGGS; T. Miller, USGS, Anchorage; W. Gould, NOAA/NESDIS.
Kolokol Group (Russia) — April 1987 Cite this Report
Kolokol Group
Russia
46.042°N, 150.083°E; summit elev. 1328 m
All times are local (unless otherwise noted)
Weak gas emission from the Berg and Trezubetz domes
Weak gas emission from the extrusive domes at Berg and Trezubetz was noted during a 6 November overflight. Five explosive eruptions and one dome-building episode are known between 1845 and 1970.
Geologic Background. A group of Holocene volcanoes in central Urup Island is named after its most prominent volcano, Kolokol. Berg and Trezubetz volcanoes, flanking Kolokol on the NW, have breached summit calderas partially filled by lava domes. Trezubetz, whose name means "Trident," has an eroded crater rim with three large peaks when seen at sea from the north. Kolokol is sometimes known as Urup-Fuji because of its symmetrical profile. The crater of Kolokol is not well preserved, but there is no evidence of glacial erosion. Several lava flows originate from Kolokol; one of these extends almost to the Sea of Okhotsk coast; a viscous lava flow armoring the SE flank is probably the most recent. Borzov volcano, the oldest of the group, lies to the SW of Kolokol. Eruptions have been observed since the late-18th century. Berg volcano has been most active, but Trezubetz erupted in 1924.
Information Contacts: G. Steinberg and B. Piskunov, Yuzhno-Sakhalinsk.
Langila (Papua New Guinea) — April 1987 Cite this Report
Langila
Papua New Guinea
5.525°S, 148.42°E; summit elev. 1330 m
All times are local (unless otherwise noted)
Ash cloud to 3 km height
Activity was generally at a low level in April with weak white vapour emission from Crater 2 and little or no activity at Crater 3. However, a strong explosion occurred at Crater 2 on 12 April, propelling an ash cloud to ~3 km above the volcano. The explosion was heard [9] km away where fine ashfall was noted. Preliminary examination of the ash indicated that it contained little or no fresh material.
Geologic Background. Langila, one of the most active volcanoes of New Britain, consists of a group of four small overlapping composite basaltic-andesitic cones on the lower E flank of the extinct Talawe volcano in the Cape Gloucester area of NW New Britain. A rectangular, 2.5-km-long crater is breached widely to the SE; Langila was constructed NE of the breached crater of Talawe. An extensive lava field reaches the coast on the N and NE sides of Langila. Frequent mild-to-moderate explosive eruptions, sometimes accompanied by lava flows, have been recorded since the 19th century from three active craters at the summit. The youngest and smallest crater (no. 3 crater) was formed in 1960 and has a diameter of 150 m.
Information Contacts: C. McKee and P. Lowenstein, RVO.
Lascar
Chile
23.37°S, 67.73°W; summit elev. 5592 m
All times are local (unless otherwise noted)
Three explosions emitted ash clouds in September 1986
Eruptive activity [in September 1986] was observed by MINSAL Co. geologists in Toconao (32.5 km NW). Paul King, Sheila King, and John Heathcote reported that single explosive events occurred on 14, 15, and 16 September. Prior to the eruptions, a prominent steam plume, larger than the normal plume, had been present but no significant seismic activity had been recorded. No glow from the summit had been visible at night.
The 14 September eruption (at 1430) sent a brown, ash-laden cloud as much as several hundred meters above the crater rim. Ash pulses continued for ~30 minutes. After ~45 minutes all activity had ended. The 15 September eruption occurred at about the same time of day and appeared to be of similar magnitude, but visibility was poor. The explosive event of 16 September was powerful but brief, and ejected only a small amount of ash. It began with a loud, somewhat sustained, rumbling explosion at about 0730. A brown ash cloud rose vertically as a dense plug, expanded, took on a cauliflower texture, and finally broadened into a mushroom-shaped cloud extending SE. No pyroclastic flows were observed and the ash column dispersed rapidly. The first minutes of the eruption were photographed. Altitudes of ash clouds (measured from the photographs) reached at least 15 km altitude and the plume may have extended 20 km downwind. A GOES satellite image at 0800 showed a small plume stretching E from Lascar. By 0900 it had turned S but an hour later its distal end was obscured by clouds.
Field investigations on 1 April 1987 revealed no magmatic activity. Vapor from vents on the sides of a deep, steep-walled pit crater created a bluish haze but no white steam cloud was present. A strong SO2 smell was noted by geologists in an aircraft above the volcano. No incandescence was observed. An extremely thin layer of ash covered the SE flanks, concentrated along a very narrow axis of dispersion. At 0.5 km from the volcano the largest fresh tephra particles were 5-10-mm angular fragments of dense, dark, unvesiculated lava, very similar to the finer grained ash (0.01-0.02 mm diameter) that fell on Salta on 16 September.
Observations from aircraft showed a large number of impact craters and ejected blocks on the N flank. Most seemed to predate the 16 September eruption but a few appeared to geologists to be extremely fresh ('rays' of ejecta were well preserved). Fresh, dense, andesitic lava blocks in these craters were up to 40 cm in diameter.
The geologists found no evidence to suggest that juvenile material was erupted. Thermal studies with the Landsat T M during 1985 and 1986 had shown a thermal anomaly at Lascar that was much stronger than any other in the central Andes. Francis and Rothery (1987) interpreted the anomaly as indicating the presence of magma, or possibly a lava lake, in the summit crater complex.
Reference. Francis, P.W. and Rothery, D.A., 1987, Using the Landsat Thematic Mapper to Detect and Monitor Active Volcanoes: an Example from Northern Chile; Geology, v. 15, no. 7, p. 614-617.
Further Reference. Glaze, L.S., Francis, P.W., Self, S., and Rothery, D.A., 1989, The 16 September 1986 Eruption of Lascar Volcano, North Chile: Satellite Investigations; Bulletin of Volcanology, v. 51, p. 149-160.
Geologic Background. Láscar is the most active volcano of the northern Chilean Andes. The andesitic-to-dacitic stratovolcano contains six overlapping summit craters. Prominent lava flows descend its NW flanks. An older, higher stratovolcano 5 km E, Volcán Aguas Calientes, displays a well-developed summit crater and a probable Holocene lava flow near its summit (de Silva and Francis, 1991). Láscar consists of two major edifices; activity began at the eastern volcano and then shifted to the western cone. The largest eruption took place about 26,500 years ago, and following the eruption of the Tumbres scoria flow about 9000 years ago, activity shifted back to the eastern edifice, where three overlapping craters were formed. Frequent small-to-moderate explosive eruptions have been recorded since the mid-19th century, along with periodic larger eruptions that produced ashfall hundreds of kilometers away. The largest historical eruption took place in 1993, producing pyroclastic flows to 8.5 km NW of the summit and ashfall in Buenos Aires.
Information Contacts: P. Francis, Lunar and Planetary Institute, Houston; C. Ramirez, SERNAGEOMIN; W. Gould, NOAA/NESDIS.
Lokon-Empung (Indonesia) — April 1987 Cite this Report
Lokon-Empung
Indonesia
1.3644°N, 124.7992°E; summit elev. 1580 m
All times are local (unless otherwise noted)
Diminished activity; continuous white plume
Activity diminished during April. A white plume was continuously emitted from Tompaluan Crater to heights of 200-400 m. During the first half of the month, an average of 15 tectonic earthquakes were detected daily. No seismic activity was reported for the second half of the month.
Geologic Background. The Lokong-Empung volcanic complex, rising above the plain of Tondano in North Sulawesi, includes four peaks and an active crater. Lokon, the highest peak, has a flat craterless top. The morphologically younger Empung cone 2 km NE has a 400-m-wide, 150-m-deep crater that erupted last in the 18th century. A ridge extending 3 km WNW from Lokon includes the Tatawiran and Tetempangan peaks. All eruptions since 1829 have originated from Tompaluan, a 150 x 250 m crater in the saddle between Lokon and Empung. These eruptions have primarily produced small-to-moderate ash plumes that sometimes damaged croplands and houses, but lava-dome growth and pyroclastic flows have also occurred.
Information Contacts: VSI; T. Casadevall, USGS & VSI.
Mahawu
Indonesia
1.352°N, 124.865°E; summit elev. 1299 m
All times are local (unless otherwise noted)
Tectonic earthquakes, plume, elevated lake temperature
Beginning on 17 April, a white plume was observed ~100 m above Mahawu crater. The plume persisted into early May. Between 1 and 22 April, tectonic earthquakes occurred at a rate of 1/day, with no shallow volcanic earthquakes. During the last week of April, tectonic earthquakes occurred at a rate of ~9/day and shallow volcanic events at ~5/day.
Mahawu contains a crater lake with a volume of ~40,000 m3 of greenish-yellow water. On 21 April the temperature of the lake water was 45°C, compared to a normal 20°C measured in September 1986. A strong odor of H2S was also noted by the VSI observer during his 21 April visit. VSI recommended that a circular area extending ~3.5 km from the crater be temporarily closed to public access. In January 1978, the temperature of the lake water reached 70°C without an eruption [but see 12:7 & 8].
Geologic Background. The elongated Mahawu volcano immediately east of Lokon-Empung volcano is the northernmost of a series of young volcanoes along a SSW-NNE line near the margin of the Quaternary Tondano caldera. Mahawu is capped by a 180-m-wide, 140-m-deep crater that sometimes contains a small crater lake, and has two pyroclastic cones on its N flank. Historical activity has been restricted to occasional small explosive eruptions recorded since 1789. In 1994 fumaroles, mudpots, and small geysers were observed along the shores of a greenish-colored crater lake.
Information Contacts: T. Casadevall, USGS & VSI.
Makushin (United States) — April 1987 Cite this Report
Makushin
United States
53.891°N, 166.923°W; summit elev. 1800 m
All times are local (unless otherwise noted)
Correction: 2 March ash plume was from Akutan
The 2 March eruption plume [previously reported] was actually a plume from Akutan. Activity on 2 March was limited to a steam plume containing ash that extended at least 30 km E from the summit. Pilot H. Wilson (Peninsula Airways) observed several steam plumes rising at least 250 m above the summit and drifting at least 3 km WNW. He noted particulate matter, possibly ash, over snow in the summit region.
Geologic Background. The ice-covered Makushin volcano on northern Unalaska Island is capped by a 2.5 km caldera. Its broad, dome-like structure contrasts with the steep-sided profiles of most other Aleutian stratovolcanoes. Much of the edifice was formed during the Pleistocene, but the caldera (which formed about 8,000 years ago), Sugarloaf cone on the ENE flank, and a cluster of about a dozen explosion pits and cinder cones at Point Kadin on the WNW flank, are of Holocene age. A broad band of NE-SW-trending vents cuts across the volcano. The composite Pakushin cone, with multiple summit craters, lies 8 km SW. Table Top (Pleistocene, 68 +/- 14 ka) and Wide Bay (Holocene) cinder cones are about 20 km ENE on the peninsula across the bay from the City of Unalaska. Frequent explosive eruptions have occurred during the past 4,000 years, sometimes accompanied by pyroclastic flows and surges. Geothermal areas are found in the summit caldera and on the SE and E flanks. Small-to-moderate explosive eruptions have been recorded since 1786.
Information Contacts: J. Reeder, ADGGS; T. Miller, USGS Anchorage; W. Gould, NOAA/NESDIS.
Manam (Papua New Guinea) — April 1987 Cite this Report
Manam
Papua New Guinea
4.08°S, 145.037°E; summit elev. 1807 m
All times are local (unless otherwise noted)
Main crater emitting ash; some lava from S crater
Mild eruptive activity continued in April; stronger at the beginning and end of the month, less vigorous 4-20 April. Southern Crater sub-continuously emitted small to moderate amounts of pale gray (and occasionally brown) ash and vapor. Several emissions of blue vapor occurred. Crater glow and weak incandescent lava ejections were occasionally seen during more active periods. Roaring, rumbling, and loud booming were heard. Pale grey, rather than the usual white, emissions occurred from Main Crater, indicating ash entrainment and a possibly significant change in activity. Seismicity showed no trends during the month. Daily totals of volcanic earthquakes were steady at ~1,500, and event amplitudes were about the same as in March. Tilt measurements suggested that slight radial inflation (<1 µrad) may have occurred in April.
Geologic Background. The 10-km-wide island of Manam, lying 13 km off the northern coast of mainland Papua New Guinea, is one of the country's most active volcanoes. Four large radial valleys extend from the unvegetated summit of the conical basaltic-andesitic stratovolcano to its lower flanks. These valleys channel lava flows and pyroclastic avalanches that have sometimes reached the coast. Five small satellitic centers are located near the island's shoreline on the northern, southern, and western sides. Two summit craters are present; both are active, although most observed eruptions have originated from the southern crater, concentrating eruptive products during much of the past century into the SE valley. Frequent eruptions, typically of mild-to-moderate scale, have been recorded since 1616. Occasional larger eruptions have produced pyroclastic flows and lava flows that reached flat-lying coastal areas and entered the sea, sometimes impacting populated areas.
Information Contacts: C. McKee and P. Lowenstein, RVO.
Merapi
Indonesia
7.54°S, 110.446°E; summit elev. 2910 m
All times are local (unless otherwise noted)
Lava dome, largest since 1973, appears stable
Merapi was inspected on 9 May. The September 1986-January 1987 lava dome remained stable and was not growing [but see 12:8]. A robust whitish gas plume containing SO2 continued to be emitted from fumaroles on the E side of the lava dome and from the Gendol and Woro fumarole fields. The volume of the new lava dome measured on 9 May was slightly in excess of 4 x 10⁶ m3, the largest since 1973. No rockfall avalanches were noted during April, although several earthquakes/day were recorded.
Geologic Background. Merapi, one of Indonesia's most active volcanoes, lies in one of the world's most densely populated areas and dominates the landscape immediately north of the major city of Yogyakarta. It is the youngest and southernmost of a volcanic chain extending NNW to Ungaran volcano. Growth of Old Merapi during the Pleistocene ended with major edifice collapse perhaps about 2,000 years ago, leaving a large arcuate scarp cutting the eroded older Batulawang volcano. Subsequent growth of the steep-sided Young Merapi edifice, its upper part unvegetated due to frequent activity, began SW of the earlier collapse scarp. Pyroclastic flows and lahars accompanying growth and collapse of the steep-sided active summit lava dome have devastated cultivated lands on the western-to-southern flanks and caused many fatalities.
Information Contacts: T. Casadevall, USGS & VSI.
Moyorodake [Medvezhia] (Japan - administered by Russia) — April 1987 Cite this Report
Moyorodake [Medvezhia]
Japan - administered by Russia
45.389°N, 148.838°E; summit elev. 1124 m
All times are local (unless otherwise noted)
Intense fumarolic activity
Intense activity from a few groups of fumaroles in Kudriavy's summit crater was occurring during a 6 November aerial survey. Sulfur deposits were noted around the fumaroles. East of the crater, on the outer dome slope, very intense gas emission (more active than in the crater) was observed.
Geologic Background. The Moyorodake volcanic complex (also known as Medvezhia) occupies the NE end of Iturup (Etorofu) Island. Two overlapping calderas, 14 x 18 and 10 x 12 km in diameter, were formed during the Pleistocene. The caldera floor contains several lava domes, cinder cones and associated lava fields, and a small lake. Four small closely spaced stratovolcanoes were constructed along an E-W line on the eastern side of the complex. The easternmost and highest, Medvezhii, lies outside the western caldera, along the Pacific coast. Srednii, Tukap, and Kudriavy (Moyorodake) volcanoes lie immediately to the west. Historically active Moyorodake is younger than 2000 years; it and Tukap remain fumarolically active. The westernmost of the post-caldera cones, Menshoi Brat, is a large lava dome with flank scoria cones, one of which has produced a series of young lava flows up to 4.5 km long that reached Slavnoe Lake. Eruptions have been documented since the 18th century, although lava flows from cinder cones on the flanks of Menshoi Brat were also probably erupted within the past few centuries.
Information Contacts: G. Steinberg and B. Piskunov, Yuzhno-Sakhalinsk.
Rabaul (Papua New Guinea) — April 1987 Cite this Report
Rabaul
Papua New Guinea
4.2459°S, 152.1937°E; summit elev. 688 m
All times are local (unless otherwise noted)
Low seismicity; deflation in E part of caldera
Seismicity remained at a very low level in April with 103 events recorded. Only five events were large enough to be located. All originated from the Greet Harbour area and four were immediately N of Tavurvur . . . in the E part of the caldera. Levelling measurements on 28 April showed that Matupit Island had subsided 8 mm since the last measurement, on 19 February, and electronic distance measurements on 6 April were consistent with deflation in the Greet Harbour Area. No definite trends were evident in tilt measurements.
Geologic Background. The low-lying Rabaul caldera on the tip of the Gazelle Peninsula at the NE end of New Britain forms a broad sheltered harbor utilized by what was the island's largest city prior to a major eruption in 1994. The outer flanks of the asymmetrical shield volcano are formed by thick pyroclastic-flow deposits. The 8 x 14 km caldera is widely breached on the east, where its floor is flooded by Blanche Bay and was formed about 1,400 years ago. An earlier caldera-forming eruption about 7,100 years ago is thought to have originated from Tavui caldera, offshore to the north. Three small stratovolcanoes lie outside the N and NE caldera rims. Post-caldera eruptions built basaltic-to-dacitic pyroclastic cones on the caldera floor near the NE and W caldera walls. Several of these, including Vulcan cone, which was formed during a large eruption in 1878, have produced major explosive activity during historical time. A powerful explosive eruption in 1994 occurred simultaneously from Vulcan and Tavurvur volcanoes and forced the temporary abandonment of Rabaul city.
Information Contacts: C. McKee and P. Lowenstein, RVO.
Raususan [Mendeleev] (Japan - administered by Russia) — April 1987 Cite this Report
Raususan [Mendeleev]
Japan - administered by Russia
43.979°N, 145.733°E; summit elev. 882 m
All times are local (unless otherwise noted)
Intense fumarolic and solfataric activity
In the explosive crater area on the volcano's E slope intense fumarolic and solfataric activity was occurring during a 6 November aerial survey.
Geologic Background. Raususan, also known as Mendeleev, is a low compound stratovolcano located in the southern part of Kunashir Island. The dominantly andesitic-dacitic volcano is cut by two nested calderas, the larger 6-7 km in diameter and the smaller 3-3.5 km. A central cone that formed inside the younger caldera was breached to the west by a large debris avalanche about 4200 years ago. A lava dome that grew inside the avalanche scarp forms the 888 m high point of the volcano. Additional lava domes in the northern part of the older caldera are considered to represent flank activity of the younger caldera. The only unambiguous historical eruption was a small phreatic explosion in 1880. Four solfatara fields lie at the eastern and northern flanks of the central cone, and a geothermal field is located outside the caldera along the eastern coast.
Information Contacts: G. Steinberg and B. Piskunov, Yuzhno-Sakhalinsk.
Rincon de la Vieja (Costa Rica) — April 1987 Cite this Report
Rincon de la Vieja
Costa Rica
10.83°N, 85.324°W; summit elev. 1916 m
All times are local (unless otherwise noted)
Phreatic eruption; lahars
"On 1 April, an eruption of Rincón de la Vieja was heard and seen by residents of the town of Buenos Aires de Upala, 7 km NE of the crater. This phreatic eruption originated from the active crater.
"Various rivers have headwaters on the N flank and flow NE (among them the Río Azul, Quebrada Azufrada, and Río Pénjamo) and lahars formed in some of them. At about 500 m above sea level, the Río Pénjamo and the Quebrada Azufrada left their channels, flooding agricultural land. No lahar formed in the Río Azul, although on 9 April it still had a gray color because of the quantity of suspended ash that it was carrying.
"According to a resident of the area, the eruption occurred at 0940. Twenty minutes later the lahar passed near the town of Buenos Aires. The seismic station of the Observatorio Vulcanológico y Sismológico registered an event at 0932.55 with a duration of 3 minutes."
Geologic Background. Rincón de la Vieja, the largest volcano in NW Costa Rica, is a remote volcanic complex in the Guanacaste Range. The volcano consists of an elongated, arcuate NW-SE-trending ridge constructed within the 15-km-wide early Pleistocene Guachipelín caldera, whose rim is exposed on the south side. Sometimes known as the "Colossus of Guanacaste," it has an estimated volume of 130 km3 and contains at least nine major eruptive centers. Activity has migrated to the SE, where the youngest-looking craters are located. The twin cone of Santa María volcano, the highest peak of the complex, is located at the eastern end of a smaller, 5-km-wide caldera and has a 500-m-wide crater. A Plinian eruption producing the 0.25 km3 Río Blanca tephra about 3,500 years ago was the last major magmatic eruption. All subsequent eruptions, including numerous historical eruptions possibly dating back to the 16th century, have been from the prominent active crater containing a 500-m-wide acid lake located ENE of Von Seebach crater.
Information Contacts: J. Barquero, OVSICORI.
Nevado del Ruiz (Colombia) — April 1987 Cite this Report
Nevado del Ruiz
Colombia
4.892°N, 75.324°W; summit elev. 5279 m
All times are local (unless otherwise noted)
Continued moderate-high seismicity; acid rain kills birds
Seismicity continued at moderately high levels in April; 920 low-frequency and 172 high-frequency events were registered. The tremor signal has remained weak compared to 1986. Seismic activity peaked on 16 and 17 April when 80-90 events were recorded each day [see also 12:05]. One week later, deformation measurements showed changes of as much as 5 µrad/day. SO2 levels, measured by COSPEC, averaged 1,000-1,200 t/d.
Geologic Background. Nevado del Ruiz is a broad, glacier-covered volcano in central Colombia that covers more than 200 km2. Three major edifices, composed of andesitic and dacitic lavas and andesitic pyroclastics, have been constructed since the beginning of the Pleistocene. The modern cone consists of a broad cluster of lava domes built within the caldera of an older edifice. The 1-km-wide, 240-m-deep Arenas crater occupies the summit. The prominent La Olleta pyroclastic cone located on the SW flank may also have been active in historical time. Steep headwalls of massive landslides cut the flanks. Melting of its summit icecap during historical eruptions, which date back to the 16th century, has resulted in devastating lahars, including one in 1985 that was South America's deadliest eruption.
Information Contacts: E. Parra, INGEOMINAS, Manizales.
Sangeang Api (Indonesia) — April 1987 Cite this Report
Sangeang Api
Indonesia
8.2°S, 119.07°E; summit elev. 1912 m
All times are local (unless otherwise noted)
About 50 small explosions daily
Sangeang Api continued in eruption with an average of ~50 small explosions/day during April. The maximum plume height was 600 m. No earthquakes were detected during April.
Geologic Background. Sangeang Api volcano, one of the most active in the Lesser Sunda Islands, forms a small 13-km-wide island off the NE coast of Sumbawa Island. Two large trachybasaltic-to-tranchyandesitic volcanic cones, Doro Api and Doro Mantoi, were constructed in the center and on the eastern rim, respectively, of an older, largely obscured caldera. Flank vents occur on the south side of Doro Mantoi and near the northern coast. Intermittent eruptions have been recorded since 1512, most of them during in the 20th century.
Information Contacts: T. Casadevall, USGS & VSI.
Sarychev Peak (Russia) — April 1987 Cite this Report
Sarychev Peak
Russia
48.092°N, 153.2°E; summit elev. 1496 m
All times are local (unless otherwise noted)
Lava flow and gas emissions
In September 1986 the staff of a meteorological station on Matua Island reported a strong sulfur smell. During the previous observations, after the 1976 eruption, the crater was described as flat-bottomed with a depth of 50-70 m by Andreyev and others (1978). During the 2 November 1986 overflight only the SE wall remained above the crater. Gas was being emitted from most of the crater, with the most intense fumaroles restricted to its central and W parts. A black, snow-free lava tongue extended 100-150 m from the S part of the crater. Many shallow fumaroles were located in the SE part of the crater and at the head of the lava flow. Gas emission was not observed from the lava flow itself. Traces of ash that fell before September 1986 were noted on the snow-covered crater slopes. The volcano has no permanent snow cover.
Reference. Andreyev, V.N., Shantser, A.Ye., Khrenov, A.P., Okrugin, V.M., and Nechayev, V.N., 1978, Eruption of the volcanic peak Sarycheva in 1976: Byull. Vulkanol. Stn., no. 55, p. 35-40.
Geologic Background. Sarychev Peak, one of the most active volcanoes of the Kuril Islands, occupies the NW end of Matua Island in the central Kuriles. The andesitic central cone was constructed within a 3-3.5-km-wide caldera, whose rim is exposed only on the SW side. A dramatic 250-m-wide, very steep-walled crater with a jagged rim caps the volcano. The substantially higher SE rim forms the 1496 m high point of the island. Fresh-looking lava flows, prior to activity in 2009, had descended in all directions, often forming capes along the coast. Much of the lower-angle outer flanks of the volcano are overlain by pyroclastic-flow deposits. Eruptions have been recorded since the 1760s and include both quiet lava effusion and violent explosions. Large eruptions in 1946 and 2009 produced pyroclastic flows that reached the sea.
Information Contacts: G. Steinberg and B. Piskunov, Yuzhno-Sakhalinsk.
Semeru
Indonesia
8.108°S, 112.922°E; summit elev. 3657 m
All times are local (unless otherwise noted)
Continued small Vulcanian explosions
. . . frequent, small Vulcanian eruptions.
Geologic Background. Semeru, the highest volcano on Java, and one of its most active, lies at the southern end of a volcanic massif extending north to the Tengger caldera. The steep-sided volcano, also referred to as Mahameru (Great Mountain), rises above coastal plains to the south. Gunung Semeru was constructed south of the overlapping Ajek-ajek and Jambangan calderas. A line of lake-filled maars was constructed along a N-S trend cutting through the summit, and cinder cones and lava domes occupy the eastern and NE flanks. Summit topography is complicated by the shifting of craters from NW to SE. Frequent 19th and 20th century eruptions were dominated by small-to-moderate explosions from the summit crater, with occasional lava flows and larger explosive eruptions accompanied by pyroclastic flows that have reached the lower flanks of the volcano.
Information Contacts: T. Casadevall, USGS & VSI.
Semisopochnoi (United States) — April 1987 Cite this Report
Semisopochnoi
United States
51.93°N, 179.58°E; summit elev. 1221 m
All times are local (unless otherwise noted)
Plume; possible ash deposits
A plume originating at about 52°N, 180° and extending 90 km ENE was noted by Steven Shivers from a NOAA 9 satellite image returned 13 April at 1731. On an image at 2135 the same day, the plume extended only 15 km ENE. On 24 April, pilot Harold Wilson (Peninsula Airways), flying 50 km SE of Semisopochnoi, noted a very dark-colored peak (perhaps Sugarloaf) among other snow-covered mountains on the island. Plumes from Semisopochnoi were reported several times in the 18th and 19th centuries.
Geologic Background. Semisopochnoi, the largest subaerial volcano of the western Aleutians, is 20 km wide at sea level and contains an 8-km-wide caldera. It formed as a result of collapse of a low-angle, dominantly basaltic volcano following the eruption of a large volume of dacitic pumice. The high point of the island is Anvil Peak, a double-peaked late-Pleistocene cone that forms much of the island's northern part. The three-peaked Mount Cerberus (renamed Mount Young in 2023) was constructed within the caldera during the Holocene. Each of the peaks contains a summit crater; lava flows on the N flank appear younger than those on the south side. Other post-caldera volcanoes include the symmetrical Sugarloaf Peak SSE of the caldera and Lakeshore Cone, a small cinder cone at the edge of Fenner Lake in the NE part of the caldera. Most documented eruptions have originated from Young, although Coats (1950) considered that both Sugarloaf and Lakeshore Cone could have been recently active.
Information Contacts: J. Reeder, ADGGS; T. Miller, USGS, Anchorage; W. Gould, NOAA/NESDIS.
Tao-Rusyr Caldera (Russia) — April 1987 Cite this Report
Tao-Rusyr Caldera
Russia
49.34°N, 154.725°E; summit elev. 1272 m
All times are local (unless otherwise noted)
No fumarolic activity
During an aerial survey on 2 November 1986 the summit crater [of Krenitzyn] was covered with snow. There was no indication of fumarolic activity in the summit area or in the area of the 1952 E-flank eruption.
Geologic Background. The southern half of Onekotan Island in the northern Kuril Islands contains the 7.5-km-wide Tao-Rusyr caldera, which is mostly filled by Kal'tsevoe lake. The basaltic-to-andesitic caldera formed about 7,500 years ago, in which the large post-caldera Krenitsyn Peak grew, building a 4-km-wide island in the NW part of the lake that rises above the caldera rim. A 350-m-wide, 100-m-deep crater truncates the peak, and a large crater is located on the upper NE side. An eruption in 1952 formed a small lava dome in an explosion crater along the eastern shore of the island.
Information Contacts: G. Steinberg and B. Piskunov, Yuzhno-Sakhalinsk.
Tomariyama [Golovnin] (Japan - administered by Russia) — April 1987 Cite this Report
Tomariyama [Golovnin]
Japan - administered by Russia
43.844°N, 145.504°E; summit elev. 535 m
All times are local (unless otherwise noted)
Moderate fumarolic and solfataric activity
During a 6 November 1986 aerial survey, moderate fumarolic and solfataric activity was noted at the N foot of the E and W domes and along Goryachee Lake's S shore.
Geologic Background. Tomariyama, also known as Golovnin, forms the southern end of Kunashir Island, across the Nemuro Strait from Hokkaido. Explosive activity has dominated in the formation of this andesitic-dacitic volcano; no lava flows are exposed. The gently sloping stratovolcano is truncated by a 4-5 km caldera that formed during a series of late-Pleistocene eruptions beginning about 43,000 years ago. Several lava domes were subsequently emplaced on the caldera floor. Topographic highs outside the caldera rim are lava domes extruded along a ring structure or an outer caldera. A 1 x 2.5 km caldera lake on the northern side of the inner caldera drains through a narrow breach in the western caldera wall. Solfataric activity occurs at the northern lake shore and at explosion craters (one of which contains a hot crater lake with reported temperatures from 36-100°C) that cut the caldera-floor lava domes. The only known recorded eruption was a minor explosion in 1848.
Information Contacts: G. Steinberg and B. Piskunov, Yuzhno-Sakhalinsk.
Ushishur
Russia
47.5125°N, 152.8139°E; summit elev. 357 m
All times are local (unless otherwise noted)
Fumarolic activity
Moderate fumarolic activity was noted in the crater and on the W outer slope during 11 and 31 aerial October observations.
Geologic Background. The subaerial portion of Ushishur volcano in the central Kuriles is exposed in two small islands, the southern containing the summit caldera and the northern a portion of the volcano's flanks. A small 1.6-km-wide caldera that formed about 9,400 years ago is narrowly breached on the south, allowing seawater to fill the caldera. Two andesitic lava domes occupy part of the caldera bay; two other older domes are joined by a sand bar to the SE caldera wall. The two younger domes, erupted sometime after the 1769 visit of Captain Snow, form islands in the bay. A cluster of strong fumaroles and hot springs are present along the SE caldera shoreline, and vigorous submarine hydrothermal activity has modified the geochemistry of water within the caldera bay. Aside from growth of the two younger lava domes, only minor phreatic eruptions have been recorded.
Information Contacts: G. Steinberg and B. Piskunov, Yuzhno-Sakhalinsk.
Whakaari/White Island (New Zealand) — April 1987 Cite this Report
Whakaari/White Island
New Zealand
37.52°S, 177.18°E; summit elev. 294 m
All times are local (unless otherwise noted)
Continued ash emission
Intermittent ash eruptions have continued since 28 March fieldwork, although no significant change has occurred in vent morphology or crater floor conditions.
On 7 April at 1544, geologists visiting the island observed an ash column that rose >1.0 km and sent warm ash W of the crater. The gas/ash plume was jetted horizontally under high pressure from the active vent (Hitchhiker) in Congress Crater; bright incandescence was visible for 10-20 m. A low-frequency vibration accompanied the eruption. Small slabs of hydrothermally altered sediments (2-5 cm) were deposited within 100 m of the vent. A deformation survey conducted during the 7 April visit found 21 mm of uplift just E of the crater (in the Donald Mound area). Fumarole temperatures had not changed significantly and new ejecta remained lithic-dominated. Total ash accumulation since 25 January 1987 was 43 cm on the E rim of the 1978 Crater complex and 80 cm on the NE rim. Ash thickness decreased rapidly away from the rim.
Low-frequency (B-type) volcanic earthquakes numbered 13-33/day 28 March-13 April, while high-frequency (A-type) events remained rare. Levels of seismic activity were similar to those of 1986. Eruption (E-type) earthquakes were recorded on 1, 7, and 10 April. The 10 April event was the largest, with a maximum tremor amplitude of 15 mm and a duration of about 10 minutes.
A minor eruption was reported on 13 April by observers ... at Whakatane and Opotiki. A vertical steam column rose 1.5-3 km above the island and at least one discrete pulse of ash-laden steam was reported to "flow" laterally away from the eruption column over the sea. When geologists visited the crater on 15 April very little fresh tephra had accumulated on the main crater floor. The vent was more or less continuously emitting high-pressure gas with minor ash, and surging cauliflower clouds climbed the crater wall. Incandescence was seen intermittently during a period of poor visibility.
Geologic Background. The uninhabited Whakaari/White Island is the 2 x 2.4 km emergent summit of a 16 x 18 km submarine volcano in the Bay of Plenty about 50 km offshore of North Island. The island consists of two overlapping andesitic-to-dacitic stratovolcanoes. The SE side of the crater is open at sea level, with the recent activity centered about 1 km from the shore close to the rear crater wall. Volckner Rocks, sea stacks that are remnants of a lava dome, lie 5 km NW. Descriptions of volcanism since 1826 have included intermittent moderate phreatic, phreatomagmatic, and Strombolian eruptions; activity there also forms a prominent part of Maori legends. The formation of many new vents during the 19th and 20th centuries caused rapid changes in crater floor topography. Collapse of the crater wall in 1914 produced a debris avalanche that buried buildings and workers at a sulfur-mining project. Explosive activity in December 2019 took place while tourists were present, resulting in many fatalities. The official government name Whakaari/White Island is a combination of the full Maori name of Te Puia o Whakaari ("The Dramatic Volcano") and White Island (referencing the constant steam plume) given by Captain James Cook in 1769.
Information Contacts: I. Nairn and C. Wood, NZGS Rotorua.