Recently Published Bulletin Reports
Erebus (Antarctica) Lava lake remains active; most thermal alerts recorded since 2019
Rincon de la Vieja (Costa Rica) Frequent phreatic explosions during July-December 2023
Bezymianny (Russia) Explosion on 18 October 2023 sends ash plume 8 km high; lava flows and incandescent avalanches
Kilauea (United States) Low-level lava effusions in the lava lake at Halema’uma’u during July-December 2022
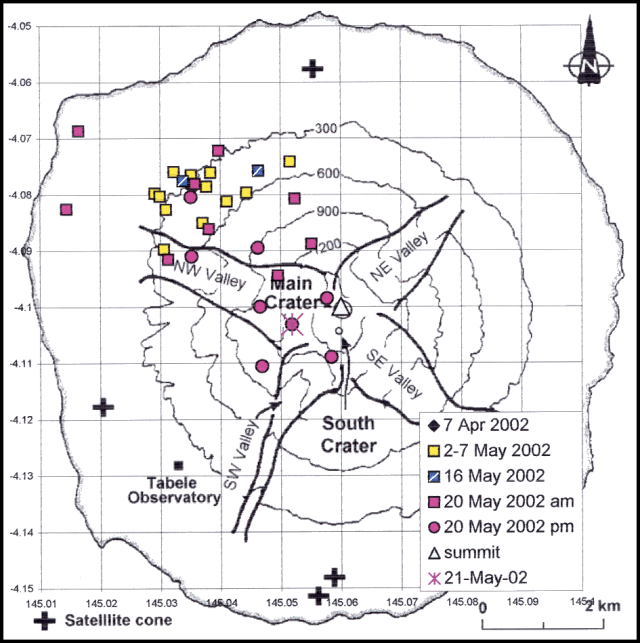
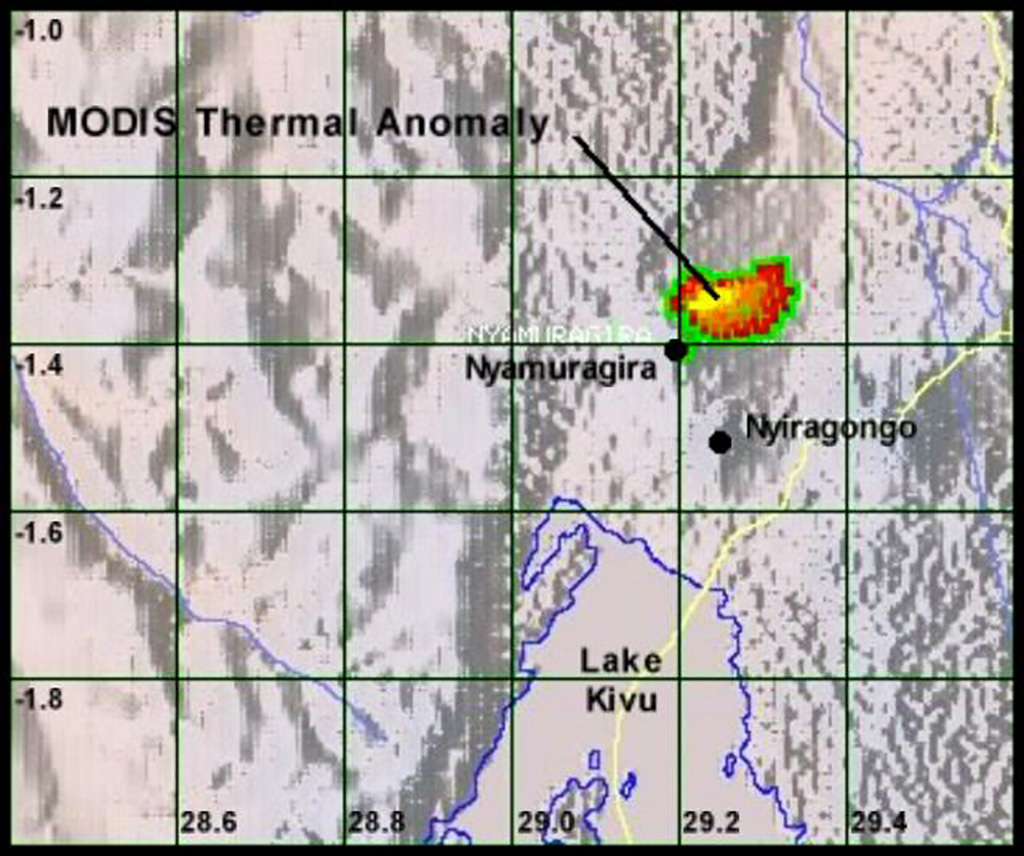
Nyamulagira (DR Congo) Lava flows and thermal activity during May-October 2023
Bagana (Papua New Guinea) Explosions, ash plumes, ashfall, and lava flows during April-September 2023
Mayon (Philippines) Lava flows, pyroclastic flows, ash emissions, and seismicity during April-September 2023
Nishinoshima (Japan) Eruption plumes and gas-and-steam plumes during May-August 2023
Krakatau (Indonesia) White gas-and-steam plumes and occasional ash plumes during May-August 2023
Merapi (Indonesia) Frequent incandescent avalanches during April-September 2023
Villarrica (Chile) Strombolian activity, gas-and-ash emissions, and crater incandescence during April-September 2023
Ebeko (Russia) Moderate explosive activity with ash plumes continued during June-November 2023
Erebus (Antarctica) — January 2024  Cite this Report
Erebus
Antarctica
77.53°S, 167.17°E; summit elev. 3794 m
All times are local (unless otherwise noted)
Lava lake remains active; most thermal alerts recorded since 2019
The lava lake in the summit crater of Erebus has been active since at least 1972. Located in Antarctica overlooking the McMurdo Station on Ross Island, it is the southernmost active volcano on the planet. Because of the remote location, activity is primarily monitored by satellites. This report covers activity during 2023.
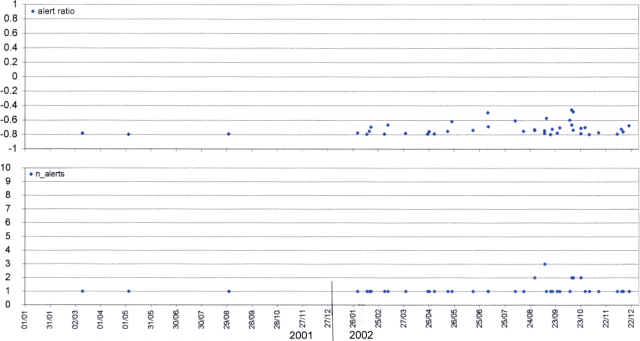
The number of thermal alerts recorded by the Hawai'i Institute of Geophysics and Planetology’s MODVOLC Thermal Alerts System increased considerably in 2023 compared to the years 2020-2022 (table 9). In contrast to previous years, the MODIS instruments aboard the Aqua and Terra satellites captured data from Erebus every month during 2023. Consistent with previous years, the lowest number of anomalous pixels were recorded in January, November, and December.
Table 9. Number of monthly MODIS-MODVOLC thermal alert pixels recorded at Erebus during 2017-2023. See BGVN 42:06 for data from 2000 through 2016. The table was compiled using data provided by the HIGP – MODVOLC Thermal Alerts System.
| Year |
Jan |
Feb |
Mar |
Apr |
May |
Jun |
Jul |
Aug |
Sep |
Oct |
Nov |
Dec |
SUM |
| 2017 |
0 |
21 |
9 |
0 |
0 |
1 |
11 |
61 |
76 |
52 |
0 |
3 |
234 |
| 2018 |
0 |
21 |
58 |
182 |
55 |
17 |
137 |
172 |
103 |
29 |
0 |
0 |
774 |
| 2019 |
2 |
21 |
162 |
151 |
55 |
56 |
75 |
53 |
29 |
19 |
1 |
0 |
624 |
| 2020 |
0 |
2 |
16 |
18 |
4 |
4 |
1 |
3 |
18 |
3 |
1 |
6 |
76 |
| 2021 |
0 |
9 |
1 |
0 |
2 |
56 |
46 |
47 |
35 |
52 |
5 |
3 |
256 |
| 2022 |
1 |
13 |
55 |
22 |
15 |
32 |
39 |
19 |
31 |
11 |
0 |
0 |
238 |
| 2023 |
2 |
33 |
49 |
82 |
41 |
32 |
70 |
64 |
42 |
17 |
5 |
11 |
448 |
Sentinel-2 infrared images showed one or two prominent heat sources within the summit crater, accompanied by adjacent smaller sources, similar to recent years (see BGVN 46:01, 47:02, and 48:01). A unique image was obtained on 25 November 2023 by the OLI-2 (Operational Land Imager-2) on Landsat 9, showing the upper part of the volcano surrounded by clouds (figure 32).
Geologic Background. Mount Erebus, the world's southernmost historically active volcano, overlooks the McMurdo research station on Ross Island. It is the largest of three major volcanoes forming the crudely triangular Ross Island. The summit of the dominantly phonolitic volcano has been modified by one or two generations of caldera formation. A summit plateau at about 3,200 m elevation marks the rim of the youngest caldera, which formed during the late-Pleistocene and within which the modern cone was constructed. An elliptical 500 x 600 m wide, 110-m-deep crater truncates the summit and contains an active lava lake within a 250-m-wide, 100-m-deep inner crater; other lava lakes are sometimes present. The glacier-covered volcano was erupting when first sighted by Captain James Ross in 1841. Continuous lava-lake activity with minor explosions, punctuated by occasional larger Strombolian explosions that eject bombs onto the crater rim, has been documented since 1972, but has probably been occurring for much of the volcano's recent history.
Information Contacts: Hawai'i Institute of Geophysics and Planetology (HIGP) - MODVOLC Thermal Alerts System, School of Ocean and Earth Science and Technology (SOEST), Univ. of Hawai'i, 2525 Correa Road, Honolulu, HI 96822, USA (URL: http://modis.higp.hawaii.edu/); Copernicus Browser, Copernicus Data Space Ecosystem, European Space Agency (URL: https://dataspace.copernicus.eu/browser/); NASA Earth Observatory, EOS Project Science Office, NASA Goddard Space Flight Center, Goddard, Maryland, USA (URL: https://earthobservatory.nasa.gov/images/152134/erebus-breaks-through).
Rincon de la Vieja (Costa Rica) — January 2024 Cite this Report
Rincon de la Vieja
Costa Rica
10.83°N, 85.324°W; summit elev. 1916 m
All times are local (unless otherwise noted)
Frequent phreatic explosions during July-December 2023
Rincón de la Vieja is a volcanic complex in Costa Rica with a hot convecting acid lake that exhibits frequent weak phreatic explosions, gas-and-steam emissions, and occasional elevated sulfur dioxide levels (BGVN 45:10, 46:03, 46:11). The current eruption period began June 2021. This report covers activity during July-December 2023 and is based on weekly bulletins and occasional daily reports from the Observatorio Vulcanologico Sismologica de Costa Rica-Universidad Nacional (OVSICORI-UNA).
Numerous weak phreatic explosions continued during July-December 2023, along with gas-and-steam emissions and plumes that rose as high as 3 km above the crater rim. Many weekly OVSICORI-UNA bulletins included the previous week's number of explosions and emissions (table 9). For many explosions, the time of explosion was given (table 10). Frequent seismic activity (long-period earthquakes, volcano-tectonic earthquakes, and tremor) accompanied the phreatic activity.
Table 9. Number of reported weekly phreatic explosions and gas-and-steam emissions at Rincón de la Vieja, July-December 2023. Counts are reported for the week before the Weekly Bulletin date; not all reports included these data. Courtesy of OVSICORI-UNA.
| OVSICORI Weekly Bulletin |
Number of explosions |
Number of emissions |
| 28 Jul 2023 |
6 |
14 |
| 4 Aug 2023 |
10 |
12 |
| 1 Sep 2023 |
13 |
11 |
| 22 Sep 2023 |
12 |
13 |
| 29 Sep 2023 |
6 |
11 |
| 6 Oct 2023 |
12 |
5 |
| 13 Oct 2023 |
7 |
9 |
| 20 Oct 2023 |
1 |
15 |
| 27 Oct 2023 |
3 |
23 |
| 3 Nov 2023 |
3 |
10 |
| 17 Nov 2023 |
0 |
Some |
| 24 Nov 2023 |
0 |
14 |
| 8 Dec 2023 |
4 |
16 |
| 22 Dec 2023 |
8 |
18 |
Table 10. Summary of activity at Rincón de la Vieja during July-December 2023. Weak phreatic explosions and gas emissions are noted where the time of explosion was indicated in the weekly or daily bulletins. Height of plumes or emissions are distance above the crater rim. Courtesy of OVSICORI-UNA.
| Date |
Time |
Description of Activity |
| 1 Jul 2023 |
0156 |
Explosion. |
| 2 Jul 2023 |
0305 |
Explosion. |
| 4 Jul 2023 |
0229, 0635 |
Event at 0635 produced a gas-and-steam plume that rose 700 m and drifted W; seen by residents in Liberia (21 km SW). |
| 9 Jul 2023 |
1843 |
Explosion. |
| 21 Jul 2023 |
0705 |
Explosion. |
| 26 Jul 2023 |
1807 |
Explosion. |
| 28 Jul 2023 |
0802 |
Explosion generated a gas-and-steam plume that rose 500 m. |
| 30 Jul 2023 |
1250 |
Explosion. |
| 31 Jul 2023 |
2136 |
Explosion. |
| 11 Aug 2023 |
0828 |
Explosion. |
| 18 Aug 2023 |
1304 |
Explosion. |
| 21 Aug 2023 |
1224 |
Explosion generated gas-and-steam plumes rose 500-600 m. |
| 22 Aug 2023 |
0749 |
Explosion generated gas-and-steam plumes rose 500-600 m. |
| 24 Aug 2023 |
1900 |
Explosion. |
| 25 Aug 2023 |
0828 |
Event produced a steam-and-gas plume that rose 3 km and drifted NW. |
| 27-28 Aug 2023 |
0813 |
Four small events; the event at 0813 on 28 August lasted two minutes and generated a steam-and-gas plume that rose 2.5 km. |
| 1 Sep 2023 |
1526 |
Explosion generated plume that rose 2 km and ejected material onto the flanks. |
| 2-3 Sep 2023 |
- |
Small explosions detected in infrasound data. |
| 4 Sep 2023 |
1251 |
Gas-and-steam plume rose 1 km and drifted W. |
| 7 Nov 2023 |
1113 |
Explosion. |
| 8 Nov 2023 |
0722 |
Explosion. |
| 12 Nov 2023 |
0136 |
Small gas emissions. |
| 14 Nov 2023 |
0415 |
Small gas emissions. |
According to OVSICORI-UNA, during July-October the average weekly sulfur dioxide (SO2) flux ranged from 68 to 240 tonnes/day. However, in mid-November the flux increased to as high as 334 tonnes/day, the highest value measured in recent years. The high SO2 flux in mid-November was also detected by the TROPOMI instrument on the Sentinel-5P satellite (figure 43).
Geologic Background. Rincón de la Vieja, the largest volcano in NW Costa Rica, is a remote volcanic complex in the Guanacaste Range. The volcano consists of an elongated, arcuate NW-SE-trending ridge constructed within the 15-km-wide early Pleistocene Guachipelín caldera, whose rim is exposed on the south side. Sometimes known as the "Colossus of Guanacaste," it has an estimated volume of 130 km3 and contains at least nine major eruptive centers. Activity has migrated to the SE, where the youngest-looking craters are located. The twin cone of Santa María volcano, the highest peak of the complex, is located at the eastern end of a smaller, 5-km-wide caldera and has a 500-m-wide crater. A Plinian eruption producing the 0.25 km3 Río Blanca tephra about 3,500 years ago was the last major magmatic eruption. All subsequent eruptions, including numerous historical eruptions possibly dating back to the 16th century, have been from the prominent active crater containing a 500-m-wide acid lake located ENE of Von Seebach crater.
Information Contacts: Observatorio Vulcanológico Sismológica de Costa Rica-Universidad Nacional (OVSICORI-UNA), Apartado 86-3000, Heredia, Costa Rica (URL: http://www.ovsicori.una.ac.cr/); NASA Global Sulfur Dioxide Monitoring Page, Atmospheric Chemistry and Dynamics Laboratory, NASA Goddard Space Flight Center (NASA/GSFC), 8800 Greenbelt Road, Goddard MD 20771, USA (URL: https://so2.gsfc.nasa.gov/).
Bezymianny (Russia) — November 2023 Cite this Report
Bezymianny
Russia
55.972°N, 160.595°E; summit elev. 2882 m
All times are local (unless otherwise noted)
Explosion on 18 October 2023 sends ash plume 8 km high; lava flows and incandescent avalanches
Bezymianny, located on Russia’s Kamchatka Peninsula, has had eruptions since 1955 characterized by dome growth, explosions, pyroclastic flows, ash plumes, and ashfall. Activity during November 2022-April 2023 included gas-and-steam emissions, lava dome collapses generating avalanches, and persistent thermal activity. Similar eruptive activity continued from May through October 2023, described here based on information from weekly and daily reports of the Kamchatka Volcano Eruptions Response Team (KVERT), notices from Tokyo VAAC (Volcanic Ash Advisory Center), and from satellite data.
Overall activity decreased after the strong period of activity in late March through April 2023, which included ash explosions during 29 March and 7-8 April 2023 that sent plumes as high as 10-12 km altitude, along with dome growth and lava flows (BGVN 48:05). This reduced activity can be seen in the MIROVA thermal detection system graph (figure 56), which was consistent with data from the MODVOLC thermal detection system and with Sentinel-2 satellite images that showed persistent hotspots in the summit crater when conditions allowed observations. A renewed period of strong activity began in mid-October 2023.
Activity increased significantly on 17 October 2023 when large collapses began during 0700-0830 on the E flanks of the lava dome and continued to after 0930 the next day (figure 57). Ash plumes rose to an altitude of 4.5-5 km, extending 220 km NNE by 18 October. A large explosion at 1630 on 18 October produced an ash plume that rose to an altitude of 11 km (8 km above the summit) and drifted NNE and then NW, extending 900 km NW within two days at an altitude of 8 km. Minor ashfall was noted in Kozyrevsk (45 km WNW). At 0820 on 20 October an ash plume was identified in satellite images drifting 100 km ENE at altitudes of 4-4.5 km.
Lava flows and hot avalanches from the dome down the SE flank continued over the next few days, including 23 October when clear conditions allowed good observations (figures 58 and 59). A large thermal anomaly was observed over the volcano through 24 October, and in the summit crater on 30 October (figure 60). Strong fumarolic activity continued, with numerous avalanches and occasional incandescence. By the last week of October, volcanic activity had decreased to a level consistent with that earlier in the reporting period.
Aviation warnings were frequently updated during 17-20 October. KVERT issued a Volcano Observatory Notice for Aviation (VONA) on 17 October at 1419 and 1727 (0219 and 0527 UTC) raising the Aviation Color Code (ACC) from Yellow to Orange (second highest level). The next day, KVERT issued a VONA at 1705 (0505 UTC) raising the ACC to Red (highest level) but lowered it back to Orange at 2117 (0917 UTC). After another decrease to Yellow and back to Orange, the ACC was reduced to Yellow on 20 October at 1204 (0004 UTC). In addition, the Tokyo VAAC issued a series of Volcanic Ash Advisories beginning on 16 October and continuing through 30 October.
Geologic Background. The modern Bezymianny, much smaller than its massive neighbors Kamen and Kliuchevskoi on the Kamchatka Peninsula, was formed about 4,700 years ago over a late-Pleistocene lava-dome complex and an edifice built about 11,000-7,000 years ago. Three periods of intensified activity have occurred during the past 3,000 years. The latest period, which was preceded by a 1,000-year quiescence, began with the dramatic 1955-56 eruption. This eruption, similar to that of St. Helens in 1980, produced a large open crater that was formed by collapse of the summit and an associated lateral blast. Subsequent episodic but ongoing lava-dome growth, accompanied by intermittent explosive activity and pyroclastic flows, has largely filled the 1956 crater.
Information Contacts: Kamchatka Volcanic Eruptions Response Team (KVERT), Far Eastern Branch, Russian Academy of Sciences, 9 Piip Blvd., Petropavlovsk-Kamchatsky, 683006, Russia (URL: http://www.kscnet.ru/ivs/kvert/); Kamchatka Volcanological Station, Kamchatka Branch of Geophysical Survey, (KB GS RAS), Klyuchi, Kamchatka Krai, Russia (URL: http://volkstat.ru/); Tokyo Volcanic Ash Advisory Center (VAAC), 1-3-4 Otemachi, Chiyoda-ku, Tokyo 100-8122, Japan (URL: http://ds.data.jma.go.jp/svd/vaac/data/); Hawai'i Institute of Geophysics and Planetology (HIGP) - MODVOLC Thermal Alerts System, School of Ocean and Earth Science and Technology (SOEST), Univ. of Hawai'i, 2525 Correa Road, Honolulu, HI 96822, USA (URL: http://modis.higp.hawaii.edu/); MIROVA (Middle InfraRed Observation of Volcanic Activity), a collaborative project between the Universities of Turin and Florence (Italy) supported by the Centre for Volcanic Risk of the Italian Civil Protection Department (URL: http://www.mirovaweb.it/); Copernicus Browser, Copernicus Data Space Ecosystem, European Space Agency (URL: https://dataspace.copernicus.eu/browser/).chr
Kilauea (United States) — January 2023 Cite this Report
Kilauea
United States
19.421°N, 155.287°W; summit elev. 1222 m
All times are local (unless otherwise noted)
Low-level lava effusions in the lava lake at Halema’uma’u during July-December 2022
Kīlauea is the southeastern-most volcano in Hawaii and overlaps the E flank of the Mauna Loa volcano. Its East Rift Zone (ERZ) has been intermittently active for at least 2,000 years. An extended eruption period began in January 1983 and was characterized by open lava lakes and lava flows from the summit caldera and the East Rift Zone. During May 2018 magma migrated into the Lower East Rift Zone (LERZ) and opened 24 fissures along a 6-km-long NE-trending fracture zone that produced lava flows traveling in multiple directions. As lava emerged from the fissures, the lava lake at Halema'uma'u drained and explosions sent ash plumes to several kilometers altitude (BGVN 43:10).
The current eruption period started during September 2021 and has recently been characterized by lava effusions, spatter, and sulfur dioxide emissions in the active Halema’uma’u lava lake (BGVN 47:08). Lava effusions, some spatter, and sulfur dioxide emissions have continued during this reporting period of July through December 2022 using daily reports, volcanic activity notices, and abundant photo, map, and video data from the US Geological Survey's (USGS) Hawaiian Volcano Observatory (HVO).
Summary of activity during July-December 2022. Low-level effusions have continued at the western vent of the Halema’uma’u crater during July through early December 2022. Occasional weak ooze-outs (also called lava break outs) would occur along the margins of the crater floor. The overall level of the active lava lake throughout the reporting period gradually increased due to infilling, however it stagnated in mid-September (table 13). During September through November, activity began to decline, though lava effusions persisted at the western vent. By 9 December, the active part of the lava lake had completely crusted over, and incandescence was no longer visible.
Table 13. Summary of measurements taken during overflights at Kīlauea that show a gradual increase in the active lava lake level and the volume of lava effused since 29 September 2021. Lower activity was reported during September-October. Data collected during July-December 2022. Courtesy of HVO.
| Date: |
Level of the active lava lake (m): |
Cumulative volume of lava effused (million cubic meters): |
| 7 Jul 2022 |
130 |
95 |
| 19 Jul 2022 |
133 |
98 |
| 4 Aug 2022 |
136 |
102 |
| 16 Aug 2022 |
137 |
104 |
| 12 Sep 2022 |
143 |
111 |
| 5 Oct 2022 |
143 |
111 |
| 28 Oct 2022 |
143 |
111 |
Activity during July 2022. Lava effusions were reported from the western vent in the Halema’uma’u crater, along with occasional weak ooze-outs along the margins of the crater floor. The height of the lava lake was variable due to deflation-inflation tilt events; for example, the lake level dropped approximately 3-4 m during a summit deflation-inflation event reported on 1 July. Webcam images taken during the night of 6-12 July showed intermittent low-level spattering at the western vent that rose less than 10 m above the vent (figure 519). Measurements made during an overflight on 7 July indicated that the crater floor was infilled about 130 m and that 95 million cubic meters of lava had been effused since 29 September 2021. A single, relatively small lava ooze-out was active to the S of the lava lake. Around midnight on 8 July there were two brief periods of lava overflow onto the lake margins. On 9 July lava ooze-outs were reported near the SE and NE edges of the crater floor and during 10-11 July they occurred near the E, NE, and NW edges. On 16 July crater incandescence was reported, though the ooze-outs and spattering were not visible. On 18 July overnight webcam images showed incandescence in the western vent complex and two ooze-outs were reported around 0000 and 0200 on 19 July. By 0900 there were active ooze-outs along the SW edge of the crater floor. Measurements made from an overflight on 19 July indicated that the crater floor was infilled about 133 m and 98 million cubic meters of lava had erupted since 29 September 2021 (figure 520). On 20 July around 1600 active ooze-outs were visible along the N edge of the crater, which continued through the next day. Extensive ooze-outs occurred along the W margin during 24 July until 1900; on 26 July minor ooze-outs were noted along the N margin. Minor spattering was visible on 29 July along the E margin of the lake. The sulfur dioxide emission rates ranged 650-2,800 tons per day (t/d), the higher of which was measured on 8 July (figure 519).
Activity during August 2022. The eruption continued in the Halema’uma’u crater at the western vent. According to HVO the lava in the active lake remained at the level of the bounding levees. Occasional minor ooze-outs were observed along the margins of the crater floor. Strong nighttime crater incandescence was visible after midnight on 6 August over the western vent cone. During 6-7 August scattered small lava lobes were active along the crater floor and incandescence persisted above the western vent through 9 August. During 7-9 August HVO reported a single lava effusion source was active along the NW margin of the crater floor. Measurements from an overflight on 4 August indicated that the crater floor was infilled about 136 m total and that 102 million cubic meters of lava had been erupted since the start of the eruption. Lava breakouts were reported along the N, NE, E, S, and W margins of the crater during 10-16 August. Another overflight survey conducted on 16 August indicated that the crater floor infilled about 137 m and 104 million cubic meters of lava had been erupted since September 2021. Measured sulfur dioxide emissions rates ranged 1,150-2,450 t/d, the higher of which occurred on 8 August.
Activity during September 2022. During September, lava effusion continued from the western vent into the active lava lake and onto the crater floor. Intermittent minor ooze-outs were reported through the month. A small ooze-out was visible on the W crater floor margin at 0220 on 2 September, which showed decreasing surface activity throughout the day, but remained active through 3 September. On 3 September around 1900 a lava outbreak occurred along the NW margin of the crater floor but had stopped by the evening of 4 September. Field crews monitoring the summit lava lake on 9 September observed spattering on the NE margin of the lake that rose no higher than 10 m, before falling back onto the lava lake crust (figure 521). Overflight measurements on 12 September indicated that the crater floor was infilled a total of 143 m and 111 million cubic meters of lava had been erupted since September 2021. Extensive breakouts in the W and N part of the crater floor were reported at 1600 on 20 September and continued into 26 September. The active part of the lava lake dropped by 10 m while other parts of the crater floor dropped by several meters. Summit tiltmeters recorded a summit seismic swarm of more than 80 earthquakes during 1500-1800 on 21 September, which occurred about 1.5 km below Halema’uma’u; a majority of these were less than Mw 2. By 22 September the active part of the lava lake was infilled about 2 m. On 23 September the western vent areas exhibited several small spatter cones with incandescent openings, along with weak, sporadic spattering (figure 522). The sulfur dioxide emission rate ranged from 930 t/d to 2,000 t/d, the higher of which was measured on 6 September.
Activity during October 2022. Activity during October declined slightly compared to previous months, though lava effusions persisted from the western vent into the active lava lake and onto the crater floor during October (figure 523). Slight variations in the lava lake were noted throughout the month. HVO reported that around 0600 on 3 October the level of the lava lake has lowered slightly. Overflight measurements taken on 5 October indicated that the crater floor was infilled a total of about 143 m and that 111 million cubic meters of lava had been effused since September 2021. During 6-7 October the lake gradually rose 0.5 m. Sulfur dioxide measurements made on 22 October had an emission rate of 700 t/d. Another overflight taken on 28 October showed that there was little to no change in the elevation of the crater floor: the crater floor was infilled a total of 143 m and 111 million cubic meters of lava had erupted since the start of the eruption.
Activity during November 2022. Activity remained low during November, though HVO reported that lava from the western vent continued to effuse into the active lava lake and onto the crater floor throughout the month. The rate of sulfur dioxide emissions during November ranged from 300-600 t/d, the higher amount of which occurred on 9 November.
Activity during December 2022. Similar low activity was reported during December, with lava effusing from the western vent into the active lava lake and onto the crater floor. During 4-5 December the active part of the lava lake was slightly variable in elevation and fluctuated within 1 m. On 9 December HVO reported that lava was no longer erupting from the western vent in the Halema’uma’u crater and that sulfur dioxide emissions had returned to near pre-eruption background levels; during 10-11 December, the lava lake had completely crusted over, and no incandescence was visible (figure 524). Time lapse camera images covering the 4-10 December showed that the crater floor showed weak deflation and no inflation. Some passive events of crustal overturning were reported during 14-15 December, which brought fresh incandescent lava to the lake surface. The sulfur dioxide emission rate was approximately 200 t/d on 14 December. A smaller overturn event on 17 December and another that occurred around 0000 and into the morning of 20 December were also detected. A small seismic swarm was later detected on 30 December.
Geologic Background. Kilauea overlaps the E flank of the massive Mauna Loa shield volcano in the island of Hawaii. Eruptions are prominent in Polynesian legends; written documentation since 1820 records frequent summit and flank lava flow eruptions interspersed with periods of long-term lava lake activity at Halemaumau crater in the summit caldera until 1924. The 3 x 5 km caldera was formed in several stages about 1,500 years ago and during the 18th century; eruptions have also originated from the lengthy East and Southwest rift zones, which extend to the ocean in both directions. About 90% of the surface of the basaltic shield volcano is formed of lava flows less than about 1,100 years old; 70% of the surface is younger than 600 years. The long-term eruption from the East rift zone between 1983 and 2018 produced lava flows covering more than 100 km2, destroyed hundreds of houses, and added new coastline.
Information Contacts: Hawaiian Volcano Observatory (HVO), U.S. Geological Survey, PO Box 51, Hawai'i National Park, HI 96718, USA (URL: http://hvo.wr.usgs.gov/).
Nyamulagira (DR Congo) — November 2023 Cite this Report
Nyamulagira
DR Congo
1.408°S, 29.2°E; summit elev. 3058 m
All times are local (unless otherwise noted)
Lava flows and thermal activity during May-October 2023
Nyamulagira (also known as Nyamuragira) is a shield volcano in the Democratic Republic of Congo with the summit truncated by a small 2 x 2.3 km caldera with walls up to about 100 m high. Documented eruptions have occurred within the summit caldera, as well as from numerous flank fissures and cinder cones. The current eruption period began in April 2018 and has more recently been characterized by summit crater lava flows and thermal activity (BGVN 48:05). This report describes lava flows and variable thermal activity during May through October 2023, based on information from the Observatoire Volcanologique de Goma (OVG) and various satellite data.
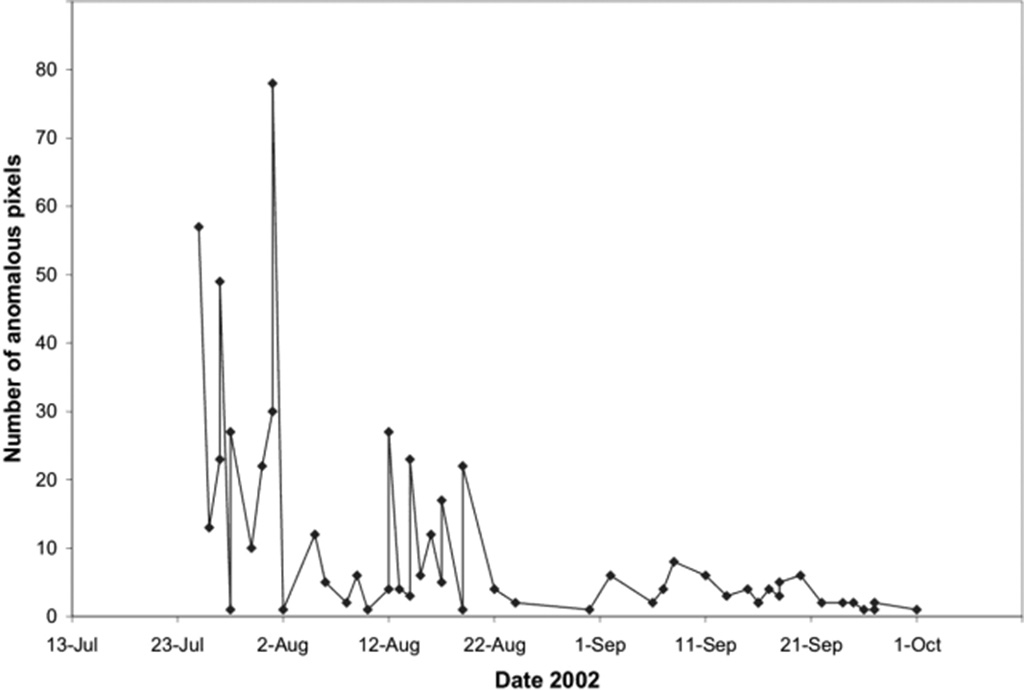
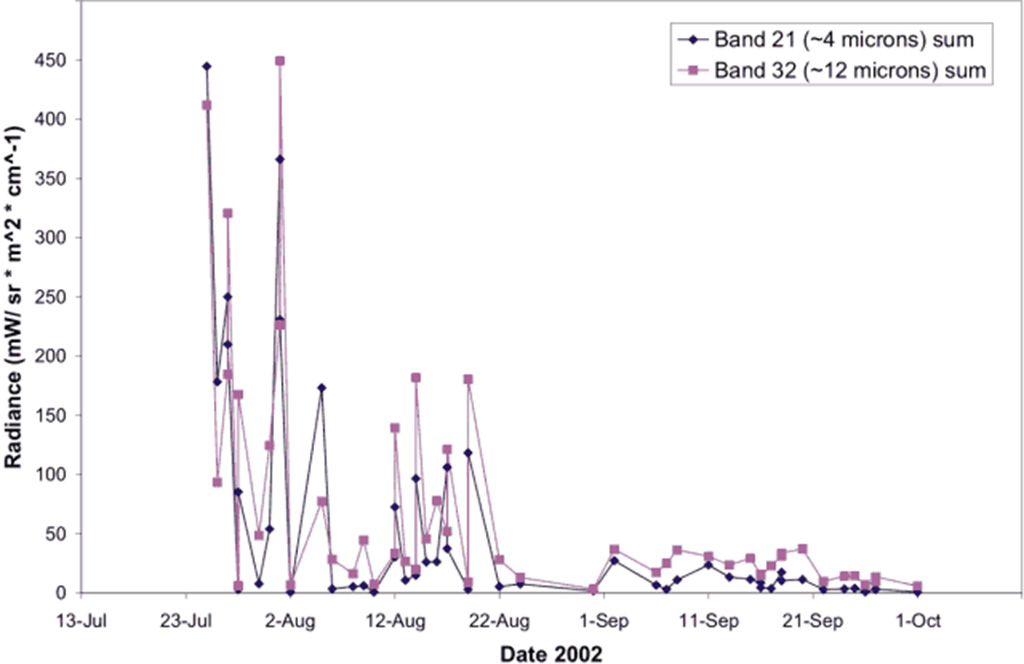
Lava lake activity continued during May. The MIROVA (Middle InfraRed Observation of Volcanic Activity) system recorded moderate-to-strong thermal activity throughout the reporting period; activity was more intense during May and October and relatively weaker from June through September (figure 95). The MODVOLC thermal algorithm, detected a total of 209 thermal alerts. There were 143 hotspots detected during May, eight during June, nine during September, and 49 during October. This activity was also reflected in infrared satellite images, where a lava flow was visible in the NW part of the crater on 7 May and strong activity was seen in the center of the crater on 4 October (figure 96). Another infrared satellite image taken on 12 May showed still active lava flows along the NW margin of the crater. According to OVG lava effusions were active during 7-29 May and moved to the N and NW parts of the crater beginning on 9 May. Strong summit crater incandescence was visible from Goma (27 km S) during the nights of 17, 19, and 20 May (figure 97). On 17 May there was an increase in eruptive activity, which peaked at 0100 on 20 May. Notable sulfur dioxide plumes drifted NW and W during 19-20 May (figure 98). Drone footage acquired in partnership with the USGS (United States Geological Survey) on 20 May captured images of narrow lava flows that traveled about 100 m down the W flank (figure 99). Data from the Rumangabo seismic station indicated a decreasing trend in activity during 17-21 May. Although weather clouds prevented clear views of the summit, a strong thermal signature on the NW flank was visible in an infrared satellite image on 22 May, based on an infrared satellite image. On 28 May the lava flows on the upper W flank began to cool and solidify. By 29 May seismicity returned to levels similar to those recorded before the 17 May increase. Lava effusion continued but was confined to the summit crater; periodic crater incandescence was observed.
Low-level activity was noted during June through October. On 1 June OVG reported that seismicity remained at lower levels and that crater incandescence had been absent for three days, though infrared satellite imagery showed continued lava effusion in the summit crater. The lava flows on the flanks covered an estimated 0.6 km2. Satellite imagery continued to show thermal activity confined to the lava lake through October (figure 96), although no lava flows or significant sulfur dioxide emissions were reported.
Geologic Background. Africa's most active volcano, Nyamulagira (also known as Nyamuragira), is a massive high-potassium basaltic shield about 25 km N of Lake Kivu and 13 km NNW of the steep-sided Nyiragongo volcano. The summit is truncated by a small 2 x 2.3 km caldera that has walls up to about 100 m high. Documented eruptions have occurred within the summit caldera, as well as from the numerous flank fissures and cinder cones. A lava lake in the summit crater, active since at least 1921, drained in 1938, at the time of a major flank eruption. Recent lava flows extend down the flanks more than 30 km from the summit as far as Lake Kivu; extensive lava flows from this volcano have covered 1,500 km2 of the western branch of the East African Rift.
Information Contacts: Observatoire Volcanologique de Goma (OVG), Departement de Geophysique, Centre de Recherche en Sciences Naturelles, Lwiro, D.S. Bukavu, DR Congo; Hawai'i Institute of Geophysics and Planetology (HIGP) - MODVOLC Thermal Alerts System, School of Ocean and Earth Science and Technology (SOEST), Univ. of Hawai'i, 2525 Correa Road, Honolulu, HI 96822, USA (URL: http://modis.higp.hawaii.edu/); MIROVA (Middle InfraRed Observation of Volcanic Activity), a collaborative project between the Universities of Turin and Florence (Italy) supported by the Centre for Volcanic Risk of the Italian Civil Protection Department (URL: http://www.mirovaweb.it/); NASA Global Sulfur Dioxide Monitoring Page, Atmospheric Chemistry and Dynamics Laboratory, NASA Goddard Space Flight Center (NASA/GSFC), 8800 Greenbelt Road, Goddard, Maryland, USA (URL: https://so2.gsfc.nasa.gov/); Copernicus Browser, Copernicus Data Space Ecosystem, European Space Agency (URL: https://dataspace.copernicus.eu/browser/); Charles Balagizi, Goma Volcano Observatory, Departement de Geophysique, Centre de Recherche en Sciences Naturelles, Lwiro, D.S. Bukavu, DR Congo.
Bagana (Papua New Guinea) — October 2023 Cite this Report
Bagana
Papua New Guinea
6.137°S, 155.196°E; summit elev. 1855 m
All times are local (unless otherwise noted)
Explosions, ash plumes, ashfall, and lava flows during April-September 2023
The remote volcano of Bagana is located in central Bougainville Island, Papua New Guinea. Recorded eruptions date back to 1842 and activity has consisted of effusive activity that has built a small lava dome in the summit crater and occasional explosions that produced pyroclastic flows. The most recent eruption has been ongoing since February 2000 and has produced occasional explosions, ash plumes, and lava flows. More recently, activity has been characterized by ongoing effusive activity and ash emissions (BGVN 48:04). This report updates activity from April through September 2023 that has consisted of explosions, ash plumes, ashfall, and lava flows, using information from the Darwin Volcanic Ash Advisory Center (VAAC) and satellite data.
An explosive eruption was reported on 7 July that generated a large gas-and-ash plume to high altitudes and caused significant ashfall in local communities; the eruption plume had reached upper tropospheric (16-18 km altitude) altitudes by 2200, according to satellite images. Sulfur dioxide plumes were detected in satellite images on 8 July and indicated that the plume was likely a mixture of gas, ice, and ash. A report issued by the Autonomous Bougainville Government (ABG) (Torokina District, Education Section) on 10 July noted that significant ash began falling during 2000-2100 on 7 July and covered most areas in the Vuakovi, Gotana (9 km SW), Koromaketo, Laruma (25 km W) and Atsilima (27 km NW) villages. Pyroclastic flows also occurred, according to ground-based reports; small deposits confined to one drainage were inspected by RVO during an overflight on 17 July and were confirmed to be from the 7 July event. Ashfall continued until 10 July and covered vegetation, which destroyed bushes and gardens and contaminated rivers and streams.
RVO reported another eruption on 14 July. The Darwin VAAC stated that an explosive event started around 0830 on 15 July and produced an ash plume that rose to 16.5 km altitude by 1000 and drifted N, according to satellite images. The plume continued to drift N and remained visible through 1900, and by 2150 it had dissipated.
Ashfall likely from both the 7 and 15 July events impacted about 8,111 people in Torokina (20 km SW), including Tsito/Vuakovi, Gotana, Koromaketo, Kenaia, Longkogari, Kenbaki, Piva (13 km SW), and Atsinima, and in the Tsitovi district, according to ABG. Significant ashfall was also reported in Ruruvu (22 km N) in the Wakunai District of Central Bougainville, though the thickness of these deposits could not be confirmed. An evacuation was called for the villages in Wakunai, where heavy ashfall had contaminated water sources; the communities of Ruruvu, Togarau, Kakarapaia, Karauturi, Atao, and Kuritaturi were asked to evacuate to a disaster center at the Wakunai District Station, and communities in Torokina were asked to evacuate to the Piva District station. According to a news article, more than 7,000 people needed temporary accommodations, with about 1,000 people in evacuation shelters. Ashfall had deposited over a broad area, contaminating water supplies, affecting crops, and collapsing some roofs and houses in rural areas. Schools were temporarily shut down. Intermittent ash emissions continued through the end of July and drifted NNW, NW, and SW. Fine ashfall was reported on the coast of Torokina, and ash plumes also drifted toward Laruma and Atsilima.
A small explosive eruption occurred at 2130 on 28 July that ejected material from the crater vents, according to reports from Torokina, in addition to a lava flow that contained two lobes. A second explosion was detected at 2157. Incandescence from the lava flow was visible from Piva as it descended the W flank around 2000 on 29 July (figure 47). The Darwin VAAC reported that a strong thermal anomaly was visible in satellite images during 30-31 July and that ash emissions rose to 2.4 km altitude and drifted WSW on 30 July. A ground report from RVO described localized emissions at 0900 on 31 July.
The Darwin VAAC reported that ash plumes were identified in satellite imagery at 0800 and 1220 on 12 August and rose to 2.1 km and 3 km altitude and drifted NW and W, respectively. A news report stated that aid was sent to more than 6,300 people that were adversely affected by the eruption. Photos taken during 17-19 August showed ash emissions rising no higher than 1 km above the summit and drifting SE. A small explosion generated an ash plume during the morning of 19 August. Deposits from small pyroclastic flows were also captured in the photos. Satellite images captured lava flows and pyroclastic flow deposits. Two temporary seismic stations were installed near Bagana on 17 August at distances of 7 km WSW (Vakovi station) and 11 km SW (Kepox station). The Kepox station immediately started to record continuous, low-frequency background seismicity.
Satellite data. Little to no thermal activity was detected during April through mid-July 2023; only one anomaly was recorded during early April and one during early June, according to MIROVA (Middle InfraRed Observation of Volcanic Activity) data (figure 48). Thermal activity increased in both power and frequency during mid-July through September, although there were still some short gaps in detected activity. MODVOLC also detected increased thermal activity during August; thermal hotspots were detected a total of five times on 19, 20, and 27 August. Weak thermal anomalies were also captured in infrared satellite images on clear weather days throughout the reporting period on 7, 12, and 17 April, 27 May, 1, 6, 16, and 31 July, and 19 September (figure 48); a strong thermal anomaly was visible on 31 July. Distinct sulfur dioxide plumes that drifted generally NW were intermittently captured by the TROPOMI instrument on the Sentinel-5P satellite and sometimes exceeded two Dobson Units (DUs) (figure 49).
Geologic Background. Bagana volcano, in a remote portion of central Bougainville Island, is frequently active. This massive symmetrical cone was largely constructed by an accumulation of viscous andesitic lava flows. The entire edifice could have been constructed in about 300 years at its present rate of lava production. Eruptive activity is characterized by non-explosive effusion of viscous lava that maintains a small lava dome in the summit crater, although occasional explosive activity produces pyroclastic flows. Lava flows with tongue-shaped lobes up to 50 m thick and prominent levees descend the flanks on all sides.
Information Contacts: Rabaul Volcano Observatory (RVO), Geohazards Management Division, Department of Mineral Policy and Geohazards Management (DMPGM), PO Box 3386, Kokopo, East New Britain Province, Papua New Guinea; Darwin Volcanic Ash Advisory Centre (VAAC), Bureau of Meteorology, Northern Territory Regional Office, PO Box 40050, Casuarina, NT 0811, Australia (URL: http://www.bom.gov.au/info/vaac/); MIROVA (Middle InfraRed Observation of Volcanic Activity), a collaborative project between the Universities of Turin and Florence (Italy) supported by the Centre for Volcanic Risk of the Italian Civil Protection Department (URL: http://www.mirovaweb.it/); Hawai'i Institute of Geophysics and Planetology (HIGP) - MODVOLC Thermal Alerts System, School of Ocean and Earth Science and Technology (SOEST), Univ. of Hawai'i, 2525 Correa Road, Honolulu, HI 96822, USA (URL: http://modis.higp.hawaii.edu/); NASA Global Sulfur Dioxide Monitoring Page, Atmospheric Chemistry and Dynamics Laboratory, NASA Goddard Space Flight Center (NASA/GSFC), 8800 Greenbelt Road, Goddard, Maryland, USA (URL: https://so2.gsfc.nasa.gov/); Copernicus Browser, Copernicus Data Space Ecosystem, European Space Agency (URL: https://dataspace.copernicus.eu/browser/); Autonomous Bougainville Government, P.O Box 322, Buka, AROB, PNG (URL: https://abg.gov.pg/); Andrew Tupper (Twitter: @andrewcraigtupp); Simon Carn, Geological and Mining Engineering and Sciences, Michigan Technological University, 1400 Townsend Drive, Houghton, MI 49931, USA (URL: http://www.volcarno.com/, Twitter: @simoncarn); Radio NZ (URL: https://www.rnz.co.nz/news/pacific/494464/more-than-7-000-people-in-bougainville-need-temporary-accommodation-after-eruption); USAID, 1300 Pennsylvania Ave, NW, Washington DC 20004, USA (URL: https://www.usaid.gov/pacific-islands/press-releases/aug-08-2023-united-states-provides-immediate-emergency-assistance-support-communities-affected-mount-bagana-volcanic-eruptions).
Mayon (Philippines) — October 2023 Cite this Report
Mayon
Philippines
13.257°N, 123.685°E; summit elev. 2462 m
All times are local (unless otherwise noted)
Lava flows, pyroclastic flows, ash emissions, and seismicity during April-September 2023
Mayon is located in the Philippines and has steep upper slopes capped by a small summit crater. Historical eruptions date back to 1616 CE that have been characterized by Strombolian eruptions, lava flows, pyroclastic flows, and mudflows. Eruptions mostly originated from a central conduit. Pyroclastic flows and mudflows have commonly descended many of the approximately 40 drainages that surround the volcano. The most recent eruption occurred during June through October 2022 and consisted of lava dome growth and gas-and-steam emissions (BGVN 47:12). A new eruption was reported during late April 2023 and has included lava flows, pyroclastic density currents, ash emissions, and seismicity. This report covers activity during April through September 2023 based on daily bulletins from the Philippine Institute of Volcanology and Seismology (PHIVOLCS).
During April through September 2023, PHIVOLCS reported near-daily rockfall events, frequent volcanic earthquakes, and sulfur dioxide measurements. Gas-and-steam emissions rose 100-900 m above the crater and drifted in different directions. Nighttime crater incandescence was often visible during clear weather and was accompanied by incandescent avalanches of material. Activity notably increased during June when lava flows were reported on the S, SE, and E flanks (figure 52). The MIROVA graph (Middle InfraRed Observation of Volcanic Activity) showed strong thermal activity coincident with these lava flows, which remained active through September (figure 53). According to the MODVOLC thermal algorithm, a total of 110 thermal alerts were detected during the reporting period: 17 during June, 40 during July, 27 during August, and 26 during September. During early June, pyroclastic density currents (PDCs) started to occur more frequently.
Low activity was reported during much of April and May; gas-and-steam emissions rose 100-900 m above the crater and generally drifted in different directions. A total of 52 rockfall events and 18 volcanic earthquakes were detected during April and 147 rockfall events and 13 volcanic events during May. Sulfur dioxide flux measurements ranged between 400-576 tons per day (t/d) during April, the latter of which was measured on 29 April and between 162-343 t/d during May, the latter of which was measured on 13 May.
Activity during June increased, characterized by lava flows, pyroclastic density currents (PDCs), crater incandescence and incandescent rockfall events, gas-and-steam emissions, and continued seismicity. Weather clouds often prevented clear views of the summit, but during clear days, moderate gas-and-steam emissions rose 100-2,500 m above the crater and drifted in multiple directions. A total of 6,237 rockfall events and 288 volcanic earthquakes were detected. The rockfall events often deposited material on the S and SE flanks within 700-1,500 m of the summit crater and ash from the events drifted SW, S, SE, NE, and E. Sulfur dioxide emissions ranged between 149-1,205 t/d, the latter of which was measured on 10 June. Short-term observations from EDM and electronic tiltmeter monitoring indicated that the upper slopes were inflating since February 2023. Longer-term ground deformation parameters based on EDM, precise leveling, continuous GPS, and electronic tilt monitoring indicated that the volcano remained inflated, especially on the NW and SE flanks. At 1000 on 5 June the Volcano Alert Level (VAL) was raised to 2 (on a 0-5 scale). PHIVOLCS noted that although low-level volcanic earthquakes, ground deformation, and volcanic gas emissions indicated unrest, the steep increase in rockfall frequency may indicate increased dome activity.
A total of 151 dome-collapse PDCs occurred during 8-9 and 11-30 June, traveled 500-2,000 m, and deposited material on the S flank within 2 km of the summit crater. During 8-9 June the VAL was raised to 3. At approximately 1947 on 11 June lava flow activity was reported; two lobes traveled within 500 m from the crater and deposited material on the S (Mi-isi), SE (Bonga), and E (Basud) flanks. Weak seismicity accompanied the lava flow and slight inflation on the upper flanks. This lava flow remained active through 30 June, moving down the S and SE flank as far as 2.5 km and 1.8 km, respectively and depositing material up to 3.3 km from the crater. During 15-16 June traces of ashfall from the PDCs were reported in Sitio Buga, Nabonton, City of Ligao and Purok, and San Francisco, Municipality of Guinobatan. During 28-29 June there were two PDCs generated by the collapse of the lava flow front, which generated a light-brown ash plume 1 km high. Satellite monitors detected significant concentrations of sulfur dioxide beginning on 29 June. On 30 June PDCs primarily affected the Basud Gully on the E flank, the largest of which occurred at 1301 and lasted eight minutes, based on the seismic record. Four PDCs generated between 1800 and 2000 that lasted approximately four minutes each traveled 3-4 km on the E flank and generated an ash plume that rose 1 km above the crater and drifted N and NW. Ashfall was recorded in Tabaco City.
Similar strong activity continued during July; slow lava effusion remained active on the S and SE flanks and traveled as far as 2.8 km and 2.8 km, respectively and material was deposited as far as 4 km from the crater. There was a total of 6,983 rockfall events and 189 PDCs that affected the S, SE, and E flanks. The volcano network detected a total of 2,124 volcanic earthquakes. Continuous gas-and-steam emissions rose 200-2,000 m above the crater and drifted in multiple directions. Sulfur dioxide emissions averaged 792-4,113 t/d, the latter of which was measured on 28 July. During 2-4 July three PDCs were generated from the collapse of the lava flow and resulting light brown plumes rose 200-300 m above the crater. Continuous tremor pulses were reported beginning at 1547 on 3 July through 7 July at 1200, at 2300 on 8 July and going through 0300 on 10 July, and at 2300 on 16 July, as recorded by the seismic network. During 6-9 July there were 10 lava flow-collapse-related PDCs that generated light brown plumes 300-500 m above the crater. During 10-11 July light ashfall was reported in some areas of Mabinit, Legazpi City, Budiao and Salvacion, Daraga, and Camalig, Albay. By 18 July the lava flow advanced 600 m on the E flank as well.
During 1733 on 18 July and 0434 on 19 July PHIVOLCS reported 30 “ashing” events, which are degassing events accompanied by audible thunder-like sounds and entrained ash at the crater, which produced short, dark plumes that drifted SW. These events each lasted 20-40 seconds, and plume heights ranged from 150-300 m above the crater, as recorded by seismic, infrasound, visual, and thermal monitors. Three more ashing events occurred during 19-20 July. Short-term observations from electronic tilt and GPS monitoring indicate deflation on the E lower flanks in early July and inflation on the NW middle flanks during the third week of July. Longer-term ground deformation parameters from EDM, precise leveling, continuous GPS, and electronic tilt monitoring indicated that the volcano was still generally inflated relative to baseline levels. A short-lived lava pulse lasted 28 seconds at 1956 on 21 July, which was accompanied by seismic and infrasound signals. By 22 July, the only lava flow that remained active was on the SE flank, and continued to extend 3.4 km, while those on the S and E flanks weakened markedly. One ashing event was detected during 30-31 July, whereas there were 57 detected during 31 July-1 August; according to PHIVOLCS beginning at approximately 1800 on 31 July eruptive activity was dominated by phases of intermittent ashing, as well as increased in the apparent rates of lava effusion from the summit crater. The ashing phases consisted of discrete events recorded as low-frequency volcanic earthquakes (LFVQ) typically 30 seconds in duration, based on seismic and infrasound signals. Gray ash plume rose 100 m above the crater and generally drifted NE. Shortly after these ashing events began, new lava began to effuse rapidly from the crater, feeding the established flowed on the SE, E, and E flanks and generating frequent rockfall events.
Intensified unrest persisted during August. There was a total of 4,141 rockfall events, 2,881 volcanic earthquakes, which included volcanic tremor events, 32 ashing events, and 101 PDCs detected throughout the month. On clear weather days, gas-and-steam emissions rose 300-1,500 m above the crater and drifted in different directions (figure 54). Sulfur dioxide emissions averaged 735-4,756 t/d, the higher value of which was measured on 16 August. During 1-2 August the rate of lava effusion decreased, but continued to feed the flows on the SE, S, and E flanks, maintaining their advances to 3.4 km, 2.8 km, and 1.1 km from the crater, respectively (figure 55). Rockfall and PDCs generated by collapses at the lava flow margins and from the summit dome deposited material within 4 km of the crater. During 3-4 August there were 10 tremor events detected that lasted 1-4 minutes. Short-lived lava pulse lasted 35 seconds and was accompanied by seismic and infrasound signals at 0442 on 6 August. Seven collapses were recorded at the front of the lava flow during 12-14 August.
During September, similar activity of slow lava effusion, PDCs, gas-and-steam emissions, and seismicity continued. There was a total of 4,452 rockfall events, 329 volcanic earthquakes, which included volcanic tremor events, two ashing events, and 85 PDCs recorded throughout the month. On clear weather days, gas-and-steam emissions rose 100-1,500 m above the crater and drifted in multiple directions. Sulfur dioxide emissions averaged 609-2,252 t/d, the higher average of which was measured on 6 September. Slow lava effusion continued advancing on the SE, S, and E flanks, maintaining lengths of 3.4 km, 2.8 km, and 1.1 km, respectively. Rockfall and PDC events generated by collapses along the lava flow margins and at the summit dome deposited material within 4 km of the crater.
Geologic Background. Symmetrical Mayon, which rises above the Albay Gulf NW of Legazpi City, is the most active volcano of the Philippines. The steep upper slopes are capped by a small summit crater. Recorded eruptions since 1616 CE range from Strombolian to basaltic Plinian, with cyclical activity beginning with basaltic eruptions, followed by longer periods of andesitic lava flows. Eruptions occur predominately from the central conduit and have also produced lava flows that travel far down the flanks. Pyroclastic density currents and mudflows have commonly swept down many of the approximately 40 ravines that radiate from the summit and have often damaged populated lowland areas. A violent eruption in 1814 killed more than 1,200 people and devastated several towns.
Information Contacts: Philippine Institute of Volcanology and Seismology (PHIVOLCS), Department of Science and Technology, University of the Philippines Campus, Diliman, Quezon City, Philippines (URL: http://www.phivolcs.dost.gov.ph/); MIROVA (Middle InfraRed Observation of Volcanic Activity), a collaborative project between the Universities of Turin and Florence (Italy) supported by the Centre for Volcanic Risk of the Italian Civil Protection Department (URL: http://www.mirovaweb.it/); Hawai'i Institute of Geophysics and Planetology (HIGP) - MODVOLC Thermal Alerts System, School of Ocean and Earth Science and Technology (SOEST), Univ. of Hawai'i, 2525 Correa Road, Honolulu, HI 96822, USA (URL: http://modis.higp.hawaii.edu/); Copernicus Browser, Copernicus Data Space Ecosystem, European Space Agency (URL: https://dataspace.copernicus.eu/browser/); William Rogers, Legazpi City, Albay Province, Philippines.
Nishinoshima (Japan) — October 2023 Cite this Report
Nishinoshima
Japan
27.247°N, 140.874°E; summit elev. 100 m
All times are local (unless otherwise noted)
Eruption plumes and gas-and-steam plumes during May-August 2023
Nishinoshima, located about 1,000 km S of Tokyo, is a small island in the Ogasawara Arc in Japan. The island is the summit of a massive submarine volcano that has prominent submarine peaks to the S, W, and NE. Eruptions date back to 1973 and the current eruption period began in October 2022. Recent activity has consisted of small ash plumes and fumarolic activity (BGVN 48:07). This report covers activity during May through August 2023, using information from monthly reports of the Japan Meteorological Agency (JMA) monthly reports and satellite data.
Activity during May through June was relatively low. The Japan Coast Guard (JCG) did overflights on 14 and 22 June and reported white gas-and-steam emissions rising 600 m and 1,200 m from the central crater of the pyroclastic cone, respectively (figure 125). In addition, multiple white gas-and-steam emissions rose from the inner rim of the W side of the crater and from the SE flank of the pyroclastic cone. Discolored brown-to-green water was observed around almost the entire perimeter of the island; on 22 June light green discolored water was observed off the S coast of the island.
Observations from the Himawari meteorological satellite confirmed an eruption on 9 and 10 July. An eruption plume rose 1.6 km above the crater and drifted N around 1300 on 9 July. Satellite images acquired at 1420 and 2020 on 9 July and at 0220 on 10 July showed continuing emissions that rose 1.3-1.6 km above the crater and drifted NE and N. The Tokyo VAAC reported that an ash plume seen by a pilot and identified in a satellite image at 0630 on 21 July rose to 3 km altitude and drifted S.
Aerial observations conducted by JCG on 8 August showed a white-and-gray plume rising from the central crater of the pyroclastic cone, and multiple white gas-and-steam emissions were rising from the inner edge of the western crater and along the NW-SE flanks of the island (figure 126). Brown-to-green discolored water was also noted around the perimeter of the island.
Intermittent low-to-moderate power thermal anomalies were recorded in the MIROVA graph (Middle InfraRed Observation of Volcanic Activity), showing an increase in both frequency and power beginning in July (figure 127). This increase in activity coincides with eruptive activity on 9 and 10 July, characterized by eruption plumes. According to the MODVOLC thermal alert algorithm, one thermal hotspot was recorded on 20 July. Weak thermal anomalies were also detected in infrared satellite imagery, accompanied by strong gas-and-steam plumes (figure 128).
Geologic Background. The small island of Nishinoshima was enlarged when several new islands coalesced during an eruption in 1973-74. Multiple eruptions that began in 2013 completely covered the previous exposed surface and continued to enlarge the island. The island is the summit of a massive submarine volcano that has prominent peaks to the S, W, and NE. The summit of the southern cone rises to within 214 m of the ocean surface 9 km SSE.
Information Contacts: Japan Meteorological Agency (JMA), 1-3-4 Otemachi, Chiyoda-ku, Tokyo 100-8122, Japan (URL: http://www.jma.go.jp/jma/indexe.html); Tokyo Volcanic Ash Advisory Center (VAAC), 1-3-4 Otemachi, Chiyoda-ku, Tokyo 100-8122, Japan (URL: http://ds.data.jma.go.jp/svd/vaac/data/); MIROVA (Middle InfraRed Observation of Volcanic Activity), a collaborative project between the Universities of Turin and Florence (Italy) supported by the Centre for Volcanic Risk of the Italian Civil Protection Department (URL: http://www.mirovaweb.it/); Copernicus Browser, Copernicus Data Space Ecosystem, European Space Agency (URL: https://dataspace.copernicus.eu/browser/).
Krakatau (Indonesia) — October 2023 Cite this Report
Krakatau
Indonesia
6.1009°S, 105.4233°E; summit elev. 285 m
All times are local (unless otherwise noted)
White gas-and-steam plumes and occasional ash plumes during May-August 2023
Krakatau is located in the Sunda Strait between Java and Sumatra, Indonesia. Caldera collapse during the catastrophic 1883 eruption destroyed Danan and Perbuwatan cones and left only a remnant of Rakata. The post-collapse cone of Anak Krakatau (Child of Krakatau) was constructed within the 1883 caldera at a point between the former Danan and Perbuwatan cones; it has been the site of frequent eruptions since 1927. The current eruption period began in May 2021 and has recently consisted of Strombolian eruptions and ash plumes (BGVN 48:07). This report describes lower levels of activity consisting of ash and white gas-and-steam plumes during May through August 2023, based on information provided by the Indonesian Center for Volcanology and Geological Hazard Mitigation, referred to as Pusat Vulkanologi dan Mitigasi Bencana Geologi (PVMBG), MAGMA Indonesia, and satellite data.
Activity was relatively low during May and June. Daily white gas-and-steam emissions rose 25-200 m above the crater and drifted in different directions. Five ash plumes were detected at 0519 on 10 May, 1241 on 11 May, 0920 on 12 May, 2320 on 12 May, and at 0710 on 13 May, and rose 1-2.5 km above the crater and drifted SW. A webcam image taken on 12 May showed ejection of incandescent material above the vent. A total of nine ash plumes were detected during 6-11 June: at 1434 and 00220 on 6 and 7 June the ash plumes rose 500 m above the crater and drifted NW, at 1537 on 8 June the ash plume rose 1 km above the crater and drifted SW, at 0746 and at 0846 on 9 June the ash plumes rose 800 m and 3 km above the crater and drifted SW, respectively, at 0423, 1431, and 1750 on 10 June the ash plumes rose 2 km, 1.5 km, and 3.5 km above the crater and drifted NW, respectively, and at 0030 on 11 June an ash plume rose 2 km above the crater and drifted NW. Webcam images taken on 10 and 11 June at 0455 and 0102, respectively, showed incandescent material ejected above the vent. On 19 June an ash plume at 0822 rose 1.5 km above the crater and drifted SE.
Similar low activity of white gas-and-steam emissions and few ash plumes were reported during July and August. Daily white gas-and-steam emissions rose 25-300 m above the crater and drifted in multiple directions. Three ash plumes were reported at 0843, 0851, and 0852 on 20 July that rose 500-2,000 m above the crater and drifted NW.
The MIROVA (Middle InfraRed Observation of Volcanic Activity) graph of MODIS thermal anomaly data showed intermittent low-to-moderate power thermal anomalies during May through August 2023 (figure 140). Although activity was often obscured by weather clouds, a thermal anomaly was visible in an infrared satellite image of the crater on 12 May, accompanied by an eruption plume that drifted SW (figure 141).
Geologic Background. The renowned Krakatau (frequently mis-named as Krakatoa) volcano lies in the Sunda Strait between Java and Sumatra. Collapse of an older edifice, perhaps in 416 or 535 CE, formed a 7-km-wide caldera. Remnants of that volcano are preserved in Verlaten and Lang Islands; subsequently the Rakata, Danan, and Perbuwatan cones were formed, coalescing to create the pre-1883 Krakatau Island. Caldera collapse during the catastrophic 1883 eruption destroyed Danan and Perbuwatan, and left only a remnant of Rakata. This eruption caused more than 36,000 fatalities, most as a result of tsunamis that swept the adjacent coastlines of Sumatra and Java. Pyroclastic surges traveled 40 km across the Sunda Strait and reached the Sumatra coast. After a quiescence of less than a half century, the post-collapse cone of Anak Krakatau (Child of Krakatau) was constructed within the 1883 caldera at a point between the former Danan and Perbuwatan cones. Anak Krakatau has been the site of frequent eruptions since 1927.
Information Contacts: Pusat Vulkanologi dan Mitigasi Bencana Geologi (PVMBG, also known as Indonesian Center for Volcanology and Geological Hazard Mitigation, CVGHM), Jalan Diponegoro 57, Bandung 40122, Indonesia (URL: http://www.vsi.esdm.go.id/); MAGMA Indonesia, Kementerian Energi dan Sumber Daya Mineral (URL: https://magma.esdm.go.id/v1); MIROVA (Middle InfraRed Observation of Volcanic Activity), a collaborative project between the Universities of Turin and Florence (Italy) supported by the Centre for Volcanic Risk of the Italian Civil Protection Department (URL: http://www.mirovaweb.it/); Copernicus Browser, Copernicus Data Space Ecosystem, European Space Agency (URL: https://dataspace.copernicus.eu/browser/).
Merapi (Indonesia) — October 2023 Cite this Report
Merapi
Indonesia
7.54°S, 110.446°E; summit elev. 2910 m
All times are local (unless otherwise noted)
Frequent incandescent avalanches during April-September 2023
Merapi, located just north of the major city of Yogyakarta in central Java, Indonesia, has had activity within the last 20 years characterized by pyroclastic flows and lahars accompanying growth and collapse of the steep-sided active summit lava dome. The current eruption period began in late December 2020 and has more recently consisted of ash plumes, intermittent incandescent avalanches of material, and pyroclastic flows (BGVN 48:04). This report covers activity during April through September 2023, based on information from Balai Penyelidikan dan Pengembangan Teknologi Kebencanaan Geologi (BPPTKG), the Center for Research and Development of Geological Disaster Technology, a branch of PVMBG which specifically monitors Merapi. Additional information comes from the Pusat Vulkanologi dan Mitigasi Bencana Geologi (PVMBG, also known as Indonesian Center for Volcanology and Geological Hazard Mitigation, CVGHM), MAGMA Indonesia, the Darwin Volcanic Ash Advisory Centre (VAAC), and various satellite data.
Activity during April through September 2023 primarily consisted of incandescent avalanches of material that mainly affected the SW and W flanks and traveled as far as 2.3 km from the summit (table 25) and white gas-and-steam emissions that rose 10-1,000 m above the crater.
Table 25. Monthly summary of avalanches and avalanche distances recorded at Merapi during April through September 2023. The number of reported avalanches does not include instances where possible avalanches were heard but could not be visually confirmed as a result of inclement weather. Data courtesy of BPPTKG (April-September 2023 daily reports).
| Month |
Average number of avalanches per day |
Distance avalanches traveled (m) |
| Apr 2023 |
19 |
1,200-2,000 |
| May 2023 |
22 |
500-2,000 |
| Jun 2023 |
18 |
1,200-2,000 |
| Jul 2023 |
30 |
300-2,000 |
| Aug 2023 |
25 |
400-2,300 |
| Sep 2023 |
23 |
600-2,000 |
BPPTKG reported that during April and May white gas-and-steam emissions rose 10-750 m above the crater, incandescent avalanches descended 500-2,000 m on the SW and W flanks (figure 135). Cloudy weather often prevented clear views of the summit, and sometimes avalanches could not be confirmed. According to a webcam image, a pyroclastic flow was visible on 17 April at 0531. During the week of 28 April and 4 May a pyroclastic flow was reported on the SW flank, traveling up to 2.5 km. According to a drone overflight taken on 17 May the SW lava dome volume was an estimated 2,372,800 cubic meters and the dome in the main crater was an estimated 2,337,300 cubic meters.
During June and July similar activity persisted with white gas-and-steam emissions rising 10-350 m above the crater and frequent incandescent avalanches that traveled 300-2,000 m down the SW, W, and S flanks (figure 136). Based on an analysis of aerial photos taken on 24 June the volume of the SW lava dome was approximately 2.5 million cubic meters. A pyroclastic flow was observed on 5 July that traveled 2.7 km on the SW flank. According to the Darwin VAAC multiple minor ash plumes were identified in satellite images on 19 July that rose to 3.7 km altitude and drifted S and SW. During 22, 25, and 26 July a total of 17 avalanches descended as far as 1.8 km on the S flank.
Frequent white gas-and-steam emissions continued during August and September, rising 10-450 m above the crater. Incandescent avalanches mainly affected the SW and W flanks and traveled 400-2,300 m from the vent (figure 137). An aerial survey conducted on 10 August was analyzed and reported that estimates of the SW dome volume was 2,764,300 cubic meters and the dome in the main crater was 2,369,800 cubic meters.
Frequent and moderate-power thermal activity continued throughout the reporting period, according to a MIROVA (Middle InfraRed Observation of Volcanic Activity) analysis of MODIS satellite data (figure 138). There was an increase in the number of detected anomalies during mid-May. The MODVOLC thermal algorithm recorded a total of 47 thermal hotspots: six during April, nine during May, eight during June, 15 during July, four during August, and five during September. Some of this activity was captured in infrared satellite imagery on clear weather days, sometimes accompanied by incandescent material on the SW flank (figure 139).
Geologic Background. Merapi, one of Indonesia's most active volcanoes, lies in one of the world's most densely populated areas and dominates the landscape immediately north of the major city of Yogyakarta. It is the youngest and southernmost of a volcanic chain extending NNW to Ungaran volcano. Growth of Old Merapi during the Pleistocene ended with major edifice collapse perhaps about 2,000 years ago, leaving a large arcuate scarp cutting the eroded older Batulawang volcano. Subsequent growth of the steep-sided Young Merapi edifice, its upper part unvegetated due to frequent activity, began SW of the earlier collapse scarp. Pyroclastic flows and lahars accompanying growth and collapse of the steep-sided active summit lava dome have devastated cultivated lands on the western-to-southern flanks and caused many fatalities.
Information Contacts: Balai Penyelidikan dan Pengembangan Teknologi Kebencanaan Geologi (BPPTKG), Center for Research and Development of Geological Disaster Technology (URL: http://merapi.bgl.esdm.go.id/, Twitter: @BPPTKG); MAGMA Indonesia, Kementerian Energi dan Sumber Daya Mineral (URL: https://magma.esdm.go.id/v1); Pusat Vulkanologi dan Mitigasi Bencana Geologi (PVMBG, also known as Indonesian Center for Volcanology and Geological Hazard Mitigation, CVGHM), Jalan Diponegoro 57, Bandung 40122, Indonesia (URL: http://www.vsi.esdm.go.id/); Darwin Volcanic Ash Advisory Centre (VAAC), Bureau of Meteorology, Northern Territory Regional Office, PO Box 40050, Casuarina, NT 0811, Australia (URL: http://www.bom.gov.au/info/vaac/); MIROVA (Middle InfraRed Observation of Volcanic Activity), a collaborative project between the Universities of Turin and Florence (Italy) supported by the Centre for Volcanic Risk of the Italian Civil Protection Department (URL: http://www.mirovaweb.it/); Hawai'i Institute of Geophysics and Planetology (HIGP) - MODVOLC Thermal Alerts System, School of Ocean and Earth Science and Technology (SOEST), Univ. of Hawai'i, 2525 Correa Road, Honolulu, HI 96822, USA (URL: http://modis.higp.hawaii.edu/); Copernicus Browser, Copernicus Data Space Ecosystem, European Space Agency (URL: https://dataspace.copernicus.eu/browser/); Øystein Lund Andersen (URL: https://www.oysteinlundandersen.com/, https://twitter.com/oysteinvolcano).
Villarrica (Chile) — October 2023 Cite this Report
Villarrica
Chile
39.42°S, 71.93°W; summit elev. 2847 m
All times are local (unless otherwise noted)
Strombolian activity, gas-and-ash emissions, and crater incandescence during April-September 2023
Villarrica, in central Chile, consists of a 2-km-wide caldera that formed about 3,500 years ago and is located at the base of the presently active cone at the NW margin of a 6-km-wide caldera. Historical eruptions eruptions date back to 1558 and have been characterized by mild-to-moderate explosive activity with occasional lava effusions. The current eruption period began in December 2014 and has recently consisted of nighttime crater incandescence, ash emissions, and seismicity (BGVN 48:04). This report covers activity during April through September 2023 and describes occasional Strombolian activity, gas-and-ash emissions, and nighttime crater incandescence. Information for this report primarily comes from the Southern Andes Volcano Observatory (Observatorio Volcanológico de Los Andes del Sur, OVDAS), part of Chile's National Service of Geology and Mining (Servicio Nacional de Geología y Minería, SERNAGEOMIN) and satellite data.
Seismicity during April consisted of long period (LP) events and tremor (TRE); a total of 9,413 LP-type events and 759 TR-type events were detected throughout the month. Nighttime crater incandescence persisted and was visible in the degassing column. Sulfur dioxide data was obtained using Differential Absorption Optical Spectroscopy Equipment (DOAS) that showed an average value of 1,450 ± 198 tons per day (t/d) during 1-15 April and 1,129 ± 201 t/d during 16-30 April, with a maximum daily value of 2,784 t/d on 9 April. Gas-and-steam emissions of variable intensities rose above the active crater as high as 1.3 km above the crater on 13 April. Strombolian explosions were not observed and there was a slight decrease in the lava lake level.
There were 14,123 LP-type events and 727 TR-type events detected during May. According to sulfur dioxide measurements taken with DOAS equipment, the active crater emitted an average value of 1,826 ± 482 t/d during 1-15 May and 912 ± 41 t/d during 16-30 May, with a daily maximum value of 5,155 t/d on 13 May. Surveillance cameras showed continuous white gas-and-steam emissions that rose as high as 430 m above the crater on 27 May. Nighttime incandescence illuminated the gas column less than 300 m above the crater rim was and no pyroclastic emissions were reported. A landslide was identified on 13 May on the E flank of the volcano 50 m from the crater rim and extending 300 m away; SERNAGEOMIN noted that this event may have occurred on 12 May. During the morning of 27 and 28 May minor Strombolian explosions characterized by incandescent ejecta were recorded at the crater rim; the last reported Strombolian explosions had occurred at the end of March.
Seismic activity during June consisted of five volcano-tectonic (VT)-type events, 21,606 LP-type events, and 2,085 TR-type events. The average value of sulfur dioxide flux obtained by DOAS equipment was 1,420 ± 217 t/d during 1-15 June and 2,562 ± 804 t/d, with a maximum daily value of 4,810 t/d on 17 June. White gas-and-steam emissions rose less than 480 m above the crater; frequent nighttime crater incandescence was reflected in the degassing plume. On 12 June an emission rose 100 m above the crater and drifted NNW. On 15 June one or several emissions resulted in ashfall to the NE as far as 5.5 km from the crater, based on a Skysat satellite image. Several Strombolian explosions occurred within the crater; activity on 15 June was higher energy and ejected blocks 200-300 m on the NE slope. Surveillance cameras showed white gas-and-steam emissions rising 480 m above the crater on 16 June. On 19 and 24 June low-intensity Strombolian activity was observed, ejecting material as far as 200 m from the center of the crater to the E.
During July, seismicity included 29,319 LP-type events, 3,736 TR-type events, and two VT-type events. DOAS equipment recorded two days of sulfur dioxide emissions of 4,220 t/d and 1,009 t/d on 1 and 13 July, respectively. Constant nighttime incandescence was also recorded and was particularly noticeable when accompanied by eruptive columns on 12 and 16 July. Minor explosive events were detected in the crater. According to Skysat satellite images taken on 12, 13, and 16 July, ashfall deposits were identified 155 m S of the crater. According to POVI, incandescence was visible from two vents on the crater floor around 0336 on 12 July. Gas-and-ash emissions rose as high as 1.2 km above the crater on 13 July and drifted E and NW. A series of gas-and-steam pulses containing some ash deposited material on the upper E flank around 1551 on 13 July. During 16-31 July, average sulfur dioxide emissions of 1,679 ± 406 t/d were recorded, with a maximum daily value of 2,343 t/d on 28 July. Fine ash emissions were also reported on 16, 17, and 23 July.
Seismicity persisted during August, characterized by 27,011 LP-type events, 3,323 TR-type events, and three VT-type events. The average value of sulfur dioxide measurements taken during 1-15 August was 1,642 ± 270 t/d and 2,207 ± 4,549 t/d during 16-31 August, with a maximum daily value of 3,294 t/d on 27 August. Nighttime crater incandescence remained visible in degassing columns. White gas-and-steam emissions rose 480 m above the crater on 6 August. According to a Skysat satellite image from 6 August, ash accumulation was observed proximal to the crater and was mainly distributed toward the E slope. White gas-and-steam emissions rose 320 m above the crater on 26 August. Nighttime incandescence and Strombolian activity that generated ash emissions were reported on 27 August.
Seismicity during September was characterized by five VT-type events, 12,057 LP-type events, and 2,058 TR-type events. Nighttime incandescence persisted. On 2 September an ash emission rose 180 m above the crater and drifted SE at 1643 (figure 125) and a white gas-and-steam plume rose 320 m above the crater. According to the Buenos Aires VAAC, periods of continuous gas-and-ash emissions were visible in webcam images from 1830 on 2 September to 0110 on 3 September. Strombolian activity was observed on 2 September and during the early morning of 3 September, the latter event of which generated an ash emission that rose 60 m above the crater and drifted 100 m from the center of the crater to the NE and SW. Ashfall was reported to the SE and S as far as 750 m from the crater. The lava lake was active during 3-4 September and lava fountaining was visible for the first time since 26 March 2023, according to POVI. Fountains captured in webcam images at 2133 on 3 September and at 0054 on 4 September rose as high as 60 m above the crater rim and ejected material onto the upper W flank. Sulfur dioxide flux of 1,730 t/d and 1,281 t/d was measured on 3 and 4 September, respectively, according to data obtained by DOAS equipment.
Strong Strombolian activity and larger gas-and-ash plumes were reported during 18-20 September. On 18 September activity was also associated with energetic LP-type events and notable sulfur dioxide fluxes (as high as 4,277 t/d). On 19 September Strombolian activity and incandescence were observed. On 20 September at 0914 ash emissions rose 50 m above the crater and drifted SSE, accompanied by Strombolian activity that ejected material less than 100 m SSE, causing fall deposits on that respective flank. SERNAGEOMIN reported that a Planet Scope satellite image taken on 20 September showed the lava lake in the crater, measuring 32 m x 35 m and an area of 0.001 km2. Several ash emissions were recorded at 0841, 0910, 1251, 1306, 1312, 1315, and 1324 on 23 September and rose less than 150 m above the crater. The sulfur dioxide flux value was 698 t/d on 23 September and 1,097 t/d on 24 September. On 24 September the Volcanic Alert Level (VAL) was raised to Orange (the third level on a four-color scale). SENAPRED maintained the Alert Level at Yellow (the middle level on a three-color scale) for the communities of Villarrica, Pucón (16 km N), Curarrehue, and Panguipulli.
During 24-25 September there was an increase in seismic energy (observed at TR-events) and acoustic signals, characterized by 1 VT-type event, 213 LP-type events, and 124 TR-type events. Mainly white gas-and-steam emissions, in addition to occasional fine ash emissions were recorded. During the early morning of 25 September Strombolian explosions were reported and ejected material 250 m in all directions, though dominantly toward the NW. On 25 September the average value of sulfur dioxide flux was 760 t/d. Seismicity during 25-30 September consisted of five VT-type events, 1,937 LP-type events, and 456 TR-type events.
During 25-29 September moderate Strombolian activity was observed and ejected material as far as the crater rim. In addition, ash pulses lasting roughly 50 minutes were observed around 0700 and dispersed ENE. During 26-27 September a TR episode lasted 6.5 hours and was accompanied by discrete acoustic signals. Satellite images from 26 September showed a spatter cone on the crater floor with one vent that measured 10 x 14 m and a smaller vent about 35 m NE of the cone. SERNAGEOMIN reported an abundant number of bomb-sized blocks up to 150 m from the crater, as well as impact marks on the snow, which indicated explosive activity. A low-altitude ash emission was observed drifting NW around 1140 on 28 September, based on webcam images. Between 0620 and 0850 on 29 September an ash emission rose 60 m above the crater and drifted NW. During an overflight taken around 1000 on 29 September scientists observed molten material in the vent, a large accumulation of pyroclasts inside the crater, and energetic degassing, some of which contained a small amount of ash. Block-sized pyroclasts were deposited on the internal walls and near the crater, and a distal ash deposit was also visible. The average sulfur dioxide flux measured on 28 September was 344 t/d. Satellite images taken on 29 September ashfall was deposited roughly 3 km WNW from the crater and nighttime crater incandescence remained visible. The average sulfur dioxide flux value from 29 September was 199 t/d. On 30 September at 0740 a pulsating ash emission rose 1.1 km above the crater and drifted NNW (figure 126). Deposits on the S flank extended as far as 4.5 km from the crater rim, based on satellite images from 30 September.
Infrared MODIS satellite data processed by MIROVA (Middle InfraRed Observation of Volcanic Activity) showed intermittent thermal activity during April through September, with slightly stronger activity detected during late September (figure 127). Small clusters of thermal activity were detected during mid-June, early July, early August, and late September. According to the MODVOLC thermal alert system, a total of four thermal hotspots were detected on 7 July and 3 and 23 September. This activity was also intermittently captured in infrared satellite imagery on clear weather days (figure 128).
Geologic Background. The glacier-covered Villarrica stratovolcano, in the northern Lakes District of central Chile, is ~15 km south of the city of Pucon. A 2-km-wide caldera that formed about 3,500 years ago is located at the base of the presently active, dominantly basaltic to basaltic andesite cone at the NW margin of a 6-km-wide Pleistocene caldera. More than 30 scoria cones and fissure vents are present on the flanks. Plinian eruptions and pyroclastic flows that have extended up to 20 km from the volcano were produced during the Holocene. Lava flows up to 18 km long have issued from summit and flank vents. Eruptions documented since 1558 CE have consisted largely of mild-to-moderate explosive activity with occasional lava effusion. Glaciers cover 40 km2 of the volcano, and lahars have damaged towns on its flanks.
Information Contacts: Servicio Nacional de Geología y Minería (SERNAGEOMIN), Observatorio Volcanológico de Los Andes del Sur (OVDAS), Avda Sta María No. 0104, Santiago, Chile (URL: http://www.sernageomin.cl/); Proyecto Observación Villarrica Internet (POVI) (URL: http://www.povi.cl/); Sistema y Servicio Nacional de Prevención y Repuesta Ante Desastres (SENAPRED), Av. Beauchef 1671, Santiago, Chile (URL: https://web.senapred.cl/); Buenos Aires Volcanic Ash Advisory Center (VAAC), Servicio Meteorológico Nacional-Fuerza Aérea Argentina, 25 de mayo 658, Buenos Aires, Argentina (URL: http://www.smn.gov.ar/vaac/buenosaires/inicio.php); MIROVA (Middle InfraRed Observation of Volcanic Activity), a collaborative project between the Universities of Turin and Florence (Italy) supported by the Centre for Volcanic Risk of the Italian Civil Protection Department (URL: http://www.mirovaweb.it/); Hawai'i Institute of Geophysics and Planetology (HIGP) - MODVOLC Thermal Alerts System, School of Ocean and Earth Science and Technology (SOEST), Univ. of Hawai'i, 2525 Correa Road, Honolulu, HI 96822, USA (URL: http://modis.higp.hawaii.edu/); Copernicus Browser, Copernicus Data Space Ecosystem, European Space Agency (URL: https://dataspace.copernicus.eu/browser/).
Ebeko
Russia
50.686°N, 156.014°E; summit elev. 1103 m
All times are local (unless otherwise noted)
Moderate explosive activity with ash plumes continued during June-November 2023
Ebeko, located on the N end of Paramushir Island in Russia’s Kuril Islands just S of the Kamchatka Peninsula, consists of three summit craters along a SSW-NNE line at the northern end of a complex of five volcanic cones. Observed eruptions date back to the late 18th century and have been characterized as small-to-moderate explosions from the summit crater, accompanied by intense fumarolic activity. The current eruptive period began in June 2022, consisting of frequent explosions, ash plumes, and thermal activity (BGVN 47:10, 48:06). This report covers similar activity during June-November 2023, based on information from the Kamchatka Volcanic Eruptions Response Team (KVERT) and satellite data.
Moderate explosive activity continued during June-November 2023 (figures 50 and 51). According to visual data from Severo-Kurilsk, explosions sent ash 2-3.5 km above the summit (3-4.5 km altitude) during most days during June through mid-September. Activity after mid-September was slightly weaker, with ash usually reaching less than 2 km above the summit. According to KVERT the volcano in October and November was, with a few exceptions, either quiet or obscured by clouds that prevented satellite observations. KVERT issued Volcano Observatory Notices for Aviation (VONA) on 8 and 12 June, 13 and 22 July, 3 and 21 August, and 31 October warning of potential aviation hazards from ash plumes drifting 3-15 km from the volcano. Based on satellite data, KVERT reported a persistent thermal anomaly whenever weather clouds permitted viewing.
Geologic Background. The flat-topped summit of the central cone of Ebeko volcano, one of the most active in the Kuril Islands, occupies the northern end of Paramushir Island. Three summit craters located along a SSW-NNE line form Ebeko volcano proper, at the northern end of a complex of five volcanic cones. Blocky lava flows extend west from Ebeko and SE from the neighboring Nezametnyi cone. The eastern part of the southern crater contains strong solfataras and a large boiling spring. The central crater is filled by a lake about 20 m deep whose shores are lined with steaming solfataras; the northern crater lies across a narrow, low barrier from the central crater and contains a small, cold crescentic lake. Historical activity, recorded since the late-18th century, has been restricted to small-to-moderate explosive eruptions from the summit craters. Intense fumarolic activity occurs in the summit craters, on the outer flanks of the cone, and in lateral explosion craters.
Information Contacts: Kamchatka Volcanic Eruptions Response Team (KVERT), Far Eastern Branch, Russian Academy of Sciences, 9 Piip Blvd., Petropavlovsk-Kamchatsky, 683006, Russia (URL: http://www.kscnet.ru/ivs/kvert/).
Search Bulletin Archive by Publication Date
Select a month and year from the drop-downs and click "Show Issue" to have that issue displayed in this tab.
The default month and year is the latest issue available.
Bulletin of the Global Volcanism Network - Volume 28, Number 01 (January 2003)
Managing Editor: Edward Venzke
Ambrym (Vanuatu)
Infrared data indicate continued lava lake activity during 2001-2002
Bagana (Papua New Guinea)
Infrared data show nearly continuous activity during 2001-2002
Etna (Italy)
Flank eruption that began in October ends on 28 January
Fuego (Guatemala)
Explosive eruptions from September 2002 through January 2003
Heard (Australia)
Infrared data show previously unknown activity during May-June 2000
Lamington (Papua New Guinea)
Rumors of volcanism in April 2002 were false
Langila (Papua New Guinea)
Infrared data indicate activity during May-October 2002
Lopevi (Vanuatu)
Infrared data corroborate and refine timing of known activity
Manam (Papua New Guinea)
Low-moderate seismicity after May eruption; plume on 31 October
Nyamulagira (DR Congo)
Infrared satellite data from the 25 July 2002 eruption
Rabaul (Papua New Guinea)
Continued ash eruptions from three vents at Tavurvur
Special Announcements (Unknown)
Global high-temperature thermal monitoring system (MODIS Thermal Alerts)
Stromboli (Italy)
Lava emissions continue into January; crater morphology changes
Tinakula (Solomon Islands)
Observers and infrared data indicate eruptive activity since 1989
Ulawun (Papua New Guinea)
Intermittent ash plumes from August through early November 2002
Veniaminof (United States)
Minor ash emissions in early October 2002; increased seismicity in December
Witori (Papua New Guinea)
Slow lava effusion within the caldera continues through January 2003
Yasur (Vanuatu)
Eruptive activity from the summit crater continued through 2002
Ambrym
Vanuatu
16.25°S, 168.12°E; summit elev. 1334 m
All times are local (unless otherwise noted)
Infrared data indicate continued lava lake activity during 2001-2002
Although the current period of activity at Ambrym has been ongoing since June 1996, direct observations have been intermittent. Most recently, there have been reports of visits during January and February 2000 (BGVN 25:02 and 25:04), August-October 2000 (BGVN 26:02), and August 2001 and December 2002 (BGVN 27:12). Another report of scientific investigations from July 2000 is presented below. These observations are supplemented by MODIS data that indicate continued lava lake activity through much of 2001 and 2002.
Observations during July 2000. During 8-11 July 2000, David Nakedau and Douglas Charley reached Ambrym and camped in the caldera, after the necessary authorizations from local chiefs. On 11 July, French and Italian scientists joined the group. During the following days two stations were installed, one close to the village of Lalinda, the other on the E flank of Benbow cone. The first station, composed of a broadband STS2 seismometer, was installed on a basaltic lava flow with the aim of recording local volcano-related seismicity and tectonic earthquakes. The summit station was equipped with a short-period Mark seismometer to record the activity of the lava lake that used to be visible at Benbow until 1999 and now has drained back at a greater depth due to the Ms 7.1 earthquake of 26 November 1999. The first results from the analysis of these data are currently in press (Carniel and others, 2003).
On 11 July 2000 a visit was made to the Niri Taten Mbwelesu crater, where only fumarolic activity could be observed. The crater name means "the son of the female pig," given after its birth in 1989 near the existing Mbwelesu (the pig) and Niri Mbwelesu (the female pig). At the request of local residents, this crater was renamed Mbogon Niri Mbwelesu in December 2002 (BGVN 27:12). After more than a day of continuous rain, on 13 July the installation of the station on the Benbow rim was accomplished. During 13 July strong degassing noises were heard only sporadically from the Southern crater, which was otherwise showing low degassing rates and low-level noises. The southern crater has been observed since the first visits of Douglas Charley, and was the site where the lava lake was observed until 1999. The Northern crater, on the contrary, was not observed by Charley before 1997. Another small vent used to be present on its W side, but was completely buried by 1999 collapses. During 13 July, from the rim observations, this crater appeared to be the source of the strongest noises.
During the following days, two descents were made into Benbow using ropes, one on 14 July by Carniel and Fulle with local guides Jimmy and Isaac; the other was made on 16 July by Charley, Garaebiti, Wallez, and Jimmy. The Southern, older crater, was obstructed and conical in shape. From it's central part, significant blueish-colored degassing was observed, indicating sulfur dioxide. On 14 July visible degassing activity was not accompanied by noticeable sound. On 16 July some small explosions were observed at this vent, which ejected centimeter-sized fragments. On the N side, a fault full of sulfur deposits was visible. Numerous concentric faults were also visible around the vent on the n, E, and W sides. A significant zone of fumarolic activity was concentrated on the N flank of the vent, mainly composed of water vapor. Other small fumaroles were located around the vent. A number of pits were aligned in the W and S border, with the most significant fumarolic activity at the S side, where blueish sulfurous gas escaped continuously.
The Northern crater emitted significant water vapor plumes. To the N and to the S of the vent, two deep tracks were created by water runoff during strong rainfalls. To the E, the border of the vent was formed by rock debris, which, according to the guide Jimmy, was emplaced as a consequence of the strong 26 November 1999 earthquake. Both on 14 July and on 16 July the sound from the N crater appeared to be much lower than from the S crater, an observation opposite to the one made from the Benbow rim on 13 July. On 14 July scientists observed several more dense water vapor clouds, some of them accompanied by the fall of very small (less than 1 cm) light lithic fragments.
Marum, and the surrounding vents of Mbwelesu, Niri Mbwelesu, and Niri Taten Mbwelesu, were visited again on 16 July. Mbwelesu was intensely degassing, which often precluded direct observation of the crater. On the SE side, where a lava lake used to be, only a static mud pond could be seen. Also Taten Mbwelesu crater was showing intense degassing accompanied by strong noise, which made observation difficult. Niri Taten Mbwelesu showed intense degassing but no noise. The dropping of rocks into the pit confirmed the presence of a mud pond at the bottom, at an approximate depth of 200 m.
On 17 July the scientists left the volcano for the village of Lalinda, where they met with the custom chief and the population in order to inform them about the activity of the volcano and about the research. On the early morning of 19 July the two eruptive plumes from Ambrym's main cones were clearly visible at a distance from the island of Paama. However, only the plume produced by Marum was colored pink-orange; this observation suggests the presence of lava at shallow depth in one of its vents, although such a feature was not observed directly during the previous days.
MODVOLC Thermal Alerts, 2001-2002. MODIS detected quasi-continuous thermal alerts for Ambrym throughout 2001 and 2002 (figure 8). Moreover, these occur fairly equally in two clusters interpreted as representing Benbow and Marum (figure 9). These data provide strong evidence in favor of continued lava lake activity. The highest alert ratios for the period of -0.107 on 9 April 2001 in Marum and -0.116 on 3 November 2001 in Benbow may represent episodes of overturn. Marum appears to have been particularly active also during January-February 2002 when the anomaly usually consisted of either 4 or 6 alert-pixels (figure 9). Anomalies continued in January-February 2003.
References. Quantin, P., 1978, Archipel des Nouvelles-Hébrides: Atlas des Sols et de quelques Données du Milieu: Cartes Pédologiques, des Formes du Relief, Géologiques et de la Végétation; ORSTOM (18 sheets).
Carniel, R., Di Cecca, M., Rouland, D., accepted Feb 2003, Ambrym, Vanuatu (July-August 2000): Spectral and dynamical transitions on the hours-to-days timescale: JVGR.
Geologic Background. Ambrym, a large basaltic volcano with a 12-km-wide caldera, is one of the most active volcanoes of the New Hebrides Arc. A thick, almost exclusively pyroclastic sequence, initially dacitic then basaltic, overlies lava flows of a pre-caldera shield volcano. The caldera was formed during a major Plinian eruption with dacitic pyroclastic flows about 1,900 years ago. Post-caldera eruptions, primarily from Marum and Benbow cones, have partially filled the caldera floor and produced lava flows that ponded on the floor or overflowed through gaps in the caldera rim. Post-caldera eruptions have also formed a series of scoria cones and maars along a fissure system oriented ENE-WSW. Eruptions have apparently occurred almost yearly during historical time from cones within the caldera or from flank vents. However, from 1850 to 1950, reporting was mostly limited to extra-caldera eruptions that would have affected local populations.
Information Contacts: Diego Coppola and David A. Rothery, Department of Earth Sciences, The Open University, Milton Keynes, MK7 6AA, United Kingdom; Roberto Carniel, Università di Udine, Italy (URL: http://www.swisseduc.ch/stromboli/); Douglas Charley, Sandrine Wallez, and David Nakedau, Département de la Géologie, des Mines et des Ressources en eau, Vanuatu; Marco Fulle, Osservatorio Astronomico, Trieste, Italy (URL: http://www.swisseduc.ch/stromboli/); Esline Garaebiti, Université de Clermont-Ferrand, France; Daniel Rouland, E.O.S.T., Strasbourg, France; Geneviève Roult, I.P.G., Paris, France.
Bagana (Papua New Guinea) — January 2003 Cite this Report
Bagana
Papua New Guinea
6.137°S, 155.196°E; summit elev. 1855 m
All times are local (unless otherwise noted)
Infrared data show nearly continuous activity during 2001-2002
Throughout 2001 and 2002, MODIS detected quasi-continuous thermal alerts at Bagana (figure 1). The most recent report is from August 1995 (BGVN 20:08). The MODIS data are presented here as valuable objective evidence of more recent activity. MODIS thermal alerts were recorded on 16 September, 3, 19, and 26 November, and 10, 12, 28, and 30 December 2000. The 2001-2002 MODIS anomalies were relatively stable with an average alert ratio of -0.63 and generally they consisted of 1 or 2 alert pixels. The maximum alert ratio detected (-0.51) occurred on 21 November 2002 when the number of alert-pixels was at its two-year maximum of 5. This is likely to indicate a higher degree of activity than usual, in which case it is likely to represent effusion of a new lava flow or a pyroclastic flow in the act of emplacement. Coordinates of alert pixels generally clustered tightly around the summit, with a slight preference towards the NW (figure 2). Activity may be genuinely concentrated on this part of the cone, but another explanation would be a 300-m error in the supposed location of the summit relative to the MODIS geocoding. However, the 5-pixel alert of 21 November 2002 is strung out towards the E, which is likely to represent an eastward-flowing lava (or pyroclastic) flow ~2 km long.
Geologic Background. Bagana volcano, in a remote portion of central Bougainville Island, is frequently active. This massive symmetrical cone was largely constructed by an accumulation of viscous andesitic lava flows. The entire edifice could have been constructed in about 300 years at its present rate of lava production. Eruptive activity is characterized by non-explosive effusion of viscous lava that maintains a small lava dome in the summit crater, although occasional explosive activity produces pyroclastic flows. Lava flows with tongue-shaped lobes up to 50 m thick and prominent levees descend the flanks on all sides.
Information Contacts: Diego Coppola and David A. Rothery, Department of Earth Sciences, The Open University, Milton Keynes, MK7 6AA, United Kingdom.
Etna
Italy
37.748°N, 14.999°E; summit elev. 3357 m
All times are local (unless otherwise noted)
Flank eruption that began in October ends on 28 January
After three months of activity, the flank eruption at Etna that began on 27 October 2002 finished on 28 January 2003. Lava flows and Strombolian explosions in January were confined to the S-flank vent located at 2,750 m elevation. Lava flows formed a fan and covered the previous lava flow field. A decrease in effusion during January was suggested by the shorter lava flow lengths of less than 2 km, which formed a complex flow field with small lava tubes. Strombolian activity from the 2,750-m cinder cone significantly declined on 27 January and disappeared on 29 January. Lava flows slowed on 27 January, and were no longer fed by the 29th, and thus cooled down. At this time SO2 output decreased significantly, reaching the lowest value of 2,000 tons/day on 29 January 2003. Volcanic tremor amplitude showed a marked decrease on 27 January, and on 28 January at 2240 it returned to background levels, signaling the end of the eruption.
Geologic Background. Mount Etna, towering above Catania on the island of Sicily, has one of the world's longest documented records of volcanism, dating back to 1500 BCE. Historical lava flows of basaltic composition cover much of the surface of this massive volcano, whose edifice is the highest and most voluminous in Italy. The Mongibello stratovolcano, truncated by several small calderas, was constructed during the late Pleistocene and Holocene over an older shield volcano. The most prominent morphological feature of Etna is the Valle del Bove, a 5 x 10 km caldera open to the east. Two styles of eruptive activity typically occur, sometimes simultaneously. Persistent explosive eruptions, sometimes with minor lava emissions, take place from one or more summit craters. Flank vents, typically with higher effusion rates, are less frequently active and originate from fissures that open progressively downward from near the summit (usually accompanied by Strombolian eruptions at the upper end). Cinder cones are commonly constructed over the vents of lower-flank lava flows. Lava flows extend to the foot of the volcano on all sides and have reached the sea over a broad area on the SE flank.
Information Contacts: Istituto Nazionale di Geofisica e Vulcanologia (INGV), Sezione di Catania Piazza Roma 2, 95123 Catania (URL: http://www.ct.ingv.it/).
Fuego (Guatemala) — January 2003 Cite this Report
Fuego
Guatemala
14.4748°N, 90.8806°W; summit elev. 3799 m
All times are local (unless otherwise noted)
Explosive eruptions from September 2002 through January 2003
Explosions, ash emission, and lava flows took place during January-February and July 2002 (BGVN 27:08). MODIS thermal alerts were recorded monthly throughout 2002. CONRED reported that during the last 3 months of 2002, a change in behavior at Fuego was characterized by an increase in Strombolian activity. Ash emission and pyroclastic flows threatened communities to the SW, which prepared for evacuation (figure 5). This report covers the period of 26 December 2002 through mid-January 2003.
According to news reports, an explosive eruption and partial crater collapse occurred on 26 December 2002 around 0905. An ash cloud was generated that reached ~2 km above the volcano and drifted W toward the Yepocapa region. Neither damage nor injuries were reported.
The Washington VAAC reported that an eruption began at Fuego on 8 January 2003 around 0500. According to INSIVUMEH, as of 1100 that day the eruption continued with ash explosions and lava flow emission. A steam-and-ash column rose to 5.7 km altitude and drifted to the W. In addition, two small-to-moderate pyroclastic flows traveled down the Santa Teresa river valley. Seismic signals continued to show evidence of magma ascent, but fewer in number with 15-25 explosions per minute recorded. This suggested continued effusive emissions for a number of hours. During the eruption, ash fell in an elliptical area chiefly W of Fuego; other events included rumbling, and fumarolic activity. CONRED stated that the Alert Level was raised to Orange and several people were evacuated from the town of Sangre de Cristo. According to a news report volcanism decreased the following day, so the Alert Level was lowered from Orange to Yellow.
INSIVUMEH reported that as of 19 January moderate eruptions continued at Fuego that produced ash clouds to 1.5-3 km altitude. Ash drifted to the S and SW, depositing fine ash in the areas of Rocela, Panimache, and Palo Verde. In addition, incandescent avalanches traveled down canyons on the volcano's flanks. Table 2 shows ash advisories issued for Fuego by the Washington VAAC during January.
Table 2. Volcanic ash advisories issued for Fuego during January 2003. Courtesy Washington VAAC.
| Date |
Time (UTC) |
Observation |
| 08 Jan 2003 |
1640 |
Satellite imagery showed a vivid hot spot. A possible ash plume was observed moving W from the summit at 1545Z. By 1615Z the narrow plume extended ~18 km to the W of the summit. |
| 08 Jan 2003 |
2010 |
Satellite imagery through 1945Z showed a larger eruption occurring with ash estimated to FL200 (6 km). The bulk of the ash was moving N but some moved W. The initial ash plume had detached and was moving W toward the coast. |
| 09 Jan 2003 |
0200 |
Ash was not visible in nighttime infrared or multispectral imagery. The last visible image of the day showed ash to the W and NW of the summit moving at 18-28 km/hour. Guatemala City airport reported continuing eruptions. |
| 09 Jan 2003 |
0755 |
Ash was not visible in infrared of multispectral imagery through 0715Z. Imagery showed a strong and persistent hot spot. Guatemala City airport reported continuous eruptions. |
| 09 Jan 2003 |
1400 |
Ash was not visible in infrared or multispectral imagery through 1315Z. A persistent strong hot spot continued in shortwave imagery. |
| 09 Jan 2003 |
1915 |
Ash too thin to be detected in satellite imagery. An occasional hot spot was detected in short wave imagery. |
| 11 Jan 2003 |
1610 |
Thin faint ash plume seen in satellite imagery extending W from the volcano ~83 km. |
| 11 Jan 2003 |
2150 |
Ash not identifiable in satellite imagery. Surface reports from Guatemala city through 2100Z continued to indicate that the volcano was active. A hot spot continued to be observed in satellite imagery. |
| 12 Jan 2003 |
0400 |
Ash not identifiable in satellite imagery. No further reports from Guatemala. Hot spot continued to be observed in satellite imagery. |
| 12 Jan 2003 |
1030 |
Ash not identifiable in satellite imagery. Surface reports from Guatemala City indicated that Fuego was active. An intermittent hot spot was seen in satellite imagery. |
| 12 Jan 2003 |
1615 |
Ash not identified in satellite imagery and no hotspot was seen at the summit. Surface reports indicated continuing activity. |
| 20 Jan 2003 |
0430 |
A report from the Guatemala Volcano Institute indicated that ongoing activity produced an ash cloud to 2 km above the summit (~5.8 km altitude) moving S and SW. Multi-spectral imagery showed the ash in a 18-km-wide line extending ~33 km from the summit. The report also indicated that ash was falling in the areas of La Rochela, Panimache, and Palo Verde. |
| 20 Jan 2003 |
1030 |
Ash plume became diffuse and difficult to see on multi-spectral imagery. Around 530Z another puff of ash was seen moving to the SW and an intermittent hotspot was visible for the past few hours. |
| 20 Jan 2003 |
1630 |
Exhalation of ash and steam at 0615Z. Ash plume diffuse and difficult to see on satellite imagery. |
Observations during 3-13 January 2003. Craig Chesner and Sid Halsor reported continuous low-level volcanic activity and one larger event at Fuego during a 10-day site visit. Nearly continuous Strombolian-type spattering and fountaining were observed during the night of 3 January. Bombs and blocks, ejected up to several tens of meters above the summit vent, fell on the upper flanks. No ash was observed during this activity, although ashy trails were generated from ejecta tumbling down the steep southern and eastern slopes of the volcano. On 4 January, no lava fountaining was observed, and activity was characterized by steady and passive emission of a gas plume.
Energetic fountaining and spattering were observed during the night of 5 January from a vantage point on the summit of nearby Agua volcano. Fourteen Strombolian explosions occurred at intervals of 5-61 minutes during 5 hours of continuous observation. These explosions ejected incandescent material ~100 m above the cone, showering the upper flanks with blocks and bombs. Typically, each explosion was accompanied by a loud detonation and an ash plume, and led to several minutes of vigorous fountaining. This activity continued during the morning of 6 January, but by evening, no incandescent activity was apparent at the summit vent.
On the morning of 7 January, a new lava flow was noted on the southern flank, and ash trails generated from spalling blocks suggested that it was active. In the evening, vigorous lava fountaining and spattering had resumed, and the lava flow was seen descending from the summit area to the S. A nearly continuous cascade of pyroclasts produced incandescent rock falls on the upper flanks of the cone.
At 1030 on 8 January, an expansive plume of ash had developed over the summit area. Concurrent fountaining and pulsating eruptions of ash were observed from a vantage point near Alotenango, a few kilometers NE of the volcano. By 1100, the eruption column was broadening at its base, darkening in color, and extending to considerable height above the summit. The most intense phase of the eruption occurred roughly between 1145 and 1215 (figure 6). During this time, loud rumbling and swashing-like sounds accompanied continuous fountaining and frequent, energetic eruptions of ash. A bright incandescent fire fountain, several tens of meters high, was clearly observed at the base of the ash column. Twice during this time period, lateral ash columns, presumably associated with pyroclastic flows, were noted descending towards the W. A convective column engulfed the summit area and appeared to rise several kilometers to an altitude of ~2-3 times the height of the cone.
By 1245, eruptive activity appeared to subside with eruptions becoming less frequent and gradual lightening in color of the ash cloud. Throughout the afternoon, the ash cloud drifted westward and dispersed ash-laden air over a broad region. A circumnavigation of the volcano during the afternoon indicated no detectable ash fall along the dispersal axis at a distance of ~9 km. However, a slight discoloration of vegetation was noted to the E of Yepocapa. Intermittent low to moderate ash eruptions continued throughout the day and summit fountaining was observed at night. The following morning (9 January), no visible activity was noted over a brief observational period. However, the summit area surrounding the vent had clearly changed, being asymmetrically higher to the NW. From 10-13 January, activity was characterized by periodic low-level Strombolian explosions and associated ash plumes. These plumes could be seen from as far away as western El Salvador.
Geologic Background. Volcán Fuego, one of Central America's most active volcanoes, is also one of three large stratovolcanoes overlooking Guatemala's former capital, Antigua. The scarp of an older edifice, Meseta, lies between Fuego and Acatenango to the north. Construction of Meseta dates back to about 230,000 years and continued until the late Pleistocene or early Holocene. Collapse of Meseta may have produced the massive Escuintla debris-avalanche deposit, which extends about 50 km onto the Pacific coastal plain. Growth of the modern Fuego volcano followed, continuing the southward migration of volcanism that began at the mostly andesitic Acatenango. Eruptions at Fuego have become more mafic with time, and most historical activity has produced basaltic rocks. Frequent vigorous eruptions have been recorded since the onset of the Spanish era in 1524, and have produced major ashfalls, along with occasional pyroclastic flows and lava flows.
Information Contacts: Gustavo Chigna M. and Otoniel Matías, Instituto Nacional de Sismologia, Vulcanologia, Meteorologia e Hidrologia (INSIVUMEH), Ministero de Communicaciones, Transporto, Obras Públicas y Vivienda, 7a. Av. 14-57, zona 13, Guatemala City 01013, Guatemala (URL: http://www.insivumeh.gob.gt/); Juan Pablo Ligorria, Coordinadora Nacional para la Reducción de Desastres (CONRED), Av. Hincapié 21-72, Zona 13, Guatemala City, Guatemala; Washington Volcanic Ash Advisory Center, NOAA Satellite Services Division, NESDIS E/SP23, NOAA Science Center, Room 401, 5200 Auth Road, Camp Springs, MD 20746, USA (URL: http://www.ospo.noaa.gov/Products/atmosphere/vaac/); Craig A. Chesner, Geology/Geography Department, Eastern Illinois University, Charleston, IL 61920, USA; Sid P. Halsor, GeoEnvironmental Science and Engineering, Wilkes University, Wilkes-Barre, PA 18766; EFE via COMTEX, Prensa Libre, Siglo XXI.
Heard (Australia) — January 2003 Cite this Report
Heard
Australia
53.106°S, 73.513°E; summit elev. 2745 m
All times are local (unless otherwise noted)
Infrared data show previously unknown activity during May-June 2000
Between 13 May 2000 and 30 January 2003, thermal alerts on Heard Island occurred on the following dates: 24 May; 3, 5, and 6 June; 25 September; 29 October; 5, 15, 19, and 24 November; 16, 17, 26, and 30 December 2000; and 2 February 2001 (figure 7). Since then no further thermal alerts have been recorded. There have been no reports of May-June 2000 activity on Heard Island published in the Bulletin. However, Rothery and Coppola are confident that the MODIS data prove high-temperature volcanic activity at these times. The late-2000 period of MODIS thermal alerts is substantiated by reports from ships and helicopters. The first of these, "fumarolic activity" on 19 October (BGVN 25:11), is 24 days later than the first MODIS thermal alert in this period. A fresh lava flow was suspected but unproven on 3 February (BGVN 26:02), and two incandescent vents were photographed on the same day (BGVN 26:03). The interpretation of the MODIS data is that lava effusion is likely. The locations of the alert pixels (figure 8) suggest that activity was on the WSW side of the summit, and may have extended about halfway to the shore.
Reference. Barling, J., 1990, Heard and McDonald Islands, in Le Masurier, W., and Thomson, J., eds., Volcanoes of the Antarctic Plate and southern Oceans: American Geophysical Union, Washington DC, p. 435-441.
Geologic Background. Heard Island on the Kerguelen Plateau in the southern Indian Ocean consists primarily of the emergent portion of two volcanic structures. The large glacier-covered composite basaltic-to-trachytic cone of Big Ben comprises most of the island, and the smaller Mt. Dixon lies at the NW tip of the island across a narrow isthmus. Little is known about the structure of Big Ben because of its extensive ice cover. The active Mawson Peak forms the island's high point and lies within a 5-6 km wide caldera breached to the SW side of Big Ben. Small satellitic scoria cones are mostly located on the northern coast. Several subglacial eruptions have been reported at this isolated volcano, but observations are infrequent and additional activity may have occurred.
Information Contacts: David A. Rothery and Diego Coppola, Department of Earth Sciences, The Open University, Milton Keynes MK 6AA, United Kingdom.
Lamington (Papua New Guinea) — January 2003 Cite this Report
Lamington
Papua New Guinea
8.95°S, 148.15°E; summit elev. 1680 m
All times are local (unless otherwise noted)
Rumors of volcanism in April 2002 were false
During most of April 2002, residents of Popondetta Town, ~21 km NNE of Lamington, and villages near the volcano were besieged by rumors of the volcano showing signs of renewed activity. Later investigations found no evidence of volcanism. Some of the rumors included fire and "smoke" from the volcano, felt earthquakes, and noises. As a result of the rumors, a couple of schools closed, some residents buried their belongings for safekeeping, and others prepared to evacuate. At the time it was difficult for the Rabaul Volcano Observatory (RVO) to confirm or deny the reports because the monitoring equipment for Lamington had not been operating since October 2001.
Based on information from Geoscience Australia and satellite imagery, the Darwin VAAC reported that an E-drifting ash cloud from Lamington seemed to be evident on satellite imagery on 22 April at 1711. The height of the cloud was not known due to thunderstorms in the area making it difficult to detect ash. However, on 23 April at 1105 a flight service reported that no volcanic activity was evident at Lamington. By 26 April Darwin VAAC had concluded that the suspicious cloud was not related to volcanism.
Investigations by the Geological Survey of PNG (RVO and PMGO) of the Department of Mining were carried out during 21-25 April (courtesy of funding from AusAID). On 28 April 2002, RVO reported that, after 3-4 weeks of rumor and speculation suggesting Lamington was showing signs of renewed volcanic activity, none had occurred. Monitoring equipment was restored during the trip, and seismic recordings during those few days showed no seismicity. A very brief aerial inspection of the summit area showed no concrete evidence of renewed volcanic activity. There were no changes in the topographical features or vegetation to indicate recent activity. Small amounts of vapor were being emitted from a few fumarole locations, but that activity was not a new development. There have been no additional reports of unusual activity or increased seismicity through February 2003.
Geologic Background. Lamington is an andesitic stratovolcano with a 1.3-km-wide breached summit crater containing a lava dome that rises above the coastal plain of the Papuan Peninsula of New Guinea north of the Owen Stanley Range. A summit complex of lava domes and crater remnants tops a low-angle base of volcaniclastic deposits dissected by radial valleys. A prominent broad "avalanche valley" extends northward from the breached crater. Ash layers from two early Holocene eruptions have been identified. In 1951 a powerful explosive eruption produced pyroclastic flows and surges that swept all sides of the volcano, killing nearly 3,000 people. The eruption concluded with growth of a 560-m-high lava dome in the summit crater.
Information Contacts: Ima Itikarai, Rabaul Volcano Observatory (RVO), P.O. Box 386, Rabaul, Papua New Guinea.
Langila (Papua New Guinea) — January 2003 Cite this Report
Langila
Papua New Guinea
5.525°S, 148.42°E; summit elev. 1330 m
All times are local (unless otherwise noted)
Infrared data indicate activity during May-October 2002
Based on information from a pilot report, the Darwin Volcanic Ash Advisory Center (VAAC) reported that an ash cloud from Langila was observed on 11 July 2002 at about 0900 and rose to a height of ~3.4 km. No ash was identifiable on satellite imagery. This was the first reported activity since October 2000 (BGVN 25:11). RVO noted that the observatory at Langila was broken into in 2000 and had its radio stolen. There are no telephones nearby, and since then they have had to rely on mailed reports (very infrequent), reports from pilots, and the Darwin VAAC.
MODVOLC Thermal Alerts, 2001-2002. MODIS thermal alerts occurred on 25 May, 19 and 26 June, 12-15, 24, and 26 August, and 13 October 2002; there were no alerts in 2001. The largest number of alert pixels was 3 on 14 August. The highest alert ratio was -0.648 on 24 August. Putting these two together suggests the most intense activity in mid-late August, but this could be severely biased by cloudy days. Available maps do not allow an accurate location of the summit, and are not of a scale to provide accurate registration. However, all but one of the alert pixels are within ~1 km of each other so there appears to be a spatially restricted event consistent with a short flow (less than a few hundred meters long) or a small dome or incandescent vent a few tens of meters across, which would affect more than one pixel when the pixel boundary fell across, or very close to, the flow, dome, or vent. Both recently active craters (Crater 1 and Crater 2) are also within a 1-km area, along a NE-SW trend, similar to the orientation of the alert pixels.
Geologic Background. Langila, one of the most active volcanoes of New Britain, consists of a group of four small overlapping composite basaltic-andesitic cones on the lower E flank of the extinct Talawe volcano in the Cape Gloucester area of NW New Britain. A rectangular, 2.5-km-long crater is breached widely to the SE; Langila was constructed NE of the breached crater of Talawe. An extensive lava field reaches the coast on the N and NE sides of Langila. Frequent mild-to-moderate explosive eruptions, sometimes accompanied by lava flows, have been recorded since the 19th century from three active craters at the summit. The youngest and smallest crater (no. 3 crater) was formed in 1960 and has a diameter of 150 m.
Information Contacts: Diego Coppola and David A. Rothery, Department of Earth Sciences, The Open University, Milton Keynes, MK7 6AA, United Kingdom; Darwin VAAC, Bureau of Meteorology, Northern Territory Regional Office, PO Box 40050, Casuarina, NT 0811, Australia (URL: http://www.bom.gov.au/info/vaac/); Steve Saunders, Rabaul Volcano Observatory (RVO), P.O. Box 386, Rabaul, Papua New Guinea.
Lopevi
Vanuatu
16.507°S, 168.346°E; summit elev. 1413 m
All times are local (unless otherwise noted)
Infrared data corroborate and refine timing of known activity
During 2001-2002, MODIS alerts occurred only in June 2001 (figure 18). The first anomaly was detected on 9 June at 2210. This consisted of three alert-pixels with a maximum alert ratio of -0.299, and can be attributed to lava flows from a new vent 200 m above sea level on the NW side of the cone, which appeared in association with a plume-forming eruption on 8 June at around 1100 (BGVN 26:08). The only other MODIS alert was 14 June at 2225 local time, and consisted of two pixels closer to the summit (figure 6). According to a local guide (BGVN 26:08), a new flow was erupted in roughly this location on 15 June. MODIS alert data provide evidence that emplacement of this flow actually began during the previous night.
Geologic Background. The small 7-km-wide conical island of Lopevi, known locally as Vanei Vollohulu, is one of Vanuatu's most active volcanoes. A small summit crater containing a cinder cone is breached to the NW and tops an older cone that is rimmed by the remnant of a larger crater. The basaltic-to-andesitic volcano has been active during historical time at both summit and flank vents, primarily along a NW-SE-trending fissure that cuts across the island, producing moderate explosive eruptions and lava flows that reached the coast. Historical eruptions at the 1413-m-high volcano date back to the mid-19th century. The island was evacuated following major eruptions in 1939 and 1960. The latter eruption, from a NW-flank fissure vent, produced a pyroclastic flow that swept to the sea and a lava flow that formed a new peninsula on the western coast.
Information Contacts: Diego Coppola and David A. Rothery, Department of Earth Sciences, The Open University, Milton Keynes, MK7 6AA, United Kingdom.
Manam (Papua New Guinea) — January 2003 Cite this Report
Manam
Papua New Guinea
4.08°S, 145.037°E; summit elev. 1807 m
All times are local (unless otherwise noted)
Low-moderate seismicity after May eruption; plume on 31 October
The Rabaul Volcano Observatory (RVO) reported that the Strombolian eruption from Southern Crater of Manam on 20 May (BGVN 27:05) ended the next day after the last ash-laden clouds were released. Activity then declined to emissions of very small amounts of thin white vapor. A seismograph was installed at Warisi village on the SE side of the island on 22 May 2002. This is the first seismograph to be deployed since Manam Observatory was shut down on 16 January 2001. During 22-24 May seismicity was at a moderate level, mainly associated with many low-frequency volcanic earthquakes. During 25 May-2 June seismicity declined and fluctuated at a low level. At 1351 on 31 October 2002 a pilot reported "light brown dust/smoke" from Manam drifting S toward the main coastline at an estimated height of ~3.0 km. A possible thin low-level plume was seen on satellite imagery extending ~18.5 km N at 1425 that day, but was not seen on later imagery.
MODVOLC Thermal Alerts, 2001-2002. Throughout 2001 and 2002, thermal alerts for Manam occurred only in April and May 2002. The first alert occurred on 7 April and may reflect the tail end of 14-31 March activity reported by RVO when ejection of red incandescent lava fragments was observed (BGVN 27:05). MODIS detected no thermal alerts during that period, which could be a result of cloud cover or because activity was too slight or too intermittent to have triggered an alert.
The number of alert pixels and the value of the alert ratio both increased to a peak on 20 May, the date of a moderate-sized Strombolian eruption reported by RVO. The eruption continued until about 1400 on 20 May. Subsequently, activity declined and consisted of forceful ash emission in moderate volumes (BGVN 27:05). The biggest MODIS anomaly on 20 May was detected at 1015 with 10 alert-pixels and a maximum ratio of 0.178. This is five hours after the first known report of activity. After 12 hours the anomaly was smaller with seven alert-pixels and a maximum alert ratio of -0.322. On 21 May the decreasing thermal anomaly was represented by one alert-pixel with a ratio of -0.783.
During the earlier part of May, MODIS alerts suggested noteworthy activity at Manam that has not, to our knowledge, been reported elsewhere. The anomaly dropped briefly to a minimum on 16 May, which could reflect a lull in activity or partial cloud cover.
The centers of most alert-pixels for Manam lie systematically NW of the summit (figure 11). Bearing in mind that the strongest anomaly should occur at the summit and that ejecta appears to have gone mostly to the SE (BGVN 27:05), there is likely a systematic error in geolocation for this volcano on the MODIS thermal alerts site. The shift between the reported daytime and nighttime alert locations on 20 May could be a related effect, attributable to a 20° difference in satellite zenith angle between these two passes.
Reference. Palfreyman, W.D., and Cooke, R.J.S., 1976, Eruptive history of Manam volcano, Papua New Guinea in Johnson R.W. (ed.), Volcanism in Australasia, Elsevier, Amsterdam, p. 117-131.
Geologic Background. The 10-km-wide island of Manam, lying 13 km off the northern coast of mainland Papua New Guinea, is one of the country's most active volcanoes. Four large radial valleys extend from the unvegetated summit of the conical basaltic-andesitic stratovolcano to its lower flanks. These valleys channel lava flows and pyroclastic avalanches that have sometimes reached the coast. Five small satellitic centers are located near the island's shoreline on the northern, southern, and western sides. Two summit craters are present; both are active, although most observed eruptions have originated from the southern crater, concentrating eruptive products during much of the past century into the SE valley. Frequent eruptions, typically of mild-to-moderate scale, have been recorded since 1616. Occasional larger eruptions have produced pyroclastic flows and lava flows that reached flat-lying coastal areas and entered the sea, sometimes impacting populated areas.
Information Contacts: Ima Itikarai, Rabaul Volcano Observatory (RVO), P.O. Box 386, Rabaul, Papua New Guinea; Darwin VAAC, Bureau of Meteorology, Northern Territory Regional Office, PO Box 40050, Casuarina Northern Territory 0811 Australia (URL: http://www.bom.gov.au/info/vaac/); Diego Coppola and David A. Rothery, Department of Earth Sciences, The Open University, Milton Keynes, MK7 6AA, United Kingdom.
Nyamulagira (DR Congo) — January 2003 Cite this Report
Nyamulagira
DR Congo
1.408°S, 29.2°E; summit elev. 3058 m
All times are local (unless otherwise noted)
Infrared satellite data from the 25 July 2002 eruption
An eruption began at Nyamuragira on 25 July 2002 (BGVN 27:07). Flights on 1 and 3 August confirmed that the eruption was continuing at a high rate, but another look on 27 September showed that the eruption had ceased (BGVN 27:10). The eruption was observed in MODIS thermal satellite imagery (1-km2 pixel size).
Initial activity was detected on 25 July at 2040 UTC, with a large (57-pixel) thermal anomaly on the S and N flanks of the volcano. The anomaly grew in size, with an image on 27 July showing a large anomaly on the N flank and a subordinate anomaly on the S flank. On all subsequent days the anomaly was limited to the N flank. The anomaly reached a maximum size of 78 pixels on 1 August, at which point it extended approximately 12-15 pixels (or around 12-15 km) along its longest dimension (figure 23). After this point the size and intensity of the anomaly rapidly diminished (detected anomalies after mid-August were no more than 8 pixels in size). The last detected anomaly at Nyamuragira occurred on 1 October. Figures 24 and 25 show the number of anomalous pixels and the sum of the radiance for the entire eruptive event.
Geologic Background. Africa's most active volcano, Nyamulagira (also known as Nyamuragira), is a massive high-potassium basaltic shield about 25 km N of Lake Kivu and 13 km NNW of the steep-sided Nyiragongo volcano. The summit is truncated by a small 2 x 2.3 km caldera that has walls up to about 100 m high. Documented eruptions have occurred within the summit caldera, as well as from the numerous flank fissures and cinder cones. A lava lake in the summit crater, active since at least 1921, drained in 1938, at the time of a major flank eruption. Recent lava flows extend down the flanks more than 30 km from the summit as far as Lake Kivu; extensive lava flows from this volcano have covered 1,500 km2 of the western branch of the East African Rift.
Information Contacts: Matt Patrick, Andy Harris, Luke Flynn, Robert Wright, Harold Garbiel, and Eric Pilger, HIGP/SOEST, University of Hawaii at Manoa, HI 96822 USA.
Rabaul (Papua New Guinea) — January 2003 Cite this Report
Rabaul
Papua New Guinea
4.2459°S, 152.1937°E; summit elev. 688 m
All times are local (unless otherwise noted)
Continued ash eruptions from three vents at Tavurvur
During mid-December 2002 through early February 2003, eruptions at Tavurvur continued from three vents at different times. The eruptions were characterized by slow, thick convoluted ash plumes occurring at irregular intervals and rising about several hundred to thousands of meters above the summit. Occasionally they became forceful. Throughout the report period light to pale gray ash plumes drifted in various directions, resulting in ashfall in the town of Rabaul, Matupit Island, Malaguna village, and other areas. During 20-27 January ash emissions were associated with discrete short-duration seismic events and slightly longer duration events. The former event types were pronounced during 20-27 January, but on 26 and 27 January seismicity changed to the low-amplitude medium-to-long duration type.
Generally, the seismicity fluctuated at low-to-moderate levels. A period of harmonic tremor was recorded on the morning of 18 December 2002. That day, the Rabaul Volcano Observatory (RVO) reported that the gaps between emissions seemed to have lengthened over the previous 24 hours. During 19-20 December, occasional larger explosions showered the flanks with rocks. Following the explosions ash-poor plumes were gently emitted from the whole area of the Northern Crater. During 20-23 December there was a slight increase in the number of volcanic earthquakes due to more ash emissions. The increase in volcanic earthquakes tapered off over the next few days.
Ground deformation measurements from real-time GPS showed no significant changes. On 24 January RVO reported that the electronic tiltmeter had been showing a slow inflation during the previous 2 months. That trend ceased by 27 January, when ground-deformation measurements from real-time GPS changed to show an inflationary trend through 2 February. Long-duration, low-amplitude earthquakes occurred through at least 10 February.
MODVOLC Thermal Alerts, 2001-2002. During 2001 and 2002, MODIS alerts occurred only during April-September 2001 and June-December 2002. These anomalies were always represented by a single alert-pixel, except for 26 May 2001, 4 July 2001, and 22 October 2002, which each had two alert-pixels. The maximum alert ratio was on 4 July 2001 when it reached -0.26. The center coordinates of all the alert-pixels plot within 1 km of each other, in a cluster centered ~1 km W of Tavurvur (figure 37), which is the only site of known activity during this period. This high degree of repeatability offset from the likely seat of the anomaly at the summit vent suggests a systematic error in geolocation.
The first alert was detected on 26 April 2001, and can be related to a change in activity on Tavurvur from occasional sub-continuous ash emissions to frequent, short-duration ash expulsions on 25 April (BGVN 26:06). From 21 May to 2 June MODIS detected a series of anomalies characterized by a single pixel (two pixels on 26 May) with a low alert ratio averaging -0.774. For this period RVO reported incandescent explosions that lessened in frequency and vigor towards the end of May but picked up again on 30 May when explosions produced dark ash clouds that rose to 1-1.5 km above the vent. On 1-2 June activity was dominated by strong discrete explosions. At night, red incandescent lava fragments were visible (BGVN 26:10). On 4 July 2001 MODIS detected a moderate anomaly coincident with Tavurvur cone, characterized by two alert-pixels with a maximum alert ratio of -0.263. The anomaly was much smaller on 6 July. Reports by RVO (BGVN 26:10) indicated a quiet period from 20 June through July and most of August marked by emission of thin, white vapor. Activity remained low throughout September and October (BGVN 26:10). MODIS detected a single alert-pixel on 17 September, possibly corresponding to the last ash-producing activity in early September 2001.
The next MODIS alerts were in 2002 on 14 June, 19 September, 22 October, 21 November, and 25 December. These were single pixels except for the 22 October anomaly, which was 2 pixels in size. This may represent the aftermath of a large explosion on 20 October that produced a thick, dark ash plume that rose 3 km (BGVN 27:11).
Reference. Almond, R.A., and McKee, C.O., 1982, Location of volcano-tectonic earthquakes within the Rabaul Caldera: Geological Survey of Papua New Guinea Report 82/19.
Geologic Background. The low-lying Rabaul caldera on the tip of the Gazelle Peninsula at the NE end of New Britain forms a broad sheltered harbor utilized by what was the island's largest city prior to a major eruption in 1994. The outer flanks of the asymmetrical shield volcano are formed by thick pyroclastic-flow deposits. The 8 x 14 km caldera is widely breached on the east, where its floor is flooded by Blanche Bay and was formed about 1,400 years ago. An earlier caldera-forming eruption about 7,100 years ago is thought to have originated from Tavui caldera, offshore to the north. Three small stratovolcanoes lie outside the N and NE caldera rims. Post-caldera eruptions built basaltic-to-dacitic pyroclastic cones on the caldera floor near the NE and W caldera walls. Several of these, including Vulcan cone, which was formed during a large eruption in 1878, have produced major explosive activity during historical time. A powerful explosive eruption in 1994 occurred simultaneously from Vulcan and Tavurvur volcanoes and forced the temporary abandonment of Rabaul city.
Information Contacts: Ima Itikarai, Rabaul Volcano Observatory (RVO), P.O. Box 386, Rabaul, Papua New Guinea; Diego Coppola and David A. Rothery, Department of Earth Sciences, The Open University, Milton Keynes, MK7 6AA, United Kingdom.
Special Announcements (Unknown) — January 2003 Cite this Report
Special Announcements
Unknown
Unknown, Unknown; summit elev. m
All times are local (unless otherwise noted)
Global high-temperature thermal monitoring system (MODIS Thermal Alerts)
The MODIS Thermal Alerts website (http://modis.higp.hawaii.edu/) is the first truly global high-temperature thermal monitoring system for volcanic activity. This system is capable of detecting and documenting changes in active lava flows, lava domes, lava lakes, strongly incandescent vents, and hot pyroclastic flows. No alert is likely to be triggered by an ash cloud. MODIS cannot see through weather clouds and is also liable to miss events of less than several hours duration. Nevertheless, MODIS is capable of adding significant information to the record of global volcanic activity.
As described by Flynn and others (2001), Wright and others (2002), and Rothery and others (2003), the MODIS Thermal Alerts website provides a series of maps updated every 24 hours to show 'thermal alerts' based on night-time (approximately 2230 local time) infrared data from the Moderate Resolution Imaging Spectroradiometer (MODIS) instrument that is carried by NASA's Terra and Aqua satellites. Thermal alerts are based on an 'alert ratio' (3.9 µm radiance - 12 µm radiance) / (3.9 µm radiance + 12 µm radiance) and an alert is triggered whenever this ratio has a value more positive than -0.8. This threshold value was chosen empirically by inspection of images containing known volcanic sites at high temperature, and is the most negative value that avoids numerous false alarms. There are also some day-time alerts (at approximately 1030 local time) based on the same algorithm. These incorporate a correction for estimated solar reflection and a more stringent threshold, whereby the alert ratio must be more positive than -0.6 to trigger an alert.
In order to bring this valuable tool to the attention of a wider community, Dave Rothery and Diego Coppola have provided an analysis of volcanic activity detected by MODIS in Melanesia from January 2001 to December 2002, which they relate as fully as possible to conventional observations in the Bulletin of the Global Volcanism Network. In the cases of Manam, Rabaul, Ulawun, and Pago there is a high degree of correspondence between MODIS alerts and independently derived observations. In the cases of Bagana, Tinakula, and Ambrym the MODIS alerts represent the only hitherto reported evidence of activity during 2001-2002. Lopevi and Yasur are intermediate cases, where MODIS adds significantly to what has previously been reported. All the 'new' activity is not necessarily unknown to local volcanologists (though this may be so in some cases), and in fact additional information from local sources would help to refine the MODIS interpretation. However, the MODIS Thermal Alerts provide a useful source of near real-time information that is openly available for the benefit of the global volcanism community.
Graphs of the 'alert ratio' and number of alerted pixels indicate the magnitude of every anomaly detected during the period. In some cases these are accompanied by maps indicating the center coordinates of the alerted pixels. The original pixels are 1 x 1 km squares, which means that the true site of a spatially small anomaly that has triggered an alert can be anywhere within a 1-km box surrounding the center point. The geolocational accuracy of MODIS pixel coordinates is generally reckoned to be better than 1 km, but may become worse for high volcanoes, especially when seen close to the edge of an imaging swath (when the satellite can be more than 45 degrees away from the zenith). Furthermore, for some of the more remote volcanoes MODIS scientists believe there may remain significant map-location errors.
References. Flynn, L.P., Wright R., Garbeil, H., Harris, A.J.L., and Pilger, E., 2001, A global thermal alert system using MODIS: initial results from 2000-2001: Advances in Environmental Monitoring and Modelling, no. 3, Monitoring volcanic hotspots using thermal remote sensing, edited by Harris, A.J.L., Wooster, M.J., and Rothery, D. A. (http://www.kcl.ac.uk/kis/schools/hums/geog/advemm/vol1no3.html).
Wright, R., Flynn, L., Garbeil, H., Harris, A., and Pilger, E., 2002, Automated volcanic eruption detection using MODIS: Remote Sensing of Environment, v. 82, p. 135-155.
Rothery, D.A., Thorne, M.T., and Flynn, L., 2003, MODIS thermal alerts in Britain and the North Sea during the first half of 2001: International Journal of Remote Sensing, v. 24, p. 817-826.
Geologic Background. Special announcements or information of general interest not linked to any specific volcano.
Information Contacts:
Stromboli (Italy) — January 2003 Cite this Report
Stromboli
Italy
38.789°N, 15.213°E; summit elev. 924 m
All times are local (unless otherwise noted)
Lava emissions continue into January; crater morphology changes
The effusive eruption at Stromboli, which began 28 December 2002, continued into January 2003. Effusion of lava occurred at a main vent located at 500 m elevation in the middle of the Sciara del Fuoco, within the scar remaining after the 30 December 2002 landslide. The position of this vent has been rather stable since its opening, also on 30 December. Another vent, located at 600 m elevation at the NE base of Crater 1, has been active several times during the eruption, forming low-effusion rate, short lava flows lasting from a few hours to a few days. Effusion rates along the Sciara del Fuoco from the 500 m vent were very variable. During peaks in effusion rate, aa lava flows were reaching the sea causing phreatic explosions at the front. A decrease in effusion rate formed a fan of thin, narrow lava flows spreading on the upper flow field without reaching the sea.
Activation of the 600 m vent occurred each time the 500 m vent showed a marked decrease in effusion rate, suggesting a temporary magma level rise within the feeder conduit of the volcano. This observation was confirmed by an approximately 50°C increase in temperature at the bottom of the craters during activation of the 600 m vent, recorded during daily thermal mapping from a helicopter.
Lava flow emission along the Sciara del Fuoco formed a very thick flow field within the landslide scar of 30 December. Occasional small landslides from the unstable walls of the Sciara cover the lava flows with talus, increasing the thickness and instability of the flow field.
During a helicopter-borne thermal survey carried out on 12 January, arcuate cracks were detected around the southern base of the summit craters of the volcano. Other fractures, oriented NE-SW, cut through the craters. These probably result from drainage of magma in the upper part of the conduit. Collapse of the crater floor in early January significantly changed the morphology of the upper part of the volcano. Crater 2 (the middle crater) has disappeared, and Crater 1 (NE) and Crater 3 (SW) were joined together to form a unique, elongate depression. No explosive activity has been detected at the summit craters of the volcano since the start of the effusion within the Sciara del Fuoco.
Geologic Background. Spectacular incandescent nighttime explosions at Stromboli have long attracted visitors to the "Lighthouse of the Mediterranean" in the NE Aeolian Islands. This volcano has lent its name to the frequent mild explosive activity that has characterized its eruptions throughout much of historical time. The small island is the emergent summit of a volcano that grew in two main eruptive cycles, the last of which formed the western portion of the island. The Neostromboli eruptive period took place between about 13,000 and 5,000 years ago. The active summit vents are located at the head of the Sciara del Fuoco, a prominent scarp that formed about 5,000 years ago due to a series of slope failures which extends to below sea level. The modern volcano has been constructed within this scarp, which funnels pyroclastic ejecta and lava flows to the NW. Essentially continuous mild Strombolian explosions, sometimes accompanied by lava flows, have been recorded for more than a millennium.
Information Contacts: Istituto Nazionale di Geofisica e Vulcanologia (INGV), Sezione di Catania Piazza Roma 2, 95123 Catania (URL: http://www.ct.ingv.it/).
Tinakula (Solomon Islands) — January 2003 Cite this Report
Tinakula
Solomon Islands
10.386°S, 165.804°E; summit elev. 796 m
All times are local (unless otherwise noted)
Observers and infrared data indicate eruptive activity since 1989
Following an eruption and tsunami from Tinakula (figure 1) during September-December 1971 (CSLP Cards 1297, 1300, and 1301), there were brief reports of large steam plumes and ash plumes in June 1984 (SEAN 09:06) and June 1985 (SEAN 10:06). This report includes observations from a variety of sources. John Seach has provided information about activity during 1989-90 and 1995, as well as some insight into hazards faced by island residents in the area. Passengers on tour expedition ships noted continuing activity in May 1999 and November 2002. MODIS thermal alerts were triggered on three occasions during January-April 2001. In April 2002 excellent observations of eruptive activity were made by scientists on an Australian research vessel.
Observations in 1989-90 and 1995. John Seach observed Tinakula volcano from the Reef Islands (54 km ENE) from August 1989 to February 1990. Typical activity consisted of Vulcanian eruptions and ash emission to 200-400 m above the summit. Eruptions occurred in distinct bursts separated by intervals ranging from minutes to hours. Reports from sailors indicated that lava bombs frequently rolled down to the sea on the NW side of the volcano, and glowing avalanches were observed at night.
Tinakula was approached by motorized canoe on two occasions in 1995, but dangerous seas made landing impossible. Ongoing ash emissions originated from the summit area. The upper slopes of the volcano were bare and exposed to gas emissions. Regions of mass wasting on the flanks were common, and blocks of lava and rubble were found at sea level at various locations around the island. However, some of the lower flanks were covered with thick vegetation. During a Solair flight from Santa Cruz to Honiara in late September 1995, activity was observed at the summit crater with ash emissions drifting several kilometers towards the W.
The island has not been inhabited since the tsunami in 1971, but islanders from the outer Reef Islands occasionally travel to tend gardens on the SE flank. The ocean between Santa Cruz Island and Reef Islands is dangerous, with many currents and high seas regularly capsizing boats. Landing on the island is always dangerous due to prevailing swells and the lack of a suitable beach. The dominant SE trade winds blow ash and gases away from inhabited islands for most of the year, but a large eruption occurring in westerly winds may affect populations in the Reef Islands. Volcanic bombs (5 cm in diameter) of an unknown age located in villages on the Reef Islands (over 50 km away) were reported to have fallen from the sky.
Observations during May 1999. On the morning of 16 May 1999, Matthew Mumford, on a sailing expedition aboard the Akademik Shuleykin, noted as they approached Tinakula that ". . . a cloud of darkness was blown skyward before our bow. As the ash moved across the sky, the contrast of gray against the white pillows of cloud gave a clear indication of how active this volcano continues to be."
MODVOLC Thermal Alerts, 2000-2002. MODIS alerts for Tinakula on 15 January 2001, 6 March 2001, and 16 April 2001 provide objective evidence of continued volcanic activity. The maximum alert ratio was low (-0.75), indicating small-scale activity. The absence of alerts since April 2001 was judged more likely to be because the level of activity has dipped below the -0.8 alert-ratio threshold rather than because of a genuine cessation of activity.
Observations during April 2002. Scientists from the RV Franklin briefly investigated Tinakula during the SOLAVENTS expedition, 26 March-21 April 2002. A vent high up on the W flank was actively expelling gas/steam, which could be heard as a low roar 50 m from shore. Small avalanches down the steep W side were common, and one larger eruption observed from the vessel's bridge lasted about 5 minutes. Small optical transmission anomalies were detected in the water column and are probably turbidity induced-particulate plumes. A weak methane anomaly was also recorded ~2.8 km off the NW coast of Tinakula. The following is based on extracts from the daily narrative section of the cruise report (McConachy and others, 2002).
The Franklin arrived ~3.2 km off the W coast of Tinakula at 0705 on 6 April 2002 (figures 2-5) and in perfect conditions the Zodiac rescue boat was deployed with Able Seaman Graham and scientists Richard Arculus and Donn Tolia to commence water sampling. The zodiac was safely back on deck by 0815. The scientists reported a roaring noise from Tinakula's active crater heard when the boat was 50 m offshore.
From virtually the same location a grab sample collected material from the 1971 eruption at around 950 m depth. An excellent, 75%-full load of exceptionally well-sorted black volcanic sand was recovered, consisting of plagioclase, pyroxene and red-brown fragments; no foraminifera were visible. A CTD-Hydrocast followed at around 0910. During this operation, smoke came from a vent 2/3 way up the summit on the W side of the sector collapse, and minor avalanches came down scree slopes on the N side of the collapse area. A number of light transmission anomalies were observed on the down cast and sampled on the upcast. They are most likely particle plumes following isopycnals (constant density surfaces) sloughing off the main slope.
Observations during November 2002. Passengers on the Zegrahm Expeditions cruise ship Clipper Odyssey observed that Tinakula was "active" on the morning of 18 November 2002, but no description of the activity was provided.
References. McConachy, T.F., Yeats, C.J., Arculus, R.J., Beattie, R., Belford, S., Holden, J., Kim, J., MacDonald, L., Schardt, C., Sestak, S., Stevens, B., and Tolia, D., 2002, SOLAVENTS-2002: Solomons Australia Vents Expedition Aboard the RV Franklin, 26 March-21 April 2002, edited by C.J. Yeats, CSIRO Exploration and Mining Report 1026F, 456 p.
Hughes, G.W., 1972, Geological map of Tinakula: Nendö sheet EOI 1, Soloman Geol. Survey, Honiara.
Eissen, J-P., Blot, C., and Louat, R., 1991, Chronology of the historic volcanic activity of the New Hebrides island arc from 1595 to 1991: Rapports Scientifiques et Technique, Sciences de la Terre, No. 2, ORSTOM, France.
Geologic Background. The small 3.5-km-wide island of Tinakula is the exposed summit of a massive stratovolcano at the NW end of the Santa Cruz islands. It has a breached summit crater that extends from the summit to below sea level. Landslides enlarged this scarp in 1965, creating an embayment on the NW coast. The Mendana cone is located on the SE side. The dominantly andesitic volcano has frequently been observed in eruption since the era of Spanish exploration began in 1595. In about 1840, an explosive eruption apparently produced pyroclastic flows that swept all sides of the island, killing its inhabitants. Recorded eruptions have frequently originated from a cone constructed within the large breached crater. These have left the upper flanks and the steep apron of lava flows and volcaniclastic debris within the breach unvegetated.
Information Contacts: Timothy F. McConachy, CSIRO Exploration and Mining, PO Box 136, North Ryde, NSW 1670, Australia (URL: http://mnf.csiro.au/); Diego Coppola and David A. Rothery, Department of Earth Sciences, The Open University, Milton Keynes, MK7 6AA, United Kingdom; John Seach, PO Box 16, Chatsworth Island, NSW 2469, Australia (URL: http://www.volcanolive.com/); Jeff and Cynthia Gneiser, Zegrahm & Eco Expeditions, 192 Nickerson Street ##200, Seattle, WA 98109, USA (URL: https://www.zegrahm.com/); Matthew Mumford, Unit 1.02, 26 Kippax Street, Surrey Hills, NSW 2010, Australia.
Ulawun (Papua New Guinea) — January 2003 Cite this Report
Ulawun
Papua New Guinea
5.05°S, 151.33°E; summit elev. 2334 m
All times are local (unless otherwise noted)
Intermittent ash plumes from August through early November 2002
During mid-March 2002 through at least early February 2003, activity from the main crater and the N valley vents of Ulawun were unchanged and generally remained low. The vent in the main crater released weak-to-moderate volumes of white and white-gray vapor. The N valley vents sometimes produced very weak traces of thin white vapor. Seismicity returned to background levels after volcanic tremors ceased on 18 March 2002. Discrete low-frequency earthquakes continued to occur in small numbers. During 15-28 April the seismicity level was low, however from 29 April seismicity increased to a moderate level following an episode of continuous volcanic tremor. The tremor ceased on 25 May. In June, RVO reported that the electronic tiltmeter continued to show long-term deflation of the summit area, but the amount of change was smaller than in the previous 1-3 months. Small continuous volcanic tremors became more prominent beginning on 21 January 2003 and ceased on 27 January.
Satellite imagery showed eruption plumes on 22 and 28 August (news reports indicated continued activity that entire week), and 6-7 September 2002 (BGVN 27:08). The Darwin VAAC issued advisories about low-level ash plumes on 12 and 19 September, and an ash-and-steam cloud to ~3.7 km on 28 September. Low-level ash plumes were noted again on 2 and 16 October, with another higher plume (~3.6 km) on the 22nd. At 0630 on 3 November an Air Niugini pilot reported ash drifting ESE from the volcano at ~3 km altitude.
MODVOLC Thermal Alerts, 2001-2002. Throughout 2001 and 2002, thermal alerts for Ulawun occurred only during 26-28 April 2001. The first detected anomaly was at 2225 on 26 April and consisted of four alert-pixels with a maximum alert ratio of -0.095. By the following day the anomaly had increased in spatial dimension to eight alert-pixels although the maximum alert ratio was lower (-0.224). On 28 April at 2215 the anomaly had increased to 15 alert-pixels with a higher maximum alert ratio of -0.053. After that no more anomalies were detected.
This sequence can be related to events reported by the Rabaul Volcano Observatory (BGVN 26:06) On 26 April 2001 at 0530 a small Strombolian eruption began. This was characterized by glowing lava fragments ejected by frequent explosions followed by small pyroclastic flows. During the day activity decreased but on 27 April at 0530 another phase of Strombolian activity began. A small pyroclastic flow occurred followed by a lava flow that descended to about 500-600 m above sea-level. This is presumably the cause of the 15-pixel alert on 28 April (figure 8). A third phase of Strombolian activity began at about 0600 on 29 April. This phase was slower and more gradual, peaking at about 1800-2200 on 29 April, and did not produce a MODIS thermal alert.
Geologic Background. The symmetrical basaltic-to-andesitic Ulawun stratovolcano is the highest volcano of the Bismarck arc, and one of Papua New Guinea's most frequently active. The volcano, also known as the Father, rises above the N coast of the island of New Britain across a low saddle NE of Bamus volcano, the South Son. The upper 1,000 m is unvegetated. A prominent E-W escarpment on the south may be the result of large-scale slumping. Satellitic cones occupy the NW and E flanks. A steep-walled valley cuts the NW side, and a flank lava-flow complex lies to the south of this valley. Historical eruptions date back to the beginning of the 18th century. Twentieth-century eruptions were mildly explosive until 1967, but after 1970 several larger eruptions produced lava flows and basaltic pyroclastic flows, greatly modifying the summit crater.
Information Contacts: Ima Itikarai, Rabaul Volcano Observatory (RVO), P.O. Box 386, Rabaul, Papua New Guinea; Darwin Volcanic Ash Advisory Center (VAAC), Bureau of Meteorology, Northern Territory Regional Office, PO Box 40050, Casuarina, NT 0811, Australia (URL: http://www.bom.gov.au/info/vaac/); Diego Coppola and David A. Rothery, Department of Earth Sciences, The Open University, Milton Keynes, MK7 6AA, United Kingdom.
Veniaminof (United States) — January 2003 Cite this Report
Veniaminof
United States
56.17°N, 159.38°W; summit elev. 2507 m
All times are local (unless otherwise noted)
Minor ash emissions in early October 2002; increased seismicity in December
Uncertain low-level eruptive activity occurred at Veniaminof in September 2002 (BGVN 27:10). During October 2002, seismicity was lower than when it was first noted in early September, although it was still above background levels. Visual observations were intermittent and inconclusive. The Alaska Volcano Observatory (AVO) received reports ranging from minor-steam and possible ash emissions, to no signs of activity. Satellite imagery on 2 October suggested an apparent gray, diffuse deposit extending across the caldera from the historically active intracaldera cinder cone. This could reflect a small explosion, vigorous steam emission, or redistribution of material by strong winds; no thermal anomalies were observed on satellite imagery. Footage obtained later, but recorded in early October, showed minor ash emission from the intracaldera cone rising ~100-200 m above the cone and drifting a short distance before dispersing. A faint covering of ash was visible on the caldera ice field extending from the base of the cone.
On 18 November AVO lowered the Concern Color Code from Yellow to Green. Since early October they had received no pilot reports or other observations of activity at the volcano. Also, they had not detected thermal anomalies in any clear satellite images. Though seismicity remained above levels recorded during summer of 2002, it remained roughly constant during the previous month at a level notably lower than in September.
Seismicity began to increase in mid-December, and on 6 January AVO raised the Concern Color Code from Green to Yellow. No thermal anomalies were detected on satellite imagery. Elevated seismicity continued through February 2003, with discrete seismic events occurring at a rate of 1-2 per minute during 21-28 February. Nearly constant periods of seismicity were recorded during the report week. Discrete seismic events occurred at rates up to 1-2 events per minute, along with moderate levels of volcanic tremor. Satellite imagery did not reveal increased surface temperatures, ash emission, or ash deposits. Visual observations on 22 January from the village of Perryville, located 35 km SSW of the volcano, revealed that white steam was rising from the intracaldera cone. The steaming was similar to that observed over the previous several months. The Concern Color Code remained at Yellow.
Geologic Background. Veniaminof, on the Alaska Peninsula, is truncated by a steep-walled, 8 x 11 km, glacier-filled caldera that formed around 3,700 years ago. The caldera rim is up to 520 m high on the north, is deeply notched on the west by Cone Glacier, and is covered by an ice sheet on the south. Post-caldera vents are located along a NW-SE zone bisecting the caldera that extends 55 km from near the Bering Sea coast, across the caldera, and down the Pacific flank. Historical eruptions probably all originated from the westernmost and most prominent of two intra-caldera cones, which rises about 300 m above the surrounding icefield. The other cone is larger, and has a summit crater or caldera that may reach 2.5 km in diameter, but is more subdued and barely rises above the glacier surface.
Information Contacts: Alaska Volcano Observatory (AVO), a cooperative program of a) U.S. Geological Survey, 4200 University Drive, Anchorage, AK 99508-4667, USA, b) Geophysical Institute, University of Alaska, PO Box 757320, Fairbanks, AK 99775-7320, USA, and c) Alaska Division of Geological & Geophysical Surveys, 794 University Ave., Suite 200, Fairbanks, AK 99709, USA.
Witori (Papua New Guinea) — January 2003 Cite this Report
Witori
Papua New Guinea
5.5745°S, 150.5161°E; summit elev. 724 m
All times are local (unless otherwise noted)
Slow lava effusion within the caldera continues through January 2003
The eruption that began at Pago on 3 August 2002 (BGVN 27:07-27:09 and 27:12) continued through at least early February 2003. The Rabaul Volcano Observatory (RVO) reported that slow effusion of the lava flow from the northwestern-most vent continued. The flow was still contained within the Witori Caldera. An aerial inspection on 10 December confirmed that the lava was still moving. Besides the continuing lava flow, a weak glow was observed on the night of 28 December and rumbling noises were heard for a very short period on 9 January. Rumblings noises were also reported on 4 and 9 February.
Small volcano-tectonic earthquakes continued at background levels. Variable amounts of white vapor were released from the vents. During late December and January the northwestern-most vent was releasing some bluish vapor, indicative of continuing eruption of lava from the same vent. Some booming noises were reported on 22 January from the summit area. As of 24 January 2003, reports of browning vegetation on the S part of the volcano had not been investigated due to logistical problems. However, RVO stated that a likely cause was volcanic plumes containing sulfur gases blowing to the S and SE and affecting vegetation. Ground deformation showed a lack of significant changes during December. This contrasts with the period between the start of the eruption on 3 August and the beginning of November when complex and significant movements were recorded.
MODVOLC Thermal Alerts, 2001-2002. Throughout 2001 and 2002, thermal alerts for Pago occurred only during August-December 2002 (figure 17). This period was characterized by continuous thermal anomalies first detected on 6 August at 1030 and growing to several pixels in size. At this time the anomaly consisted of a single alert-pixel with an alert ratio of -0.31. At 2250 MODIS detected five alert-pixels with a maximum alert ratio of -0.35. The alert ratio of the anomaly rose to a peak on 8 August at 1015 when a single alert-pixel had an alert ratio of -0.035.
After that, during August detected alerts on Pago gradually decreased. On 15 August the anomaly consisted of three alert-pixels with a maximum alert ratio of -0.077, and on 22 August two alert-pixels were detected with maximum alert ratio of -0.167. The RVO reported that the eruption continued with low levels of activity during August and was characterized by the ejection of ash clouds (BGVN 27:08). The earliest date reported for lava effusion is 9 August (BGVN 27:07).
On 26 August MODIS detected five alert-pixels with a maximum alert ratio of -0.291. The anomaly decreased on 29 August when only one alert-pixel was detected (alert ratio -0.318), but had expanded by 31 August to two alert-pixels with a maximum alert ratio of -0.382, and by 2 September to four alert-pixels with a maximum alert ratio of -0.345. This series of anomalies is evidently related to lava erupted from the craters NW of the central cone during 25 August to 3 September (BGVN 27:08), during which lava flowed NE and then SW after reaching the caldera wall. The coordinates of the alert-pixels throughout the eruption were dispersed between the active vent and the caldera wall in a pattern consistent with this description (figure 18).
On 9 September MODIS detected a single pixel anomaly with an alert ratio of -0.275. This anomaly was probably related to the explosion(s) that produced a 1.5-km-high ash-and-steam plume visible on satellite images on 7 and 8 September (BGVN 27:08). During September and October the alert ratio became lower and varied between one and five pixels. The relatively high alert ratio of -0.441 on 2 October was probably related to continuous lava flows in the NE portion of a fissure system inside the caldera, reported by the RVO (BGVN 27:09). MODIS detected continuous anomalies during October-December 2002, attributed to continuing lava effusion. Another alert was recorded on 15 January 2003.
Geologic Background. The active Pago cone has grown within the Witori caldera (5.5 x 7.5 km) on the northern coast of central New Britain contains the active Pago cone. The gently sloping outer caldera flanks consist primarily of dacitic pyroclastic-flow and airfall deposits produced during a series of five major explosive eruptions from about 5,600 to 1,200 years ago, many of which may have been associated with caldera formation. Pago cone may have formed less than 350 years ago; it has grown to a height above the caldera rim, and a series of ten dacitic lava flows from it covers much of the caldera floor. The youngest of these was erupted during 2002-2003 from vents extending from the summit nearly to the NW caldera wall. The Buru caldera cuts the SW flank.
Information Contacts: Ima Itikarai, Rabaul Volcano Observatory (RVO), PO Box 386, Rabaul, E.N.B.P., Papua New Guinea; Diego Coppola and David A. Rothery, Department of Earth Sciences, The Open University, Milton Keynes, MK7 6AA, United Kingdom.
Yasur
Vanuatu
19.532°S, 169.447°E; summit elev. 361 m
All times are local (unless otherwise noted)
Eruptive activity from the summit crater continued through 2002
Eruptive activity has continued at Yasur since a more vigorous phase began in October 2001 that lasted at least into January 2002 (BGVN 27:01). This report includes details for a period of mild activity during 24-28 July 2000 (not previously included in the Bulletin). Since that time visitors noted activity continuing in October 2000 and September 2001 (BGVN 26:11), as well as October and December 2001 (BGVN 27:01). Accounts are provided below of activity during January, August, November, and December 2002. Finally, MODIS thermal-alert data confirm intermittent lower level activity in 2001, and an increase in vigor beginning in August 2002.
Observations during July 2000. Roberto Carniel, Douglas Charley, and Marco Fulle arrived on Tanna Island on 24 July 2000 and camped at the base of the E slope of the cone. The lake that used to fill part of the surrounding Ash Plain had disappeared after heavy rains during the rainy season caused the overflow of the lake, damaging several houses in the village of Sulphur Bay. In the active crater, three smaller craters were distinguished, named A, B, and C, from left to right as seen from the E rim, where local guides bring tourists. This spot lies no more than 150 m from the most active C vents (figure 30). During the visit Crater B was slightly active, while Crater A appeared dormant.
On the afternoon of 24 July the activity was moderate to high. Between 1620 and 1640 frequent spattering was observed by Carniel at the C/1 and C/2 vents. Between 1640 and 1820 eight eruptions were observed at vent C/0, with another 10 eruptions at vent C/1. On average the latter vent exhibited the bigger eruptions, in one case accompanied by gray emissions.
During the morning of 25 July the activity was again quite intense; observations were sometimes disturbed by a strong wind. Between 0825 and 0910 the explosions were mostly concentrated in the C/0 vent (six eruptions). Some of them were accompanied by the emission of brown ash at the end. During this period three silent explosions with only brown ash emitted were observed at vent B/1, completely inactive the previous day. C/1 showed only one eruption. After 20 minutes with no eruptions, from 0930 to 1130 the activity was mostly concentrated in the C/1 vent, where 17 eruptions were observed, some ended by a brown ash emission. The vent also showed about ten minutes of frequent spattering around 1120; during the same period B/1 vent produced two more silent ash eruptions and a brief spattering was observed at a vent, C/2, that looked different from C/1 but did not show any other activity after this. After 0930 vent C/0 did not show any activity.
During the afternoon, new visual observations were made by Carniel. From 1700 to 1725 very low activity was observed. Two successive silent brown ash eruptions from vent B/1 accompanied the start of a more intense phase for vent C/1. This vent erupted 15 times between 1725 and 1855, sometimes also showing continuous spattering and glow. Again no activity was seen at vent C/0.
During the morning of 26 July visual observations were made between 0835 and 1125. The first ten minutes were characterized by continuous and loud spattering at vent C/1, which showed a total of 18 explosions, some of them extremely loud and/or accompanied by the emission of gray ash. Vent C/0 showed only three eruptions, but all very loud and followed by a brown ash emission. One single silent ash eruption was observed at vent B/1 at 0945.
Carniel made other visual observations between 1700 and 1750 on the afternoon of 26 July, when the activity was characterized by a variable level of continuous spattering from vent C/1, which also showed 10 eruptions. During this period vent C/0 showed a single eruption at 1736. No activity was observed in crater B.
After a morning characterized by rain, Carniel and Fulle climbed the volcano again on the afternoon of 27 July. The air was still humid and gas stayed over the craters. The volcano was very quiet between the eruptions, with no sounds and no spattering at any vent. Between 1630 and 1730 there were 14 eruptions observed at vent C/1, but most of them were gas-rich emissions with very few bombs reaching the vent rim. Only two eruptions slightly bigger than spattering were observed at vent C/0.
On the morning of 28 July 2000, before leaving the volcano, the team made their last visual observations. Activity was moderate and visibility not very good. Many eruptions were very loud and they could be ascribed to C/1 from the sound alone, even when not visible. At 0920 a rockfall was heard from the S side of the caldera rim.
Observations during January 2002. The International Federation of Red Cross and Red Crescent Societies noted on 16 January 2002 that scientists were on alert for heightened volcanic activity at Yasur following a M 7.2 earthquake on 3 January. The earthquake produced landslides in Vanuatu's capital, Port Vila on Efate Island, and damaged buildings and bridges in the city, but there were no deaths or serious injuries. During 5 January to at least 16 January ash fell on Tanna Island, polluting water sources. The week of 6 January the Vanuatu government restricted access to the volcano's crater citing an increased risk of an eruption since the 3 January earthquake.
The Volcanic Ash Advisory Center in Wellington notified aviators of an eruption on 25 January around 1300. A pilot reported that the ash cloud rose to ~2 km altitude and slowly drifted S. The ash cloud was not visible on satellite imagery, possibly due to heavy meteorological cloud cover.
Observations during August 2002. The European Volcanological Society posted a report from the Institut de Recherche pour le Développement (IRD) on 3 September 2002. At that time the increasing level of activity at Yasur since October 2001 and the M 6 earthquake of 29 August 2002 had prompted IRD to upgrade the hazard status to Alarm Level 3, closing access to the volcano. The earthquake was strongly felt by residents of the entire district around the volcano. This was the first time since the seismic station was installed in October 1992 that a shock of such magnitude was recorded. Elders of the Yasur district confirmed that such an earthquake had not been experienced within living memory. The installation of two new seismological monitoring stations is planned, to complement the existing alarm system installed 2 km from Yasur and the Isangel station.
Observations during November 2002. On 22 November 2002 a group of passengers from the Zegrahm Expeditions cruise ship Clipper Odyssey visited the summit area. They observed Strombolian activity from one crater and heard thunderous whooshing sounds followed by thick yellow and white smoke from another.
Observations during December 2002. John Seach visited to the volcano on 7 December 2002, approaching by 4WD vehicle across the dry bed of Lake Siwi, which drained in 2000 after a collapse of the natural dam on the N end of the ash plain. Reports from Sulphur Bay village indicated that many houses were destroyed by the flooding. Flowing water from the lake eroded a 5-m-deep section of ground at the location of the dam (figure 31).
Three fumaroles were active on the caldera wall near the parking area at the summit. The crater rim was climbed from the SE and observations made from 1700 to 1930. Yasur showed a high level of activity with up to three vents erupting simultaneously inside the main crater. Eruptions occurred every one or two seconds during the 2.5-hour stay at the summit. Most eruptions were Strombolian with glowing bombs sent up to 150 m above the crater (figure 32). Projectiles generally fell back inside the crater, but the northern-most vent occasionally sent glowing lava bombs over the N and NE crater rims. Mild Vulcanian eruptions occurred at times with ash ejected to 100 m above the crater. Bombs were ejected as either glowing orange blobs of lava or black crusted material. Eruptions were accompanied by loud explosions and ground shaking. Bombs impacting on the ash made a sound like raindrops.
Seismic counts made by the Institute of Research and Development (Noumea) showed an increase in eruptive activity at Yasur in the beginning of December 2002 with Level 3 events increasing from 10 to 40 per hour (see BGVN 27:01 for description of seismic count data). Seismic counts remained elevated until the end of January 2003 when activity reduced to pre-December 2002 levels.
MODVOLC Thermal Alerts, 2001-2002. MODIS alerts occurred only three times in 2001 but increased in frequency, size, and alert ratio during 2002 (figure 33). The alerts that occurred in 2001, on 10 March, 4 April, and 31 August, were characterized by a single alert-pixel with very low alert ratio. Ground reports for this period noted mild eruptive activity, with vigorous Strombolian activity beginning in late December 2001 (BGVN 26:11 and 27:01). From 31 January 2002 MODIS indicates quasi-continuous activity throughout the year, which was at its most intense in the two months beginning 29 August 2002 (2210 local time). This followed the M 6 volcanic earthquake at 1500. A map of alert-pixel coordinates places them consistently E of the crater, but this may be a geolocation error rather than being indicative of a new vent.
Geologic Background. Yasur has exhibited essentially continuous Strombolian and Vulcanian activity at least since Captain Cook observed ash eruptions in 1774. This style of activity may have continued for the past 800 years. Located at the SE tip of Tanna Island in Vanuatu, this pyroclastic cone has a nearly circular, 400-m-wide summit crater. The active cone is largely contained within the small Yenkahe caldera, and is the youngest of a group of Holocene volcanic centers constructed over the down-dropped NE flank of the Pleistocene Tukosmeru volcano. The Yenkahe horst is located within the Siwi ring fracture, a 4-km-wide open feature associated with eruption of the andesitic Siwi pyroclastic sequence. Active tectonism along the Yenkahe horst accompanying eruptions has raised Port Resolution harbor more than 20 m during the past century.
Information Contacts: Roberto Carniel, Università di Udine, Italy (URL: http://www.swisseduc.ch/stromboli/); Douglas Charley, Département de la Géologie, des Mines et des Ressources en eau, Vanuatu; Marco Fulle, Osservatorio Astronomico, Trieste, Italy (URL: http://www.swisseduc.ch/stromboli/); Diego Coppola and David A. Rothery, Department of Earth Sciences, The Open University, Milton Keynes, MK7 6AA, United Kingdom; John Seach, PO Box 16, Chatsworth Island, NSW 2469, Australia (URL: http://www.volcanolive.com/); Jeff and Cynthia Gneiser, Zegrahm & Eco Expeditions, 192 Nickerson Street ##200, Seattle, WA 98109, USA (URL: https://www.zegrahm.com/); International Federation of Red Cross and Red Crescent Societies, PO Box 372, CH-1211 Geneva 19, Switzerland (URL: http://www.ifrc.org/); Wellington Volcanic Ash Advisory Center (VAAC), MetService, PO Box 722, Wellington, New Zealand (URL: http://vaac.metservice.com/); Michel Lardy, Institut de Recherche pour le Développement (IRD), CRV, BP A 5 Nouméa, Nouvelle Calédonie; Société Volcanologique Européenne, C.P. 1, 1211 Geneva 17, Switzerland (URL: http://www.sveurop.org/).