Recently Published Bulletin Reports
Erebus (Antarctica) Lava lake remains active; most thermal alerts recorded since 2019
Rincon de la Vieja (Costa Rica) Frequent phreatic explosions during July-December 2023
Bezymianny (Russia) Explosion on 18 October 2023 sends ash plume 8 km high; lava flows and incandescent avalanches
Kilauea (United States) Low-level lava effusions in the lava lake at Halema’uma’u during July-December 2022
Nyamulagira (DR Congo) Lava flows and thermal activity during May-October 2023
Bagana (Papua New Guinea) Explosions, ash plumes, ashfall, and lava flows during April-September 2023
Mayon (Philippines) Lava flows, pyroclastic flows, ash emissions, and seismicity during April-September 2023
Nishinoshima (Japan) Eruption plumes and gas-and-steam plumes during May-August 2023
Krakatau (Indonesia) White gas-and-steam plumes and occasional ash plumes during May-August 2023
Villarrica (Chile) Strombolian activity, gas-and-ash emissions, and crater incandescence during April-September 2023
Merapi (Indonesia) Frequent incandescent avalanches during April-September 2023
Ebeko (Russia) Moderate explosive activity with ash plumes continued during June-November 2023
Erebus (Antarctica) — January 2024  Cite this Report
Erebus
Antarctica
77.53°S, 167.17°E; summit elev. 3794 m
All times are local (unless otherwise noted)
Lava lake remains active; most thermal alerts recorded since 2019
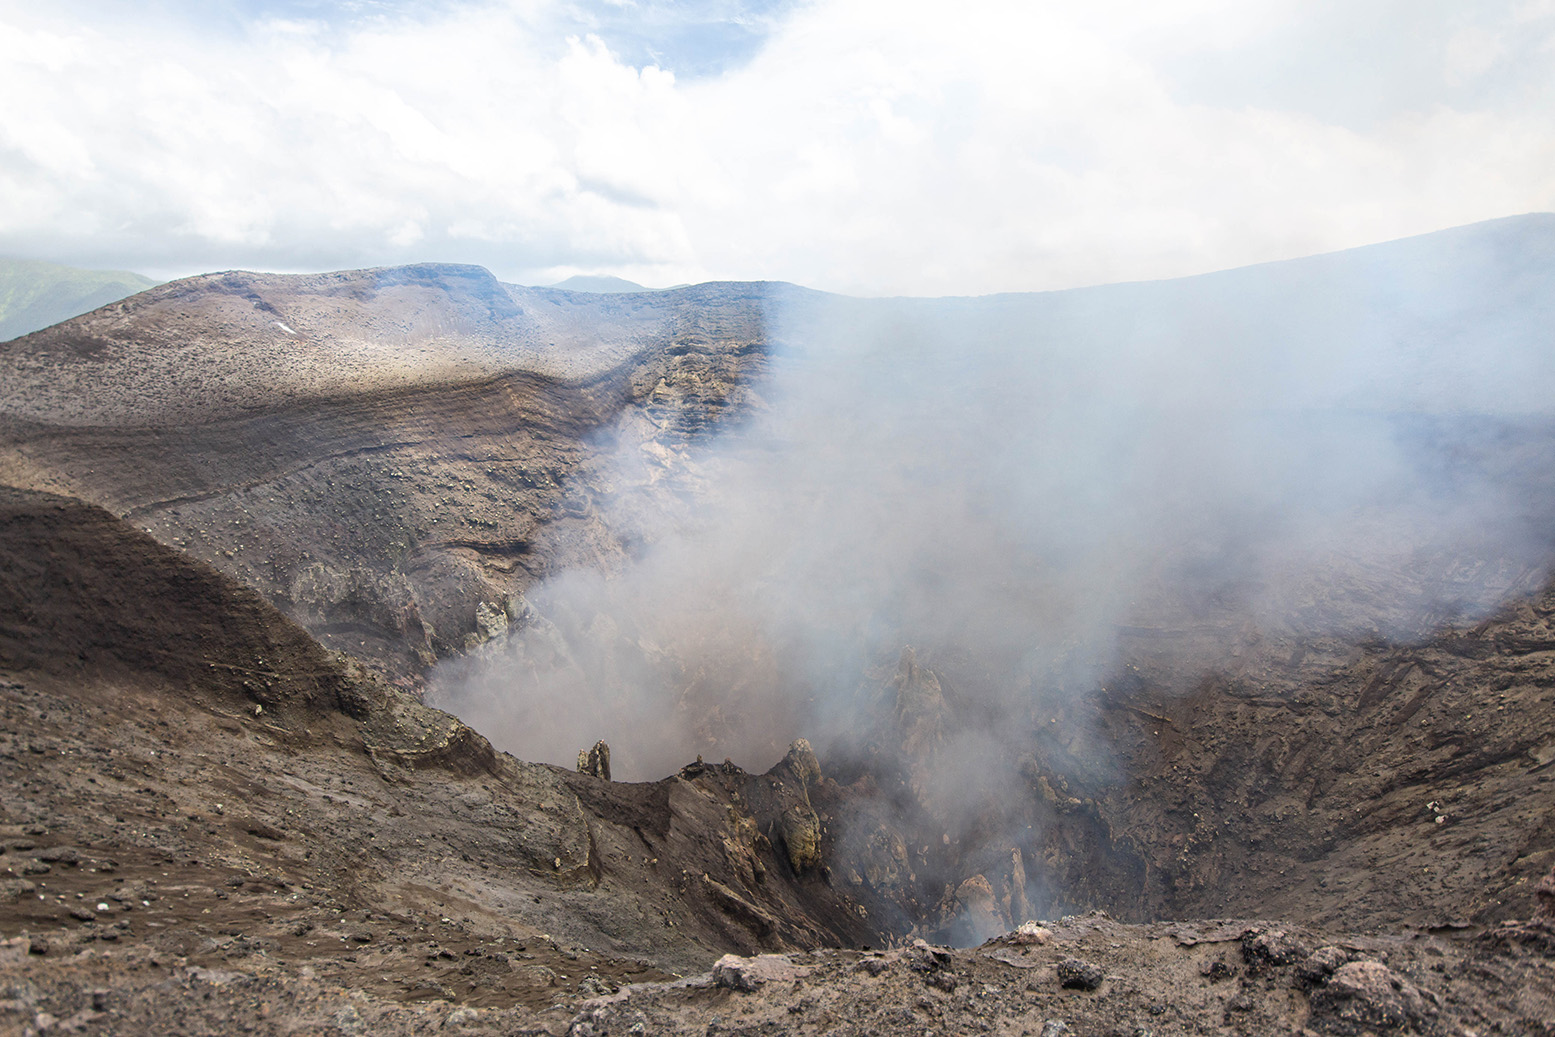
The lava lake in the summit crater of Erebus has been active since at least 1972. Located in Antarctica overlooking the McMurdo Station on Ross Island, it is the southernmost active volcano on the planet. Because of the remote location, activity is primarily monitored by satellites. This report covers activity during 2023.
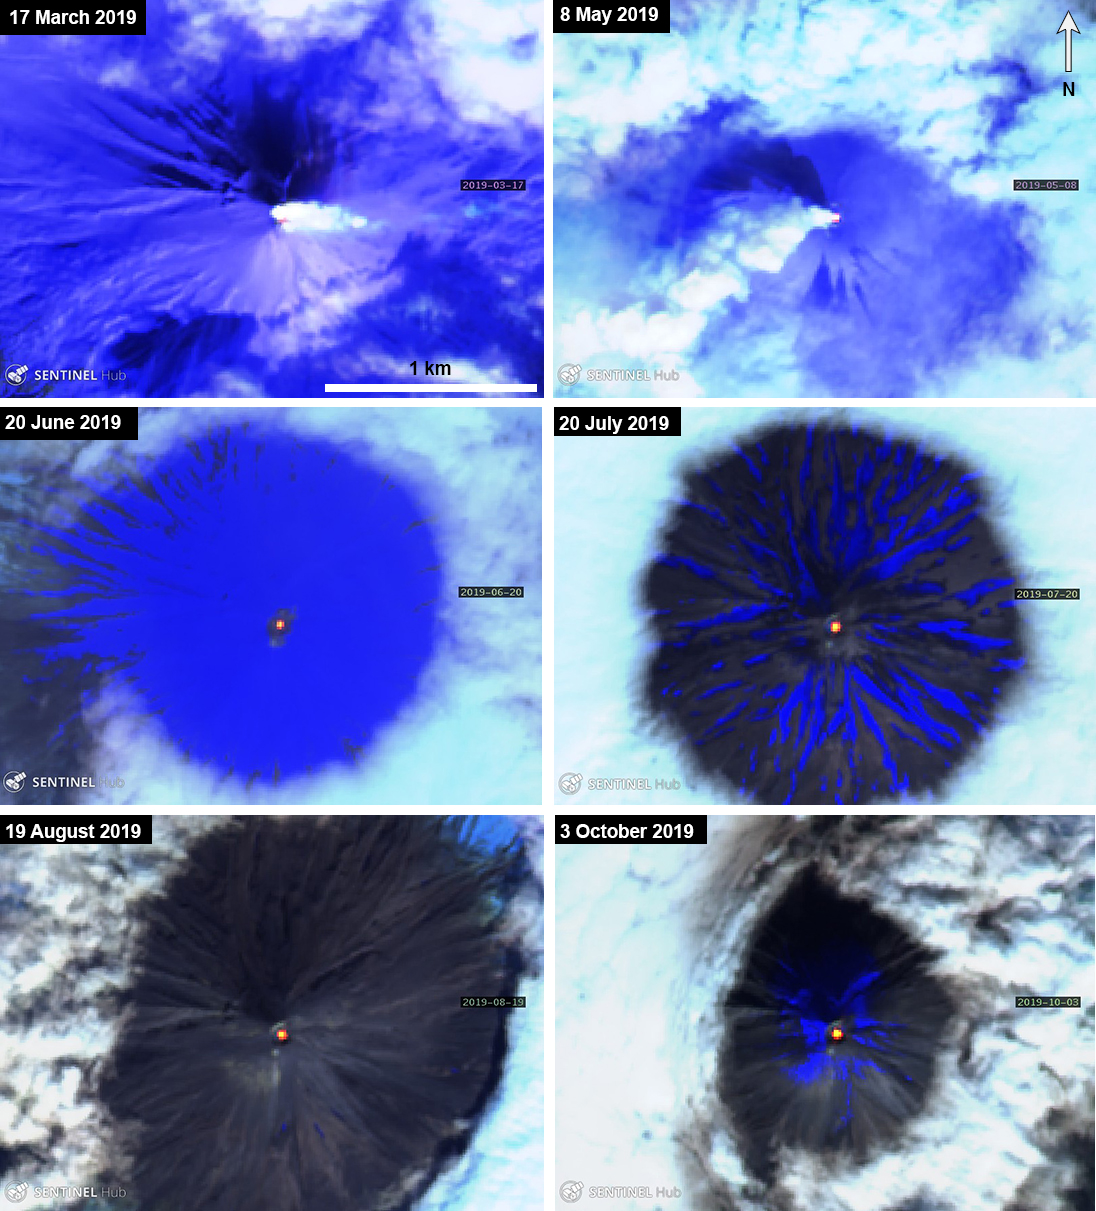
The number of thermal alerts recorded by the Hawai'i Institute of Geophysics and Planetology’s MODVOLC Thermal Alerts System increased considerably in 2023 compared to the years 2020-2022 (table 9). In contrast to previous years, the MODIS instruments aboard the Aqua and Terra satellites captured data from Erebus every month during 2023. Consistent with previous years, the lowest number of anomalous pixels were recorded in January, November, and December.
Table 9. Number of monthly MODIS-MODVOLC thermal alert pixels recorded at Erebus during 2017-2023. See BGVN 42:06 for data from 2000 through 2016. The table was compiled using data provided by the HIGP – MODVOLC Thermal Alerts System.
| Year |
Jan |
Feb |
Mar |
Apr |
May |
Jun |
Jul |
Aug |
Sep |
Oct |
Nov |
Dec |
SUM |
| 2017 |
0 |
21 |
9 |
0 |
0 |
1 |
11 |
61 |
76 |
52 |
0 |
3 |
234 |
| 2018 |
0 |
21 |
58 |
182 |
55 |
17 |
137 |
172 |
103 |
29 |
0 |
0 |
774 |
| 2019 |
2 |
21 |
162 |
151 |
55 |
56 |
75 |
53 |
29 |
19 |
1 |
0 |
624 |
| 2020 |
0 |
2 |
16 |
18 |
4 |
4 |
1 |
3 |
18 |
3 |
1 |
6 |
76 |
| 2021 |
0 |
9 |
1 |
0 |
2 |
56 |
46 |
47 |
35 |
52 |
5 |
3 |
256 |
| 2022 |
1 |
13 |
55 |
22 |
15 |
32 |
39 |
19 |
31 |
11 |
0 |
0 |
238 |
| 2023 |
2 |
33 |
49 |
82 |
41 |
32 |
70 |
64 |
42 |
17 |
5 |
11 |
448 |
Sentinel-2 infrared images showed one or two prominent heat sources within the summit crater, accompanied by adjacent smaller sources, similar to recent years (see BGVN 46:01, 47:02, and 48:01). A unique image was obtained on 25 November 2023 by the OLI-2 (Operational Land Imager-2) on Landsat 9, showing the upper part of the volcano surrounded by clouds (figure 32).
Geologic Background. Mount Erebus, the world's southernmost historically active volcano, overlooks the McMurdo research station on Ross Island. It is the largest of three major volcanoes forming the crudely triangular Ross Island. The summit of the dominantly phonolitic volcano has been modified by one or two generations of caldera formation. A summit plateau at about 3,200 m elevation marks the rim of the youngest caldera, which formed during the late-Pleistocene and within which the modern cone was constructed. An elliptical 500 x 600 m wide, 110-m-deep crater truncates the summit and contains an active lava lake within a 250-m-wide, 100-m-deep inner crater; other lava lakes are sometimes present. The glacier-covered volcano was erupting when first sighted by Captain James Ross in 1841. Continuous lava-lake activity with minor explosions, punctuated by occasional larger Strombolian explosions that eject bombs onto the crater rim, has been documented since 1972, but has probably been occurring for much of the volcano's recent history.
Information Contacts: Hawai'i Institute of Geophysics and Planetology (HIGP) - MODVOLC Thermal Alerts System, School of Ocean and Earth Science and Technology (SOEST), Univ. of Hawai'i, 2525 Correa Road, Honolulu, HI 96822, USA (URL: http://modis.higp.hawaii.edu/); Copernicus Browser, Copernicus Data Space Ecosystem, European Space Agency (URL: https://dataspace.copernicus.eu/browser/); NASA Earth Observatory, EOS Project Science Office, NASA Goddard Space Flight Center, Goddard, Maryland, USA (URL: https://earthobservatory.nasa.gov/images/152134/erebus-breaks-through).
Rincon de la Vieja (Costa Rica) — January 2024 Cite this Report
Rincon de la Vieja
Costa Rica
10.83°N, 85.324°W; summit elev. 1916 m
All times are local (unless otherwise noted)
Frequent phreatic explosions during July-December 2023
Rincón de la Vieja is a volcanic complex in Costa Rica with a hot convecting acid lake that exhibits frequent weak phreatic explosions, gas-and-steam emissions, and occasional elevated sulfur dioxide levels (BGVN 45:10, 46:03, 46:11). The current eruption period began June 2021. This report covers activity during July-December 2023 and is based on weekly bulletins and occasional daily reports from the Observatorio Vulcanologico Sismologica de Costa Rica-Universidad Nacional (OVSICORI-UNA).
Numerous weak phreatic explosions continued during July-December 2023, along with gas-and-steam emissions and plumes that rose as high as 3 km above the crater rim. Many weekly OVSICORI-UNA bulletins included the previous week's number of explosions and emissions (table 9). For many explosions, the time of explosion was given (table 10). Frequent seismic activity (long-period earthquakes, volcano-tectonic earthquakes, and tremor) accompanied the phreatic activity.
Table 9. Number of reported weekly phreatic explosions and gas-and-steam emissions at Rincón de la Vieja, July-December 2023. Counts are reported for the week before the Weekly Bulletin date; not all reports included these data. Courtesy of OVSICORI-UNA.
| OVSICORI Weekly Bulletin |
Number of explosions |
Number of emissions |
| 28 Jul 2023 |
6 |
14 |
| 4 Aug 2023 |
10 |
12 |
| 1 Sep 2023 |
13 |
11 |
| 22 Sep 2023 |
12 |
13 |
| 29 Sep 2023 |
6 |
11 |
| 6 Oct 2023 |
12 |
5 |
| 13 Oct 2023 |
7 |
9 |
| 20 Oct 2023 |
1 |
15 |
| 27 Oct 2023 |
3 |
23 |
| 3 Nov 2023 |
3 |
10 |
| 17 Nov 2023 |
0 |
Some |
| 24 Nov 2023 |
0 |
14 |
| 8 Dec 2023 |
4 |
16 |
| 22 Dec 2023 |
8 |
18 |
Table 10. Summary of activity at Rincón de la Vieja during July-December 2023. Weak phreatic explosions and gas emissions are noted where the time of explosion was indicated in the weekly or daily bulletins. Height of plumes or emissions are distance above the crater rim. Courtesy of OVSICORI-UNA.
| Date |
Time |
Description of Activity |
| 1 Jul 2023 |
0156 |
Explosion. |
| 2 Jul 2023 |
0305 |
Explosion. |
| 4 Jul 2023 |
0229, 0635 |
Event at 0635 produced a gas-and-steam plume that rose 700 m and drifted W; seen by residents in Liberia (21 km SW). |
| 9 Jul 2023 |
1843 |
Explosion. |
| 21 Jul 2023 |
0705 |
Explosion. |
| 26 Jul 2023 |
1807 |
Explosion. |
| 28 Jul 2023 |
0802 |
Explosion generated a gas-and-steam plume that rose 500 m. |
| 30 Jul 2023 |
1250 |
Explosion. |
| 31 Jul 2023 |
2136 |
Explosion. |
| 11 Aug 2023 |
0828 |
Explosion. |
| 18 Aug 2023 |
1304 |
Explosion. |
| 21 Aug 2023 |
1224 |
Explosion generated gas-and-steam plumes rose 500-600 m. |
| 22 Aug 2023 |
0749 |
Explosion generated gas-and-steam plumes rose 500-600 m. |
| 24 Aug 2023 |
1900 |
Explosion. |
| 25 Aug 2023 |
0828 |
Event produced a steam-and-gas plume that rose 3 km and drifted NW. |
| 27-28 Aug 2023 |
0813 |
Four small events; the event at 0813 on 28 August lasted two minutes and generated a steam-and-gas plume that rose 2.5 km. |
| 1 Sep 2023 |
1526 |
Explosion generated plume that rose 2 km and ejected material onto the flanks. |
| 2-3 Sep 2023 |
- |
Small explosions detected in infrasound data. |
| 4 Sep 2023 |
1251 |
Gas-and-steam plume rose 1 km and drifted W. |
| 7 Nov 2023 |
1113 |
Explosion. |
| 8 Nov 2023 |
0722 |
Explosion. |
| 12 Nov 2023 |
0136 |
Small gas emissions. |
| 14 Nov 2023 |
0415 |
Small gas emissions. |
According to OVSICORI-UNA, during July-October the average weekly sulfur dioxide (SO2) flux ranged from 68 to 240 tonnes/day. However, in mid-November the flux increased to as high as 334 tonnes/day, the highest value measured in recent years. The high SO2 flux in mid-November was also detected by the TROPOMI instrument on the Sentinel-5P satellite (figure 43).
Geologic Background. Rincón de la Vieja, the largest volcano in NW Costa Rica, is a remote volcanic complex in the Guanacaste Range. The volcano consists of an elongated, arcuate NW-SE-trending ridge constructed within the 15-km-wide early Pleistocene Guachipelín caldera, whose rim is exposed on the south side. Sometimes known as the "Colossus of Guanacaste," it has an estimated volume of 130 km3 and contains at least nine major eruptive centers. Activity has migrated to the SE, where the youngest-looking craters are located. The twin cone of Santa María volcano, the highest peak of the complex, is located at the eastern end of a smaller, 5-km-wide caldera and has a 500-m-wide crater. A Plinian eruption producing the 0.25 km3 Río Blanca tephra about 3,500 years ago was the last major magmatic eruption. All subsequent eruptions, including numerous historical eruptions possibly dating back to the 16th century, have been from the prominent active crater containing a 500-m-wide acid lake located ENE of Von Seebach crater.
Information Contacts: Observatorio Vulcanológico Sismológica de Costa Rica-Universidad Nacional (OVSICORI-UNA), Apartado 86-3000, Heredia, Costa Rica (URL: http://www.ovsicori.una.ac.cr/); NASA Global Sulfur Dioxide Monitoring Page, Atmospheric Chemistry and Dynamics Laboratory, NASA Goddard Space Flight Center (NASA/GSFC), 8800 Greenbelt Road, Goddard MD 20771, USA (URL: https://so2.gsfc.nasa.gov/).
Bezymianny (Russia) — November 2023 Cite this Report
Bezymianny
Russia
55.972°N, 160.595°E; summit elev. 2882 m
All times are local (unless otherwise noted)
Explosion on 18 October 2023 sends ash plume 8 km high; lava flows and incandescent avalanches
Bezymianny, located on Russia’s Kamchatka Peninsula, has had eruptions since 1955 characterized by dome growth, explosions, pyroclastic flows, ash plumes, and ashfall. Activity during November 2022-April 2023 included gas-and-steam emissions, lava dome collapses generating avalanches, and persistent thermal activity. Similar eruptive activity continued from May through October 2023, described here based on information from weekly and daily reports of the Kamchatka Volcano Eruptions Response Team (KVERT), notices from Tokyo VAAC (Volcanic Ash Advisory Center), and from satellite data.
Overall activity decreased after the strong period of activity in late March through April 2023, which included ash explosions during 29 March and 7-8 April 2023 that sent plumes as high as 10-12 km altitude, along with dome growth and lava flows (BGVN 48:05). This reduced activity can be seen in the MIROVA thermal detection system graph (figure 56), which was consistent with data from the MODVOLC thermal detection system and with Sentinel-2 satellite images that showed persistent hotspots in the summit crater when conditions allowed observations. A renewed period of strong activity began in mid-October 2023.
Activity increased significantly on 17 October 2023 when large collapses began during 0700-0830 on the E flanks of the lava dome and continued to after 0930 the next day (figure 57). Ash plumes rose to an altitude of 4.5-5 km, extending 220 km NNE by 18 October. A large explosion at 1630 on 18 October produced an ash plume that rose to an altitude of 11 km (8 km above the summit) and drifted NNE and then NW, extending 900 km NW within two days at an altitude of 8 km. Minor ashfall was noted in Kozyrevsk (45 km WNW). At 0820 on 20 October an ash plume was identified in satellite images drifting 100 km ENE at altitudes of 4-4.5 km.
Lava flows and hot avalanches from the dome down the SE flank continued over the next few days, including 23 October when clear conditions allowed good observations (figures 58 and 59). A large thermal anomaly was observed over the volcano through 24 October, and in the summit crater on 30 October (figure 60). Strong fumarolic activity continued, with numerous avalanches and occasional incandescence. By the last week of October, volcanic activity had decreased to a level consistent with that earlier in the reporting period.
Aviation warnings were frequently updated during 17-20 October. KVERT issued a Volcano Observatory Notice for Aviation (VONA) on 17 October at 1419 and 1727 (0219 and 0527 UTC) raising the Aviation Color Code (ACC) from Yellow to Orange (second highest level). The next day, KVERT issued a VONA at 1705 (0505 UTC) raising the ACC to Red (highest level) but lowered it back to Orange at 2117 (0917 UTC). After another decrease to Yellow and back to Orange, the ACC was reduced to Yellow on 20 October at 1204 (0004 UTC). In addition, the Tokyo VAAC issued a series of Volcanic Ash Advisories beginning on 16 October and continuing through 30 October.
Geologic Background. The modern Bezymianny, much smaller than its massive neighbors Kamen and Kliuchevskoi on the Kamchatka Peninsula, was formed about 4,700 years ago over a late-Pleistocene lava-dome complex and an edifice built about 11,000-7,000 years ago. Three periods of intensified activity have occurred during the past 3,000 years. The latest period, which was preceded by a 1,000-year quiescence, began with the dramatic 1955-56 eruption. This eruption, similar to that of St. Helens in 1980, produced a large open crater that was formed by collapse of the summit and an associated lateral blast. Subsequent episodic but ongoing lava-dome growth, accompanied by intermittent explosive activity and pyroclastic flows, has largely filled the 1956 crater.
Information Contacts: Kamchatka Volcanic Eruptions Response Team (KVERT), Far Eastern Branch, Russian Academy of Sciences, 9 Piip Blvd., Petropavlovsk-Kamchatsky, 683006, Russia (URL: http://www.kscnet.ru/ivs/kvert/); Kamchatka Volcanological Station, Kamchatka Branch of Geophysical Survey, (KB GS RAS), Klyuchi, Kamchatka Krai, Russia (URL: http://volkstat.ru/); Tokyo Volcanic Ash Advisory Center (VAAC), 1-3-4 Otemachi, Chiyoda-ku, Tokyo 100-8122, Japan (URL: http://ds.data.jma.go.jp/svd/vaac/data/); Hawai'i Institute of Geophysics and Planetology (HIGP) - MODVOLC Thermal Alerts System, School of Ocean and Earth Science and Technology (SOEST), Univ. of Hawai'i, 2525 Correa Road, Honolulu, HI 96822, USA (URL: http://modis.higp.hawaii.edu/); MIROVA (Middle InfraRed Observation of Volcanic Activity), a collaborative project between the Universities of Turin and Florence (Italy) supported by the Centre for Volcanic Risk of the Italian Civil Protection Department (URL: http://www.mirovaweb.it/); Copernicus Browser, Copernicus Data Space Ecosystem, European Space Agency (URL: https://dataspace.copernicus.eu/browser/).chr
Kilauea (United States) — January 2023 Cite this Report
Kilauea
United States
19.421°N, 155.287°W; summit elev. 1222 m
All times are local (unless otherwise noted)
Low-level lava effusions in the lava lake at Halema’uma’u during July-December 2022
Kīlauea is the southeastern-most volcano in Hawaii and overlaps the E flank of the Mauna Loa volcano. Its East Rift Zone (ERZ) has been intermittently active for at least 2,000 years. An extended eruption period began in January 1983 and was characterized by open lava lakes and lava flows from the summit caldera and the East Rift Zone. During May 2018 magma migrated into the Lower East Rift Zone (LERZ) and opened 24 fissures along a 6-km-long NE-trending fracture zone that produced lava flows traveling in multiple directions. As lava emerged from the fissures, the lava lake at Halema'uma'u drained and explosions sent ash plumes to several kilometers altitude (BGVN 43:10).
The current eruption period started during September 2021 and has recently been characterized by lava effusions, spatter, and sulfur dioxide emissions in the active Halema’uma’u lava lake (BGVN 47:08). Lava effusions, some spatter, and sulfur dioxide emissions have continued during this reporting period of July through December 2022 using daily reports, volcanic activity notices, and abundant photo, map, and video data from the US Geological Survey's (USGS) Hawaiian Volcano Observatory (HVO).
Summary of activity during July-December 2022. Low-level effusions have continued at the western vent of the Halema’uma’u crater during July through early December 2022. Occasional weak ooze-outs (also called lava break outs) would occur along the margins of the crater floor. The overall level of the active lava lake throughout the reporting period gradually increased due to infilling, however it stagnated in mid-September (table 13). During September through November, activity began to decline, though lava effusions persisted at the western vent. By 9 December, the active part of the lava lake had completely crusted over, and incandescence was no longer visible.
Table 13. Summary of measurements taken during overflights at Kīlauea that show a gradual increase in the active lava lake level and the volume of lava effused since 29 September 2021. Lower activity was reported during September-October. Data collected during July-December 2022. Courtesy of HVO.
| Date: |
Level of the active lava lake (m): |
Cumulative volume of lava effused (million cubic meters): |
| 7 Jul 2022 |
130 |
95 |
| 19 Jul 2022 |
133 |
98 |
| 4 Aug 2022 |
136 |
102 |
| 16 Aug 2022 |
137 |
104 |
| 12 Sep 2022 |
143 |
111 |
| 5 Oct 2022 |
143 |
111 |
| 28 Oct 2022 |
143 |
111 |
Activity during July 2022. Lava effusions were reported from the western vent in the Halema’uma’u crater, along with occasional weak ooze-outs along the margins of the crater floor. The height of the lava lake was variable due to deflation-inflation tilt events; for example, the lake level dropped approximately 3-4 m during a summit deflation-inflation event reported on 1 July. Webcam images taken during the night of 6-12 July showed intermittent low-level spattering at the western vent that rose less than 10 m above the vent (figure 519). Measurements made during an overflight on 7 July indicated that the crater floor was infilled about 130 m and that 95 million cubic meters of lava had been effused since 29 September 2021. A single, relatively small lava ooze-out was active to the S of the lava lake. Around midnight on 8 July there were two brief periods of lava overflow onto the lake margins. On 9 July lava ooze-outs were reported near the SE and NE edges of the crater floor and during 10-11 July they occurred near the E, NE, and NW edges. On 16 July crater incandescence was reported, though the ooze-outs and spattering were not visible. On 18 July overnight webcam images showed incandescence in the western vent complex and two ooze-outs were reported around 0000 and 0200 on 19 July. By 0900 there were active ooze-outs along the SW edge of the crater floor. Measurements made from an overflight on 19 July indicated that the crater floor was infilled about 133 m and 98 million cubic meters of lava had erupted since 29 September 2021 (figure 520). On 20 July around 1600 active ooze-outs were visible along the N edge of the crater, which continued through the next day. Extensive ooze-outs occurred along the W margin during 24 July until 1900; on 26 July minor ooze-outs were noted along the N margin. Minor spattering was visible on 29 July along the E margin of the lake. The sulfur dioxide emission rates ranged 650-2,800 tons per day (t/d), the higher of which was measured on 8 July (figure 519).
Activity during August 2022. The eruption continued in the Halema’uma’u crater at the western vent. According to HVO the lava in the active lake remained at the level of the bounding levees. Occasional minor ooze-outs were observed along the margins of the crater floor. Strong nighttime crater incandescence was visible after midnight on 6 August over the western vent cone. During 6-7 August scattered small lava lobes were active along the crater floor and incandescence persisted above the western vent through 9 August. During 7-9 August HVO reported a single lava effusion source was active along the NW margin of the crater floor. Measurements from an overflight on 4 August indicated that the crater floor was infilled about 136 m total and that 102 million cubic meters of lava had been erupted since the start of the eruption. Lava breakouts were reported along the N, NE, E, S, and W margins of the crater during 10-16 August. Another overflight survey conducted on 16 August indicated that the crater floor infilled about 137 m and 104 million cubic meters of lava had been erupted since September 2021. Measured sulfur dioxide emissions rates ranged 1,150-2,450 t/d, the higher of which occurred on 8 August.
Activity during September 2022. During September, lava effusion continued from the western vent into the active lava lake and onto the crater floor. Intermittent minor ooze-outs were reported through the month. A small ooze-out was visible on the W crater floor margin at 0220 on 2 September, which showed decreasing surface activity throughout the day, but remained active through 3 September. On 3 September around 1900 a lava outbreak occurred along the NW margin of the crater floor but had stopped by the evening of 4 September. Field crews monitoring the summit lava lake on 9 September observed spattering on the NE margin of the lake that rose no higher than 10 m, before falling back onto the lava lake crust (figure 521). Overflight measurements on 12 September indicated that the crater floor was infilled a total of 143 m and 111 million cubic meters of lava had been erupted since September 2021. Extensive breakouts in the W and N part of the crater floor were reported at 1600 on 20 September and continued into 26 September. The active part of the lava lake dropped by 10 m while other parts of the crater floor dropped by several meters. Summit tiltmeters recorded a summit seismic swarm of more than 80 earthquakes during 1500-1800 on 21 September, which occurred about 1.5 km below Halema’uma’u; a majority of these were less than Mw 2. By 22 September the active part of the lava lake was infilled about 2 m. On 23 September the western vent areas exhibited several small spatter cones with incandescent openings, along with weak, sporadic spattering (figure 522). The sulfur dioxide emission rate ranged from 930 t/d to 2,000 t/d, the higher of which was measured on 6 September.
Activity during October 2022. Activity during October declined slightly compared to previous months, though lava effusions persisted from the western vent into the active lava lake and onto the crater floor during October (figure 523). Slight variations in the lava lake were noted throughout the month. HVO reported that around 0600 on 3 October the level of the lava lake has lowered slightly. Overflight measurements taken on 5 October indicated that the crater floor was infilled a total of about 143 m and that 111 million cubic meters of lava had been effused since September 2021. During 6-7 October the lake gradually rose 0.5 m. Sulfur dioxide measurements made on 22 October had an emission rate of 700 t/d. Another overflight taken on 28 October showed that there was little to no change in the elevation of the crater floor: the crater floor was infilled a total of 143 m and 111 million cubic meters of lava had erupted since the start of the eruption.
Activity during November 2022. Activity remained low during November, though HVO reported that lava from the western vent continued to effuse into the active lava lake and onto the crater floor throughout the month. The rate of sulfur dioxide emissions during November ranged from 300-600 t/d, the higher amount of which occurred on 9 November.
Activity during December 2022. Similar low activity was reported during December, with lava effusing from the western vent into the active lava lake and onto the crater floor. During 4-5 December the active part of the lava lake was slightly variable in elevation and fluctuated within 1 m. On 9 December HVO reported that lava was no longer erupting from the western vent in the Halema’uma’u crater and that sulfur dioxide emissions had returned to near pre-eruption background levels; during 10-11 December, the lava lake had completely crusted over, and no incandescence was visible (figure 524). Time lapse camera images covering the 4-10 December showed that the crater floor showed weak deflation and no inflation. Some passive events of crustal overturning were reported during 14-15 December, which brought fresh incandescent lava to the lake surface. The sulfur dioxide emission rate was approximately 200 t/d on 14 December. A smaller overturn event on 17 December and another that occurred around 0000 and into the morning of 20 December were also detected. A small seismic swarm was later detected on 30 December.
Geologic Background. Kilauea overlaps the E flank of the massive Mauna Loa shield volcano in the island of Hawaii. Eruptions are prominent in Polynesian legends; written documentation since 1820 records frequent summit and flank lava flow eruptions interspersed with periods of long-term lava lake activity at Halemaumau crater in the summit caldera until 1924. The 3 x 5 km caldera was formed in several stages about 1,500 years ago and during the 18th century; eruptions have also originated from the lengthy East and Southwest rift zones, which extend to the ocean in both directions. About 90% of the surface of the basaltic shield volcano is formed of lava flows less than about 1,100 years old; 70% of the surface is younger than 600 years. The long-term eruption from the East rift zone between 1983 and 2018 produced lava flows covering more than 100 km2, destroyed hundreds of houses, and added new coastline.
Information Contacts: Hawaiian Volcano Observatory (HVO), U.S. Geological Survey, PO Box 51, Hawai'i National Park, HI 96718, USA (URL: http://hvo.wr.usgs.gov/).
Nyamulagira (DR Congo) — November 2023 Cite this Report
Nyamulagira
DR Congo
1.408°S, 29.2°E; summit elev. 3058 m
All times are local (unless otherwise noted)
Lava flows and thermal activity during May-October 2023
Nyamulagira (also known as Nyamuragira) is a shield volcano in the Democratic Republic of Congo with the summit truncated by a small 2 x 2.3 km caldera with walls up to about 100 m high. Documented eruptions have occurred within the summit caldera, as well as from numerous flank fissures and cinder cones. The current eruption period began in April 2018 and has more recently been characterized by summit crater lava flows and thermal activity (BGVN 48:05). This report describes lava flows and variable thermal activity during May through October 2023, based on information from the Observatoire Volcanologique de Goma (OVG) and various satellite data.
Lava lake activity continued during May. The MIROVA (Middle InfraRed Observation of Volcanic Activity) system recorded moderate-to-strong thermal activity throughout the reporting period; activity was more intense during May and October and relatively weaker from June through September (figure 95). The MODVOLC thermal algorithm, detected a total of 209 thermal alerts. There were 143 hotspots detected during May, eight during June, nine during September, and 49 during October. This activity was also reflected in infrared satellite images, where a lava flow was visible in the NW part of the crater on 7 May and strong activity was seen in the center of the crater on 4 October (figure 96). Another infrared satellite image taken on 12 May showed still active lava flows along the NW margin of the crater. According to OVG lava effusions were active during 7-29 May and moved to the N and NW parts of the crater beginning on 9 May. Strong summit crater incandescence was visible from Goma (27 km S) during the nights of 17, 19, and 20 May (figure 97). On 17 May there was an increase in eruptive activity, which peaked at 0100 on 20 May. Notable sulfur dioxide plumes drifted NW and W during 19-20 May (figure 98). Drone footage acquired in partnership with the USGS (United States Geological Survey) on 20 May captured images of narrow lava flows that traveled about 100 m down the W flank (figure 99). Data from the Rumangabo seismic station indicated a decreasing trend in activity during 17-21 May. Although weather clouds prevented clear views of the summit, a strong thermal signature on the NW flank was visible in an infrared satellite image on 22 May, based on an infrared satellite image. On 28 May the lava flows on the upper W flank began to cool and solidify. By 29 May seismicity returned to levels similar to those recorded before the 17 May increase. Lava effusion continued but was confined to the summit crater; periodic crater incandescence was observed.
Low-level activity was noted during June through October. On 1 June OVG reported that seismicity remained at lower levels and that crater incandescence had been absent for three days, though infrared satellite imagery showed continued lava effusion in the summit crater. The lava flows on the flanks covered an estimated 0.6 km2. Satellite imagery continued to show thermal activity confined to the lava lake through October (figure 96), although no lava flows or significant sulfur dioxide emissions were reported.
Geologic Background. Africa's most active volcano, Nyamulagira (also known as Nyamuragira), is a massive high-potassium basaltic shield about 25 km N of Lake Kivu and 13 km NNW of the steep-sided Nyiragongo volcano. The summit is truncated by a small 2 x 2.3 km caldera that has walls up to about 100 m high. Documented eruptions have occurred within the summit caldera, as well as from the numerous flank fissures and cinder cones. A lava lake in the summit crater, active since at least 1921, drained in 1938, at the time of a major flank eruption. Recent lava flows extend down the flanks more than 30 km from the summit as far as Lake Kivu; extensive lava flows from this volcano have covered 1,500 km2 of the western branch of the East African Rift.
Information Contacts: Observatoire Volcanologique de Goma (OVG), Departement de Geophysique, Centre de Recherche en Sciences Naturelles, Lwiro, D.S. Bukavu, DR Congo; Hawai'i Institute of Geophysics and Planetology (HIGP) - MODVOLC Thermal Alerts System, School of Ocean and Earth Science and Technology (SOEST), Univ. of Hawai'i, 2525 Correa Road, Honolulu, HI 96822, USA (URL: http://modis.higp.hawaii.edu/); MIROVA (Middle InfraRed Observation of Volcanic Activity), a collaborative project between the Universities of Turin and Florence (Italy) supported by the Centre for Volcanic Risk of the Italian Civil Protection Department (URL: http://www.mirovaweb.it/); NASA Global Sulfur Dioxide Monitoring Page, Atmospheric Chemistry and Dynamics Laboratory, NASA Goddard Space Flight Center (NASA/GSFC), 8800 Greenbelt Road, Goddard, Maryland, USA (URL: https://so2.gsfc.nasa.gov/); Copernicus Browser, Copernicus Data Space Ecosystem, European Space Agency (URL: https://dataspace.copernicus.eu/browser/); Charles Balagizi, Goma Volcano Observatory, Departement de Geophysique, Centre de Recherche en Sciences Naturelles, Lwiro, D.S. Bukavu, DR Congo.
Bagana (Papua New Guinea) — October 2023 Cite this Report
Bagana
Papua New Guinea
6.137°S, 155.196°E; summit elev. 1855 m
All times are local (unless otherwise noted)
Explosions, ash plumes, ashfall, and lava flows during April-September 2023
The remote volcano of Bagana is located in central Bougainville Island, Papua New Guinea. Recorded eruptions date back to 1842 and activity has consisted of effusive activity that has built a small lava dome in the summit crater and occasional explosions that produced pyroclastic flows. The most recent eruption has been ongoing since February 2000 and has produced occasional explosions, ash plumes, and lava flows. More recently, activity has been characterized by ongoing effusive activity and ash emissions (BGVN 48:04). This report updates activity from April through September 2023 that has consisted of explosions, ash plumes, ashfall, and lava flows, using information from the Darwin Volcanic Ash Advisory Center (VAAC) and satellite data.
An explosive eruption was reported on 7 July that generated a large gas-and-ash plume to high altitudes and caused significant ashfall in local communities; the eruption plume had reached upper tropospheric (16-18 km altitude) altitudes by 2200, according to satellite images. Sulfur dioxide plumes were detected in satellite images on 8 July and indicated that the plume was likely a mixture of gas, ice, and ash. A report issued by the Autonomous Bougainville Government (ABG) (Torokina District, Education Section) on 10 July noted that significant ash began falling during 2000-2100 on 7 July and covered most areas in the Vuakovi, Gotana (9 km SW), Koromaketo, Laruma (25 km W) and Atsilima (27 km NW) villages. Pyroclastic flows also occurred, according to ground-based reports; small deposits confined to one drainage were inspected by RVO during an overflight on 17 July and were confirmed to be from the 7 July event. Ashfall continued until 10 July and covered vegetation, which destroyed bushes and gardens and contaminated rivers and streams.
RVO reported another eruption on 14 July. The Darwin VAAC stated that an explosive event started around 0830 on 15 July and produced an ash plume that rose to 16.5 km altitude by 1000 and drifted N, according to satellite images. The plume continued to drift N and remained visible through 1900, and by 2150 it had dissipated.
Ashfall likely from both the 7 and 15 July events impacted about 8,111 people in Torokina (20 km SW), including Tsito/Vuakovi, Gotana, Koromaketo, Kenaia, Longkogari, Kenbaki, Piva (13 km SW), and Atsinima, and in the Tsitovi district, according to ABG. Significant ashfall was also reported in Ruruvu (22 km N) in the Wakunai District of Central Bougainville, though the thickness of these deposits could not be confirmed. An evacuation was called for the villages in Wakunai, where heavy ashfall had contaminated water sources; the communities of Ruruvu, Togarau, Kakarapaia, Karauturi, Atao, and Kuritaturi were asked to evacuate to a disaster center at the Wakunai District Station, and communities in Torokina were asked to evacuate to the Piva District station. According to a news article, more than 7,000 people needed temporary accommodations, with about 1,000 people in evacuation shelters. Ashfall had deposited over a broad area, contaminating water supplies, affecting crops, and collapsing some roofs and houses in rural areas. Schools were temporarily shut down. Intermittent ash emissions continued through the end of July and drifted NNW, NW, and SW. Fine ashfall was reported on the coast of Torokina, and ash plumes also drifted toward Laruma and Atsilima.
A small explosive eruption occurred at 2130 on 28 July that ejected material from the crater vents, according to reports from Torokina, in addition to a lava flow that contained two lobes. A second explosion was detected at 2157. Incandescence from the lava flow was visible from Piva as it descended the W flank around 2000 on 29 July (figure 47). The Darwin VAAC reported that a strong thermal anomaly was visible in satellite images during 30-31 July and that ash emissions rose to 2.4 km altitude and drifted WSW on 30 July. A ground report from RVO described localized emissions at 0900 on 31 July.
The Darwin VAAC reported that ash plumes were identified in satellite imagery at 0800 and 1220 on 12 August and rose to 2.1 km and 3 km altitude and drifted NW and W, respectively. A news report stated that aid was sent to more than 6,300 people that were adversely affected by the eruption. Photos taken during 17-19 August showed ash emissions rising no higher than 1 km above the summit and drifting SE. A small explosion generated an ash plume during the morning of 19 August. Deposits from small pyroclastic flows were also captured in the photos. Satellite images captured lava flows and pyroclastic flow deposits. Two temporary seismic stations were installed near Bagana on 17 August at distances of 7 km WSW (Vakovi station) and 11 km SW (Kepox station). The Kepox station immediately started to record continuous, low-frequency background seismicity.
Satellite data. Little to no thermal activity was detected during April through mid-July 2023; only one anomaly was recorded during early April and one during early June, according to MIROVA (Middle InfraRed Observation of Volcanic Activity) data (figure 48). Thermal activity increased in both power and frequency during mid-July through September, although there were still some short gaps in detected activity. MODVOLC also detected increased thermal activity during August; thermal hotspots were detected a total of five times on 19, 20, and 27 August. Weak thermal anomalies were also captured in infrared satellite images on clear weather days throughout the reporting period on 7, 12, and 17 April, 27 May, 1, 6, 16, and 31 July, and 19 September (figure 48); a strong thermal anomaly was visible on 31 July. Distinct sulfur dioxide plumes that drifted generally NW were intermittently captured by the TROPOMI instrument on the Sentinel-5P satellite and sometimes exceeded two Dobson Units (DUs) (figure 49).
Geologic Background. Bagana volcano, in a remote portion of central Bougainville Island, is frequently active. This massive symmetrical cone was largely constructed by an accumulation of viscous andesitic lava flows. The entire edifice could have been constructed in about 300 years at its present rate of lava production. Eruptive activity is characterized by non-explosive effusion of viscous lava that maintains a small lava dome in the summit crater, although occasional explosive activity produces pyroclastic flows. Lava flows with tongue-shaped lobes up to 50 m thick and prominent levees descend the flanks on all sides.
Information Contacts: Rabaul Volcano Observatory (RVO), Geohazards Management Division, Department of Mineral Policy and Geohazards Management (DMPGM), PO Box 3386, Kokopo, East New Britain Province, Papua New Guinea; Darwin Volcanic Ash Advisory Centre (VAAC), Bureau of Meteorology, Northern Territory Regional Office, PO Box 40050, Casuarina, NT 0811, Australia (URL: http://www.bom.gov.au/info/vaac/); MIROVA (Middle InfraRed Observation of Volcanic Activity), a collaborative project between the Universities of Turin and Florence (Italy) supported by the Centre for Volcanic Risk of the Italian Civil Protection Department (URL: http://www.mirovaweb.it/); Hawai'i Institute of Geophysics and Planetology (HIGP) - MODVOLC Thermal Alerts System, School of Ocean and Earth Science and Technology (SOEST), Univ. of Hawai'i, 2525 Correa Road, Honolulu, HI 96822, USA (URL: http://modis.higp.hawaii.edu/); NASA Global Sulfur Dioxide Monitoring Page, Atmospheric Chemistry and Dynamics Laboratory, NASA Goddard Space Flight Center (NASA/GSFC), 8800 Greenbelt Road, Goddard, Maryland, USA (URL: https://so2.gsfc.nasa.gov/); Copernicus Browser, Copernicus Data Space Ecosystem, European Space Agency (URL: https://dataspace.copernicus.eu/browser/); Autonomous Bougainville Government, P.O Box 322, Buka, AROB, PNG (URL: https://abg.gov.pg/); Andrew Tupper (Twitter: @andrewcraigtupp); Simon Carn, Geological and Mining Engineering and Sciences, Michigan Technological University, 1400 Townsend Drive, Houghton, MI 49931, USA (URL: http://www.volcarno.com/, Twitter: @simoncarn); Radio NZ (URL: https://www.rnz.co.nz/news/pacific/494464/more-than-7-000-people-in-bougainville-need-temporary-accommodation-after-eruption); USAID, 1300 Pennsylvania Ave, NW, Washington DC 20004, USA (URL: https://www.usaid.gov/pacific-islands/press-releases/aug-08-2023-united-states-provides-immediate-emergency-assistance-support-communities-affected-mount-bagana-volcanic-eruptions).
Mayon (Philippines) — October 2023 Cite this Report
Mayon
Philippines
13.257°N, 123.685°E; summit elev. 2462 m
All times are local (unless otherwise noted)
Lava flows, pyroclastic flows, ash emissions, and seismicity during April-September 2023
Mayon is located in the Philippines and has steep upper slopes capped by a small summit crater. Historical eruptions date back to 1616 CE that have been characterized by Strombolian eruptions, lava flows, pyroclastic flows, and mudflows. Eruptions mostly originated from a central conduit. Pyroclastic flows and mudflows have commonly descended many of the approximately 40 drainages that surround the volcano. The most recent eruption occurred during June through October 2022 and consisted of lava dome growth and gas-and-steam emissions (BGVN 47:12). A new eruption was reported during late April 2023 and has included lava flows, pyroclastic density currents, ash emissions, and seismicity. This report covers activity during April through September 2023 based on daily bulletins from the Philippine Institute of Volcanology and Seismology (PHIVOLCS).
During April through September 2023, PHIVOLCS reported near-daily rockfall events, frequent volcanic earthquakes, and sulfur dioxide measurements. Gas-and-steam emissions rose 100-900 m above the crater and drifted in different directions. Nighttime crater incandescence was often visible during clear weather and was accompanied by incandescent avalanches of material. Activity notably increased during June when lava flows were reported on the S, SE, and E flanks (figure 52). The MIROVA graph (Middle InfraRed Observation of Volcanic Activity) showed strong thermal activity coincident with these lava flows, which remained active through September (figure 53). According to the MODVOLC thermal algorithm, a total of 110 thermal alerts were detected during the reporting period: 17 during June, 40 during July, 27 during August, and 26 during September. During early June, pyroclastic density currents (PDCs) started to occur more frequently.
Low activity was reported during much of April and May; gas-and-steam emissions rose 100-900 m above the crater and generally drifted in different directions. A total of 52 rockfall events and 18 volcanic earthquakes were detected during April and 147 rockfall events and 13 volcanic events during May. Sulfur dioxide flux measurements ranged between 400-576 tons per day (t/d) during April, the latter of which was measured on 29 April and between 162-343 t/d during May, the latter of which was measured on 13 May.
Activity during June increased, characterized by lava flows, pyroclastic density currents (PDCs), crater incandescence and incandescent rockfall events, gas-and-steam emissions, and continued seismicity. Weather clouds often prevented clear views of the summit, but during clear days, moderate gas-and-steam emissions rose 100-2,500 m above the crater and drifted in multiple directions. A total of 6,237 rockfall events and 288 volcanic earthquakes were detected. The rockfall events often deposited material on the S and SE flanks within 700-1,500 m of the summit crater and ash from the events drifted SW, S, SE, NE, and E. Sulfur dioxide emissions ranged between 149-1,205 t/d, the latter of which was measured on 10 June. Short-term observations from EDM and electronic tiltmeter monitoring indicated that the upper slopes were inflating since February 2023. Longer-term ground deformation parameters based on EDM, precise leveling, continuous GPS, and electronic tilt monitoring indicated that the volcano remained inflated, especially on the NW and SE flanks. At 1000 on 5 June the Volcano Alert Level (VAL) was raised to 2 (on a 0-5 scale). PHIVOLCS noted that although low-level volcanic earthquakes, ground deformation, and volcanic gas emissions indicated unrest, the steep increase in rockfall frequency may indicate increased dome activity.
A total of 151 dome-collapse PDCs occurred during 8-9 and 11-30 June, traveled 500-2,000 m, and deposited material on the S flank within 2 km of the summit crater. During 8-9 June the VAL was raised to 3. At approximately 1947 on 11 June lava flow activity was reported; two lobes traveled within 500 m from the crater and deposited material on the S (Mi-isi), SE (Bonga), and E (Basud) flanks. Weak seismicity accompanied the lava flow and slight inflation on the upper flanks. This lava flow remained active through 30 June, moving down the S and SE flank as far as 2.5 km and 1.8 km, respectively and depositing material up to 3.3 km from the crater. During 15-16 June traces of ashfall from the PDCs were reported in Sitio Buga, Nabonton, City of Ligao and Purok, and San Francisco, Municipality of Guinobatan. During 28-29 June there were two PDCs generated by the collapse of the lava flow front, which generated a light-brown ash plume 1 km high. Satellite monitors detected significant concentrations of sulfur dioxide beginning on 29 June. On 30 June PDCs primarily affected the Basud Gully on the E flank, the largest of which occurred at 1301 and lasted eight minutes, based on the seismic record. Four PDCs generated between 1800 and 2000 that lasted approximately four minutes each traveled 3-4 km on the E flank and generated an ash plume that rose 1 km above the crater and drifted N and NW. Ashfall was recorded in Tabaco City.
Similar strong activity continued during July; slow lava effusion remained active on the S and SE flanks and traveled as far as 2.8 km and 2.8 km, respectively and material was deposited as far as 4 km from the crater. There was a total of 6,983 rockfall events and 189 PDCs that affected the S, SE, and E flanks. The volcano network detected a total of 2,124 volcanic earthquakes. Continuous gas-and-steam emissions rose 200-2,000 m above the crater and drifted in multiple directions. Sulfur dioxide emissions averaged 792-4,113 t/d, the latter of which was measured on 28 July. During 2-4 July three PDCs were generated from the collapse of the lava flow and resulting light brown plumes rose 200-300 m above the crater. Continuous tremor pulses were reported beginning at 1547 on 3 July through 7 July at 1200, at 2300 on 8 July and going through 0300 on 10 July, and at 2300 on 16 July, as recorded by the seismic network. During 6-9 July there were 10 lava flow-collapse-related PDCs that generated light brown plumes 300-500 m above the crater. During 10-11 July light ashfall was reported in some areas of Mabinit, Legazpi City, Budiao and Salvacion, Daraga, and Camalig, Albay. By 18 July the lava flow advanced 600 m on the E flank as well.
During 1733 on 18 July and 0434 on 19 July PHIVOLCS reported 30 “ashing” events, which are degassing events accompanied by audible thunder-like sounds and entrained ash at the crater, which produced short, dark plumes that drifted SW. These events each lasted 20-40 seconds, and plume heights ranged from 150-300 m above the crater, as recorded by seismic, infrasound, visual, and thermal monitors. Three more ashing events occurred during 19-20 July. Short-term observations from electronic tilt and GPS monitoring indicate deflation on the E lower flanks in early July and inflation on the NW middle flanks during the third week of July. Longer-term ground deformation parameters from EDM, precise leveling, continuous GPS, and electronic tilt monitoring indicated that the volcano was still generally inflated relative to baseline levels. A short-lived lava pulse lasted 28 seconds at 1956 on 21 July, which was accompanied by seismic and infrasound signals. By 22 July, the only lava flow that remained active was on the SE flank, and continued to extend 3.4 km, while those on the S and E flanks weakened markedly. One ashing event was detected during 30-31 July, whereas there were 57 detected during 31 July-1 August; according to PHIVOLCS beginning at approximately 1800 on 31 July eruptive activity was dominated by phases of intermittent ashing, as well as increased in the apparent rates of lava effusion from the summit crater. The ashing phases consisted of discrete events recorded as low-frequency volcanic earthquakes (LFVQ) typically 30 seconds in duration, based on seismic and infrasound signals. Gray ash plume rose 100 m above the crater and generally drifted NE. Shortly after these ashing events began, new lava began to effuse rapidly from the crater, feeding the established flowed on the SE, E, and E flanks and generating frequent rockfall events.
Intensified unrest persisted during August. There was a total of 4,141 rockfall events, 2,881 volcanic earthquakes, which included volcanic tremor events, 32 ashing events, and 101 PDCs detected throughout the month. On clear weather days, gas-and-steam emissions rose 300-1,500 m above the crater and drifted in different directions (figure 54). Sulfur dioxide emissions averaged 735-4,756 t/d, the higher value of which was measured on 16 August. During 1-2 August the rate of lava effusion decreased, but continued to feed the flows on the SE, S, and E flanks, maintaining their advances to 3.4 km, 2.8 km, and 1.1 km from the crater, respectively (figure 55). Rockfall and PDCs generated by collapses at the lava flow margins and from the summit dome deposited material within 4 km of the crater. During 3-4 August there were 10 tremor events detected that lasted 1-4 minutes. Short-lived lava pulse lasted 35 seconds and was accompanied by seismic and infrasound signals at 0442 on 6 August. Seven collapses were recorded at the front of the lava flow during 12-14 August.
During September, similar activity of slow lava effusion, PDCs, gas-and-steam emissions, and seismicity continued. There was a total of 4,452 rockfall events, 329 volcanic earthquakes, which included volcanic tremor events, two ashing events, and 85 PDCs recorded throughout the month. On clear weather days, gas-and-steam emissions rose 100-1,500 m above the crater and drifted in multiple directions. Sulfur dioxide emissions averaged 609-2,252 t/d, the higher average of which was measured on 6 September. Slow lava effusion continued advancing on the SE, S, and E flanks, maintaining lengths of 3.4 km, 2.8 km, and 1.1 km, respectively. Rockfall and PDC events generated by collapses along the lava flow margins and at the summit dome deposited material within 4 km of the crater.
Geologic Background. Symmetrical Mayon, which rises above the Albay Gulf NW of Legazpi City, is the most active volcano of the Philippines. The steep upper slopes are capped by a small summit crater. Recorded eruptions since 1616 CE range from Strombolian to basaltic Plinian, with cyclical activity beginning with basaltic eruptions, followed by longer periods of andesitic lava flows. Eruptions occur predominately from the central conduit and have also produced lava flows that travel far down the flanks. Pyroclastic density currents and mudflows have commonly swept down many of the approximately 40 ravines that radiate from the summit and have often damaged populated lowland areas. A violent eruption in 1814 killed more than 1,200 people and devastated several towns.
Information Contacts: Philippine Institute of Volcanology and Seismology (PHIVOLCS), Department of Science and Technology, University of the Philippines Campus, Diliman, Quezon City, Philippines (URL: http://www.phivolcs.dost.gov.ph/); MIROVA (Middle InfraRed Observation of Volcanic Activity), a collaborative project between the Universities of Turin and Florence (Italy) supported by the Centre for Volcanic Risk of the Italian Civil Protection Department (URL: http://www.mirovaweb.it/); Hawai'i Institute of Geophysics and Planetology (HIGP) - MODVOLC Thermal Alerts System, School of Ocean and Earth Science and Technology (SOEST), Univ. of Hawai'i, 2525 Correa Road, Honolulu, HI 96822, USA (URL: http://modis.higp.hawaii.edu/); Copernicus Browser, Copernicus Data Space Ecosystem, European Space Agency (URL: https://dataspace.copernicus.eu/browser/); William Rogers, Legazpi City, Albay Province, Philippines.
Nishinoshima (Japan) — October 2023 Cite this Report
Nishinoshima
Japan
27.247°N, 140.874°E; summit elev. 100 m
All times are local (unless otherwise noted)
Eruption plumes and gas-and-steam plumes during May-August 2023
Nishinoshima, located about 1,000 km S of Tokyo, is a small island in the Ogasawara Arc in Japan. The island is the summit of a massive submarine volcano that has prominent submarine peaks to the S, W, and NE. Eruptions date back to 1973 and the current eruption period began in October 2022. Recent activity has consisted of small ash plumes and fumarolic activity (BGVN 48:07). This report covers activity during May through August 2023, using information from monthly reports of the Japan Meteorological Agency (JMA) monthly reports and satellite data.
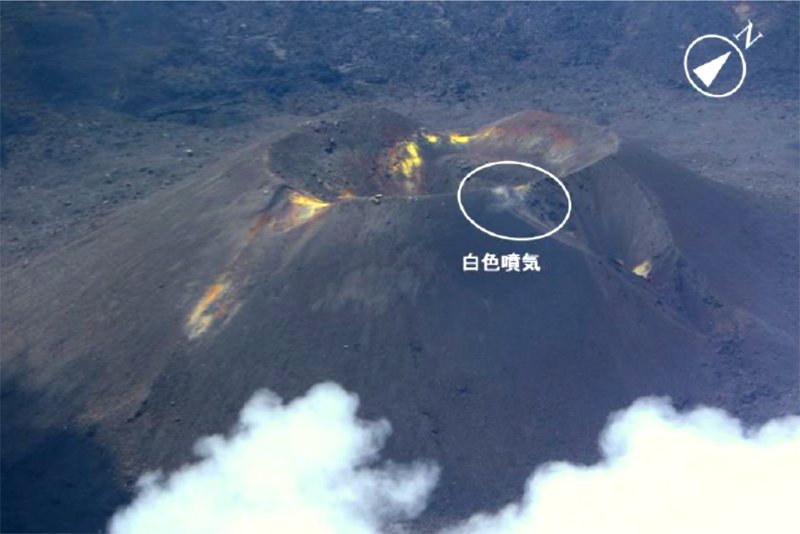
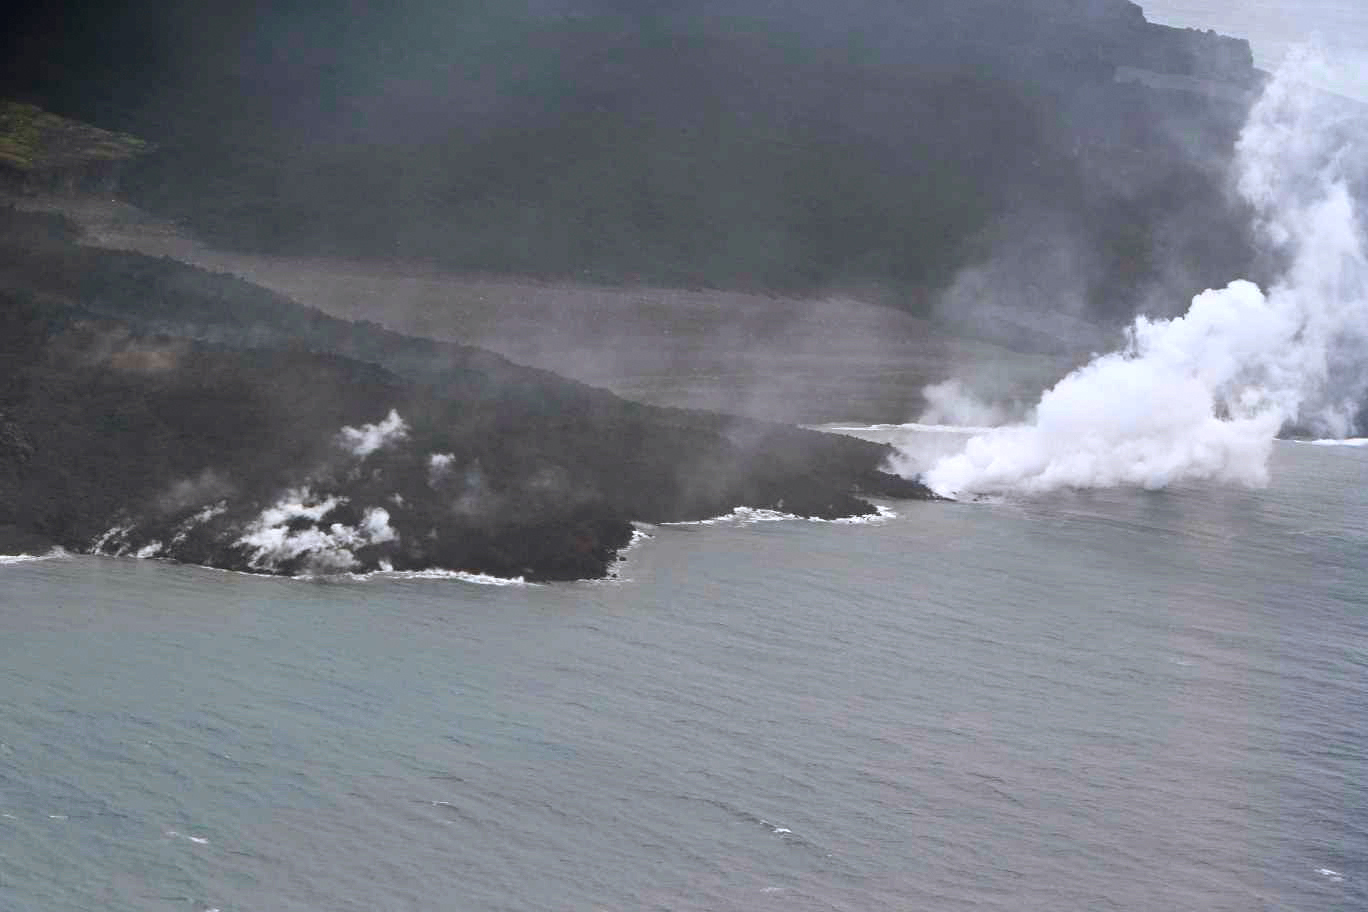
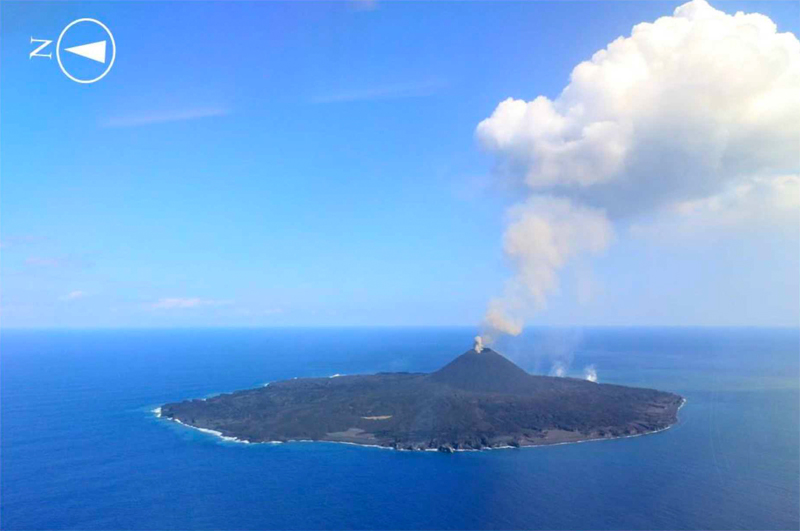
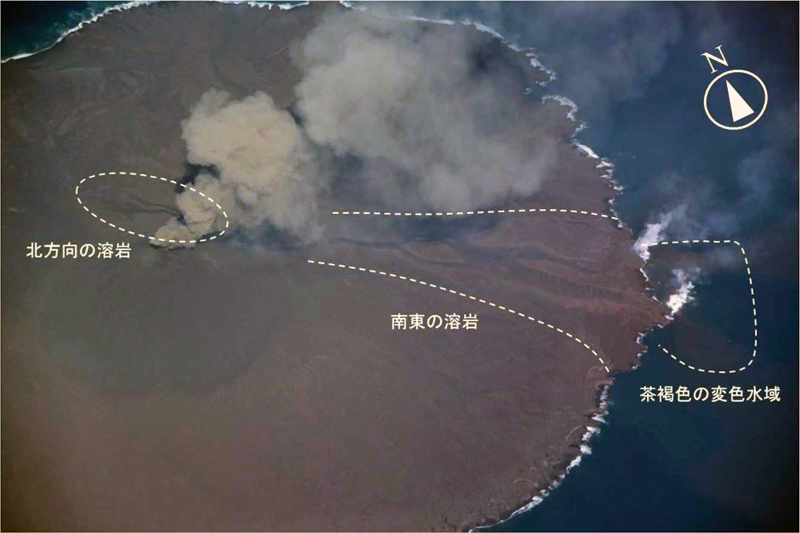
Activity during May through June was relatively low. The Japan Coast Guard (JCG) did overflights on 14 and 22 June and reported white gas-and-steam emissions rising 600 m and 1,200 m from the central crater of the pyroclastic cone, respectively (figure 125). In addition, multiple white gas-and-steam emissions rose from the inner rim of the W side of the crater and from the SE flank of the pyroclastic cone. Discolored brown-to-green water was observed around almost the entire perimeter of the island; on 22 June light green discolored water was observed off the S coast of the island.
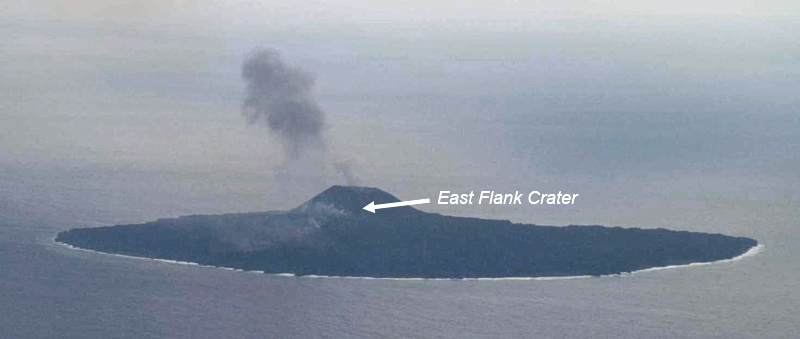
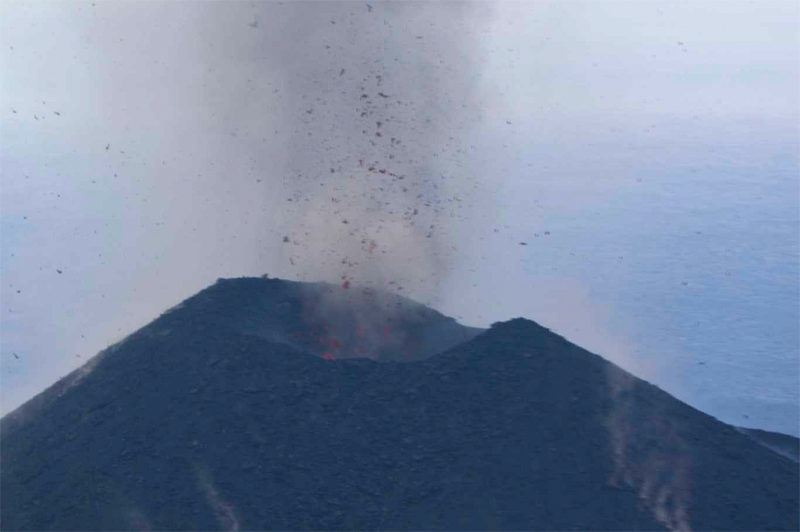
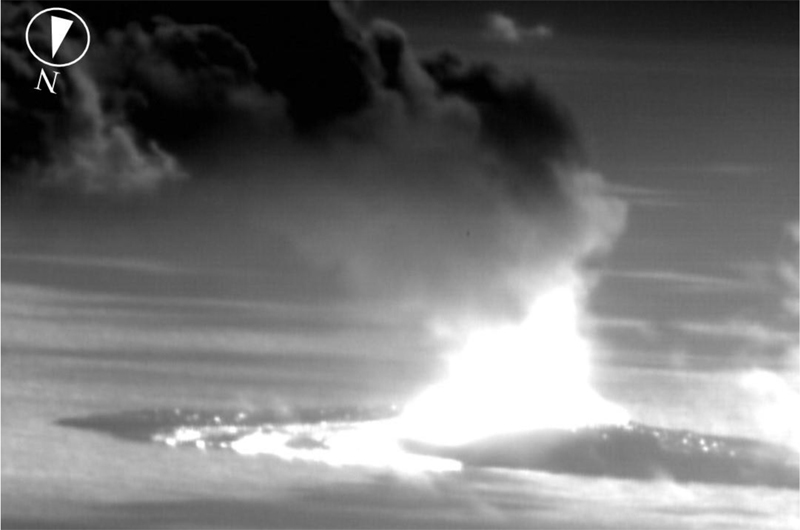
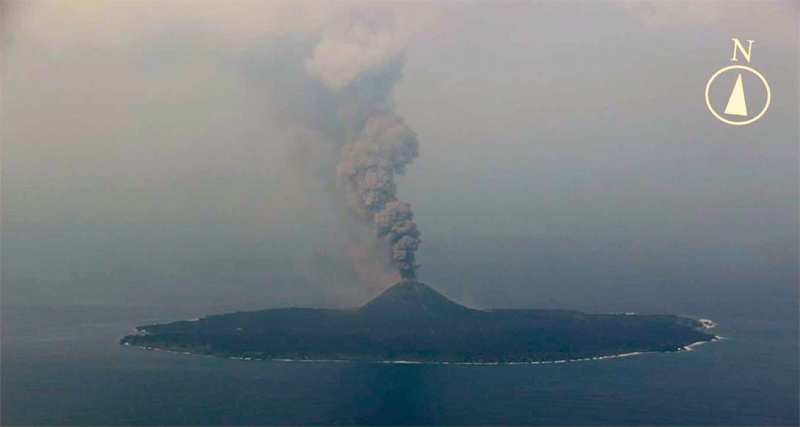
Observations from the Himawari meteorological satellite confirmed an eruption on 9 and 10 July. An eruption plume rose 1.6 km above the crater and drifted N around 1300 on 9 July. Satellite images acquired at 1420 and 2020 on 9 July and at 0220 on 10 July showed continuing emissions that rose 1.3-1.6 km above the crater and drifted NE and N. The Tokyo VAAC reported that an ash plume seen by a pilot and identified in a satellite image at 0630 on 21 July rose to 3 km altitude and drifted S.
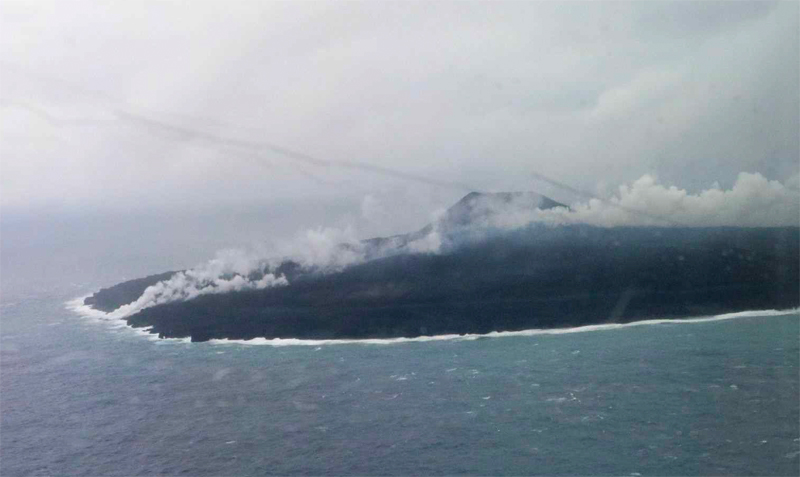
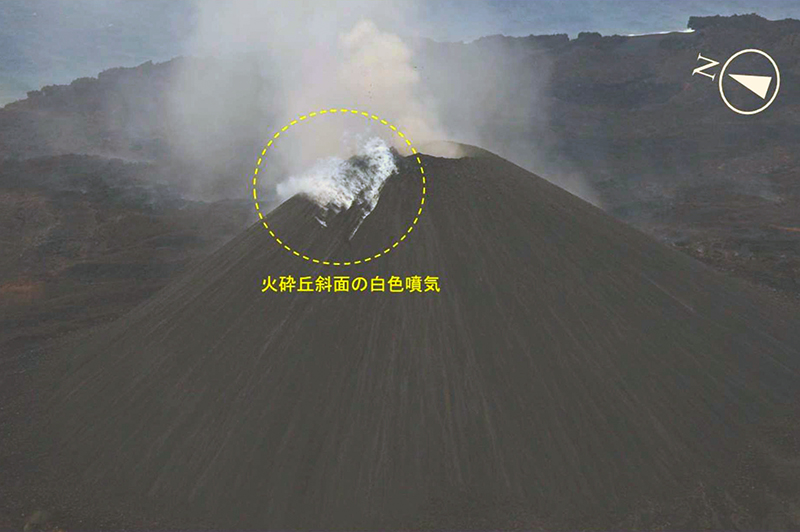
Aerial observations conducted by JCG on 8 August showed a white-and-gray plume rising from the central crater of the pyroclastic cone, and multiple white gas-and-steam emissions were rising from the inner edge of the western crater and along the NW-SE flanks of the island (figure 126). Brown-to-green discolored water was also noted around the perimeter of the island.
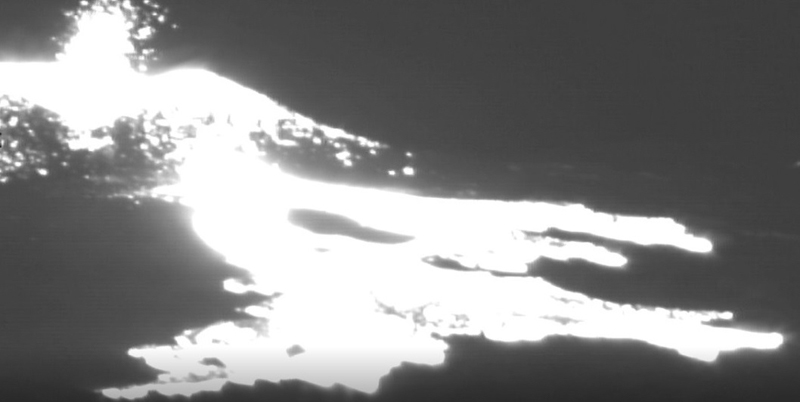
Intermittent low-to-moderate power thermal anomalies were recorded in the MIROVA graph (Middle InfraRed Observation of Volcanic Activity), showing an increase in both frequency and power beginning in July (figure 127). This increase in activity coincides with eruptive activity on 9 and 10 July, characterized by eruption plumes. According to the MODVOLC thermal alert algorithm, one thermal hotspot was recorded on 20 July. Weak thermal anomalies were also detected in infrared satellite imagery, accompanied by strong gas-and-steam plumes (figure 128).
Geologic Background. The small island of Nishinoshima was enlarged when several new islands coalesced during an eruption in 1973-74. Multiple eruptions that began in 2013 completely covered the previous exposed surface and continued to enlarge the island. The island is the summit of a massive submarine volcano that has prominent peaks to the S, W, and NE. The summit of the southern cone rises to within 214 m of the ocean surface 9 km SSE.
Information Contacts: Japan Meteorological Agency (JMA), 1-3-4 Otemachi, Chiyoda-ku, Tokyo 100-8122, Japan (URL: http://www.jma.go.jp/jma/indexe.html); Tokyo Volcanic Ash Advisory Center (VAAC), 1-3-4 Otemachi, Chiyoda-ku, Tokyo 100-8122, Japan (URL: http://ds.data.jma.go.jp/svd/vaac/data/); MIROVA (Middle InfraRed Observation of Volcanic Activity), a collaborative project between the Universities of Turin and Florence (Italy) supported by the Centre for Volcanic Risk of the Italian Civil Protection Department (URL: http://www.mirovaweb.it/); Copernicus Browser, Copernicus Data Space Ecosystem, European Space Agency (URL: https://dataspace.copernicus.eu/browser/).
Krakatau (Indonesia) — October 2023 Cite this Report
Krakatau
Indonesia
6.1009°S, 105.4233°E; summit elev. 285 m
All times are local (unless otherwise noted)
White gas-and-steam plumes and occasional ash plumes during May-August 2023
Krakatau is located in the Sunda Strait between Java and Sumatra, Indonesia. Caldera collapse during the catastrophic 1883 eruption destroyed Danan and Perbuwatan cones and left only a remnant of Rakata. The post-collapse cone of Anak Krakatau (Child of Krakatau) was constructed within the 1883 caldera at a point between the former Danan and Perbuwatan cones; it has been the site of frequent eruptions since 1927. The current eruption period began in May 2021 and has recently consisted of Strombolian eruptions and ash plumes (BGVN 48:07). This report describes lower levels of activity consisting of ash and white gas-and-steam plumes during May through August 2023, based on information provided by the Indonesian Center for Volcanology and Geological Hazard Mitigation, referred to as Pusat Vulkanologi dan Mitigasi Bencana Geologi (PVMBG), MAGMA Indonesia, and satellite data.
Activity was relatively low during May and June. Daily white gas-and-steam emissions rose 25-200 m above the crater and drifted in different directions. Five ash plumes were detected at 0519 on 10 May, 1241 on 11 May, 0920 on 12 May, 2320 on 12 May, and at 0710 on 13 May, and rose 1-2.5 km above the crater and drifted SW. A webcam image taken on 12 May showed ejection of incandescent material above the vent. A total of nine ash plumes were detected during 6-11 June: at 1434 and 00220 on 6 and 7 June the ash plumes rose 500 m above the crater and drifted NW, at 1537 on 8 June the ash plume rose 1 km above the crater and drifted SW, at 0746 and at 0846 on 9 June the ash plumes rose 800 m and 3 km above the crater and drifted SW, respectively, at 0423, 1431, and 1750 on 10 June the ash plumes rose 2 km, 1.5 km, and 3.5 km above the crater and drifted NW, respectively, and at 0030 on 11 June an ash plume rose 2 km above the crater and drifted NW. Webcam images taken on 10 and 11 June at 0455 and 0102, respectively, showed incandescent material ejected above the vent. On 19 June an ash plume at 0822 rose 1.5 km above the crater and drifted SE.
Similar low activity of white gas-and-steam emissions and few ash plumes were reported during July and August. Daily white gas-and-steam emissions rose 25-300 m above the crater and drifted in multiple directions. Three ash plumes were reported at 0843, 0851, and 0852 on 20 July that rose 500-2,000 m above the crater and drifted NW.
The MIROVA (Middle InfraRed Observation of Volcanic Activity) graph of MODIS thermal anomaly data showed intermittent low-to-moderate power thermal anomalies during May through August 2023 (figure 140). Although activity was often obscured by weather clouds, a thermal anomaly was visible in an infrared satellite image of the crater on 12 May, accompanied by an eruption plume that drifted SW (figure 141).
Geologic Background. The renowned Krakatau (frequently mis-named as Krakatoa) volcano lies in the Sunda Strait between Java and Sumatra. Collapse of an older edifice, perhaps in 416 or 535 CE, formed a 7-km-wide caldera. Remnants of that volcano are preserved in Verlaten and Lang Islands; subsequently the Rakata, Danan, and Perbuwatan cones were formed, coalescing to create the pre-1883 Krakatau Island. Caldera collapse during the catastrophic 1883 eruption destroyed Danan and Perbuwatan, and left only a remnant of Rakata. This eruption caused more than 36,000 fatalities, most as a result of tsunamis that swept the adjacent coastlines of Sumatra and Java. Pyroclastic surges traveled 40 km across the Sunda Strait and reached the Sumatra coast. After a quiescence of less than a half century, the post-collapse cone of Anak Krakatau (Child of Krakatau) was constructed within the 1883 caldera at a point between the former Danan and Perbuwatan cones. Anak Krakatau has been the site of frequent eruptions since 1927.
Information Contacts: Pusat Vulkanologi dan Mitigasi Bencana Geologi (PVMBG, also known as Indonesian Center for Volcanology and Geological Hazard Mitigation, CVGHM), Jalan Diponegoro 57, Bandung 40122, Indonesia (URL: http://www.vsi.esdm.go.id/); MAGMA Indonesia, Kementerian Energi dan Sumber Daya Mineral (URL: https://magma.esdm.go.id/v1); MIROVA (Middle InfraRed Observation of Volcanic Activity), a collaborative project between the Universities of Turin and Florence (Italy) supported by the Centre for Volcanic Risk of the Italian Civil Protection Department (URL: http://www.mirovaweb.it/); Copernicus Browser, Copernicus Data Space Ecosystem, European Space Agency (URL: https://dataspace.copernicus.eu/browser/).
Villarrica (Chile) — October 2023 Cite this Report
Villarrica
Chile
39.42°S, 71.93°W; summit elev. 2847 m
All times are local (unless otherwise noted)
Strombolian activity, gas-and-ash emissions, and crater incandescence during April-September 2023
Villarrica, in central Chile, consists of a 2-km-wide caldera that formed about 3,500 years ago and is located at the base of the presently active cone at the NW margin of a 6-km-wide caldera. Historical eruptions eruptions date back to 1558 and have been characterized by mild-to-moderate explosive activity with occasional lava effusions. The current eruption period began in December 2014 and has recently consisted of nighttime crater incandescence, ash emissions, and seismicity (BGVN 48:04). This report covers activity during April through September 2023 and describes occasional Strombolian activity, gas-and-ash emissions, and nighttime crater incandescence. Information for this report primarily comes from the Southern Andes Volcano Observatory (Observatorio Volcanológico de Los Andes del Sur, OVDAS), part of Chile's National Service of Geology and Mining (Servicio Nacional de Geología y Minería, SERNAGEOMIN) and satellite data.
Seismicity during April consisted of long period (LP) events and tremor (TRE); a total of 9,413 LP-type events and 759 TR-type events were detected throughout the month. Nighttime crater incandescence persisted and was visible in the degassing column. Sulfur dioxide data was obtained using Differential Absorption Optical Spectroscopy Equipment (DOAS) that showed an average value of 1,450 ± 198 tons per day (t/d) during 1-15 April and 1,129 ± 201 t/d during 16-30 April, with a maximum daily value of 2,784 t/d on 9 April. Gas-and-steam emissions of variable intensities rose above the active crater as high as 1.3 km above the crater on 13 April. Strombolian explosions were not observed and there was a slight decrease in the lava lake level.
There were 14,123 LP-type events and 727 TR-type events detected during May. According to sulfur dioxide measurements taken with DOAS equipment, the active crater emitted an average value of 1,826 ± 482 t/d during 1-15 May and 912 ± 41 t/d during 16-30 May, with a daily maximum value of 5,155 t/d on 13 May. Surveillance cameras showed continuous white gas-and-steam emissions that rose as high as 430 m above the crater on 27 May. Nighttime incandescence illuminated the gas column less than 300 m above the crater rim was and no pyroclastic emissions were reported. A landslide was identified on 13 May on the E flank of the volcano 50 m from the crater rim and extending 300 m away; SERNAGEOMIN noted that this event may have occurred on 12 May. During the morning of 27 and 28 May minor Strombolian explosions characterized by incandescent ejecta were recorded at the crater rim; the last reported Strombolian explosions had occurred at the end of March.
Seismic activity during June consisted of five volcano-tectonic (VT)-type events, 21,606 LP-type events, and 2,085 TR-type events. The average value of sulfur dioxide flux obtained by DOAS equipment was 1,420 ± 217 t/d during 1-15 June and 2,562 ± 804 t/d, with a maximum daily value of 4,810 t/d on 17 June. White gas-and-steam emissions rose less than 480 m above the crater; frequent nighttime crater incandescence was reflected in the degassing plume. On 12 June an emission rose 100 m above the crater and drifted NNW. On 15 June one or several emissions resulted in ashfall to the NE as far as 5.5 km from the crater, based on a Skysat satellite image. Several Strombolian explosions occurred within the crater; activity on 15 June was higher energy and ejected blocks 200-300 m on the NE slope. Surveillance cameras showed white gas-and-steam emissions rising 480 m above the crater on 16 June. On 19 and 24 June low-intensity Strombolian activity was observed, ejecting material as far as 200 m from the center of the crater to the E.
During July, seismicity included 29,319 LP-type events, 3,736 TR-type events, and two VT-type events. DOAS equipment recorded two days of sulfur dioxide emissions of 4,220 t/d and 1,009 t/d on 1 and 13 July, respectively. Constant nighttime incandescence was also recorded and was particularly noticeable when accompanied by eruptive columns on 12 and 16 July. Minor explosive events were detected in the crater. According to Skysat satellite images taken on 12, 13, and 16 July, ashfall deposits were identified 155 m S of the crater. According to POVI, incandescence was visible from two vents on the crater floor around 0336 on 12 July. Gas-and-ash emissions rose as high as 1.2 km above the crater on 13 July and drifted E and NW. A series of gas-and-steam pulses containing some ash deposited material on the upper E flank around 1551 on 13 July. During 16-31 July, average sulfur dioxide emissions of 1,679 ± 406 t/d were recorded, with a maximum daily value of 2,343 t/d on 28 July. Fine ash emissions were also reported on 16, 17, and 23 July.
Seismicity persisted during August, characterized by 27,011 LP-type events, 3,323 TR-type events, and three VT-type events. The average value of sulfur dioxide measurements taken during 1-15 August was 1,642 ± 270 t/d and 2,207 ± 4,549 t/d during 16-31 August, with a maximum daily value of 3,294 t/d on 27 August. Nighttime crater incandescence remained visible in degassing columns. White gas-and-steam emissions rose 480 m above the crater on 6 August. According to a Skysat satellite image from 6 August, ash accumulation was observed proximal to the crater and was mainly distributed toward the E slope. White gas-and-steam emissions rose 320 m above the crater on 26 August. Nighttime incandescence and Strombolian activity that generated ash emissions were reported on 27 August.
Seismicity during September was characterized by five VT-type events, 12,057 LP-type events, and 2,058 TR-type events. Nighttime incandescence persisted. On 2 September an ash emission rose 180 m above the crater and drifted SE at 1643 (figure 125) and a white gas-and-steam plume rose 320 m above the crater. According to the Buenos Aires VAAC, periods of continuous gas-and-ash emissions were visible in webcam images from 1830 on 2 September to 0110 on 3 September. Strombolian activity was observed on 2 September and during the early morning of 3 September, the latter event of which generated an ash emission that rose 60 m above the crater and drifted 100 m from the center of the crater to the NE and SW. Ashfall was reported to the SE and S as far as 750 m from the crater. The lava lake was active during 3-4 September and lava fountaining was visible for the first time since 26 March 2023, according to POVI. Fountains captured in webcam images at 2133 on 3 September and at 0054 on 4 September rose as high as 60 m above the crater rim and ejected material onto the upper W flank. Sulfur dioxide flux of 1,730 t/d and 1,281 t/d was measured on 3 and 4 September, respectively, according to data obtained by DOAS equipment.
Strong Strombolian activity and larger gas-and-ash plumes were reported during 18-20 September. On 18 September activity was also associated with energetic LP-type events and notable sulfur dioxide fluxes (as high as 4,277 t/d). On 19 September Strombolian activity and incandescence were observed. On 20 September at 0914 ash emissions rose 50 m above the crater and drifted SSE, accompanied by Strombolian activity that ejected material less than 100 m SSE, causing fall deposits on that respective flank. SERNAGEOMIN reported that a Planet Scope satellite image taken on 20 September showed the lava lake in the crater, measuring 32 m x 35 m and an area of 0.001 km2. Several ash emissions were recorded at 0841, 0910, 1251, 1306, 1312, 1315, and 1324 on 23 September and rose less than 150 m above the crater. The sulfur dioxide flux value was 698 t/d on 23 September and 1,097 t/d on 24 September. On 24 September the Volcanic Alert Level (VAL) was raised to Orange (the third level on a four-color scale). SENAPRED maintained the Alert Level at Yellow (the middle level on a three-color scale) for the communities of Villarrica, Pucón (16 km N), Curarrehue, and Panguipulli.
During 24-25 September there was an increase in seismic energy (observed at TR-events) and acoustic signals, characterized by 1 VT-type event, 213 LP-type events, and 124 TR-type events. Mainly white gas-and-steam emissions, in addition to occasional fine ash emissions were recorded. During the early morning of 25 September Strombolian explosions were reported and ejected material 250 m in all directions, though dominantly toward the NW. On 25 September the average value of sulfur dioxide flux was 760 t/d. Seismicity during 25-30 September consisted of five VT-type events, 1,937 LP-type events, and 456 TR-type events.
During 25-29 September moderate Strombolian activity was observed and ejected material as far as the crater rim. In addition, ash pulses lasting roughly 50 minutes were observed around 0700 and dispersed ENE. During 26-27 September a TR episode lasted 6.5 hours and was accompanied by discrete acoustic signals. Satellite images from 26 September showed a spatter cone on the crater floor with one vent that measured 10 x 14 m and a smaller vent about 35 m NE of the cone. SERNAGEOMIN reported an abundant number of bomb-sized blocks up to 150 m from the crater, as well as impact marks on the snow, which indicated explosive activity. A low-altitude ash emission was observed drifting NW around 1140 on 28 September, based on webcam images. Between 0620 and 0850 on 29 September an ash emission rose 60 m above the crater and drifted NW. During an overflight taken around 1000 on 29 September scientists observed molten material in the vent, a large accumulation of pyroclasts inside the crater, and energetic degassing, some of which contained a small amount of ash. Block-sized pyroclasts were deposited on the internal walls and near the crater, and a distal ash deposit was also visible. The average sulfur dioxide flux measured on 28 September was 344 t/d. Satellite images taken on 29 September ashfall was deposited roughly 3 km WNW from the crater and nighttime crater incandescence remained visible. The average sulfur dioxide flux value from 29 September was 199 t/d. On 30 September at 0740 a pulsating ash emission rose 1.1 km above the crater and drifted NNW (figure 126). Deposits on the S flank extended as far as 4.5 km from the crater rim, based on satellite images from 30 September.
Infrared MODIS satellite data processed by MIROVA (Middle InfraRed Observation of Volcanic Activity) showed intermittent thermal activity during April through September, with slightly stronger activity detected during late September (figure 127). Small clusters of thermal activity were detected during mid-June, early July, early August, and late September. According to the MODVOLC thermal alert system, a total of four thermal hotspots were detected on 7 July and 3 and 23 September. This activity was also intermittently captured in infrared satellite imagery on clear weather days (figure 128).
Geologic Background. The glacier-covered Villarrica stratovolcano, in the northern Lakes District of central Chile, is ~15 km south of the city of Pucon. A 2-km-wide caldera that formed about 3,500 years ago is located at the base of the presently active, dominantly basaltic to basaltic andesite cone at the NW margin of a 6-km-wide Pleistocene caldera. More than 30 scoria cones and fissure vents are present on the flanks. Plinian eruptions and pyroclastic flows that have extended up to 20 km from the volcano were produced during the Holocene. Lava flows up to 18 km long have issued from summit and flank vents. Eruptions documented since 1558 CE have consisted largely of mild-to-moderate explosive activity with occasional lava effusion. Glaciers cover 40 km2 of the volcano, and lahars have damaged towns on its flanks.
Information Contacts: Servicio Nacional de Geología y Minería (SERNAGEOMIN), Observatorio Volcanológico de Los Andes del Sur (OVDAS), Avda Sta María No. 0104, Santiago, Chile (URL: http://www.sernageomin.cl/); Proyecto Observación Villarrica Internet (POVI) (URL: http://www.povi.cl/); Sistema y Servicio Nacional de Prevención y Repuesta Ante Desastres (SENAPRED), Av. Beauchef 1671, Santiago, Chile (URL: https://web.senapred.cl/); Buenos Aires Volcanic Ash Advisory Center (VAAC), Servicio Meteorológico Nacional-Fuerza Aérea Argentina, 25 de mayo 658, Buenos Aires, Argentina (URL: http://www.smn.gov.ar/vaac/buenosaires/inicio.php); MIROVA (Middle InfraRed Observation of Volcanic Activity), a collaborative project between the Universities of Turin and Florence (Italy) supported by the Centre for Volcanic Risk of the Italian Civil Protection Department (URL: http://www.mirovaweb.it/); Hawai'i Institute of Geophysics and Planetology (HIGP) - MODVOLC Thermal Alerts System, School of Ocean and Earth Science and Technology (SOEST), Univ. of Hawai'i, 2525 Correa Road, Honolulu, HI 96822, USA (URL: http://modis.higp.hawaii.edu/); Copernicus Browser, Copernicus Data Space Ecosystem, European Space Agency (URL: https://dataspace.copernicus.eu/browser/).
Merapi (Indonesia) — October 2023 Cite this Report
Merapi
Indonesia
7.54°S, 110.446°E; summit elev. 2910 m
All times are local (unless otherwise noted)
Frequent incandescent avalanches during April-September 2023
Merapi, located just north of the major city of Yogyakarta in central Java, Indonesia, has had activity within the last 20 years characterized by pyroclastic flows and lahars accompanying growth and collapse of the steep-sided active summit lava dome. The current eruption period began in late December 2020 and has more recently consisted of ash plumes, intermittent incandescent avalanches of material, and pyroclastic flows (BGVN 48:04). This report covers activity during April through September 2023, based on information from Balai Penyelidikan dan Pengembangan Teknologi Kebencanaan Geologi (BPPTKG), the Center for Research and Development of Geological Disaster Technology, a branch of PVMBG which specifically monitors Merapi. Additional information comes from the Pusat Vulkanologi dan Mitigasi Bencana Geologi (PVMBG, also known as Indonesian Center for Volcanology and Geological Hazard Mitigation, CVGHM), MAGMA Indonesia, the Darwin Volcanic Ash Advisory Centre (VAAC), and various satellite data.
Activity during April through September 2023 primarily consisted of incandescent avalanches of material that mainly affected the SW and W flanks and traveled as far as 2.3 km from the summit (table 25) and white gas-and-steam emissions that rose 10-1,000 m above the crater.
Table 25. Monthly summary of avalanches and avalanche distances recorded at Merapi during April through September 2023. The number of reported avalanches does not include instances where possible avalanches were heard but could not be visually confirmed as a result of inclement weather. Data courtesy of BPPTKG (April-September 2023 daily reports).
| Month |
Average number of avalanches per day |
Distance avalanches traveled (m) |
| Apr 2023 |
19 |
1,200-2,000 |
| May 2023 |
22 |
500-2,000 |
| Jun 2023 |
18 |
1,200-2,000 |
| Jul 2023 |
30 |
300-2,000 |
| Aug 2023 |
25 |
400-2,300 |
| Sep 2023 |
23 |
600-2,000 |
BPPTKG reported that during April and May white gas-and-steam emissions rose 10-750 m above the crater, incandescent avalanches descended 500-2,000 m on the SW and W flanks (figure 135). Cloudy weather often prevented clear views of the summit, and sometimes avalanches could not be confirmed. According to a webcam image, a pyroclastic flow was visible on 17 April at 0531. During the week of 28 April and 4 May a pyroclastic flow was reported on the SW flank, traveling up to 2.5 km. According to a drone overflight taken on 17 May the SW lava dome volume was an estimated 2,372,800 cubic meters and the dome in the main crater was an estimated 2,337,300 cubic meters.
During June and July similar activity persisted with white gas-and-steam emissions rising 10-350 m above the crater and frequent incandescent avalanches that traveled 300-2,000 m down the SW, W, and S flanks (figure 136). Based on an analysis of aerial photos taken on 24 June the volume of the SW lava dome was approximately 2.5 million cubic meters. A pyroclastic flow was observed on 5 July that traveled 2.7 km on the SW flank. According to the Darwin VAAC multiple minor ash plumes were identified in satellite images on 19 July that rose to 3.7 km altitude and drifted S and SW. During 22, 25, and 26 July a total of 17 avalanches descended as far as 1.8 km on the S flank.
Frequent white gas-and-steam emissions continued during August and September, rising 10-450 m above the crater. Incandescent avalanches mainly affected the SW and W flanks and traveled 400-2,300 m from the vent (figure 137). An aerial survey conducted on 10 August was analyzed and reported that estimates of the SW dome volume was 2,764,300 cubic meters and the dome in the main crater was 2,369,800 cubic meters.
Frequent and moderate-power thermal activity continued throughout the reporting period, according to a MIROVA (Middle InfraRed Observation of Volcanic Activity) analysis of MODIS satellite data (figure 138). There was an increase in the number of detected anomalies during mid-May. The MODVOLC thermal algorithm recorded a total of 47 thermal hotspots: six during April, nine during May, eight during June, 15 during July, four during August, and five during September. Some of this activity was captured in infrared satellite imagery on clear weather days, sometimes accompanied by incandescent material on the SW flank (figure 139).
Geologic Background. Merapi, one of Indonesia's most active volcanoes, lies in one of the world's most densely populated areas and dominates the landscape immediately north of the major city of Yogyakarta. It is the youngest and southernmost of a volcanic chain extending NNW to Ungaran volcano. Growth of Old Merapi during the Pleistocene ended with major edifice collapse perhaps about 2,000 years ago, leaving a large arcuate scarp cutting the eroded older Batulawang volcano. Subsequent growth of the steep-sided Young Merapi edifice, its upper part unvegetated due to frequent activity, began SW of the earlier collapse scarp. Pyroclastic flows and lahars accompanying growth and collapse of the steep-sided active summit lava dome have devastated cultivated lands on the western-to-southern flanks and caused many fatalities.
Information Contacts: Balai Penyelidikan dan Pengembangan Teknologi Kebencanaan Geologi (BPPTKG), Center for Research and Development of Geological Disaster Technology (URL: http://merapi.bgl.esdm.go.id/, Twitter: @BPPTKG); MAGMA Indonesia, Kementerian Energi dan Sumber Daya Mineral (URL: https://magma.esdm.go.id/v1); Pusat Vulkanologi dan Mitigasi Bencana Geologi (PVMBG, also known as Indonesian Center for Volcanology and Geological Hazard Mitigation, CVGHM), Jalan Diponegoro 57, Bandung 40122, Indonesia (URL: http://www.vsi.esdm.go.id/); Darwin Volcanic Ash Advisory Centre (VAAC), Bureau of Meteorology, Northern Territory Regional Office, PO Box 40050, Casuarina, NT 0811, Australia (URL: http://www.bom.gov.au/info/vaac/); MIROVA (Middle InfraRed Observation of Volcanic Activity), a collaborative project between the Universities of Turin and Florence (Italy) supported by the Centre for Volcanic Risk of the Italian Civil Protection Department (URL: http://www.mirovaweb.it/); Hawai'i Institute of Geophysics and Planetology (HIGP) - MODVOLC Thermal Alerts System, School of Ocean and Earth Science and Technology (SOEST), Univ. of Hawai'i, 2525 Correa Road, Honolulu, HI 96822, USA (URL: http://modis.higp.hawaii.edu/); Copernicus Browser, Copernicus Data Space Ecosystem, European Space Agency (URL: https://dataspace.copernicus.eu/browser/); Øystein Lund Andersen (URL: https://www.oysteinlundandersen.com/, https://twitter.com/oysteinvolcano).
Ebeko
Russia
50.686°N, 156.014°E; summit elev. 1103 m
All times are local (unless otherwise noted)
Moderate explosive activity with ash plumes continued during June-November 2023
Ebeko, located on the N end of Paramushir Island in Russia’s Kuril Islands just S of the Kamchatka Peninsula, consists of three summit craters along a SSW-NNE line at the northern end of a complex of five volcanic cones. Observed eruptions date back to the late 18th century and have been characterized as small-to-moderate explosions from the summit crater, accompanied by intense fumarolic activity. The current eruptive period began in June 2022, consisting of frequent explosions, ash plumes, and thermal activity (BGVN 47:10, 48:06). This report covers similar activity during June-November 2023, based on information from the Kamchatka Volcanic Eruptions Response Team (KVERT) and satellite data.
Moderate explosive activity continued during June-November 2023 (figures 50 and 51). According to visual data from Severo-Kurilsk, explosions sent ash 2-3.5 km above the summit (3-4.5 km altitude) during most days during June through mid-September. Activity after mid-September was slightly weaker, with ash usually reaching less than 2 km above the summit. According to KVERT the volcano in October and November was, with a few exceptions, either quiet or obscured by clouds that prevented satellite observations. KVERT issued Volcano Observatory Notices for Aviation (VONA) on 8 and 12 June, 13 and 22 July, 3 and 21 August, and 31 October warning of potential aviation hazards from ash plumes drifting 3-15 km from the volcano. Based on satellite data, KVERT reported a persistent thermal anomaly whenever weather clouds permitted viewing.
Geologic Background. The flat-topped summit of the central cone of Ebeko volcano, one of the most active in the Kuril Islands, occupies the northern end of Paramushir Island. Three summit craters located along a SSW-NNE line form Ebeko volcano proper, at the northern end of a complex of five volcanic cones. Blocky lava flows extend west from Ebeko and SE from the neighboring Nezametnyi cone. The eastern part of the southern crater contains strong solfataras and a large boiling spring. The central crater is filled by a lake about 20 m deep whose shores are lined with steaming solfataras; the northern crater lies across a narrow, low barrier from the central crater and contains a small, cold crescentic lake. Historical activity, recorded since the late-18th century, has been restricted to small-to-moderate explosive eruptions from the summit craters. Intense fumarolic activity occurs in the summit craters, on the outer flanks of the cone, and in lateral explosion craters.
Information Contacts: Kamchatka Volcanic Eruptions Response Team (KVERT), Far Eastern Branch, Russian Academy of Sciences, 9 Piip Blvd., Petropavlovsk-Kamchatsky, 683006, Russia (URL: http://www.kscnet.ru/ivs/kvert/).
Search Bulletin Archive by Publication Date
Select a month and year from the drop-downs and click "Show Issue" to have that issue displayed in this tab.
The default month and year is the latest issue available.
Bulletin of the Global Volcanism Network - Volume 45, Number 03 (March 2020)
Managing Editor: Edward Venzke
Ambrym (Vanuatu)
Fissure eruption in December 2018 produces an offshore pumice eruption after lava lakes drain
Cleveland (United States)
Intermittent thermal anomalies and lava dome subsidence, February 2019-January 2020
Copahue (Chile-Argentina)
Ash emissions end on 12 November; lake returns to El Agrio Crater in December 2019
Fernandina (Ecuador)
Fissure eruption produced lava flows during 12-13 January 2020
Mayotte (France)
Seismicity and deformation, with submarine E-flank volcanism starting in July 2018
Nishinoshima (Japan)
Ongoing activity enlarges island with lava flows, ash plumes, and incandescent ejecta, December 2019-February 2020
San Miguel (El Salvador)
Small ash emissions during 22 February 2020
Ubinas (Peru)
Explosions produced ash plumes in September 2019; several lahars generated in January and February 2020
Unnamed (Tonga)
Additional details and pumice raft drift maps from the August 2019 submarine eruption
Yasur (Vanuatu)
Strombolian activity continues during June 2019 through February 2020
Ambrym
Vanuatu
16.25°S, 168.12°E; summit elev. 1334 m
All times are local (unless otherwise noted)
Fissure eruption in December 2018 produces an offshore pumice eruption after lava lakes drain
Ambrym is an active volcanic island in the Vanuatu archipelago consisting of a 12 km-wide summit caldera. Benbow and Marum are two currently active craters within the caldera that have produced lava lakes, explosions, lava flows, ash, and gas emissions, in addition to fissure eruptions. More recently, a submarine fissure eruption in December 2018 produced lava fountains and lava flows, which resulted in the drainage of the active lava lakes in both the Benbow and Marum craters (BGVN 44:01). This report updates information from January 2019 through March 2020, including the submarine pumice eruption during December 2018 using information from the Vanuatu Meteorology and Geohazards Department (VMGD) and research by Shreve et al. (2019).
Activity on 14 December 2018 consisted of thermal anomalies located in the lava lake that disappeared over a 12-hour time period; a helicopter flight on 16 December confirmed the drainage of the summit lava lakes as well as a partial collapse of the Benbow and Marum craters (figure 49). During 14-15 December, a lava flow (figure 49), accompanied by lava fountaining, was observed originating from the SE flank of Marum, producing SO2 and ash emissions. A Mw 5.6 earthquake at 2021 on 15 December marked the beginning of a dike intrusion into the SE rift zone as well as a sharp increase in seismicity (Shreve et al., 2019). This intrusion extended more than 30 km from within the caldera to beyond the east coast, with a total volume of 419-532 x 106 m3 of magma. More than 2 m of coastal uplift was observed along the SE coast due to the asymmetry of the dike from December, resulting in onshore fractures.
Shreve et al. (2019) state that although the dike almost reached the surface, magma did not erupt from the onshore fractures; only minor gas emissions were detected until 17 December. An abrupt decrease in the seismic moment release on 17 December at 1600 marked the end of the dike propagation (figure 50). InSAR-derived models suggested an offshore eruption (Shreve et al., 2019). This was confirmed on 18-19 December when basaltic pumice, indicating a subaqueous eruption, was collected on the beach near Pamal and Ulei. Though the depth and exact location of the fissure has not been mapped, the nature of the basaltic pumice would suggest it was a relatively shallow offshore eruption, according to Shreve et al. (2019).
In the weeks following the dike emplacement, there was more than 2 m of subsidence measured at both summit craters identified using ALOS-2 and Sentinel-1 InSAR data. After 22 December, no additional large-scale deformation was observed, though a localized discontinuity (less than 12 cm) measured across the fractures along the SE coast in addition to seismicity suggested a continuation of the distal submarine eruption into late 2019. Additional pumice was observed on 3 February 2019 near Pamal village, suggesting possible ongoing activity. These surveys also noted that no gas-and-steam emissions, lava flows, or volcanic gases were emitted from the recently active cracks and faults on the SE cost of Ambrym.
During February-October 2019, onshore activity at Ambrym declined to low levels of unrest, according to VMGD. The only activity within the summit caldera consisted of gas-and-steam emissions, with no evidence of the previous lava lakes (figure 51). Intermittent seismicity and gas-and-steam emissions continued to be observed at Ambrym and offshore of the SE coast. Mével et al. (2019) installed three Trillium Compact 120s posthole seismometers in the S and E part of Ambrym from 25 May to 5 June 2019. They found that there were multiple seismic events, including a Deep-Long Period event and mixed up/down first motions at two stations near the tip of the dike intrusion and offshore of Pamal at depths of 15-20 km below sea level. Based on a preliminary analysis of these data, Mével et al. (2019) interpreted the observations as indicative of ongoing volcanic seismicity in the region of the offshore dike intrusion and eruption.
Seismicity was no longer reported from 10 October 2019 through March 2020. Thermal anomalies were not detected in satellite data except for one in late April and one in early September 2019, according to MODIS thermal infrared data analyzed by the MIROVA system. The most recent report from VMGD was issued on 27 March 2020, which noted low-level unrest consisting of dominantly gas-and-steam emissions.
References:
Shreve T, Grandin R, Boichu M, Garaebiti E, Moussallam Y, Ballu V, Delgado F, Leclerc F, Vallée M, Henriot N, Cevuard S, Tari D, Lebellegard P, Pelletier B, 2019. From prodigious volcanic degassing to caldera subsidence and quiescence at Ambrym (Vanuatu): the influence of regional tectonics. Sci. Rep. 9, 18868. https://doi.org/10.1038/s41598-019-55141-7.
Mével H, Roman D, Brothelande E, Shimizu K, William R, Cevuard S, Garaebiti E, 2019. The CAVA (Carnegie Ambrym Volcano Analysis) Project - a Multidisciplinary Characterization of the Structure and Dynamics of Ambrym Volcano, Vanuatu. American Geophysical Union, Fall 2019 Meeting, Abstract and Poster V43C-0201.
Geologic Background. Ambrym, a large basaltic volcano with a 12-km-wide caldera, is one of the most active volcanoes of the New Hebrides Arc. A thick, almost exclusively pyroclastic sequence, initially dacitic then basaltic, overlies lava flows of a pre-caldera shield volcano. The caldera was formed during a major Plinian eruption with dacitic pyroclastic flows about 1,900 years ago. Post-caldera eruptions, primarily from Marum and Benbow cones, have partially filled the caldera floor and produced lava flows that ponded on the floor or overflowed through gaps in the caldera rim. Post-caldera eruptions have also formed a series of scoria cones and maars along a fissure system oriented ENE-WSW. Eruptions have apparently occurred almost yearly during historical time from cones within the caldera or from flank vents. However, from 1850 to 1950, reporting was mostly limited to extra-caldera eruptions that would have affected local populations.
Information Contacts: Geo-Hazards Division, Vanuatu Meteorology and Geo-Hazards Department (VMGD), Ministry of Climate Change Adaptation, Meteorology, Geo-Hazards, Energy, Environment and Disaster Management, Private Mail Bag 9054, Lini Highway, Port Vila, Vanuatu (URL: http://www.vmgd.gov.vu/, https://www.facebook.com/VanuatuGeohazardsObservatory/); MIROVA (Middle InfraRed Observation of Volcanic Activity), a collaborative project between the Universities of Turin and Florence (Italy) supported by the Centre for Volcanic Risk of the Italian Civil Protection Department (URL: http://www.mirovaweb.it/); Sentinel Hub Playground (URL: https://www.sentinel-hub.com/explore/sentinel-playground); Global Sulfur Dioxide Monitoring Page, Atmospheric Chemistry and Dynamics Laboratory, NASA Goddard Space Flight Center (NASA/GSFC), 8800 Greenbelt Road, Goddard, Maryland, USA (URL: https://so2.gsfc.nasa.gov/).
Cleveland (United States) — March 2020 Cite this Report
Cleveland
United States
52.825°N, 169.944°W; summit elev. 1730 m
All times are local (unless otherwise noted)
Intermittent thermal anomalies and lava dome subsidence, February 2019-January 2020
Cleveland is a stratovolcano located in the western portion of Chuginadak Island, a remote island part of the east central Aleutians. Common volcanism has included small lava flows, explosions, and ash clouds. Intermittent lava dome growth, small ash explosions, and thermal anomalies have characterized more recent activity (BGVN 44:02). For this reporting period during February 2019-January 2020, activity largely consisted of gas-and-steam emissions and intermittent thermal anomalies within the summit crater. The primary source of information comes from the Alaska Volcano Observatory (AVO) and various satellite data.
Low levels of unrest occurred intermittently throughout this reporting period with gas-and-steam emissions and thermal anomalies as the dominant type of activity (figures 30 and 31). An explosion on 9 January 2019 was followed by lava dome growth observed during 12-16 January. Suomi NPP/VIIRS sensor data showed two hotspots on 8 and 14 February 2019, though there was no evidence of lava within the summit crater at that time. According to satellite imagery from AVO, the lava dome was slowly subsiding during February into early March. Elevated surface temperatures were detected on 17 and 24 March in conjunction with degassing; another gas-and-steam plume was observed rising from the summit on 30 March. Thermal anomalies were again seen on 15 and 28 April using Suomi NPP/VIIRS sensor data. Intermittent gas-and-steam emissions continued as the number of detected thermal anomalies slightly increased during the next month, occurring on 1, 7, 15, 18, and 23 May. A gas-and-steam plume was observed on 9 May.
There were 10 thermal anomalies observed in June, and 11 each in July and August. Typical mild degassing was visible when photographed on 9 August (figure 32). On 14 August, seismicity increased, which included a swarm of a dozen local earthquakes. The lava dome emplaced in January was clearly visible in satellite imagery (figure 33). The number of thermal anomalies decreased the next month, occurring on 10, 21, and 25 September. During this month, a gas-and-steam plume was observed in a webcam image on 6, 8, 20, and 25 September. On 3-6, 10, and 21 October elevated surface temperatures were recorded as well as small gas-and-steam plumes on 4, 7, 13, and 20-25 October.
Four thermal anomalies were detected on 3, 6, and 8-9 November. According to a VONA report from AVO on 8 November, satellite data suggested possible slow lava effusion in the summit crater; however, by the 15th no evidence of eruptive activity had been seen in any data sources. Another thermal anomaly was observed on 14 January 2020. Gas-and-steam emissions observed in webcam images continued intermittently.
MIROVA (Middle InfraRed Observation of Volcanic Activity) analysis of MODIS satellite data shows intermittent weak thermal anomalies within 5 km of the crater summit during mid-April through November 2019 with a larger cluster of activity in early June, late July and early October (figure 30). Thermal satellite imagery from Sentinel-2 also detected weak thermal anomalies within the summit crater throughout the reporting period, occasionally accompanied by gas-and-steam plumes (figure 31).
Geologic Background. The beautifully symmetrical Mount Cleveland stratovolcano is situated at the western end of the uninhabited Chuginadak Island. It lies SE across Carlisle Pass strait from Carlisle volcano and NE across Chuginadak Pass strait from Herbert volcano. Joined to the rest of Chuginadak Island by a low isthmus, Cleveland is the highest of the Islands of the Four Mountains group and is one of the most active of the Aleutian Islands. The native name, Chuginadak, refers to the Aleut goddess of fire, who was thought to reside on the volcano. Numerous large lava flows descend the steep-sided flanks. It is possible that some 18th-to-19th century eruptions attributed to Carlisle should be ascribed to Cleveland (Miller et al., 1998). In 1944 it produced the only known fatality from an Aleutian eruption. Recent eruptions have been characterized by short-lived explosive ash emissions, at times accompanied by lava fountaining and lava flows down the flanks.
Information Contacts: Alaska Volcano Observatory (AVO), a cooperative program of a) U.S. Geological Survey, 4200 University Drive, Anchorage, AK 99508-4667 USA (URL: https://avo.alaska.edu/), b) Geophysical Institute, University of Alaska, PO Box 757320, Fairbanks, AK 99775-7320, USA, and c) Alaska Division of Geological & Geophysical Surveys, 794 University Ave., Suite 200, Fairbanks, AK 99709, USA (URL: http://dggs.alaska.gov/); MIROVA (Middle InfraRed Observation of Volcanic Activity), a collaborative project between the Universities of Turin and Florence (Italy) supported by the Centre for Volcanic Risk of the Italian Civil Protection Department (URL: http://www.mirovaweb.it/); Sentinel Hub Playground (URL: https://www.sentinel-hub.com/explore/sentinel-playground); NASA Worldview (URL: https://worldview.earthdata.nasa.gov/).
Copahue (Chile-Argentina) — March 2020 Cite this Report
Copahue
Chile-Argentina
37.856°S, 71.183°W; summit elev. 2953 m
All times are local (unless otherwise noted)
Ash emissions end on 12 November; lake returns to El Agrio Crater in December 2019
Most of the large edifice of Copahue lies high in the central Chilean Andes, but the active El Agrio crater lies on the Argentinian side of the border at the W edge of the Pliocene Caviahue caldera. Infrequent mild-to-moderate explosive eruptions have been recorded since the 18th century. The most recent eruptive episode began with phreatic explosions and ash emissions on 2 August 2019 that continued until mid-November 2019. This report summarizes activity from November 2019 through February 2020 and is based on reports issued by Servicio Nacional de Geología y Minería (SERNAGEOMIN) Observatorio Volcanológico de Los Andes del Sur (OVDAS), Buenos Aires Volcanic Ash Advisory Center (VAAC), satellite data, and photographs from nearby residents.
MIROVA data indicated a few weak thermal anomalies during mid-October to mid-November 2019. Multiple continuous ash emissions were reported daily until mid-November when activity declined significantly. By mid-December the lake inside El Agrio crater had reappeared and occasional steam plumes were the only reported surface activity at Copahue through February 2020.
The Buenos Aires VAAC and SERNAGEOMIN both reported continuous ash emissions during 1-9 November 2019 that were visible in the webcam. Satellite imagery recorded the plumes drifting generally E or NE at 3.0-4.3 km altitude (figure 49). Most of the emissions on 10 November were steam (figure 50). The last pulse of ash emissions occurred on 12 November with an ash plume visible moving SE at 3 km altitude in satellite imagery and a strong thermal anomaly (figure 51). The following day emissions were primarily steam and gas. SERNAGEOMIN noted the ash emissions rising around 800 m above El Agrio crater and also reported incandescence visible during most nights through mid-November. During the second half of November the constant degassing was primarily water vapor with occasional nighttime incandescence. Steam plumes rose 450 m above the crater on 27 November.
Nighttime incandescence was last observed in the SERNAGEOMIN webcam on 1 December; SERNAGEOMIN lowered the alert level from Yellow to Green on 15 December 2019. Throughout December degassing consisted mainly of minor steam plumes (figure 52), the highest plume rose to 300 m above the crater on 18 December, and minor SO2 plumes persisted through the 21st (figure 53),. By mid-December the El Agrio crater lake was returning and satellite images clearly showed the increase in size of the lake through February (figure 54). The only surface activity reported during January and February 2020 was occasional white steam plumes rising near El Agrio crater.
Geologic Background. Volcán Copahue is an elongated composite cone constructed along the Chile-Argentina border within the 6.5 x 8.5 km wide Trapa-Trapa caldera that formed between 0.6 and 0.4 million years ago near the NW margin of the 20 x 15 km Pliocene Caviahue (Del Agrio) caldera. The eastern summit crater, part of a 2-km-long, ENE-WSW line of nine craters, contains a briny, acidic 300-m-wide crater lake (also referred to as El Agrio or Del Agrio) and displays intense fumarolic activity. Acidic hot springs occur below the eastern outlet of the crater lake, contributing to the acidity of the Río Agrio, and another geothermal zone is located within Caviahue caldera about 7 km NE of the summit. Infrequent mild-to-moderate explosive eruptions have been recorded since the 18th century. Twentieth-century eruptions from the crater lake have ejected pyroclastic rocks and chilled liquid sulfur fragments.
Information Contacts: Servicio Nacional de Geología y Minería (SERNAGEOMIN), Observatorio Volcanológico de Los Andes del Sur (OVDAS), Avda Sta María No. 0104, Santiago, Chile (URL: http://www.sernageomin.cl/); MIROVA (Middle InfraRed Observation of Volcanic Activity), a collaborative project between the Universities of Turin and Florence (Italy) supported by the Centre for Volcanic Risk of the Italian Civil Protection Department (URL: http://www.mirovaweb.it/); Sentinel Hub Playground (URL: https://www.sentinel-hub.com/explore/sentinel-playground); Global Sulfur Dioxide Monitoring Page, Atmospheric Chemistry and Dynamics Laboratory, NASA Goddard Space Flight Center (NASA/GSFC), 8800 Greenbelt Road, Goddard, Maryland, USA (URL: https://so2.gsfc.nasa.gov/); Valentina Sepulveda, Hotel Caviahue, Caviahue, Argentina (URL: https://twitter.com/valecaviahue, Twitter:@valecaviahue).
Fernandina (Ecuador) — March 2020 Cite this Report
Fernandina
Ecuador
0.37°S, 91.55°W; summit elev. 1476 m
All times are local (unless otherwise noted)
Fissure eruption produced lava flows during 12-13 January 2020
Fernandina is a volcanic island in the Galapagos islands, around 1,000 km W from the coast of mainland Ecuador. It has produced nearly 30 recorded eruptions since 1800, with the most recent events having occurred along radial or circumferential fissures around the summit crater. The most recent previous eruption, starting on 16 June 2018, lasted two days and produced lava flows from a radial fissure on the northern flank. Monitoring and scientific reports come from the Instituto Geofísico, Escuela Politécnica Nacional (IG-EPN).
A report from IG-EPN on 12 January 2020 stated that there had been an increase in seismicity and deformation occurring during the previous weeks. On the day of the report, 11 seismic events had occurred, with the largest magnitude of 4.7 at a depth of 5 km. Shortly before 1810 that day a circumferential fissure formed below the eastern rim of the La Cumbre crater, at about 1.3-1.4 km elevation, and produced lava flows down the flank (figure 39). A rapid-onset seismic swarm reached maximum intensity at 1650 on 12 January (figure 40); a second increase in seismicity indicating the start of the eruption began around 70 minutes later (1800). A hotspot was observed in NOAA / CIMSS data between 1800 and 1810, and a gas plume rising up to 2 km above the fissure dispersed W to NW. The eruption lasted 9 hours, until about 0300 on 13 January.
A report issued at 1159 local time on 13 January 2020 described a rapid decrease in seismicity, gas emissions, and thermal anomalies, indicating a rapid decline in eruptive activity similar to previous events in 2017 and 2018. An overflight that day confirmed that the eruption had ended, after lava flows had extended around 500 m from the crater and covered an area of 3.8 km2 (figures 41 and 42). Seismicity continued on the 14th, with small volcano-tectonic (VT) earthquakes occurring less than 500 m below the surface. Periodic seismicity was recorded through 13-15 January, though there was an increase in seismicity during 17-22 January with deformation also detected (figure 43). No volcanic activity followed, and no additional gas or thermal anomalies were detected.
Geologic Background. Fernandina, the most active of Galápagos volcanoes and the one closest to the Galápagos mantle plume, is a basaltic shield volcano with a deep 5 x 6.5 km summit caldera. The volcano displays the classic "overturned soup bowl" profile of Galápagos shield volcanoes. Its caldera is elongated in a NW-SE direction and formed during several episodes of collapse. Circumferential fissures surround the caldera and were instrumental in growth of the volcano. Reporting has been poor in this uninhabited western end of the archipelago, and even a 1981 eruption was not witnessed at the time. In 1968 the caldera floor dropped 350 m following a major explosive eruption. Subsequent eruptions, mostly from vents located on or near the caldera boundary faults, have produced lava flows inside the caldera as well as those in 1995 that reached the coast from a SW-flank vent. Collapse of a nearly 1 km3 section of the east caldera wall during an eruption in 1988 produced a debris-avalanche deposit that covered much of the caldera floor and absorbed the caldera lake.
Information Contacts: Instituto Geofísico, Escuela Politécnica Nacional (IG-EPN), Casilla 17-01-2759, Quito, Ecuador (URL: http://www.igepn.edu.ec/); Dirección del Parque Nacional Galápagos (DPNG), Isla Santa Cruz, Galápagos, Ecuador (URL: http://www.galapagos.gob.ec/).
Mayotte
France
12.83°S, 45.17°E; summit elev. 660 m
All times are local (unless otherwise noted)
Seismicity and deformation, with submarine E-flank volcanism starting in July 2018
Mayotte is a volcanic island in the Comoros archipelago between the eastern coast of Africa and the northern tip of Madagascar. A chain of basaltic volcanism began 10-20 million years ago and migrating W, making up four principal volcanic islands, according to the Institut de Physique du Globe de Paris (IPGP) and Cesca et al. (2020). Before May 2010, only two seismic events had been felt by the nearby community within recent decades. New activity since May 2018 consists of dominantly seismic events and lava effusion. The primary source of information for this report through February 2020 comes from semi-monthly reports from the Réseau de Surveillance Volcanologique et Sismologique de Mayotte (REVOSIMA), a cooperative program between the Institut de Physique du Globe de Paris (IPGP), the Bureau de Recherches Géologiques et Minières (BRGM), and the Observatoire Volcanologique du Piton de la Fournaise (OVPF-IPGP); Lemoine et al. (2019), the Centre National de la Recherche Scientifique (CNRS), and the Institut Français de Recherche pour l'Exploitation de la Mer (IFREMER).
Seismicity was the dominant type of activity recorded in association with a new submarine eruption. On 10 May 2018, the first seismic event occurred at 0814, detected by the YTMZ accelerometer from the French RAP Network, according to BRGM and Lemoine et al. (2019). Seismicity continued to increase during 13-15 May 2018, with the strongest recorded event for the Comoros area occurring on 15 May at 1848 and two more events on 20-21 May (figure 1). At the time, no surface effusion were directly observed; however, Global Navigation Satellite System (GNSS) instruments were deployed to monitor any ground motion (Lemoine et al. 2019).
Seismicity decreased dramatically after June 2018, with two spikes in August and September (see figure 1). Much of this seismicity occurred offshore 50 km E of Mayotte Island (figure 2). The École Normale Supérieure, the Observatoire Volcanologique du Piton de la Fournaise (OVPF-IPGP), and the REVOSIMA August 2019 bulletin reported that measurements from the GNSS stations and Teria GPS network data indicated eastward surface deformation and subsidence beginning in July 2018. Based on this ground deformation data Lemoine et al. (2019) determined that the eruptive phase began fifty days after the initial seismic events occurred, on 3 July 2018.
Between 2 and 18 May 2019, an oceanographic campaign (MAYOBS 1) discovered a new submarine eruption site 50 km E from the island of Mayotte (figure 2). The director of IPGP, Marc Chaussidon, stated in an interview with Science Magazine that multibeam sonar waves were used to determine the elevation (800 m) and diameter (5 km) of the new submarine cone (figure 3). In addition, this multibeam sonar image showed fluid plumes within the water column rising from the center and flanks of the structure. According to REVOSIMA, these plumes rose to 1 km above the summit of the cone but did not breach the ocean surface. The seafloor image (figure 3) also indicated that as much as 5 km3 of magma erupted onto the seafloor from this new edifice during May 2019, according to Science Magazine.
On 17 May 2019, a second oceanographic campaign (MAYOBS 2) discovered new lava flows located 5 km S of the new eruptive site. BRGM reported that in June a new lava flow had been identified on the W flank of the cone measuring 150 m thick with an estimated volume of 0.3 km3 (figure 4). According to REVOSIMA, the presence of multiple new lava flows would suggest multiple effusion points. Over a period of 11 months (July 2018-June 2019) the rate of lava effusion was at least 150-200 m3/s; between 18 May to 17 June 2019, 0.2 km3 of lava was produced, and from 17 June to 30 July 2019, 0.3 km3 of lava was produced. The MAYOBS 4 (19 July 2019-4 August 2019) and SHOM (20-21 August 2019) missions revealed a new lava flow formed between 31 July and 20 August to the NW of the eruptive site with a volume of 0.08 km3 and covering 3.25 km2.
During the MAYOBS 4 campaign in late July 2019, scientists dredged the NE flank of the cone for samples and took photographs of the newly erupted lava (figure 5). Two dives found the presence of pillow lavas. When samples were brought up to the surface, they exploded due to the large amount of gas and rapid decompression.
During April-May 2019 the rate of ground deformation slowed. Deflation was also observed up to 90 km E of Mayotte in late October 2019 and consistently between August 2019 and February 2020. Seismicity continued intermittently through February 2020 offshore E of Mayotte Island, though the number of detected events started to decrease in July 2018 (see figure 1). Though seismicity and deformation continued, the most recent observation of new lava flows occurred during the MAYOBS 4 and SHOM campaigns on 20 August 2019, as reported in REVOSIMA bulletins.
References: Cesca S, Heimann S, Letort J, Razafindrakoto H N T, Dahm T, Cotton F, 2020. Seismic catalogues of the 2018-2019 volcano-seismic crisis offshore Mayotte, Comoro Islands. Nat. Geosci. 13, 87-93. https://doi.org/10.1038/s41561-019-0505-5.
Lemoine A, Bertil D, Roulle A, Briole P, 2019. The volcano-tectonic crisis of 2018 east of Mayotte, Comoros islands. Preprint submitted to EarthArXiv, 28 February 2019. https://doi.org/10.31223/osf.io/d46xj.
Geologic Background. Mayotte, located in the Mozambique Channel between the northern tip of Madagascar and the eastern coast of Africa, consists two main volcanic islands, Grande Terre and Petite Terre, and roughly twenty islets within a barrier-reef lagoon complex (Zinke et al., 2005; Pelleter et al., 2014). Volcanism began roughly 15-10 million years ago (Pelleter et al., 2014; Nougier et al., 1986), and has included basaltic lava flows, nephelinite, tephrite, phonolitic domes, and pyroclastic deposits (Nehlig et al., 2013). Lavas on the NE were active from about 4.7 to 1.4 million years and on the south from about 7.7 to 2.7 million years. Mafic activity resumed on the north from about 2.9 to 1.2 million years and on the south from about 2 to 1.5 million years. Several pumice layers found in cores on the barrier reef-lagoon complex indicate that volcanism likely occurred less than 7,000 years ago (Zinke et al., 2003). More recent activity that began in May 2018 consisted of seismicity and ground deformation occurring offshore E of Mayotte Island (Lemoine et al., 2019). One year later, in May 2019, a new subaqueous edifice and associated lava flows were observed 50 km E of Petite Terre during an oceanographic campaign.
Information Contacts: Réseau de Surveillance Volcanologique et Sismologique de Mayotte (REVOSIMA), a cooperative program of a) Institut de Physique du Globe de Paris (IPGP), b) Bureau de Recherches Géologiques et Minières (BRGM), c) Observatoire Volcanologique du Piton de la Fournaise (OVPF-IPGP); (URL: http://www.ipgp.fr/fr/reseau-de-surveillance-volcanologique-sismologique-de-mayotte); Observatoire Volcanologique du Piton de la Fournaise, Institut de Physique du Globe de Paris, 14 route nationale 3, 27 ème km, 97418 La Plaine des Cafres, La Réunion, France (URL: http://www.ipgp.fr/fr); Bureau de Recherches Géologiques et Minières (BRGM), 3 avenue Claude-Guillemin, BP 36009, 45060 Orléans Cedex 2, France (URL: https://www.brgm.fr/); Institut Français de Recherche pour l'Exploitation de la Mer (IFREMER), 1625 route de Sainte-Anne, CS 10070, 29280 Plouzané, France (URL: https://wwz.ifremer.fr/); Centre National de la Recherche Scientifique (CNRS), 3 rue Michel-Ange, 75016 Paris, France (URL: http://www.cnrs.fr/); École Normale Supérieure, 45 rue d'Ulm, F-75230 Paris Cedex 05, France (URL: https://www.ens.psl.eu/); Université de Paris, 85 boulevard Saint-Germain, 75006 Paris, France (URL: https://u-paris.fr/en/498-2/); Roland Pease, Science Magazine (URL: https://science.sciencemag.org/, article at https://www.sciencemag.org/news/2019/05/ship-spies-largest-underwater-eruption-ever) published 21 May 2019.
Nishinoshima (Japan) — March 2020 Cite this Report
Nishinoshima
Japan
27.247°N, 140.874°E; summit elev. 100 m
All times are local (unless otherwise noted)
Ongoing activity enlarges island with lava flows, ash plumes, and incandescent ejecta, December 2019-February 2020
After 40 years of dormancy, Japan’s Nishinoshima volcano, located about 1,000 km S of Tokyo in the Ogasawara Arc, erupted above sea level in November 2013. Lava flows were active through November 2015, emerging from a central pyroclastic cone. A new eruption in mid-2017 continued the growth of the island with ash plumes, ejecta, and lava flows. A short eruptive event in July 2018 produced a new lava flow and vent on the side of the pyroclastic cone. The next eruption of ash plumes, incandescent ejecta, and lava flows, covered in this report, began in early December 2019 and was ongoing through February 2020. Information is provided primarily from the Japan Meteorological Agency (JMA) monthly reports.
Nishinoshima remained quiet after a short eruptive event in July 2018 until MODVOLC thermal alerts appeared on 5 December 2019. Multiple near-daily alerts continued through February 2020. The intermittent low-level thermal anomalies seen in the MIROVA data beginning in May and June 2019 may reflect areas with increased temperatures and fumarolic activity reported by the Japan Coast Guard during overflights in June and July. The significant increase in thermal anomalies in the MIROVA data on 5 December correlates with the beginning of extrusive and explosive activity (figure 63). Eruptive activity included ash emissions, incandescent ejecta, and numerous lava flows from multiple vents that flowed into the sea down several flanks, significantly enlarging the island.
A brief period of activity during 12-21 July 2018 produced explosive activity with blocks and bombs ejected 500 m from a new vent on the E flank of the pyroclastic cone, and a 700-m-long lava flow that stopped about 100 m before reaching the ocean (BGVN 43:09). No further activity was reported during 2018. During overflights on 29 and 31 January, and 7 February 2019, white steam plumes drifted from the E crater margin and inner wall of the pyroclastic cone and discolored waters were present around the island, but no other signs of activity were reported. A survey carried out by the Japan Coast Guard during 7-8 June 2019 reported minor fumarolic activity from the summit crater, and high-temperature areas were noted on the hillsides, measured by infrared thermal imaging equipment. Sulfur dioxide emissions were below the detection limit. In an overflight on 12 July 2019, Coast Guard personnel noted a small white plume rising from the E edge of the summit crater of the pyroclastic cone (figure 64).
The white plume was still present during an overflight on 14 August 2019. Greenish yellow areas of water about 500 m wide were distributed around the island, and a plume of green water extended 1.8 km from the NW coast. Similar conditions were observed on 15 October 2019; pale yellow-green discolored water was about 100 m wide and concentrated on the N shore of Nishinoshima. No steam plume from the summit was present during a visit on 19 November 2019, but yellow-white discolored water on the N shore was about 100 m wide and 700 m long. Along the NE and SE coasts, yellow-white water was 100-200 m wide and about 1,000 m long.
A MODVOLC thermal alert appeared at Nishinoshima on 5 December 2019. An eruption was observed by the Japan Coast Guard the following day. A pulsating light gray ash plume rose from the summit crater accompanied by tephra ejected 200 m above the crater rim every few minutes (figure 65). In addition, ash and tephra rose intermittently from a crater on the E flank of the pyroclastic cone, from which lava also flowed down towards the E coast (figure 66). By 1300 on 7 December the lava was flowing into the sea (figure 67).
Observations by the Japan Coast Guard on 15 December 2019 confirmed that vigorous eruptive activity was ongoing; incandescent ejecta and ash plumes rose 300 m above the summit crater rim (figure 68). A new vent had opened on the N flank of the cone from which lava flowed NW to the sea (figure 69). The lava flow from the E-flank crater also remained active and continued flowing into the sea. The Tokyo VAAC reported an ash emission on 24 December that rose to 1,000 m altitude and drifted S. On 31 December, explosions at the summit continued every few seconds with ash and ejecta rising 300 m high. In addition, lava from the NE flank of the pyroclastic cone flowed NE to the sea (figure 70).
Satellite data from JAXA (Japan Aerospace Exploration Agency) made it possible for JMA to produce maps showing the rapid changes in topography at Nishinoshima resulting from the new lava flows. The new E-flank lava flow was readily seen when comparing imagery from 22 November with 6 December 2019 (figure 71a). An image from 6 December compared with 20 December 2019 shows the flow on the E flank splitting and entering the sea at two locations (figure 71b), the flow on the NW flank traveling briefly N before turning W and forming a large fan into the ocean on the W flank, and a new flow heading NE from the summit area of the pyroclastic cone.
The Tokyo VAAC reported an ash plume visible in satellite imagery on 15 January 2020 that rose to 1.8 km altitude and drifted SE. The Japan Coast Guard conducted an overflight on 17 January that confirmed the continued eruptions of ash, incandescent ejecta, and lava. Dark gray ash plumes were observed at 1.8 km altitude, with ashfall and tephra concentrated around the pyroclastic cone (figure 72). Plumes of steam were visible where the NE lava flow entered the ocean; the E and NW lava entry areas did not appear active but were still hot. Satellite data from ALOS-2 prepared by JAXA confirmed ongoing activity around the summit vent and on the NE flank, while activity on the W flank had ceased (figure 73). An ash plume was reported by the Tokyo VAAC on 25 January; it rose to 1.5 km altitude and drifted SW for most of the day.
On 3 Feburary 2020 the Tokyo VAAC reported an ash plume visible in satellite imagery that rose to 2.1 km altitude and drifted E. The following day the Japan Coast Guard observed eruptions from the summit crater at five minute intervals that produced grayish white plumes. The plumes rose to 2.7 km altitude (figure 74). Large bombs were scattered around the pyroclastic cone, and the summit crater appeared filled with lava except for the active vent. The lava deltas on the NE flank were only active at the tips of the flows producing a few steam jets where lava entered the sea. The active flows were on the SE flank, and a new 200-m-long lava flow was flowing down the N flank of the pyroclastic cone (figure 75). The lava flowing from the E flank of the pyroclastic cone to the SE into the sea, produced larger jets of steam (figure 76). Yellow-brown discolored water appeared around the island in several places.
JAXA satellite data confirmed that the flow activity was concentrated on the NE flank and shore during the second half of January 2020, but also recorded the new flow down the SE flank that was observed by the Coast Guard in early February. By mid-February the satellite topographic data indicated the decrease in activity in the NE flank flows, the increased activity on the SE and E flank, and the extension of the flow moving due N to the coast (figure 77). Observations on 17 February 2020 by the Japan Coast Guard revealed eruptions from the summit crater every few seconds, and steam-and-ash plumes rising about 600 m. Vigorous white emissions rose from fractures near the top of the W flank of the pyroclastic cone, but thermal data indicated the area was no hotter than the surrounding area (figure 78). The lava flow on the SE coast still had steam emissions rising from the ocean entry point, but activity was weaker than on 4 February. The newest flow moving due N from the summit produced steam emissions where the flow front entered the ocean.
Sulfur dioxide plumes from Nishinoshima have been small and infrequent in recent years, but the renewed and increased eruptive activity beginning in December 2019 produced several small SO2 plumes that were recorded in daily satellite data (figure 79).
Geologic Background. The small island of Nishinoshima was enlarged when several new islands coalesced during an eruption in 1973-74. Multiple eruptions that began in 2013 completely covered the previous exposed surface and continued to enlarge the island. The island is the summit of a massive submarine volcano that has prominent peaks to the S, W, and NE. The summit of the southern cone rises to within 214 m of the ocean surface 9 km SSE.
Information Contacts: Japan Meteorological Agency (JMA), Otemachi, 1-3-4, Chiyoda-ku Tokyo 100-8122, Japan (URL: http://www.jma.go.jp/jma/indexe.html); Japan Aerospace Exploration Agency-Earth Observation Research Center (JAXA-EORC), 7-44-1 Jindaiji Higashi-machi, Chofu-shi, Tokyo 182-8522, Japan (URL: http://www.eorc.jaxa.jp/); Japan Coast Guard (JCG) Volcano Database, Hydrographic and Oceanographic Department, 3-1-1, Kasumigaseki, Chiyoda-ku, Tokyo 100-8932, Japan (URL: http://www.kaiho.mlit.go.jp/info/kouhou/h29/index.html, http://www1.kaiho.mlit.go.jp/GIJUTSUKOKUSAI/kaiikiDB/kaiyo18-e1.htm); MIROVA (Middle InfraRed Observation of Volcanic Activity), a collaborative project between the Universities of Turin and Florence (Italy) supported by the Centre for Volcanic Risk of the Italian Civil Protection Department (URL: http://www.mirovaweb.it/); Tokyo Volcanic Ash Advisory Center (VAAC), 1-3-4 Otemachi, Chiyoda-ku, Tokyo, Japan (URL: http://ds.data.jma.go.jp/svd/vaac/data/); Global Sulfur Dioxide Monitoring Page, Atmospheric Chemistry and Dynamics Laboratory, NASA Goddard Space Flight Center (NASA/GSFC), 8800 Greenbelt Road, Goddard, Maryland, USA (URL: https://so2.gsfc.nasa.gov/); Simon Carn, Geological and Mining Engineering and Sciences, Michigan Technological University, 1400 Townsend Drive, Houghton, MI 49931, USA (URL: http://www.volcarno.com/, Twitter: @simoncarn).
San Miguel (El Salvador) — March 2020 Cite this Report
San Miguel
El Salvador
13.434°N, 88.269°W; summit elev. 2130 m
All times are local (unless otherwise noted)
Small ash emissions during 22 February 2020
San Miguel, locally known as Chaparrastique, is a stratovolcano located in El Salvador. Recent activity has consisted of occasional small ash explosions and ash emissions. Infrequent gas-and-steam and ash emissions were observed during this reporting period of June 2018-March 2020. The primary source of information for this report comes from El Salvador's Servicio Nacional de Estudios Territoriales (SNET) and special reports from the Ministero de Medio Ambiente y Recursos Naturales (MARN) in addition to various satellite data.
Based on Sentinel-2 satellite imagery and analyses of infrared MODIS data, volcanism at San Miguel from June 2018 to mid-February was relatively low, consisting of occasional gas-and-steam emissions. During 2019, a weak thermal anomaly in the summit crater was registered in thermal satellite imagery (figure 27). This thermal anomaly persisted during a majority of the year but was not visible after September 2019; faint gas-and-steam emissions could sometimes be seen rising from the summit crater.
Volcanism was prominent beginning on 13-20 February 2020 when SO2 emissions exceeded 620 tons/day (typical low SO2 values are less than 400 tons/day). During 20-21 February the amplitude of microearthquakes increased and minor emissions of gas-and-steam and SO2 were visible within the crater (figure 28). According to SNET and special reports from MARN, on 22 February at 1055 an ash cloud was visible rising 400 m above the crater rim (figure 29), resulting in minor ashfall in Piedra Azul (5 km SW). That same day RSAM values peaked at 550 units as recorded by the VSM station on the upper N flank, which is above normal values of about 150. Seismicity increased the day after the eruptive activity. Minor gas-and-steam emissions continued to rise 400 m above the crater rim during 23-24 February; the RSAM values fell to 33-97 units. Activity in March was relatively low; some seismicity, including small magnitude earthquakes, occurred during the month in addition to SO2 emissions ranging from 517 to 808 tons/day.
Geologic Background. The symmetrical cone of San Miguel, one of the most active volcanoes in El Salvador, rises from near sea level to form one of the country's most prominent landmarks. A broad, deep, crater complex that has been frequently modified by eruptions recorded since the early 16th century caps the truncated unvegetated summit, also known locally as Chaparrastique. Flanks eruptions of the basaltic-andesitic volcano have produced many lava flows, including several during the 17th-19th centuries that extended to the N, NE, and SE. The SE-flank flows are the largest and form broad, sparsely vegetated lava fields crossed by highways and a railroad skirting the base of the volcano. Flank vent locations have migrated higher on the edifice during historical time, and the most recent activity has consisted of minor ash eruptions from the summit crater.
Information Contacts: Servicio Nacional de Estudios Territoriales (SNET), Ministero de Medio Ambiente y Recursos Naturales (MARN), Km. 5½ Carretera a Nueva San Salvador, Avenida las Mercedes, San Salvador, El Salvador (URL: http://www.snet.gob.sv/ver/vulcanologia); Sentinel Hub Playground (URL: https://www.sentinel-hub.com/explore/sentinel-playground).
Ubinas
Peru
16.345°S, 70.8972°W; summit elev. 5608 m
All times are local (unless otherwise noted)
Explosions produced ash plumes in September 2019; several lahars generated in January and February 2020
Ubinas, located 70 km from the city of Arequipa in Peru, has produced frequent eruptions since 1550 characterized by ash plumes, ballistic ejecta (blocks and bombs), some pyroclastic flows, and lahars. Activity is focused at the summit crater (figure 53). A new eruptive episode began on 24 June 2019, with an ash plume reaching 12 km altitude on 19 July. This report summarizes activity during September 2019 through February 2020 and is based on agency reports and satellite data.
Prior to September 2019 the last explosion occurred on 22 July. At 2145 on 1 September moderate, continuous ash emission occurred reaching nearly 1 km above the crater. An explosion produced an ash plume at 1358 on the 3rd that reached up to 1.3 km above the summit; six minutes later ashfall and lapilli up to 1.5 cm in diameter was reported 6 km away, with ashfall reported up to 8 km away (figure 54 and 55). Three explosions produced ash plumes at 0456, 0551, and 0844 on 4 September, with the two later ash plumes reaching around 2 km above the crater. The ash plume dispersed to the south and ashfall was reported in Ubinas, Tonohaya, San Miguel, Anascapa, Huatahua, Huarina, and Matalaque, reaching a thickness of 1 mm in Ubinas.
During 8-9 September there were three explosions generating ash plumes to less than 2.5 km, with the largest occurring at 1358 and producing ashfall in the Moquegua region to the south. Following these events, gas and water vapor were continuously emitted up to 1 km above the crater. There was an increase in seismicity during the 10-11th and an explosion produced a 1.5 km high (above the crater) ash plume at 0726 on the 12th, which dispersed to the S and SE (figure 56). During 10-15 September there was continuous emission of gas (blue in color) and steam up to 1.5 km above the volcano. Gas emission, thermal anomalies, and seismicity continued during 16-29 September, but no further explosions were recorded.
Throughout October activity consisted of seismicity, elevated temperatures within the crater, and gas emissions reaching 800 to 1,500 m above the crater. No explosions were recorded. Drone footage released in early October (figure 57) shows the gas emissions and provided a view of the crater floor (figure 58). On the 15th IGP reported that the likelihood of an eruption had reduced.
Similar activity continued through early November with no reported explosions, and the thermal anomalies were no longer detected at the end of November (figure 59), although a faint thermal anomaly was visible in Sentinel-2 data in mid-December (figure 60). A rockfall occurred at 1138 on 13 November down the Volcanmayo gorge.
There were no explosions during January or February 2020, with seismicity and reduced gas emissions continuing. There was a small- to moderate-volume lahar generated at 1620 on 4 January down the SE flank. A second moderate- to high-volume lahar was generated at 1532 on 24 February, and three more lahars at 1325 and 1500 on 29 February, and at 1601 on 1 March, moved down the Volcanmayo gorge and the Sacohaya river channel. The last three lahars were of moderate to large volume.
Geologic Background. The truncated appearance of Ubinas, Perú's most active volcano, is a result of a 1.4-km-wide crater at the summit. It is the northernmost of three young volcanoes located along a regional structural lineament about 50 km behind the main volcanic front. The growth and destruction of Ubinas I was followed by construction of Ubinas II beginning in the mid-Pleistocene. The upper slopes of the andesitic-to-rhyolitic Ubinas II stratovolcano are composed primarily of andesitic and trachyandesitic lava flows and steepen to nearly 45°. The steep-walled, 150-m-deep summit crater contains an ash cone with a 500-m-wide funnel-shaped vent that is 200 m deep. Debris-avalanche deposits from the collapse of the SE flank about 3,700 years ago extend 10 km from the volcano. Widespread Plinian pumice-fall deposits include one from about 1,000 years ago. Holocene lava flows are visible on the flanks, but activity documented since the 16th century has consisted of intermittent minor-to-moderate explosive eruptions.
Information Contacts: Observatorio Volcanologico del INGEMMET (Instituto Geológical Minero y Metalúrgico), Barrio Magisterial Nro. 2 B-16 Umacollo - Yanahuara Arequipa, Peru (URL: http://ovi.ingemmet.gob.pe); Instituto Geofisico del Peru (IGP), Calle Badajoz N° 169 Urb. Mayorazgo IV Etapa, Ate, Lima 15012, Perú (URL: https://www.gob.pe/igp); MIROVA (Middle InfraRed Observation of Volcanic Activity), a collaborative project between the Universities of Turin and Florence (Italy) supported by the Centre for Volcanic Risk of the Italian Civil Protection Department (URL: http://www.mirovaweb.it/); Planet Labs, Inc. (URL: https://www.planet.com/); Sentinel Hub Playground (URL: https://www.sentinel-hub.com/explore/sentinel-playground).
Unnamed
Tonga
18.325°S, 174.365°W; summit elev. -40 m
All times are local (unless otherwise noted)
Additional details and pumice raft drift maps from the August 2019 submarine eruption
In the northern Tonga region, approximately 80 km NW of Vava’u, large areas of floating pumice, termed rafts, were observed starting as early as 7 August 2019. The area of these andesitic pumice rafts was initially 195 km2 with the layers measuring 15-30 cm thick and were produced 200 m below sea level (Jutzeler et al. 2020). The previous report (BGVN 44:11) described the morphology of the clasts and the rafts, and their general westward path from 9 August to 9 October 2019, with the first sighting occurring on 9 August NW of Vava’u in Tonga. This report updates details regarding the submarine pumice raft eruption in early August 2019 using new observations and data from Brandl et al. (2019) and Jutzeler et al. (2020).
The NoToVE-2004 (Northern Tonga Vents Expedition) research cruise on the RV Southern Surveyor (SS11/2004) from the Australian CSIRO Marine National Facility traveled to the northern Tonga Arc and discovered several submarine basalt-to-rhyolite volcanic centers (Arculus, 2004). One of these volcanic centers 50 km NW of Vava’u was the unnamed seamount (volcano number 243091) that had erupted in 2001 and again in 2019, unofficially designated “Volcano F” for reference purposes by Arculus (2004) and also used by Brandl et al. (2019). It is a volcanic complex that rises more than 1 km from the seafloor with a central 6 x 8.7 km caldera and a volcanic apron measuring over 50 km in diameter (figures 19 and 20). Arculus (2004) described some of the dredged material as “fresh, black, plagioclase-bearing lava with well-formed, glassy crusts up to 2cm thick” from cones by the eastern wall of the caldera; a number of apparent flows, lava or debris, were observed draping over the northern wall of the caldera.
The International Seismological Centre (ISC) Preliminary Bulletin listed a particularly strong (5.7 Mw) earthquake at 2201 local time on 5 August, 15 km SSW of the volcano at a depth of 10 km (Brandl et al. 2019). This event was followed by six slightly lower magnitude earthquakes over the next two days.
Sentinel-2 satellite imagery showed two concentric rings originating from a point source (18.307°S 174.395°W) on 6 August (figure 21), which could be interpreted as small weak submarine plumes or possibly a series of small volcanic cones, according to Brandl et al. (2019). The larger ring is about 1.2 km in diameter and the smaller one measures 250 m. By 8 August volcanic activity had decreased, but the pumice rafts that were produced remained visible through at least early October (BGVN 44:11). Brandl et al. (2019) states that, due to the lack of continued observed activity rising from this location, the eruption was likely a 2-day-long event during 6-8 August.
The pumice was first observed on 9 August occurred up to 56 km from the point of origin, according to Jutzeler et al. (2020). By calculating the velocity (14 km/day) of the raft using three satellites, Jutzeler et al. (2020) determined the pumice was erupted immediately after the satellite image of the submarine plumes on 6 August (UTC time). Minor activity at the vent may have continued on 8 and 11 August (UTC time) with pale blue-green water discoloration (figure 22) and a small (less than 1 km2) diffuse pumice raft 2-5 km from the vent.
Continuous observations using various satellite data and observations aboard the catamaran ROAM tracked the movement and extent of the pumice raft that was produced during the submarine eruption in early August (figure 23). The first visible pumice raft was observed on 8 August 2019, covering more than 136.7 km2 between the volcanic islands of Fonualei and Late and drifting W for 60 km until 9 August (Brandl et al. 2019; Jutzeler 2020). The next day, the raft increased to 167.2-195 km2 while drifting SW for 74 km until 14 August. Over the next three days (10-12 August) the size of the raft briefly decreased in size to less than 100 km2 before increasing again to 157.4 km2 on 14 August; at least nine individual rafts were mapped and identified on satellite imagery (Brandl et al. 2019). On 15 August sailing vessels observed a large pumice raft about 75 km W of Late Island (see details in BGVN 44:11), which was the same one as seen in satellite imagery on 8 August.
By 17 August high-resolution satellite images showed an area of large and small rafts measuring 222 km2 and were found within a field of smaller rafts for a total extent of 1,350 km2, which drifted 73 km NNW through 22 August before moving counterclockwise for three days (figure f; Jutzeler et al., 2020). Small pumice ribbons encountered the Oneata Lagoon on 30 August, the first island that the raft came into contact (Jutzeler et al. 2020). By 2 September, the main raft intersected with Lakeba Island (460 km from the source) (figure 24), breaking into smaller ribbons that started to drift W on 8 September. On 19 September the small rafts (less than 100 m x less than 2 km) entered the strait between Viti Levu and Vanua Levu, the two main islands of Fiji, while most of the others were stranded 60 km W in the Yasawa Islands for more than two months (Jutzeler et al., 2020).
References: Arculus R J, SS2004/11 shipboard scientists, 2004. SS11/2004 Voyage Summary: NoToVE-2004 (Northern Tonga Vents Expedition): submarine hydrothermal plume activity and petrology of the northern Tofua Arc, Tonga. https://www.cmar.csiro.au/data/trawler/survey_details.cfm?survey=SS200411
Brandl P A, Schmid F, Augustin N, Grevemeyer I, Arculus R J, Devey C W, Petersen S, Stewart M , Kopp K, Hannington M D, 2019. The 6-8 Aug 2019 eruption of ‘Volcano F’ in the Tofua Arc, Tonga. Journal of Volcanology and Geothermal Research: https://doi.org/10.1016/j.jvolgeores.2019.106695
Jutzeler M, Marsh R, van Sebille E, Mittal T, Carey R, Fauria K, Manga M, McPhie J, 2020. Ongoing Dispersal of the 7 August 2019 Pumice Raft From the Tonga Arc in the Southwestern Pacific Ocean. AGU Geophysical Research Letters: https://doi.orh/10.1029/2019GL086768.
Geologic Background. A submarine volcano along the Tofua volcanic arc ~45 km NW of Vava'u Island was first observed in September 2001, ~35 km S of Fonualei and 60 km NE of Late volcano. The site of the eruption is at an approximate bathymetric depth of 300 m. T-phase waves were recorded on 27-28 September 2001, and on the 27th local fishermen observed an ash-rich eruption column that rose above the ocean surface. No eruptive activity was reported after the 28th, but water discoloration was documented the following month. In early November rafts and strandings of dacitic pumice were reported along the coasts of Kadavu and Viti Levu in Fiji. The depth of the summit of the submarine cone following the eruption was determined to be 40 m during a 2007 survey; the crater of the 2001 eruption was open to the E.
Information Contacts: Jan Steffen, Communication and Media, GEOMAR Helmholtz Centre for Ocean Research, Kiel, Germany; Sentinel Hub Playground (URL: https://www.sentinel-hub.com/explore/sentinel-playground).
Yasur
Vanuatu
19.532°S, 169.447°E; summit elev. 361 m
All times are local (unless otherwise noted)
Strombolian activity continues during June 2019 through February 2020
Yasur has remained on Alert Level 2 (on a scale of 0-4) since 18 October 2016, indicating "Major Unrest; Danger Zone remains at 395 m around the eruptive vents." The summit crater contains several active vents that frequently produce Strombolian explosions and gas plumes (figure 60). This bulletin summarizes activity during June 2019 through February 2020 and is based on reports by the Vanuatu Meteorology and Geo-Hazards Department (VMGD), visitor photographs and videos, and satellite data.
A VMGD report on 27 June described ongoing Strombolian explosions with major unrest confined to the crater. The 25 July report noted the continuation of Strombolian activity with some strong explosions, and a warning that volcanic bombs may impact outside of the crater area (figure 61).
No VMGD report was available for August, but Strombolian activity continued with gas emissions and explosions, as documented by visitors (figure 62). The eruption continued through September and October with some strong explosions and multiple active vents visible in thermal satellite imagery (figure 63). Strombolian explosions ejecting fluid lava from rapidly expanding gas bubbles were recorded during October, and likely represented the typical activity during the surrounding months (figure 64). Along with vigorous degassing producing a persistent plume there was occasional ash content (figure 65). At some point during 20-29 October a small landslide occurred along the eastern inner wall of the crater, visible in satellite images and later confirmed to have produced ashfall at the summit (figure 66).
Continuous explosive activity continued in November-February with some stronger explosions recorded along with accompanying gas emissions. Gas plumes of sulfur dioxide were detected by satellite sensors on some days through this period (figure 67) and ash content was present at times (figure 68). Thermal anomalies continued to be detected by satellite sensors with varying intensity, and with a reduction in intensity in February, as seen in Sentinel-2 imagery and the MIROVA system (figures 69 and 70).
Geologic Background. Yasur has exhibited essentially continuous Strombolian and Vulcanian activity at least since Captain Cook observed ash eruptions in 1774. This style of activity may have continued for the past 800 years. Located at the SE tip of Tanna Island in Vanuatu, this pyroclastic cone has a nearly circular, 400-m-wide summit crater. The active cone is largely contained within the small Yenkahe caldera, and is the youngest of a group of Holocene volcanic centers constructed over the down-dropped NE flank of the Pleistocene Tukosmeru volcano. The Yenkahe horst is located within the Siwi ring fracture, a 4-km-wide open feature associated with eruption of the andesitic Siwi pyroclastic sequence. Active tectonism along the Yenkahe horst accompanying eruptions has raised Port Resolution harbor more than 20 m during the past century.
Information Contacts: Geo-Hazards Division, Vanuatu Meteorology and Geo-Hazards Department (VMGD), Ministry of Climate Change Adaptation, Meteorology, Geo-Hazards, Energy, Environment and Disaster Management, Private Mail Bag 9054, Lini Highway, Port Vila, Vanuatu (URL: http://www.vmgd.gov.vu/, https://www.facebook.com/VanuatuGeohazardsObservatory/); MIROVA (Middle InfraRed Observation of Volcanic Activity), a collaborative project between the Universities of Turin and Florence (Italy) supported by the Centre for Volcanic Risk of the Italian Civil Protection Department (URL: http://www.mirovaweb.it/); Sentinel Hub Playground (URL: https://www.sentinel-hub.com/explore/sentinel-playground); Planet Labs, Inc. (URL: https://www.planet.com/); Global Sulfur Dioxide Monitoring Page, Atmospheric Chemistry and Dynamics Laboratory, NASA Goddard Space Flight Center (NASA/GSFC), 8800 Greenbelt Road, Goddard, Maryland, USA (URL: https://so2.gsfc.nasa.gov/); Justin Noonan (URL: https://www.justinnoonan.com/, Instagram: https://www.instagram.com/justinnoonan_/); Doro Adventures (Twitter: https://twitter.com/DoroAdventures, URL: http://doroadventures.com/).