Recently Published Bulletin Reports
Erebus (Antarctica) Lava lake remains active; most thermal alerts recorded since 2019
Rincon de la Vieja (Costa Rica) Frequent phreatic explosions during July-December 2023
Bezymianny (Russia) Explosion on 18 October 2023 sends ash plume 8 km high; lava flows and incandescent avalanches
Kilauea (United States) Low-level lava effusions in the lava lake at Halema’uma’u during July-December 2022
Nyamulagira (DR Congo) Lava flows and thermal activity during May-October 2023
Bagana (Papua New Guinea) Explosions, ash plumes, ashfall, and lava flows during April-September 2023
Mayon (Philippines) Lava flows, pyroclastic flows, ash emissions, and seismicity during April-September 2023
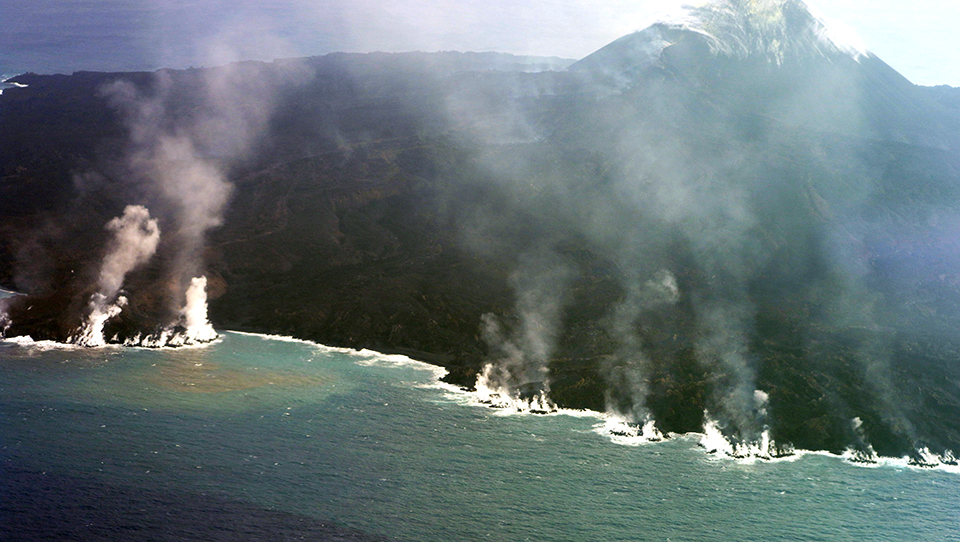
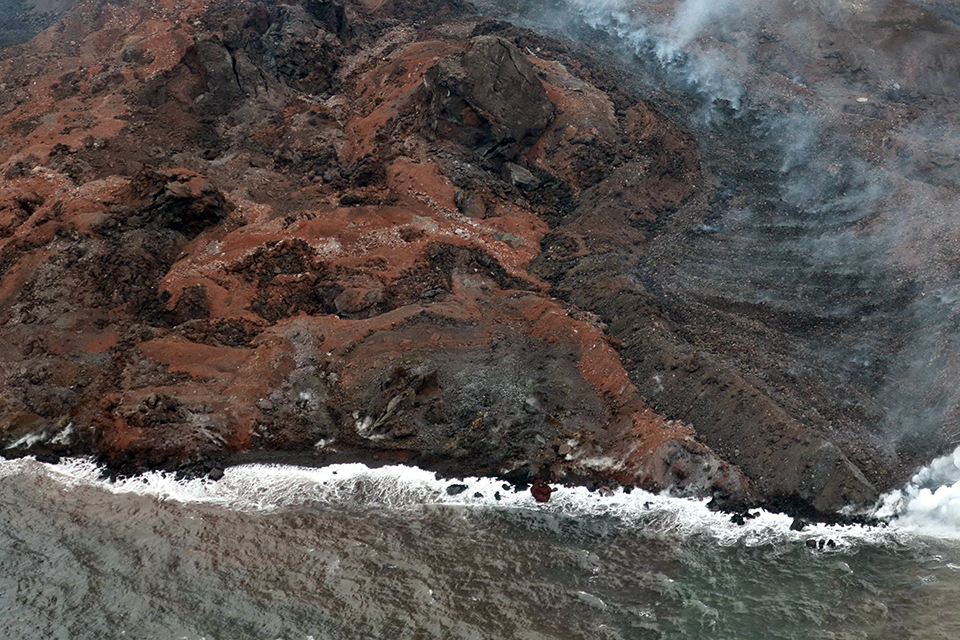
Nishinoshima (Japan) Eruption plumes and gas-and-steam plumes during May-August 2023
Krakatau (Indonesia) White gas-and-steam plumes and occasional ash plumes during May-August 2023
Villarrica (Chile) Strombolian activity, gas-and-ash emissions, and crater incandescence during April-September 2023
Merapi (Indonesia) Frequent incandescent avalanches during April-September 2023
Ebeko (Russia) Moderate explosive activity with ash plumes continued during June-November 2023
Erebus (Antarctica) — January 2024  Cite this Report
Erebus
Antarctica
77.53°S, 167.17°E; summit elev. 3794 m
All times are local (unless otherwise noted)
Lava lake remains active; most thermal alerts recorded since 2019
The lava lake in the summit crater of Erebus has been active since at least 1972. Located in Antarctica overlooking the McMurdo Station on Ross Island, it is the southernmost active volcano on the planet. Because of the remote location, activity is primarily monitored by satellites. This report covers activity during 2023.
The number of thermal alerts recorded by the Hawai'i Institute of Geophysics and Planetology’s MODVOLC Thermal Alerts System increased considerably in 2023 compared to the years 2020-2022 (table 9). In contrast to previous years, the MODIS instruments aboard the Aqua and Terra satellites captured data from Erebus every month during 2023. Consistent with previous years, the lowest number of anomalous pixels were recorded in January, November, and December.
Table 9. Number of monthly MODIS-MODVOLC thermal alert pixels recorded at Erebus during 2017-2023. See BGVN 42:06 for data from 2000 through 2016. The table was compiled using data provided by the HIGP – MODVOLC Thermal Alerts System.
| Year |
Jan |
Feb |
Mar |
Apr |
May |
Jun |
Jul |
Aug |
Sep |
Oct |
Nov |
Dec |
SUM |
| 2017 |
0 |
21 |
9 |
0 |
0 |
1 |
11 |
61 |
76 |
52 |
0 |
3 |
234 |
| 2018 |
0 |
21 |
58 |
182 |
55 |
17 |
137 |
172 |
103 |
29 |
0 |
0 |
774 |
| 2019 |
2 |
21 |
162 |
151 |
55 |
56 |
75 |
53 |
29 |
19 |
1 |
0 |
624 |
| 2020 |
0 |
2 |
16 |
18 |
4 |
4 |
1 |
3 |
18 |
3 |
1 |
6 |
76 |
| 2021 |
0 |
9 |
1 |
0 |
2 |
56 |
46 |
47 |
35 |
52 |
5 |
3 |
256 |
| 2022 |
1 |
13 |
55 |
22 |
15 |
32 |
39 |
19 |
31 |
11 |
0 |
0 |
238 |
| 2023 |
2 |
33 |
49 |
82 |
41 |
32 |
70 |
64 |
42 |
17 |
5 |
11 |
448 |
Sentinel-2 infrared images showed one or two prominent heat sources within the summit crater, accompanied by adjacent smaller sources, similar to recent years (see BGVN 46:01, 47:02, and 48:01). A unique image was obtained on 25 November 2023 by the OLI-2 (Operational Land Imager-2) on Landsat 9, showing the upper part of the volcano surrounded by clouds (figure 32).
Geologic Background. Mount Erebus, the world's southernmost historically active volcano, overlooks the McMurdo research station on Ross Island. It is the largest of three major volcanoes forming the crudely triangular Ross Island. The summit of the dominantly phonolitic volcano has been modified by one or two generations of caldera formation. A summit plateau at about 3,200 m elevation marks the rim of the youngest caldera, which formed during the late-Pleistocene and within which the modern cone was constructed. An elliptical 500 x 600 m wide, 110-m-deep crater truncates the summit and contains an active lava lake within a 250-m-wide, 100-m-deep inner crater; other lava lakes are sometimes present. The glacier-covered volcano was erupting when first sighted by Captain James Ross in 1841. Continuous lava-lake activity with minor explosions, punctuated by occasional larger Strombolian explosions that eject bombs onto the crater rim, has been documented since 1972, but has probably been occurring for much of the volcano's recent history.
Information Contacts: Hawai'i Institute of Geophysics and Planetology (HIGP) - MODVOLC Thermal Alerts System, School of Ocean and Earth Science and Technology (SOEST), Univ. of Hawai'i, 2525 Correa Road, Honolulu, HI 96822, USA (URL: http://modis.higp.hawaii.edu/); Copernicus Browser, Copernicus Data Space Ecosystem, European Space Agency (URL: https://dataspace.copernicus.eu/browser/); NASA Earth Observatory, EOS Project Science Office, NASA Goddard Space Flight Center, Goddard, Maryland, USA (URL: https://earthobservatory.nasa.gov/images/152134/erebus-breaks-through).
Rincon de la Vieja (Costa Rica) — January 2024 Cite this Report
Rincon de la Vieja
Costa Rica
10.83°N, 85.324°W; summit elev. 1916 m
All times are local (unless otherwise noted)
Frequent phreatic explosions during July-December 2023
Rincón de la Vieja is a volcanic complex in Costa Rica with a hot convecting acid lake that exhibits frequent weak phreatic explosions, gas-and-steam emissions, and occasional elevated sulfur dioxide levels (BGVN 45:10, 46:03, 46:11). The current eruption period began June 2021. This report covers activity during July-December 2023 and is based on weekly bulletins and occasional daily reports from the Observatorio Vulcanologico Sismologica de Costa Rica-Universidad Nacional (OVSICORI-UNA).
Numerous weak phreatic explosions continued during July-December 2023, along with gas-and-steam emissions and plumes that rose as high as 3 km above the crater rim. Many weekly OVSICORI-UNA bulletins included the previous week's number of explosions and emissions (table 9). For many explosions, the time of explosion was given (table 10). Frequent seismic activity (long-period earthquakes, volcano-tectonic earthquakes, and tremor) accompanied the phreatic activity.
Table 9. Number of reported weekly phreatic explosions and gas-and-steam emissions at Rincón de la Vieja, July-December 2023. Counts are reported for the week before the Weekly Bulletin date; not all reports included these data. Courtesy of OVSICORI-UNA.
| OVSICORI Weekly Bulletin |
Number of explosions |
Number of emissions |
| 28 Jul 2023 |
6 |
14 |
| 4 Aug 2023 |
10 |
12 |
| 1 Sep 2023 |
13 |
11 |
| 22 Sep 2023 |
12 |
13 |
| 29 Sep 2023 |
6 |
11 |
| 6 Oct 2023 |
12 |
5 |
| 13 Oct 2023 |
7 |
9 |
| 20 Oct 2023 |
1 |
15 |
| 27 Oct 2023 |
3 |
23 |
| 3 Nov 2023 |
3 |
10 |
| 17 Nov 2023 |
0 |
Some |
| 24 Nov 2023 |
0 |
14 |
| 8 Dec 2023 |
4 |
16 |
| 22 Dec 2023 |
8 |
18 |
Table 10. Summary of activity at Rincón de la Vieja during July-December 2023. Weak phreatic explosions and gas emissions are noted where the time of explosion was indicated in the weekly or daily bulletins. Height of plumes or emissions are distance above the crater rim. Courtesy of OVSICORI-UNA.
| Date |
Time |
Description of Activity |
| 1 Jul 2023 |
0156 |
Explosion. |
| 2 Jul 2023 |
0305 |
Explosion. |
| 4 Jul 2023 |
0229, 0635 |
Event at 0635 produced a gas-and-steam plume that rose 700 m and drifted W; seen by residents in Liberia (21 km SW). |
| 9 Jul 2023 |
1843 |
Explosion. |
| 21 Jul 2023 |
0705 |
Explosion. |
| 26 Jul 2023 |
1807 |
Explosion. |
| 28 Jul 2023 |
0802 |
Explosion generated a gas-and-steam plume that rose 500 m. |
| 30 Jul 2023 |
1250 |
Explosion. |
| 31 Jul 2023 |
2136 |
Explosion. |
| 11 Aug 2023 |
0828 |
Explosion. |
| 18 Aug 2023 |
1304 |
Explosion. |
| 21 Aug 2023 |
1224 |
Explosion generated gas-and-steam plumes rose 500-600 m. |
| 22 Aug 2023 |
0749 |
Explosion generated gas-and-steam plumes rose 500-600 m. |
| 24 Aug 2023 |
1900 |
Explosion. |
| 25 Aug 2023 |
0828 |
Event produced a steam-and-gas plume that rose 3 km and drifted NW. |
| 27-28 Aug 2023 |
0813 |
Four small events; the event at 0813 on 28 August lasted two minutes and generated a steam-and-gas plume that rose 2.5 km. |
| 1 Sep 2023 |
1526 |
Explosion generated plume that rose 2 km and ejected material onto the flanks. |
| 2-3 Sep 2023 |
- |
Small explosions detected in infrasound data. |
| 4 Sep 2023 |
1251 |
Gas-and-steam plume rose 1 km and drifted W. |
| 7 Nov 2023 |
1113 |
Explosion. |
| 8 Nov 2023 |
0722 |
Explosion. |
| 12 Nov 2023 |
0136 |
Small gas emissions. |
| 14 Nov 2023 |
0415 |
Small gas emissions. |
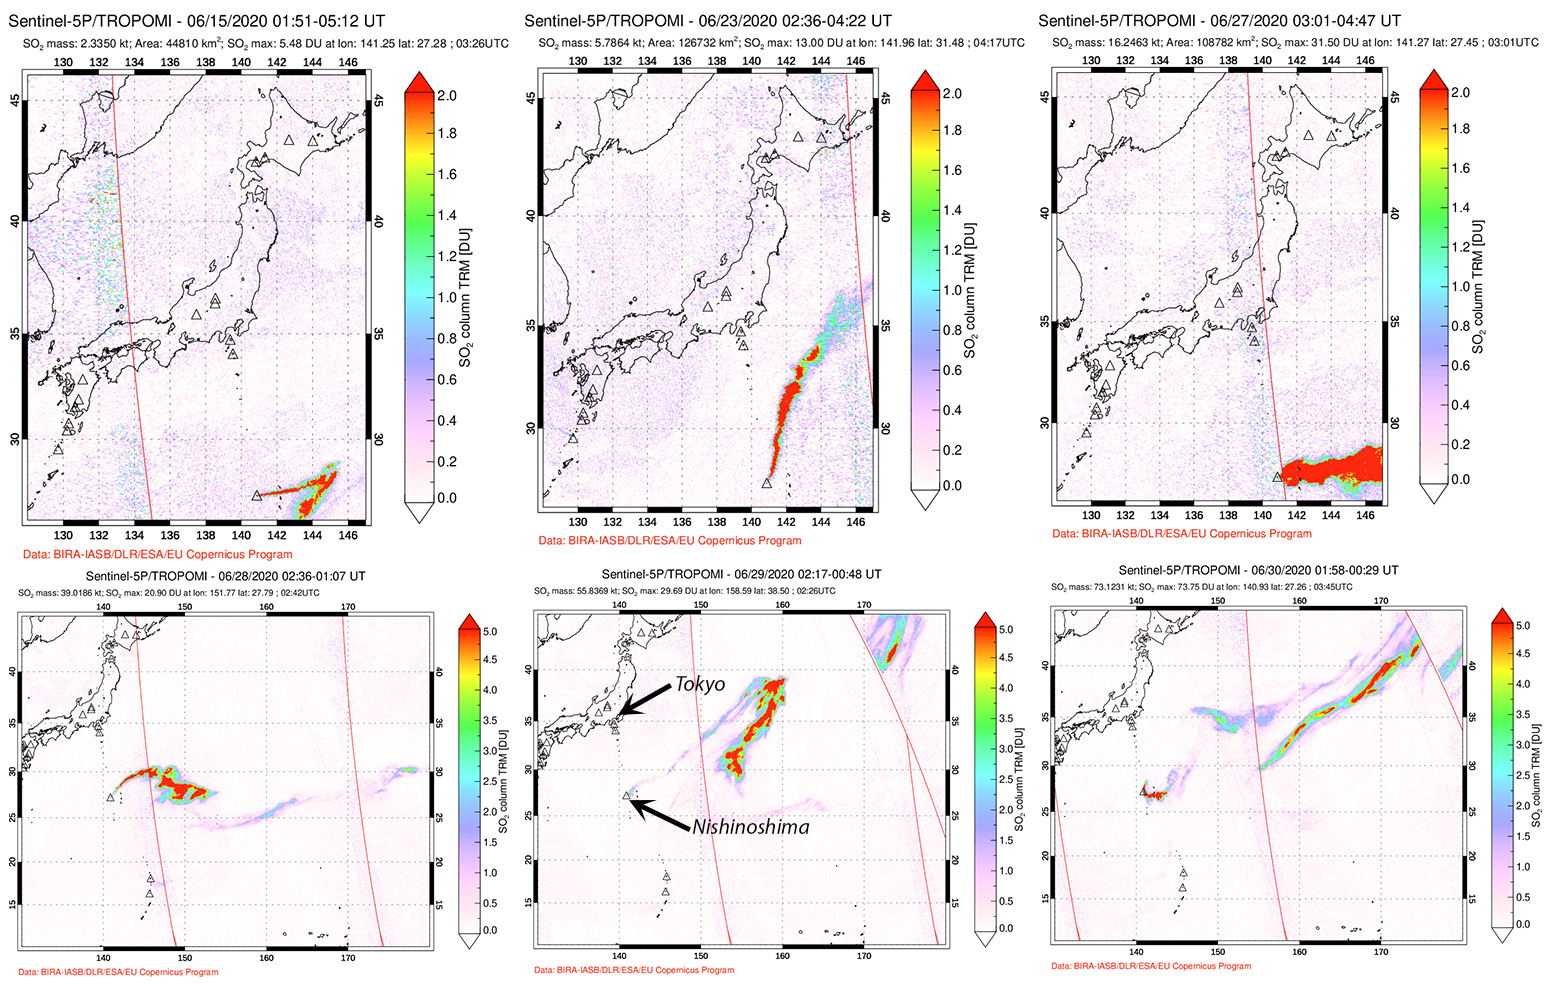
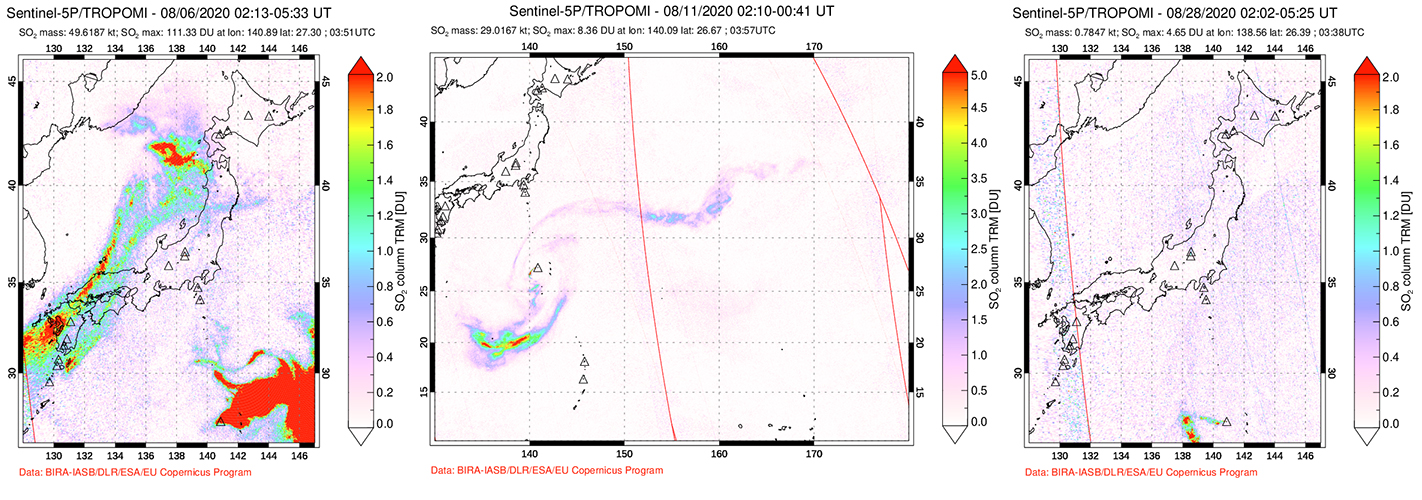
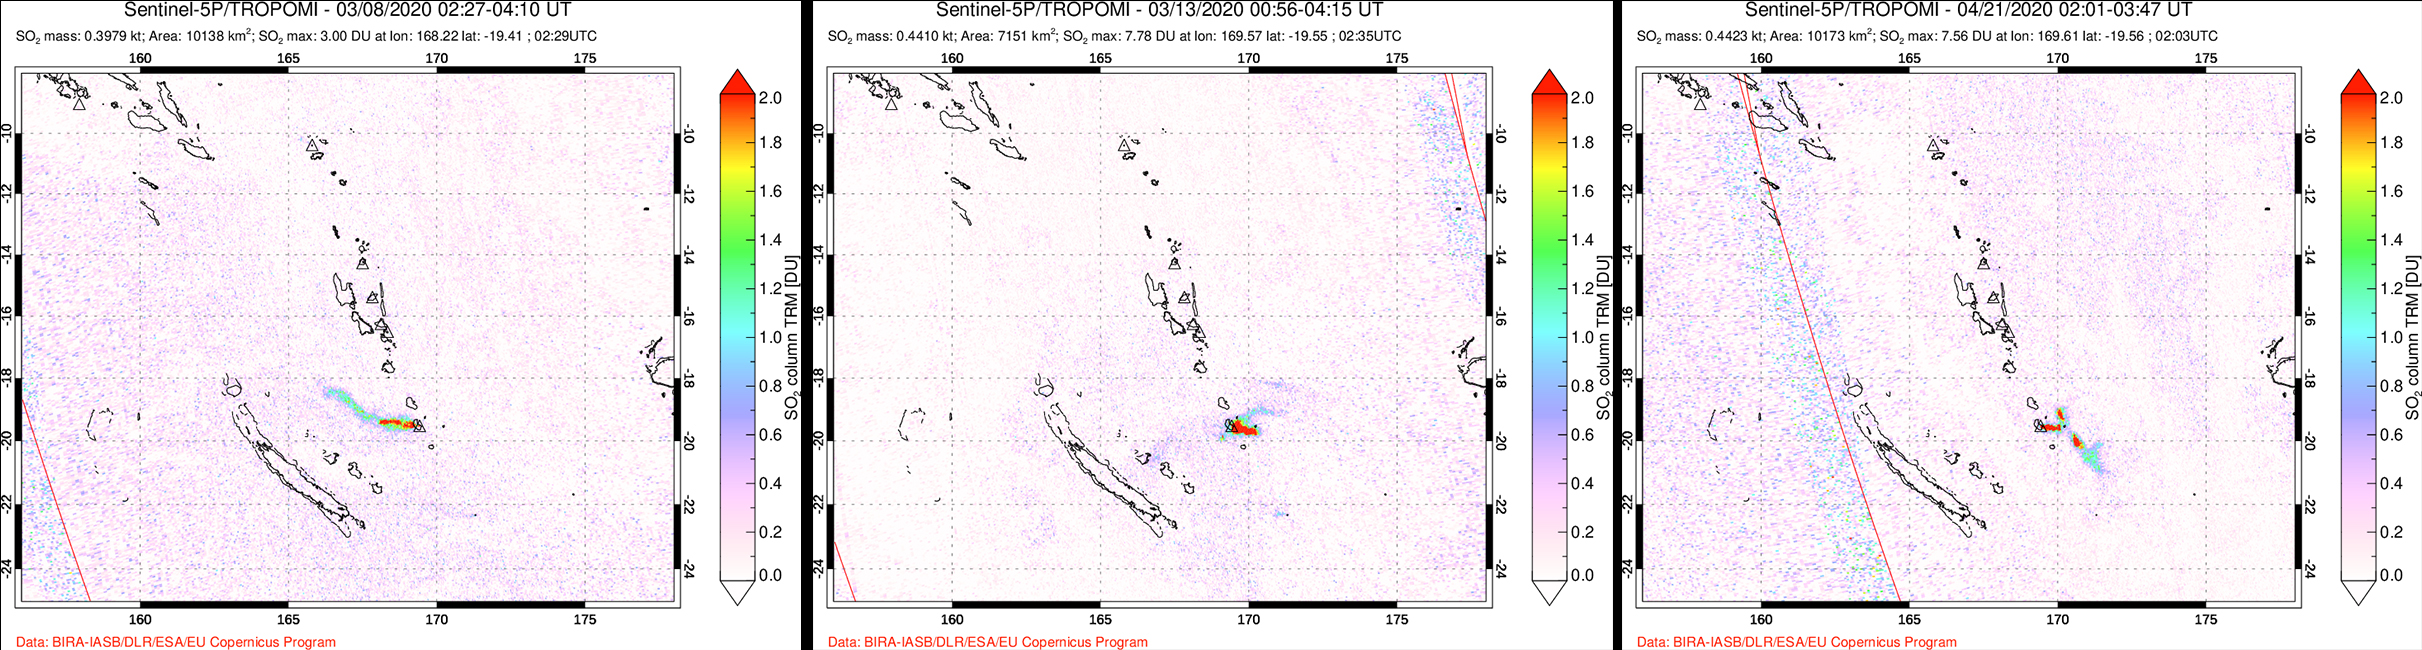
According to OVSICORI-UNA, during July-October the average weekly sulfur dioxide (SO2) flux ranged from 68 to 240 tonnes/day. However, in mid-November the flux increased to as high as 334 tonnes/day, the highest value measured in recent years. The high SO2 flux in mid-November was also detected by the TROPOMI instrument on the Sentinel-5P satellite (figure 43).
Geologic Background. Rincón de la Vieja, the largest volcano in NW Costa Rica, is a remote volcanic complex in the Guanacaste Range. The volcano consists of an elongated, arcuate NW-SE-trending ridge constructed within the 15-km-wide early Pleistocene Guachipelín caldera, whose rim is exposed on the south side. Sometimes known as the "Colossus of Guanacaste," it has an estimated volume of 130 km3 and contains at least nine major eruptive centers. Activity has migrated to the SE, where the youngest-looking craters are located. The twin cone of Santa María volcano, the highest peak of the complex, is located at the eastern end of a smaller, 5-km-wide caldera and has a 500-m-wide crater. A Plinian eruption producing the 0.25 km3 Río Blanca tephra about 3,500 years ago was the last major magmatic eruption. All subsequent eruptions, including numerous historical eruptions possibly dating back to the 16th century, have been from the prominent active crater containing a 500-m-wide acid lake located ENE of Von Seebach crater.
Information Contacts: Observatorio Vulcanológico Sismológica de Costa Rica-Universidad Nacional (OVSICORI-UNA), Apartado 86-3000, Heredia, Costa Rica (URL: http://www.ovsicori.una.ac.cr/); NASA Global Sulfur Dioxide Monitoring Page, Atmospheric Chemistry and Dynamics Laboratory, NASA Goddard Space Flight Center (NASA/GSFC), 8800 Greenbelt Road, Goddard MD 20771, USA (URL: https://so2.gsfc.nasa.gov/).
Bezymianny (Russia) — November 2023 Cite this Report
Bezymianny
Russia
55.972°N, 160.595°E; summit elev. 2882 m
All times are local (unless otherwise noted)
Explosion on 18 October 2023 sends ash plume 8 km high; lava flows and incandescent avalanches
Bezymianny, located on Russia’s Kamchatka Peninsula, has had eruptions since 1955 characterized by dome growth, explosions, pyroclastic flows, ash plumes, and ashfall. Activity during November 2022-April 2023 included gas-and-steam emissions, lava dome collapses generating avalanches, and persistent thermal activity. Similar eruptive activity continued from May through October 2023, described here based on information from weekly and daily reports of the Kamchatka Volcano Eruptions Response Team (KVERT), notices from Tokyo VAAC (Volcanic Ash Advisory Center), and from satellite data.
Overall activity decreased after the strong period of activity in late March through April 2023, which included ash explosions during 29 March and 7-8 April 2023 that sent plumes as high as 10-12 km altitude, along with dome growth and lava flows (BGVN 48:05). This reduced activity can be seen in the MIROVA thermal detection system graph (figure 56), which was consistent with data from the MODVOLC thermal detection system and with Sentinel-2 satellite images that showed persistent hotspots in the summit crater when conditions allowed observations. A renewed period of strong activity began in mid-October 2023.
Activity increased significantly on 17 October 2023 when large collapses began during 0700-0830 on the E flanks of the lava dome and continued to after 0930 the next day (figure 57). Ash plumes rose to an altitude of 4.5-5 km, extending 220 km NNE by 18 October. A large explosion at 1630 on 18 October produced an ash plume that rose to an altitude of 11 km (8 km above the summit) and drifted NNE and then NW, extending 900 km NW within two days at an altitude of 8 km. Minor ashfall was noted in Kozyrevsk (45 km WNW). At 0820 on 20 October an ash plume was identified in satellite images drifting 100 km ENE at altitudes of 4-4.5 km.
Lava flows and hot avalanches from the dome down the SE flank continued over the next few days, including 23 October when clear conditions allowed good observations (figures 58 and 59). A large thermal anomaly was observed over the volcano through 24 October, and in the summit crater on 30 October (figure 60). Strong fumarolic activity continued, with numerous avalanches and occasional incandescence. By the last week of October, volcanic activity had decreased to a level consistent with that earlier in the reporting period.
Aviation warnings were frequently updated during 17-20 October. KVERT issued a Volcano Observatory Notice for Aviation (VONA) on 17 October at 1419 and 1727 (0219 and 0527 UTC) raising the Aviation Color Code (ACC) from Yellow to Orange (second highest level). The next day, KVERT issued a VONA at 1705 (0505 UTC) raising the ACC to Red (highest level) but lowered it back to Orange at 2117 (0917 UTC). After another decrease to Yellow and back to Orange, the ACC was reduced to Yellow on 20 October at 1204 (0004 UTC). In addition, the Tokyo VAAC issued a series of Volcanic Ash Advisories beginning on 16 October and continuing through 30 October.
Geologic Background. The modern Bezymianny, much smaller than its massive neighbors Kamen and Kliuchevskoi on the Kamchatka Peninsula, was formed about 4,700 years ago over a late-Pleistocene lava-dome complex and an edifice built about 11,000-7,000 years ago. Three periods of intensified activity have occurred during the past 3,000 years. The latest period, which was preceded by a 1,000-year quiescence, began with the dramatic 1955-56 eruption. This eruption, similar to that of St. Helens in 1980, produced a large open crater that was formed by collapse of the summit and an associated lateral blast. Subsequent episodic but ongoing lava-dome growth, accompanied by intermittent explosive activity and pyroclastic flows, has largely filled the 1956 crater.
Information Contacts: Kamchatka Volcanic Eruptions Response Team (KVERT), Far Eastern Branch, Russian Academy of Sciences, 9 Piip Blvd., Petropavlovsk-Kamchatsky, 683006, Russia (URL: http://www.kscnet.ru/ivs/kvert/); Kamchatka Volcanological Station, Kamchatka Branch of Geophysical Survey, (KB GS RAS), Klyuchi, Kamchatka Krai, Russia (URL: http://volkstat.ru/); Tokyo Volcanic Ash Advisory Center (VAAC), 1-3-4 Otemachi, Chiyoda-ku, Tokyo 100-8122, Japan (URL: http://ds.data.jma.go.jp/svd/vaac/data/); Hawai'i Institute of Geophysics and Planetology (HIGP) - MODVOLC Thermal Alerts System, School of Ocean and Earth Science and Technology (SOEST), Univ. of Hawai'i, 2525 Correa Road, Honolulu, HI 96822, USA (URL: http://modis.higp.hawaii.edu/); MIROVA (Middle InfraRed Observation of Volcanic Activity), a collaborative project between the Universities of Turin and Florence (Italy) supported by the Centre for Volcanic Risk of the Italian Civil Protection Department (URL: http://www.mirovaweb.it/); Copernicus Browser, Copernicus Data Space Ecosystem, European Space Agency (URL: https://dataspace.copernicus.eu/browser/).chr
Kilauea (United States) — January 2023 Cite this Report
Kilauea
United States
19.421°N, 155.287°W; summit elev. 1222 m
All times are local (unless otherwise noted)
Low-level lava effusions in the lava lake at Halema’uma’u during July-December 2022
Kīlauea is the southeastern-most volcano in Hawaii and overlaps the E flank of the Mauna Loa volcano. Its East Rift Zone (ERZ) has been intermittently active for at least 2,000 years. An extended eruption period began in January 1983 and was characterized by open lava lakes and lava flows from the summit caldera and the East Rift Zone. During May 2018 magma migrated into the Lower East Rift Zone (LERZ) and opened 24 fissures along a 6-km-long NE-trending fracture zone that produced lava flows traveling in multiple directions. As lava emerged from the fissures, the lava lake at Halema'uma'u drained and explosions sent ash plumes to several kilometers altitude (BGVN 43:10).
The current eruption period started during September 2021 and has recently been characterized by lava effusions, spatter, and sulfur dioxide emissions in the active Halema’uma’u lava lake (BGVN 47:08). Lava effusions, some spatter, and sulfur dioxide emissions have continued during this reporting period of July through December 2022 using daily reports, volcanic activity notices, and abundant photo, map, and video data from the US Geological Survey's (USGS) Hawaiian Volcano Observatory (HVO).
Summary of activity during July-December 2022. Low-level effusions have continued at the western vent of the Halema’uma’u crater during July through early December 2022. Occasional weak ooze-outs (also called lava break outs) would occur along the margins of the crater floor. The overall level of the active lava lake throughout the reporting period gradually increased due to infilling, however it stagnated in mid-September (table 13). During September through November, activity began to decline, though lava effusions persisted at the western vent. By 9 December, the active part of the lava lake had completely crusted over, and incandescence was no longer visible.
Table 13. Summary of measurements taken during overflights at Kīlauea that show a gradual increase in the active lava lake level and the volume of lava effused since 29 September 2021. Lower activity was reported during September-October. Data collected during July-December 2022. Courtesy of HVO.
| Date: |
Level of the active lava lake (m): |
Cumulative volume of lava effused (million cubic meters): |
| 7 Jul 2022 |
130 |
95 |
| 19 Jul 2022 |
133 |
98 |
| 4 Aug 2022 |
136 |
102 |
| 16 Aug 2022 |
137 |
104 |
| 12 Sep 2022 |
143 |
111 |
| 5 Oct 2022 |
143 |
111 |
| 28 Oct 2022 |
143 |
111 |
Activity during July 2022. Lava effusions were reported from the western vent in the Halema’uma’u crater, along with occasional weak ooze-outs along the margins of the crater floor. The height of the lava lake was variable due to deflation-inflation tilt events; for example, the lake level dropped approximately 3-4 m during a summit deflation-inflation event reported on 1 July. Webcam images taken during the night of 6-12 July showed intermittent low-level spattering at the western vent that rose less than 10 m above the vent (figure 519). Measurements made during an overflight on 7 July indicated that the crater floor was infilled about 130 m and that 95 million cubic meters of lava had been effused since 29 September 2021. A single, relatively small lava ooze-out was active to the S of the lava lake. Around midnight on 8 July there were two brief periods of lava overflow onto the lake margins. On 9 July lava ooze-outs were reported near the SE and NE edges of the crater floor and during 10-11 July they occurred near the E, NE, and NW edges. On 16 July crater incandescence was reported, though the ooze-outs and spattering were not visible. On 18 July overnight webcam images showed incandescence in the western vent complex and two ooze-outs were reported around 0000 and 0200 on 19 July. By 0900 there were active ooze-outs along the SW edge of the crater floor. Measurements made from an overflight on 19 July indicated that the crater floor was infilled about 133 m and 98 million cubic meters of lava had erupted since 29 September 2021 (figure 520). On 20 July around 1600 active ooze-outs were visible along the N edge of the crater, which continued through the next day. Extensive ooze-outs occurred along the W margin during 24 July until 1900; on 26 July minor ooze-outs were noted along the N margin. Minor spattering was visible on 29 July along the E margin of the lake. The sulfur dioxide emission rates ranged 650-2,800 tons per day (t/d), the higher of which was measured on 8 July (figure 519).
Activity during August 2022. The eruption continued in the Halema’uma’u crater at the western vent. According to HVO the lava in the active lake remained at the level of the bounding levees. Occasional minor ooze-outs were observed along the margins of the crater floor. Strong nighttime crater incandescence was visible after midnight on 6 August over the western vent cone. During 6-7 August scattered small lava lobes were active along the crater floor and incandescence persisted above the western vent through 9 August. During 7-9 August HVO reported a single lava effusion source was active along the NW margin of the crater floor. Measurements from an overflight on 4 August indicated that the crater floor was infilled about 136 m total and that 102 million cubic meters of lava had been erupted since the start of the eruption. Lava breakouts were reported along the N, NE, E, S, and W margins of the crater during 10-16 August. Another overflight survey conducted on 16 August indicated that the crater floor infilled about 137 m and 104 million cubic meters of lava had been erupted since September 2021. Measured sulfur dioxide emissions rates ranged 1,150-2,450 t/d, the higher of which occurred on 8 August.
Activity during September 2022. During September, lava effusion continued from the western vent into the active lava lake and onto the crater floor. Intermittent minor ooze-outs were reported through the month. A small ooze-out was visible on the W crater floor margin at 0220 on 2 September, which showed decreasing surface activity throughout the day, but remained active through 3 September. On 3 September around 1900 a lava outbreak occurred along the NW margin of the crater floor but had stopped by the evening of 4 September. Field crews monitoring the summit lava lake on 9 September observed spattering on the NE margin of the lake that rose no higher than 10 m, before falling back onto the lava lake crust (figure 521). Overflight measurements on 12 September indicated that the crater floor was infilled a total of 143 m and 111 million cubic meters of lava had been erupted since September 2021. Extensive breakouts in the W and N part of the crater floor were reported at 1600 on 20 September and continued into 26 September. The active part of the lava lake dropped by 10 m while other parts of the crater floor dropped by several meters. Summit tiltmeters recorded a summit seismic swarm of more than 80 earthquakes during 1500-1800 on 21 September, which occurred about 1.5 km below Halema’uma’u; a majority of these were less than Mw 2. By 22 September the active part of the lava lake was infilled about 2 m. On 23 September the western vent areas exhibited several small spatter cones with incandescent openings, along with weak, sporadic spattering (figure 522). The sulfur dioxide emission rate ranged from 930 t/d to 2,000 t/d, the higher of which was measured on 6 September.
Activity during October 2022. Activity during October declined slightly compared to previous months, though lava effusions persisted from the western vent into the active lava lake and onto the crater floor during October (figure 523). Slight variations in the lava lake were noted throughout the month. HVO reported that around 0600 on 3 October the level of the lava lake has lowered slightly. Overflight measurements taken on 5 October indicated that the crater floor was infilled a total of about 143 m and that 111 million cubic meters of lava had been effused since September 2021. During 6-7 October the lake gradually rose 0.5 m. Sulfur dioxide measurements made on 22 October had an emission rate of 700 t/d. Another overflight taken on 28 October showed that there was little to no change in the elevation of the crater floor: the crater floor was infilled a total of 143 m and 111 million cubic meters of lava had erupted since the start of the eruption.
Activity during November 2022. Activity remained low during November, though HVO reported that lava from the western vent continued to effuse into the active lava lake and onto the crater floor throughout the month. The rate of sulfur dioxide emissions during November ranged from 300-600 t/d, the higher amount of which occurred on 9 November.
Activity during December 2022. Similar low activity was reported during December, with lava effusing from the western vent into the active lava lake and onto the crater floor. During 4-5 December the active part of the lava lake was slightly variable in elevation and fluctuated within 1 m. On 9 December HVO reported that lava was no longer erupting from the western vent in the Halema’uma’u crater and that sulfur dioxide emissions had returned to near pre-eruption background levels; during 10-11 December, the lava lake had completely crusted over, and no incandescence was visible (figure 524). Time lapse camera images covering the 4-10 December showed that the crater floor showed weak deflation and no inflation. Some passive events of crustal overturning were reported during 14-15 December, which brought fresh incandescent lava to the lake surface. The sulfur dioxide emission rate was approximately 200 t/d on 14 December. A smaller overturn event on 17 December and another that occurred around 0000 and into the morning of 20 December were also detected. A small seismic swarm was later detected on 30 December.
Geologic Background. Kilauea overlaps the E flank of the massive Mauna Loa shield volcano in the island of Hawaii. Eruptions are prominent in Polynesian legends; written documentation since 1820 records frequent summit and flank lava flow eruptions interspersed with periods of long-term lava lake activity at Halemaumau crater in the summit caldera until 1924. The 3 x 5 km caldera was formed in several stages about 1,500 years ago and during the 18th century; eruptions have also originated from the lengthy East and Southwest rift zones, which extend to the ocean in both directions. About 90% of the surface of the basaltic shield volcano is formed of lava flows less than about 1,100 years old; 70% of the surface is younger than 600 years. The long-term eruption from the East rift zone between 1983 and 2018 produced lava flows covering more than 100 km2, destroyed hundreds of houses, and added new coastline.
Information Contacts: Hawaiian Volcano Observatory (HVO), U.S. Geological Survey, PO Box 51, Hawai'i National Park, HI 96718, USA (URL: http://hvo.wr.usgs.gov/).
Nyamulagira (DR Congo) — November 2023 Cite this Report
Nyamulagira
DR Congo
1.408°S, 29.2°E; summit elev. 3058 m
All times are local (unless otherwise noted)
Lava flows and thermal activity during May-October 2023
Nyamulagira (also known as Nyamuragira) is a shield volcano in the Democratic Republic of Congo with the summit truncated by a small 2 x 2.3 km caldera with walls up to about 100 m high. Documented eruptions have occurred within the summit caldera, as well as from numerous flank fissures and cinder cones. The current eruption period began in April 2018 and has more recently been characterized by summit crater lava flows and thermal activity (BGVN 48:05). This report describes lava flows and variable thermal activity during May through October 2023, based on information from the Observatoire Volcanologique de Goma (OVG) and various satellite data.
Lava lake activity continued during May. The MIROVA (Middle InfraRed Observation of Volcanic Activity) system recorded moderate-to-strong thermal activity throughout the reporting period; activity was more intense during May and October and relatively weaker from June through September (figure 95). The MODVOLC thermal algorithm, detected a total of 209 thermal alerts. There were 143 hotspots detected during May, eight during June, nine during September, and 49 during October. This activity was also reflected in infrared satellite images, where a lava flow was visible in the NW part of the crater on 7 May and strong activity was seen in the center of the crater on 4 October (figure 96). Another infrared satellite image taken on 12 May showed still active lava flows along the NW margin of the crater. According to OVG lava effusions were active during 7-29 May and moved to the N and NW parts of the crater beginning on 9 May. Strong summit crater incandescence was visible from Goma (27 km S) during the nights of 17, 19, and 20 May (figure 97). On 17 May there was an increase in eruptive activity, which peaked at 0100 on 20 May. Notable sulfur dioxide plumes drifted NW and W during 19-20 May (figure 98). Drone footage acquired in partnership with the USGS (United States Geological Survey) on 20 May captured images of narrow lava flows that traveled about 100 m down the W flank (figure 99). Data from the Rumangabo seismic station indicated a decreasing trend in activity during 17-21 May. Although weather clouds prevented clear views of the summit, a strong thermal signature on the NW flank was visible in an infrared satellite image on 22 May, based on an infrared satellite image. On 28 May the lava flows on the upper W flank began to cool and solidify. By 29 May seismicity returned to levels similar to those recorded before the 17 May increase. Lava effusion continued but was confined to the summit crater; periodic crater incandescence was observed.
Low-level activity was noted during June through October. On 1 June OVG reported that seismicity remained at lower levels and that crater incandescence had been absent for three days, though infrared satellite imagery showed continued lava effusion in the summit crater. The lava flows on the flanks covered an estimated 0.6 km2. Satellite imagery continued to show thermal activity confined to the lava lake through October (figure 96), although no lava flows or significant sulfur dioxide emissions were reported.
Geologic Background. Africa's most active volcano, Nyamulagira (also known as Nyamuragira), is a massive high-potassium basaltic shield about 25 km N of Lake Kivu and 13 km NNW of the steep-sided Nyiragongo volcano. The summit is truncated by a small 2 x 2.3 km caldera that has walls up to about 100 m high. Documented eruptions have occurred within the summit caldera, as well as from the numerous flank fissures and cinder cones. A lava lake in the summit crater, active since at least 1921, drained in 1938, at the time of a major flank eruption. Recent lava flows extend down the flanks more than 30 km from the summit as far as Lake Kivu; extensive lava flows from this volcano have covered 1,500 km2 of the western branch of the East African Rift.
Information Contacts: Observatoire Volcanologique de Goma (OVG), Departement de Geophysique, Centre de Recherche en Sciences Naturelles, Lwiro, D.S. Bukavu, DR Congo; Hawai'i Institute of Geophysics and Planetology (HIGP) - MODVOLC Thermal Alerts System, School of Ocean and Earth Science and Technology (SOEST), Univ. of Hawai'i, 2525 Correa Road, Honolulu, HI 96822, USA (URL: http://modis.higp.hawaii.edu/); MIROVA (Middle InfraRed Observation of Volcanic Activity), a collaborative project between the Universities of Turin and Florence (Italy) supported by the Centre for Volcanic Risk of the Italian Civil Protection Department (URL: http://www.mirovaweb.it/); NASA Global Sulfur Dioxide Monitoring Page, Atmospheric Chemistry and Dynamics Laboratory, NASA Goddard Space Flight Center (NASA/GSFC), 8800 Greenbelt Road, Goddard, Maryland, USA (URL: https://so2.gsfc.nasa.gov/); Copernicus Browser, Copernicus Data Space Ecosystem, European Space Agency (URL: https://dataspace.copernicus.eu/browser/); Charles Balagizi, Goma Volcano Observatory, Departement de Geophysique, Centre de Recherche en Sciences Naturelles, Lwiro, D.S. Bukavu, DR Congo.
Bagana (Papua New Guinea) — October 2023 Cite this Report
Bagana
Papua New Guinea
6.137°S, 155.196°E; summit elev. 1855 m
All times are local (unless otherwise noted)
Explosions, ash plumes, ashfall, and lava flows during April-September 2023
The remote volcano of Bagana is located in central Bougainville Island, Papua New Guinea. Recorded eruptions date back to 1842 and activity has consisted of effusive activity that has built a small lava dome in the summit crater and occasional explosions that produced pyroclastic flows. The most recent eruption has been ongoing since February 2000 and has produced occasional explosions, ash plumes, and lava flows. More recently, activity has been characterized by ongoing effusive activity and ash emissions (BGVN 48:04). This report updates activity from April through September 2023 that has consisted of explosions, ash plumes, ashfall, and lava flows, using information from the Darwin Volcanic Ash Advisory Center (VAAC) and satellite data.
An explosive eruption was reported on 7 July that generated a large gas-and-ash plume to high altitudes and caused significant ashfall in local communities; the eruption plume had reached upper tropospheric (16-18 km altitude) altitudes by 2200, according to satellite images. Sulfur dioxide plumes were detected in satellite images on 8 July and indicated that the plume was likely a mixture of gas, ice, and ash. A report issued by the Autonomous Bougainville Government (ABG) (Torokina District, Education Section) on 10 July noted that significant ash began falling during 2000-2100 on 7 July and covered most areas in the Vuakovi, Gotana (9 km SW), Koromaketo, Laruma (25 km W) and Atsilima (27 km NW) villages. Pyroclastic flows also occurred, according to ground-based reports; small deposits confined to one drainage were inspected by RVO during an overflight on 17 July and were confirmed to be from the 7 July event. Ashfall continued until 10 July and covered vegetation, which destroyed bushes and gardens and contaminated rivers and streams.
RVO reported another eruption on 14 July. The Darwin VAAC stated that an explosive event started around 0830 on 15 July and produced an ash plume that rose to 16.5 km altitude by 1000 and drifted N, according to satellite images. The plume continued to drift N and remained visible through 1900, and by 2150 it had dissipated.
Ashfall likely from both the 7 and 15 July events impacted about 8,111 people in Torokina (20 km SW), including Tsito/Vuakovi, Gotana, Koromaketo, Kenaia, Longkogari, Kenbaki, Piva (13 km SW), and Atsinima, and in the Tsitovi district, according to ABG. Significant ashfall was also reported in Ruruvu (22 km N) in the Wakunai District of Central Bougainville, though the thickness of these deposits could not be confirmed. An evacuation was called for the villages in Wakunai, where heavy ashfall had contaminated water sources; the communities of Ruruvu, Togarau, Kakarapaia, Karauturi, Atao, and Kuritaturi were asked to evacuate to a disaster center at the Wakunai District Station, and communities in Torokina were asked to evacuate to the Piva District station. According to a news article, more than 7,000 people needed temporary accommodations, with about 1,000 people in evacuation shelters. Ashfall had deposited over a broad area, contaminating water supplies, affecting crops, and collapsing some roofs and houses in rural areas. Schools were temporarily shut down. Intermittent ash emissions continued through the end of July and drifted NNW, NW, and SW. Fine ashfall was reported on the coast of Torokina, and ash plumes also drifted toward Laruma and Atsilima.
A small explosive eruption occurred at 2130 on 28 July that ejected material from the crater vents, according to reports from Torokina, in addition to a lava flow that contained two lobes. A second explosion was detected at 2157. Incandescence from the lava flow was visible from Piva as it descended the W flank around 2000 on 29 July (figure 47). The Darwin VAAC reported that a strong thermal anomaly was visible in satellite images during 30-31 July and that ash emissions rose to 2.4 km altitude and drifted WSW on 30 July. A ground report from RVO described localized emissions at 0900 on 31 July.
The Darwin VAAC reported that ash plumes were identified in satellite imagery at 0800 and 1220 on 12 August and rose to 2.1 km and 3 km altitude and drifted NW and W, respectively. A news report stated that aid was sent to more than 6,300 people that were adversely affected by the eruption. Photos taken during 17-19 August showed ash emissions rising no higher than 1 km above the summit and drifting SE. A small explosion generated an ash plume during the morning of 19 August. Deposits from small pyroclastic flows were also captured in the photos. Satellite images captured lava flows and pyroclastic flow deposits. Two temporary seismic stations were installed near Bagana on 17 August at distances of 7 km WSW (Vakovi station) and 11 km SW (Kepox station). The Kepox station immediately started to record continuous, low-frequency background seismicity.
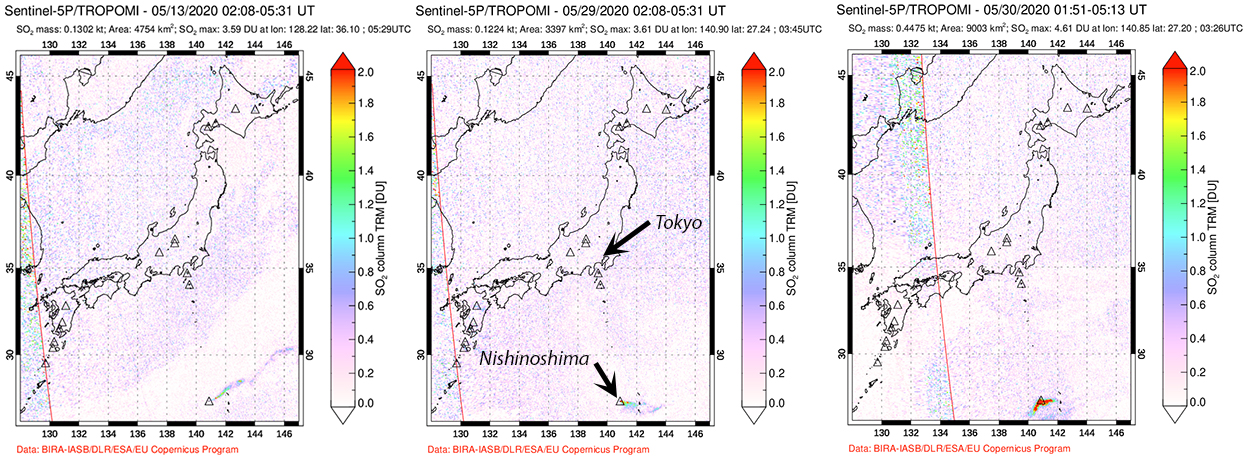
Satellite data. Little to no thermal activity was detected during April through mid-July 2023; only one anomaly was recorded during early April and one during early June, according to MIROVA (Middle InfraRed Observation of Volcanic Activity) data (figure 48). Thermal activity increased in both power and frequency during mid-July through September, although there were still some short gaps in detected activity. MODVOLC also detected increased thermal activity during August; thermal hotspots were detected a total of five times on 19, 20, and 27 August. Weak thermal anomalies were also captured in infrared satellite images on clear weather days throughout the reporting period on 7, 12, and 17 April, 27 May, 1, 6, 16, and 31 July, and 19 September (figure 48); a strong thermal anomaly was visible on 31 July. Distinct sulfur dioxide plumes that drifted generally NW were intermittently captured by the TROPOMI instrument on the Sentinel-5P satellite and sometimes exceeded two Dobson Units (DUs) (figure 49).
Geologic Background. Bagana volcano, in a remote portion of central Bougainville Island, is frequently active. This massive symmetrical cone was largely constructed by an accumulation of viscous andesitic lava flows. The entire edifice could have been constructed in about 300 years at its present rate of lava production. Eruptive activity is characterized by non-explosive effusion of viscous lava that maintains a small lava dome in the summit crater, although occasional explosive activity produces pyroclastic flows. Lava flows with tongue-shaped lobes up to 50 m thick and prominent levees descend the flanks on all sides.
Information Contacts: Rabaul Volcano Observatory (RVO), Geohazards Management Division, Department of Mineral Policy and Geohazards Management (DMPGM), PO Box 3386, Kokopo, East New Britain Province, Papua New Guinea; Darwin Volcanic Ash Advisory Centre (VAAC), Bureau of Meteorology, Northern Territory Regional Office, PO Box 40050, Casuarina, NT 0811, Australia (URL: http://www.bom.gov.au/info/vaac/); MIROVA (Middle InfraRed Observation of Volcanic Activity), a collaborative project between the Universities of Turin and Florence (Italy) supported by the Centre for Volcanic Risk of the Italian Civil Protection Department (URL: http://www.mirovaweb.it/); Hawai'i Institute of Geophysics and Planetology (HIGP) - MODVOLC Thermal Alerts System, School of Ocean and Earth Science and Technology (SOEST), Univ. of Hawai'i, 2525 Correa Road, Honolulu, HI 96822, USA (URL: http://modis.higp.hawaii.edu/); NASA Global Sulfur Dioxide Monitoring Page, Atmospheric Chemistry and Dynamics Laboratory, NASA Goddard Space Flight Center (NASA/GSFC), 8800 Greenbelt Road, Goddard, Maryland, USA (URL: https://so2.gsfc.nasa.gov/); Copernicus Browser, Copernicus Data Space Ecosystem, European Space Agency (URL: https://dataspace.copernicus.eu/browser/); Autonomous Bougainville Government, P.O Box 322, Buka, AROB, PNG (URL: https://abg.gov.pg/); Andrew Tupper (Twitter: @andrewcraigtupp); Simon Carn, Geological and Mining Engineering and Sciences, Michigan Technological University, 1400 Townsend Drive, Houghton, MI 49931, USA (URL: http://www.volcarno.com/, Twitter: @simoncarn); Radio NZ (URL: https://www.rnz.co.nz/news/pacific/494464/more-than-7-000-people-in-bougainville-need-temporary-accommodation-after-eruption); USAID, 1300 Pennsylvania Ave, NW, Washington DC 20004, USA (URL: https://www.usaid.gov/pacific-islands/press-releases/aug-08-2023-united-states-provides-immediate-emergency-assistance-support-communities-affected-mount-bagana-volcanic-eruptions).
Mayon (Philippines) — October 2023 Cite this Report
Mayon
Philippines
13.257°N, 123.685°E; summit elev. 2462 m
All times are local (unless otherwise noted)
Lava flows, pyroclastic flows, ash emissions, and seismicity during April-September 2023
Mayon is located in the Philippines and has steep upper slopes capped by a small summit crater. Historical eruptions date back to 1616 CE that have been characterized by Strombolian eruptions, lava flows, pyroclastic flows, and mudflows. Eruptions mostly originated from a central conduit. Pyroclastic flows and mudflows have commonly descended many of the approximately 40 drainages that surround the volcano. The most recent eruption occurred during June through October 2022 and consisted of lava dome growth and gas-and-steam emissions (BGVN 47:12). A new eruption was reported during late April 2023 and has included lava flows, pyroclastic density currents, ash emissions, and seismicity. This report covers activity during April through September 2023 based on daily bulletins from the Philippine Institute of Volcanology and Seismology (PHIVOLCS).
During April through September 2023, PHIVOLCS reported near-daily rockfall events, frequent volcanic earthquakes, and sulfur dioxide measurements. Gas-and-steam emissions rose 100-900 m above the crater and drifted in different directions. Nighttime crater incandescence was often visible during clear weather and was accompanied by incandescent avalanches of material. Activity notably increased during June when lava flows were reported on the S, SE, and E flanks (figure 52). The MIROVA graph (Middle InfraRed Observation of Volcanic Activity) showed strong thermal activity coincident with these lava flows, which remained active through September (figure 53). According to the MODVOLC thermal algorithm, a total of 110 thermal alerts were detected during the reporting period: 17 during June, 40 during July, 27 during August, and 26 during September. During early June, pyroclastic density currents (PDCs) started to occur more frequently.
Low activity was reported during much of April and May; gas-and-steam emissions rose 100-900 m above the crater and generally drifted in different directions. A total of 52 rockfall events and 18 volcanic earthquakes were detected during April and 147 rockfall events and 13 volcanic events during May. Sulfur dioxide flux measurements ranged between 400-576 tons per day (t/d) during April, the latter of which was measured on 29 April and between 162-343 t/d during May, the latter of which was measured on 13 May.
Activity during June increased, characterized by lava flows, pyroclastic density currents (PDCs), crater incandescence and incandescent rockfall events, gas-and-steam emissions, and continued seismicity. Weather clouds often prevented clear views of the summit, but during clear days, moderate gas-and-steam emissions rose 100-2,500 m above the crater and drifted in multiple directions. A total of 6,237 rockfall events and 288 volcanic earthquakes were detected. The rockfall events often deposited material on the S and SE flanks within 700-1,500 m of the summit crater and ash from the events drifted SW, S, SE, NE, and E. Sulfur dioxide emissions ranged between 149-1,205 t/d, the latter of which was measured on 10 June. Short-term observations from EDM and electronic tiltmeter monitoring indicated that the upper slopes were inflating since February 2023. Longer-term ground deformation parameters based on EDM, precise leveling, continuous GPS, and electronic tilt monitoring indicated that the volcano remained inflated, especially on the NW and SE flanks. At 1000 on 5 June the Volcano Alert Level (VAL) was raised to 2 (on a 0-5 scale). PHIVOLCS noted that although low-level volcanic earthquakes, ground deformation, and volcanic gas emissions indicated unrest, the steep increase in rockfall frequency may indicate increased dome activity.
A total of 151 dome-collapse PDCs occurred during 8-9 and 11-30 June, traveled 500-2,000 m, and deposited material on the S flank within 2 km of the summit crater. During 8-9 June the VAL was raised to 3. At approximately 1947 on 11 June lava flow activity was reported; two lobes traveled within 500 m from the crater and deposited material on the S (Mi-isi), SE (Bonga), and E (Basud) flanks. Weak seismicity accompanied the lava flow and slight inflation on the upper flanks. This lava flow remained active through 30 June, moving down the S and SE flank as far as 2.5 km and 1.8 km, respectively and depositing material up to 3.3 km from the crater. During 15-16 June traces of ashfall from the PDCs were reported in Sitio Buga, Nabonton, City of Ligao and Purok, and San Francisco, Municipality of Guinobatan. During 28-29 June there were two PDCs generated by the collapse of the lava flow front, which generated a light-brown ash plume 1 km high. Satellite monitors detected significant concentrations of sulfur dioxide beginning on 29 June. On 30 June PDCs primarily affected the Basud Gully on the E flank, the largest of which occurred at 1301 and lasted eight minutes, based on the seismic record. Four PDCs generated between 1800 and 2000 that lasted approximately four minutes each traveled 3-4 km on the E flank and generated an ash plume that rose 1 km above the crater and drifted N and NW. Ashfall was recorded in Tabaco City.
Similar strong activity continued during July; slow lava effusion remained active on the S and SE flanks and traveled as far as 2.8 km and 2.8 km, respectively and material was deposited as far as 4 km from the crater. There was a total of 6,983 rockfall events and 189 PDCs that affected the S, SE, and E flanks. The volcano network detected a total of 2,124 volcanic earthquakes. Continuous gas-and-steam emissions rose 200-2,000 m above the crater and drifted in multiple directions. Sulfur dioxide emissions averaged 792-4,113 t/d, the latter of which was measured on 28 July. During 2-4 July three PDCs were generated from the collapse of the lava flow and resulting light brown plumes rose 200-300 m above the crater. Continuous tremor pulses were reported beginning at 1547 on 3 July through 7 July at 1200, at 2300 on 8 July and going through 0300 on 10 July, and at 2300 on 16 July, as recorded by the seismic network. During 6-9 July there were 10 lava flow-collapse-related PDCs that generated light brown plumes 300-500 m above the crater. During 10-11 July light ashfall was reported in some areas of Mabinit, Legazpi City, Budiao and Salvacion, Daraga, and Camalig, Albay. By 18 July the lava flow advanced 600 m on the E flank as well.
During 1733 on 18 July and 0434 on 19 July PHIVOLCS reported 30 “ashing” events, which are degassing events accompanied by audible thunder-like sounds and entrained ash at the crater, which produced short, dark plumes that drifted SW. These events each lasted 20-40 seconds, and plume heights ranged from 150-300 m above the crater, as recorded by seismic, infrasound, visual, and thermal monitors. Three more ashing events occurred during 19-20 July. Short-term observations from electronic tilt and GPS monitoring indicate deflation on the E lower flanks in early July and inflation on the NW middle flanks during the third week of July. Longer-term ground deformation parameters from EDM, precise leveling, continuous GPS, and electronic tilt monitoring indicated that the volcano was still generally inflated relative to baseline levels. A short-lived lava pulse lasted 28 seconds at 1956 on 21 July, which was accompanied by seismic and infrasound signals. By 22 July, the only lava flow that remained active was on the SE flank, and continued to extend 3.4 km, while those on the S and E flanks weakened markedly. One ashing event was detected during 30-31 July, whereas there were 57 detected during 31 July-1 August; according to PHIVOLCS beginning at approximately 1800 on 31 July eruptive activity was dominated by phases of intermittent ashing, as well as increased in the apparent rates of lava effusion from the summit crater. The ashing phases consisted of discrete events recorded as low-frequency volcanic earthquakes (LFVQ) typically 30 seconds in duration, based on seismic and infrasound signals. Gray ash plume rose 100 m above the crater and generally drifted NE. Shortly after these ashing events began, new lava began to effuse rapidly from the crater, feeding the established flowed on the SE, E, and E flanks and generating frequent rockfall events.
Intensified unrest persisted during August. There was a total of 4,141 rockfall events, 2,881 volcanic earthquakes, which included volcanic tremor events, 32 ashing events, and 101 PDCs detected throughout the month. On clear weather days, gas-and-steam emissions rose 300-1,500 m above the crater and drifted in different directions (figure 54). Sulfur dioxide emissions averaged 735-4,756 t/d, the higher value of which was measured on 16 August. During 1-2 August the rate of lava effusion decreased, but continued to feed the flows on the SE, S, and E flanks, maintaining their advances to 3.4 km, 2.8 km, and 1.1 km from the crater, respectively (figure 55). Rockfall and PDCs generated by collapses at the lava flow margins and from the summit dome deposited material within 4 km of the crater. During 3-4 August there were 10 tremor events detected that lasted 1-4 minutes. Short-lived lava pulse lasted 35 seconds and was accompanied by seismic and infrasound signals at 0442 on 6 August. Seven collapses were recorded at the front of the lava flow during 12-14 August.
During September, similar activity of slow lava effusion, PDCs, gas-and-steam emissions, and seismicity continued. There was a total of 4,452 rockfall events, 329 volcanic earthquakes, which included volcanic tremor events, two ashing events, and 85 PDCs recorded throughout the month. On clear weather days, gas-and-steam emissions rose 100-1,500 m above the crater and drifted in multiple directions. Sulfur dioxide emissions averaged 609-2,252 t/d, the higher average of which was measured on 6 September. Slow lava effusion continued advancing on the SE, S, and E flanks, maintaining lengths of 3.4 km, 2.8 km, and 1.1 km, respectively. Rockfall and PDC events generated by collapses along the lava flow margins and at the summit dome deposited material within 4 km of the crater.
Geologic Background. Symmetrical Mayon, which rises above the Albay Gulf NW of Legazpi City, is the most active volcano of the Philippines. The steep upper slopes are capped by a small summit crater. Recorded eruptions since 1616 CE range from Strombolian to basaltic Plinian, with cyclical activity beginning with basaltic eruptions, followed by longer periods of andesitic lava flows. Eruptions occur predominately from the central conduit and have also produced lava flows that travel far down the flanks. Pyroclastic density currents and mudflows have commonly swept down many of the approximately 40 ravines that radiate from the summit and have often damaged populated lowland areas. A violent eruption in 1814 killed more than 1,200 people and devastated several towns.
Information Contacts: Philippine Institute of Volcanology and Seismology (PHIVOLCS), Department of Science and Technology, University of the Philippines Campus, Diliman, Quezon City, Philippines (URL: http://www.phivolcs.dost.gov.ph/); MIROVA (Middle InfraRed Observation of Volcanic Activity), a collaborative project between the Universities of Turin and Florence (Italy) supported by the Centre for Volcanic Risk of the Italian Civil Protection Department (URL: http://www.mirovaweb.it/); Hawai'i Institute of Geophysics and Planetology (HIGP) - MODVOLC Thermal Alerts System, School of Ocean and Earth Science and Technology (SOEST), Univ. of Hawai'i, 2525 Correa Road, Honolulu, HI 96822, USA (URL: http://modis.higp.hawaii.edu/); Copernicus Browser, Copernicus Data Space Ecosystem, European Space Agency (URL: https://dataspace.copernicus.eu/browser/); William Rogers, Legazpi City, Albay Province, Philippines.
Nishinoshima (Japan) — October 2023 Cite this Report
Nishinoshima
Japan
27.247°N, 140.874°E; summit elev. 100 m
All times are local (unless otherwise noted)
Eruption plumes and gas-and-steam plumes during May-August 2023
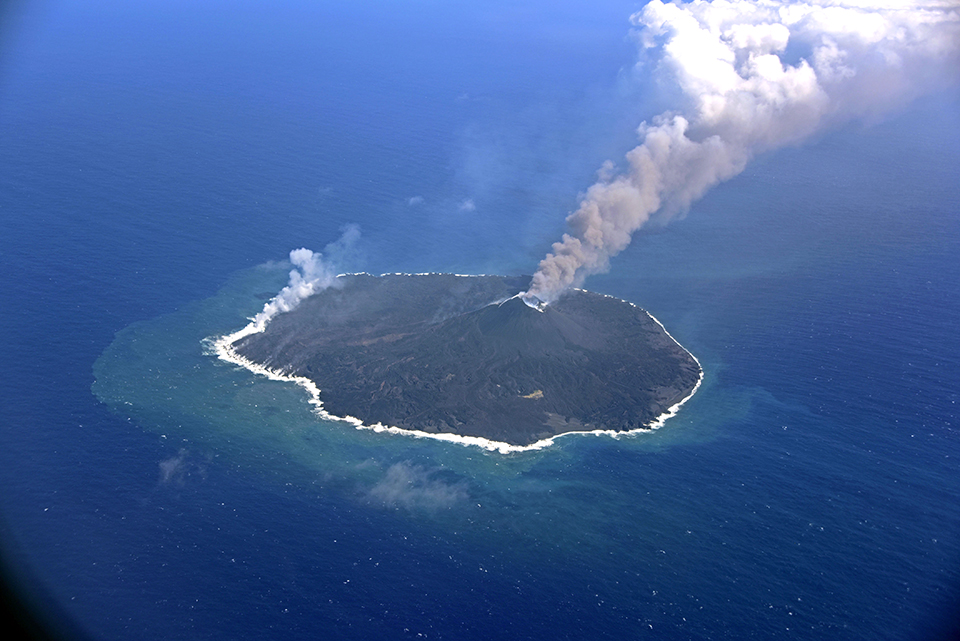
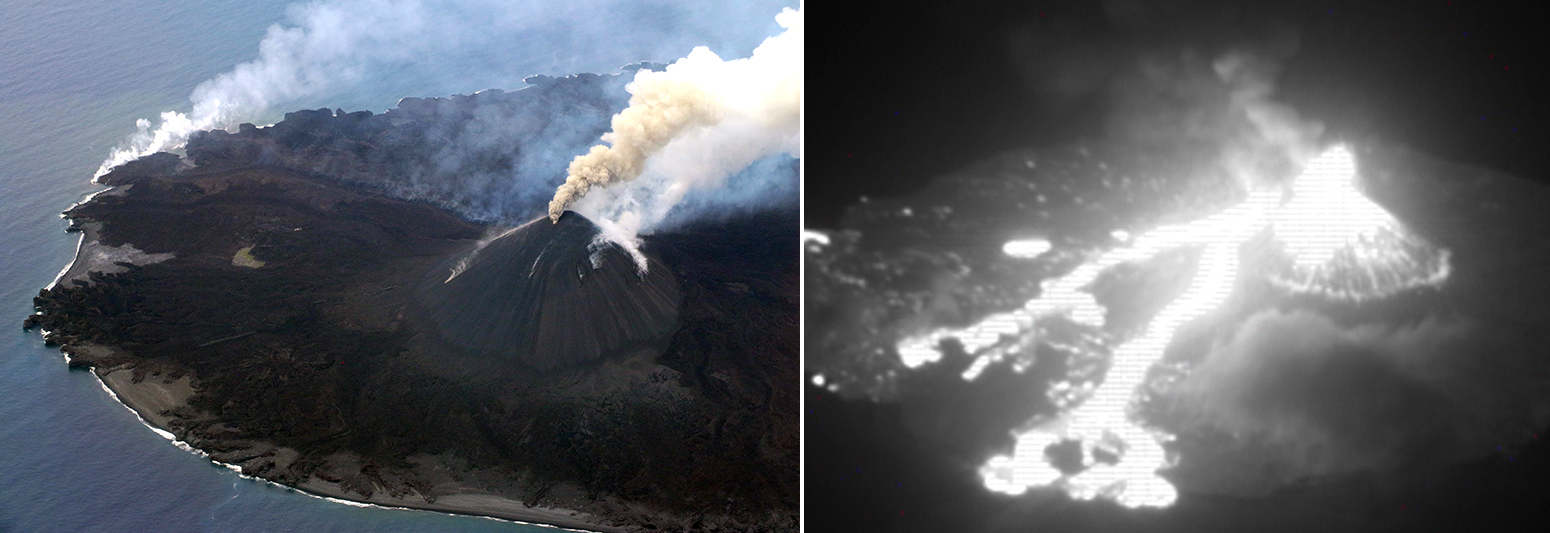
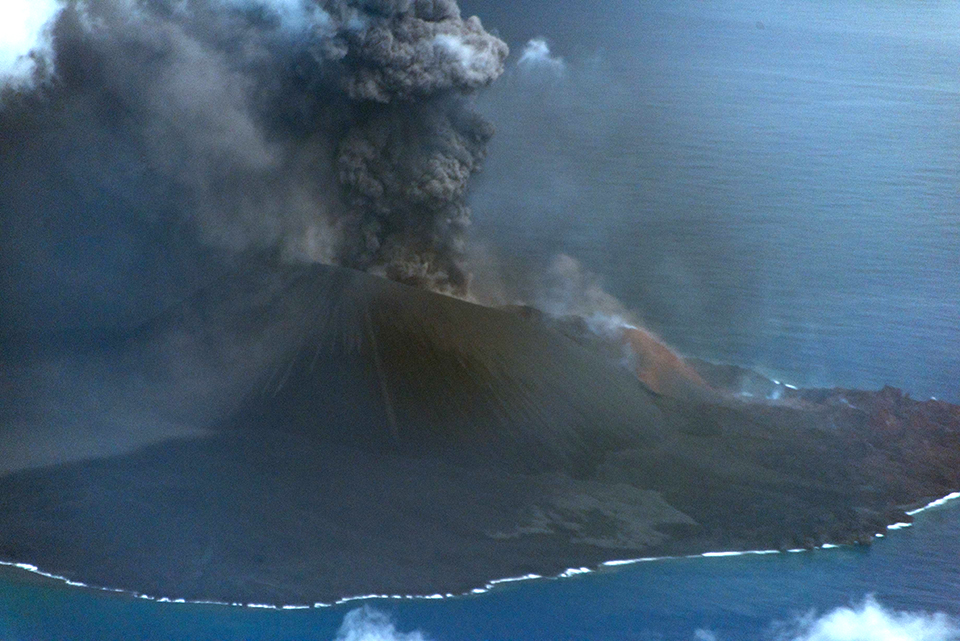
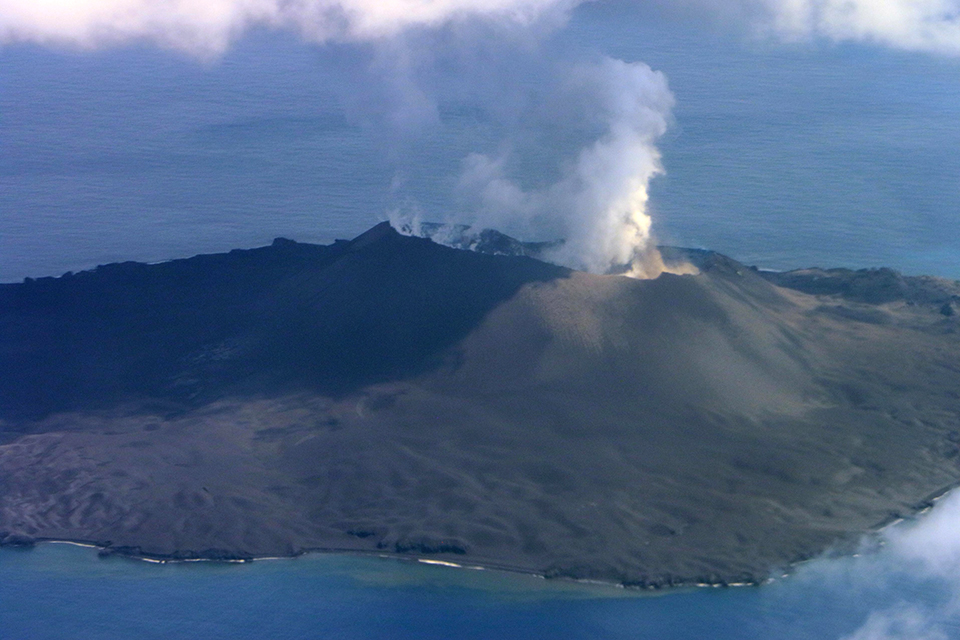
Nishinoshima, located about 1,000 km S of Tokyo, is a small island in the Ogasawara Arc in Japan. The island is the summit of a massive submarine volcano that has prominent submarine peaks to the S, W, and NE. Eruptions date back to 1973 and the current eruption period began in October 2022. Recent activity has consisted of small ash plumes and fumarolic activity (BGVN 48:07). This report covers activity during May through August 2023, using information from monthly reports of the Japan Meteorological Agency (JMA) monthly reports and satellite data.
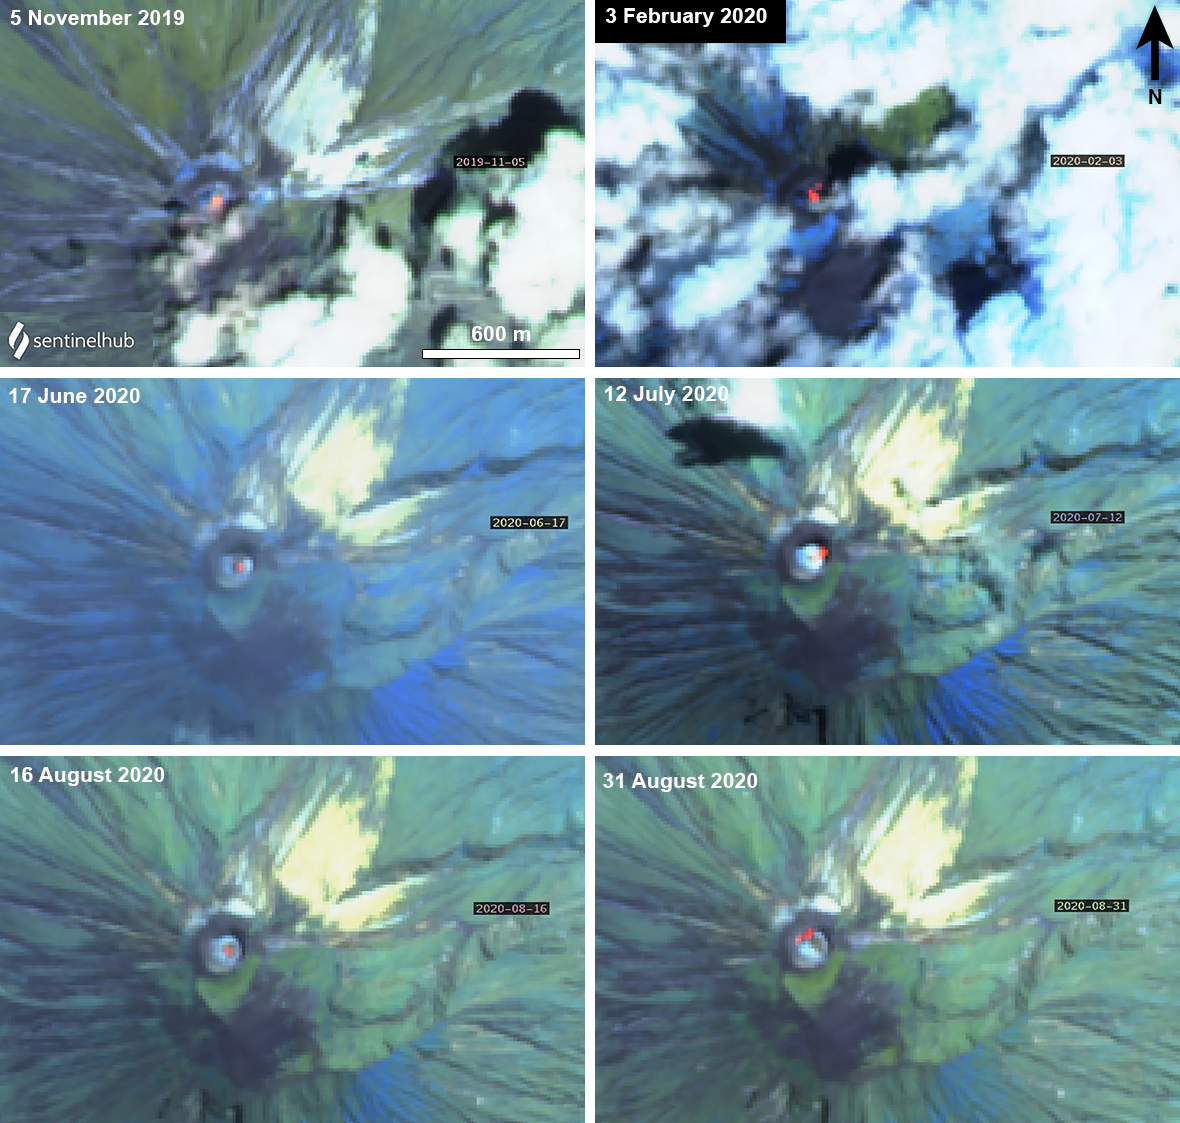
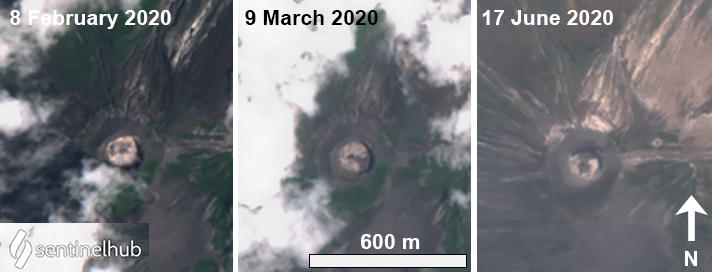
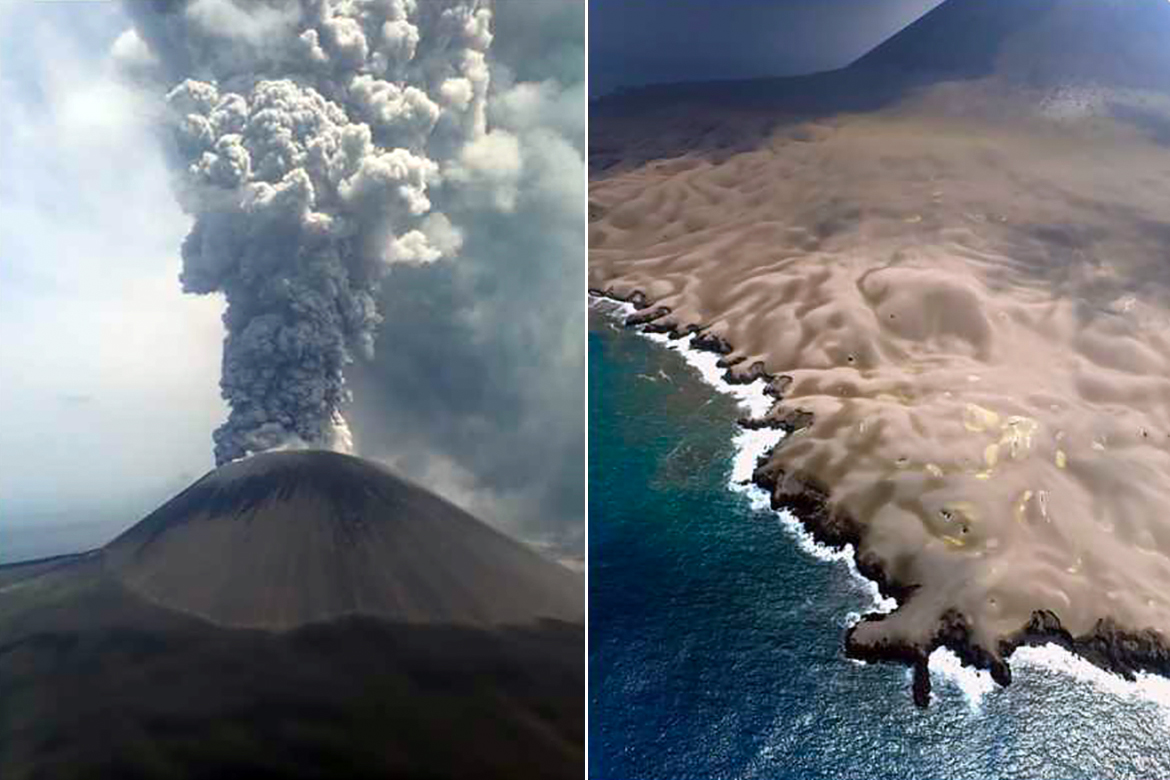
Activity during May through June was relatively low. The Japan Coast Guard (JCG) did overflights on 14 and 22 June and reported white gas-and-steam emissions rising 600 m and 1,200 m from the central crater of the pyroclastic cone, respectively (figure 125). In addition, multiple white gas-and-steam emissions rose from the inner rim of the W side of the crater and from the SE flank of the pyroclastic cone. Discolored brown-to-green water was observed around almost the entire perimeter of the island; on 22 June light green discolored water was observed off the S coast of the island.
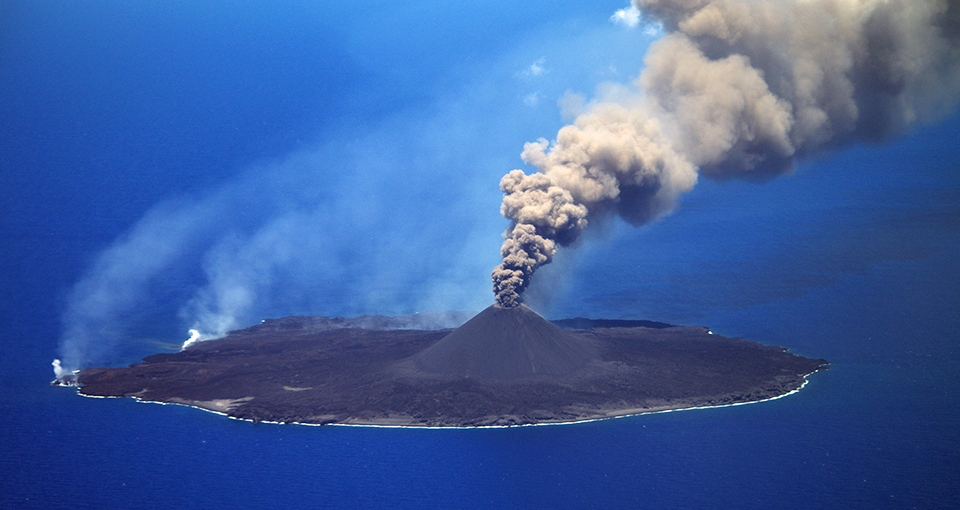
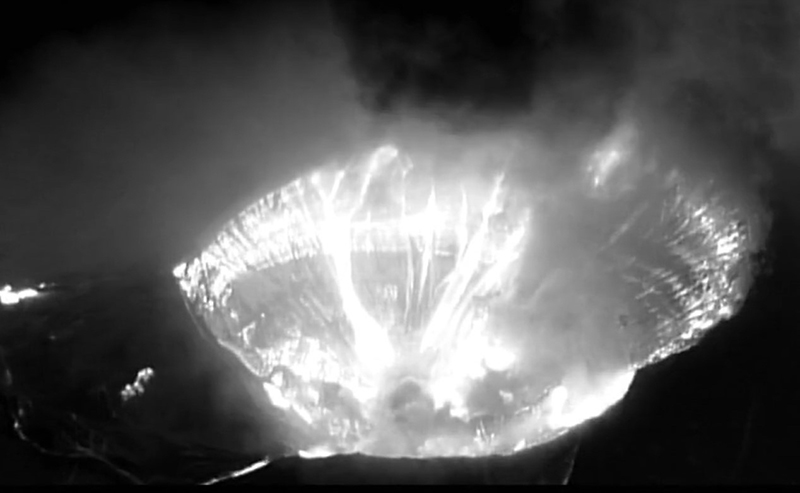
Observations from the Himawari meteorological satellite confirmed an eruption on 9 and 10 July. An eruption plume rose 1.6 km above the crater and drifted N around 1300 on 9 July. Satellite images acquired at 1420 and 2020 on 9 July and at 0220 on 10 July showed continuing emissions that rose 1.3-1.6 km above the crater and drifted NE and N. The Tokyo VAAC reported that an ash plume seen by a pilot and identified in a satellite image at 0630 on 21 July rose to 3 km altitude and drifted S.
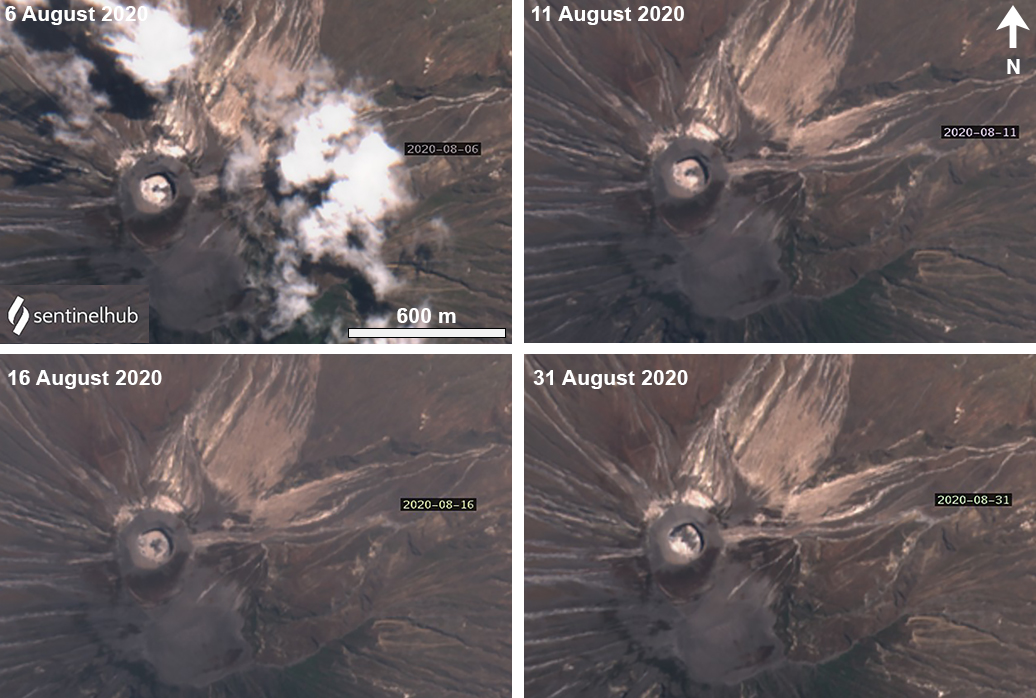
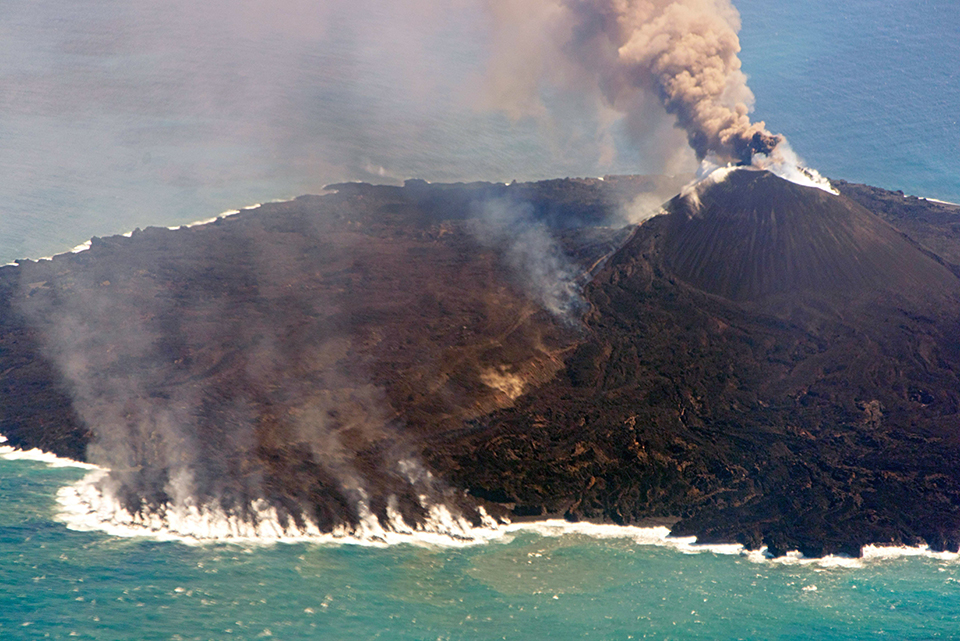
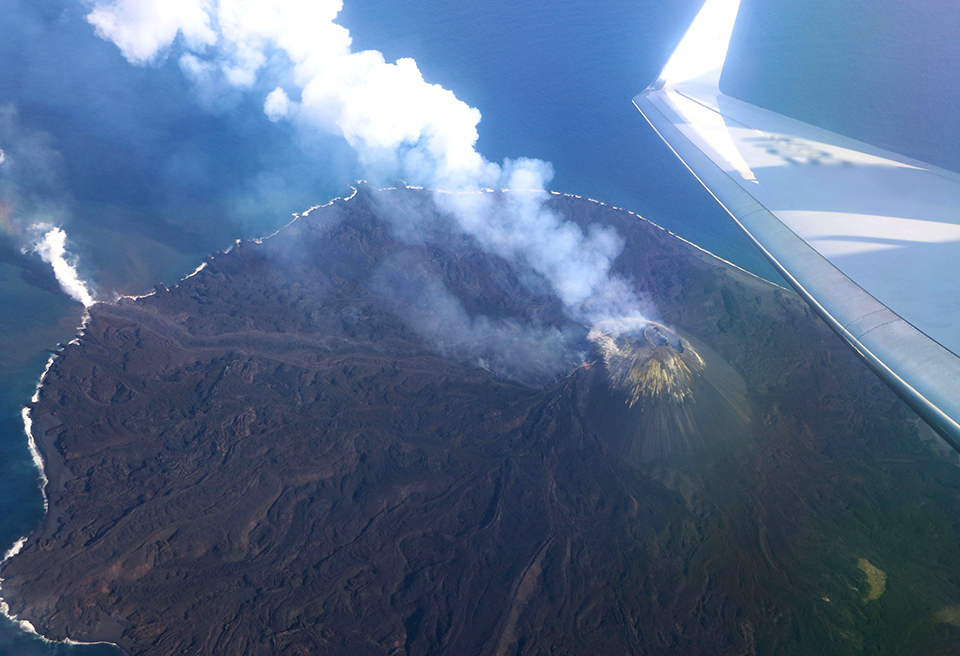
Aerial observations conducted by JCG on 8 August showed a white-and-gray plume rising from the central crater of the pyroclastic cone, and multiple white gas-and-steam emissions were rising from the inner edge of the western crater and along the NW-SE flanks of the island (figure 126). Brown-to-green discolored water was also noted around the perimeter of the island.
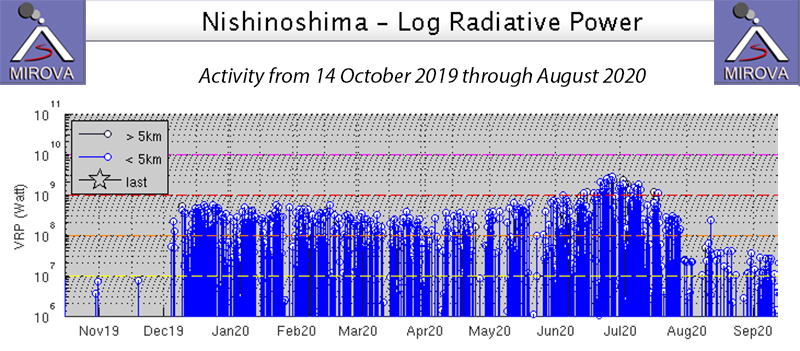
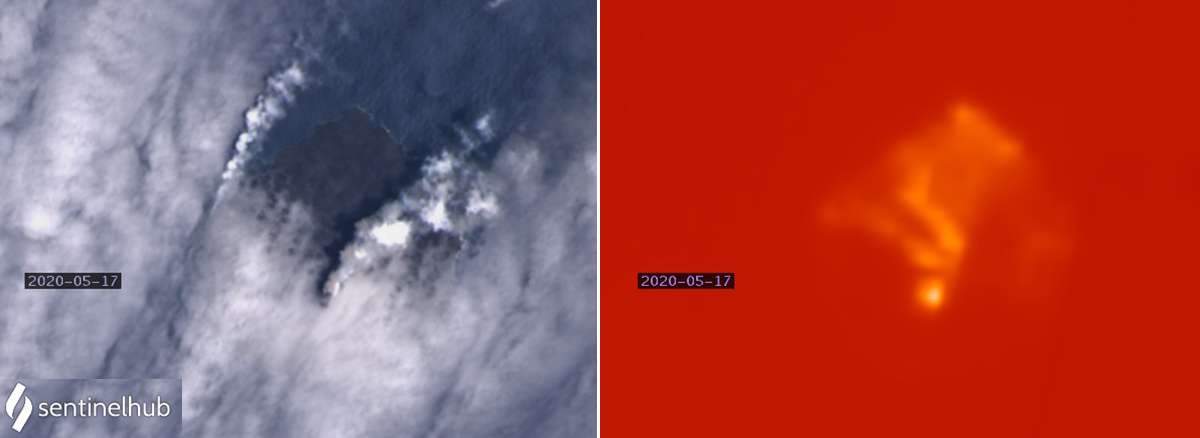
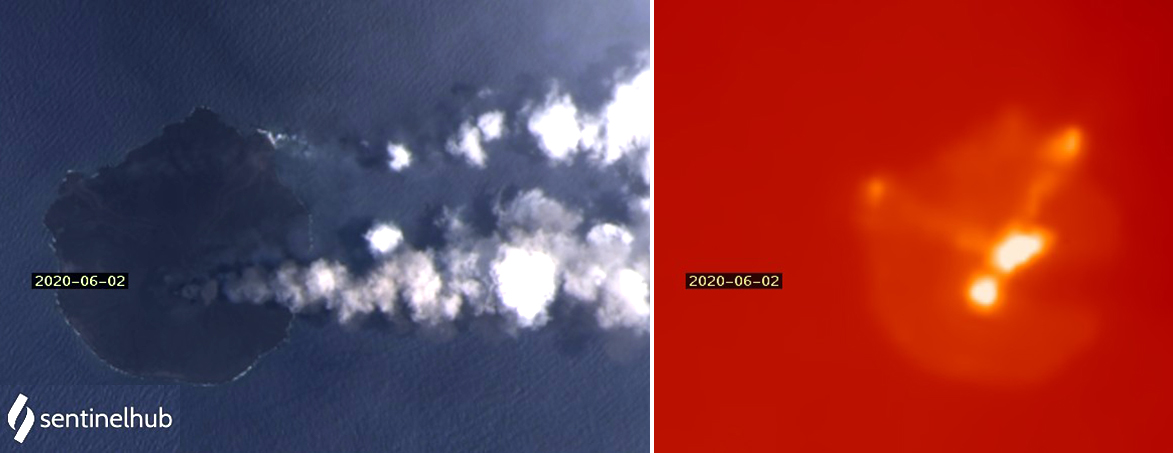
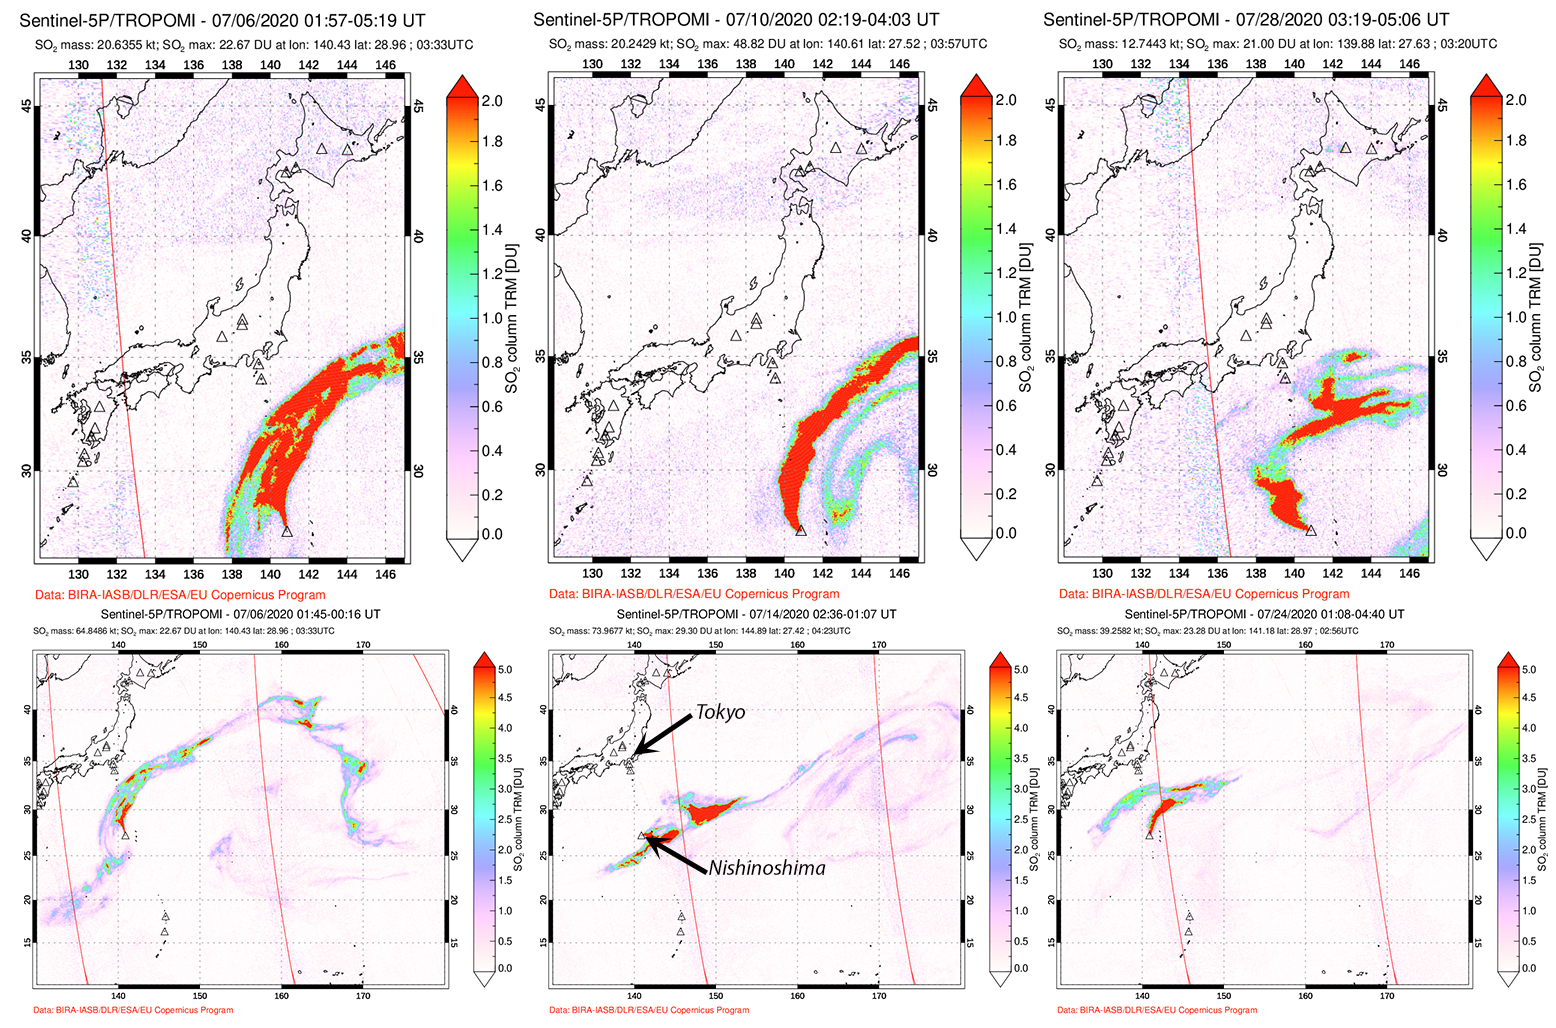
Intermittent low-to-moderate power thermal anomalies were recorded in the MIROVA graph (Middle InfraRed Observation of Volcanic Activity), showing an increase in both frequency and power beginning in July (figure 127). This increase in activity coincides with eruptive activity on 9 and 10 July, characterized by eruption plumes. According to the MODVOLC thermal alert algorithm, one thermal hotspot was recorded on 20 July. Weak thermal anomalies were also detected in infrared satellite imagery, accompanied by strong gas-and-steam plumes (figure 128).
Geologic Background. The small island of Nishinoshima was enlarged when several new islands coalesced during an eruption in 1973-74. Multiple eruptions that began in 2013 completely covered the previous exposed surface and continued to enlarge the island. The island is the summit of a massive submarine volcano that has prominent peaks to the S, W, and NE. The summit of the southern cone rises to within 214 m of the ocean surface 9 km SSE.
Information Contacts: Japan Meteorological Agency (JMA), 1-3-4 Otemachi, Chiyoda-ku, Tokyo 100-8122, Japan (URL: http://www.jma.go.jp/jma/indexe.html); Tokyo Volcanic Ash Advisory Center (VAAC), 1-3-4 Otemachi, Chiyoda-ku, Tokyo 100-8122, Japan (URL: http://ds.data.jma.go.jp/svd/vaac/data/); MIROVA (Middle InfraRed Observation of Volcanic Activity), a collaborative project between the Universities of Turin and Florence (Italy) supported by the Centre for Volcanic Risk of the Italian Civil Protection Department (URL: http://www.mirovaweb.it/); Copernicus Browser, Copernicus Data Space Ecosystem, European Space Agency (URL: https://dataspace.copernicus.eu/browser/).
Krakatau (Indonesia) — October 2023 Cite this Report
Krakatau
Indonesia
6.1009°S, 105.4233°E; summit elev. 285 m
All times are local (unless otherwise noted)
White gas-and-steam plumes and occasional ash plumes during May-August 2023
Krakatau is located in the Sunda Strait between Java and Sumatra, Indonesia. Caldera collapse during the catastrophic 1883 eruption destroyed Danan and Perbuwatan cones and left only a remnant of Rakata. The post-collapse cone of Anak Krakatau (Child of Krakatau) was constructed within the 1883 caldera at a point between the former Danan and Perbuwatan cones; it has been the site of frequent eruptions since 1927. The current eruption period began in May 2021 and has recently consisted of Strombolian eruptions and ash plumes (BGVN 48:07). This report describes lower levels of activity consisting of ash and white gas-and-steam plumes during May through August 2023, based on information provided by the Indonesian Center for Volcanology and Geological Hazard Mitigation, referred to as Pusat Vulkanologi dan Mitigasi Bencana Geologi (PVMBG), MAGMA Indonesia, and satellite data.
Activity was relatively low during May and June. Daily white gas-and-steam emissions rose 25-200 m above the crater and drifted in different directions. Five ash plumes were detected at 0519 on 10 May, 1241 on 11 May, 0920 on 12 May, 2320 on 12 May, and at 0710 on 13 May, and rose 1-2.5 km above the crater and drifted SW. A webcam image taken on 12 May showed ejection of incandescent material above the vent. A total of nine ash plumes were detected during 6-11 June: at 1434 and 00220 on 6 and 7 June the ash plumes rose 500 m above the crater and drifted NW, at 1537 on 8 June the ash plume rose 1 km above the crater and drifted SW, at 0746 and at 0846 on 9 June the ash plumes rose 800 m and 3 km above the crater and drifted SW, respectively, at 0423, 1431, and 1750 on 10 June the ash plumes rose 2 km, 1.5 km, and 3.5 km above the crater and drifted NW, respectively, and at 0030 on 11 June an ash plume rose 2 km above the crater and drifted NW. Webcam images taken on 10 and 11 June at 0455 and 0102, respectively, showed incandescent material ejected above the vent. On 19 June an ash plume at 0822 rose 1.5 km above the crater and drifted SE.
Similar low activity of white gas-and-steam emissions and few ash plumes were reported during July and August. Daily white gas-and-steam emissions rose 25-300 m above the crater and drifted in multiple directions. Three ash plumes were reported at 0843, 0851, and 0852 on 20 July that rose 500-2,000 m above the crater and drifted NW.
The MIROVA (Middle InfraRed Observation of Volcanic Activity) graph of MODIS thermal anomaly data showed intermittent low-to-moderate power thermal anomalies during May through August 2023 (figure 140). Although activity was often obscured by weather clouds, a thermal anomaly was visible in an infrared satellite image of the crater on 12 May, accompanied by an eruption plume that drifted SW (figure 141).
Geologic Background. The renowned Krakatau (frequently mis-named as Krakatoa) volcano lies in the Sunda Strait between Java and Sumatra. Collapse of an older edifice, perhaps in 416 or 535 CE, formed a 7-km-wide caldera. Remnants of that volcano are preserved in Verlaten and Lang Islands; subsequently the Rakata, Danan, and Perbuwatan cones were formed, coalescing to create the pre-1883 Krakatau Island. Caldera collapse during the catastrophic 1883 eruption destroyed Danan and Perbuwatan, and left only a remnant of Rakata. This eruption caused more than 36,000 fatalities, most as a result of tsunamis that swept the adjacent coastlines of Sumatra and Java. Pyroclastic surges traveled 40 km across the Sunda Strait and reached the Sumatra coast. After a quiescence of less than a half century, the post-collapse cone of Anak Krakatau (Child of Krakatau) was constructed within the 1883 caldera at a point between the former Danan and Perbuwatan cones. Anak Krakatau has been the site of frequent eruptions since 1927.
Information Contacts: Pusat Vulkanologi dan Mitigasi Bencana Geologi (PVMBG, also known as Indonesian Center for Volcanology and Geological Hazard Mitigation, CVGHM), Jalan Diponegoro 57, Bandung 40122, Indonesia (URL: http://www.vsi.esdm.go.id/); MAGMA Indonesia, Kementerian Energi dan Sumber Daya Mineral (URL: https://magma.esdm.go.id/v1); MIROVA (Middle InfraRed Observation of Volcanic Activity), a collaborative project between the Universities of Turin and Florence (Italy) supported by the Centre for Volcanic Risk of the Italian Civil Protection Department (URL: http://www.mirovaweb.it/); Copernicus Browser, Copernicus Data Space Ecosystem, European Space Agency (URL: https://dataspace.copernicus.eu/browser/).
Villarrica (Chile) — October 2023 Cite this Report
Villarrica
Chile
39.42°S, 71.93°W; summit elev. 2847 m
All times are local (unless otherwise noted)
Strombolian activity, gas-and-ash emissions, and crater incandescence during April-September 2023
Villarrica, in central Chile, consists of a 2-km-wide caldera that formed about 3,500 years ago and is located at the base of the presently active cone at the NW margin of a 6-km-wide caldera. Historical eruptions eruptions date back to 1558 and have been characterized by mild-to-moderate explosive activity with occasional lava effusions. The current eruption period began in December 2014 and has recently consisted of nighttime crater incandescence, ash emissions, and seismicity (BGVN 48:04). This report covers activity during April through September 2023 and describes occasional Strombolian activity, gas-and-ash emissions, and nighttime crater incandescence. Information for this report primarily comes from the Southern Andes Volcano Observatory (Observatorio Volcanológico de Los Andes del Sur, OVDAS), part of Chile's National Service of Geology and Mining (Servicio Nacional de Geología y Minería, SERNAGEOMIN) and satellite data.
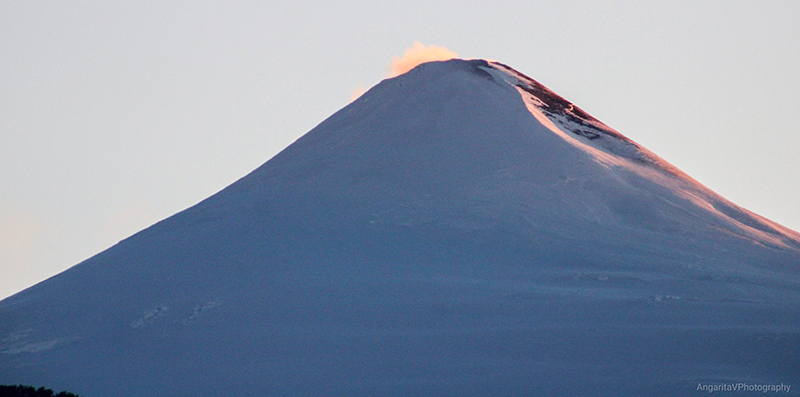
Seismicity during April consisted of long period (LP) events and tremor (TRE); a total of 9,413 LP-type events and 759 TR-type events were detected throughout the month. Nighttime crater incandescence persisted and was visible in the degassing column. Sulfur dioxide data was obtained using Differential Absorption Optical Spectroscopy Equipment (DOAS) that showed an average value of 1,450 ± 198 tons per day (t/d) during 1-15 April and 1,129 ± 201 t/d during 16-30 April, with a maximum daily value of 2,784 t/d on 9 April. Gas-and-steam emissions of variable intensities rose above the active crater as high as 1.3 km above the crater on 13 April. Strombolian explosions were not observed and there was a slight decrease in the lava lake level.
There were 14,123 LP-type events and 727 TR-type events detected during May. According to sulfur dioxide measurements taken with DOAS equipment, the active crater emitted an average value of 1,826 ± 482 t/d during 1-15 May and 912 ± 41 t/d during 16-30 May, with a daily maximum value of 5,155 t/d on 13 May. Surveillance cameras showed continuous white gas-and-steam emissions that rose as high as 430 m above the crater on 27 May. Nighttime incandescence illuminated the gas column less than 300 m above the crater rim was and no pyroclastic emissions were reported. A landslide was identified on 13 May on the E flank of the volcano 50 m from the crater rim and extending 300 m away; SERNAGEOMIN noted that this event may have occurred on 12 May. During the morning of 27 and 28 May minor Strombolian explosions characterized by incandescent ejecta were recorded at the crater rim; the last reported Strombolian explosions had occurred at the end of March.
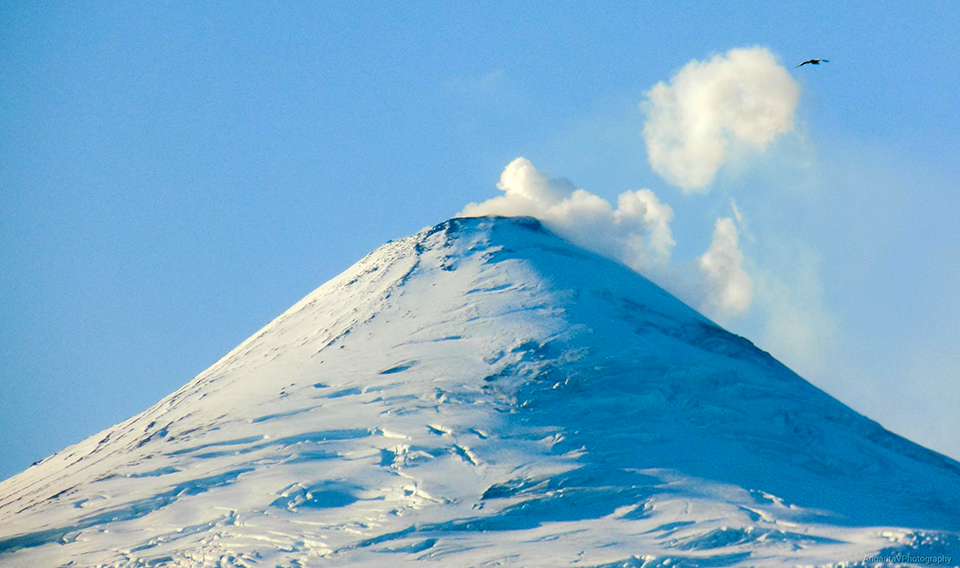
Seismic activity during June consisted of five volcano-tectonic (VT)-type events, 21,606 LP-type events, and 2,085 TR-type events. The average value of sulfur dioxide flux obtained by DOAS equipment was 1,420 ± 217 t/d during 1-15 June and 2,562 ± 804 t/d, with a maximum daily value of 4,810 t/d on 17 June. White gas-and-steam emissions rose less than 480 m above the crater; frequent nighttime crater incandescence was reflected in the degassing plume. On 12 June an emission rose 100 m above the crater and drifted NNW. On 15 June one or several emissions resulted in ashfall to the NE as far as 5.5 km from the crater, based on a Skysat satellite image. Several Strombolian explosions occurred within the crater; activity on 15 June was higher energy and ejected blocks 200-300 m on the NE slope. Surveillance cameras showed white gas-and-steam emissions rising 480 m above the crater on 16 June. On 19 and 24 June low-intensity Strombolian activity was observed, ejecting material as far as 200 m from the center of the crater to the E.
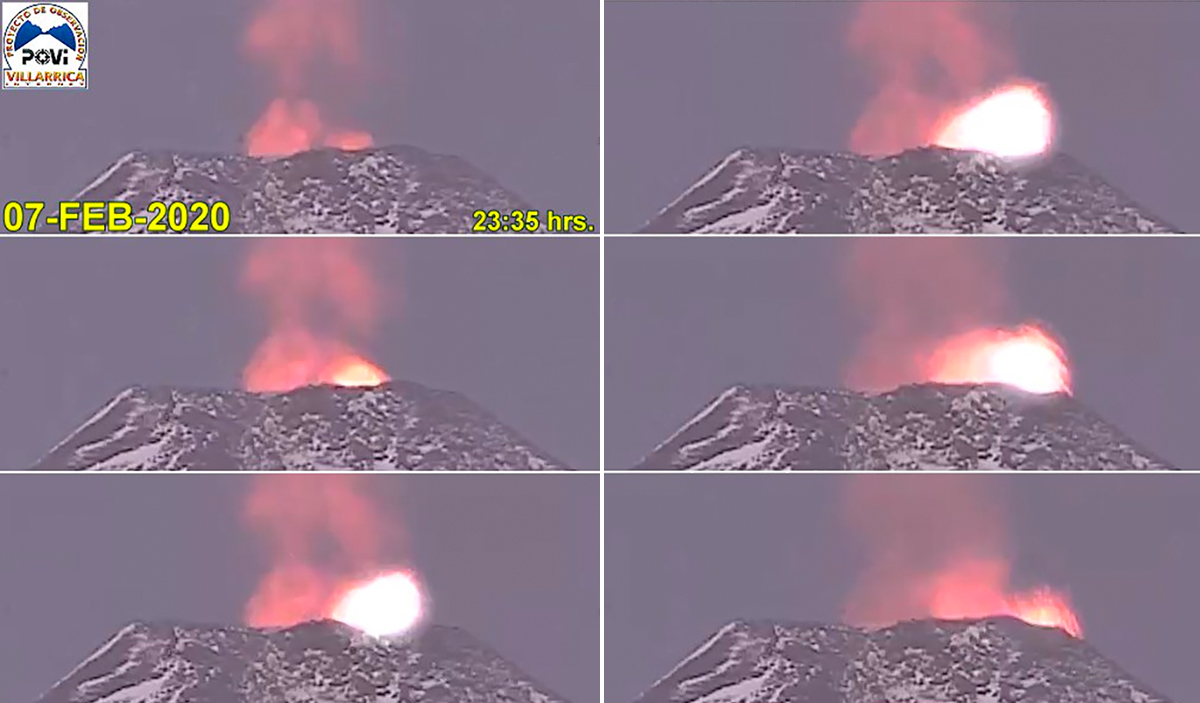
During July, seismicity included 29,319 LP-type events, 3,736 TR-type events, and two VT-type events. DOAS equipment recorded two days of sulfur dioxide emissions of 4,220 t/d and 1,009 t/d on 1 and 13 July, respectively. Constant nighttime incandescence was also recorded and was particularly noticeable when accompanied by eruptive columns on 12 and 16 July. Minor explosive events were detected in the crater. According to Skysat satellite images taken on 12, 13, and 16 July, ashfall deposits were identified 155 m S of the crater. According to POVI, incandescence was visible from two vents on the crater floor around 0336 on 12 July. Gas-and-ash emissions rose as high as 1.2 km above the crater on 13 July and drifted E and NW. A series of gas-and-steam pulses containing some ash deposited material on the upper E flank around 1551 on 13 July. During 16-31 July, average sulfur dioxide emissions of 1,679 ± 406 t/d were recorded, with a maximum daily value of 2,343 t/d on 28 July. Fine ash emissions were also reported on 16, 17, and 23 July.
Seismicity persisted during August, characterized by 27,011 LP-type events, 3,323 TR-type events, and three VT-type events. The average value of sulfur dioxide measurements taken during 1-15 August was 1,642 ± 270 t/d and 2,207 ± 4,549 t/d during 16-31 August, with a maximum daily value of 3,294 t/d on 27 August. Nighttime crater incandescence remained visible in degassing columns. White gas-and-steam emissions rose 480 m above the crater on 6 August. According to a Skysat satellite image from 6 August, ash accumulation was observed proximal to the crater and was mainly distributed toward the E slope. White gas-and-steam emissions rose 320 m above the crater on 26 August. Nighttime incandescence and Strombolian activity that generated ash emissions were reported on 27 August.
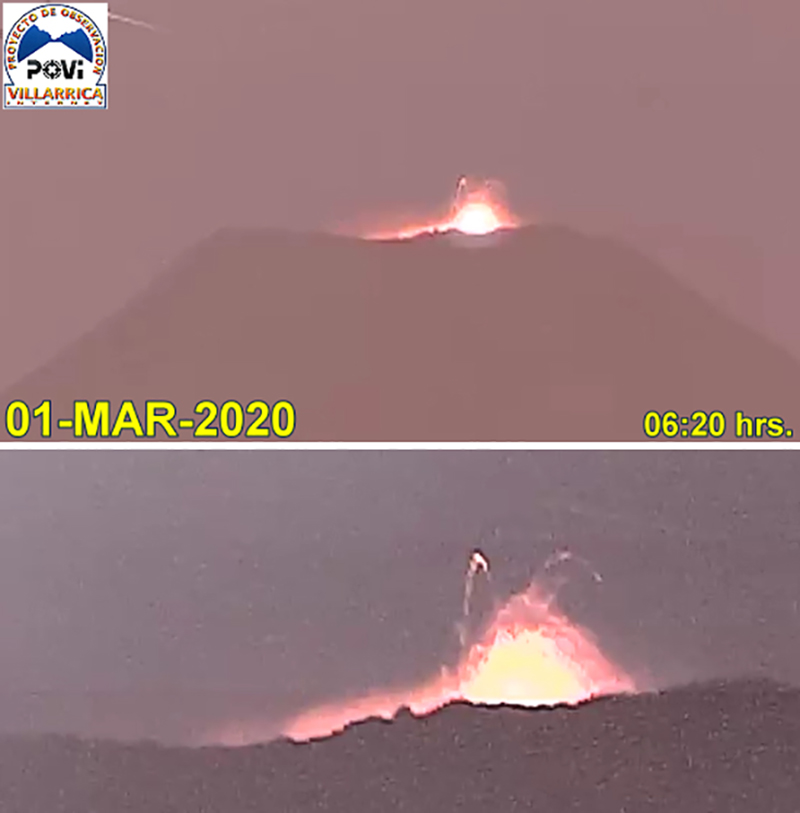
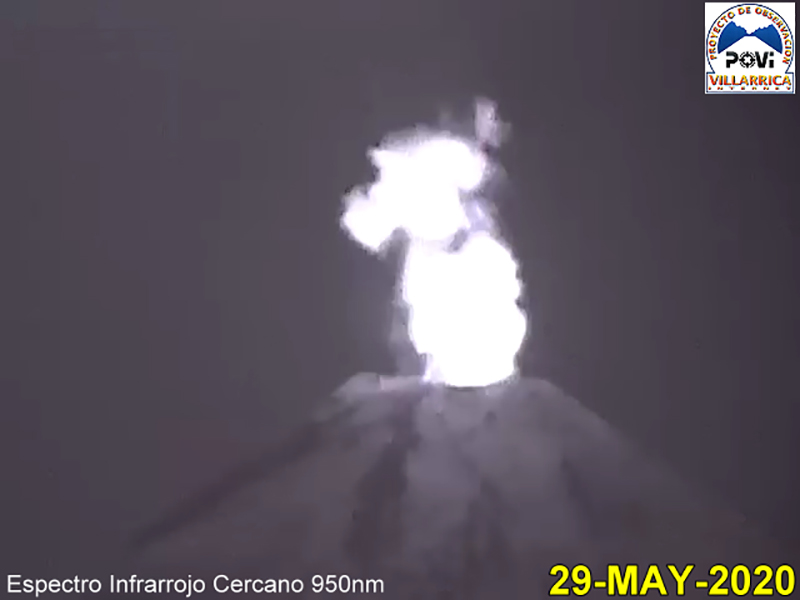
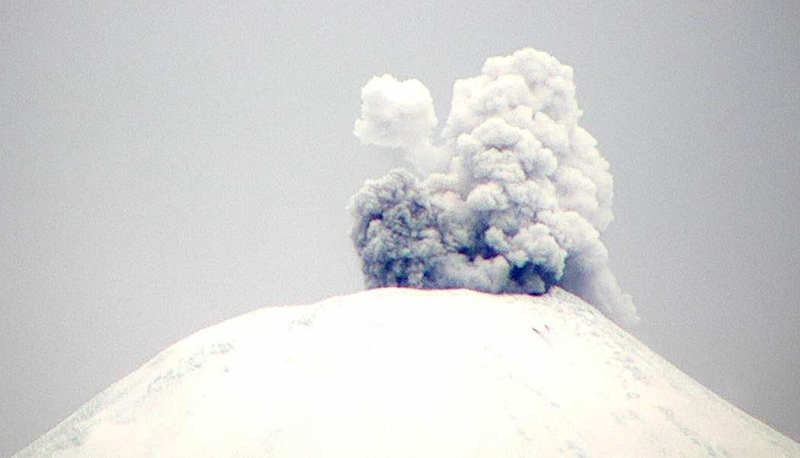
Seismicity during September was characterized by five VT-type events, 12,057 LP-type events, and 2,058 TR-type events. Nighttime incandescence persisted. On 2 September an ash emission rose 180 m above the crater and drifted SE at 1643 (figure 125) and a white gas-and-steam plume rose 320 m above the crater. According to the Buenos Aires VAAC, periods of continuous gas-and-ash emissions were visible in webcam images from 1830 on 2 September to 0110 on 3 September. Strombolian activity was observed on 2 September and during the early morning of 3 September, the latter event of which generated an ash emission that rose 60 m above the crater and drifted 100 m from the center of the crater to the NE and SW. Ashfall was reported to the SE and S as far as 750 m from the crater. The lava lake was active during 3-4 September and lava fountaining was visible for the first time since 26 March 2023, according to POVI. Fountains captured in webcam images at 2133 on 3 September and at 0054 on 4 September rose as high as 60 m above the crater rim and ejected material onto the upper W flank. Sulfur dioxide flux of 1,730 t/d and 1,281 t/d was measured on 3 and 4 September, respectively, according to data obtained by DOAS equipment.
Strong Strombolian activity and larger gas-and-ash plumes were reported during 18-20 September. On 18 September activity was also associated with energetic LP-type events and notable sulfur dioxide fluxes (as high as 4,277 t/d). On 19 September Strombolian activity and incandescence were observed. On 20 September at 0914 ash emissions rose 50 m above the crater and drifted SSE, accompanied by Strombolian activity that ejected material less than 100 m SSE, causing fall deposits on that respective flank. SERNAGEOMIN reported that a Planet Scope satellite image taken on 20 September showed the lava lake in the crater, measuring 32 m x 35 m and an area of 0.001 km2. Several ash emissions were recorded at 0841, 0910, 1251, 1306, 1312, 1315, and 1324 on 23 September and rose less than 150 m above the crater. The sulfur dioxide flux value was 698 t/d on 23 September and 1,097 t/d on 24 September. On 24 September the Volcanic Alert Level (VAL) was raised to Orange (the third level on a four-color scale). SENAPRED maintained the Alert Level at Yellow (the middle level on a three-color scale) for the communities of Villarrica, Pucón (16 km N), Curarrehue, and Panguipulli.
During 24-25 September there was an increase in seismic energy (observed at TR-events) and acoustic signals, characterized by 1 VT-type event, 213 LP-type events, and 124 TR-type events. Mainly white gas-and-steam emissions, in addition to occasional fine ash emissions were recorded. During the early morning of 25 September Strombolian explosions were reported and ejected material 250 m in all directions, though dominantly toward the NW. On 25 September the average value of sulfur dioxide flux was 760 t/d. Seismicity during 25-30 September consisted of five VT-type events, 1,937 LP-type events, and 456 TR-type events.
During 25-29 September moderate Strombolian activity was observed and ejected material as far as the crater rim. In addition, ash pulses lasting roughly 50 minutes were observed around 0700 and dispersed ENE. During 26-27 September a TR episode lasted 6.5 hours and was accompanied by discrete acoustic signals. Satellite images from 26 September showed a spatter cone on the crater floor with one vent that measured 10 x 14 m and a smaller vent about 35 m NE of the cone. SERNAGEOMIN reported an abundant number of bomb-sized blocks up to 150 m from the crater, as well as impact marks on the snow, which indicated explosive activity. A low-altitude ash emission was observed drifting NW around 1140 on 28 September, based on webcam images. Between 0620 and 0850 on 29 September an ash emission rose 60 m above the crater and drifted NW. During an overflight taken around 1000 on 29 September scientists observed molten material in the vent, a large accumulation of pyroclasts inside the crater, and energetic degassing, some of which contained a small amount of ash. Block-sized pyroclasts were deposited on the internal walls and near the crater, and a distal ash deposit was also visible. The average sulfur dioxide flux measured on 28 September was 344 t/d. Satellite images taken on 29 September ashfall was deposited roughly 3 km WNW from the crater and nighttime crater incandescence remained visible. The average sulfur dioxide flux value from 29 September was 199 t/d. On 30 September at 0740 a pulsating ash emission rose 1.1 km above the crater and drifted NNW (figure 126). Deposits on the S flank extended as far as 4.5 km from the crater rim, based on satellite images from 30 September.
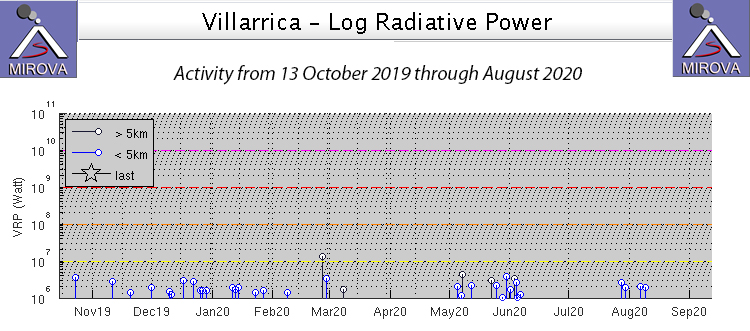
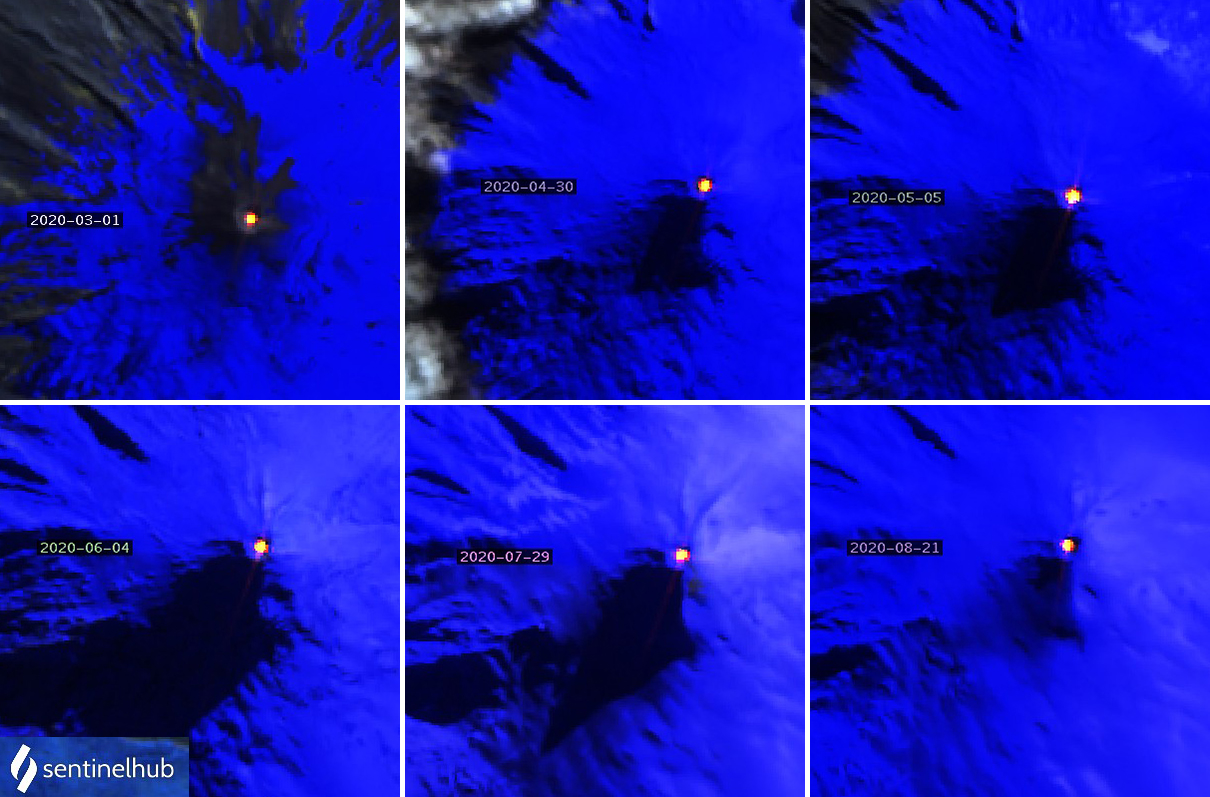
Infrared MODIS satellite data processed by MIROVA (Middle InfraRed Observation of Volcanic Activity) showed intermittent thermal activity during April through September, with slightly stronger activity detected during late September (figure 127). Small clusters of thermal activity were detected during mid-June, early July, early August, and late September. According to the MODVOLC thermal alert system, a total of four thermal hotspots were detected on 7 July and 3 and 23 September. This activity was also intermittently captured in infrared satellite imagery on clear weather days (figure 128).
Geologic Background. The glacier-covered Villarrica stratovolcano, in the northern Lakes District of central Chile, is ~15 km south of the city of Pucon. A 2-km-wide caldera that formed about 3,500 years ago is located at the base of the presently active, dominantly basaltic to basaltic andesite cone at the NW margin of a 6-km-wide Pleistocene caldera. More than 30 scoria cones and fissure vents are present on the flanks. Plinian eruptions and pyroclastic flows that have extended up to 20 km from the volcano were produced during the Holocene. Lava flows up to 18 km long have issued from summit and flank vents. Eruptions documented since 1558 CE have consisted largely of mild-to-moderate explosive activity with occasional lava effusion. Glaciers cover 40 km2 of the volcano, and lahars have damaged towns on its flanks.
Information Contacts: Servicio Nacional de Geología y Minería (SERNAGEOMIN), Observatorio Volcanológico de Los Andes del Sur (OVDAS), Avda Sta María No. 0104, Santiago, Chile (URL: http://www.sernageomin.cl/); Proyecto Observación Villarrica Internet (POVI) (URL: http://www.povi.cl/); Sistema y Servicio Nacional de Prevención y Repuesta Ante Desastres (SENAPRED), Av. Beauchef 1671, Santiago, Chile (URL: https://web.senapred.cl/); Buenos Aires Volcanic Ash Advisory Center (VAAC), Servicio Meteorológico Nacional-Fuerza Aérea Argentina, 25 de mayo 658, Buenos Aires, Argentina (URL: http://www.smn.gov.ar/vaac/buenosaires/inicio.php); MIROVA (Middle InfraRed Observation of Volcanic Activity), a collaborative project between the Universities of Turin and Florence (Italy) supported by the Centre for Volcanic Risk of the Italian Civil Protection Department (URL: http://www.mirovaweb.it/); Hawai'i Institute of Geophysics and Planetology (HIGP) - MODVOLC Thermal Alerts System, School of Ocean and Earth Science and Technology (SOEST), Univ. of Hawai'i, 2525 Correa Road, Honolulu, HI 96822, USA (URL: http://modis.higp.hawaii.edu/); Copernicus Browser, Copernicus Data Space Ecosystem, European Space Agency (URL: https://dataspace.copernicus.eu/browser/).
Merapi (Indonesia) — October 2023 Cite this Report
Merapi
Indonesia
7.54°S, 110.446°E; summit elev. 2910 m
All times are local (unless otherwise noted)
Frequent incandescent avalanches during April-September 2023
Merapi, located just north of the major city of Yogyakarta in central Java, Indonesia, has had activity within the last 20 years characterized by pyroclastic flows and lahars accompanying growth and collapse of the steep-sided active summit lava dome. The current eruption period began in late December 2020 and has more recently consisted of ash plumes, intermittent incandescent avalanches of material, and pyroclastic flows (BGVN 48:04). This report covers activity during April through September 2023, based on information from Balai Penyelidikan dan Pengembangan Teknologi Kebencanaan Geologi (BPPTKG), the Center for Research and Development of Geological Disaster Technology, a branch of PVMBG which specifically monitors Merapi. Additional information comes from the Pusat Vulkanologi dan Mitigasi Bencana Geologi (PVMBG, also known as Indonesian Center for Volcanology and Geological Hazard Mitigation, CVGHM), MAGMA Indonesia, the Darwin Volcanic Ash Advisory Centre (VAAC), and various satellite data.
Activity during April through September 2023 primarily consisted of incandescent avalanches of material that mainly affected the SW and W flanks and traveled as far as 2.3 km from the summit (table 25) and white gas-and-steam emissions that rose 10-1,000 m above the crater.
Table 25. Monthly summary of avalanches and avalanche distances recorded at Merapi during April through September 2023. The number of reported avalanches does not include instances where possible avalanches were heard but could not be visually confirmed as a result of inclement weather. Data courtesy of BPPTKG (April-September 2023 daily reports).
| Month |
Average number of avalanches per day |
Distance avalanches traveled (m) |
| Apr 2023 |
19 |
1,200-2,000 |
| May 2023 |
22 |
500-2,000 |
| Jun 2023 |
18 |
1,200-2,000 |
| Jul 2023 |
30 |
300-2,000 |
| Aug 2023 |
25 |
400-2,300 |
| Sep 2023 |
23 |
600-2,000 |
BPPTKG reported that during April and May white gas-and-steam emissions rose 10-750 m above the crater, incandescent avalanches descended 500-2,000 m on the SW and W flanks (figure 135). Cloudy weather often prevented clear views of the summit, and sometimes avalanches could not be confirmed. According to a webcam image, a pyroclastic flow was visible on 17 April at 0531. During the week of 28 April and 4 May a pyroclastic flow was reported on the SW flank, traveling up to 2.5 km. According to a drone overflight taken on 17 May the SW lava dome volume was an estimated 2,372,800 cubic meters and the dome in the main crater was an estimated 2,337,300 cubic meters.
During June and July similar activity persisted with white gas-and-steam emissions rising 10-350 m above the crater and frequent incandescent avalanches that traveled 300-2,000 m down the SW, W, and S flanks (figure 136). Based on an analysis of aerial photos taken on 24 June the volume of the SW lava dome was approximately 2.5 million cubic meters. A pyroclastic flow was observed on 5 July that traveled 2.7 km on the SW flank. According to the Darwin VAAC multiple minor ash plumes were identified in satellite images on 19 July that rose to 3.7 km altitude and drifted S and SW. During 22, 25, and 26 July a total of 17 avalanches descended as far as 1.8 km on the S flank.
Frequent white gas-and-steam emissions continued during August and September, rising 10-450 m above the crater. Incandescent avalanches mainly affected the SW and W flanks and traveled 400-2,300 m from the vent (figure 137). An aerial survey conducted on 10 August was analyzed and reported that estimates of the SW dome volume was 2,764,300 cubic meters and the dome in the main crater was 2,369,800 cubic meters.
Frequent and moderate-power thermal activity continued throughout the reporting period, according to a MIROVA (Middle InfraRed Observation of Volcanic Activity) analysis of MODIS satellite data (figure 138). There was an increase in the number of detected anomalies during mid-May. The MODVOLC thermal algorithm recorded a total of 47 thermal hotspots: six during April, nine during May, eight during June, 15 during July, four during August, and five during September. Some of this activity was captured in infrared satellite imagery on clear weather days, sometimes accompanied by incandescent material on the SW flank (figure 139).
Geologic Background. Merapi, one of Indonesia's most active volcanoes, lies in one of the world's most densely populated areas and dominates the landscape immediately north of the major city of Yogyakarta. It is the youngest and southernmost of a volcanic chain extending NNW to Ungaran volcano. Growth of Old Merapi during the Pleistocene ended with major edifice collapse perhaps about 2,000 years ago, leaving a large arcuate scarp cutting the eroded older Batulawang volcano. Subsequent growth of the steep-sided Young Merapi edifice, its upper part unvegetated due to frequent activity, began SW of the earlier collapse scarp. Pyroclastic flows and lahars accompanying growth and collapse of the steep-sided active summit lava dome have devastated cultivated lands on the western-to-southern flanks and caused many fatalities.
Information Contacts: Balai Penyelidikan dan Pengembangan Teknologi Kebencanaan Geologi (BPPTKG), Center for Research and Development of Geological Disaster Technology (URL: http://merapi.bgl.esdm.go.id/, Twitter: @BPPTKG); MAGMA Indonesia, Kementerian Energi dan Sumber Daya Mineral (URL: https://magma.esdm.go.id/v1); Pusat Vulkanologi dan Mitigasi Bencana Geologi (PVMBG, also known as Indonesian Center for Volcanology and Geological Hazard Mitigation, CVGHM), Jalan Diponegoro 57, Bandung 40122, Indonesia (URL: http://www.vsi.esdm.go.id/); Darwin Volcanic Ash Advisory Centre (VAAC), Bureau of Meteorology, Northern Territory Regional Office, PO Box 40050, Casuarina, NT 0811, Australia (URL: http://www.bom.gov.au/info/vaac/); MIROVA (Middle InfraRed Observation of Volcanic Activity), a collaborative project between the Universities of Turin and Florence (Italy) supported by the Centre for Volcanic Risk of the Italian Civil Protection Department (URL: http://www.mirovaweb.it/); Hawai'i Institute of Geophysics and Planetology (HIGP) - MODVOLC Thermal Alerts System, School of Ocean and Earth Science and Technology (SOEST), Univ. of Hawai'i, 2525 Correa Road, Honolulu, HI 96822, USA (URL: http://modis.higp.hawaii.edu/); Copernicus Browser, Copernicus Data Space Ecosystem, European Space Agency (URL: https://dataspace.copernicus.eu/browser/); Øystein Lund Andersen (URL: https://www.oysteinlundandersen.com/, https://twitter.com/oysteinvolcano).
Ebeko
Russia
50.686°N, 156.014°E; summit elev. 1103 m
All times are local (unless otherwise noted)
Moderate explosive activity with ash plumes continued during June-November 2023
Ebeko, located on the N end of Paramushir Island in Russia’s Kuril Islands just S of the Kamchatka Peninsula, consists of three summit craters along a SSW-NNE line at the northern end of a complex of five volcanic cones. Observed eruptions date back to the late 18th century and have been characterized as small-to-moderate explosions from the summit crater, accompanied by intense fumarolic activity. The current eruptive period began in June 2022, consisting of frequent explosions, ash plumes, and thermal activity (BGVN 47:10, 48:06). This report covers similar activity during June-November 2023, based on information from the Kamchatka Volcanic Eruptions Response Team (KVERT) and satellite data.
Moderate explosive activity continued during June-November 2023 (figures 50 and 51). According to visual data from Severo-Kurilsk, explosions sent ash 2-3.5 km above the summit (3-4.5 km altitude) during most days during June through mid-September. Activity after mid-September was slightly weaker, with ash usually reaching less than 2 km above the summit. According to KVERT the volcano in October and November was, with a few exceptions, either quiet or obscured by clouds that prevented satellite observations. KVERT issued Volcano Observatory Notices for Aviation (VONA) on 8 and 12 June, 13 and 22 July, 3 and 21 August, and 31 October warning of potential aviation hazards from ash plumes drifting 3-15 km from the volcano. Based on satellite data, KVERT reported a persistent thermal anomaly whenever weather clouds permitted viewing.
Geologic Background. The flat-topped summit of the central cone of Ebeko volcano, one of the most active in the Kuril Islands, occupies the northern end of Paramushir Island. Three summit craters located along a SSW-NNE line form Ebeko volcano proper, at the northern end of a complex of five volcanic cones. Blocky lava flows extend west from Ebeko and SE from the neighboring Nezametnyi cone. The eastern part of the southern crater contains strong solfataras and a large boiling spring. The central crater is filled by a lake about 20 m deep whose shores are lined with steaming solfataras; the northern crater lies across a narrow, low barrier from the central crater and contains a small, cold crescentic lake. Historical activity, recorded since the late-18th century, has been restricted to small-to-moderate explosive eruptions from the summit craters. Intense fumarolic activity occurs in the summit craters, on the outer flanks of the cone, and in lateral explosion craters.
Information Contacts: Kamchatka Volcanic Eruptions Response Team (KVERT), Far Eastern Branch, Russian Academy of Sciences, 9 Piip Blvd., Petropavlovsk-Kamchatsky, 683006, Russia (URL: http://www.kscnet.ru/ivs/kvert/).
Search Bulletin Archive by Publication Date
Select a month and year from the drop-downs and click "Show Issue" to have that issue displayed in this tab.
The default month and year is the latest issue available.
Bulletin of the Global Volcanism Network - Volume 45, Number 09 (September 2020)
Managing Editor: Edward Venzke
Etna (Italy)
Effusive activity in early April; frequent Strombolian explosions and ash emissions during April-July 2020
Fuego (Guatemala)
Ongoing explosions, ash plumes, lava flows, and lahars during April-July 2020
Klyuchevskoy (Russia)
Strombolian activity, gas-and-steam and ash plumes, and a lava flow during June-early July 2020
Lengai, Ol Doinyo (Tanzania)
Multiple lava flows within the summit crater; September 2019-August 2020
Nishinoshima (Japan)
Major June-July eruption of lava, ash, and sulfur dioxide; activity declines in August 2020
Raung (Indonesia)
Eruptions confirmed during 2012- 2013; lava fills inner crater in November 2014-August 2015
Stromboli (Italy)
Strombolian activity continues at both summit craters during May-August 2020
Turrialba (Costa Rica)
New eruptive period on 18 June 2020 consisted of ash eruptions
Villarrica (Chile)
Continued summit incandescence February-August 2020 with larger explosions in July and August
Yasur (Vanuatu)
Ash and gas explosions continue through August 2020
Etna
Italy
37.748°N, 14.999°E; summit elev. 3357 m
All times are local (unless otherwise noted)
Effusive activity in early April; frequent Strombolian explosions and ash emissions during April-July 2020
Etna, located on the island of Sicily, Italy, is a stratovolcano that has had historical eruptions dating back 3,500 years. Its most recent eruptive period began in September 2013 and has continued through July 2020, characterized by Strombolian explosions, lava flows, and ash plumes. Activity has commonly originated from the summit areas, including the Northeast Crater (NEC), the Voragine-Bocca Nuova (or Central) complex (VOR-BN), the Southeast Crater (SEC, formed in 1978), and the New Southeast Crater (NSEC, formed in 2011). The newest crater, referred to as the "cono della sella" (saddle cone), emerged during early 2017 in the area between SEC and NSEC. Volcanism during this reporting period from April through July 2020 includes frequent Strombolian explosions primarily in the Voragine and NSEC craters, ash emissions, some lava effusions, and gas-and-steam emissions. Information primarily comes from weekly reports by the Osservatorio Etneo (OE), part of the Catania Branch of Italy's Istituo Nazionale di Geofisica e Vulcanologica (INGV).
Summary of activity during April-July 2020. Degassing of variable intensity is typical activity from all summit vents at Etna during the reporting period. Intra-crater Strombolian explosions and ash emissions that rose to a maximum altitude of 5 km on 19 April primarily originated from the Voragine (VOR) and New Southeast Crater (NSEC) craters. At night, summit crater incandescence was occasionally visible in conjunction with explosions and degassing. During 18-19 April small lava flows were observed in the VOR and NSEC craters that descended toward the BN from the VOR Crater and the upper E and S flanks of the NSEC. On 19 April a significant eruptive event began with Strombolian explosions that gradually evolved into lava fountaining activity, ejecting hot material and spatter from the NSEC. Ash plumes that were produced during this event resulted in ashfall to the E of Etna. The flows had stopped by the end of April; activity during May consisted of Strombolian explosions in both the VOR and NSEC craters and intermittent ash plumes rising 4.5 km altitude. On 22 May Strombolian explosions in the NSEC produced multiple ash plumes, which resulted in ashfall to the S. INGV reported that the pit crater at the bottom of BN had widened and was accompanied by degassing. Explosions with intermittent ash emissions continued during June and July and were primarily focused in the VOR and NSEC craters; mild Strombolian activity in the SEC was reported in mid-July.
MIROVA (Middle InfraRed Observation of Volcanic Activity) analysis of MODIS satellite data shows multiple episodes of thermal activity throughout the reporting period (figure 296). In early April, the frequency and power of the thermal anomalies began to decrease through mid-June; in July, they had increased in power again but remained less frequent compared to activity in January through March. According to the MODVOLC thermal algorithm, a total of seven alerts were detected in the summit craters during 10 April (1), 17 April (1), 24 April (2), 10 July (1), 13 July (1), and 29 July (1) 2020. These thermal hotspots were typically registered during or after a Strombolian event. Frequent Strombolian activity contributed to distinct SO2 plumes that drifted in different directions (figure 297).
Activity during April-May 2020. During April, INGV reported Strombolian explosions that produced some ash emissions and intra-crater effusive activity within the Voragine Crater (VOR) and abundant degassing from the New Southeast Crater (NSEC), Northeast Crater (NEC), and from two vents on the cono della sella (saddle cone) that were sometimes accompanied by a modest amount of ash (figure 298). At night, summit crater incandescence was observed in the cono della salla. The Strombolian activity in the VOR built intra-crater scoria cones while lava flows traveled down the S flank of the largest, main cone. On 18 April effusive activity from the main cone in the VOR Crater traveled 30 m toward the Bocca Nuova (BN) Crater; the pit crater at the bottom of the BN crater had widened compared to previous observations. A brief episode of Strombolian explosions that started around 0830 on 19 April in the NSEC gradually evolved into modest lava fountaining activity by 0915, rising to 3 km altitude and ejecting bombs up to 100 m (figure 299). A large spatter deposit was found 50 m from the vent and 3-4 small lava flows were descending the NSEC crater rim; two of these summit lava flows were observed at 1006, confined to the upper E and S flanks of the cone. Around 1030, one or two vents in the cono della sella produced a gas-and-steam and ash plume that rose 5 km altitude and drifted E, resulting in ashfall on the E flank of Etna in the Valle del Bove, as well as between the towns of Zafferana Etnea (10 km SE) and Linguaglossa (17 km NE). At night, flashes of incandescence were visible at the summit. By 1155, the lava fountaining had gradually slowed, stopping completely around 1300. The NEC continued to produce gas-and-steam emissions with some intra-crater explosive activity. During the week of 20-26 April, Strombolian activity in the VOR intra-crater scoria cone ejected pyroclastic material several hundred meters above the crater rim while the lava flows had significantly decreased, though continued to travel on the E flank of the main cone. Weak, intra-crater Strombolian activity with occasional ash emissions and nightly summit incandescence were observed in the NSEC (figure 300). By 30 April there were no longer any active lava flows; the entire flow field had begun cooling. The mass of the SO2 emissions varied in April from 5,000-15,000 tons per day.
Strombolian explosions produced periodic ash emissions and ejected mild, discontinuous incandescent material in the VOR Crater; the coarse material was deposited onto the S flank of BN (figure 301). Pulsating degassing continued from the summit craters, some of which were accompanied by incandescent flashes at night. The Strombolian activity in the cono della sella occasionally produced reddish ash during 3-4 May. During 5 and 8 May, there was an increase in ash emissions at the NSEC that drifted SSE. A strong explosive event in the VOR Crater located E of the main cone produced a significant amount of ash and ejected coarse material, which included blocks and bombs measuring 15-20 cm, that fell on the W edge of the crater, as well as on the S terrace of the BN Crater (figure 302).
On 10 May degassing continued in the NSEC while Strombolian activity fluctuated in both the VOR and NSEC Craters, ejecting ballistics beyond the crater rim; in the latter, some of the blocks fell back in, accumulated on the edge, and rolled down the slopes (figure 303). During the week of 11-17 May, eruptive activity at the VOR Crater was the lowest observed since early March; there were 4-5 weak, low intensity pulses not accompanied by bombs or ashfall in the VOR Crater. Degassing continued in the BN Crater. The crater of the cono della sella had widened further N following collapses due to the Strombolian activity, which exposed the internal wall.
On 18 May an ash plume from the NSEC rose 4.5 km altitude and drifted NE. Strombolian explosions on 22 May at the NSEC produced multiple ash plumes that rose 4.5 km altitude and drifted S and SW (figure 304), depositing a thin layer of ash on the S slope, and resulting in ashfall in Catania (27 km S). Explosions from the VOR Crater had ejected a deposit of large clasts (greater than 30 cm) on the NE flank, between the VOR Crater and NEC on 23 May. INGV reported that the pit crater in the BN continued to widen and degassing was observed in the NSEC, VOR Crater, and NEC. During the week of 25-31 May persistent visible flashes of incandescence at night were observed, which suggested there was intra-crater Strombolian activity in the SEC and NSEC. The mass of the SO2 plumes varied between 5,000-9,000 tons per day.
Activity during June-July 2020. During June, moderate intra-crater Strombolian activity with intermittent ash emissions continued in the NSEC and occurred more sporadically in the VOR Crater; at night, incandescence of variable intensity was observed at the summit. During the week of 8-14 June, Strombolian explosions in the cono della sella generated some incandescence and rare jets of incandescent material above the crater rim, though no ash emissions were reported. On the morning of 14 June a sequence of ten small explosions in the VOR Crater ejected incandescent material just above the crater rim and produced small ash emissions. On 25 June an overflight showed the developing pit crater in the center of the BN, accompanied by degassing along the S edge of the wall; degassing continued from the NEC, VOR Crater, SEC, and NSEC (figure 305). The mass of the SO2 plumes measured 5,000-7,000 tons per day, according to INGV.
Similar modest, intra-crater Strombolian explosions in the NSEC, sporadic explosions in the VOR Crater, and degassing in the BN, VOR Crater, and NEC persisted into July. On 2 July degassing in the NEC was accompanied by weak intra-crater Strombolian activity. Intermittent weak ash emissions and ejecta from the NSEC and VOR Crater were observed during the month. During the week of 6-12 July INGV reported gas-and-steam emissions continued to rise from the vent in the pit crater at the bottom of BN (figure 306). On 11 July mild Strombolian activity, nighttime incandescence, and degassing was visible in the SEC (figure 307). By 15 July there was a modest increase in activity in the NSEC and VOR Craters, generating ash emissions and ejecting material over the crater rims while the other summit craters were dominantly characterized by degassing. On 31 July an explosion in the NSEC produced an ash plume that rose 4.5 km altitude.
Geologic Background. Mount Etna, towering above Catania on the island of Sicily, has one of the world's longest documented records of volcanism, dating back to 1500 BCE. Historical lava flows of basaltic composition cover much of the surface of this massive volcano, whose edifice is the highest and most voluminous in Italy. The Mongibello stratovolcano, truncated by several small calderas, was constructed during the late Pleistocene and Holocene over an older shield volcano. The most prominent morphological feature of Etna is the Valle del Bove, a 5 x 10 km caldera open to the east. Two styles of eruptive activity typically occur, sometimes simultaneously. Persistent explosive eruptions, sometimes with minor lava emissions, take place from one or more summit craters. Flank vents, typically with higher effusion rates, are less frequently active and originate from fissures that open progressively downward from near the summit (usually accompanied by Strombolian eruptions at the upper end). Cinder cones are commonly constructed over the vents of lower-flank lava flows. Lava flows extend to the foot of the volcano on all sides and have reached the sea over a broad area on the SE flank.
Information Contacts: Sezione di Catania - Osservatorio Etneo, Istituto Nazionale di Geofisica e Vulcanologia (INGV), Sezione di Catania, Piazza Roma 2, 95123 Catania, Italy (URL: http://www.ct.ingv.it/it/); MIROVA (Middle InfraRed Observation of Volcanic Activity), a collaborative project between the Universities of Turin and Florence (Italy) supported by the Centre for Volcanic Risk of the Italian Civil Protection Department (URL: http://www.mirovaweb.it/); Hawai'i Institute of Geophysics and Planetology (HIGP) - MODVOLC Thermal Alerts System, School of Ocean and Earth Science and Technology (SOEST), Univ. of Hawai'i, 2525 Correa Road, Honolulu, HI 96822, USA (URL: http://modis.higp.hawaii.edu/); Global Sulfur Dioxide Monitoring Page, Atmospheric Chemistry and Dynamics Laboratory, NASA Goddard Space Flight Center (NASA/GSFC), 8800 Greenbelt Road, Goddard, Maryland, USA (URL: https://so2.gsfc.nasa.gov/); Boris Behncke, Istituto Nazionale di Geofisica e Vulcanologia (INGV), Sezione di Catania, Piazza Roma 2, 95123 Catania, Italy.
Fuego (Guatemala) — September 2020 Cite this Report
Fuego
Guatemala
14.4748°N, 90.8806°W; summit elev. 3799 m
All times are local (unless otherwise noted)
Ongoing explosions, ash plumes, lava flows, and lahars during April-July 2020
Fuego, located in Guatemala, is a stratovolcano that has been erupting since 2002 with historical eruptions dating back to 1531. Volcanism is characterized by major ashfalls, pyroclastic flows, lava flows, and lahars. The previous report (BGVN 45:04) described recent activity that included multiple ash explosions, block avalanches, and intermittent lava flows. This report updates activity from April through July 2020 that consisted of daily explosions, ash plumes, block avalanches ashfall, intermittent lava flows, and lahars. The primary source of information comes from the Instituto Nacional de Sismologia, Vulcanología, Meteorología e Hidrologia (INSIVUMEH), the Washington Volcanic Ash Advisory Center (VAAC), and various satellite data.
Summary of activity during April-July 2020. Daily activity throughout April-July 2020 was characterized by multiple hourly explosions, ash plumes that rose to a maximum of 4.9 km altitude, incandescent pulses that reached 600 m above the crater, block avalanches into multiple drainages, and ashfall affecting nearby communities (table 21). The highest rate of explosions occurred on 2 and 3 April and 2 May with up to 16 explosions per hour. White degassing occurred frequently during the reporting period, rising to a maximum altitude of 4.5 km and drifting in multiple directions. Intermittent lava flows were observed each month in the Seca (Santa Teresa) and Ceniza drainages (figure 132); the number of flows decreased in June through July, which is represented in the MIROVA analysis of MODIS satellite data, where the strength and frequency of thermal activity slightly decreased (figure 133). Occasional lahars were detected descending several drainages on the W and SE flanks, sometimes carrying tree branches and large blocks up to 1 m in diameter.
Table 21. Activity summary by month for Fuego with information compiled from INSIVUMEH daily reports.
| Month |
Number of explosions per hour |
Ash plume heights (km) |
Ash plume distance (km) and direction |
Drainages affected by block avalanches |
Villages reporting ashfall |
| Apr 2020 |
5-16 |
4.3-4.9 km |
8-20 km E, NE, SE, W, NW, SW, S, N |
Taniluyá, Ceniza, Las Lajas, Trinidad, Seca, Honda, and Santa Teresa |
Morelia, Panimaché I and II, Sangre de Cristo, Santa Sofía, Finca Palo Verde, San Pedro Yepocapa, Las Cruces Quisache, La Rochela, Ceylan, and Osuna |
| May 2020 |
4-16 |
4.3-4.9 km |
10-17 km S, SW, W, N, NE, E, SE |
Trinidad, Taniluyá, Ceniza, Las Lajas, Santa Teresa, Seca, and Honda |
Panimaché I, La Rochela, Ceilán, Morelia, San Andrés Osuna, Finca Palo Verde, Santa Sofía, Seilán, San Pedro Yepocapa, Alotenango, Ciudad Vieja, San Miguel Dueñas, and Antigua Guatemala |
| Jun 2020 |
3-15 |
4.2-4.9 km |
10-25.9 km E, SE, S, N, NE, W, SW, NW |
Seca, Taniluyá, Ceniza, Trinidad, Las Lajas, Santa Teresa and Honda |
San Pedro Yepocapa, Sangre de Cristo, Panimaché I and II, Morelia, Finca Palo Verde, El Porvenir, Yucales, Santa Emilia, Santa Sofía |
| Jul 2020 |
1-15 |
4-4.9 km |
10-24 km W, NW, SW, S, NE |
Trinidad, Taniluyá, Ceniza, Honda, Las Lajas, Seca, and Santa Teresa |
Panimaché I and II, Morelia, Santa Sofía, Finca Palo Verde, Sangre de Cristo, San Pedro Yepocapa, and El Porvenir |
Activity during April-May 2020. Activity in April 2020 consisted of 5-16 explosions per hour, generating ash plumes that rose 4.3-4.9 km altitude and drifted 8-20 km in multiple directions. Ashfall was reported in Morelia (9 km SW), Panimaché I and II (8 km SW), Sangre de Cristo (8 km WSW), Santa Sofía (12 km SW), Finca Palo Verde, San Pedro Yepocapa (8 km NW), Las Cruces Quisache (8 km NW), La Rochela, Ceylan, Osuna (12 km SW). The Washington VAAC issued multiple aviation advisories for a total of six days in April. Intermittent white gas-and-steam emissions reached 4.1-4.5 km altitude drifting in multiple directions. Incandescent ejecta was frequently observed rising 75-400 m above the crater; material ejected up to 600 m above the crater on 11 April. These constant explosions produced block avalanches that traveled down the Taniluyá (SW), Ceniza (SSW), Las Lajas (SE), Trinidad (S), Seca (W), Honda, and Santa Teresa (W) drainages. Effusive activity was reported on 6-13 and 15 April from the summit vent, traveling 150-800 m down the Ceniza drainage, accompanied by block avalanches in the front of the flow up to 1 km. Crater incandescence was also observed.
On 19-20 April a new lava flow descended the Ceniza drainage measuring 200-400 long, generating incandescent block avalanches at the front of the flow that moved up to 1 km. On 22 April lahars descended the Honda, Las Lajas, El Juté (SE), Trinidad, Ceniza, Taniluyá, Mineral, and Seca drainages and tributaries in Guacalate, Achiguate, and Pantaleón. During the evening of 23 April the rate of effusive activity increased; observatory staff observed a second lava flow in the Seca drainage was 170 m long and incandescent blocks from the flow traveled up to 600 m. Two lava flows in the Ceniza (130-400 m) and Seca (150-800 m) drainages continued from 23-28 April and had stopped by 30 April. On 30 April weak and moderate explosions produced ash plumes that rose 4.5-4.7 km altitude drifting S and SE, resulting in fine ashfall in Panimaché I, Morelia, Santa Sofía (figure 134).
During May 2020, the rate of explosion remained similar, with 4-16 explosions per hour, which generated gray ash plumes that rose 4.3-4.9 km altitude and drifted 10-17 km generally W and E. Ashfall was observed in Panimaché I, La Rochela, Ceilán, Morelia, San Andrés Osuna, Finca Palo Verde, Santa Sofía, Seilán, San Pedro Yepocapa, Alotenango (8 km ENE), Ciudad Vieja (13.5 km NE), San Miguel Dueñas (10 km NE), and Antigua Guatemala (18 km NE). The Washington VAAC issued volcanic ash advisory notices on six days in May. White gas-and-steam emissions continued, rising 4-4.5 km altitude drifting in multiple directions. Incandescent ejecta rose 100-400 m above the crater, accompanied by some crater incandescence and block avalanches in the Trinidad, Taniluyá, Ceniza, Las Lajas, Santa Teresa, Seca, and Honda drainages that moved up to 1 km and sometimes reached vegetated areas.
During 8-11 May a new 400 m long lava flow was detected in the Ceniza drainage, accompanied by constant crater incandescence and block avalanches traveling up to 1 km, according to INSIVUMEH. On 8 and 17 May moderate to strong lahars descended the Santa Teresa and Mineral drainages on the W flank and on 21 May they descended the Las Lajas drainage on the E flank and the Ceniza drainage on the SW flank. During 20-24 May a 100-400 m long lava flow was reported in the Ceniza drainage alongside degassing and avalanches moving up to 1 km and during 25-26 May a 150 m long lava flow was reported in the Seca drainage.
Activity during June-July 2020. The rate of explosions in June 2020 decreased slightly to 3-15 per hour, generating gray ash plumes that rose 4.2-4.9 km altitude and drifted 10-26 km in multiple directions (figure 135). As a result, intermittent ashfall was reported in San Pedro Yepocapa, Sangre de Cristo, Panimaché I and II, Morelia, Finca Palo Verde, El Porvenir (8 km ENE), Yucales (12 km SW), Santa Emilia, Santa Sofia, according to INSIVUMEH. VAAC advisories were published on eight days in June. Degassing persisted in the summit crater that rose 4.1-4.5 km altitude extending in different directions. Crater incandescence was observed occasionally, as well as incandescent pulses that rose 100-300 m above the crater. Block avalanches were observed descending the Seca, Taniluyá, Ceniza, Trinidad, Las Lajas, Santa Teresa, and Honda drainages, which could sometimes carry blocks up to 1 km in diameter.
On 2 June at 1050 a weak to moderate lahar was observed in the Las Lajas drainage on the SE flank. On 5 June, more lahars were detected in the Seca and Mineral drainages on the W flanks. A new lava flow was detected on 12 June, traveling 250 m down the Seca drainage on the NW flank, and accompanied by constant summit crater incandescence and gas emissions. The flow continued into 14 June, lengthening up to 300 m long. On 24 June weak and moderate explosions produced ash plumes that rose 4.3-4.7 km altitude drifting W and SW (figure 135). On 29 June at 1300 a weak lahar was reported in the Seca, Santa Teresa, and Mineral drainages on the W flank.
Daily explosions and ash plumes continued through July 2020, with 1-15 explosions per hour and producing consistent ash plumes 4-4.9 km altitude drifting generally W for 10-24 km. These explosions resulted in block avalanches that descended the Trinidad, Taniluyá, Ceniza, Honda, Las Lajas, Seca, and Santa Teresa drainages. The number of white gas emissions decrease slightly compared to previous months and 4-4.4 km altitude. VAAC advisories were distributed on twenty different days in July. Incandescent ejecta was observed rising 100-350 m above the crater. Occasional ashfall was observed in Panimaché I and II, Morelia, Santa Sofía, Finca Palo Verde, Sangre de Cristo, San Pedro Yepocapa, and El Porvenir, according to INSIVUMEH.
On 4 July in the early morning, a lava flow began in the Seca drainage, which also produced some fine ash particles that drifted W. The lava flow continued into 5 July, measuring 150 m long. On the same day, weak to moderate lahars traveled only 20 m, carrying tree branches and blocks measuring 30 cm to 1 m. On 14, 24, and 29 July more lahars were generated in the Las Lajas drainages on the former date and both the Las Lajas and El Jute drainages on the two latter dates.
Geologic Background. Volcán Fuego, one of Central America's most active volcanoes, is also one of three large stratovolcanoes overlooking Guatemala's former capital, Antigua. The scarp of an older edifice, Meseta, lies between Fuego and Acatenango to the north. Construction of Meseta dates back to about 230,000 years and continued until the late Pleistocene or early Holocene. Collapse of Meseta may have produced the massive Escuintla debris-avalanche deposit, which extends about 50 km onto the Pacific coastal plain. Growth of the modern Fuego volcano followed, continuing the southward migration of volcanism that began at the mostly andesitic Acatenango. Eruptions at Fuego have become more mafic with time, and most historical activity has produced basaltic rocks. Frequent vigorous eruptions have been recorded since the onset of the Spanish era in 1524, and have produced major ashfalls, along with occasional pyroclastic flows and lava flows.
Information Contacts: Instituto Nacional de Sismologia, Vulcanologia, Meteorologia e Hydrologia (INSIVUMEH), Unit of Volcanology, Geologic Department of Investigation and Services, 7a Av. 14-57, Zona 13, Guatemala City, Guatemala (URL: http://www.insivumeh.gob.gt/); Washington Volcanic Ash Advisory Center (VAAC), Satellite Analysis Branch (SAB), NOAA/NESDIS OSPO, NOAA Science Center Room 401, 5200 Auth Rd, Camp Springs, MD 20746, USA (URL: www.ospo.noaa.gov/Products/atmosphere/vaac, archive at: http://www.ssd.noaa.gov/VAAC/archive.html); MIROVA (Middle InfraRed Observation of Volcanic Activity), a collaborative project between the Universities of Turin and Florence (Italy) supported by the Centre for Volcanic Risk of the Italian Civil Protection Department (URL: http://www.mirovaweb.it/); Sentinel Hub Playground (URL: https://www.sentinel-hub.com/explore/sentinel-playground); William Chigna, CONRED (URL: https://twitter.com/william_chigna).
Klyuchevskoy (Russia) — September 2020 Cite this Report
Klyuchevskoy
Russia
56.056°N, 160.642°E; summit elev. 4754 m
All times are local (unless otherwise noted)
Strombolian activity, gas-and-steam and ash plumes, and a lava flow during June-early July 2020
Klyuchevskoy is a frequently active stratovolcano located in northern Kamchatka. Historical eruptions dating back 3,000 years have included more than 100 flank eruptions with most lateral craters and cones occurring along radial fissures between the unconfined NE-to-SE flanks. The previous report (BGVN 45:06) described ash plumes, nighttime incandescence, and Strombolian activity. Strombolian activity, ash plumes, and a strong lava flow continued. This report updates activity from June through August 2020 using weekly and daily reports from the Kamchatkan Volcanic Eruption Response Team (KVERT), the Tokyo Volcanic Ash Advisory (VAAC), and satellite data.
Moderate explosive-effusive activity continued in June 2020, with Strombolian explosions, frequent gas-and-steam emissions that contained some amount of ash, and an active lava flow. On 1 June a gas-and-steam plume containing some ash extended up to 465 km SE and E. The lava flow descended the SE flank down the Apakhonchich chute (figure 43). Occasionally, phreatic explosions accompanied the lava flow as it interacted with snow. Intermittent ash plumes, reported throughout the month by KVERT using video and satellite data and the Tokyo VAAC using HIMAWARI-8 imagery, rose to 5.5-6.7 km altitude and drifted in different directions up to 34 km from the volcano. On 12 and 30 June ash plumes rose to a maximum altitude of 6.7 km. On 19 June, 28-30 June, and 1-3 July some collapses were detected alongside the lava flow as it continued to advance down the SE flank.
During 1-3 July moderate Strombolian activity was observed, accompanied by gas-and-steam emissions containing ash and a continuous lava flow traveling down the Apakhonchich chute on the SE flank. On 1 July a Tokyo VAAC advisory reported an ash plume rising to 6 km altitude and extending SE. On 3 July the activity sharply decreased. KVERT reported there was some residual heat leftover from the lava flow and Strombolian activity that continued to cool through at least 13 July; KVERT also reported frequent gas-and-steam emissions, which contained a small amount of ash through 5 July, rising from the summit crater (figure 44). The weekly KVERT report on 16 July stated that the eruption had ended on 3 July 2020.
MIROVA (Middle InfraRed Observation of Volcanic Activity) analysis of MODIS satellite data shows frequent and strong thermal activity within 5 km of the summit crater from March through June followed by a sharp and sudden decline in early July (figures 45). A total of six weak thermal anomalies were detected between July and August. According to the MODVOLC thermal algorithm, a total of 111 thermal alerts were detected at or near the summit crater from 1 June to 1 July, a majority of which were due to the active lava flow on the SE flank and Strombolian explosions in the crater. Sentinel-2 thermal satellite imagery frequently showed the active lava flow descending the SE flank as a strong thermal anomaly, sometimes even through weather clouds (figure 46). These thermal anomalies were also recorded by the Sentinel-2 MODIS Thermal Volcanic Activity data on a MIROVA graph, showing a strong cluster during June to early July, followed by a sharp decrease and then a hiatus in activity (figure 47).
Geologic Background. Klyuchevskoy is the highest and most active volcano on the Kamchatka Peninsula. Since its origin about 6,000 years ago, this symmetrical, basaltic stratovolcano has produced frequent moderate-volume explosive and effusive eruptions without major periods of inactivity. It rises above a saddle NE of Kamen volcano and lies SE of the broad Ushkovsky massif. More than 100 flank eruptions have occurred during approximately the past 3,000 years, with most lateral craters and cones occurring along radial fissures between the unconfined NE-to-SE flanks of the conical volcano between 500 and 3,600 m elevation. Eruptions recorded since the late 17th century have resulted in frequent changes to the morphology of the 700-m-wide summit crater. These eruptions over the past 400 years have originated primarily from the summit crater, but have also included numerous major explosive and effusive eruptions from flank craters.
Information Contacts: Kamchatka Volcanic Eruptions Response Team (KVERT), Far Eastern Branch, Russian Academy of Sciences, 9 Piip Blvd., Petropavlovsk-Kamchatsky, 683006, Russia (URL: http://www.kscnet.ru/ivs/kvert/); Tokyo Volcanic Ash Advisory Center (VAAC), 1-3-4 Otemachi, Chiyoda-ku, Tokyo 100-8122, Japan (URL: http://ds.data.jma.go.jp/svd/vaac/data/); Hawai'i Institute of Geophysics and Planetology (HIGP) - MODVOLC Thermal Alerts System, School of Ocean and Earth Science and Technology (SOEST), Univ. of Hawai'i, 2525 Correa Road, Honolulu, HI 96822, USA (URL: http://modis.higp.hawaii.edu/); MIROVA (Middle InfraRed Observation of Volcanic Activity), a collaborative project between the Universities of Turin and Florence (Italy) supported by the Centre for Volcanic Risk of the Italian Civil Protection Department (URL: http://www.mirovaweb.it/); Sentinel Hub Playground (URL: https://www.sentinel-hub.com/explore/sentinel-playground).
Ol Doinyo Lengai (Tanzania) — September 2020 Cite this Report
Ol Doinyo Lengai
Tanzania
2.764°S, 35.914°E; summit elev. 2962 m
All times are local (unless otherwise noted)
Multiple lava flows within the summit crater; September 2019-August 2020
Ol Doinyo Lengai, located near the southern end of the East African Rift in Tanzania, is a stratovolcano known for its unique low-temperature carbonatitic lava. Frequent eruptions have been recorded since the late 19th century. Activity primarily occurs in the crater offset to the N about 100 m below the summit where hornitos (small cones) and pit craters produce lava flows and spattering. Lava began overflowing various flanks of the crater in 1993. The eruption transitioned to significant explosive activity in September 2007, which formed a new pyroclastic cone inside the crater. Repeated ash emissions reached altitudes greater than 10 km during March 2008. By mid-April 2008 explosive activity had decreased. In September new hornitos with small lava flows formed on the crater floor. The most recent eruptive period began in April 2017 and has been characterized by spattering confined to the crater, effusive activity in the summit crater, and multiple lava flows (BGVN 44:09). Effusive activity continued in the summit crater during this reporting period from September 2019 through August 2020, based on data and images from satellite information.
Throughout September 2019 to August 2020, evidence for repeated small lava flows was recorded in thermal data and satellite imagery. A total of seven low-level pulses of thermal activity were detected within 5 km from the summit in MIROVA data during September 2019 (1), February (2), March (2), and August (2) 2020 (figure 207). Sentinel-2 satellite imagery also provided evidence of multiple lava flows within the summit crater throughout the reporting period. On clear weather days, intermittent thermal anomalies were observed in thermal satellite imagery within the summit crater; new lava flows were detected due to the change in shape, volume, and location of the hotspot (figure 208). During a majority of the reporting period, the thermal anomaly dominantly appeared in the center of the crater, though occasionally it would also migrate to the SE wall, as seen on 3 February, the E wall on 12 July, or the NE wall on 31 August. In Natural Color rendering, fresh lava flows appear black within the crater that quickly cools to a white-brown color. These satellite images showed the migration of new lava flows between February, March, and June (figure 209). The flow on 8 February occurs in the center and along the W wall of the crater; the flow on 9 March is slightly thinner and is observed in the center and along the E wall of the crater; finally, the flow on 17 June is located in the center and along the N wall of the crater.
During August, multiple lava flows were detected in Sentinel-2 satellite imagery. On relatively clear days, lava flows were visible in the middle of the summit crater, occasionally branching out to one side of the crater (figure 210). On 6 August, a thin lava flow branched to the E flank, which became thicker by 11 August. On 16 and 21 August, the lava remained mostly in the center of the crater. A large pulse of fresh lava occurred on 31 August, extending to the NW and SE sides of the crater.
Geologic Background. The symmetrical Ol Doinyo Lengai is the only volcano known to have erupted carbonatite tephras and lavas in historical time. The prominent stratovolcano, known to the Maasai as "The Mountain of God," rises abruptly above the broad plain south of Lake Natron in the Gregory Rift Valley. The cone-building stage ended about 15,000 years ago and was followed by periodic ejection of natrocarbonatitic and nephelinite tephra during the Holocene. Historical eruptions have consisted of smaller tephra ejections and emission of numerous natrocarbonatitic lava flows on the floor of the summit crater and occasionally down the upper flanks. The depth and morphology of the northern crater have changed dramatically during the course of historical eruptions, ranging from steep crater walls about 200 m deep in the mid-20th century to shallow platforms mostly filling the crater. Long-term lava effusion in the summit crater beginning in 1983 had by the turn of the century mostly filled the northern crater; by late 1998 lava had begun overflowing the crater rim.
Information Contacts: MIROVA (Middle InfraRed Observation of Volcanic Activity), a collaborative project between the Universities of Turin and Florence (Italy) supported by the Centre for Volcanic Risk of the Italian Civil Protection Department (URL: http://www.mirovaweb.it/); Sentinel Hub Playground (URL: https://www.sentinel-hub.com/explore/sentinel-playground).
Nishinoshima (Japan) — September 2020 Cite this Report
Nishinoshima
Japan
27.247°N, 140.874°E; summit elev. 100 m
All times are local (unless otherwise noted)
Major June-July eruption of lava, ash, and sulfur dioxide; activity declines in August 2020
Japan’s Nishinoshima volcano, located about 1,000 km S of Tokyo in the Ogasawara Arc, erupted above sea level in November 2013 after 40 years of dormancy. Activity lasted through November 2015 and returned during mid-2017, continuing the growth of the island with ash plumes, ejecta, and lava flows. A short eruptive event in July 2018 produced a small lava flow and vent on the side of the pyroclastic cone. The next eruption of ash plumes, incandescent ejecta, and lava flows began in early December 2019, resulting in significant growth of the island. This report covers the ongoing activity from March-August 2020 when activity decreased. Information is provided primarily from Japan Meteorological Agency (JMA) monthly reports and the Japan Coast Guard (JCG), which makes regular overflights to make observations.
Renewed eruptive activity that began on 5 December 2019 continued during March-August 2020 but appeared to wane by the end of August. Major lava flows covered all sides of the island, with higher levels of activity during late June and early July. Ash emissions increased significantly during June and produced dense black ash plumes that rose up to 6 km altitude in early July. Explosive activity produced lightning and incandescent jets that rose 200 m and large bombs that fell to the base of the pyroclastic cone. Lava flow activity diminished at the end of July. Ash emissions decreased throughout August and appeared to cease after 27 August 2020. The MIROVA plot clearly reflects the high levels of thermal activity between December 2019 and August 2020 (figure 80); this event was reported by JMA as the largest eruption recorded to date. Sulfur dioxide emissions were very high during late June through early August, producing emissions that drifted across much of the western Pacific region.
The Japan Coast Guard (JCG) conducted overflights of Nishinoshima on 9 and 15 March 2020 (figure 81). During both visits they observed eruptive activity from the summit crater, including ash emissions that rose to an altitude of approximately 1,000 m and lava flowing down the N and SE flanks (figure 82). Large ejecta was scattered around the base of the pyroclastic cone. The lava flowing north had reached the coast and was producing vigorous steam as it entered the water on 9 March; whitish gas emissions were visible on the N flank of the cone at the source of the lava flow (figure 83). On 9 March yellow-green discolored water was noted off the NE shore. The lava flow on the SE coast produced a small amount of steam at the ocean entry point and a strong signal in thermal imagery on 15 March (figure 84). Multiple daily MODVOLC thermal alerts were issued during 1-10, 17-24, and 27-30 March. Landsat-8 visual and thermal imagery on 30 March 2020 confirmed that thermal anomalies on the N and SE flanks of the volcano continued.
Ash emissions were not observed at Nishinoshima during JCG overflights on 6, 16, and 19 April 2020, but gas-and-steam emissions were noted from the summit crater, and a yellow discoloration interpreted by JMA to be sulfur precipitation was observed near the top of the pyroclastic cone. The summit crater was larger than during previous visits. Steam plumes seen each of those days on the N and NE coasts suggested active ocean entry of lava flows (figure 85). A lava flow was observed emerging from the E flank of the cone and entering the ocean on the E coast on 19 and 29 April (figure 86). During the overflight on 29 April observers noted lava flowing southward from a vent on the E flank of the pyroclastic cone. A narrow, brown, ash plume was visible on 29 April at the summit crater rising to an altitude of about 1,500 m. Thermal observations indicated continued flow activity throughout the month. Multiple daily MODVOLC thermal alerts were recorded during 2-6, 10-11, 17-23, and 28-30 April. Significant growth of the pyroclastic cone occurred between early February and late April 2020 (figure 87).
Infrared satellite imagery from 17 May 2020 showed a strong thermal anomaly at the summit and hot spots on the NW flank indicative of flows. Visible imagery confirmed emissions at the summit and steam plumes on the NW flank (figure 88). Gray ash plumes rose to about 1,800 m altitude on 18 May during the only overflight of the month made by the Japan Coast Guard. In addition, white gas emissions rose from around the summit area and large blocks of ejecta were scattered around the base of the pyroclastic cone (figure 89). Steam from ocean-entry lava on the N flank was reduced from previous months, but a new flow moving NW into the ocean was generating a steam plume and a strong thermal signature. Multi-pixel thermal alerts were measured by the MODVOLC system on 1-3, 9-10, 13-15, 18, and 26-30 May. Sulfur dioxide emissions had been weak and intermittent from March through early May 2020 but became more persistent during the second half of May. Although modest in size, the plumes were detectible hundreds of kilometers away from the volcano (figure 90).
Activity increased significantly during June 2020. Satellite imagery from 2 June revealed two intense thermal anomalies at the summit indicating a new crater, and lava flows active on the NW and NE flanks, all showing gas or steam emissions (figure 91). Dense brown and gray ash emissions were observed rising from the summit crater during JCG overflights on 7 and 15 June (figure 92). Plumes reached at least 1,500 m altitude, and ejecta reached the base of the pyroclastic cone. Between 5 and 19 June the lava flow on the WNW coast slowed significantly, while the flows to the N and E became significantly more active (figure 93). The Tokyo VAAC reported the first ash plume since mid-February on 12 June rose to 2.1 km and drifted NE. On 14 June they reported an ash plume extending E at 2.7 km altitude. Dense emissions continued to drift N and E at 2.1-2.7 km altitude until the last week of the month. The JCG overflight on 19 June observed darker ash emissions than two weeks earlier that drifted at least 180 km NE (figure 94) and incandescent tephra that exploded from the enlarged summit area where three overlapping craters trending E-W had formed.
The Tokyo VAAC reported ash emissions that rose to 4.6 km altitude and drifted NE on 25 June. For the remainder of the month they rose to 2.7-3.9 km altitude and drifted N and NE. By the time of the JCG overflight on 29 June, the new crater that had opened on the SW flank had merged with the summit crater (figure 95). Dense black ash emissions rose to 3.4 km altitude and drifted NE, lava flowed down the SW flank into the ocean producing violent steam explosions, and incandescent tephra was scattered at least 200 m from the base of the pyroclastic cone from ongoing explosive activity (figure 96). Multiple layers of recent flow activity were visible along the SW coast (figure 97). Yellow-green discolored water encircled the entire island with a width of 1,000 m.
MODVOLC thermal alerts reached their highest levels of the period during June 2020 with multi-pixel alerts recorded on most days of the month. Sulfur dioxide emissions increased steadily throughout June to the highest levels recorded for Nishinoshima; by the end of the month plumes of SO2 were drifting thousands of kilometers across the Pacific Ocean and being captured in complex atmospheric circulation currents (figure 98).
By early July 2020, satellite data indicated that the NE quadrant of the island was covered with ash, and a large amount of new lava had flowed down the SW flank, creating fans extending into the ocean (figure 99). The Tokyo VAAC reported ash emissions that rose to 3.7-4.9 km altitude and drifted N during 1-6 July. The altitude increased to 6.1 km during 8 and 9 July, and ranged from 4.6-6.1 km during 10-14 July while the drift direction changed to NE. The marine meteorological observation ship "Ryofu Maru" reported on 11 July that dense black ash was continuously erupting from the summit crater and drifting W at 1,700 m altitude or higher. They observed large volcanic blocks scattered around the base of the pyroclastic cone, and ash falling from the drifting plume. During the night of 11 July incandescent lava and volcanic lightning rose to about 200 m above the crater rim (figure 100).
During 16-26 July 2020 the Tokyo VAAC reported ash emissions at 3.7-5.2 km altitude that drifted primarily N and NE. The vessel "Keifu Maru" passed Nishinoshima on 20 July and crewmembers observed continuing emissions from the summit of dense, black ash. JCG observed an ash plume rising to at least 2.7 km altitude during their overflight of 20 July. A large dome of fresh lava was visible on the SW flank of the island (figure 101). Lower ash emissions from 2.4-3.7 km altitude were reported by the Tokyo VAAC during 27-29 July, but the altitude increased to 5.5-5.8 km during the last two days of the month. During an overflight on 30 July by the National Research Institute for Earth Science and Disaster Prevention, dark and light gray ash emissions rose to 3.0 km altitude, but no flowing lava or large bombs were observed. They also noted thick deposits of brownish-gray ash on the N side of the island (figure 102).
JMA reported a sharp decrease in the lava eruption rate during July with thermal anomalies decreasing significantly mid-month. Multiple daily MODVOLC thermal alerts were recorded during the first half of the month but were reduced to two or three per day during the last third of July. Throughout July, SO2 emissions were the highest recorded in modern times for Nishinoshima. High levels of emissions were measured daily, producing streams with high concentrations of SO2 that were caught up in rotating wind currents and drifted thousands of kilometers across the Pacific Ocean (figure 103).
Thermal activity was greatly reduced during August 2020. Only one or two MODVOLC alerts were issued on 11, 18, 20, 21, 29, and 30 August, and no fresh lava flows were observed. The Tokyo VAAC reported ash emissions daily from 1-20 August. Plume heights were 4.9-5.8 km altitude during 1-4 August after which they dropped to 3.9 km altitude through 15 August. A brief pulse to 4.6 km altitude was recorded on 16 August, but then they dropped to 3.0 km or lower through the end of the month and became intermittent. The last ash emission was reported at 2.7 km altitude drifting W on 27 August.
No eruptive activity was observed during the Japan Coast Guard overflights on 19 and 23 August. High temperatures were measured on the inner wall of the summit crater on 19 August (figure 104). Steam plumes rose from the summit crater to about 2.5 km altitude during both visits (figure 105). Yellow-green discolored water was present on 23 August around the NW and SW coasts. No lava flows were observed, and infrared cameras did not measure any surface thermal anomalies outside of the crater. Very high levels of SO2 emissions were measured through 12 August when they began to noticeably decrease (figure 106). By the end of the month, only small amounts of SO2 were measured in satellite data.
Geologic Background. The small island of Nishinoshima was enlarged when several new islands coalesced during an eruption in 1973-74. Multiple eruptions that began in 2013 completely covered the previous exposed surface and continued to enlarge the island. The island is the summit of a massive submarine volcano that has prominent peaks to the S, W, and NE. The summit of the southern cone rises to within 214 m of the ocean surface 9 km SSE.
Information Contacts: Japan Meteorological Agency (JMA), 1-3-4 Otemachi, Chiyoda-ku, Tokyo 100-8122, Japan (URL: http://www.jma.go.jp/jma/indexe.html); Japan Coast Guard (JCG), Hydrographic and Oceanographic Department, 3-1-1, Kasumigaseki, Chiyoda-ku, Tokyo 100-8932, Japan (URL: https://www1.kaiho.mlit.go.jp/GIJUTSUKOKUSAI/kaiikiDB/kaiyo18-e1.htm); MIROVA (Middle InfraRed Observation of Volcanic Activity), a collaborative project between the Universities of Turin and Florence (Italy) supported by the Centre for Volcanic Risk of the Italian Civil Protection Department (URL: http://www.mirovaweb.it/); Hawai'i Institute of Geophysics and Planetology (HIGP) - MODVOLC Thermal Alerts System, School of Ocean and Earth Science and Technology (SOEST), Univ. of Hawai'i, 2525 Correa Road, Honolulu, HI 96822, USA (URL: http://modis.higp.hawaii.edu/); Tokyo Volcanic Ash Advisory Center (VAAC), 1-3-4 Otemachi, Chiyoda-ku, Tokyo 100-8122, Japan (URL: http://ds.data.jma.go.jp/svd/vaac/data/); Japan Aerospace Exploration Agency-Earth Observation Research Center (JAXA-EORC), 7-44-1 Jindaiji Higashi-machi, Chofu-shi, Tokyo 182-8522, Japan (URL: http://www.eorc.jaxa.jp/); Sentinel Hub Playground (URL: https://www.sentinel-hub.com/explore/sentinel-playground); Global Sulfur Dioxide Monitoring Page, Atmospheric Chemistry and Dynamics Laboratory, NASA Goddard Space Flight Center (NASA/GSFC), 8800 Greenbelt Road, Goddard, Maryland, USA (URL: https://so2.gsfc.nasa.gov/).
Raung (Indonesia) — September 2020 Cite this Report
Raung
Indonesia
8.119°S, 114.056°E; summit elev. 3260 m
All times are local (unless otherwise noted)
Eruptions confirmed during 2012- 2013; lava fills inner crater in November 2014-August 2015
A massive stratovolcano in easternmost Java, Raung has over sixty recorded eruptions dating back to the late 16th Century. Explosions with ash plumes, Strombolian activity, and lava flows from a cinder cone within the 2-km-wide summit crater have been the most common activity. Visual reports of activity have often come from commercial airline flights that pass near the summit; Pusat Vulkanologi dan Mitigasi Bencana Geologi (PVMBG, also known as Indonesian Center for Volcanology and Geological Hazard Mitigation, CVGHM) has installed webcams to monitor activity in recent years. An eruption in 2015 produced a large volume of lava within the summit crater and formed a new pyroclastic cone in the same location as the previous one. Confirmation and details of eruptions in 2012, 2013, and 2014-2015 are covered in this report with information provided by PVMBG, the Darwin Volcanic Ash Advisory Center (VAAC), several sources of satellite data, and visitors to the volcano.
Newly available visual and satellite information confirm eruptions at Raung during October 2012-January 2013, June-July 2013, and extend the beginning of the 2015 eruption back to November 2014. The 2015 eruption was the largest in several decades; Strombolian activity was reported for many months and fresh lava flows covered the crater floor. Raung was quiet after the 2015 eruption ended in August of that year until July 2020.
Eruption during October 2012-January 2013. A MODVOLC thermal alert appeared inside the summit crater of Raung on 14 October 2012, followed by another four alerts on 16 October. Multiple daily alerts were reported on many days through 8 November, most within the main crater. Single alerts appeared on 29 November and 1 December 2012 (figure 9). PVMBG raised the Alert Level on 17 October from 1 to 2 due to increased seismicity and raised it further to Level 3 on 22 October. A local news report by Aris Yanto indicted that a minor Strombolian eruption occurred inside the crater on 19 October. Strombolian activity was also observed inside the inner crater on 5 November 2012 by visitors (figure 10); they reported loud rumbling sounds that could be heard up to 15 km from the crater.
The Darwin VAAC issued an advisory of an eruption plume to 9.1 km altitude reported at 0237 UTC on 8 November 2012. In a second advisory about two hours later they noted that an ash plume was not visible in satellite imagery. A press article released by the Center for Volcanology and Geological Hazard Mitigation (PVMBG) indicated that gray ash plumes were observed on 6 January 2013 that rose 300 m above the summit crater rim. Incandescence was observed around the crater and thundering explosions were heard by nearby residents.
Eruption during June-July 2013. Two MODVOLC thermal alerts were measured inside the summit crater on 29 June 2013. A photo taken on 21 July showed minor Strombolian activity at the inner crater (figure 11). A weak SO2 anomaly was detected in the vicinity of Raung by the OMI instrument on the Aura satellite on 27 July. Thermal alerts were recorded on 29 and 31 July. When Google Earth imagery from 14 March 2011 created by Maxar Technologies is compared with imagery from 29 July 2013 captured by Landsat/Copernicus, dark tephra is filling the inner crater in the 2013 image; it was not present in 2011 (figure 12).
Eruption during November 2014-August 2015. Information about this eruption was previously reported (BGVN 41:12), but additional details are provided here. Landsat-8 imagery from 28 October 2014 indicated clear skies and little activity within the summit crater. Local observers reported steam plumes beginning in mid-November (figure 13). MODVOLC thermal alerts within the summit crater were issued on 28 and 30 November, and then 15 alerts were issued on seven days in December. Thermal Landsat-8 imagery from cloudy days on 29 November and 15 December indicated an anomaly over the area of the pyroclastic cone inside the summit crater (figure 14).
In January 2015 the MODVOLC system identified 25 thermal anomalies in MODIS data, with a peak of eight alerts on 8 January. Visitors to the summit crater on 6 January witnessed explosions from the inner crater approximately every 40 minutes that produced gas and small amounts of ash and tephra. They reported lava flowing continuously from the inner crater onto the larger crater floor, and incandescent activity was seen at night (figure 15). Landsat-8 images from 16 January showed a strong thermal anomaly covering an area of fresh lava (figure 16).
Satellite images were obscured by meteoric clouds during February 2015, but PVMBG reported gray and brown plumes rising 300 m multiple times and incandescence and rumbling on 14 February. Visitors to the summit crater during the second half of February reported Strombolian activity with lava fountains from the inner crater, at times as frequently as every 15 minutes (figure 17). Loud explosions and rumbling were heard 10-15 km away. MODVOLC thermal alerts stopped on 25 February and did not reappear until late June.
PVMBG raised the Alert Level to 2 in mid-March 2015. Weak thermal anomalies located inside and NW of the pyroclastic cone were present in satellite imagery on 21 March. PVMBG reported gray and brown emissions during March, April, and May rising as high as 300 m above the crater. Landsat imagery from 22 April showed a small emission inside the pyroclastic cone, and on 8 May showed a clearer view of the fresh black lava NW and SW of the pyroclastic cone (figure 18).
Nine MODVOLC thermal alerts appeared inside the summit crater on 21 June 2015 after no alerts since late February, suggesting an increase in activity. The Darwin VAAC issued the first ash advisory for 2015 on 24 June noting an aviation report of recent ash. The following day the Ujung Pandang Meteorological Weather Office (MWO) reported an ash emission drifting W at 3.7 km altitude. The same day, 25 June, Landsat-8 imagery clearly showed a new lava flow on the W side of the crater and a strong thermal anomaly. The thermal data showed a point source of heat widening SW from the center of the crater and a second point source of heat that appeared to be inside the pyroclastic cone. A small ash plume was visible over the cone (figure 19). Strombolian activity and ash plumes were reported by BNPB and PVMBG in the following days. On 26 June the Darwin VAAC noted the hotspot had remained visible in infrared imagery for several days. PVMBG reported an ash emission to 3 km altitude on 29 June.
Activity increased significantly during July 2015 (BGVN 41:12). Ash plumes rose as high as 6.7 km altitude and drifted hundreds of kilometers in multiple directions, forcing multiple shutdowns at airports on Bali and Lombok, as well as Banyuwangi and Jember in East Java. The Darwin VAAC issued 152 ash advisories during the month. Ashfall was reported up to 20 km W during July and 20-40 km SE during early August. Visitors to the summit in early July observed a new pyroclastic cone growing inside the inner crater from incandescent ejecta and dense ash emissions (figure 20). Landsat-8 imagery from 11 July showed a dense ash plume drifting SE, fresh black lava covering the 2-km-wide summit caldera floor, and a very strong thermal anomaly most intense at the center near the pyroclastic cone and cooler around the inner edges of the crater (figure 21). On 12 July, the Moderate Resolution Imaging Spectroradiometer (MODIS) on NASA’s Aqua satellite captured a view of an ash-and-gas plume drifting hundreds of kilometers SE from Raung (figure 22).
A satellite image on 20 July showed fresh incandescent lava covering the floor of the summit crater and a dense ash plume drifting N from the summit (figure 23). Incandescent ejecta emerged from two vents on the new pyroclastic cone inside the inner crater on 26 July (figure 24). On 27 July a dense ash plume was visible again in satellite imagery drifting NW and the hottest part of the thermal anomaly was in the SE quadrant of the crater (figure 25). Substantial SO2 plumes were recorded by the OMI instrument on the Aura satellite during July and early August 2015 (figure 26).
Significant ash emissions continued into early August 2015 with numerous flight cancellations. The Darwin VAAC reported ash plumes rising to 5.2 km altitude and extending as far as 750 km SE during the first two weeks in August (figure 27). Satellite imagery indicated a small ash plume drifting W from the center of the crater on 12 August and weak thermal anomalies along the E and S rim of the floor of the crater (figure 28). The summit crater was covered with fresh lava on 14 August when viewed by visitors, and ash emissions rose a few hundred meters above the crater rim from a vent in the SW side of the pyroclastic cone (figure 29). The visitors observed pulsating ash emissions rising from the SW vent on the large double-crater new cinder cone. The larger vent to the NE was almost entirely inactive except for two small, weakly effusive vents on its inner walls.
The lengthy sequence of multiple daily VAAC reports that began in late June ended on 16 August 2015 with reports becoming more intermittent and ash plume heights rising to only 3.7-3.9 km altitude. Multiple discontinuous eruptions to 3.9 km altitude were reported on 18 August. The plumes extended about 100 km NW. The last report of an ash plume was from an airline on 22 August noting a low-level plume 50 km NW. Two MODVOLC alerts were issued that day. By 28 August only a very small steam plume was present at the center of the crater; the southern half of the edge of the crater floor still had small thermal anomalies (figure 30). The last single MODVOLC thermal alerts were on 29 August and 7 September. The Alert Level was lowered to 2 on 24 August 2015, and further lowered to 1 on 20 October 2016.
Geologic Background. Raung, one of Java's most active volcanoes, is a massive stratovolcano in easternmost Java that was constructed SW of the rim of Ijen caldera. The unvegetated summit is truncated by a dramatic steep-walled, 2-km-wide caldera that has been the site of frequent historical eruptions. A prehistoric collapse of Gunung Gadung on the W flank produced a large debris avalanche that traveled 79 km, reaching nearly to the Indian Ocean. Raung contains several centers constructed along a NE-SW line, with Gunung Suket and Gunung Gadung stratovolcanoes being located to the NE and W, respectively.
Information Contacts: Pusat Vulkanologi dan Mitigasi Bencana Geologi (PVMBG, also known as Indonesian Center for Volcanology and Geological Hazard Mitigation, CVGHM), Jalan Diponegoro 57, Bandung 40122, Indonesia (URL: http://www.vsi.esdm.go.id/); Badan Nasional Penanggulangan Bencana (BNPB), National Disaster Management Agency, Graha BNPB - Jl. Scout Kav.38, East Jakarta 13120, Indonesia (URL: http://www.bnpb.go.id/); Hawai'i Institute of Geophysics and Planetology (HIGP) - MODVOLC Thermal Alerts System, School of Ocean and Earth Science and Technology (SOEST), Univ. of Hawai'i, 2525 Correa Road, Honolulu, HI 96822, USA (URL: http://modis.higp.hawaii.edu/); Darwin Volcanic Ash Advisory Centre (VAAC), Bureau of Meteorology, Northern Territory Regional Office, PO Box 40050, Casuarina, NT 0811, Australia (URL: http://www.bom.gov.au/info/vaac/);Google Earth (URL: https://www.google.com/earth/); Sentinel Hub Playground (URL: https://www.sentinel-hub.com/explore/sentinel-playground); NASA Earth Observatory, EOS Project Science Office, NASA Goddard Space Flight Center, Goddard, Maryland, USA (URL: http://earthobservatory.nasa.gov/, https://earthobservatory.nasa.gov/images/86213/eruption-of-raung-volcano); Tom Pfeiffer, Volcano Discovery (URL: http://www.volcanodiscovery.com/); Aris Yanto (URL: https://www.exploredesa.com/2012/11/mount-raung-produce-of-vulcanic-ash-plume-and-continue-eruption/); DigitalGlobe (URL: https://www.maxar.com/, https://twitter.com/Maxar/status/875449111398547457); Øystein Lund Andersen (URL: https://twitter.com/OysteinVolcano/status/1194879946042142726, http://www.oysteinlundandersen.com).
Stromboli (Italy) — September 2020 Cite this Report
Stromboli
Italy
38.789°N, 15.213°E; summit elev. 924 m
All times are local (unless otherwise noted)
Strombolian activity continues at both summit craters during May-August 2020
Stromboli, located in northeastern-most part of the Aeolian Islands, is composed of two active summit vents: the Northern (N) Crater and the Central-South (CS) Crater that are situated at the head of the Sciara del Fuoco, a large scarp that runs from the summit down the NW side of the volcano. The current eruption period began in 1934, continuing to the present with volcanism characterized by consistent Strombolian explosions in both summit craters, ash plumes, pyroclastic flows, and occasional lava flows (BGVN 45:08). This report updates activity consisting of dominantly Strombolian explosions and ash plumes from May to August 2020 with information primarily from daily and weekly reports by Italy's Istituto Nazionale di Geofisica e Vulcanologia (INGV) and various satellite data.
Activity was consistent during this reporting period. Explosion rates ranged from 1-23 events per hour and were of variable intensity, producing material that typically rose from less than 80 to over 300 m above the crater. One ash plume on 19 July rose 1 km above the crater and high energy ballistics were ejected 500 m above the crater during the week of 20-26 July (table 9). Strombolian explosions were often accompanied by gas-and-steam emissions and spattering that has occasionally resulted in material deposited on the slopes of the Sciara del Fuoco. According to INGV, the average SO2 emissions measured 250-300 tons/day.
Table 9. Summary of activity at Stromboli during May-August 2020. Low-intensity activity indicates ejecta rising less than 80 m, medium-intensity is ejecta rising less than 150 m, and high-intensity is ejecta rising over 200 m above the vent. Data courtesy of INGV.
| Month |
Activity |
| May 2020 |
Strombolian activity and degassing continued with some spattering. Explosion rates varied from 1-17 per hour. Ejected material rose 80-150 m above the N crater and 150-250 m above the CS crater. The average SO2 emissions measured 300 tons/day. |
| Jun 2020 |
Strombolian activity and degassing continued with spattering. Explosion rates varied from 2-14 per hour. Ejected material rose 80-200 m above the N crater and 150 m above the CS crater. Spattering was primarily focused in the CS crater. The average SO2 emissions measured 300 tons/day. |
| Jul 2020 |
Strombolian activity and degassing continued with some spattering. Explosion rates varied from 1-12 per hour. Ejected material rose 80-1,000 m above the N crater. Spattering was primarily focused in the CS crater. The average SO2 emissions measured 300 tons/day. |
| Aug 2020 |
Strombolian activity continued with discontinuous spattering. Explosion rates varied from 1-23 per hour. Ejected material rose at least 200 m above the N crater and at least 250 m above the CS crater. |
Explosive activity was relatively consistent during May 2020 and was mainly produced in 3-4 eruptive vents in the N crater and at least two eruptive vents in the CS crater. As a result of some explosions fallout covered the slopes of the Sciara del Fuoco. Explosion rates varied from 1-17 per hour in the N crater and 1-8 per hour in the CS crater; ejected material rose 80-250 m above the craters.
During June, explosions originated from 2-3 eruptive vents in the N crater and at least 2-3 localized vents in the CS crater. The Strombolian explosions ejected material 80-200 m above the craters, some of which fell back onto the Sciara (figure 182). Explosion rates varied from 5-14 per hour in the N crater and 2-9 per hour in the CS crater. Spattering was typically observed in the CS crater.
Ongoing explosive activity continued into July, originating from 2-3 eruptive vents in the N crater and 3-4 eruptive vents in the CS crater. Explosions varied from 3-12 per hour in the N crater and 1-11 per hour in the CS crater; ejected lapilli and bombs rose 80-1,000 m above the craters (figure 183). On 19 July a high-energy explosion between 0500 and 0504 produced an ash plume containing ejecta more than 50 cm that rose to a maximum of 1 km above the crater, with fallout reaching the Pizzo sopra la Fossa and resulting in ashfall on the Sciara and the towns of Liscione and Roccette. During the week of 20-26 July explosions in the E portion of the volcano ejected ballistics 500 m above the crater; the size and shape of these varied between slag bombs to clasts greater than 50 cm.
Strombolian activity accompanied by discontinuous spattering continued during August. Total daily explosions varied from 3-23 per hour ejecting material that up to 200-250 m above the craters. During the first half of the month the explosions were low-intensity and consisted of fine material. On 13 August the intensity of the explosions increased, producing an ash plume that rose 300 m above the crater drifting SE and resulting in a significant amount of ashfall on the Sciara. During the week of 17-23, explosions in the N1 crater ejected material 200 m above the crater while explosions in the CS crater ejected material 250 m above the crater, predominantly during 22 August in the S2 crater (figure 184).
Moderate thermal activity was relatively consistent from October 2019 through mid-April 2020; during May-August thermal activity became less frequent and anomalies were lower in power based on the MIROVA Log Radiative Power graph using MODIS infrared satellite information (figure 185). Though there were no detected MODVOLC thermal alerts during this reporting period, many thermal hotspots were observed in Sentinel-2 thermal satellite imagery in both summit craters (figure 186).
Geologic Background. Spectacular incandescent nighttime explosions at Stromboli have long attracted visitors to the "Lighthouse of the Mediterranean" in the NE Aeolian Islands. This volcano has lent its name to the frequent mild explosive activity that has characterized its eruptions throughout much of historical time. The small island is the emergent summit of a volcano that grew in two main eruptive cycles, the last of which formed the western portion of the island. The Neostromboli eruptive period took place between about 13,000 and 5,000 years ago. The active summit vents are located at the head of the Sciara del Fuoco, a prominent scarp that formed about 5,000 years ago due to a series of slope failures which extends to below sea level. The modern volcano has been constructed within this scarp, which funnels pyroclastic ejecta and lava flows to the NW. Essentially continuous mild Strombolian explosions, sometimes accompanied by lava flows, have been recorded for more than a millennium.
Information Contacts: Istituto Nazionale di Geofisica e Vulcanologia (INGV), Sezione di Catania, Piazza Roma 2, 95123 Catania, Italy, (URL: http://www.ct.ingv.it/en/); MIROVA (Middle InfraRed Observation of Volcanic Activity), a collaborative project between the Universities of Turin and Florence (Italy) supported by the Centre for Volcanic Risk of the Italian Civil Protection Department (URL: http://www.mirovaweb.it/); Sentinel Hub Playground (URL: https://www.sentinel-hub.com/explore/sentinel-playground).
Turrialba (Costa Rica) — September 2020 Cite this Report
Turrialba
Costa Rica
10.025°N, 83.767°W; summit elev. 3340 m
All times are local (unless otherwise noted)
New eruptive period on 18 June 2020 consisted of ash eruptions
Turrialba is a stratovolcano located in Costa Rica that overlooks the city of Cartago. Three well-defined craters occur at the upper SW end of a broad 800 x 2,200 m summit depression that is breached to the NE. Activity described in the previous report primarily included weak ash explosions and minor ash emissions (BGVN 44:11). This reporting period updates information from November 2019-August 2020; volcanism dominantly consists of ash emissions during June-August, based on information from daily and weekly reports by the Observatorio Vulcanologico Sismologica de Costa Rica-Universidad Nacional (OVSICORI-UNA) and satellite data.
Volcanism during November 2019 through mid-June was relatively low, dominated by low SO2 emissions (100-300 tons/day) and typical low seismic tremors. A single explosion was recorded at 1850 on 7 December 2019, and two gas-and-steam plumes rose 800 m and 300 m above the crater on 25 and 27 December, respectively. An explosion was detected on 29 January 2020 but did not result in any ejecta. An overflight during the week of 10 February measured the depth of the crater (140 m); since the previous measurements made in February 2019 (220 m), the crater has filled with 80 m of debris due to frequent collapses of the NW and SE internal crater walls. Beginning around February and into at least early May 2020 the Sentinel-2 MODIS Thermal Volcanic Activity graph provided by the MIROVA system detected a small cluster of thermal anomalies (figure 52). Some of these anomalies were faintly registered in Sentinel-2 thermal satellite imagery during 10 and 25 April, with a more distinct anomaly occurring on 15 May (figure 53).
On 18 June activity increased, which marked the start of a new eruptive period that produced ash emissions rising 100 m above the crater rim at 1714, 1723, and 1818. The next morning, 19 June, two more events at 1023 and 1039 resulted in ash emissions rising 100 m above the crater. During 23-26 June small ash emissions continued to occur each day, rising no higher than 100 m above the crater. A series of small ash eruptions that rose 100 m above the crater occurred during 28 and 29 June; four events were recorded at 0821, 1348, 1739, and 2303 on 28 June and five more were recorded at 0107, 0232, 0306, 0412, and 0818 on 29 June. The two events at 0107 and 0412 were accompanied by ballistics ejected onto the N wall of the crater, according to OVSICORI-UNA.
Almost daily ash emissions continued during 1-7 July, rising less than 100 m above the crater; no ash emissions were observed on 3 July. On 6 July, gas-and-steam and ash emissions rose hundreds of meters above the crater at 0900, resulting in local ashfall. Passive gas-and-steam emissions with minor amounts of ash were occasionally visible during 9-10 July. On 14 July an eruptive pulse was observed, generating brief incandescence at 2328, which was likely associated with a small ash emission. Dilute ash emissions at 1028 on 16 July preceded an eruption at 1209 that resulted in an ash plume rising 200 m above the crater. Ash emissions of variable densities continued through 20 July rising as high as 200 m above the crater; on 20 July incandescence was observed on the W wall of the crater. An eruptive event at 0946 on 29 July produced an ash plume that rose 200-300 m above the crater rim. During 30-31 July a series of at least ten ash eruptions were detected, rising no higher than 200 m above the crater, each lasting less than ten minutes. Some incandescence was visible on the SW wall of the crater during this time.
On 1 August at 0746 an ash plume rose 500 m above the crater. During 4-5 August a total of 19 minor ash emissions occurred, accompanied by ash plumes that rose no higher than 200 m above the crater. OVSICORI-UNA reported on 21 August that the SW wall of the crater had fractured; some incandescence in the fracture zone had been observed the previous month. Two final eruptions were detected on 22 and 24 August at 1253 and 2023, respectively. The eruption on 24 August resulted in an ash plume that rose to a maximum height of 1 km above the crater.
Geologic Background. Turrialba, the easternmost of Costa Rica's Holocene volcanoes, is a large vegetated basaltic-to-dacitic stratovolcano located across a broad saddle NE of Irazú volcano overlooking the city of Cartago. The massive edifice covers an area of 500 km2. Three well-defined craters occur at the upper SW end of a broad 800 x 2200 m summit depression that is breached to the NE. Most activity originated from the summit vent complex, but two pyroclastic cones are located on the SW flank. Five major explosive eruptions have occurred during the past 3500 years. A series of explosive eruptions during the 19th century were sometimes accompanied by pyroclastic flows. Fumarolic activity continues at the central and SW summit craters.
Information Contacts: Observatorio Vulcanologico Sismologica de Costa Rica-Universidad Nacional (OVSICORI-UNA), Apartado 86-3000, Heredia, Costa Rica (URL: http://www.ovsicori.una.ac.cr/, https://www.facebook.com/OVSICORI/); MIROVA (Middle InfraRed Observation of Volcanic Activity), a collaborative project between the Universities of Turin and Florence (Italy) supported by the Centre for Volcanic Risk of the Italian Civil Protection Department (URL: http://www.mirovaweb.it/); Sentinel Hub Playground (URL: https://www.sentinel-hub.com/explore/sentinel-playground).
Villarrica (Chile) — September 2020 Cite this Report
Villarrica
Chile
39.42°S, 71.93°W; summit elev. 2847 m
All times are local (unless otherwise noted)
Continued summit incandescence February-August 2020 with larger explosions in July and August
Historical eruptions at Chile's Villarrica, documented since 1558, have consisted largely of mild-to-moderate explosive activity with occasional lava effusion. An intermittently active lava lake at the summit has been the source of Strombolian activity, incandescent ejecta, and thermal anomalies for several decades; the current eruption has been ongoing since December 2014. Continuing activity during February-August 2020 is covered in this report, with information provided by the Southern Andes Volcano Observatory (Observatorio Volcanológico de Los Andes del Sur, OVDAS), part of Chile's National Service of Geology and Mining (Servicio Nacional de Geología y Minería, SERNAGEOMIN), and Projecto Observación Villarrica Internet (POVI), part of the Fundacion Volcanes de Chile, a private research group that studies volcanoes across Chile. Sentinel satellite imagery also provided valuable data.
Intermittent incandescence was observed at the summit throughout February-August 2020, which was reflected in the MIROVA thermal anomaly data for the period (figure 92). Continuous steam and gas emissions with occasional ash plumes rose 100-520 m above the summit. Every clear satellite image of Villarrica from February -August 2020 showed either a strong thermal anomaly within the summit crater or a dense cloud within the crater that prevented the heat signal from being measured. Sentinel-2 captured on average twelve images of Villarrica each month (figure 93). Larger explosions on 25 July and 7 August produced ejecta and ash emissions.
Primarily white gas emissions rose up to 400 m above the summit during the first half of February 2020 and to 320 m during the second half. Incandescence was observed on clear nights. Incandescent ejecta was captured in the POVI webcam on 7 February (figure 94). Sentinel-2 satellite imagery showed bright thermal anomalies at the summit on 5, 8, 10, 13, 18, 20, 23, 25, and 28 February, nine of the eleven days that images were taken; the other days were cloudy.
Villarrica remained at Alert Level Yellow (on a four-level Green-Yellow-Orange-Red scale) in March 2020. Plumes of gas rose 350 m above the crater during the first half of March. The POVI webcam captured incandescent ejecta on 1 March (figure 95). SERNAGEOMIN reported continuous white emissions and incandescence at night when the weather permitted. During the second half of March emissions rose 300 m above the crater; they were mostly white but occasionally gray and drifted N, S, and SE. Nighttime incandescence could be observed from communities that were tens of kilometers away on multiple occasions (figure 96). Sentinel-2 satellite imagery showed bright thermal anomalies at the summit on 1, 3, 4, 6, 9, 11, 14, 16, 19, 26, 29, and 31 March, twelve of the fourteen days images were taken. The other days were cloudy.
During the first half of April 2020 plumes of gas rose 300 m above the crater, mostly as continuous degassing of steam. Incandescence continued to be seen on clear nights throughout the month. Steam plumes rose 150 m high during the second half of the month. A series of Strombolian explosions on 28-29 April ejected material up to 30 m above the crater rim (figure 97). Sentinel-2 satellite imagery showed bright thermal anomalies at the summit on 3, 8, 10, 13, 20, and 30 April, six of the twelve days images were taken; other days were cloudy.
Daily plumes of steam rose 160 m above the summit crater during the first half of May 2020; incandescence was visible on clear nights throughout the month. During 5-7 May webcams captured episodes of dark gray emissions with minor ash that, according to SERNAGEOMIN, was related to collapses of the interior crater walls. Plumes rose as high as 360 m above the crater during the second half of May. The continuous degassing was gray and white with periodic ash emissions. Pyroclastic deposits were noted in a radius of 50 m around the crater rim associated with minor explosive activity from the lava lake. The POVI infrared camera captured a strong thermal signal rising from the summit on 29 May (figure 98), although no visual incandescence was reported. Residents of Coñaripe (17 km SSW) could see steam plumes at the snow-covered summit on 31 May (figure 99). Sentinel-2 satellite imagery showed bright thermal anomalies at the summit on 5, 13, 20, 23, 25 and 30 May, six of the twelve days images were taken. The other days were cloudy.
For most of the first half of June, white steam emissions rose as high as 480 m above the crater rim. A few times, emissions were gray, attributed to ash emissions from collapses of the inner wall of the crater by SERNAGEOMIN. Incandescence was visible on clear nights throughout the month. Vertical inflation of 1.5 cm was noted during the first half of June. Skies were cloudy for much of the second half of June; webcams only captured images of the summit on 21 and 27 June with 100-m-high steam plumes. Sentinel-2 satellite imagery showed bright thermal anomalies at the summit on 4, 7, and 14 June, three of the twelve days images were taken. The other days were cloudy.
Atmospheric clouds prevented most observations of the summit during the first half of July (figure 100); during brief periods it was possible to detect incandescence and emissions rising to 320 m above the crater. Continuous degassing was observed during the second half of July; the highest plume rose to 360 m above the crater on 23 July. On 25 July, monitoring stations in the vicinity of Villarrica registered a large-period (LP) seismic event associated with a moderate explosion at the crater. It was accompanied by a 14.7 Pa infrasound signal measured 1 km away. Meteorological conditions did not permit views of any surface activity that day, but a clear view of the summit on 28 July showed dark tephra on the snow around the summit crater (figure 101). Sentinel-2 satellite imagery showed bright thermal anomalies at the summit on 2 and 29 July, two of the twelve days images were taken. The other days were either cloudy or had steam obscuring the summit crater.
An explosion on 7 August at 1522 local time (1922 UTC) produced an LP seismic signal and a 10 Pa infrasound signal. Webcams were able to capture an image of the explosion which produced a dense plume of steam and ash that rose 370 m above the summit and drifted SE (figure 102). The highest plumes in the first half of August reached 520 m above the summit on 7 August. Sporadic emissions near the summit level were reported by the Buenos Aires VAAC the following day but were not observed in satellite imagery. When weather permitted during the second half of the month, continuous degassing to 200 m above the crater was visible on the webcams. SERNAGEOMIN participated in a webinar on 20 August 2020 discussing safety at Villarrica and showed an image of the summit crater taken during an overflight on 19 August (figure 103). Sentinel-2 satellite imagery showed bright thermal anomalies at the summit on 6, 21, and 31 August, three of the thirteen days images were taken. The other days were cloudy.
Geologic Background. The glacier-covered Villarrica stratovolcano, in the northern Lakes District of central Chile, is ~15 km south of the city of Pucon. A 2-km-wide caldera that formed about 3,500 years ago is located at the base of the presently active, dominantly basaltic to basaltic andesite cone at the NW margin of a 6-km-wide Pleistocene caldera. More than 30 scoria cones and fissure vents are present on the flanks. Plinian eruptions and pyroclastic flows that have extended up to 20 km from the volcano were produced during the Holocene. Lava flows up to 18 km long have issued from summit and flank vents. Eruptions documented since 1558 CE have consisted largely of mild-to-moderate explosive activity with occasional lava effusion. Glaciers cover 40 km2 of the volcano, and lahars have damaged towns on its flanks.
Information Contacts: Servicio Nacional de Geología y Minería (SERNAGEOMIN), Observatorio Volcanológico de Los Andes del Sur (OVDAS), Avda Sta María No. 0104, Santiago, Chile (URL: http://www.sernageomin.cl/); MIROVA (Middle InfraRed Observation of Volcanic Activity), a collaborative project between the Universities of Turin and Florence (Italy) supported by the Centre for Volcanic Risk of the Italian Civil Protection Department (URL: http://www.mirovaweb.it/); Sentinel Hub Playground (URL: https://www.sentinel-hub.com/explore/sentinel-playground); Proyecto Observación Villarrica Internet (POVI), (URL: http://www.povi.cl/, https://twitter.com/povi_cl/status/1237541250825248768); Luis Orlando (URL: https://twitter.com/valepizzas/status/1242657625495539712); Laura Angarita (URL: https://twitter.com/AngaritaV/status/1267275374947377152, https://twitter.com/AngaritaV/status/1288086614422573057); Geography Fans (URL: https://twitter.com/Geografia_Afic/status/1284520850499092480); Turismo Integral (URL: https://turismointegral.net/expertos-entregan-recomendaciones-por-actividad-registrada-en-volcan-villarrica/).
Yasur (Vanuatu) — September 2020 Cite this Report
Yasur
Vanuatu
19.532°S, 169.447°E; summit elev. 361 m
All times are local (unless otherwise noted)
Ash and gas explosions continue through August 2020
Recent activity at Yasur, which has been erupting since July 1774, includes frequent Strombolian explosions, along with ash and gas plumes from several vents in the summit crater (BGVN 44:02, 45:03). This report summarizes activity during March through August 2020, using information from monthly bulletins of the Vanuatu Meteorology and Geo-Hazards Department (VMGD) and various satellite data. The volcano has remained on Alert Level 2 (major unrest state, on a scale of 0-5), where it has been since 18 October 2016, according to VMGD.
During the current reporting period, VMGD reported that explosive activity continued at an elevated level, with ongoing ash and gas emissions (figure 71). Some of the more intense explosions ejected bombs outside the summit crater. During 2-3, 13, and 17 March, 2-3 April, and 19 July, the Wellington Volcanic Ash Advisory Center (VAAC) identified low-level ash plumes that reached an altitude of 1.5 km and drifted in multiple directions; the ash plume during 2-3 April resulted in ashfall on the SSW part of the island. On 19 May an ash plume rose to a maximum altitude of 2.1 km and drifted SE.
During the reporting period, the MODVOLC thermal algorithm using MODIS satellite data detected a total of 55 thermal hotspots during three days in April, nine days in May, six days in June and August, and four days in July. A maximum of four pixels were recorded on a single day during 26 May, 6 June, and 20 July. The MIROVA (Middle InfraRed Observation of Volcanic Activity) analysis of MODIS satellite data detected numerous hotspots from 16 September 2019 through August 2020, with a slight increase in power and frequency during May (figure 72). Satellite images from Sentinel-2 detected a strong thermal anomaly within the summit crater on 10 May, accompanied by ash and gas emissions (figure 73).
High-resolution satellite sensors commonly recorded moderate sulfur dioxide levels drifting in multiple directions from the volcano. High sulfur dioxide levels were also occasionally observed, especially during March (figure 74).
Geologic Background. Yasur has exhibited essentially continuous Strombolian and Vulcanian activity at least since Captain Cook observed ash eruptions in 1774. This style of activity may have continued for the past 800 years. Located at the SE tip of Tanna Island in Vanuatu, this pyroclastic cone has a nearly circular, 400-m-wide summit crater. The active cone is largely contained within the small Yenkahe caldera, and is the youngest of a group of Holocene volcanic centers constructed over the down-dropped NE flank of the Pleistocene Tukosmeru volcano. The Yenkahe horst is located within the Siwi ring fracture, a 4-km-wide open feature associated with eruption of the andesitic Siwi pyroclastic sequence. Active tectonism along the Yenkahe horst accompanying eruptions has raised Port Resolution harbor more than 20 m during the past century.
Information Contacts: Geo-Hazards Division, Vanuatu Meteorology and Geo-Hazards Department (VMGD), Ministry of Climate Change Adaptation, Meteorology, Geo-Hazards, Energy, Environment and Disaster Management, Private Mail Bag 9054, Lini Highway, Port Vila, Vanuatu (URL: http://www.vmgd.gov.vu/, https://www.facebook.com/VanuatuGeohazardsObservatory/); Wellington Volcanic Ash Advisory Centre (VAAC), Meteorological Service of New Zealand Ltd (MetService), PO Box 722, Wellington, New Zealand (URL: http://vaac.metservice.com/index.html); Hawai'i Institute of Geophysics and Planetology (HIGP) MODVOLC Thermal Alerts System, School of Ocean and Earth Science and Technology (SOEST), Univ. of Hawai'i, 2525 Correa Road, Honolulu, HI 96822, USA (URL: http://modis.higp.hawaii.edu/); MIROVA (Middle InfraRed Observation of Volcanic Activity), a collaborative project between the Universities of Turin and Florence (Italy) supported by the Centre for Volcanic Risk of the Italian Civil Protection Department (URL: http://www.mirovaweb.it/); Sentinel Hub Playground (URL: https://www.sentinel-hub.com/explore/sentinel-playground); Global Sulfur Dioxide Monitoring Page, Atmospheric Chemistry and Dynamics Laboratory, NASA Goddard Space Flight Center (NASA/GSFC), 8800 Greenbelt Road, Goddard, Maryland, USA (URL: https://so2.gsfc.nasa.gov/).