Recently Published Bulletin Reports
Erebus (Antarctica) Lava lake remains active; most thermal alerts recorded since 2019
Rincon de la Vieja (Costa Rica) Frequent phreatic explosions during July-December 2023
Bezymianny (Russia) Explosion on 18 October 2023 sends ash plume 8 km high; lava flows and incandescent avalanches
Kilauea (United States) Low-level lava effusions in the lava lake at Halema’uma’u during July-December 2022
Nyamulagira (DR Congo) Lava flows and thermal activity during May-October 2023
Bagana (Papua New Guinea) Explosions, ash plumes, ashfall, and lava flows during April-September 2023
Mayon (Philippines) Lava flows, pyroclastic flows, ash emissions, and seismicity during April-September 2023
Nishinoshima (Japan) Eruption plumes and gas-and-steam plumes during May-August 2023
Krakatau (Indonesia) White gas-and-steam plumes and occasional ash plumes during May-August 2023
Villarrica (Chile) Strombolian activity, gas-and-ash emissions, and crater incandescence during April-September 2023
Merapi (Indonesia) Frequent incandescent avalanches during April-September 2023
Ebeko (Russia) Moderate explosive activity with ash plumes continued during June-November 2023
Erebus (Antarctica) — January 2024  Cite this Report
Erebus
Antarctica
77.53°S, 167.17°E; summit elev. 3794 m
All times are local (unless otherwise noted)
Lava lake remains active; most thermal alerts recorded since 2019
The lava lake in the summit crater of Erebus has been active since at least 1972. Located in Antarctica overlooking the McMurdo Station on Ross Island, it is the southernmost active volcano on the planet. Because of the remote location, activity is primarily monitored by satellites. This report covers activity during 2023.
The number of thermal alerts recorded by the Hawai'i Institute of Geophysics and Planetology’s MODVOLC Thermal Alerts System increased considerably in 2023 compared to the years 2020-2022 (table 9). In contrast to previous years, the MODIS instruments aboard the Aqua and Terra satellites captured data from Erebus every month during 2023. Consistent with previous years, the lowest number of anomalous pixels were recorded in January, November, and December.
Table 9. Number of monthly MODIS-MODVOLC thermal alert pixels recorded at Erebus during 2017-2023. See BGVN 42:06 for data from 2000 through 2016. The table was compiled using data provided by the HIGP – MODVOLC Thermal Alerts System.
| Year |
Jan |
Feb |
Mar |
Apr |
May |
Jun |
Jul |
Aug |
Sep |
Oct |
Nov |
Dec |
SUM |
| 2017 |
0 |
21 |
9 |
0 |
0 |
1 |
11 |
61 |
76 |
52 |
0 |
3 |
234 |
| 2018 |
0 |
21 |
58 |
182 |
55 |
17 |
137 |
172 |
103 |
29 |
0 |
0 |
774 |
| 2019 |
2 |
21 |
162 |
151 |
55 |
56 |
75 |
53 |
29 |
19 |
1 |
0 |
624 |
| 2020 |
0 |
2 |
16 |
18 |
4 |
4 |
1 |
3 |
18 |
3 |
1 |
6 |
76 |
| 2021 |
0 |
9 |
1 |
0 |
2 |
56 |
46 |
47 |
35 |
52 |
5 |
3 |
256 |
| 2022 |
1 |
13 |
55 |
22 |
15 |
32 |
39 |
19 |
31 |
11 |
0 |
0 |
238 |
| 2023 |
2 |
33 |
49 |
82 |
41 |
32 |
70 |
64 |
42 |
17 |
5 |
11 |
448 |
Sentinel-2 infrared images showed one or two prominent heat sources within the summit crater, accompanied by adjacent smaller sources, similar to recent years (see BGVN 46:01, 47:02, and 48:01). A unique image was obtained on 25 November 2023 by the OLI-2 (Operational Land Imager-2) on Landsat 9, showing the upper part of the volcano surrounded by clouds (figure 32).
Geologic Background. Mount Erebus, the world's southernmost historically active volcano, overlooks the McMurdo research station on Ross Island. It is the largest of three major volcanoes forming the crudely triangular Ross Island. The summit of the dominantly phonolitic volcano has been modified by one or two generations of caldera formation. A summit plateau at about 3,200 m elevation marks the rim of the youngest caldera, which formed during the late-Pleistocene and within which the modern cone was constructed. An elliptical 500 x 600 m wide, 110-m-deep crater truncates the summit and contains an active lava lake within a 250-m-wide, 100-m-deep inner crater; other lava lakes are sometimes present. The glacier-covered volcano was erupting when first sighted by Captain James Ross in 1841. Continuous lava-lake activity with minor explosions, punctuated by occasional larger Strombolian explosions that eject bombs onto the crater rim, has been documented since 1972, but has probably been occurring for much of the volcano's recent history.
Information Contacts: Hawai'i Institute of Geophysics and Planetology (HIGP) - MODVOLC Thermal Alerts System, School of Ocean and Earth Science and Technology (SOEST), Univ. of Hawai'i, 2525 Correa Road, Honolulu, HI 96822, USA (URL: http://modis.higp.hawaii.edu/); Copernicus Browser, Copernicus Data Space Ecosystem, European Space Agency (URL: https://dataspace.copernicus.eu/browser/); NASA Earth Observatory, EOS Project Science Office, NASA Goddard Space Flight Center, Goddard, Maryland, USA (URL: https://earthobservatory.nasa.gov/images/152134/erebus-breaks-through).
Rincon de la Vieja (Costa Rica) — January 2024 Cite this Report
Rincon de la Vieja
Costa Rica
10.83°N, 85.324°W; summit elev. 1916 m
All times are local (unless otherwise noted)
Frequent phreatic explosions during July-December 2023
Rincón de la Vieja is a volcanic complex in Costa Rica with a hot convecting acid lake that exhibits frequent weak phreatic explosions, gas-and-steam emissions, and occasional elevated sulfur dioxide levels (BGVN 45:10, 46:03, 46:11). The current eruption period began June 2021. This report covers activity during July-December 2023 and is based on weekly bulletins and occasional daily reports from the Observatorio Vulcanologico Sismologica de Costa Rica-Universidad Nacional (OVSICORI-UNA).
Numerous weak phreatic explosions continued during July-December 2023, along with gas-and-steam emissions and plumes that rose as high as 3 km above the crater rim. Many weekly OVSICORI-UNA bulletins included the previous week's number of explosions and emissions (table 9). For many explosions, the time of explosion was given (table 10). Frequent seismic activity (long-period earthquakes, volcano-tectonic earthquakes, and tremor) accompanied the phreatic activity.
Table 9. Number of reported weekly phreatic explosions and gas-and-steam emissions at Rincón de la Vieja, July-December 2023. Counts are reported for the week before the Weekly Bulletin date; not all reports included these data. Courtesy of OVSICORI-UNA.
| OVSICORI Weekly Bulletin |
Number of explosions |
Number of emissions |
| 28 Jul 2023 |
6 |
14 |
| 4 Aug 2023 |
10 |
12 |
| 1 Sep 2023 |
13 |
11 |
| 22 Sep 2023 |
12 |
13 |
| 29 Sep 2023 |
6 |
11 |
| 6 Oct 2023 |
12 |
5 |
| 13 Oct 2023 |
7 |
9 |
| 20 Oct 2023 |
1 |
15 |
| 27 Oct 2023 |
3 |
23 |
| 3 Nov 2023 |
3 |
10 |
| 17 Nov 2023 |
0 |
Some |
| 24 Nov 2023 |
0 |
14 |
| 8 Dec 2023 |
4 |
16 |
| 22 Dec 2023 |
8 |
18 |
Table 10. Summary of activity at Rincón de la Vieja during July-December 2023. Weak phreatic explosions and gas emissions are noted where the time of explosion was indicated in the weekly or daily bulletins. Height of plumes or emissions are distance above the crater rim. Courtesy of OVSICORI-UNA.
| Date |
Time |
Description of Activity |
| 1 Jul 2023 |
0156 |
Explosion. |
| 2 Jul 2023 |
0305 |
Explosion. |
| 4 Jul 2023 |
0229, 0635 |
Event at 0635 produced a gas-and-steam plume that rose 700 m and drifted W; seen by residents in Liberia (21 km SW). |
| 9 Jul 2023 |
1843 |
Explosion. |
| 21 Jul 2023 |
0705 |
Explosion. |
| 26 Jul 2023 |
1807 |
Explosion. |
| 28 Jul 2023 |
0802 |
Explosion generated a gas-and-steam plume that rose 500 m. |
| 30 Jul 2023 |
1250 |
Explosion. |
| 31 Jul 2023 |
2136 |
Explosion. |
| 11 Aug 2023 |
0828 |
Explosion. |
| 18 Aug 2023 |
1304 |
Explosion. |
| 21 Aug 2023 |
1224 |
Explosion generated gas-and-steam plumes rose 500-600 m. |
| 22 Aug 2023 |
0749 |
Explosion generated gas-and-steam plumes rose 500-600 m. |
| 24 Aug 2023 |
1900 |
Explosion. |
| 25 Aug 2023 |
0828 |
Event produced a steam-and-gas plume that rose 3 km and drifted NW. |
| 27-28 Aug 2023 |
0813 |
Four small events; the event at 0813 on 28 August lasted two minutes and generated a steam-and-gas plume that rose 2.5 km. |
| 1 Sep 2023 |
1526 |
Explosion generated plume that rose 2 km and ejected material onto the flanks. |
| 2-3 Sep 2023 |
- |
Small explosions detected in infrasound data. |
| 4 Sep 2023 |
1251 |
Gas-and-steam plume rose 1 km and drifted W. |
| 7 Nov 2023 |
1113 |
Explosion. |
| 8 Nov 2023 |
0722 |
Explosion. |
| 12 Nov 2023 |
0136 |
Small gas emissions. |
| 14 Nov 2023 |
0415 |
Small gas emissions. |
According to OVSICORI-UNA, during July-October the average weekly sulfur dioxide (SO2) flux ranged from 68 to 240 tonnes/day. However, in mid-November the flux increased to as high as 334 tonnes/day, the highest value measured in recent years. The high SO2 flux in mid-November was also detected by the TROPOMI instrument on the Sentinel-5P satellite (figure 43).
Geologic Background. Rincón de la Vieja, the largest volcano in NW Costa Rica, is a remote volcanic complex in the Guanacaste Range. The volcano consists of an elongated, arcuate NW-SE-trending ridge constructed within the 15-km-wide early Pleistocene Guachipelín caldera, whose rim is exposed on the south side. Sometimes known as the "Colossus of Guanacaste," it has an estimated volume of 130 km3 and contains at least nine major eruptive centers. Activity has migrated to the SE, where the youngest-looking craters are located. The twin cone of Santa María volcano, the highest peak of the complex, is located at the eastern end of a smaller, 5-km-wide caldera and has a 500-m-wide crater. A Plinian eruption producing the 0.25 km3 Río Blanca tephra about 3,500 years ago was the last major magmatic eruption. All subsequent eruptions, including numerous historical eruptions possibly dating back to the 16th century, have been from the prominent active crater containing a 500-m-wide acid lake located ENE of Von Seebach crater.
Information Contacts: Observatorio Vulcanológico Sismológica de Costa Rica-Universidad Nacional (OVSICORI-UNA), Apartado 86-3000, Heredia, Costa Rica (URL: http://www.ovsicori.una.ac.cr/); NASA Global Sulfur Dioxide Monitoring Page, Atmospheric Chemistry and Dynamics Laboratory, NASA Goddard Space Flight Center (NASA/GSFC), 8800 Greenbelt Road, Goddard MD 20771, USA (URL: https://so2.gsfc.nasa.gov/).
Bezymianny (Russia) — November 2023 Cite this Report
Bezymianny
Russia
55.972°N, 160.595°E; summit elev. 2882 m
All times are local (unless otherwise noted)
Explosion on 18 October 2023 sends ash plume 8 km high; lava flows and incandescent avalanches
Bezymianny, located on Russia’s Kamchatka Peninsula, has had eruptions since 1955 characterized by dome growth, explosions, pyroclastic flows, ash plumes, and ashfall. Activity during November 2022-April 2023 included gas-and-steam emissions, lava dome collapses generating avalanches, and persistent thermal activity. Similar eruptive activity continued from May through October 2023, described here based on information from weekly and daily reports of the Kamchatka Volcano Eruptions Response Team (KVERT), notices from Tokyo VAAC (Volcanic Ash Advisory Center), and from satellite data.
Overall activity decreased after the strong period of activity in late March through April 2023, which included ash explosions during 29 March and 7-8 April 2023 that sent plumes as high as 10-12 km altitude, along with dome growth and lava flows (BGVN 48:05). This reduced activity can be seen in the MIROVA thermal detection system graph (figure 56), which was consistent with data from the MODVOLC thermal detection system and with Sentinel-2 satellite images that showed persistent hotspots in the summit crater when conditions allowed observations. A renewed period of strong activity began in mid-October 2023.
Activity increased significantly on 17 October 2023 when large collapses began during 0700-0830 on the E flanks of the lava dome and continued to after 0930 the next day (figure 57). Ash plumes rose to an altitude of 4.5-5 km, extending 220 km NNE by 18 October. A large explosion at 1630 on 18 October produced an ash plume that rose to an altitude of 11 km (8 km above the summit) and drifted NNE and then NW, extending 900 km NW within two days at an altitude of 8 km. Minor ashfall was noted in Kozyrevsk (45 km WNW). At 0820 on 20 October an ash plume was identified in satellite images drifting 100 km ENE at altitudes of 4-4.5 km.
Lava flows and hot avalanches from the dome down the SE flank continued over the next few days, including 23 October when clear conditions allowed good observations (figures 58 and 59). A large thermal anomaly was observed over the volcano through 24 October, and in the summit crater on 30 October (figure 60). Strong fumarolic activity continued, with numerous avalanches and occasional incandescence. By the last week of October, volcanic activity had decreased to a level consistent with that earlier in the reporting period.
Aviation warnings were frequently updated during 17-20 October. KVERT issued a Volcano Observatory Notice for Aviation (VONA) on 17 October at 1419 and 1727 (0219 and 0527 UTC) raising the Aviation Color Code (ACC) from Yellow to Orange (second highest level). The next day, KVERT issued a VONA at 1705 (0505 UTC) raising the ACC to Red (highest level) but lowered it back to Orange at 2117 (0917 UTC). After another decrease to Yellow and back to Orange, the ACC was reduced to Yellow on 20 October at 1204 (0004 UTC). In addition, the Tokyo VAAC issued a series of Volcanic Ash Advisories beginning on 16 October and continuing through 30 October.
Geologic Background. The modern Bezymianny, much smaller than its massive neighbors Kamen and Kliuchevskoi on the Kamchatka Peninsula, was formed about 4,700 years ago over a late-Pleistocene lava-dome complex and an edifice built about 11,000-7,000 years ago. Three periods of intensified activity have occurred during the past 3,000 years. The latest period, which was preceded by a 1,000-year quiescence, began with the dramatic 1955-56 eruption. This eruption, similar to that of St. Helens in 1980, produced a large open crater that was formed by collapse of the summit and an associated lateral blast. Subsequent episodic but ongoing lava-dome growth, accompanied by intermittent explosive activity and pyroclastic flows, has largely filled the 1956 crater.
Information Contacts: Kamchatka Volcanic Eruptions Response Team (KVERT), Far Eastern Branch, Russian Academy of Sciences, 9 Piip Blvd., Petropavlovsk-Kamchatsky, 683006, Russia (URL: http://www.kscnet.ru/ivs/kvert/); Kamchatka Volcanological Station, Kamchatka Branch of Geophysical Survey, (KB GS RAS), Klyuchi, Kamchatka Krai, Russia (URL: http://volkstat.ru/); Tokyo Volcanic Ash Advisory Center (VAAC), 1-3-4 Otemachi, Chiyoda-ku, Tokyo 100-8122, Japan (URL: http://ds.data.jma.go.jp/svd/vaac/data/); Hawai'i Institute of Geophysics and Planetology (HIGP) - MODVOLC Thermal Alerts System, School of Ocean and Earth Science and Technology (SOEST), Univ. of Hawai'i, 2525 Correa Road, Honolulu, HI 96822, USA (URL: http://modis.higp.hawaii.edu/); MIROVA (Middle InfraRed Observation of Volcanic Activity), a collaborative project between the Universities of Turin and Florence (Italy) supported by the Centre for Volcanic Risk of the Italian Civil Protection Department (URL: http://www.mirovaweb.it/); Copernicus Browser, Copernicus Data Space Ecosystem, European Space Agency (URL: https://dataspace.copernicus.eu/browser/).chr
Kilauea (United States) — January 2023 Cite this Report
Kilauea
United States
19.421°N, 155.287°W; summit elev. 1222 m
All times are local (unless otherwise noted)
Low-level lava effusions in the lava lake at Halema’uma’u during July-December 2022
Kīlauea is the southeastern-most volcano in Hawaii and overlaps the E flank of the Mauna Loa volcano. Its East Rift Zone (ERZ) has been intermittently active for at least 2,000 years. An extended eruption period began in January 1983 and was characterized by open lava lakes and lava flows from the summit caldera and the East Rift Zone. During May 2018 magma migrated into the Lower East Rift Zone (LERZ) and opened 24 fissures along a 6-km-long NE-trending fracture zone that produced lava flows traveling in multiple directions. As lava emerged from the fissures, the lava lake at Halema'uma'u drained and explosions sent ash plumes to several kilometers altitude (BGVN 43:10).
The current eruption period started during September 2021 and has recently been characterized by lava effusions, spatter, and sulfur dioxide emissions in the active Halema’uma’u lava lake (BGVN 47:08). Lava effusions, some spatter, and sulfur dioxide emissions have continued during this reporting period of July through December 2022 using daily reports, volcanic activity notices, and abundant photo, map, and video data from the US Geological Survey's (USGS) Hawaiian Volcano Observatory (HVO).
Summary of activity during July-December 2022. Low-level effusions have continued at the western vent of the Halema’uma’u crater during July through early December 2022. Occasional weak ooze-outs (also called lava break outs) would occur along the margins of the crater floor. The overall level of the active lava lake throughout the reporting period gradually increased due to infilling, however it stagnated in mid-September (table 13). During September through November, activity began to decline, though lava effusions persisted at the western vent. By 9 December, the active part of the lava lake had completely crusted over, and incandescence was no longer visible.
Table 13. Summary of measurements taken during overflights at Kīlauea that show a gradual increase in the active lava lake level and the volume of lava effused since 29 September 2021. Lower activity was reported during September-October. Data collected during July-December 2022. Courtesy of HVO.
| Date: |
Level of the active lava lake (m): |
Cumulative volume of lava effused (million cubic meters): |
| 7 Jul 2022 |
130 |
95 |
| 19 Jul 2022 |
133 |
98 |
| 4 Aug 2022 |
136 |
102 |
| 16 Aug 2022 |
137 |
104 |
| 12 Sep 2022 |
143 |
111 |
| 5 Oct 2022 |
143 |
111 |
| 28 Oct 2022 |
143 |
111 |
Activity during July 2022. Lava effusions were reported from the western vent in the Halema’uma’u crater, along with occasional weak ooze-outs along the margins of the crater floor. The height of the lava lake was variable due to deflation-inflation tilt events; for example, the lake level dropped approximately 3-4 m during a summit deflation-inflation event reported on 1 July. Webcam images taken during the night of 6-12 July showed intermittent low-level spattering at the western vent that rose less than 10 m above the vent (figure 519). Measurements made during an overflight on 7 July indicated that the crater floor was infilled about 130 m and that 95 million cubic meters of lava had been effused since 29 September 2021. A single, relatively small lava ooze-out was active to the S of the lava lake. Around midnight on 8 July there were two brief periods of lava overflow onto the lake margins. On 9 July lava ooze-outs were reported near the SE and NE edges of the crater floor and during 10-11 July they occurred near the E, NE, and NW edges. On 16 July crater incandescence was reported, though the ooze-outs and spattering were not visible. On 18 July overnight webcam images showed incandescence in the western vent complex and two ooze-outs were reported around 0000 and 0200 on 19 July. By 0900 there were active ooze-outs along the SW edge of the crater floor. Measurements made from an overflight on 19 July indicated that the crater floor was infilled about 133 m and 98 million cubic meters of lava had erupted since 29 September 2021 (figure 520). On 20 July around 1600 active ooze-outs were visible along the N edge of the crater, which continued through the next day. Extensive ooze-outs occurred along the W margin during 24 July until 1900; on 26 July minor ooze-outs were noted along the N margin. Minor spattering was visible on 29 July along the E margin of the lake. The sulfur dioxide emission rates ranged 650-2,800 tons per day (t/d), the higher of which was measured on 8 July (figure 519).
Activity during August 2022. The eruption continued in the Halema’uma’u crater at the western vent. According to HVO the lava in the active lake remained at the level of the bounding levees. Occasional minor ooze-outs were observed along the margins of the crater floor. Strong nighttime crater incandescence was visible after midnight on 6 August over the western vent cone. During 6-7 August scattered small lava lobes were active along the crater floor and incandescence persisted above the western vent through 9 August. During 7-9 August HVO reported a single lava effusion source was active along the NW margin of the crater floor. Measurements from an overflight on 4 August indicated that the crater floor was infilled about 136 m total and that 102 million cubic meters of lava had been erupted since the start of the eruption. Lava breakouts were reported along the N, NE, E, S, and W margins of the crater during 10-16 August. Another overflight survey conducted on 16 August indicated that the crater floor infilled about 137 m and 104 million cubic meters of lava had been erupted since September 2021. Measured sulfur dioxide emissions rates ranged 1,150-2,450 t/d, the higher of which occurred on 8 August.
Activity during September 2022. During September, lava effusion continued from the western vent into the active lava lake and onto the crater floor. Intermittent minor ooze-outs were reported through the month. A small ooze-out was visible on the W crater floor margin at 0220 on 2 September, which showed decreasing surface activity throughout the day, but remained active through 3 September. On 3 September around 1900 a lava outbreak occurred along the NW margin of the crater floor but had stopped by the evening of 4 September. Field crews monitoring the summit lava lake on 9 September observed spattering on the NE margin of the lake that rose no higher than 10 m, before falling back onto the lava lake crust (figure 521). Overflight measurements on 12 September indicated that the crater floor was infilled a total of 143 m and 111 million cubic meters of lava had been erupted since September 2021. Extensive breakouts in the W and N part of the crater floor were reported at 1600 on 20 September and continued into 26 September. The active part of the lava lake dropped by 10 m while other parts of the crater floor dropped by several meters. Summit tiltmeters recorded a summit seismic swarm of more than 80 earthquakes during 1500-1800 on 21 September, which occurred about 1.5 km below Halema’uma’u; a majority of these were less than Mw 2. By 22 September the active part of the lava lake was infilled about 2 m. On 23 September the western vent areas exhibited several small spatter cones with incandescent openings, along with weak, sporadic spattering (figure 522). The sulfur dioxide emission rate ranged from 930 t/d to 2,000 t/d, the higher of which was measured on 6 September.
Activity during October 2022. Activity during October declined slightly compared to previous months, though lava effusions persisted from the western vent into the active lava lake and onto the crater floor during October (figure 523). Slight variations in the lava lake were noted throughout the month. HVO reported that around 0600 on 3 October the level of the lava lake has lowered slightly. Overflight measurements taken on 5 October indicated that the crater floor was infilled a total of about 143 m and that 111 million cubic meters of lava had been effused since September 2021. During 6-7 October the lake gradually rose 0.5 m. Sulfur dioxide measurements made on 22 October had an emission rate of 700 t/d. Another overflight taken on 28 October showed that there was little to no change in the elevation of the crater floor: the crater floor was infilled a total of 143 m and 111 million cubic meters of lava had erupted since the start of the eruption.
Activity during November 2022. Activity remained low during November, though HVO reported that lava from the western vent continued to effuse into the active lava lake and onto the crater floor throughout the month. The rate of sulfur dioxide emissions during November ranged from 300-600 t/d, the higher amount of which occurred on 9 November.
Activity during December 2022. Similar low activity was reported during December, with lava effusing from the western vent into the active lava lake and onto the crater floor. During 4-5 December the active part of the lava lake was slightly variable in elevation and fluctuated within 1 m. On 9 December HVO reported that lava was no longer erupting from the western vent in the Halema’uma’u crater and that sulfur dioxide emissions had returned to near pre-eruption background levels; during 10-11 December, the lava lake had completely crusted over, and no incandescence was visible (figure 524). Time lapse camera images covering the 4-10 December showed that the crater floor showed weak deflation and no inflation. Some passive events of crustal overturning were reported during 14-15 December, which brought fresh incandescent lava to the lake surface. The sulfur dioxide emission rate was approximately 200 t/d on 14 December. A smaller overturn event on 17 December and another that occurred around 0000 and into the morning of 20 December were also detected. A small seismic swarm was later detected on 30 December.
Geologic Background. Kilauea overlaps the E flank of the massive Mauna Loa shield volcano in the island of Hawaii. Eruptions are prominent in Polynesian legends; written documentation since 1820 records frequent summit and flank lava flow eruptions interspersed with periods of long-term lava lake activity at Halemaumau crater in the summit caldera until 1924. The 3 x 5 km caldera was formed in several stages about 1,500 years ago and during the 18th century; eruptions have also originated from the lengthy East and Southwest rift zones, which extend to the ocean in both directions. About 90% of the surface of the basaltic shield volcano is formed of lava flows less than about 1,100 years old; 70% of the surface is younger than 600 years. The long-term eruption from the East rift zone between 1983 and 2018 produced lava flows covering more than 100 km2, destroyed hundreds of houses, and added new coastline.
Information Contacts: Hawaiian Volcano Observatory (HVO), U.S. Geological Survey, PO Box 51, Hawai'i National Park, HI 96718, USA (URL: http://hvo.wr.usgs.gov/).
Nyamulagira (DR Congo) — November 2023 Cite this Report
Nyamulagira
DR Congo
1.408°S, 29.2°E; summit elev. 3058 m
All times are local (unless otherwise noted)
Lava flows and thermal activity during May-October 2023
Nyamulagira (also known as Nyamuragira) is a shield volcano in the Democratic Republic of Congo with the summit truncated by a small 2 x 2.3 km caldera with walls up to about 100 m high. Documented eruptions have occurred within the summit caldera, as well as from numerous flank fissures and cinder cones. The current eruption period began in April 2018 and has more recently been characterized by summit crater lava flows and thermal activity (BGVN 48:05). This report describes lava flows and variable thermal activity during May through October 2023, based on information from the Observatoire Volcanologique de Goma (OVG) and various satellite data.
Lava lake activity continued during May. The MIROVA (Middle InfraRed Observation of Volcanic Activity) system recorded moderate-to-strong thermal activity throughout the reporting period; activity was more intense during May and October and relatively weaker from June through September (figure 95). The MODVOLC thermal algorithm, detected a total of 209 thermal alerts. There were 143 hotspots detected during May, eight during June, nine during September, and 49 during October. This activity was also reflected in infrared satellite images, where a lava flow was visible in the NW part of the crater on 7 May and strong activity was seen in the center of the crater on 4 October (figure 96). Another infrared satellite image taken on 12 May showed still active lava flows along the NW margin of the crater. According to OVG lava effusions were active during 7-29 May and moved to the N and NW parts of the crater beginning on 9 May. Strong summit crater incandescence was visible from Goma (27 km S) during the nights of 17, 19, and 20 May (figure 97). On 17 May there was an increase in eruptive activity, which peaked at 0100 on 20 May. Notable sulfur dioxide plumes drifted NW and W during 19-20 May (figure 98). Drone footage acquired in partnership with the USGS (United States Geological Survey) on 20 May captured images of narrow lava flows that traveled about 100 m down the W flank (figure 99). Data from the Rumangabo seismic station indicated a decreasing trend in activity during 17-21 May. Although weather clouds prevented clear views of the summit, a strong thermal signature on the NW flank was visible in an infrared satellite image on 22 May, based on an infrared satellite image. On 28 May the lava flows on the upper W flank began to cool and solidify. By 29 May seismicity returned to levels similar to those recorded before the 17 May increase. Lava effusion continued but was confined to the summit crater; periodic crater incandescence was observed.
Low-level activity was noted during June through October. On 1 June OVG reported that seismicity remained at lower levels and that crater incandescence had been absent for three days, though infrared satellite imagery showed continued lava effusion in the summit crater. The lava flows on the flanks covered an estimated 0.6 km2. Satellite imagery continued to show thermal activity confined to the lava lake through October (figure 96), although no lava flows or significant sulfur dioxide emissions were reported.
Geologic Background. Africa's most active volcano, Nyamulagira (also known as Nyamuragira), is a massive high-potassium basaltic shield about 25 km N of Lake Kivu and 13 km NNW of the steep-sided Nyiragongo volcano. The summit is truncated by a small 2 x 2.3 km caldera that has walls up to about 100 m high. Documented eruptions have occurred within the summit caldera, as well as from the numerous flank fissures and cinder cones. A lava lake in the summit crater, active since at least 1921, drained in 1938, at the time of a major flank eruption. Recent lava flows extend down the flanks more than 30 km from the summit as far as Lake Kivu; extensive lava flows from this volcano have covered 1,500 km2 of the western branch of the East African Rift.
Information Contacts: Observatoire Volcanologique de Goma (OVG), Departement de Geophysique, Centre de Recherche en Sciences Naturelles, Lwiro, D.S. Bukavu, DR Congo; Hawai'i Institute of Geophysics and Planetology (HIGP) - MODVOLC Thermal Alerts System, School of Ocean and Earth Science and Technology (SOEST), Univ. of Hawai'i, 2525 Correa Road, Honolulu, HI 96822, USA (URL: http://modis.higp.hawaii.edu/); MIROVA (Middle InfraRed Observation of Volcanic Activity), a collaborative project between the Universities of Turin and Florence (Italy) supported by the Centre for Volcanic Risk of the Italian Civil Protection Department (URL: http://www.mirovaweb.it/); NASA Global Sulfur Dioxide Monitoring Page, Atmospheric Chemistry and Dynamics Laboratory, NASA Goddard Space Flight Center (NASA/GSFC), 8800 Greenbelt Road, Goddard, Maryland, USA (URL: https://so2.gsfc.nasa.gov/); Copernicus Browser, Copernicus Data Space Ecosystem, European Space Agency (URL: https://dataspace.copernicus.eu/browser/); Charles Balagizi, Goma Volcano Observatory, Departement de Geophysique, Centre de Recherche en Sciences Naturelles, Lwiro, D.S. Bukavu, DR Congo.
Bagana (Papua New Guinea) — October 2023 Cite this Report
Bagana
Papua New Guinea
6.137°S, 155.196°E; summit elev. 1855 m
All times are local (unless otherwise noted)
Explosions, ash plumes, ashfall, and lava flows during April-September 2023
The remote volcano of Bagana is located in central Bougainville Island, Papua New Guinea. Recorded eruptions date back to 1842 and activity has consisted of effusive activity that has built a small lava dome in the summit crater and occasional explosions that produced pyroclastic flows. The most recent eruption has been ongoing since February 2000 and has produced occasional explosions, ash plumes, and lava flows. More recently, activity has been characterized by ongoing effusive activity and ash emissions (BGVN 48:04). This report updates activity from April through September 2023 that has consisted of explosions, ash plumes, ashfall, and lava flows, using information from the Darwin Volcanic Ash Advisory Center (VAAC) and satellite data.
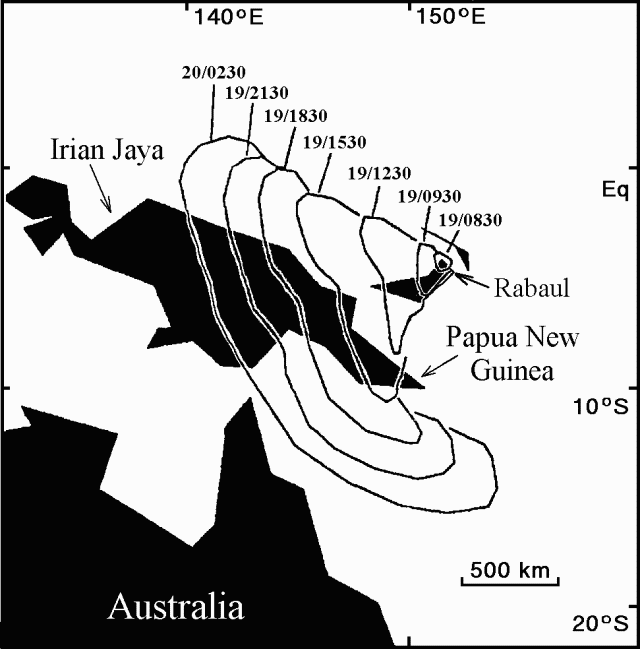
An explosive eruption was reported on 7 July that generated a large gas-and-ash plume to high altitudes and caused significant ashfall in local communities; the eruption plume had reached upper tropospheric (16-18 km altitude) altitudes by 2200, according to satellite images. Sulfur dioxide plumes were detected in satellite images on 8 July and indicated that the plume was likely a mixture of gas, ice, and ash. A report issued by the Autonomous Bougainville Government (ABG) (Torokina District, Education Section) on 10 July noted that significant ash began falling during 2000-2100 on 7 July and covered most areas in the Vuakovi, Gotana (9 km SW), Koromaketo, Laruma (25 km W) and Atsilima (27 km NW) villages. Pyroclastic flows also occurred, according to ground-based reports; small deposits confined to one drainage were inspected by RVO during an overflight on 17 July and were confirmed to be from the 7 July event. Ashfall continued until 10 July and covered vegetation, which destroyed bushes and gardens and contaminated rivers and streams.
RVO reported another eruption on 14 July. The Darwin VAAC stated that an explosive event started around 0830 on 15 July and produced an ash plume that rose to 16.5 km altitude by 1000 and drifted N, according to satellite images. The plume continued to drift N and remained visible through 1900, and by 2150 it had dissipated.
Ashfall likely from both the 7 and 15 July events impacted about 8,111 people in Torokina (20 km SW), including Tsito/Vuakovi, Gotana, Koromaketo, Kenaia, Longkogari, Kenbaki, Piva (13 km SW), and Atsinima, and in the Tsitovi district, according to ABG. Significant ashfall was also reported in Ruruvu (22 km N) in the Wakunai District of Central Bougainville, though the thickness of these deposits could not be confirmed. An evacuation was called for the villages in Wakunai, where heavy ashfall had contaminated water sources; the communities of Ruruvu, Togarau, Kakarapaia, Karauturi, Atao, and Kuritaturi were asked to evacuate to a disaster center at the Wakunai District Station, and communities in Torokina were asked to evacuate to the Piva District station. According to a news article, more than 7,000 people needed temporary accommodations, with about 1,000 people in evacuation shelters. Ashfall had deposited over a broad area, contaminating water supplies, affecting crops, and collapsing some roofs and houses in rural areas. Schools were temporarily shut down. Intermittent ash emissions continued through the end of July and drifted NNW, NW, and SW. Fine ashfall was reported on the coast of Torokina, and ash plumes also drifted toward Laruma and Atsilima.
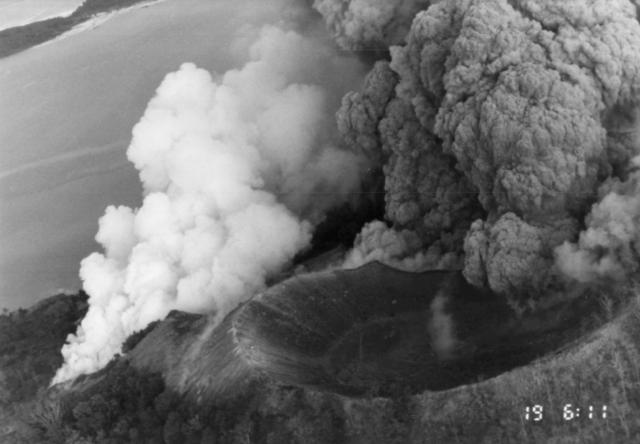
A small explosive eruption occurred at 2130 on 28 July that ejected material from the crater vents, according to reports from Torokina, in addition to a lava flow that contained two lobes. A second explosion was detected at 2157. Incandescence from the lava flow was visible from Piva as it descended the W flank around 2000 on 29 July (figure 47). The Darwin VAAC reported that a strong thermal anomaly was visible in satellite images during 30-31 July and that ash emissions rose to 2.4 km altitude and drifted WSW on 30 July. A ground report from RVO described localized emissions at 0900 on 31 July.
The Darwin VAAC reported that ash plumes were identified in satellite imagery at 0800 and 1220 on 12 August and rose to 2.1 km and 3 km altitude and drifted NW and W, respectively. A news report stated that aid was sent to more than 6,300 people that were adversely affected by the eruption. Photos taken during 17-19 August showed ash emissions rising no higher than 1 km above the summit and drifting SE. A small explosion generated an ash plume during the morning of 19 August. Deposits from small pyroclastic flows were also captured in the photos. Satellite images captured lava flows and pyroclastic flow deposits. Two temporary seismic stations were installed near Bagana on 17 August at distances of 7 km WSW (Vakovi station) and 11 km SW (Kepox station). The Kepox station immediately started to record continuous, low-frequency background seismicity.
Satellite data. Little to no thermal activity was detected during April through mid-July 2023; only one anomaly was recorded during early April and one during early June, according to MIROVA (Middle InfraRed Observation of Volcanic Activity) data (figure 48). Thermal activity increased in both power and frequency during mid-July through September, although there were still some short gaps in detected activity. MODVOLC also detected increased thermal activity during August; thermal hotspots were detected a total of five times on 19, 20, and 27 August. Weak thermal anomalies were also captured in infrared satellite images on clear weather days throughout the reporting period on 7, 12, and 17 April, 27 May, 1, 6, 16, and 31 July, and 19 September (figure 48); a strong thermal anomaly was visible on 31 July. Distinct sulfur dioxide plumes that drifted generally NW were intermittently captured by the TROPOMI instrument on the Sentinel-5P satellite and sometimes exceeded two Dobson Units (DUs) (figure 49).
Geologic Background. Bagana volcano, in a remote portion of central Bougainville Island, is frequently active. This massive symmetrical cone was largely constructed by an accumulation of viscous andesitic lava flows. The entire edifice could have been constructed in about 300 years at its present rate of lava production. Eruptive activity is characterized by non-explosive effusion of viscous lava that maintains a small lava dome in the summit crater, although occasional explosive activity produces pyroclastic flows. Lava flows with tongue-shaped lobes up to 50 m thick and prominent levees descend the flanks on all sides.
Information Contacts: Rabaul Volcano Observatory (RVO), Geohazards Management Division, Department of Mineral Policy and Geohazards Management (DMPGM), PO Box 3386, Kokopo, East New Britain Province, Papua New Guinea; Darwin Volcanic Ash Advisory Centre (VAAC), Bureau of Meteorology, Northern Territory Regional Office, PO Box 40050, Casuarina, NT 0811, Australia (URL: http://www.bom.gov.au/info/vaac/); MIROVA (Middle InfraRed Observation of Volcanic Activity), a collaborative project between the Universities of Turin and Florence (Italy) supported by the Centre for Volcanic Risk of the Italian Civil Protection Department (URL: http://www.mirovaweb.it/); Hawai'i Institute of Geophysics and Planetology (HIGP) - MODVOLC Thermal Alerts System, School of Ocean and Earth Science and Technology (SOEST), Univ. of Hawai'i, 2525 Correa Road, Honolulu, HI 96822, USA (URL: http://modis.higp.hawaii.edu/); NASA Global Sulfur Dioxide Monitoring Page, Atmospheric Chemistry and Dynamics Laboratory, NASA Goddard Space Flight Center (NASA/GSFC), 8800 Greenbelt Road, Goddard, Maryland, USA (URL: https://so2.gsfc.nasa.gov/); Copernicus Browser, Copernicus Data Space Ecosystem, European Space Agency (URL: https://dataspace.copernicus.eu/browser/); Autonomous Bougainville Government, P.O Box 322, Buka, AROB, PNG (URL: https://abg.gov.pg/); Andrew Tupper (Twitter: @andrewcraigtupp); Simon Carn, Geological and Mining Engineering and Sciences, Michigan Technological University, 1400 Townsend Drive, Houghton, MI 49931, USA (URL: http://www.volcarno.com/, Twitter: @simoncarn); Radio NZ (URL: https://www.rnz.co.nz/news/pacific/494464/more-than-7-000-people-in-bougainville-need-temporary-accommodation-after-eruption); USAID, 1300 Pennsylvania Ave, NW, Washington DC 20004, USA (URL: https://www.usaid.gov/pacific-islands/press-releases/aug-08-2023-united-states-provides-immediate-emergency-assistance-support-communities-affected-mount-bagana-volcanic-eruptions).
Mayon (Philippines) — October 2023 Cite this Report
Mayon
Philippines
13.257°N, 123.685°E; summit elev. 2462 m
All times are local (unless otherwise noted)
Lava flows, pyroclastic flows, ash emissions, and seismicity during April-September 2023
Mayon is located in the Philippines and has steep upper slopes capped by a small summit crater. Historical eruptions date back to 1616 CE that have been characterized by Strombolian eruptions, lava flows, pyroclastic flows, and mudflows. Eruptions mostly originated from a central conduit. Pyroclastic flows and mudflows have commonly descended many of the approximately 40 drainages that surround the volcano. The most recent eruption occurred during June through October 2022 and consisted of lava dome growth and gas-and-steam emissions (BGVN 47:12). A new eruption was reported during late April 2023 and has included lava flows, pyroclastic density currents, ash emissions, and seismicity. This report covers activity during April through September 2023 based on daily bulletins from the Philippine Institute of Volcanology and Seismology (PHIVOLCS).
During April through September 2023, PHIVOLCS reported near-daily rockfall events, frequent volcanic earthquakes, and sulfur dioxide measurements. Gas-and-steam emissions rose 100-900 m above the crater and drifted in different directions. Nighttime crater incandescence was often visible during clear weather and was accompanied by incandescent avalanches of material. Activity notably increased during June when lava flows were reported on the S, SE, and E flanks (figure 52). The MIROVA graph (Middle InfraRed Observation of Volcanic Activity) showed strong thermal activity coincident with these lava flows, which remained active through September (figure 53). According to the MODVOLC thermal algorithm, a total of 110 thermal alerts were detected during the reporting period: 17 during June, 40 during July, 27 during August, and 26 during September. During early June, pyroclastic density currents (PDCs) started to occur more frequently.
Low activity was reported during much of April and May; gas-and-steam emissions rose 100-900 m above the crater and generally drifted in different directions. A total of 52 rockfall events and 18 volcanic earthquakes were detected during April and 147 rockfall events and 13 volcanic events during May. Sulfur dioxide flux measurements ranged between 400-576 tons per day (t/d) during April, the latter of which was measured on 29 April and between 162-343 t/d during May, the latter of which was measured on 13 May.
Activity during June increased, characterized by lava flows, pyroclastic density currents (PDCs), crater incandescence and incandescent rockfall events, gas-and-steam emissions, and continued seismicity. Weather clouds often prevented clear views of the summit, but during clear days, moderate gas-and-steam emissions rose 100-2,500 m above the crater and drifted in multiple directions. A total of 6,237 rockfall events and 288 volcanic earthquakes were detected. The rockfall events often deposited material on the S and SE flanks within 700-1,500 m of the summit crater and ash from the events drifted SW, S, SE, NE, and E. Sulfur dioxide emissions ranged between 149-1,205 t/d, the latter of which was measured on 10 June. Short-term observations from EDM and electronic tiltmeter monitoring indicated that the upper slopes were inflating since February 2023. Longer-term ground deformation parameters based on EDM, precise leveling, continuous GPS, and electronic tilt monitoring indicated that the volcano remained inflated, especially on the NW and SE flanks. At 1000 on 5 June the Volcano Alert Level (VAL) was raised to 2 (on a 0-5 scale). PHIVOLCS noted that although low-level volcanic earthquakes, ground deformation, and volcanic gas emissions indicated unrest, the steep increase in rockfall frequency may indicate increased dome activity.
A total of 151 dome-collapse PDCs occurred during 8-9 and 11-30 June, traveled 500-2,000 m, and deposited material on the S flank within 2 km of the summit crater. During 8-9 June the VAL was raised to 3. At approximately 1947 on 11 June lava flow activity was reported; two lobes traveled within 500 m from the crater and deposited material on the S (Mi-isi), SE (Bonga), and E (Basud) flanks. Weak seismicity accompanied the lava flow and slight inflation on the upper flanks. This lava flow remained active through 30 June, moving down the S and SE flank as far as 2.5 km and 1.8 km, respectively and depositing material up to 3.3 km from the crater. During 15-16 June traces of ashfall from the PDCs were reported in Sitio Buga, Nabonton, City of Ligao and Purok, and San Francisco, Municipality of Guinobatan. During 28-29 June there were two PDCs generated by the collapse of the lava flow front, which generated a light-brown ash plume 1 km high. Satellite monitors detected significant concentrations of sulfur dioxide beginning on 29 June. On 30 June PDCs primarily affected the Basud Gully on the E flank, the largest of which occurred at 1301 and lasted eight minutes, based on the seismic record. Four PDCs generated between 1800 and 2000 that lasted approximately four minutes each traveled 3-4 km on the E flank and generated an ash plume that rose 1 km above the crater and drifted N and NW. Ashfall was recorded in Tabaco City.
Similar strong activity continued during July; slow lava effusion remained active on the S and SE flanks and traveled as far as 2.8 km and 2.8 km, respectively and material was deposited as far as 4 km from the crater. There was a total of 6,983 rockfall events and 189 PDCs that affected the S, SE, and E flanks. The volcano network detected a total of 2,124 volcanic earthquakes. Continuous gas-and-steam emissions rose 200-2,000 m above the crater and drifted in multiple directions. Sulfur dioxide emissions averaged 792-4,113 t/d, the latter of which was measured on 28 July. During 2-4 July three PDCs were generated from the collapse of the lava flow and resulting light brown plumes rose 200-300 m above the crater. Continuous tremor pulses were reported beginning at 1547 on 3 July through 7 July at 1200, at 2300 on 8 July and going through 0300 on 10 July, and at 2300 on 16 July, as recorded by the seismic network. During 6-9 July there were 10 lava flow-collapse-related PDCs that generated light brown plumes 300-500 m above the crater. During 10-11 July light ashfall was reported in some areas of Mabinit, Legazpi City, Budiao and Salvacion, Daraga, and Camalig, Albay. By 18 July the lava flow advanced 600 m on the E flank as well.
During 1733 on 18 July and 0434 on 19 July PHIVOLCS reported 30 “ashing” events, which are degassing events accompanied by audible thunder-like sounds and entrained ash at the crater, which produced short, dark plumes that drifted SW. These events each lasted 20-40 seconds, and plume heights ranged from 150-300 m above the crater, as recorded by seismic, infrasound, visual, and thermal monitors. Three more ashing events occurred during 19-20 July. Short-term observations from electronic tilt and GPS monitoring indicate deflation on the E lower flanks in early July and inflation on the NW middle flanks during the third week of July. Longer-term ground deformation parameters from EDM, precise leveling, continuous GPS, and electronic tilt monitoring indicated that the volcano was still generally inflated relative to baseline levels. A short-lived lava pulse lasted 28 seconds at 1956 on 21 July, which was accompanied by seismic and infrasound signals. By 22 July, the only lava flow that remained active was on the SE flank, and continued to extend 3.4 km, while those on the S and E flanks weakened markedly. One ashing event was detected during 30-31 July, whereas there were 57 detected during 31 July-1 August; according to PHIVOLCS beginning at approximately 1800 on 31 July eruptive activity was dominated by phases of intermittent ashing, as well as increased in the apparent rates of lava effusion from the summit crater. The ashing phases consisted of discrete events recorded as low-frequency volcanic earthquakes (LFVQ) typically 30 seconds in duration, based on seismic and infrasound signals. Gray ash plume rose 100 m above the crater and generally drifted NE. Shortly after these ashing events began, new lava began to effuse rapidly from the crater, feeding the established flowed on the SE, E, and E flanks and generating frequent rockfall events.
Intensified unrest persisted during August. There was a total of 4,141 rockfall events, 2,881 volcanic earthquakes, which included volcanic tremor events, 32 ashing events, and 101 PDCs detected throughout the month. On clear weather days, gas-and-steam emissions rose 300-1,500 m above the crater and drifted in different directions (figure 54). Sulfur dioxide emissions averaged 735-4,756 t/d, the higher value of which was measured on 16 August. During 1-2 August the rate of lava effusion decreased, but continued to feed the flows on the SE, S, and E flanks, maintaining their advances to 3.4 km, 2.8 km, and 1.1 km from the crater, respectively (figure 55). Rockfall and PDCs generated by collapses at the lava flow margins and from the summit dome deposited material within 4 km of the crater. During 3-4 August there were 10 tremor events detected that lasted 1-4 minutes. Short-lived lava pulse lasted 35 seconds and was accompanied by seismic and infrasound signals at 0442 on 6 August. Seven collapses were recorded at the front of the lava flow during 12-14 August.
During September, similar activity of slow lava effusion, PDCs, gas-and-steam emissions, and seismicity continued. There was a total of 4,452 rockfall events, 329 volcanic earthquakes, which included volcanic tremor events, two ashing events, and 85 PDCs recorded throughout the month. On clear weather days, gas-and-steam emissions rose 100-1,500 m above the crater and drifted in multiple directions. Sulfur dioxide emissions averaged 609-2,252 t/d, the higher average of which was measured on 6 September. Slow lava effusion continued advancing on the SE, S, and E flanks, maintaining lengths of 3.4 km, 2.8 km, and 1.1 km, respectively. Rockfall and PDC events generated by collapses along the lava flow margins and at the summit dome deposited material within 4 km of the crater.
Geologic Background. Symmetrical Mayon, which rises above the Albay Gulf NW of Legazpi City, is the most active volcano of the Philippines. The steep upper slopes are capped by a small summit crater. Recorded eruptions since 1616 CE range from Strombolian to basaltic Plinian, with cyclical activity beginning with basaltic eruptions, followed by longer periods of andesitic lava flows. Eruptions occur predominately from the central conduit and have also produced lava flows that travel far down the flanks. Pyroclastic density currents and mudflows have commonly swept down many of the approximately 40 ravines that radiate from the summit and have often damaged populated lowland areas. A violent eruption in 1814 killed more than 1,200 people and devastated several towns.
Information Contacts: Philippine Institute of Volcanology and Seismology (PHIVOLCS), Department of Science and Technology, University of the Philippines Campus, Diliman, Quezon City, Philippines (URL: http://www.phivolcs.dost.gov.ph/); MIROVA (Middle InfraRed Observation of Volcanic Activity), a collaborative project between the Universities of Turin and Florence (Italy) supported by the Centre for Volcanic Risk of the Italian Civil Protection Department (URL: http://www.mirovaweb.it/); Hawai'i Institute of Geophysics and Planetology (HIGP) - MODVOLC Thermal Alerts System, School of Ocean and Earth Science and Technology (SOEST), Univ. of Hawai'i, 2525 Correa Road, Honolulu, HI 96822, USA (URL: http://modis.higp.hawaii.edu/); Copernicus Browser, Copernicus Data Space Ecosystem, European Space Agency (URL: https://dataspace.copernicus.eu/browser/); William Rogers, Legazpi City, Albay Province, Philippines.
Nishinoshima (Japan) — October 2023 Cite this Report
Nishinoshima
Japan
27.247°N, 140.874°E; summit elev. 100 m
All times are local (unless otherwise noted)
Eruption plumes and gas-and-steam plumes during May-August 2023
Nishinoshima, located about 1,000 km S of Tokyo, is a small island in the Ogasawara Arc in Japan. The island is the summit of a massive submarine volcano that has prominent submarine peaks to the S, W, and NE. Eruptions date back to 1973 and the current eruption period began in October 2022. Recent activity has consisted of small ash plumes and fumarolic activity (BGVN 48:07). This report covers activity during May through August 2023, using information from monthly reports of the Japan Meteorological Agency (JMA) monthly reports and satellite data.
Activity during May through June was relatively low. The Japan Coast Guard (JCG) did overflights on 14 and 22 June and reported white gas-and-steam emissions rising 600 m and 1,200 m from the central crater of the pyroclastic cone, respectively (figure 125). In addition, multiple white gas-and-steam emissions rose from the inner rim of the W side of the crater and from the SE flank of the pyroclastic cone. Discolored brown-to-green water was observed around almost the entire perimeter of the island; on 22 June light green discolored water was observed off the S coast of the island.
Observations from the Himawari meteorological satellite confirmed an eruption on 9 and 10 July. An eruption plume rose 1.6 km above the crater and drifted N around 1300 on 9 July. Satellite images acquired at 1420 and 2020 on 9 July and at 0220 on 10 July showed continuing emissions that rose 1.3-1.6 km above the crater and drifted NE and N. The Tokyo VAAC reported that an ash plume seen by a pilot and identified in a satellite image at 0630 on 21 July rose to 3 km altitude and drifted S.
Aerial observations conducted by JCG on 8 August showed a white-and-gray plume rising from the central crater of the pyroclastic cone, and multiple white gas-and-steam emissions were rising from the inner edge of the western crater and along the NW-SE flanks of the island (figure 126). Brown-to-green discolored water was also noted around the perimeter of the island.
Intermittent low-to-moderate power thermal anomalies were recorded in the MIROVA graph (Middle InfraRed Observation of Volcanic Activity), showing an increase in both frequency and power beginning in July (figure 127). This increase in activity coincides with eruptive activity on 9 and 10 July, characterized by eruption plumes. According to the MODVOLC thermal alert algorithm, one thermal hotspot was recorded on 20 July. Weak thermal anomalies were also detected in infrared satellite imagery, accompanied by strong gas-and-steam plumes (figure 128).
Geologic Background. The small island of Nishinoshima was enlarged when several new islands coalesced during an eruption in 1973-74. Multiple eruptions that began in 2013 completely covered the previous exposed surface and continued to enlarge the island. The island is the summit of a massive submarine volcano that has prominent peaks to the S, W, and NE. The summit of the southern cone rises to within 214 m of the ocean surface 9 km SSE.
Information Contacts: Japan Meteorological Agency (JMA), 1-3-4 Otemachi, Chiyoda-ku, Tokyo 100-8122, Japan (URL: http://www.jma.go.jp/jma/indexe.html); Tokyo Volcanic Ash Advisory Center (VAAC), 1-3-4 Otemachi, Chiyoda-ku, Tokyo 100-8122, Japan (URL: http://ds.data.jma.go.jp/svd/vaac/data/); MIROVA (Middle InfraRed Observation of Volcanic Activity), a collaborative project between the Universities of Turin and Florence (Italy) supported by the Centre for Volcanic Risk of the Italian Civil Protection Department (URL: http://www.mirovaweb.it/); Copernicus Browser, Copernicus Data Space Ecosystem, European Space Agency (URL: https://dataspace.copernicus.eu/browser/).
Krakatau (Indonesia) — October 2023 Cite this Report
Krakatau
Indonesia
6.1009°S, 105.4233°E; summit elev. 285 m
All times are local (unless otherwise noted)
White gas-and-steam plumes and occasional ash plumes during May-August 2023
Krakatau is located in the Sunda Strait between Java and Sumatra, Indonesia. Caldera collapse during the catastrophic 1883 eruption destroyed Danan and Perbuwatan cones and left only a remnant of Rakata. The post-collapse cone of Anak Krakatau (Child of Krakatau) was constructed within the 1883 caldera at a point between the former Danan and Perbuwatan cones; it has been the site of frequent eruptions since 1927. The current eruption period began in May 2021 and has recently consisted of Strombolian eruptions and ash plumes (BGVN 48:07). This report describes lower levels of activity consisting of ash and white gas-and-steam plumes during May through August 2023, based on information provided by the Indonesian Center for Volcanology and Geological Hazard Mitigation, referred to as Pusat Vulkanologi dan Mitigasi Bencana Geologi (PVMBG), MAGMA Indonesia, and satellite data.
Activity was relatively low during May and June. Daily white gas-and-steam emissions rose 25-200 m above the crater and drifted in different directions. Five ash plumes were detected at 0519 on 10 May, 1241 on 11 May, 0920 on 12 May, 2320 on 12 May, and at 0710 on 13 May, and rose 1-2.5 km above the crater and drifted SW. A webcam image taken on 12 May showed ejection of incandescent material above the vent. A total of nine ash plumes were detected during 6-11 June: at 1434 and 00220 on 6 and 7 June the ash plumes rose 500 m above the crater and drifted NW, at 1537 on 8 June the ash plume rose 1 km above the crater and drifted SW, at 0746 and at 0846 on 9 June the ash plumes rose 800 m and 3 km above the crater and drifted SW, respectively, at 0423, 1431, and 1750 on 10 June the ash plumes rose 2 km, 1.5 km, and 3.5 km above the crater and drifted NW, respectively, and at 0030 on 11 June an ash plume rose 2 km above the crater and drifted NW. Webcam images taken on 10 and 11 June at 0455 and 0102, respectively, showed incandescent material ejected above the vent. On 19 June an ash plume at 0822 rose 1.5 km above the crater and drifted SE.
Similar low activity of white gas-and-steam emissions and few ash plumes were reported during July and August. Daily white gas-and-steam emissions rose 25-300 m above the crater and drifted in multiple directions. Three ash plumes were reported at 0843, 0851, and 0852 on 20 July that rose 500-2,000 m above the crater and drifted NW.
The MIROVA (Middle InfraRed Observation of Volcanic Activity) graph of MODIS thermal anomaly data showed intermittent low-to-moderate power thermal anomalies during May through August 2023 (figure 140). Although activity was often obscured by weather clouds, a thermal anomaly was visible in an infrared satellite image of the crater on 12 May, accompanied by an eruption plume that drifted SW (figure 141).
Geologic Background. The renowned Krakatau (frequently mis-named as Krakatoa) volcano lies in the Sunda Strait between Java and Sumatra. Collapse of an older edifice, perhaps in 416 or 535 CE, formed a 7-km-wide caldera. Remnants of that volcano are preserved in Verlaten and Lang Islands; subsequently the Rakata, Danan, and Perbuwatan cones were formed, coalescing to create the pre-1883 Krakatau Island. Caldera collapse during the catastrophic 1883 eruption destroyed Danan and Perbuwatan, and left only a remnant of Rakata. This eruption caused more than 36,000 fatalities, most as a result of tsunamis that swept the adjacent coastlines of Sumatra and Java. Pyroclastic surges traveled 40 km across the Sunda Strait and reached the Sumatra coast. After a quiescence of less than a half century, the post-collapse cone of Anak Krakatau (Child of Krakatau) was constructed within the 1883 caldera at a point between the former Danan and Perbuwatan cones. Anak Krakatau has been the site of frequent eruptions since 1927.
Information Contacts: Pusat Vulkanologi dan Mitigasi Bencana Geologi (PVMBG, also known as Indonesian Center for Volcanology and Geological Hazard Mitigation, CVGHM), Jalan Diponegoro 57, Bandung 40122, Indonesia (URL: http://www.vsi.esdm.go.id/); MAGMA Indonesia, Kementerian Energi dan Sumber Daya Mineral (URL: https://magma.esdm.go.id/v1); MIROVA (Middle InfraRed Observation of Volcanic Activity), a collaborative project between the Universities of Turin and Florence (Italy) supported by the Centre for Volcanic Risk of the Italian Civil Protection Department (URL: http://www.mirovaweb.it/); Copernicus Browser, Copernicus Data Space Ecosystem, European Space Agency (URL: https://dataspace.copernicus.eu/browser/).
Villarrica (Chile) — October 2023 Cite this Report
Villarrica
Chile
39.42°S, 71.93°W; summit elev. 2847 m
All times are local (unless otherwise noted)
Strombolian activity, gas-and-ash emissions, and crater incandescence during April-September 2023
Villarrica, in central Chile, consists of a 2-km-wide caldera that formed about 3,500 years ago and is located at the base of the presently active cone at the NW margin of a 6-km-wide caldera. Historical eruptions eruptions date back to 1558 and have been characterized by mild-to-moderate explosive activity with occasional lava effusions. The current eruption period began in December 2014 and has recently consisted of nighttime crater incandescence, ash emissions, and seismicity (BGVN 48:04). This report covers activity during April through September 2023 and describes occasional Strombolian activity, gas-and-ash emissions, and nighttime crater incandescence. Information for this report primarily comes from the Southern Andes Volcano Observatory (Observatorio Volcanológico de Los Andes del Sur, OVDAS), part of Chile's National Service of Geology and Mining (Servicio Nacional de Geología y Minería, SERNAGEOMIN) and satellite data.
Seismicity during April consisted of long period (LP) events and tremor (TRE); a total of 9,413 LP-type events and 759 TR-type events were detected throughout the month. Nighttime crater incandescence persisted and was visible in the degassing column. Sulfur dioxide data was obtained using Differential Absorption Optical Spectroscopy Equipment (DOAS) that showed an average value of 1,450 ± 198 tons per day (t/d) during 1-15 April and 1,129 ± 201 t/d during 16-30 April, with a maximum daily value of 2,784 t/d on 9 April. Gas-and-steam emissions of variable intensities rose above the active crater as high as 1.3 km above the crater on 13 April. Strombolian explosions were not observed and there was a slight decrease in the lava lake level.
There were 14,123 LP-type events and 727 TR-type events detected during May. According to sulfur dioxide measurements taken with DOAS equipment, the active crater emitted an average value of 1,826 ± 482 t/d during 1-15 May and 912 ± 41 t/d during 16-30 May, with a daily maximum value of 5,155 t/d on 13 May. Surveillance cameras showed continuous white gas-and-steam emissions that rose as high as 430 m above the crater on 27 May. Nighttime incandescence illuminated the gas column less than 300 m above the crater rim was and no pyroclastic emissions were reported. A landslide was identified on 13 May on the E flank of the volcano 50 m from the crater rim and extending 300 m away; SERNAGEOMIN noted that this event may have occurred on 12 May. During the morning of 27 and 28 May minor Strombolian explosions characterized by incandescent ejecta were recorded at the crater rim; the last reported Strombolian explosions had occurred at the end of March.
Seismic activity during June consisted of five volcano-tectonic (VT)-type events, 21,606 LP-type events, and 2,085 TR-type events. The average value of sulfur dioxide flux obtained by DOAS equipment was 1,420 ± 217 t/d during 1-15 June and 2,562 ± 804 t/d, with a maximum daily value of 4,810 t/d on 17 June. White gas-and-steam emissions rose less than 480 m above the crater; frequent nighttime crater incandescence was reflected in the degassing plume. On 12 June an emission rose 100 m above the crater and drifted NNW. On 15 June one or several emissions resulted in ashfall to the NE as far as 5.5 km from the crater, based on a Skysat satellite image. Several Strombolian explosions occurred within the crater; activity on 15 June was higher energy and ejected blocks 200-300 m on the NE slope. Surveillance cameras showed white gas-and-steam emissions rising 480 m above the crater on 16 June. On 19 and 24 June low-intensity Strombolian activity was observed, ejecting material as far as 200 m from the center of the crater to the E.
During July, seismicity included 29,319 LP-type events, 3,736 TR-type events, and two VT-type events. DOAS equipment recorded two days of sulfur dioxide emissions of 4,220 t/d and 1,009 t/d on 1 and 13 July, respectively. Constant nighttime incandescence was also recorded and was particularly noticeable when accompanied by eruptive columns on 12 and 16 July. Minor explosive events were detected in the crater. According to Skysat satellite images taken on 12, 13, and 16 July, ashfall deposits were identified 155 m S of the crater. According to POVI, incandescence was visible from two vents on the crater floor around 0336 on 12 July. Gas-and-ash emissions rose as high as 1.2 km above the crater on 13 July and drifted E and NW. A series of gas-and-steam pulses containing some ash deposited material on the upper E flank around 1551 on 13 July. During 16-31 July, average sulfur dioxide emissions of 1,679 ± 406 t/d were recorded, with a maximum daily value of 2,343 t/d on 28 July. Fine ash emissions were also reported on 16, 17, and 23 July.
Seismicity persisted during August, characterized by 27,011 LP-type events, 3,323 TR-type events, and three VT-type events. The average value of sulfur dioxide measurements taken during 1-15 August was 1,642 ± 270 t/d and 2,207 ± 4,549 t/d during 16-31 August, with a maximum daily value of 3,294 t/d on 27 August. Nighttime crater incandescence remained visible in degassing columns. White gas-and-steam emissions rose 480 m above the crater on 6 August. According to a Skysat satellite image from 6 August, ash accumulation was observed proximal to the crater and was mainly distributed toward the E slope. White gas-and-steam emissions rose 320 m above the crater on 26 August. Nighttime incandescence and Strombolian activity that generated ash emissions were reported on 27 August.
Seismicity during September was characterized by five VT-type events, 12,057 LP-type events, and 2,058 TR-type events. Nighttime incandescence persisted. On 2 September an ash emission rose 180 m above the crater and drifted SE at 1643 (figure 125) and a white gas-and-steam plume rose 320 m above the crater. According to the Buenos Aires VAAC, periods of continuous gas-and-ash emissions were visible in webcam images from 1830 on 2 September to 0110 on 3 September. Strombolian activity was observed on 2 September and during the early morning of 3 September, the latter event of which generated an ash emission that rose 60 m above the crater and drifted 100 m from the center of the crater to the NE and SW. Ashfall was reported to the SE and S as far as 750 m from the crater. The lava lake was active during 3-4 September and lava fountaining was visible for the first time since 26 March 2023, according to POVI. Fountains captured in webcam images at 2133 on 3 September and at 0054 on 4 September rose as high as 60 m above the crater rim and ejected material onto the upper W flank. Sulfur dioxide flux of 1,730 t/d and 1,281 t/d was measured on 3 and 4 September, respectively, according to data obtained by DOAS equipment.
Strong Strombolian activity and larger gas-and-ash plumes were reported during 18-20 September. On 18 September activity was also associated with energetic LP-type events and notable sulfur dioxide fluxes (as high as 4,277 t/d). On 19 September Strombolian activity and incandescence were observed. On 20 September at 0914 ash emissions rose 50 m above the crater and drifted SSE, accompanied by Strombolian activity that ejected material less than 100 m SSE, causing fall deposits on that respective flank. SERNAGEOMIN reported that a Planet Scope satellite image taken on 20 September showed the lava lake in the crater, measuring 32 m x 35 m and an area of 0.001 km2. Several ash emissions were recorded at 0841, 0910, 1251, 1306, 1312, 1315, and 1324 on 23 September and rose less than 150 m above the crater. The sulfur dioxide flux value was 698 t/d on 23 September and 1,097 t/d on 24 September. On 24 September the Volcanic Alert Level (VAL) was raised to Orange (the third level on a four-color scale). SENAPRED maintained the Alert Level at Yellow (the middle level on a three-color scale) for the communities of Villarrica, Pucón (16 km N), Curarrehue, and Panguipulli.
During 24-25 September there was an increase in seismic energy (observed at TR-events) and acoustic signals, characterized by 1 VT-type event, 213 LP-type events, and 124 TR-type events. Mainly white gas-and-steam emissions, in addition to occasional fine ash emissions were recorded. During the early morning of 25 September Strombolian explosions were reported and ejected material 250 m in all directions, though dominantly toward the NW. On 25 September the average value of sulfur dioxide flux was 760 t/d. Seismicity during 25-30 September consisted of five VT-type events, 1,937 LP-type events, and 456 TR-type events.
During 25-29 September moderate Strombolian activity was observed and ejected material as far as the crater rim. In addition, ash pulses lasting roughly 50 minutes were observed around 0700 and dispersed ENE. During 26-27 September a TR episode lasted 6.5 hours and was accompanied by discrete acoustic signals. Satellite images from 26 September showed a spatter cone on the crater floor with one vent that measured 10 x 14 m and a smaller vent about 35 m NE of the cone. SERNAGEOMIN reported an abundant number of bomb-sized blocks up to 150 m from the crater, as well as impact marks on the snow, which indicated explosive activity. A low-altitude ash emission was observed drifting NW around 1140 on 28 September, based on webcam images. Between 0620 and 0850 on 29 September an ash emission rose 60 m above the crater and drifted NW. During an overflight taken around 1000 on 29 September scientists observed molten material in the vent, a large accumulation of pyroclasts inside the crater, and energetic degassing, some of which contained a small amount of ash. Block-sized pyroclasts were deposited on the internal walls and near the crater, and a distal ash deposit was also visible. The average sulfur dioxide flux measured on 28 September was 344 t/d. Satellite images taken on 29 September ashfall was deposited roughly 3 km WNW from the crater and nighttime crater incandescence remained visible. The average sulfur dioxide flux value from 29 September was 199 t/d. On 30 September at 0740 a pulsating ash emission rose 1.1 km above the crater and drifted NNW (figure 126). Deposits on the S flank extended as far as 4.5 km from the crater rim, based on satellite images from 30 September.
Infrared MODIS satellite data processed by MIROVA (Middle InfraRed Observation of Volcanic Activity) showed intermittent thermal activity during April through September, with slightly stronger activity detected during late September (figure 127). Small clusters of thermal activity were detected during mid-June, early July, early August, and late September. According to the MODVOLC thermal alert system, a total of four thermal hotspots were detected on 7 July and 3 and 23 September. This activity was also intermittently captured in infrared satellite imagery on clear weather days (figure 128).
Geologic Background. The glacier-covered Villarrica stratovolcano, in the northern Lakes District of central Chile, is ~15 km south of the city of Pucon. A 2-km-wide caldera that formed about 3,500 years ago is located at the base of the presently active, dominantly basaltic to basaltic andesite cone at the NW margin of a 6-km-wide Pleistocene caldera. More than 30 scoria cones and fissure vents are present on the flanks. Plinian eruptions and pyroclastic flows that have extended up to 20 km from the volcano were produced during the Holocene. Lava flows up to 18 km long have issued from summit and flank vents. Eruptions documented since 1558 CE have consisted largely of mild-to-moderate explosive activity with occasional lava effusion. Glaciers cover 40 km2 of the volcano, and lahars have damaged towns on its flanks.
Information Contacts: Servicio Nacional de Geología y Minería (SERNAGEOMIN), Observatorio Volcanológico de Los Andes del Sur (OVDAS), Avda Sta María No. 0104, Santiago, Chile (URL: http://www.sernageomin.cl/); Proyecto Observación Villarrica Internet (POVI) (URL: http://www.povi.cl/); Sistema y Servicio Nacional de Prevención y Repuesta Ante Desastres (SENAPRED), Av. Beauchef 1671, Santiago, Chile (URL: https://web.senapred.cl/); Buenos Aires Volcanic Ash Advisory Center (VAAC), Servicio Meteorológico Nacional-Fuerza Aérea Argentina, 25 de mayo 658, Buenos Aires, Argentina (URL: http://www.smn.gov.ar/vaac/buenosaires/inicio.php); MIROVA (Middle InfraRed Observation of Volcanic Activity), a collaborative project between the Universities of Turin and Florence (Italy) supported by the Centre for Volcanic Risk of the Italian Civil Protection Department (URL: http://www.mirovaweb.it/); Hawai'i Institute of Geophysics and Planetology (HIGP) - MODVOLC Thermal Alerts System, School of Ocean and Earth Science and Technology (SOEST), Univ. of Hawai'i, 2525 Correa Road, Honolulu, HI 96822, USA (URL: http://modis.higp.hawaii.edu/); Copernicus Browser, Copernicus Data Space Ecosystem, European Space Agency (URL: https://dataspace.copernicus.eu/browser/).
Merapi (Indonesia) — October 2023 Cite this Report
Merapi
Indonesia
7.54°S, 110.446°E; summit elev. 2910 m
All times are local (unless otherwise noted)
Frequent incandescent avalanches during April-September 2023
Merapi, located just north of the major city of Yogyakarta in central Java, Indonesia, has had activity within the last 20 years characterized by pyroclastic flows and lahars accompanying growth and collapse of the steep-sided active summit lava dome. The current eruption period began in late December 2020 and has more recently consisted of ash plumes, intermittent incandescent avalanches of material, and pyroclastic flows (BGVN 48:04). This report covers activity during April through September 2023, based on information from Balai Penyelidikan dan Pengembangan Teknologi Kebencanaan Geologi (BPPTKG), the Center for Research and Development of Geological Disaster Technology, a branch of PVMBG which specifically monitors Merapi. Additional information comes from the Pusat Vulkanologi dan Mitigasi Bencana Geologi (PVMBG, also known as Indonesian Center for Volcanology and Geological Hazard Mitigation, CVGHM), MAGMA Indonesia, the Darwin Volcanic Ash Advisory Centre (VAAC), and various satellite data.
Activity during April through September 2023 primarily consisted of incandescent avalanches of material that mainly affected the SW and W flanks and traveled as far as 2.3 km from the summit (table 25) and white gas-and-steam emissions that rose 10-1,000 m above the crater.
Table 25. Monthly summary of avalanches and avalanche distances recorded at Merapi during April through September 2023. The number of reported avalanches does not include instances where possible avalanches were heard but could not be visually confirmed as a result of inclement weather. Data courtesy of BPPTKG (April-September 2023 daily reports).
| Month |
Average number of avalanches per day |
Distance avalanches traveled (m) |
| Apr 2023 |
19 |
1,200-2,000 |
| May 2023 |
22 |
500-2,000 |
| Jun 2023 |
18 |
1,200-2,000 |
| Jul 2023 |
30 |
300-2,000 |
| Aug 2023 |
25 |
400-2,300 |
| Sep 2023 |
23 |
600-2,000 |
BPPTKG reported that during April and May white gas-and-steam emissions rose 10-750 m above the crater, incandescent avalanches descended 500-2,000 m on the SW and W flanks (figure 135). Cloudy weather often prevented clear views of the summit, and sometimes avalanches could not be confirmed. According to a webcam image, a pyroclastic flow was visible on 17 April at 0531. During the week of 28 April and 4 May a pyroclastic flow was reported on the SW flank, traveling up to 2.5 km. According to a drone overflight taken on 17 May the SW lava dome volume was an estimated 2,372,800 cubic meters and the dome in the main crater was an estimated 2,337,300 cubic meters.
During June and July similar activity persisted with white gas-and-steam emissions rising 10-350 m above the crater and frequent incandescent avalanches that traveled 300-2,000 m down the SW, W, and S flanks (figure 136). Based on an analysis of aerial photos taken on 24 June the volume of the SW lava dome was approximately 2.5 million cubic meters. A pyroclastic flow was observed on 5 July that traveled 2.7 km on the SW flank. According to the Darwin VAAC multiple minor ash plumes were identified in satellite images on 19 July that rose to 3.7 km altitude and drifted S and SW. During 22, 25, and 26 July a total of 17 avalanches descended as far as 1.8 km on the S flank.
Frequent white gas-and-steam emissions continued during August and September, rising 10-450 m above the crater. Incandescent avalanches mainly affected the SW and W flanks and traveled 400-2,300 m from the vent (figure 137). An aerial survey conducted on 10 August was analyzed and reported that estimates of the SW dome volume was 2,764,300 cubic meters and the dome in the main crater was 2,369,800 cubic meters.
Frequent and moderate-power thermal activity continued throughout the reporting period, according to a MIROVA (Middle InfraRed Observation of Volcanic Activity) analysis of MODIS satellite data (figure 138). There was an increase in the number of detected anomalies during mid-May. The MODVOLC thermal algorithm recorded a total of 47 thermal hotspots: six during April, nine during May, eight during June, 15 during July, four during August, and five during September. Some of this activity was captured in infrared satellite imagery on clear weather days, sometimes accompanied by incandescent material on the SW flank (figure 139).
Geologic Background. Merapi, one of Indonesia's most active volcanoes, lies in one of the world's most densely populated areas and dominates the landscape immediately north of the major city of Yogyakarta. It is the youngest and southernmost of a volcanic chain extending NNW to Ungaran volcano. Growth of Old Merapi during the Pleistocene ended with major edifice collapse perhaps about 2,000 years ago, leaving a large arcuate scarp cutting the eroded older Batulawang volcano. Subsequent growth of the steep-sided Young Merapi edifice, its upper part unvegetated due to frequent activity, began SW of the earlier collapse scarp. Pyroclastic flows and lahars accompanying growth and collapse of the steep-sided active summit lava dome have devastated cultivated lands on the western-to-southern flanks and caused many fatalities.
Information Contacts: Balai Penyelidikan dan Pengembangan Teknologi Kebencanaan Geologi (BPPTKG), Center for Research and Development of Geological Disaster Technology (URL: http://merapi.bgl.esdm.go.id/, Twitter: @BPPTKG); MAGMA Indonesia, Kementerian Energi dan Sumber Daya Mineral (URL: https://magma.esdm.go.id/v1); Pusat Vulkanologi dan Mitigasi Bencana Geologi (PVMBG, also known as Indonesian Center for Volcanology and Geological Hazard Mitigation, CVGHM), Jalan Diponegoro 57, Bandung 40122, Indonesia (URL: http://www.vsi.esdm.go.id/); Darwin Volcanic Ash Advisory Centre (VAAC), Bureau of Meteorology, Northern Territory Regional Office, PO Box 40050, Casuarina, NT 0811, Australia (URL: http://www.bom.gov.au/info/vaac/); MIROVA (Middle InfraRed Observation of Volcanic Activity), a collaborative project between the Universities of Turin and Florence (Italy) supported by the Centre for Volcanic Risk of the Italian Civil Protection Department (URL: http://www.mirovaweb.it/); Hawai'i Institute of Geophysics and Planetology (HIGP) - MODVOLC Thermal Alerts System, School of Ocean and Earth Science and Technology (SOEST), Univ. of Hawai'i, 2525 Correa Road, Honolulu, HI 96822, USA (URL: http://modis.higp.hawaii.edu/); Copernicus Browser, Copernicus Data Space Ecosystem, European Space Agency (URL: https://dataspace.copernicus.eu/browser/); Øystein Lund Andersen (URL: https://www.oysteinlundandersen.com/, https://twitter.com/oysteinvolcano).
Ebeko
Russia
50.686°N, 156.014°E; summit elev. 1103 m
All times are local (unless otherwise noted)
Moderate explosive activity with ash plumes continued during June-November 2023
Ebeko, located on the N end of Paramushir Island in Russia’s Kuril Islands just S of the Kamchatka Peninsula, consists of three summit craters along a SSW-NNE line at the northern end of a complex of five volcanic cones. Observed eruptions date back to the late 18th century and have been characterized as small-to-moderate explosions from the summit crater, accompanied by intense fumarolic activity. The current eruptive period began in June 2022, consisting of frequent explosions, ash plumes, and thermal activity (BGVN 47:10, 48:06). This report covers similar activity during June-November 2023, based on information from the Kamchatka Volcanic Eruptions Response Team (KVERT) and satellite data.
Moderate explosive activity continued during June-November 2023 (figures 50 and 51). According to visual data from Severo-Kurilsk, explosions sent ash 2-3.5 km above the summit (3-4.5 km altitude) during most days during June through mid-September. Activity after mid-September was slightly weaker, with ash usually reaching less than 2 km above the summit. According to KVERT the volcano in October and November was, with a few exceptions, either quiet or obscured by clouds that prevented satellite observations. KVERT issued Volcano Observatory Notices for Aviation (VONA) on 8 and 12 June, 13 and 22 July, 3 and 21 August, and 31 October warning of potential aviation hazards from ash plumes drifting 3-15 km from the volcano. Based on satellite data, KVERT reported a persistent thermal anomaly whenever weather clouds permitted viewing.
Geologic Background. The flat-topped summit of the central cone of Ebeko volcano, one of the most active in the Kuril Islands, occupies the northern end of Paramushir Island. Three summit craters located along a SSW-NNE line form Ebeko volcano proper, at the northern end of a complex of five volcanic cones. Blocky lava flows extend west from Ebeko and SE from the neighboring Nezametnyi cone. The eastern part of the southern crater contains strong solfataras and a large boiling spring. The central crater is filled by a lake about 20 m deep whose shores are lined with steaming solfataras; the northern crater lies across a narrow, low barrier from the central crater and contains a small, cold crescentic lake. Historical activity, recorded since the late-18th century, has been restricted to small-to-moderate explosive eruptions from the summit craters. Intense fumarolic activity occurs in the summit craters, on the outer flanks of the cone, and in lateral explosion craters.
Information Contacts: Kamchatka Volcanic Eruptions Response Team (KVERT), Far Eastern Branch, Russian Academy of Sciences, 9 Piip Blvd., Petropavlovsk-Kamchatsky, 683006, Russia (URL: http://www.kscnet.ru/ivs/kvert/).
Search Bulletin Archive by Publication Date
Select a month and year from the drop-downs and click "Show Issue" to have that issue displayed in this tab.
The default month and year is the latest issue available.
Bulletin of the Global Volcanism Network - Volume 19, Number 09 (September 1994)
Managing Editor: Edward Venzke
Aira (Japan)
Eruptive activity decreases
Arenal (Costa Rica)
Lava flows remain active and produce rockfalls from flow-front collapses
Asosan (Japan)
Explosions eject mud and blocks
Deception Island (Antarctica)
Seismicity decreases; fumarole temperatures stable
Galeras (Colombia)
Long-period seismicity continues
Kanaga (United States)
Minor ash emission
Kilauea (United States)
One active ocean entry; small breakouts on E side of flow field
Klyuchevskoy (Russia)
Eruption sends plume to 15-20 km altitude and produces lava flows
Lengai, Ol Doinyo (Tanzania)
New active hornito and central depression
Masaya (Nicaragua)
Temperatures and SO2 flux from incandescent opening continue rising
Miravalles (Costa Rica)
Summary of April 1991-July 1994 seismicity
Negro, Cerro (Nicaragua)
Tremor increases after 7 September, but no steam or ash
Pacaya (Guatemala)
Vigorous Strombolian explosions produce ashfalls and lava flows
Poas (Costa Rica)
Phreatic and fumarolic activity; block-and-ash eruptions
Rabaul (Papua New Guinea)
Tavurvur remains active; details of September eruptions
Rincon de la Vieja (Costa Rica)
Vigorous fumarolic activity
Ruapehu (New Zealand)
Cooling trend of crater lake reverses in late August
San Cristobal (Nicaragua)
Increased seismicity during March-July declines in August
Stromboli (Italy)
Intense activity from ten vent locations
Telica (Nicaragua)
Explosion followed by decreased seismicity
Unzendake (Japan)
Endogenous dome growth slows; erosion of talus slopes
Veniaminof (United States)
Intermittent steam-and-ash plumes
Whakaari/White Island (New Zealand)
Small eruption in late July ejects mud and blocks
Aira
Japan
31.5772°N, 130.6589°E; summit elev. 1117 m
All times are local (unless otherwise noted)
Eruptive activity decreases
Explosive volcanism continued through September but caused no damage. Nine eruptions occurred . . ., including four explosive ones, a significant decrease from last month. The highest ash plume of September rose to 3,200 m on the morning of 12 September. No volcanic earthquake swarms were detected, but 438 distinct events were registered at a seismic station 2.3 km NW of Minami-dake crater. Ashfall was sometimes observed at [KLMO], where 425 g/m2 was measured in September.
Geologic Background. The Aira caldera in the northern half of Kagoshima Bay contains the post-caldera Sakurajima volcano, one of Japan's most active. Eruption of the voluminous Ito pyroclastic flow accompanied formation of the 17 x 23 km caldera about 22,000 years ago. The smaller Wakamiko caldera was formed during the early Holocene in the NE corner of the caldera, along with several post-caldera cones. The construction of Sakurajima began about 13,000 years ago on the southern rim and built an island that was joined to the Osumi Peninsula during the major explosive and effusive eruption of 1914. Activity at the Kitadake summit cone ended about 4,850 years ago, after which eruptions took place at Minamidake. Frequent eruptions since the 8th century have deposited ash on the city of Kagoshima, located across Kagoshima Bay only 8 km from the summit. The largest recorded eruption took place during 1471-76.
Information Contacts: JMA.
Arenal (Costa Rica) — September 1994 Cite this Report
Arenal
Costa Rica
10.463°N, 84.703°W; summit elev. 1670 m
All times are local (unless otherwise noted)
Lava flows remain active and produce rockfalls from flow-front collapses
Strombolian eruptions and lava output from Crater C continued in August-September, while Crater D exhibited fumarolic activity. The new lava flow observed in July on the high W flank stopped in August. However, the composite lava flow active since 28 August 1993 formed two new lobes that overflowed levees around 1,200 m elev. In August-September a cone in Crater C, new lava flows, and pyroclastic materials had covered and filled the bulk of the amphitheater opened by the August 1993 event.
ICE scientists noted that explosive activity in August was similar to July, although volcano-seismic activity declined. On 11 and 15 August the number and size of explosions escalated, vibrating windows and other infrastructure at a settlement 4 km from the active crater. Some of these events were detected seismically 30 km away (station Las Juntas de Abangares).
In September, explosions were fewer in number, of lower magnitude, and they carried smaller amounts of pyroclastic material. The lobes of the 28 August 1993 lava flow remained active in September. Several flow-front collapses, resembling pyroclastic flows, were witnessed during September. The largest such witnessed event (1600, 29 September), resulted in a 500-m-high, reddish-brown ash cloud. In addition, some "noisy" seismic signals recorded by ICE may have been caused by similar unwitnessed collapse events. Summit fumarolic activity remained very vigorous. Explosive activity was similar to previous months. Volcano-seismic events decreased to an average of 55/day, and tremor declined slightly to 58 minutes/day. On the SE, E, and NE flanks the vegetation continued to recede because of the effects of acidic rain, rock falls, and other factors such as high rainfall, which had induced small cold avalanches (specifically down Calle de Arena, Guillermina, and Agua Caliente rivers).
On average, 76 daily seismic events were recorded by ICE during August, compared to 104 in July and 73 in June; daily number of tremor hours averaged ~1.3, similar to July. During September, 620 seismic events (1.5-2.5 Hz frequencies) were recorded by OVSICORI-UNA, and were thought to correlate chiefly to gas-dominated eruptions, or in some cases to gas-and-ash eruptions. Sounds associated with these eruptions were similar to a jet or steam locomotive. Sporadic tremor took place in the 1.3-3.0 Hz frequency range; total tremor duration for September was 99 hours. During August-September, distance and dry tilt measurements failed to show significant changes.
Geologic Background. Conical Volcán Arenal is the youngest stratovolcano in Costa Rica and one of its most active. The 1670-m-high andesitic volcano towers above the eastern shores of Lake Arenal, which has been enlarged by a hydroelectric project. Arenal lies along a volcanic chain that has migrated to the NW from the late-Pleistocene Los Perdidos lava domes through the Pleistocene-to-Holocene Chato volcano, which contains a 500-m-wide, lake-filled summit crater. The earliest known eruptions of Arenal took place about 7000 years ago, and it was active concurrently with Cerro Chato until the activity of Chato ended about 3500 years ago. Growth of Arenal has been characterized by periodic major explosive eruptions at several-hundred-year intervals and periods of lava effusion that armor the cone. An eruptive period that began with a major explosive eruption in 1968 ended in December 2010; continuous explosive activity accompanied by slow lava effusion and the occasional emission of pyroclastic flows characterized the eruption from vents at the summit and on the upper western flank.
Information Contacts: E. Fernandez, J. Barquero, V. Barboza, R. Van der Laat, T. Marino, F. de Obaldia, and L. Carvajal, OVSICORI; G. Soto, W. Taylor, F. Arias, G. Alvarado, and R. Barquero, ICE; M. Mora, Univ de Costa Rica.
Asosan
Japan
32.8849°N, 131.085°E; summit elev. 1592 m
All times are local (unless otherwise noted)
Explosions eject mud and blocks
Activity increased at Crater 1 during September. Tremor amplitude registered at a seismic station 800 m W of the crater was 4.8 µm at about 0800 on 11 September. Three hours later, the AWS (figure 25), issued a Volcanic Advisory noting that Aso was getting restless. Another tremor, which was large enough to be felt at AWS, occurred at 1148 later that day. The floor of Crater 1 was covered by a pool of water, and intermittent mud ejection took place. Several tens of volcanic stones were found outside of the crater rim within ~300 m from the center of the crater during a visit on the morning of 14 September. These rocks were ejected by an explosion on the evening of 12 September, based on seismic records. The area within 1 km of Crater 1 was placed off-limits on 11 September by local governments through the Board for Volcanic Disaster Reduction.
During the rest of September, mud ejection was intermittent and volcanic tremor was frequent. On 15 and 18 September, ejected mud rose 150 m above the bottom of the crater, almost to the crater rim. On 16 and 19 September, a plume rose to a height of 1,500 m above the crater rim. Tremor was felt by personnel at AWS on 11, 15, 21, 22, and 29 September, and 1 October. The 29 September event was registered 800 m W of the crater with an amplitude of 52 µm, which is the largest reading since tremor amplitude measurements began in 1969.
The 12 September ejection of stones beyond the crater rim was the first eruptive activity since February 1993; mud ejections have been reported since 2 May 1994.
Geologic Background. The 24-km-wide Asosan caldera was formed during four major explosive eruptions from 300,000 to 90,000 years ago. These produced voluminous pyroclastic flows that covered much of Kyushu. The last of these, the Aso-4 eruption, produced more than 600 km3 of airfall tephra and pyroclastic-flow deposits. A group of 17 central cones was constructed in the middle of the caldera, one of which, Nakadake, is one of Japan's most active volcanoes. It was the location of Japan's first documented historical eruption in 553 CE. The Nakadake complex has remained active throughout the Holocene. Several other cones have been active during the Holocene, including the Kometsuka scoria cone as recently as about 210 CE. Historical eruptions have largely consisted of basaltic to basaltic andesite ash emission with periodic strombolian and phreatomagmatic activity. The summit crater of Nakadake is accessible by toll road and cable car, and is one of Kyushu's most popular tourist destinations.
Information Contacts: JMA.
Deception Island (Antarctica) — September 1994 Cite this Report
Deception Island
Antarctica
62.9567°S, 60.6367°W; summit elev. 602 m
All times are local (unless otherwise noted)
Seismicity decreases; fumarole temperatures stable
The Deception Volcano Observatory (figure 9) was created in 1993, but the volcano has been monitored every summer since 1986. Seismicity remained stable during the austral summer of 1993-94. The decrease in seismic activity seen during 1992-93 from 1991-92 levels continued. Only a few small local seismic events (M 1.5-2) and some larger events (M 2.5, >100 km depth) were detected. Fumaroles emitted mainly CO2 (94.7%) and H2S (3.5%); no SO2 was detected. Fumarole temperatures were similar to previous years near the Argentine Station (60.5°C), in Fumarole Bay (101.2°C), and at Steaming Hill (98.5°C).
Geologic Background. Ring-shaped Deception Island, at the SW end of the South Shetland Islands, NE of Graham Land Peninsula, was constructed along the axis of the Bransfield Rift spreading center. A narrow passageway named Neptunes Bellows provides an entrance to a natural harbor within the 8.5 x 10 km caldera that was utilized as an Antarctic whaling station. Numerous vents along ring fractures circling the low 14-km-wide island have been reported active for more than 200 years. Maars line the shores of 190-m-deep Port Foster caldera bay. Among the largest of these maars is 1-km-wide Whalers Bay, at the entrance to the harbor. Eruptions during the past 8,700 years have been dated from ash layers in lake sediments on the Antarctic Peninsula and neighboring islands.
Information Contacts: C. Risso, Instituto Antártico Argentino; R. Ortiz, Museo Nacional de Ciencias Naturales, Spain.
Galeras (Colombia) — September 1994 Cite this Report
Galeras
Colombia
1.22°N, 77.37°W; summit elev. 4276 m
All times are local (unless otherwise noted)
Long-period seismicity continues
Long-period screw-type events (monochromatic and with a slow coda decay) continued during September. The current episode of screw-type events began on 9 August. Compared to the episodes that preceded five eruptions at Galeras during 1992-93, this episode was more intermittent, with periods of several days between events. From 9 August to 23 September there were 29 screw-type events, with frequencies of 2.4-8.5 Hz and durations of 20-180 seconds. These events were associated with pressurization phases in the volcanic system, and gas emission.
Distinct screw-type events took place until 23 September, when 100 minutes of 7.8 Hz tremor were recorded at the station 900 m NE of the crater. The tremor episode corresponded to an increase in the gas emission rate, according to aerial observations and mobile COSPEC SO2 measurements. After the tremor, a small swarm of short-duration long-period events occurred, which in the past have been associated with gas emission. This behavior, although on a smaller scale, was similar to that during and after the July 1992 and January, March, April, and June 1993 eruptions. Seismic activity stayed at low levels through the end of September; superficial low-magnitude events were related to fracturing and fluid movement (butterfly events). Low rates of deformation and SO2 emission continued.
High-frequency seismicity was located in several sectors around the volcano; the most significant activity was from a source 3.3 km NNE of the active cone, where three earthquakes originated that were felt in Pasto (9 km E) and villages such as Jenoy, Nariño, and La Florida. An earthquake on 5 September had M 2.6 and a depth of ~8.6 km. Two earthquakes on the 28th had M 2.2 and 2.9 with depths of 7.1 and 8.8 km, respectively.
Geologic Background. Galeras, a stratovolcano with a large breached caldera located immediately west of the city of Pasto, is one of Colombia's most frequently active volcanoes. The dominantly andesitic complex has been active for more than 1 million years, and two major caldera collapse eruptions took place during the late Pleistocene. Long-term extensive hydrothermal alteration has contributed to large-scale edifice collapse on at least three occasions, producing debris avalanches that swept to the west and left a large open caldera inside which the modern cone has been constructed. Major explosive eruptions since the mid-Holocene have produced widespread tephra deposits and pyroclastic flows that swept all but the southern flanks. A central cone slightly lower than the caldera rim has been the site of numerous small-to-moderate eruptions since the time of the Spanish conquistadors.
Information Contacts: INGEOMINAS, Pasto.
Kanaga (United States) — September 1994 Cite this Report
Kanaga
United States
51.923°N, 177.168°W; summit elev. 1307 m
All times are local (unless otherwise noted)
Minor ash emission
Eruptive activity continued in the second half of August with emissions of steam and minor amounts of ash on 20-21 August. A shift in wind direction produced light ashfall in Adak on 20 August and temporarily disrupted air traffic to Adak on the 22nd. Weather clouds frequently obscured Kanaga from late August through mid-September. Preliminary analysis suggests the ash is broadly similar in composition to other known tephras and lavas from Kanaga.
Observers reported white steam clouds rising to 600 m above the summit on 8 September; occasional low rumbling noises were also heard. Weather clouds obscured Kanaga for much of 16-30 September, but AVHRR satellite images indicated a steam plume extending ~50 km S of Kanaga on 22 September. . . . .
Geologic Background. Symmetrical Kanaga stratovolcano is situated within the Kanaton caldera at the northern tip of Kanaga Island. The caldera rim forms a 760-m-high arcuate ridge south and east of Kanaga; a lake occupies part of the SE caldera floor. The volume of subaerial dacitic tuff is smaller than would typically be associated with caldera collapse, and deposits of a massive submarine debris avalanche associated with edifice collapse extend nearly 30 km to the NNW. Several fresh lava flows from historical or late prehistorical time descend the flanks of Kanaga, in some cases to the sea. Historical eruptions, most of which are poorly documented, have been recorded since 1763. Kanaga is also noted petrologically for ultramafic inclusions within an outcrop of alkaline basalt SW of the volcano. Fumarolic activity occurs in a circular, 200-m-wide, 60-m-deep summit crater and produces vapor plumes sometimes seen on clear days from Adak, 50 km to the east.
Information Contacts: AVO.
Kilauea (United States) — September 1994 Cite this Report
Kilauea
United States
19.421°N, 155.287°W; summit elev. 1222 m
All times are local (unless otherwise noted)
One active ocean entry; small breakouts on E side of flow field
Lava continued to enter the ocean in the Kamoamoa/Lae Apuki area during the first half of September. Flows from the tube extended the bench, stranding the littoral cone built in July. Activity appeared to diminish in early September, and by 5 September the only active entry was SE of the littoral cone. The entry was moderately explosive through 12 September. Small pahoehoe and 'a'a lava flows continued to break out on the E side of the flow field between 270 and 15 m elevation.
Geologic Background. Kilauea overlaps the E flank of the massive Mauna Loa shield volcano in the island of Hawaii. Eruptions are prominent in Polynesian legends; written documentation since 1820 records frequent summit and flank lava flow eruptions interspersed with periods of long-term lava lake activity at Halemaumau crater in the summit caldera until 1924. The 3 x 5 km caldera was formed in several stages about 1,500 years ago and during the 18th century; eruptions have also originated from the lengthy East and Southwest rift zones, which extend to the ocean in both directions. About 90% of the surface of the basaltic shield volcano is formed of lava flows less than about 1,100 years old; 70% of the surface is younger than 600 years. The long-term eruption from the East rift zone between 1983 and 2018 produced lava flows covering more than 100 km2, destroyed hundreds of houses, and added new coastline.
Information Contacts: T. Mattox, HVO.
Klyuchevskoy (Russia) — September 1994 Cite this Report
Klyuchevskoy
Russia
56.056°N, 160.642°E; summit elev. 4754 m
All times are local (unless otherwise noted)
Eruption sends plume to 15-20 km altitude and produces lava flows
During 15-19 September, gas-and-ash bursts rose 500-700 m above the crater. The eruption column reached 1.5-2.0 km above the crater and extended >50 km downwind to the SE. Lava flows extruding from two vents 200 m below the crater rim had moved down to 2,800 m elevation on the NW and SW flanks. Phreatic explosions were occurring at the contact of the NW lava flow and the glacier. Lava fountains in the central crater reached heights of 300-500 m. Continuous volcanic tremor, with a maximum amplitude of 6.1 µm, was recorded at the seismic station 11 km from the volcano.
From 20 to 23 September, gas-and-ash bursts increased in height to 800-1,000 m above the crater. The eruption column continued to reach ~2 km above the crater, but extended >100 km SE. Lava flows on the NW and SW flanks remained active, and fountains in the central crater increased to heights of 500-700 m. Volcanic tremor was continuous with a maximum amplitude of 8.2 µm.
Eruptive activity increased on the afternoon of 30 September. Ash bursts rose 3 km above the crater and the ash column reached an estimated altitude of 10 km and extended SE for >100 km. Lava flows on the NW and SW slopes of the volcano remained active, and mudflows were noted on the N slope. Continuous volcanic tremor had a maximum amplitude of 8.4 µm.
At 0600 on 1 October the eruption entered a paroxysmal stage with lava bursts rising 4,500 m above the crater rim. The ash column was estimated at 15-20 km altitude and extended >100 km SE. Phreatic explosions along the margin of the flank lava flows generated steam clouds >1 km high. Avalanches of incandescent blocks were observed descending the N slope. Between 0900 and 1100, ash and lava bursts produced a dark, ash-laden plume rising to a height of 15-18 km and moving ESE. GMS satellite imagery showed ash ~565 km SE moving at ~140 km/hour. By 1400 the dark ash plume reached 15 km altitude. Lava and ash explosions continued from the central crater at 1500, when the ash column rose to 12-14 km above sea level and moved ESE at an altitude of 10-11 km. Pilot reports indicated that the ash was at 9-11 km (FL300-370 = 30,000-37,000 feet). A 747 aircraft reported an ash encounter at 11 km altitude, but avoided the cloud by climbing to ~12 km (FL390). Helicopter observations at 1500-1700 revealed two lava flows on the N and NW slopes and lava fountaining to 900 m above the crater rim. The eruption appeared to reach its maximum intensity between 0600 and 1630. By 1900 the ash plume was at a maximum altitude of 9-11 km and drifting E for >100 km. Volcanic tremor was continuous with a maximum amplitude of 8.4 µm. Analysis of GMS infrared imagery at 2330 showed a thin concentrated plume extending generally SE, surrounded by areas of thinner ash.
After about 0530 on 2 October, layered weather clouds moving from the W had obscured the summit from GMS satellite observation, although the dissipating ash cloud could be seen SE of the volcano. At 0920 a dark ash plume rose to ~8.4-8.7 km altitude and drifted E, but by 1100 the plume was only rising to 6-7 km and drifting NNE. Areas of thick, moderate, and thin dispersing ash, E and S of the volcano beyond the obscuring weather clouds, continued to be tracked by satellite through 2030. By that time, the ash cloud was becoming more diffuse and harder to distinguish from underlying low-level clouds.
The volcano was obscured by clouds on 3 October. Volcanic tremor with a maximum amplitude of 1-2.5 Nm indicated that the eruption was continuing, but at a reduced rate. On 4 October, only fumarolic activity appeared to be occurring inside the summit crater and no incandescence could be seen at night. The gas-and-steam plume rose ~1 km above the crater and was directed S for ~5 km.
Meteor-3 TOMS overflew the eruption plume at 1347 on 1 October. Preliminary results showed an extended SO2 cloud ~800 km long to the SE, with an approximate area of 150,000 km2. Estimated cloud mass was 90 kt SO2 +- 50%. A pass at 1520 on 2 October did not find an SO2 cloud.
Geologic Background. Klyuchevskoy is the highest and most active volcano on the Kamchatka Peninsula. Since its origin about 6,000 years ago, this symmetrical, basaltic stratovolcano has produced frequent moderate-volume explosive and effusive eruptions without major periods of inactivity. It rises above a saddle NE of Kamen volcano and lies SE of the broad Ushkovsky massif. More than 100 flank eruptions have occurred during approximately the past 3,000 years, with most lateral craters and cones occurring along radial fissures between the unconfined NE-to-SE flanks of the conical volcano between 500 and 3,600 m elevation. Eruptions recorded since the late 17th century have resulted in frequent changes to the morphology of the 700-m-wide summit crater. These eruptions over the past 400 years have originated primarily from the summit crater, but have also included numerous major explosive and effusive eruptions from flank craters.
Information Contacts: V. Kirianov, IVGG; J. Lynch, SAB; I. Sprod, GSFC.
Ol Doinyo Lengai (Tanzania) — September 1994 Cite this Report
Ol Doinyo Lengai
Tanzania
2.764°S, 35.914°E; summit elev. 2962 m
All times are local (unless otherwise noted)
New active hornito and central depression
A small eruption on 18 September 1994 was the first observed activity since July 1993. A new central depression ~20 m deep was emanating hot gas from a prominent ring fracture ~100 m in diameter. Virtually continuous booming and rushing noises indicated near-surface lava, but it was not possible to see over the dangerous overhang. The new depression within the existing crater overlapped the 1992-93 eruptive sites and caused partial subsidence of older hornitos. A separate new lava-filled central hornito (~30 m in diameter and 10 m high) was observed for ~6 hours. Highly vesicular brown lava erupted once to the brim and was sampled. Lava was generally a few meters below the surface of the hornito, but periodic surges ejected spatter to ~30 m away. These ejections were interspersed with jetting of colorless gas and occasional widespread lapilli emissions to ~50 m away. The new hornito lava, ~50 m above the base of the central depression, was very frothy, crystal-rich, non-incandescent, and appeared similar to the type seen in 1992.
Geologic Background. The symmetrical Ol Doinyo Lengai is the only volcano known to have erupted carbonatite tephras and lavas in historical time. The prominent stratovolcano, known to the Maasai as "The Mountain of God," rises abruptly above the broad plain south of Lake Natron in the Gregory Rift Valley. The cone-building stage ended about 15,000 years ago and was followed by periodic ejection of natrocarbonatitic and nephelinite tephra during the Holocene. Historical eruptions have consisted of smaller tephra ejections and emission of numerous natrocarbonatitic lava flows on the floor of the summit crater and occasionally down the upper flanks. The depth and morphology of the northern crater have changed dramatically during the course of historical eruptions, ranging from steep crater walls about 200 m deep in the mid-20th century to shallow platforms mostly filling the crater. Long-term lava effusion in the summit crater beginning in 1983 had by the turn of the century mostly filled the northern crater; by late 1998 lava had begun overflowing the crater rim.
Information Contacts: A. Jones, W. Taylor, A. Church, L. Johnson, and T. Allison, Univ College London.
Masaya (Nicaragua) — September 1994 Cite this Report
Masaya
Nicaragua
11.9844°N, 86.1688°W; summit elev. 594 m
All times are local (unless otherwise noted)
Temperatures and SO2 flux from incandescent opening continue rising
A red incandescent area that opened in the inner crater during mid-June 1993 remained active at least through June 1994. An unbroken gas plume has often been observed extending several kilometers from the volcano. Average fumarole temperatures, measured with an infrared pyrometer, began increasing in May 1993 from around 50°C to almost 250°C by July 1993 (figure 9 and 18:07). Fumarole temperatures slowly increased to almost 400°C by May 1994, when they suddenly increased again, reaching almost 600°C by the end of July 1994. Measurement of SO2 emissions at the summit were carried out using colorimetric and chemical techniques. An increase from background to ~5 mg/m3 was detected in June 1993 after the incandescent opening first appeared. SO2 increased to ~15 mg/m3 between July and August, and again increased sharply during September-November 1993 to ~30 mg/m3. Steady increases in the SO2 emission rate since then resulted in measurements of ~35 mg/m3 in May-July 1994.
Geologic Background. Masaya volcano in Nicaragua has erupted frequently since the time of the Spanish Conquistadors, when an active lava lake prompted attempts to extract the volcano's molten "gold" until it was found to be basalt rock upon cooling. It lies within the massive Pleistocene Las Sierras caldera and is itself a broad, 6 x 11 km basaltic caldera with steep-sided walls up to 300 m high. The caldera is filled on its NW end by more than a dozen vents that erupted along a circular, 4-km-diameter fracture system. The Nindirí and Masaya cones, the source of observed eruptions, were constructed at the southern end of the fracture system and contain multiple summit craters, including the currently active Santiago crater. A major basaltic Plinian tephra erupted from Masaya about 6,500 years ago. Recent lava flows cover much of the caldera floor and there is a lake at the far eastern end. A lava flow from the 1670 eruption overtopped the north caldera rim. Periods of long-term vigorous gas emission at roughly quarter-century intervals have caused health hazards and crop damage.
Information Contacts: H. Taleno, L. Urbina, C. Lugo, and O. Canales, INETER.
Miravalles (Costa Rica) — September 1994 Cite this Report
Miravalles
Costa Rica
10.748°N, 85.153°W; summit elev. 2028 m
All times are local (unless otherwise noted)
Summary of April 1991-July 1994 seismicity
"The Office of Seismology and Volcanology of the Department of Geological Engineering, Costa Rican Institute of Electricity (ICE), has monitored the seismicity of the Miravalles Geothermal Field since 1977. The monthly number of recorded earthquakes at the Miravalles Caldera from April 1991 through July 1994 is shown on figure 1. Maximum magnitudes were 3.5; no high-magnitude local earthquakes occurred within the geothermal field during this study period. Previous seismological campaigns showed a similar level of activity.
"The 219 tectonic events located during this period were distributed within a radius of 15 km of the geothermal field. There were some clusters of events that from their location and alignment could be correlated to previously determined faults and structures in the area and they were cataloged in 8 groups. Earthquakes recorded during the monitoring campaign were mostly shallow, with depths of 0-15 km and predominantly 0-5 km. The distribution of earthquakes cannot be correlated with a magma chamber or any shallow magmatic body in the area, but it confirms that some seismic activity is taking place under and inside the caldera."
Geologic Background. Miravalles is an andesitic stratovolcano that is one of five post-caldera cones along a NE-trending line within the broad 15 x 20 km Guayabo (Miravalles) caldera. The caldera was formed during several major explosive eruptions that produced voluminous dacitic-rhyolitic pyroclastic flows between ~1.5 and 0.6 million years ago. Growth of post-caldera volcanoes in the eastern part of the caldera that overtopped much of the eastern and southern caldera rims was interrupted by edifice collapse which produced a major debris avalanche to the SW. Morphologically youthful lava flows cover the W and SW flanks of the post-caldera Miravalles complex, which rises above the town of Guayabo on the flat western caldera floor. A small steam explosion on the SW flank was reported in 1946. High heat flow remains, and it is the site of a large developed geothermal field.
Information Contacts: R. Barquero, ICE.
Cerro Negro (Nicaragua) — September 1994 Cite this Report
Cerro Negro
Nicaragua
12.506°N, 86.702°W; summit elev. 728 m
All times are local (unless otherwise noted)
Tremor increases after 7 September, but no steam or ash
After the last eruption of Cerro Negro in April 1992 (BGVN 17:03 and 17:04), telemetry-equipped seismic instruments donated by the Japanese government were installed in November 1993. During the previous 10 months, seismic behavior has chiefly consisted of low-amplitude high-frequency events, but beginning on 7 September this changed. Tremor amplitudes increased, first to 2 mm but later reaching 10-12 mm, and tremor episodes lasted from minutes to hours. Field observers inspecting the summit on 15 September found neither steam nor fresh ash. Tremor and high-frequency seismicity continued through 30 September. Other recent fieldwork has investigated the extent of passive degassing and the chemical composition of the emissions (BGVN 19:06).
Geologic Background. Nicaragua's youngest volcano, Cerro Negro, was created following an eruption that began in April 1850 about 2 km NW of the summit of Las Pilas volcano. It is the largest, southernmost, and most recent of a group of four youthful cinder cones constructed along a NNW-SSE-trending line in the central Marrabios Range. Strombolian-to-subplinian eruptions at intervals of a few years to several decades have constructed a roughly 250-m-high basaltic cone and an associated lava field constrained by topography to extend primarily NE and SW. Cone and crater morphology have varied significantly during its short eruptive history. Although it lies in a relatively unpopulated area, occasional heavy ashfalls have damaged crops and buildings.
Information Contacts: H. Taleno, L. Urbina, C. Lugo, and O. Canales, INETER.
Pacaya (Guatemala) — September 1994 Cite this Report
Pacaya
Guatemala
14.382°N, 90.601°W; summit elev. 2569 m
All times are local (unless otherwise noted)
Vigorous Strombolian explosions produce ashfalls and lava flows
Activity increased at 0400 on 12 October with vigorous Strombolian explosions. Approximately 5 cm of ash was deposited in El Patrocinio, ~4 km W (figure 12). Ash drifted as far as Santa Lucia Cotzumalguapa, ~45 km WSW on the Pacific lowlands. Although apparently declining on 14 October, Strombolian activity was continuing, an ash plume to 300 m above the vent persisted, and tremor was still being detected by the seismometer at Pacaya. As of 14 October, five lava flows active on MacKenney cone had reached the base of the edifice, two on the N, two on the W, and one on the S flank. Flow velocities were reported to be 10 m/hour. Heavy rains and cloud cover since the start of the increased activity have prevented detailed observations. The Comite Nacional de Emergencias (CONE) evacuated 142 people from the towns of El Patrocinio, El Caracol (3 km SW), and other nearby areas, to San Vincente de Pacaya (5 km NW).
Pacaya is a complex volcano constructed on the S rim of the 14 x 16 km Pleistocene Amatitlan Caldera. In 1565, the first recorded historical eruption from Pacaya caused ashfall for three days in Guatemala City. Following explosions in July and October 1965, Strombolian activity was generally continuous until March 1989 when explosive activity removed ~75 m of the MacKenney cone summit and enlarged the crater. Strombolian activity began again in January 1990 and has continued intermittently since then. This latest episode of activity, although smaller in terms of area impacted by tephra, is similar to the activity during July-August 1991, which again destroyed part of the cone and damaged towns W of the volcano.
Geologic Background. Eruptions from Pacaya are frequently visible from Guatemala City, the nation's capital. This complex basaltic volcano was constructed just outside the southern topographic rim of the 14 x 16 km Pleistocene Amatitlán caldera. A cluster of dacitic lava domes occupies the southern caldera floor. The post-caldera Pacaya massif includes the older Pacaya Viejo and Cerro Grande stratovolcanoes and the currently active Mackenney stratovolcano. Collapse of Pacaya Viejo between 600 and 1,500 years ago produced a debris-avalanche deposit that extends 25 km onto the Pacific coastal plain and left an arcuate scarp inside which the modern Pacaya volcano (Mackenney cone) grew. The NW-flank Cerro Chino crater was last active in the 19th century. During the past several decades, activity has consisted of frequent Strombolian eruptions with intermittent lava flow extrusion that has partially filled in the caldera moat and covered the flanks of Mackenney cone, punctuated by occasional larger explosive eruptions that partially destroy the summit.
Information Contacts: Eddy Sanchez, INSIVUMEH.
Poas (Costa Rica) — September 1994 Cite this Report
Poas
Costa Rica
10.2°N, 84.233°W; summit elev. 2697 m
All times are local (unless otherwise noted)
Phreatic and fumarolic activity; block-and-ash eruptions
Phreatic and strong fumarolic activity between 20 July and 5 August formed a pan-like structure in the bottom of the inner lake (figure 55). Following heavy rainfall on the summit area, this structure was filled with water and mud. In the active crater, fumaroles on the S and SE sides of the lake disappeared during August, and block-and-ash eruptions formed a new small crater. The majority of the blocks fell onto the crater floor, the largest seen was 1.2 m in diameter. These eruptions ceased 5 August, but smaller gas-column discharges followed, to heights of 600 m above the lake. These discharges were noteworthy because they were rich in sulfur particulates.
The lake in the active crater rose 1.5 m in September, covering some fumaroles. The 60°C lake was gray, muddy-looking, and clouded with suspended sulfur. Fringed by mud pots, the lake occupied the pan-like structure formed during earlier phreatic and strong fumarolic activity. Owing to the lake's rise, fumaroles in its center appeared isolated; the fumaroles to the N, NW, and W generally maintained steam columns rising ~600 m above the crater. The sound produced resembled steam escaping from a pressure-release valve when heard from the overlook.
Fumaroles on the dome were unchanged in August and September. Fumarolic activity remained strong through late September in several locations on the crater bottom, including boiling mudpots. At the beginning of September the W fumarole converted into a pan-shaped source vent constantly releasing gas and phreatic emissions to heights of 5 m. In mid-September a new fumarole appeared on the W fringe of this source vent with a moderate gas output. Toward the end of the month the gas released at the source vent decreased.
During August and September, OVSICORI-UNA recorded 3,639 and 1,524 low-frequency events, respectively. Compared to tremor duration in August (97 hours), tremor duration in September increased by 42% (to 138 hours). August tremor amplitude was 4-11 mm, with a frequency range centered around 2.3 Hz. September tremor amplitude was 3-9 mm, its frequency range was largely 1.4-2.3 Hz. In addition, a contant, deep noise source (1-3 mm amplitude) was noted during August.
On 23 September seismic instruments recorded a swarm of 11 events, of which 10 were felt by the inhabitants close to the volcano. Four of these events were located (table 5). The located events had magnitudes between 2.1 and 3.0 and epicenters in the W sectors of the volcano. Deformation measurements showed an expansion of 14 ppm during the last week of September. The localized change was found along one of the measured lines inside the crater. Outside the crater there were no significant changes. Radial inclination at the summit was very low on the two precision leveling lines. The dry tilt meters also lacked significant changes.
Table 5. Four located Poás earthquakes that occurred in the swarm on 23 September 1994. Courtesy of OVSICORI-UNA.
| Date |
Time (UTC) |
Magnitude |
Depth (km) |
Distance from the active crater |
| 23 Sep 1994 |
0126 |
3.0 |
5.4 |
2.8 km WNW |
| 23 Sep 1994 |
0134 |
2.5 |
6.7 |
2.5 km W |
| 23 Sep 1994 |
0138 |
2.4 |
7.5 |
7.5 km NW |
| 23 Sep 1994 |
0220 |
2.1 |
4.0 |
7 km SW |
Acidic atmospheric conditions were discussed for 1986-90 in an unpublished report by Fernandez and Barquero (1990). During this interval the active crater lake at Poás progressively rose in temperature from ~30 to 90°C. Compared to 1986, the lake's water also increased in dissolved sulfur (2- to 3.5-fold), chlorine (7-fold), and fluorine (~10-fold). Prevailing winds generally carried acidic gases S and SW. Measurements of total wet and dry deposition taken at both the crater rim overlook (El Mirador) and 2.3 km SW of the crater during 1986-90 indicated pH values as low as 3.5-4.1. Acidic rain disrupted strawberry, dairy, and coffee farms (2 x 10⁴ m2 severely damaged), affecting 681 farmers. It also disturbed the trees in several reforestation projects, where losses reached 95%. Farm equipment rusted rapidly. At the time of the report, studies failed to clearly demonstrate health problems, although local inhabitants complained of respiratory, skin, and eye irritations. The National Park and villages adjacent to Poás sustained damage, especially to building roofs. Areas significantly affected by the acidic atmospheric conditions reached over 24.5 ha (245,000 m2). The report cited four references to Poás work, including a paper by Brown and others (1989) proposing that ". . . crater-lake and fumarole discharge variations may well occur before significant signals on seismic and tilt networks are detected."
They further stated that ". . . maintained power output and/or low water supply could culminate in a dramatic change in activity, possibly with devastating results." A final note makes this case by example: "After continued evaporation through the dry season, Poás lake disappeared in late April 1989 accompanied by several days of continuous phreatic geysering. A dry steam/'ash' plume . . . was erupted to 200 m height on 25 April; from 30 April to early May a continuous plume reached 2 km in height with fallout over 200 km2."
References. Brown, G., Rymer, H., Dowden, J., Kapadia, P., Stevenson, D., Barquero, J., and Morales, L.D., 1989, Energy budget analysis for Poás crater lake: implications for predicting volcanic activity: Nature, v. 339, no. 6223, p. 370-72.
Fernandez, E., and Barquero, J., 1990, Erupciones de gases y sus consecuencias en el volcan Poás, Costa Rica [Eruption of gases and their consequences at Poás volcano], Costa Rica: Observatorio Vulcanologico y Sismologico de Costa Rica, Univ Nacional, Heredia, Costa Rica, 4 p.
Geologic Background. The broad vegetated edifice of Poás, one of the most active volcanoes of Costa Rica, contains three craters along a N-S line. The frequently visited multi-hued summit crater lakes of the basaltic-to-dacitic volcano are easily accessible by vehicle from the nearby capital city of San José. A N-S-trending fissure cutting the complex stratovolcano extends to the lower N flank, where it has produced the Congo stratovolcano and several lake-filled maars. The southernmost of the two summit crater lakes, Botos, last erupted about 7,500 years ago. The more prominent geothermally heated northern lake, Laguna Caliente, is one of the world's most acidic natural lakes, with a pH of near zero. It has been the site of frequent phreatic and phreatomagmatic eruptions since an eruption was reported in 1828. Eruptions often include geyser-like ejections of crater-lake water.
Information Contacts: E. Fernandez, J. Barquero, V. Barboza, R. Van der Laat, T. Marino, F. de Obaldia, and L. Carvajal, OVSICORI-UNA; G. Soto, W. Taylor, F. Arias, G. Alvarado, and R. Barquero, ICE; M. Mora, UCR.
Rabaul (Papua New Guinea) — September 1994 Cite this Report
Rabaul
Papua New Guinea
4.2459°S, 152.1937°E; summit elev. 688 m
All times are local (unless otherwise noted)
Tavurvur remains active; details of September eruptions
New eruptions began on 19 September 1994, ending a repose period of ~51 years. Following the pattern of the last two eruptive episodes (1878 and 1937-43), there were almost simultaneous outbursts on opposite sides of the caldera as the intracaldera cones Tavurvur and Vulcan began erupting at 0605 and 0717, respectively. The eruption at Vulcan was the more powerful and included a brief phase of strong Plinian activity soon after its onset. Vulcan's eruption ended on 2 October. The eruption at Tavurvur, after peaking during the first five days of activity, exhibited a slow decline. However, moderate to weak activity continued as of 28 October. By mid-late October, eight new 3-component seismic stations and two tilt stations had been installed by volcanologists at RVO with the assistance of USGS scientists. Many stations had been damaged or destroyed by tsunami, vandalism, or heavy ashfall during the eruption. The following report is from RVO.
Precursory activity. "A levelling survey along the usual route from the Rabaul Town area to Matupit Island was completed on 15 September. Compared with the previous survey on 19 July (19:07), the greatest change was uplift of ~25 mm at the S extremity of the island. This rate of uplift is similar to the long-term rate observed during 1973-83, prior to the 'Rabaul Seismo-Deformational Crisis Period' of 1983-85.
"For most of the time in the preceeding few months, seismicity gave little or no warning of the coming eruptions. The normal (high-frequency) seismicity on the caldera ring-fault was at a low level. Some low-frequency events were recorded, but their origin and significance are not yet known.
"The eruptions were immediately preceded by 27 hours of vigorous and fluctuating seismicity, which was initiated by two caldera earthquakes (max ML 5.1) at 0251 on 18 September. These earthquakes were located in the E part of the caldera seismic zone, near Tavurvur, at a depth of 1.2 km. The earthquakes were felt very strongly throughout the town and a small localized tsunami was generated. Seismicity over the following four hours took place near Vulcan and showed a general decline. Through this period, the pattern of seismicity appeared to be similar to many previous swarms of earthquakes on the caldera fault system. During the next ten hours (0600-1600), earthquakes continued at a steady rate, still concentrated near Vulcan. From about 1600 on 18 September, seismicity increased and reached a peak at about 0200 on 19 September; at this time, earthquakes were felt every few minutes. Seismicity then showed a slow decrease. Earthquake epicentres were concentrated in the Vulcan area until about 0430, when the focus shifted to Tavurvur.
"Soon after dawn on 19 September (0600), it was clear that an eruption was imminent because offshore areas had emerged. The most obvious uplift was at Vulcan, where a tide gauge was almost out of the water, indicating an estimated uplift of 6 m. The W and S coasts of Matupit Island had also been raised and the S shoreline was shifted ~70 m S.
Evacuation. "In consideration of the increased seismicity after about 1600 on 18 September, RVO recommended the declaration of a Stage 2 alert (eruption expected within weeks to months) around 1800. This was subsequently issued at 1815. Throughout the late afternoon a voluntary evacuation of the town had developed, but the release of the Stage 2 alert accelerated the process. At midnight, RVO advised the Provincial Disaster Committee that an eruption was imminent. By this time, people had congregated in Queen Elizabeth Park in the centre of Rabaul Town. Transport was mobilised, and during the next few hours people were ferried from the town area to beyond the caldera rim. RVO recommended a Stage 3 alert (eruption expected within days to weeks) in the early hours of the 19th, but the Disaster Committee refrained from a declaration because the evacuation appeared to be proceeding well. It was feared that announcement of a higher stage of alert might be counter-productive. The evacuation went smoothly and by around 0700 on the 19th, the town and high-risk areas were virtually deserted.
Outbreak of eruptions. "An aerial inspection had been arranged for early morning on the 19th. While waiting on the Rabaul airstrip, a small white emission cloud was noticed above the W rim of Tavurvur's summit crater at about 0603. Three minutes later, ash was seen in the emissions which appeared to originate from the SW part of Tavurvur's 1937 crater. The intensity of the emissions was low as billowing, grey, cauliflower-shaped ash clouds rose slowly and with little sound (figure 18). The ash clouds rose only a few hundred metres and were driven towards Rabaul Town by moderate SE winds. At about 0618, the ash plume had reached the S limits of the town. The strength of the eruption remained low over the next hour as darkness descended on Rabaul.
"The eruption of Vulcan commenced at 0717 on 19 September with relatively small explosions on the N flank of the Vulcan 1937 cone. However, activity intensified rapidly, and by 0737 low-density pyroclastic flows were being generated and the eruption column was rising rapidly. Run-out distances of ~2 km were common for these early pyroclastic flows. At 0743, ballistic ejecta were seen landing in the water up to 1 km from the E shore of Vulcan. At about 0745 a phase of very strong activity commenced. Continuous explosions generated a Plinian eruption column that attained a height of ~20 km. The sounds of this activity were of dull thudding, quite a contrast to the sharp, loud reports of electrical discharges around the eruption column. By 0830, Rabaul Town and surrounding areas were enveloped in darkness by the spreading ash canopy. The phase of Plinian activity had ended by about 0830, but strong ash emission continued.
"A number of tsunami were generated, probably by the Vulcan activity. The largest of these rose ~5 m above high water. The SW and W parts of Matupit Island were hit numerous times by tsunami, washing inland as far as several hundred metres. Small boats were carried inland ~60 m at the head of Rabaul Harbour.
Continuing eruptions. "The activity at Tavurvur increased through the 19th and the eruption column was estimated to have reached a maximum height of ~6 km. Only one vent was active. The eruption column was very dense and the moderate SE winds drove the ash plume directly over Rabaul. No pyroclastic flows were generated at Tavurvur. Over the next few days activity at Tavurvur waned slightly. The eruption column was usually ~1-2 km high. The dense dark grey-brown ash clouds fed a plume that continued to blanket Rabaul Town with fine ash.
"At Vulcan, at least four vents were active. The main vent was at the point of the eruption outbreak. Another vent slightly to the N was active briefly. A vent in the crater of the 1937 Vulcan cone and one on its SW flank also were active. Two more phases of Plinian activity took place at Vulcan in the evening of 19 September between about 1830 and 1930. The intensity of this activity was considerably weaker than the first Plinian phase. Pyroclastic flows were formed throughout the first few days of the eruption. The largest of these extended ~3 km. Pumice from Vulcan formed a large raft that covered most of Simpson Harbour.
Sequence of felt earthquakes and decline of eruption. "On 23 September, between about 1850 and 1900, there was a sequence of strongly felt caldera earthquakes. The largest of these had an estimated magnitude of 3.5. Most of the seismic stations had been lost during the first day of the eruption, so it was not possible to locate any of these earthquakes. However, most of them appeared to originate from the SE part of the caldera. These earthquakes may have been due to structural re-adjustment of the caldera to the eruptive removal of significant quantities of magma. On the morning of 24 September, a marked decline was evident in the activity at Vulcan, and a lesser decline was seen at Tavurvur. This may have been connected with the sequence of earthquakes the previous evening. The eruption at Vulcan ended on 2 October, but Tavurvur continued erupting, generating an eruption column 1-2 km high and a plume ~20 km long.
Lava flow at Tavurvur. "A small lava flow was first noticed in the summit crater of Tavurvur on 30 September. The aa lava was emerging from a sub-terminal vent on the W flank of the growing ejecta cone. The flow rate was extremely low as the lava slowly advanced towards the W rim of the summit crater. On 5 October, a new lava lobe was seen overriding the first lobe in the summit crater of Tavurvur. This lava lobe also advanced very slowly and eventually reached the nose of the first lobe. The length of these lobes was ~100 m. Lava continued to be fed into these lobes after they had stopped advancing, causing them to thicken. Eventually, on 8 October, a breakout occurred on the W side of the original lobe. A more fluid black lava emerged, ponding between the earlier lava flows and the W crater rim. On 12 October, following a considerable growth of the body of lava within the crater, lava began spilling over the crater rim and descending Tavurvur's W flank. A second lava breakout from the earlier bulky flows within the crater took place on 14 October. This became the main feeder for the slowly advancing lava flow on the W flank of the cone. It remained active until about 25 October.
Tephra from Vulcan and Tavurvur. "The tephra from Vulcan was pale grey-brown pumice and ash, probably of dacitic composition. In contrast, Tavurvur's tephra was dominated by very fine-grained ash. Accretionary lapilli were abundant throughout both sequences and a number of ash units were extremely hard, apparently having self-cemented on deposition. The base of the Tavurvur sequence was marked by a blue-grey very fine ash that appeared to be rich in sulphides. This material probably originated as a hydrothermal clay on the crater floor. Late in the Tavurvur sequence was a pumiceous unit that may be sub-Plinian. During 8-18 October, strong explosions ejected ballistic material as far as 1.5 km from Tavurvur's summit. Large blocks (to ~1 m size) were found partially buried in the road around the N and E foot of Tavurvur. These ejecta included a mixture of dense glassy lava blocks, porphyritic lava blocks, and pumiceous bombs.
Sulfur dioxide emissions. "SO2 emission rates from Tavurvur were measured in the period from 29 September to 6 October by Stan Williams (Arizona State Univ). Preliminary results indicated a progressive decline from ~30,000 to ~3,000 t/d.
Ground deformation. "Tilt measurements, which started at Matupit Island on 24 September, indicated a large deflation (~930 µrad) of the central part of the caldera compared with pre-eruption values, and a slowly reducing rate of deflation during the eruption. The rate of deflation declined from ~10 to ~2 µrad/day between 24 September and 25 October. Sea-shore levelling measurements, which started in late September, indicated minor subsidence over most of the caldera compared with pre-eruption levels. The greatest subsidence was ~80 cm in the area of Rabaul Airport, between Matupit Island and the town. About 3 m of uplift was recorded at the E shore of Vulcan and slight uplift was recorded at the S end of Matupit Island. Geodetic levelling from outside the caldera, through Rabaul Town, and onto Matupit Island, confirmed these results.
Effects of the eruption. "The official death toll from the eruptions and associated events was five; four of which were due to house roofs collapsing. One person was killed by lightning. Over 50,000 people have been displaced by the eruptions and were in care centres in safe areas of the Gazelle Peninsula as of the end of October.
"The rapid accumulation of ash on Rabaul Town caused collapse of some buildings within a few hours of the onset of the eruptions. Ashfall from Tavurvur in the first few days of the eruption caused widespread damage in Rabaul Town; virtually every building in the S part of town collapsed. Serious structural damage was sustained by most buildings in the ashfall zone within 8 km of Tavurvur. All housing in the immediate area of Vulcan (to ~2 km) was destroyed within ~1 hour of the start of the Vulcan eruption by a combination of pyroclastic flows and heavy ashfall.
"Heavy rainfall during the first day and night of the eruption exacerbated the effects of heavy ashfall. Mudflows and floods were widespread in the Rabaul Town area, near Vulcan, and immediately outside the Rabaul Caldera to the NW. The most serious floods were NW of the caldera, where the heavy ashfall caused rapid runoff and eventual deep erosion and migration of stream channels. The obliteration of rainforest cover around Rabaul will present a serious risk of flash floods and mudflows at times of heavy rainfall. The wet season in Rabaul normally starts in early December.
Satellite imagery. "The westwards-spreading ash plume . . . was clearly visible from Earth-imaging satellites. A wide-angle plume (90°) was seen on a series of Japanese GMS images as a triangular area at 0903 of 19 September, spreading at different wind levels in a fan extending from Rabaul. The N edge of the plume trended NW, and the S edge to the SW, extending across the E Bismarck Sea and moving down the N coast of New Britain.
"A similar spreading pattern was seen on images (IR channel 4) from the NOAA-12 polar orbiting satellite (19:08). The SE margin of the cloud at 1800 on 19 September was seen curving S over the Solomon Sea and SE New Guinea, with the NE margin extending past Manus Island. All parts of Papua New Guinea to the W of these margins were covered by the eruption cloud. The strongly sheared cloud seen on subsequent images was being driven S and then E by high-level winds towards the Fiji region.
"AVHRR imagery from the Nimbus-7 satellite showed similar ash-cloud dispersal patterns. However, computation of the temperature differences recorded between AVHRR IR channels 4 and 5 at 1905 on 19 September and 0747 the next day yielded unexplained patterns in which negative temperature differences (T4-T5), thought to be indicative of ash-bearing clouds, were restricted to 1° of latitude W of Rabaul (F. Prata, pers. comm. to RVO). In addition, the SO2 signature seen on TOMS images at 1520 on the 20th and 1503 on the 21st (19:08) were restricted to the E corner of the Bismarck Sea W of Rabaul, or over the general Rabaul area. Both of these aspects of the satellite imagery require further consideration and study."
Jim Lynch (NOAA Synoptic Analysis Branch) provided the following satellite interpretation. NOAA and GMS satellite imagery clearly depicted the volcanic plume during the first three days of the eruption (19-22 September). The size and shape of the plume during the first 18 hours is shown on figure 19. By correlating plume drift with available wind data, the maximum height of the original plume was estimated at 21-30 km altitude, well into the stratosphere. The eruption maintained the plume to this altitude for ~12 hours before tapering off to 12-18 km. After the first 56 hours of continuous activity there was apparently a 6-hour respite, after which the eruption resumed at a moderate intensity, generating a plume to 21 km) blew W and WNW toward Borneo and Southeast Asia; however, the plume became too diffuse to track beyond 1,300 km from the volcano. The upper tropospheric plume (12-18 km) tracked SW, then S, and finally SE for ~1,000 km around an upper-level ridge before it became too diffuse to track with standard infrared imagery. The denser, more opaque portion of the plume remained within ~400 km of the volcano. Analyses of visible, infrared, and multispectral imagery from NOAA-12 and GMS satellites definitively depicted an ash plume only within 1,000 km of the volcano. Analysis of TOMS data revealed a relatively small amount of SO2 (80 kt) close to the volcano (19:08). The fact that a dense plume of ash and aerosols did not remain in the upper atmosphere suggests that the ash plume was composed mostly of large particulates that fell out of the atmosphere near and just downwind from the volcano.
Geologic Background. The low-lying Rabaul caldera on the tip of the Gazelle Peninsula at the NE end of New Britain forms a broad sheltered harbor utilized by what was the island's largest city prior to a major eruption in 1994. The outer flanks of the asymmetrical shield volcano are formed by thick pyroclastic-flow deposits. The 8 x 14 km caldera is widely breached on the east, where its floor is flooded by Blanche Bay and was formed about 1,400 years ago. An earlier caldera-forming eruption about 7,100 years ago is thought to have originated from Tavui caldera, offshore to the north. Three small stratovolcanoes lie outside the N and NE caldera rims. Post-caldera eruptions built basaltic-to-dacitic pyroclastic cones on the caldera floor near the NE and W caldera walls. Several of these, including Vulcan cone, which was formed during a large eruption in 1878, have produced major explosive activity during historical time. A powerful explosive eruption in 1994 occurred simultaneously from Vulcan and Tavurvur volcanoes and forced the temporary abandonment of Rabaul city.
Information Contacts: C. McKee, with contributions fromRVO Staff and R. Johnson, RVO; J. Lynch, SAB; D. Dzurisin and C. Miller, CVO.
Rincon de la Vieja (Costa Rica) — September 1994 Cite this Report
Rincon de la Vieja
Costa Rica
10.83°N, 85.324°W; summit elev. 1916 m
All times are local (unless otherwise noted)
Vigorous fumarolic activity
Fumarolic activity in the main crater remained vigorous during August and September. Preliminary processing of seismicity recorded by ICE with a portable digital station 2.2 km S of the crater during fieldwork in late August indicated several hundred low-frequency earthquakes beneath the crater, and background tremor-like activity. The preliminary interpretation is that the low-frequency seismicity is caused by hydrothermal circulation among a shallow magma body, aquifers, and the lake system. The OVSICORI-UNA seimic station (5 km SW of the active crater) registered 15 high-frequency low-magnitude events during September.
From the village of México (40 km NE), early morning observations during late September and early October by an ICE geologist revealed a steam-rich gas column rising up to 1 km above the crater. This is higher than the 300-400 m estimated in March.
Geologic Background. Rincón de la Vieja, the largest volcano in NW Costa Rica, is a remote volcanic complex in the Guanacaste Range. The volcano consists of an elongated, arcuate NW-SE-trending ridge constructed within the 15-km-wide early Pleistocene Guachipelín caldera, whose rim is exposed on the south side. Sometimes known as the "Colossus of Guanacaste," it has an estimated volume of 130 km3 and contains at least nine major eruptive centers. Activity has migrated to the SE, where the youngest-looking craters are located. The twin cone of Santa María volcano, the highest peak of the complex, is located at the eastern end of a smaller, 5-km-wide caldera and has a 500-m-wide crater. A Plinian eruption producing the 0.25 km3 Río Blanca tephra about 3,500 years ago was the last major magmatic eruption. All subsequent eruptions, including numerous historical eruptions possibly dating back to the 16th century, have been from the prominent active crater containing a 500-m-wide acid lake located ENE of Von Seebach crater.
Information Contacts: E. Fernandez, J. Barquero, V. Barboza, R. Van der Laat, T. Marino, F. de Obaldia, and L. Carvajal, OVSICORI; G. Soto, W. Taylor, F. Arias, G. Alvarado, and R. Barquero, ICE; Mauricio Mora, Univ. de Costa Rica.
Ruapehu (New Zealand) — September 1994 Cite this Report
Ruapehu
New Zealand
39.28°S, 175.57°E; summit elev. 2797 m
All times are local (unless otherwise noted)
Cooling trend of crater lake reverses in late August
Crater Lake has continued cooling since a minor heating event in early June, which occurred without eruptions. Observations through late August indicated a possible reversal of this cooling trend: minor convection, slightly enhanced acoustic signals, and an increase in volcanic tremor.
On 12 August the crater lake was pale gray with an indistinct slick over the central vent. The N vent area was not observed. Snow was present almost to the water's edge with no evidence of surging. Lake temperature at Logger Point was 16°C on 12 August. The battery for the ARGOS temperature logger was replaced on 12 August and a lake temperature of 18°C was recorded. The lake had a similar appearance on 27 August, but there was weak upwelling in the N vent area. Rafts of yellow sulfur were stranded on the shoreline. Lake temperature at Outlet was 17°C. In late August, ARGOS temperatures began displaying significant diurnal variation, and were not much higher than at Outlet. This may indicate that either the sensor had drifted closer to the surface or that surface temperature variations penetrated deeper into the lake. Outflow was ~25 l/s during both visits.
Volcanic tremor remained at slightly elevated levels during June, and during July the tremor levels varied. The dominant frequency remained at 2 Hz, implying only one source region but a periodic variation in output strength. Tremor levels were low in early August, but rose slightly during the month. Volcano-seismic activity was last reported on 7 July. . . .
Geologic Background. Ruapehu, one of New Zealand's most active volcanoes, is a complex stratovolcano constructed during at least four cone-building episodes dating back to about 200,000 years ago. The dominantly andesitic 110 km3 volcanic massif is elongated in a NNE-SSW direction and surrounded by another 100 km3 ring plain of volcaniclastic debris, including the NW-flank Murimoto debris-avalanche deposit. A series of subplinian eruptions took place between about 22,600 and 10,000 years ago, but pyroclastic flows have been infrequent. The broad summait area and flank contain at least six vents active during the Holocene. Frequent mild-to-moderate explosive eruptions have been recorded from the Te Wai a-Moe (Crater Lake) vent, and tephra characteristics suggest that the crater lake may have formed as recently as 3,000 years ago. Lahars resulting from phreatic eruptions at the summit crater lake are a hazard to a ski area on the upper flanks and lower river valleys.
Information Contacts: P. Otway, IGNS Wairakei.
San Cristobal (Nicaragua) — September 1994 Cite this Report
San Cristobal
Nicaragua
12.702°N, 87.004°W; summit elev. 1745 m
All times are local (unless otherwise noted)
Increased seismicity during March-July declines in August
The number of high-frequency seismic events increased from 46 in March to 897 in July. The number decreased again in August and September, but there were large tremors. For an unspecified time interval prior to 21 August the gas plume extended several kilometers from the volcano.
Geologic Background. The San Cristóbal volcanic complex, consisting of five principal volcanic edifices, forms the NW end of the Marrabios Range. The symmetrical 1745-m-high youngest cone, named San Cristóbal (also known as El Viejo), is Nicaragua's highest volcano and is capped by a 500 x 600 m wide crater. El Chonco, with several flank lava domes, is located 4 km W of San Cristóbal; it and the eroded Moyotepe volcano, 4 km NE of San Cristóbal, are of Pleistocene age. Volcán Casita, containing an elongated summit crater, lies immediately east of San Cristóbal and was the site of a catastrophic landslide and lahar in 1998. The Plio-Pleistocene La Pelona caldera is located at the eastern end of the complex. Historical eruptions from San Cristóbal, consisting of small-to-moderate explosive activity, have been reported since the 16th century. Some other 16th-century eruptions attributed to Casita volcano are uncertain and may pertain to other Marrabios Range volcanoes.
Information Contacts: H. Taleno, L. Urbina, C. Lugo, and O. Canales, INETER.
Stromboli (Italy) — September 1994 Cite this Report
Stromboli
Italy
38.789°N, 15.213°E; summit elev. 924 m
All times are local (unless otherwise noted)
Intense activity from ten vent locations
Extraordinarily intense activity was observed 21-22 August during an ascent and 8 hours on the summit (Pizzo sopra la Fossa). Significant morphologic changes had taken place in the crater area since March 1994 (19:03). Due to the vigorous activity, the craters could not be approached; however, the position and shape of eruptive vents were visible due to the filling of the craters. During the observation period, 10 boccas produced eruptions (compared with 4 in March), most of which were generally clustered and showed sympathetic to simultaneous activity. There were rarely any 10-minute intervals without eruptions, and for periods of up to several hours there was continuous lava fountaining from up to 3 vents at the same time. There was no regularity in the succession, size, or timing of the eruptions. Crater 2 was inactive.
Crater 1, the NE-most active crater, had 6 active boccas, most of which had formed spatter cones. None of these cones had been present during the crater visits in March; during the present visit, however, Crater 1 was filled almost to its rim with cones and erupted pyroclastics. Growth of these spatter cones since March had been much more vigorous than the formation of the earlier cones (1986-93), which were destroyed by explosions in October 1993. Only 5 months before this visit, Crater 1 had been a deep (>60 m) chasm, with no indication of incipient cones. The new cones were, after only 5 months of growth, larger than the pre-October 1993 cones.
The northernmost two vents, 1A and 1B, formed a broad, flat cone ~5 m high that displayed continuous incandescence. Vent 1A formed a crater 5-10 m wide on top of the cone and was the site of frequent brief lava fountains, but also had periods of quasi-continuous lava jetting and spraying. The focus of the explosions was apparently very close to the surface judging from the broad angle of the jets that sprayed large clumps of lava over a wide area, thus contributing to the broad, flat shape of the cone. The largest fountains from 1A rose higher than Pizzo sopra la Fossa, maybe to heights of 250 m. Vent 1B on the NE flank only became active towards the closing stages of the largest eruptions of 1A, ejecting a narrow fountain obliquely NE.
A cluster of vents was present in the central part of Crater 1, the most active among them (2A) was located on top of a tall, steep, spatter cone about 20-25 m high. Vent 2A (diameter <=3 m) was the site of activity ranging from continuous spattering to vigorous, long-lasting fountains that reached heights >250 m. There were at least four periods of continuous and vigorous fountaining, at 1930-2000, 2300-2400 (21 August), 0100-0200, and 0700-0800 (22 August), spraying rapid successions of lava 100 m above the vent and producing a continuous loud roaring sound. All fountains from 2A were vertical and relatively narrow. Frequently the entire cone was covered by cascading spatter forming small, rootless flows. Towards the morning of 22 August, the upper ~3 m of the cone was destroyed by vigorous gas emissions and explosive fountaining. Vent 2B, on the SE flank of cone 2A, was somewhat wider (<=5 m) and had formed a low, flat conelet. Its activity was restricted to minor oblique ejections of spatter towards the E that always preceded major activity from cone 2A. A very small incandescent vent (2C) was present on the S flank of 2A; it did not eject any solid material.
In the SW sector of Crater 1, two similarly shaped spatter cones (3A & 3B) were each ~10 m high. They were at the site of the twin boccas of March (labeled ##4 at that time). The activity of these boccas was stupendously symmetrical, producing a pair of equally shaped narrow, tall (> 100 m) vertical fountains of equal height, initially of bluish burning gas followed by the ejection of lava fragments. Magmatic eruptions lasted up to 15 seconds and were accompanied by very loud crashing noises.
Crater 3, largely filled with new pyroclastic material, had two principal eruptive sites that had not developed into cones due to the wide dispersal of ejecta beyond the crater. Vent 1 lay in the NE part of Crater 3, at the site of the pit containing the active lava pond 5 months earlier. The vent was very small (<=3 m diameter) and had built a low mound of very large agglutinated bombs to above the almost level surface of pyroclastics filling the crater. Activity from this bocca was highly irregular, with repose periods of >30 minutes, and continuous fountaining episodes up to 60 minutes long. Larger fountains every 10-45 minutes sprayed incandescent tephra up to 150 m high. During periods of continuous fountaining, the focus of the explosions migrated towards the surface, as evidenced by the increasingly wide angle of the fountains. The vent area was covered by a continuous sheet of incandescent spatter, but no lava outflow took place.
The most impressive eruptions took place from a cluster of three closely spaced, continuously incandescent vents (2) at the SW end of Crater 3, probably corresponding to vents 3 and 4 in March (19:03). Eruptions began instantaneously and sent very broad jets to heights of up to 300 m, covering an area far beyond the crater rim. During daylight, some of these eruptions produced spectacular plumes that rose up to 500 m above the vents (350 m above the summit). The eruptions made little noise, but sometimes produced heat waves that could be intensely felt on Pizzo sopra la Fossa. At times, two eruptions occurred within a 5-minute period, whereas others were separated by up to 60 minutes.
During the week preceding and 10 days after the visit, occasional large ash puffs (up to 350-400 m above the summit) were seen from neighboring islands, and frequent lava fountains were seen at night from N Lipari Island (26 August) and Alicudi Island (30-31 August), indicating that Stromboli was in a state of increased activity at least from mid-August until the end of the month.
Geologic Background. Spectacular incandescent nighttime explosions at Stromboli have long attracted visitors to the "Lighthouse of the Mediterranean" in the NE Aeolian Islands. This volcano has lent its name to the frequent mild explosive activity that has characterized its eruptions throughout much of historical time. The small island is the emergent summit of a volcano that grew in two main eruptive cycles, the last of which formed the western portion of the island. The Neostromboli eruptive period took place between about 13,000 and 5,000 years ago. The active summit vents are located at the head of the Sciara del Fuoco, a prominent scarp that formed about 5,000 years ago due to a series of slope failures which extends to below sea level. The modern volcano has been constructed within this scarp, which funnels pyroclastic ejecta and lava flows to the NW. Essentially continuous mild Strombolian explosions, sometimes accompanied by lava flows, have been recorded for more than a millennium.
Information Contacts: G. Giuntoli and B. Behncke, GEOMAR, Kiel, Germany.
Telica (Nicaragua) — September 1994 Cite this Report
Telica
Nicaragua
12.606°N, 86.84°W; summit elev. 1036 m
All times are local (unless otherwise noted)
Explosion followed by decreased seismicity
A phreatic explosion on 12 August followed strong tremor two days earlier. Activity that began on 31 July produced a gas-and-ash column that rose ~800 m above the 1,060-m-high summit; detectable amounts of ash fell as far as ~17 km from the summit source vent (BGVN 19:07). Strong tremor again took place on 28 August. From that time until mid-September, weak tremor and few events of high or low frequency were recorded. Geochemical monitoring revealed decreases in SO2, Cl, and F gases. The most significant morphological change in the inner crater was the joining of crater fumaroles A and B (figure 7).
Geologic Background. Telica, one of Nicaragua's most active volcanoes, has erupted frequently since the beginning of the Spanish era. This volcano group consists of several interlocking cones and vents with a general NW alignment. Sixteenth-century eruptions were reported at symmetrical Santa Clara volcano at the SW end of the group. However, its eroded and breached crater has been covered by forests throughout historical time, and these eruptions may have originated from Telica, whose upper slopes in contrast are unvegetated. The steep-sided cone of Telica is truncated by a 700-m-wide double crater; the southern crater, the source of recent eruptions, is 120 m deep. El Liston, immediately E, has several nested craters. The fumaroles and boiling mudpots of Hervideros de San Jacinto, SE of Telica, form a prominent geothermal area frequented by tourists, and geothermal exploration has occurred nearby.
Information Contacts: H. Taleno, L. Urbina, C. Lugo, and O. Canales, INETER.
Unzendake (Japan) — September 1994 Cite this Report
Unzendake
Japan
32.761°N, 130.299°E; summit elev. 1483 m
All times are local (unless otherwise noted)
Endogenous dome growth slows; erosion of talus slopes
Almost no advancement of the talus slopes took place from September to October. However, small pyroclastic flows and rockfalls occurred to the S during September and to the N during October (figure 76). These collapses resulted in the formation of small horseshoe-shaped craters on the talus slopes. The top of the dome decreased in elevation from 1,490 m in July, to 1,470 m in August, and to 1,460 m by October. The top of the endogenous dome, which was cone-shaped, exhibited a flat morphology by August with gentle depressions in some parts, including the E-W-trending ridges. These morphological changes were accompanied by a decrease in eruption rate to3/day.
Pyroclastic flows caused by lava dome collapse, detected seismically ~1 km WSW of the dome, totaled 128 in September. Most of the pyroclastic flows occurred during 11-13 September, and none took place late in the month. The pyroclastic flows moved SW and SE, reaching the Akamatsu Valley; the longest of the month traveled 2.5 km SE.
On 1 September, 439 microearthquakes beneath the lava dome were registered at a seismic station ~3.6 km SW, but they gradually decreased in number throughout the month to 20/day. The total number of earthquakes for September was 3,260. Crest-line theodolite measurements from the UWS revealed that endogenous growth almost stopped in mid-September. EDM on the N flank by the JMA and GSJ indicated shortening of 10 mm/day during the second half of September.
Geologic Background. The massive Unzendake volcanic complex comprises much of the Shimabara Peninsula east of the city of Nagasaki. An E-W graben, 30-40 km long, extends across the peninsula. Three large stratovolcanoes with complex structures, Kinugasa on the north, Fugen-dake at the east-center, and Kusenbu on the south, form topographic highs on the broad peninsula. Fugendake and Mayuyama volcanoes in the east-central portion of the andesitic-to-dacitic volcanic complex have been active during the Holocene. The Mayuyama lava dome complex, located along the eastern coast west of Shimabara City, formed about 4000 years ago and was the source of a devastating 1792 CE debris avalanche and tsunami. Historical eruptive activity has been restricted to the summit and flanks of Fugendake. The latest activity during 1990-95 formed a lava dome at the summit, accompanied by pyroclastic flows that caused fatalities and damaged populated areas near Shimabara City.
Information Contacts: S. Nakada, Kyushu Univ; JMA.
Veniaminof (United States) — September 1994 Cite this Report
Veniaminof
United States
56.17°N, 159.38°W; summit elev. 2507 m
All times are local (unless otherwise noted)
Intermittent steam-and-ash plumes
During mid-July, observers in Perryville . . . reported a small steam plume over the volcano. Satellite imagery recorded a hot spot at the volcano on 10 August, but no additional reports were received until 12 August, when observers in Perryville saw low-level steam-and-ash emission. Snow on the upper S flank was gray, indicating a light ash cover. Observers in Port Heiden . . . were able to view Veniaminof on several days during 12-19 August, but no steam or ash clouds were visible. On 16 August, a pilot reported a plume, possibly containing small amounts of ash, rising 300 m above the volcano. During 19-26 August, observers in Port Heiden and Perryville could see Veniaminof and reported that no steam or ash clouds were visible.
Observers in Perryville noted a small steam plume over the volcano in late August and occasionally during the first half of September when weather conditions were favorable. Poor weather prevented visual observation of Veniaminof during 16-23 September. Residents of Port Heiden observed steam and ash bursts reaching ~600 m over Veniaminof on 28 September. On that day, AVHRR satellite imagery showed a "hot" spot at the volcano. Residents of Port Heiden reported no activity on 6 October, the one day they could see the volcano. Also, AVHRR satellite imagery showed overcast conditions during 1-7 October.
Geologic Background. Veniaminof, on the Alaska Peninsula, is truncated by a steep-walled, 8 x 11 km, glacier-filled caldera that formed around 3,700 years ago. The caldera rim is up to 520 m high on the north, is deeply notched on the west by Cone Glacier, and is covered by an ice sheet on the south. Post-caldera vents are located along a NW-SE zone bisecting the caldera that extends 55 km from near the Bering Sea coast, across the caldera, and down the Pacific flank. Historical eruptions probably all originated from the westernmost and most prominent of two intra-caldera cones, which rises about 300 m above the surrounding icefield. The other cone is larger, and has a summit crater or caldera that may reach 2.5 km in diameter, but is more subdued and barely rises above the glacier surface.
Information Contacts: AVO.
Whakaari/White Island (New Zealand) — September 1994 Cite this Report
Whakaari/White Island
New Zealand
37.52°S, 177.18°E; summit elev. 294 m
All times are local (unless otherwise noted)
Small eruption in late July ejects mud and blocks
A small eruption from Wade Crater on 28 July ejected mud and ballistic blocks. During a visit on 17 August, the floor of Princess Crater was occupied by a small green pond larger than on 28 June. The view of Wade Crater was restricted for most of the visit, but the gray lake was still present, and a small bench had formed on the E side of the lake. A mudflow deposit S of Wade Crater extended from the talus slope beneath the crater rim for 20-30 m towards The Sag. The deposit was ~20 cm thick, composed of fine mud with some small pebbles, and had a slightly yellow surface with a gray interior. The same deposit was seen on the divide between Wade and Princess craters, but thinned rapidly to the N, and disappeared before reaching TV1 Crater. Recent bombs and impact craters were observed SE of, but not within, the mudflow deposit. Additional bombs and impact craters were present N of TV1 Crater. The mud and block material was probably erupted at the same time from the lake bed of Wade Crater; the mud component was then remobilized and flowed down the talus slope. The blocks N of TV1 are assumed to be associated with the same eruption that formed the mudflow.
Leveling data showed a continuation of the uplift observed during January-June 1994. Total uplift at Peg M was 35 mm since January 1994. The uplift center was >100 m S of Donald Mound, although an area of relative subsidence persisted in the Donald Duck-TV1 Crater area to the N. Crater-wide inflation centered S of Donald Mound was clearly established. Inflation was also occurring N of Donald Mound, previously the most rapidly deflating area, but at a slower rate. The situation in mid-August was a significant reversal of the strong deflationary trend from 1987 to late 1993. These inflationary trends can be modelled as a doublet with a deep (500 m) source and a secondary shallow (200 m) source beneath Donald Mound, similar to the results observed in 1973-74 before the 1976-82 eruption. Volcanic seismicity continued at low levels during July-August compared to the April-June period, although volcanic tremor increased in late August.
Geologic Background. The uninhabited Whakaari/White Island is the 2 x 2.4 km emergent summit of a 16 x 18 km submarine volcano in the Bay of Plenty about 50 km offshore of North Island. The island consists of two overlapping andesitic-to-dacitic stratovolcanoes. The SE side of the crater is open at sea level, with the recent activity centered about 1 km from the shore close to the rear crater wall. Volckner Rocks, sea stacks that are remnants of a lava dome, lie 5 km NW. Descriptions of volcanism since 1826 have included intermittent moderate phreatic, phreatomagmatic, and Strombolian eruptions; activity there also forms a prominent part of Maori legends. The formation of many new vents during the 19th and 20th centuries caused rapid changes in crater floor topography. Collapse of the crater wall in 1914 produced a debris avalanche that buried buildings and workers at a sulfur-mining project. Explosive activity in December 2019 took place while tourists were present, resulting in many fatalities. The official government name Whakaari/White Island is a combination of the full Maori name of Te Puia o Whakaari ("The Dramatic Volcano") and White Island (referencing the constant steam plume) given by Captain James Cook in 1769.
Information Contacts: S. Sherburn, IGNS, Wairakei.