PVMBG reported that after a period of elevated seismicity at Ijen during 12-22 July, the number and magnitude of seismic events began to decrease. Realtime Seismic Amplitude Measurement (RSAM) data showed that the intensity of the seismicity began to decline on 13 July and, although there were fluctuations, seismicity had almost returned to normal levels. Visual observations during 1-12 August indicated that the color of the lake was the usual turquoise green, gas bubbles were not visible, there were fewer sulfur spherules, and white steam was not rising from the surface of the lake. The temperature of the crater lake water was 42.2-43.4 degrees Celsius. Dense white solfatara plumes rose from vents. A sulfur odor was present, but it was not strong. The lake water was 15.3 m below the dam. At 1300 on 13 August the Alert level was lowered to 1 (on a scale of 1-4) and residents, visitors, and miners were advised to not approach the crater rim, go down inside the crater, or stay overnight within 500 m of the crater rim.
Source: Pusat Vulkanologi dan Mitigasi Bencana Geologi (PVMBG, also known as CVGHM)
2012 high seismicity, blasts, and subaqueous emissions; maps of complex
This report first documents earthquakes at or near Kawah Ijen and minor emissions within its crater lake during mid-December 2011 to mid-2012. These earthquakes and emissions were ongoing at press time.
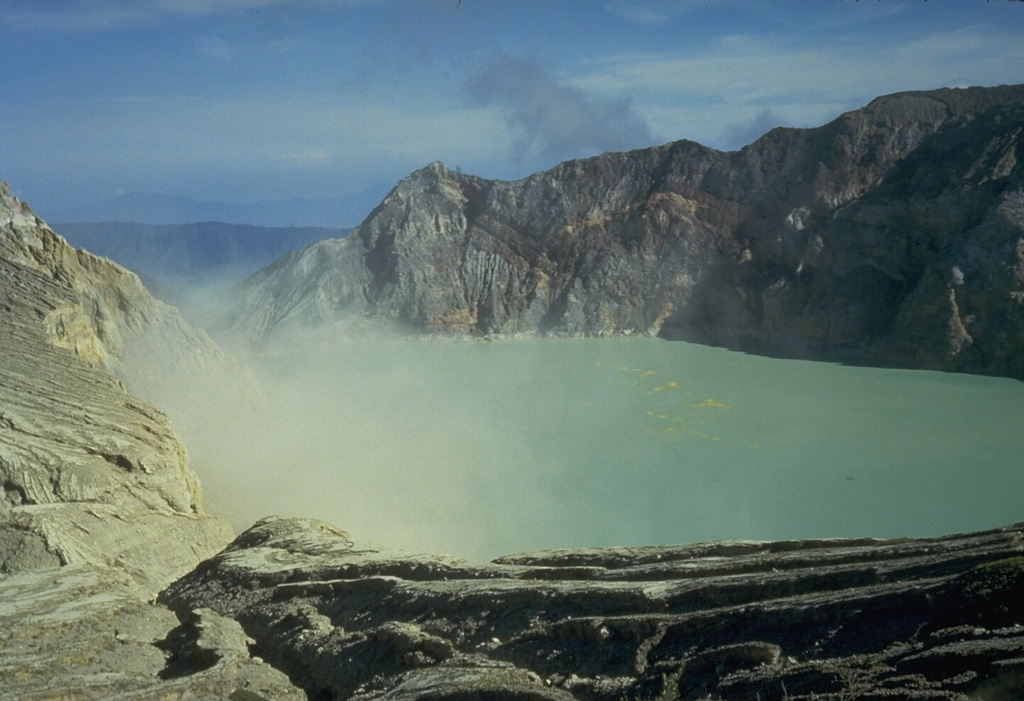
The second and third subsections below present maps and background relating to the Ijen complex. As discussed in earlier reports, Ijen is the name often applied to the larger complex consisting of a large caldera and associated cones. Kawah Ijen is the name of the intracaldera cone that contains a crater with an acid briny lake 700 x 800 m in diameter. The coordinates cited in the header and Summary for this volcano refer to the approximate center of the lake (see photos of the lake in Photo Gallery and figure 4 in BGVN 32:02; Demelle and others, 2000; Takano and others, 2004). Kawah Ijen, the active vent of the complex, is known for hydrothermal and phreatic behavior in its crater lake. During this reporting interval an intrusion appears to have risen to a shallow depth beneath the crater lake. Subaqueous sulfur-bearing emissions seemingly occurred on the lake floor.
The last subsection briefly calls attention to sulfur mining near Kawah Ijen's crater lake. Laborers carry heavy loads of native sulfur across steep terrain as they breathe air rich in volcanic gases. Recent dental studies cited in this subsection compared the teeth and gums of laborers to residents living nearby who endured less exposure to the volcanic gases. They found that the laborers suffered more tooth and gum disorders.
Mid-December 2011 to mid-2012. According to a summary of activity by the Center for Volcanology and Geological Hazard Mitigation (CVGHM) and the USGS Volcano Disaster Assistance Program (VDAP), Ijen volcano has been in a state of heightened unrest centered at Kawah Ijen since May 2011, a time when teams installed, tested, and conducted training on the use of upgraded seismic instrumentation. As previously reported in BGVN 36:12, increased seismicity and fumarole temperatures caused CVGHM to raise the Alert Level from 1 to 2 (on a scale of 1-4) on 15 December 2011.
On 18 December, after observing further increases in both seismicity and degassing, CVGHM established Alert Level 3. In the next few months, scientists documented four periods of significant unrest. They occurred on 20 and 30 December 2011, 4 January 2012, and 2 March 2012.
On 1 January 2012, CVGHM recorded a swarm of earthquakes, raising concerns of renewed pressure in the then-inferred shallow magmatic system. The agency's reports also noted shifts in the rates of recent high-frequency earthquakes (believed to be associated with breaking rocks). Increases occurred in both low-frequency earthquakes and tremor (both believed to be associated with the movement of fluids). At the crater lake, debris (probably native sulfur) seen floating on the surface was judged as likely derived from emissions vented into the ~180-m-deep lake (Takano and others, 2004). Congruent with that interpretation, sulfurous-gas emissions measured just over the lake surface were very high at the time.
On 8 February 2012, after decreases in seismicity, and visual and thermal signs of unrest at Kawah Ijen, CVGHM lowered the Alert Level to 2.
Sharp increases in seismicity prevailed after 2 March 2012, which spurred CVGHM to raise the Alert Level to 3 on 12 March. Elevated crater lake temperatures (up to 43°C at 5 m depth) and gas plumes to 100-200 m above the summit had been reported. These observations led CVGHM and VDAP to suggest an intrusion of magma had reached the point where it caused perturbations to the extensive hydrothermal system in the shallow conduit and crater lake.
During 1-30 April 2012 white plumes from Kawah Ijen rose 100-200 m above the crater, and during 1-11 May diffuse white plumes rose 50-100 m above the crater. During this time and through 13 May, the amplitude and number of earthquakes gradually decreased and the crater lake water temperature decreased by 8°C. On 13 May 2012, CVGHM again lowered the Alert Level to 2. Later, on 24 July 2012, they again raised the Alert Level to 3. Authorities posted a 1.5-km-radius no-entry zone around the lake's center.
Visual and seismic observations published in CVGHM's report of 24 July 2012 indicated repeated hot air-blasts during 1-24 July. The blasts sent plumes rising to 50-100 m over the summit, and registered seismically as follows: 1-7 July, 8 blasts; 8-14 July, 12; 15-21 July, 40; and 22-24 July, 32. During those same intervals volcanic earthquakes occurred between 36 and 273 times per interval, with the maximum occurring during 15-21 July, the same interval as the largest number of air-blasts (but not the highest average rate of air blasts per day, which occurred during 22-24 July). Various other earthquake types were recorded in the same report. Although background seismicity typically had amplitudes in the range 0.5-5 mm, many of the larger amplitude air-blasts reached 20-40 mm with durations up to 18 seconds.
Maps, hazards, and Ijen's Merapi. The Ijen complex resides at the E end of Java just across the strait from Bali (figure 13, inset map). Kawah Ijen sits at the E end of the complex within the caldera (figure 13, main map).
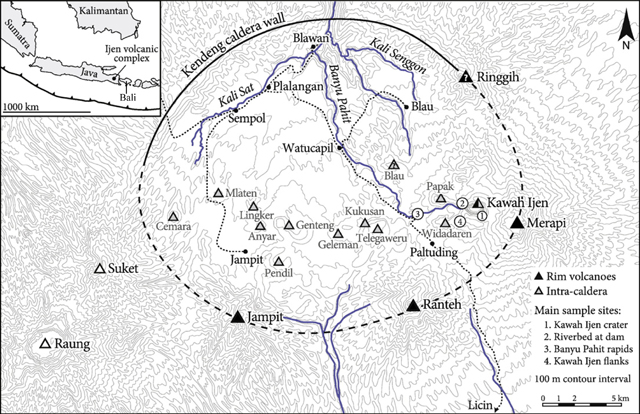 |
Figure 13. (Inset, upper left) Overview map illustrating the Ijen volcanic complex located in Eastern Java, accross the strait from Bali. (Main map) The large sub-circular shape indicates the margin of the Ijen caldera. The active Kawah Ijen cone is in the E part of the caldera. The solid and dashed line segments respectively discriminate between the well constrained N topographic margin ("Kendeng caldera wall") and the inferred S margin. Associated volcanic centers reside both inside the caldera (lightly shaded triangles), and on the rim (solid black triangles). In this interpretation of the caldera, it is ~13 km wide. The caldera drains to the N in a river system that starts at the outflow from the crater lake. The major river is called Banyu Pahit (also spelled Banyuputhih). Raung and Suket cones sit W of and outside the Ijen complex. From van Hinsberg and others (2010). |
Figures 14 and 15 illustrate foreseen hazardous areas and the regional context, including cities around the Ijen complex. The circles shown on both maps are centered around the Kawah Ijen cone and its crater lake.
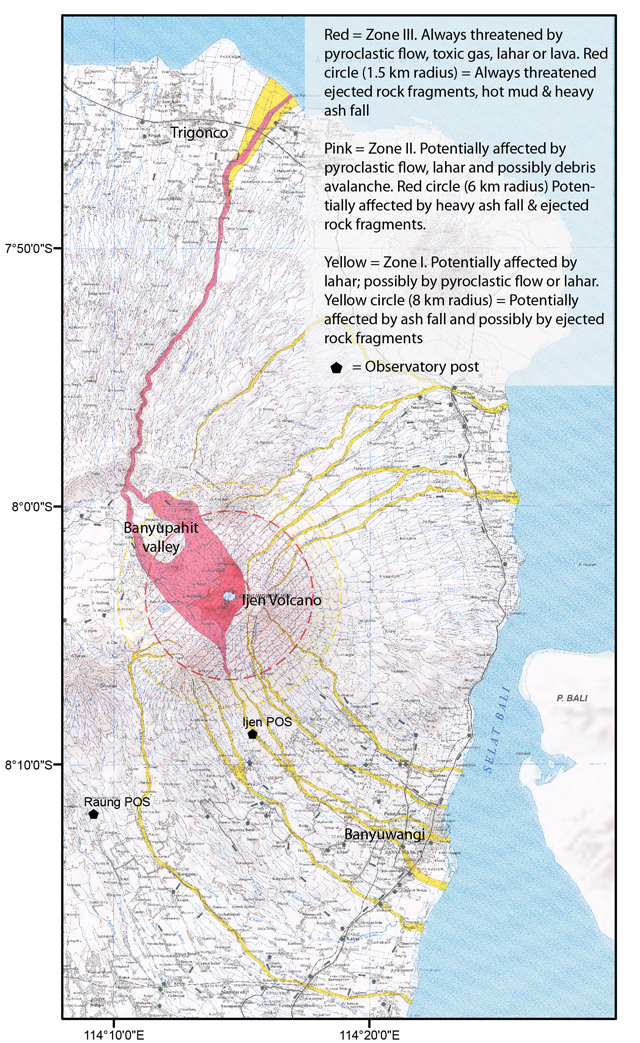 |
Figure 14. Map of the Ijen complex showing hazard zones (Yellow–Zone I; Pink–Zone II, and Red–Zone III; as described in the legend at right). For scale, a small (rather faint) inner red dashed ring around Kawah Ijen crater and the lake it encloses has a diameter of 1.5 km; the pink dashed ring, 6 km, and the outer yellow ring, 8 km. The lake's surface is at 2,200 m elevation. Note location of observation posts. The large urban area on the N coast has a population of 1.5 million and is here labeled Trigonco (but other local names apply, as seen in figure 15). Map extracted from an original prepared by Mulyana, A.R., Effendi, W., Karim, A., and Rukada, T. (2006). Courtesy of CVGHM and VDAP. |
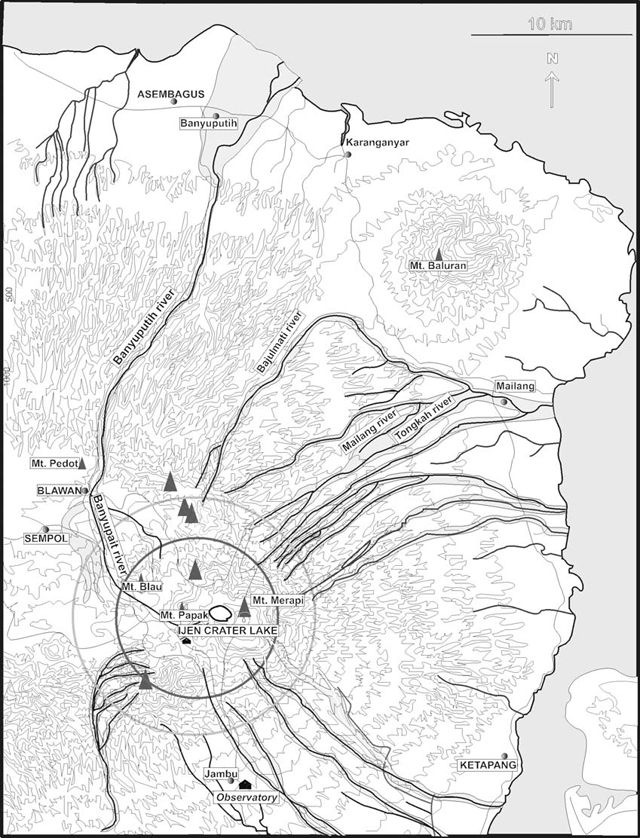 |
Figure 15. A hazard map of the Ijen complex at slightly smaller scale than figure 14, with names of key drainages that could funnel floods, lahars, pyroclastic flows, and lavas. Original source unknown; from van Bergen and others (2000). |
Both figures 14 and 15 emphasize the attendant lahar hazards. Regarding floods and lahars, the crater lake at Kawah Ijen has a volume of ~30 million cubic meters, all or part of which could be expelled in an eruption or breakout due to crater-wall failure, an event that could send acidic brines down one or more of the drainages. About 5,000 people live within 10 km of the lake but farther away, many thousands more would be at risk in the event of large lahars.
The port cities to the N have a population of ~1.5 million and lie near the mouth of a river representing the main drainage from within the caldera, including the controlled outflow from the crater lake (figures 14 and 15).
As seen on a relief map (figure 16), Merapi (on the far E side of the caldera) forms the highest point in the complex, 2,799 m (and reflects the summit elevation value we typically provide for the complex). Merapi is the same name applied to the better-known, regularly erupting volcano in Central Java near the city of Yogyakarta. Another potential confusion is the volcano Marapi on the island of Sumatra.
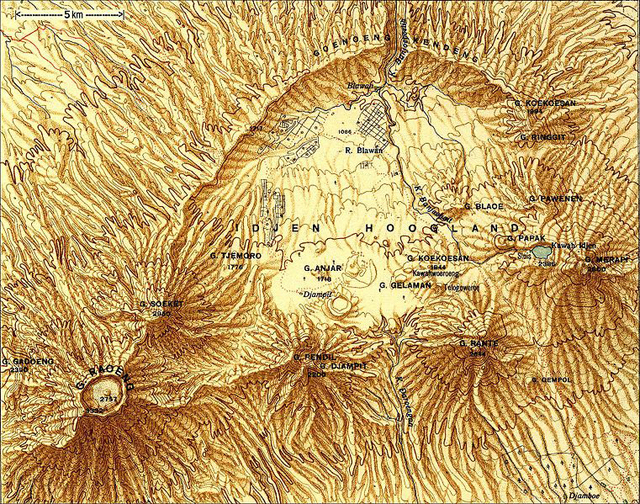 |
Figure 16. Shaded relief map of the Ijen (shown here as the Idjen) volcanic complex published in 1937 ("Topogr. Dienst, 1937"). Kawah Ijen cone, with its associated crater and lake, appears near the E side of the complex on the flank of the taller Merapi cone. Prominent topographic highs are labeled, typically preceded by the letter G (from the word Gunung, which means peak or mount in Indonesian). Courtesy of Wikipedia. |
Figure 16 shows the Kendeng mountains defining the caldera's arcuate topographic margin bounding the N (with elevations up to 1,559 m). The lowest point of the caldera's N rim (~850 m) occurs near Blawan village at the breach in the caldera wall. Starting at the SE, the major cones on or near the S margin (on this map) are Merapi (2,799 m, and on its flanks, Kawah Ijen at 2,386 m), Rante, and the closely spaced Pendil Djampit.
Just N of Pendil Djampit lies a fault with offset down towards the caldera (figure 17). It trends NW and curves to the N, helping to establish the path of the inferred SW caldera margin (figure 13).
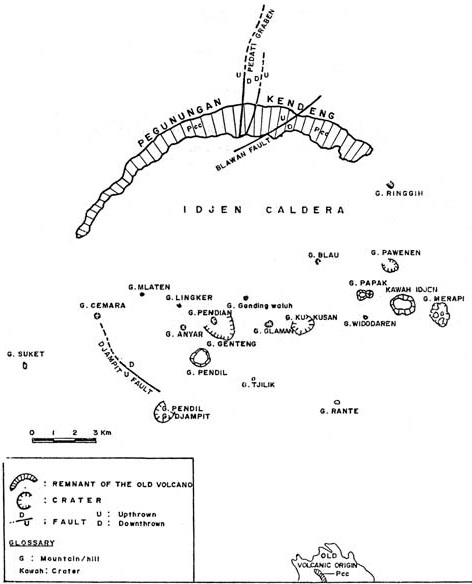 |
Figure 17. Sketch map of Ijen showing several faults and the morphology of the string of eruptive centers strung E to W across the caldera floor. From van Bergen and others (2000). |
A separate volcano in the GVP database, Raung (Raoeng) stratovolcano (3,332 m), forms a distant topographic feature well to the W of the flat caldera floor and SW boundary (figures 13, 16, and 17). As here defined, Raung includes two other remote cones as subfeatures. One is the cone located to Raung's NE, Soeket (Suket) stratovolcano (2,950 m). Both Suket and Raung lie along the western topographic divide for the drainage basin that feeds into the Ijen complex.
Model of the crater-lake system. Given the recent concerns about activity in Kawah Ijen's crater lake, a simple model of the shallow crust in this area provides a way to help visualize conditions and processes in the subsurface. Figure 18 shows the general situation as put forth in a simple sketch by Alain Bernard (van Bergen and others, 2000).
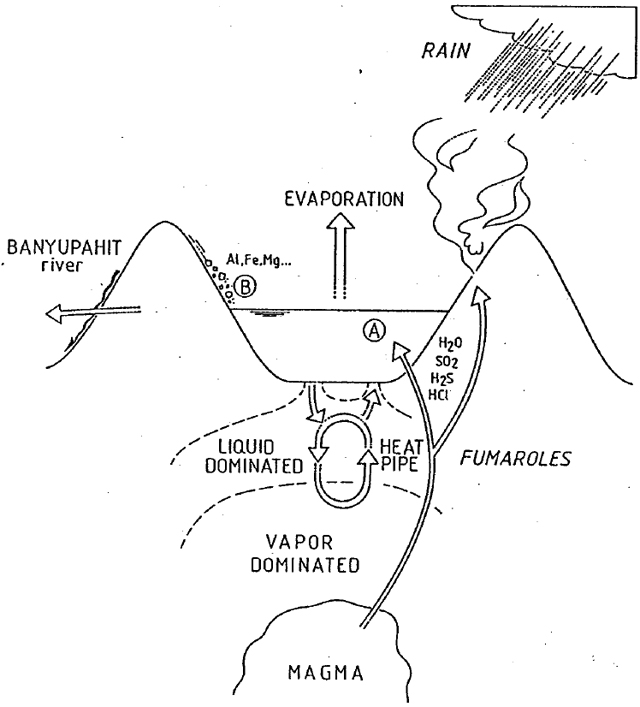 |
Figure 18. A simplified model of the environment and subsurface associated with Kawah Ijen's crater lake. This illustrates some of the factors associated with the lake's chemistry, including rainfall, runoff, surface-rock weathering, and the interconnected hydrothermal, geochemical, and magmatic systems. Taken from van Bergen and others (2000). |
van Bergen and others (2000) made the following remarks: "The lake chemistry is determined by dissolution of magmatic volatiles, fluid-rock interaction, evaporation of the lake water, dilution by meteoric water and recycling of lake water through seepage into the subsurface hydrothermal system. The lake acts as [a] chemical condenser for volatiles and as a calorimeter trapping heat supplied by a shallow magmatic reservoir. Magmatic volatiles can be supplied to the crater lake system by direct injection of magmatic vapours (SO2, H2S, HCl, and HF) via subaqueous fumaroles or via hot brines entering at the lake bottom."
van Hinsberg and others (2010) stated the following: "The crater lake of Kawah Ijen volcano represents the largest body of natural hyperacidic brine in the world (Delmelle and Bernard, 1994) and has been present since at least 1789 (cf. Bosch, 1858). It is characterised by a singularly high dissolved element load (>100 g/L) and very low pH. Fluids from the crater lake seep through [Kawah Ijen's] western flank to form the acid Banyu Pahit river, the water of which is eventually used for irrigation 40 km downstream [to the N] of the lake in the coastal plain of Asambagus."
Sulfur mining. A strongly active solfatara field (fumaroles that are characteristically sulfurous) is present in the SE part of Kawah Ijen's crater near the lakeshore, where sulfur-mining activities have existed for many decades (see figure 8 in BGVN 32:09). Local workers channel some of the fumarolic gases and molten condensates through pipes and out onto the ground. Once the liquid cools and hardens, workers break the solid sulfur into large pieces and load it into baskets for manual transport out of the crater. According to Wikipedia, miners carry loads of sulfur ore blocks ranging from 75 to 90 kg up a steep trail to the crater rim and then 3 km down the mountain to a weighing station. That and many other web sites show photos of the mining process. Among the more recent photos of the scene are those by Oliver Grunewald (2010) on the 'boston.com' web site. He points out that few of the miners possess gas masks.
Two dental studies of miners concluded that they had both higher incidence of dental erosion to the enamel on their teeth (Pranani and Wibisono, 2008) and the gum disease gingivitis (Anitasari and Wibisono, 2008). Both studies attribute these problems to exposure to sulfuric acid fumes. The studies were small (30 miners) and for comparison (control groups) used similar numbers of residents who lived around the mine but did not work as miners.
References. Anitasari, S. and Wibisono, G., 2008, Relationship between the length of sulphuric acid fumes exposure and the grade of gingivitis, Studies on the Sulphur Miners at Mount Ijen Banyuwangi East Java, Fakultas Kedokteran, Disusun oleh:NIM: G2A004170, Fakultas Kedokteran, Universitas Diponegoro, Semaran, 18 pp.
Bosch, C.J., 1858. Uitbarstingen der vulkanen Idjin en Raun (Banjoewangi). Tijdschrift voor Indische Taal-, Land- en Volkenkunde, Deel 7, 265–286.
Delmelle, P., Bernard, A., Kusakabe, M., Fischer, T.P., and Takanod, B., 2006, Geochemistry of the magmatic–hydrothermal system of Kawah Ijen volcano, East Java, Indonesia, J. of Volcanology and Geothermal Research, Vol. 97, Issues 1-4, April 2000, pp. 31-53.
Grunewald, O., 2010, Kawah Ijen at night, Updated 8 December 2010, Accessed 7 Sept 2012 (URL: http://www.boston.com/bigpicture/2010/12/kawah_ijen_by_night.html).
Topogr. Dienst, 1937, Atlas van Tropisch Nederland, original reproduced on Wikipedia Commons web site (http://commons.wikipedia.org/wiki/File:Ijen.JPG) entitled 'Ijen', Updated 17 June 2012, Accessed 29 August 2012.
Mulyana, A.R., Effendi, W., Karim, A., and Rukada, T., 2006, [Ijen hazards map, figure 14 (further citation details currently unavailable)].
Pranani, D. and Wibisono, G., 2008, The influence of sulphuric acid fumes exposure on the incidence of dental erosion, Study on sulphuric miner in Mount Ijen, Banyuwangi, East Java, Dyah Pranani, NIM: G2a004055, Fakultas Kedokteran, Universitas Diponegoro Semarang, 18 pp.
Takano, B., Suzuki, K., Sugimori, K., Ohba, T., Fazlullin, S.M., Bernard, A., Sumarti, S., Sukhyar, R., and Hirabayashi, M., 2004, Bathymetric and geochemical investigation of Kawah Ijen Crater Lake, East Java, Indonesia, J. of Volcanology and Geothermal Research, vol. 135, Issue 4, pp. 299–329.
van Bergen, M.J., Bernard, A., Sumarti, S., Sriwana, T., and Sitorus, K., 2000, Crater lakes of Java: Dieng, Kelud and Ijen, Excursion Guidebook, IAVCEI General Assembly, Bali 2000, 43 p.
van Hinsberg, V., Berlo, K., and van Bergen, M.J., 2010, Extreme alteration by hyperacidic brines at Kawah Ijen volcano, East Java, Indonesia: I. Textural and mineralogical imprint, J. of Volcanology and Geothermal Research, Vol. 198, Issues 1–2, pp. 253–263.
Information Contacts: Center of Volcanology and Geological Hazard Mitigation (CVGHM), Jalan Diponegoro 57, Bandung 40122, Indonesia (URL: http://www.vsi.esdm.go.id/); Volcano Disaster Assistance Program (VDAP), US Geological Survey (USGS), 1300 SE Cardinal Court, Bldg. 10, Suite 100, Vancouver, WA 98683.
2024: July
| August
2023: January
2020: January
| May
2018: March
2014: August
2013: August
2012: February
| March
| May
| July
2011: July
| December
2005: June
2004: June
2002: February
2001: February
| April
| May
| July
PVMBG reported that after a period of elevated seismicity at Ijen during 12-22 July, the number and magnitude of seismic events began to decrease. Realtime Seismic Amplitude Measurement (RSAM) data showed that the intensity of the seismicity began to decline on 13 July and, although there were fluctuations, seismicity had almost returned to normal levels. Visual observations during 1-12 August indicated that the color of the lake was the usual turquoise green, gas bubbles were not visible, there were fewer sulfur spherules, and white steam was not rising from the surface of the lake. The temperature of the crater lake water was 42.2-43.4 degrees Celsius. Dense white solfatara plumes rose from vents. A sulfur odor was present, but it was not strong. The lake water was 15.3 m below the dam. At 1300 on 13 August the Alert level was lowered to 1 (on a scale of 1-4) and residents, visitors, and miners were advised to not approach the crater rim, go down inside the crater, or stay overnight within 500 m of the crater rim.
Source: Pusat Vulkanologi dan Mitigasi Bencana Geologi (PVMBG, also known as CVGHM)
Pusat Vulkanologi dan Mitigasi Bencana Geologi (PVMBG) raised the Alert Level at Ijen from 1 to 2 (on a scale of 1-4) at 2200 on 12 July (local time). The recommended exclusion zone radius was expanded from 500 to 1,500 m away from the crater due to a notable increase in seismic energy, as well as an increase in continuous tremor amplitudes. Realtime seismic amplitude measurement (RSAM) analysis has shown that seismic energy has slowly increased since 1 January 2023. However, a significant increase in energy was observed from 1700 through 2100 on 12 July, along with an increase in continuous tremor amplitudes starting at 2110. From 1 June through 12 July there was a decreasing trend in the number of both shallow volcanic earthquakes (Type B/vulkanik dangkal) and deep volcanic earthquakes (Type A/vulkanik dalam), while the number of other types of earthquakes fluctuated normally. On 30 June the surface temperature of the crater lake water was 34°C, which falls within the normal range. Weak to moderate fumarolic activity was observed, characterized by dense white emissions. The color of the water appeared turquoise green, as usual, with no visible gas bubbles on the surface of the lake. The smell of sulfur gas was moderately strong, and sulfur spherules were observed at the edge of the crater lake. White emissions were observed rising 50-100 m above the summit on 10, 12-13, and 16 July, and 50-200 m on 14 July. Emission observations were not reported on 11 or 15 July. Seismicity during 10-16 July included daily gas emission events and continuous tremor, volcanic earthquakes during 13-16 July, and a volcano-tectonic (VT) earthquake on 16 July. PVMBG reminded the public to stay vigilant of the potential for poisonous gases emanating from the crater lake.
Source: Pusat Vulkanologi dan Mitigasi Bencana Geologi (PVMBG, also known as CVGHM)
PVMBG reported that unrest continued at Ijen during 10-17 January. There were 2-30 daily earthquakes indicating emissions and 2-19 daily shallow volcanic earthquakes. One tornillo earthquake was recorded on 10 January. Diffuse white gas plumes were visible rising as high as 400 m above the summit during 10-14 January. The Alert Level remained at 2 (on a scale of 1-4) and residents, visitors, and sulfur miners were advised to not approach the crater within 1.5 km.
Source: Pusat Vulkanologi dan Mitigasi Bencana Geologi (PVMBG, also known as CVGHM)
PVMBG reported that beginning in July 2022 the seismic network at Ijen began detecting increasing numbers of shallow volcanic earthquakes and earthquake signals characteristic of emissions, indicating increasing pressure at shallow depths within the hydrothermal system. The number of shallow volcanic earthquakes again increased on 1 January. The temperature of the crater lake water rose from 16 degrees Celsius in December 2022 to 45.6 degrees Celsius on 5 January 2023. During a field visit on 5 January scientists noted that the color of the lake water was light green, dense white solfatara plumes were visible rising from vents, and the sulfur odor was strong. Increased activity at the volcano is often characterized by a change in the lake water color from green to whitish-green due to the resuspension of disturbed lake-bottom sediments from increased gas emissions. The elevated unrest promoted PVMBG to raise the Alert Level to 2 (on a scale of 1-4) on 7 January. Residents, visitors, and miners were advised to not approach the crater within 1.5 km.
Source: Pusat Vulkanologi dan Mitigasi Bencana Geologi (PVMBG, also known as CVGHM)
PVMBG reported that on 29 May a gas explosion at Ijen generated a plume that rose 250-500 m above the surface of the lake. According to news articles two sulfur miners heard the explosion from under the water at 1230, which created 3-m-high waves in the lake; the miners ran but one tripped and fell into the lake. Search efforts were unsuccessful after three hours and, due to weather conditions and an increased amount of gas in the crater area, had to be suspended.
PVMBG noted that patterns of various types of earthquakes did not indicate increased activity during 17 Janury-29 May. The temperature of the lake water fluctuated between 24.5 and 40.3 degrees Celsius. A lot of rain in the past few months increased the volume of the lake, possibly contributing to a disruption in the system, though these seasonal changes were within normal ranges at the volcano. The Alert Level remained at 1 (on a scale of 1-4), and residents and visitors were advised to not approach the crater rim or descend to the crater floor.
Sources: Pusat Vulkanologi dan Mitigasi Bencana Geologi (PVMBG, also known as CVGHM); Inibaru
PVMBG reported that during 1-18 January white plumes rose 250-400 m above Ijen’s water lake surface and no change in the color of the water was noted. An increase in the number of shallow volcanic earthquakes was detected; continuous tremor emerged on 11 January, peaked on 15 January, and then decreased during 17-18 January. The temperature of the lake water fluctuated, though overall it decreased from 38 degrees Celsius in June 2019 to 20 degrees Celsius on 14 January; the lake water was 46 degrees Celsius during a period of increased activity from February to March 2018. The Alert Level remained at 1 (on a scale of 1-4), and residents and visitors were advised to not approach the crater rim or descend to the crater floor.
Source: Pusat Vulkanologi dan Mitigasi Bencana Geologi (PVMBG, also known as CVGHM)
Based on information from residents of Sempol (8 km W), PVMBG reported that 27 people in Watu Capil village (7 km NW) required medical treatment after exposure to sulfur dioxide gas from Ijen at 2100 on 21 March. The path from Paltuding (SW base) to the top of the crater was closed as a result. During 21-22 March white plumes rose 100-200 m above the summit area; there were no visible changes in the emissions after the incident. PVMBG noted that there had been three occurrences of anomalous gas concentrations during January-March. The Alert Level remained at 1 (on a scale of 1-4), and residents and visitors were advised to not approach the crater rim or crater floor.
Source: Pusat Vulkanologi dan Mitigasi Bencana Geologi (PVMBG, also known as CVGHM)
PVMBG noted that due to decreased volcanic seismicity the Alert Level for Ijen was lowered to 1 (on a scale of 1-4) on 11 August. Residents and visitors were advised to not approach the crater rim or crater floor.
Source: Pusat Vulkanologi dan Mitigasi Bencana Geologi (PVMBG, also known as CVGHM)
CVGHM reported that during 1 July-25 August diffuse white plumes rose 100-150 m above Ijen's crater, the lake water was light green, and seismicity decreased. On 26 August the Alert Level was lowered to 2 (on a scale of 1-4). Visitors, tourists, miners, and hikers were reminded not to approach the crater within 1 km.
Source: Pusat Vulkanologi dan Mitigasi Bencana Geologi (PVMBG, also known as CVGHM)
CVGHM reported that, although weather conditions at Ijen often prevented views of the volcano during 1-24 July, white plumes were occasionally observed rising 50-100 m above the crater. Seismicity indicated unrest, and along with visual observations, prompted CVGHM to raise the Alert Level to 3 (on a scale of 1-4) on 24 July.
Source: Pusat Vulkanologi dan Mitigasi Bencana Geologi (PVMBG, also known as CVGHM)
CVGHM reported that during 1-30 April white plumes from Ijen rose 100-200 m above the crater; during 1-11 May diffuse white plumes rose 50-100 m. From the beginning of April until 13 May the amplitude and number of earthquakes gradually decreased and the crater lake water temperature decreased by eight degrees Celsius. The Alert Level was lowered to 2 (on a scale of 1-4) on 13 May.
Source: Pusat Vulkanologi dan Mitigasi Bencana Geologi (PVMBG, also known as CVGHM)
On 24 March, CVGHM reported that Ijen's lake water chemistry changed during 10 January-17 March, exhibiting a significant increase in carbon dioxide, especially after 5 February, and an increase in acidity. The lake surface temperature increased from 28.8 degrees Celsius on 3 March to 45.1 degrees Celsius on 17 March. The lake water temperature at a depth of 5 m also rose from 42.7 to 44.7 degrees Celsius on 3 and 17 March, respectively. Seismicity increased starting in March. The Alert Level remained at 2 (on a scale of 1-4). [Correction: the Alert Level remained at 3.]
Source: Pusat Vulkanologi dan Mitigasi Bencana Geologi (PVMBG, also known as CVGHM)
CVGHM raised the Alert Level for Ijen from 2 to 3 (on a scale of 1-4) on 12 March because of increased seismicity and visual observations. On 10 March scientists observed some plant damage around the crater lake and a 10-m-wide area of disrupted water on the crater-lake surface.
Source: Pusat Vulkanologi dan Mitigasi Bencana Geologi (PVMBG, also known as CVGHM)
CVGHM lowered the Alert Level for Ijen from 3 to 2 (on a scale of 1-4) on 8 February based on decreased seismicity and visual observations of white plumes rising as high as 300 m above the crater. In addition, a decrease in lake water temperature was measured, which ranged from 42 degrees Celsius on 20 January to 37 degrees on 2 February.
Source: Pusat Vulkanologi dan Mitigasi Bencana Geologi (PVMBG, also known as CVGHM)
CVGHM reported that during 1 October-30 November white plumes from Ijen rose 50-150 m above the crater and lake water temperatures ranged from 26 to 31.6 degrees Celsius. During 1-14 December brownish-white plumes rose 50-200 m above the crater. The lake water temperature was 26.8 and 34.2 degrees Celsius on 8 and 14 December, respectively. Based on increased seismicity, visual observations, and lake water temperature increases, CVGHM raised the Alert Level from 1 to 2 (on a scale of 1-4). During 15-17 December seismicity significantly increased and sulfur dioxide gas emissions around the lake also increased. On 17 December the color of the lake water changed from light green to white. The Alert Level was raised to 3 the next day.
Source: Pusat Vulkanologi dan Mitigasi Bencana Geologi (PVMBG, also known as CVGHM)
The Darwin VAAC reported that on 10 July a pilot observed an ash plume drifting W from Ijen at an altitude of 3.7 km (12,000 ft) a.s.l. [Correction: Later reports from observers indicated that the plume was likely from a nearby forest fire and not from Ijen. Scientists noted that the seismic activity was quiet and that there were no increases in degassing or boiling of the lake.]
Source: Darwin Volcanic Ash Advisory Centre (VAAC)
According to the Darwin VAAC, on 17 June a pilot observed a plume from Ijen at a height of ~6.1 km (20,000 ft) a.s.l. Ash was not visible on satellite imagery.
Source: Darwin Volcanic Ash Advisory Centre (VAAC)
According to a news article, people were prohibited from visiting Ijen due to an increase in activity beginning on 17 June. The chief of the national park was reported as saying, "There have been sulfuric rocks coming out of the edge of the crater and the fluid in it [crater lake] has turned from green to white and it has emitted hot foam. There are also increasing tremors."
Source: Reuters
VSI reported that during 28 January-3 February there was an increase in seismicity at Ijen in comparison to the previous week. In addition to continuous tremor, 2 small explosions were recorded. The volcano remained at Alert Level 2.
Source: Pusat Vulkanologi dan Mitigasi Bencana Geologi (PVMBG, also known as CVGHM)
The Darwin VAAC reported that at 0120 on 15 July sulfur fumes entered the cabin of an aircraft flying from Singapore to Denpasar. At the time, the aircraft was flying at an altitude of ~2.4 km a.s.l. ~15 km SE of Ijen. VSI stated that earlier, during 2-8 July, seismic and explosive activity had increased and the Alert Level had been raised from 1 to 2 (on a scale of 1-4).
Source: Pusat Vulkanologi dan Mitigasi Bencana Geologi (PVMBG, also known as CVGHM)
During 23-29 April seismic activity was higher than normal at Ijen, with a high number of shallow volcanic earthquakes (nine). In addition, one small explosion event and seven tectonic earthquakes were recorded. Visual observations were not possible. The volcano remained at Alert Level 2 (on a scale of 1-4).
Source: Pusat Vulkanologi dan Mitigasi Bencana Geologi (PVMBG, also known as CVGHM)
During 16-23 April there was an increase in the number of shallow volcanic earthquakes (ten) in comparison to the previous week. Seismographs also recorded one deep volcanic, and two tectonic earthquakes. The volcano remained at Alert Level 2 (on a scale of 1-4).
Source: Pusat Vulkanologi dan Mitigasi Bencana Geologi (PVMBG, also known as CVGHM)
Volcanic activity at Ijen during 9-15 April was higher than normal, with a relatively large number (nine) of shallow volcanic earthquakes. Seismographs also recorded ten small explosion events. The volcano remained at Alert Level 2 (on a scale of 1-4).
Source: Pusat Vulkanologi dan Mitigasi Bencana Geologi (PVMBG, also known as CVGHM)
Seismic activity at Ijen was high during 2-9 April. Five episodes of tremor were reported. The number of shallow volcanic earthquakes decreased in comparison to the previous week. Overall, seismographs recorded 13 shallow volcanic earthquakes, two tectonic earthquakes, and one small explosion event. The volcano is at Alert Level 2 (on a scale of 1-4).
Source: Pusat Vulkanologi dan Mitigasi Bencana Geologi (PVMBG, also known as CVGHM)
During 27 March- 1 April, seismic activity at Ijen increased in comparison to the previous week. Seismographs on the volcano detected 35 shallow volcanic earthquakes, seven tectonic earthquakes, and one small explosion. The volcano remained at Alert Level 2 (on a scale of 1-4).
Source: Pusat Vulkanologi dan Mitigasi Bencana Geologi (PVMBG, also known as CVGHM)
During 20-26 February, the number of earthquakes recorded was relatively high; 42 shallow volcanic earthquakes and five tectonic earthquakes were detected. The volcano remained at Alert Level 2 (on a scale of 1-4).
Source: Pusat Vulkanologi dan Mitigasi Bencana Geologi (PVMBG, also known as CVGHM)
During 30 January to 5 February, seismic activity increased at Ijen volcano. This increase was marked by a large number of shallow volcanic earthquakes (75). In addition, 2 small explosion events, 6 tectonic events, and 2 tremor earthquakes occurred. The volcano is at Alert Level 2 (on a scale of 1-4).
Source: Pusat Vulkanologi dan Mitigasi Bencana Geologi (PVMBG, also known as CVGHM)
Reports are organized chronologically and indexed below by Month/Year (Publication Volume:Number), and include a one-line summary. Click on the index link or scroll down to read the reports.
High-pressure steam emission, but little seismicity
The light green crater lake showed no degassing or temperature increase in late July. High-pressure steam was emitted from the solfatara fields near the lake. Nine volcanic A-type, four volcanic B-type, 25 distant tectonic, and four local tectonic earthquakes were recorded.
Information Contacts: VSI
Slight increase in crater lake temperature; tremor episodes
The whitish-green crater lake's temperature was 47°C, slightly increased from the previous week (42°C). Volcanic tremor, recorded since 16 March, had frequencies of 1-2 Hz, and maximum amplitudes that decreased slightly from 1.5 mm to 0.5 mm. The tremor episodes were interpreted as gas bubbles in the crater lake.
Information Contacts: W. Modjo, VSI; AP.
Crater lake changes from gray and bubbling to light green
The crater lake (45°C) was light green in March and April, a change from its previous gray color, when large bubbles were visible on the surface. A total of one deep and two shallow volcanic earthquakes and one tectonic event were recorded. Tremor was recorded on 25, 26, and 28 March.
Information Contacts: W. Modjo, VSI.
Infrared Space Shuttle photograph shows caldera and crater lake
An infrared Space Shuttle photograph (figure 1) taken in May 1992 showed clear views of both Raung and the Ijen volcanic complex. Neither volcano was erupting, but the caldera lake in Kawah Ijen and the devegetated caldera and summit region at Raung were obvious features. The Ijen Caldera was clearly defined, along with some post-caldera cones on its southern margin (Kawah Ijen and Gunung Merapi, Gunung Rante, and Gunung Pendil).
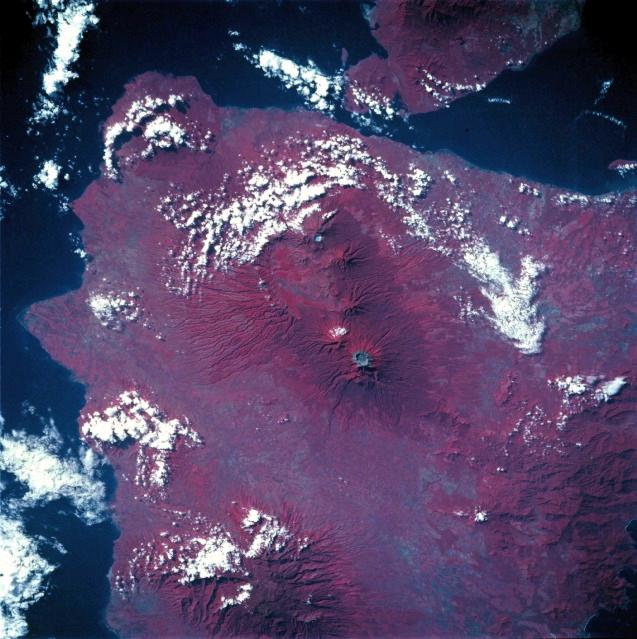 |
Figure 1. This near-vertical color infrared photograph shows both Raung volcano and the Ijen volcanic complex on the E end of Java; the summit of Baluran, at the NE tip of the island, is hidden by clouds. Raung, the tall feature near the center of this photograph with a NE-flank vent (Gunung Suket), has a very wide caldera surrounded by a grayish rim. The difference in color of the rim and the flanks is caused by the rim's lack of vegetation compared with the healthy and extensive vegetation on the flanks. The large elongate Ijen Caldera NE of Raung has numerous cones on its margin, the most obvious being Kawah Ijen with its acidic crater lake. North is to the left; the tip of the island is pointing NE. NASA Photo ID: STS049-097-050, May 1992. |
Information Contacts: NASA JSC Digital Image Collection (URL: http://images.jsc.nasa.gov/).
Phreatic eruptions from the crater lake
Three phreatic eruptions occurred from the center of the crater lake in early July, but caused no damage. The eruptions, at 0646 on 3 July and at 0835 and 1045 on 4 July, were preceded by increasing seismicity and tremor. The color of the lake also changed from whitish-green to brown prior to the activity.
Information Contacts: W. Tjetjep, VSI.
Additional details about July-August 1993 phreatic activity
Phreatic eruptions in July 1993 were preceded by increasing seismicity, but caused no damage. The following report, summarized from . . . VSI (1993a and b), provides additional details about this activity.
The number of volcanic earthquakes started to increase at the end of June 1993. Continuous tremor recorded on 21 June had a maximum amplitude of 0.5-2 mm. The next day, 37 shallow volcanic earthquakes were detected. Tremor amplitude gradually increased from 23 to 30 June. On 26 June, 4 deep volcanic earthquakes occurred. The number of volcanic earthquakes increased until 1 July when a gradual decrease began. However, by 1 July the maximum tremor amplitude was 7-10 mm. Because of the seismic activity, a warning was issued to the local population, to tourists, and to workers at the sulfur mine, saying that the area around the crater was closed.
Water temperature in the crater lake on 2 July was normal (36°C). The lake water was a pale green color, and the surface was covered by dense white vapor to a height of 10 m. Yellowish white vapor was being emitted from the solfatara field, and a very strong sulfur odor could be smelled.
A phreatic eruption at 0845 on 3 July from the center of the crater lake was accompanied by loud eruption sounds. The cloud released from the lake was 10-15 m high and 60-80 m in diameter. Lake water became brownish green, and the surface was dark. Two more phreatic eruptions the next morning (at 0835 and 1045) were smaller than the first; the early morning cloud rose 8-10 m, and no sounds were heard during the second of the 4 July eruptions. Rockfalls occurred at 1000 on 5 July from the S inner crater wall. A rumbling noise indicative of another phreatic eruption was heard at 0215 on 7 July at the sulfur weighing station, ~750 m from the crater.
During the period from 8 to 31 July, seismicity was variable, but there were no phreatic eruptions. Maximum tremor amplitude decreased to 0.5-4 mm. The number of deep volcanic earthquakes fluctuated in the 1-13 events/day range while shallow volcanic earthquakes occurred at a rate of 3-22/day. The temperature of water in the crater lake rose from 39 to 40°C.
Two phreatic eruptions occurred on 1 August starting at 1635; the sound could be heard at the sulfur weighing station. These eruptions were preceded by a tectonic earthquake with an amplitude >46 mm. There were no reports of injuries during any of the phreatic eruptions in July or August.
Seismic activity gradually decreased during 2-21 August when 0-2 deep and 5-23 shallow volcanic earthquakes were recorded each day. Crater lake water temperature through most of August was 39-41°C, and the pH was 1. Maximum tremor amplitude was 1-6 mm until 22 August when tremor was no longer continuous and maximum amplitude decreased to 1 mm. Between 22 August and 9 September deep volcanic earthquakes were recorded at a rate of 1-2/day; shallow events varied from 2 to 17/day. By 10 September, seismic data and visual observations indicated that the volcano had returned to a "normal" level of activity.
References. Volcanological Survey of Indonesia, 1993a, Ijen Volcano: Journal of Volcanic Activity in Indonesia, v. 1, no. 1/2, p. 14.
Volcanological Survey of Indonesia, 1993b, Ijen Volcano: Journal of Volcanic Activity in Indonesia, v. 1, no. 3/4, p. 8-12.
Information Contacts: W. Tjetjep, VSI; BOM Darwin, Australia; S. Matthews, Univ of Bristol; UPI; ANS.
Minor phreatic eruption in February described
At 0915 on 3 February 1994, a small phreatic eruption took place from the S part of the crater lake. Coincident with the eruption, lake level rose ~1 m. Visual and seismic activity then returned to normal through July. During 7-14 August, the number of volcanic earthquakes and tremor increased compared to earlier in August. The temperature of the light-green crater lake was 39-42°C.
Information Contacts: VSI.
Late-June interval of increased seismicity; lake color changes
Not long after a Jakarta newspaper reported increased fumarolic activity and a large number of earthquakes, Dali Ahmad of the Volcanological Survey of Indonesia (VSI) reported that seismic activity had been on the rise since about 27 June. He also noted that the color of the water in Kawah Ijen crater lake had changed, and one or more workers near the summit reported dizziness and headaches. Ahmad closed by saying that seismicity later returned to normal.
Geologist Steve Mattox, visiting around late June, reported seeing gas bubbles and areas of upwelling in the lake. He noted that on 29 June the summit area was closed to public access after birds were seen falling into the water.
Reference. Pasternack, G.I., and Varekamp, J.C., 1994, The geochemistry of Keli Mutu volcanic lakes, Flores, Indonesia: Geochem. Journal 28, p. 243- 262.
Information Contacts: Dali Ahmad, Volcanological Survey of Indonesia, Jalan Diponegoro 57, Bandung, Indonesia; Steve Mattox, 44 Robinson St., Nedlands, WA 60009 Australia; Johan C. Varekamp, Department of Earth & Environmental Sciences 265 Church Street, Wesleyan University Middletown, CT 06459-0139 USA.
Elevated seismicity during 27 June-11 July; lake-color shifts and odors
The Volcanological Survey of Indonesia (VSI) reported that seismic activity had been on the rise since about 27 June and that the color of the water in Kawah Ijen crater lake had changed (BGVN 22:06). A visiting geologist had also noted lake bubbling and upwelling. The following report provides additional information about the activity during late June-July.
Seismicity remained high during 27 June through about 11 July 1997 (figure 2). This increase, however, was not followed by phreatic eruptions as in 1993 (BGVN 18:07 and 19:05). Still, seismic data indicated that the number of deep A-type and especially shallow B-type volcanic earthquakes sharply increased. The maximum amplitude of volcanic tremor also increased rapidly.
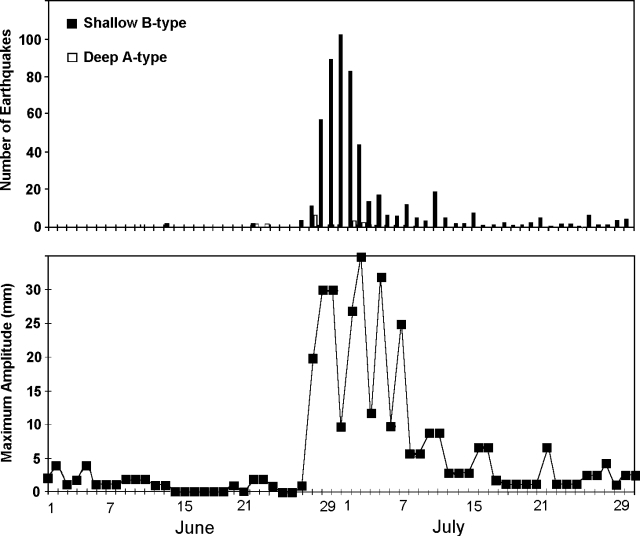 |
Figure 2. Seismicity at Kawah Ijen: daily number of volcanic earthquakes (top) and maximum amplitudes of volcanic tremor (bottom), June-July 1997. Courtesy of Isya N. Dana, Jr., VSI. |
The color of the crater lake changed from light green to whitish (pale) green and a very strong sulfuric odor was noted at the side of the crater lake. However, these changes were not followed by corresponding shifts in the lake's water temperature (figure 3). Because of the increasing activity, VSI warned residents, tourists, and sulfur miners that the crater area was closed until early August 1997.
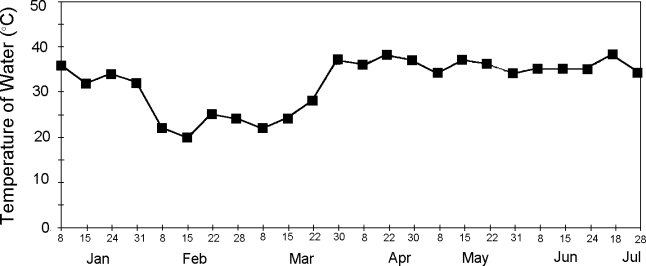 |
Figure 3. Crater-lake water temperatures measured at Kawah Ijen, January-August 1997. Courtesy of Isya N. Dana, Jr., VSI. |
Ijen Caldera encloses a group of small stratovolcanoes. The active crater at Kawah Ijen is ~700 m across and 200 m deep. Kawah Ijen's noteworthy features include a mineral-rich acid lake and fumarolic sulfur in sufficient abundance to support active mining (see photos in Krafft and Krafft, 1979).
Reference. Krafft, K,. and Krafft, M., 1979, Volcanoes: Earth's Awakening (originally published in French under the title "Volcans"): Hachette/Hammond Inc., ISBN 0-8437-3760-3, plates on p. 142, 156, and 157.
Information Contacts: Isya N. Dana, Jr., Volcanological Survey of Indonesia (VSI), Jalan Diponegoro 57, Bandung 40122, Indonesia.
Recent measurements of acid crater lake
Measurements and sampling were made in the acid lake of Kawah-Ijen during two transits with a rubber rowboat on 7 and 10 December 1998. The 7 December measurements occurred just after heavy rain and the lake's color was pale and nearly white. In the middle of the lake, the surface temperature was 23.5°C with a pH of 0.48 as a result of dilution by the rain. The temperature near the solfatara at the S side of the lake ranged between 24.6 and 24.9°C with a pH of 0.45. Near the hot sublacustrine spring the temperature was as high as 61.7°C and the pH was 0.60. In the Banyupahit River, 3 km from the dam that closes the lake, the water had a temperature of 21.1°C and a pH of 0.47.
Three days later, 10 December, the lake was pale green with localized brown coloration; the temperature of the surface was 24.8-25.2°C and the pH 0.36-0.38. The highest measured temperature of the solfatara was 224°C, while the CO2 content of the atmosphere near the lake surface was normal, ~300 ppm.
Information Contacts: Jacques-Marie Bardintzeff, Laboratoire de Petrographie-Volcanologie, bat 504 Universite Paris-Sud, 91405 Orsay, France.
Two phreatic eruptions at the active crater lake on 28 June
Two phreatic eruptions occurred at the Sibanteng location inside the active crater lake at 0510 on 28 June. An accompanying detonation was heard 2 km from the summit and volcanic tremor was recorded with an amplitude of 0.5 to 1 mm. Seismicity continued at the same low level as the previous week. Other details regarding the eruption remain undisclosed.
Information Contacts: R. Sukhyar and Dali Ahmad, Volcanological Survey of Indonesia (VSI), Jalan Diponegoro No. 57, Bandung 40122, Indonesia (URL: http://www.vsi.esdm.go.id/).
Increased seismicity since April 1999; white plumes and phreatic eruptions
Seismicity at Ijen increased starting in early April, when volcanic B-type events rose from 15 during the week ending on 5 April to 41 events during 6-12 April. Tremor during April and May had amplitudes of 0.5-2 mm. The number of B-type events remained high (more than 34/week) for most of the period through mid-June. Seismicity then gradually declined through mid-July, after which the weekly number of B-type events remained stable at an average of 9/week. During the period of 18 May through the week ending on 21 June a "white ash plume" rose 50-100 m. Recorded tremor had an amplitude of 0.5-3 mm.
Two phreatic eruptions occurred at the Sibanteng location inside the active crater lake at 0510 on 28 June. An accompanying detonation was heard at the sulfur mining site 2 km from the summit and volcanic tremor was recorded with an amplitude of 0.5-1 mm. The following week, 6-12 July, yellow-gray sulfur emissions were observed from the crater and a loud "whizz" noise was heard. The crater lake's water was brownish-white and had sulfur agglutinate floating on the surface. Measurements on 8 July showed that the hotspring temperature was 48°C, air temperature at the crater lake was 15°C, the lakewater temperature was 40°C, and the sulfur gas temperature was 207-221°C. Thick haze prevented observations from 13 July through 23 August, but B-type events and continuous tremor was recorded. When J.M. Bardintzeff visited, on 17 August 1999, the solfatara was strongly active and the crater filled with gas. The acid lake was a pale-green color.
Conductivity determinations were made of acid lake waters sampled on 7 December 1998 (BGVN 23:11) by Bardintzeff, Marlin, and Barsuglia. Conductivity in the middle of the lake was 146 mS/cm. Near the S side it was 140 and only 98-120 mS/cm near the hot sub-lacustrine spring. A small affluent in the S side, was (from its source to the lake) 39-27°C, with a pH of 1.6, and conductivity of 17 mS/cm. In the Banyupahit River, 3 km from the dam, conductivity was 138 mS/cm. On 10 December 1998 conductivity in the middle of the lake was 181 mS/cm.
Information Contacts: Volcanological Survey of Indonesia (VSI), Jalan Diponegoro No. 57, Bandung 40122, Indonesia (URL: http://www.vsi.esdm.go.id/); J.M. Bardintzeff; C. Marlin, and F. Barsuglia, Sciences de la Terre, bat 504, Universite Paris-Sud, 91405 Orsay cedex, France.
Low-medium density ash emission; elevated seismicity with continuous tremor
This report covers the period June-October 2000. During mid-June, seismographs recorded an increasing number of earthquakes. A white, variable-density ash plume rose 25 m above Ijen's summit. Volcanic and tremor earthquakes occurred with amplitudes of ~0.5-4 mm. In late July, the number of volcanic and tremor earthquakes increased.
Ash erupted once during late August-early September. A medium-density ash cloud rose up to 50 m above the crater during the second week in September. The following week, the ash emission changed to a low-density plume and rose 25 m.
In late September, seismographs registered an increase in shallow volcanic (B-type) earthquakes and the initiation of continuous tremor. Visual observations were not available for late September and parts of October because of inclement weather. Tremor became discontinuous by the end of October, and elevated seismicity continued.
Information Contacts: Dali Ahmad, Volcanological Survey of Indonesia (VSI), Jalan Diponegoro No. 57, Bandung 40122, Indonesia (URL: http://www.vsi.esdm.go.id/).
Heightened seismicity through at least September 2001, white-gray plume to ~100 m
As summarized in table 1, beginning in February and lasting through at least September 2001, Ijen displayed heightened seismicity including tremor, shallow volcanic (B-type) earthquakes, and explosion earthquakes. Deep volcanic (A-type) earthquakes also occurred on a few occasions. The Alert Level remained at 2 (on a scale of 1-4) during most of the report period. Our last report (BGVN 25:10) covered activity through October 2000.
Table 1. Summary of seismicity at Ijen, 30 January-30 September 2001. Measurements in millimeters (mm) indicate amplitudes. Courtesy of the Volcanological Survey of Indonesia (VSI).
| Date | Deep volcanic (A-type) | Shallow volcanic (B-type) | Small explosion | Tectonic | Tremor |
| 30 Jan-05 Feb 2001 | -- | 75 | 2 | 6 | 2 (4 mm) |
| 06 Feb-11 Feb 2001 | -- | 36 | 2 | 6 | -- |
| 13 Feb-19 Feb 2001 | 1 | 30 | 3 | 4 | -- |
| 20 Feb-26 Feb 2001 | -- | 42 | -- | 5 | -- |
| 27 Feb-05 Mar 2001 | 42 (4 mm) | -- | -- | 5 | -- |
| 06 Mar-12 Mar 2001 | -- | 17 | -- | -- | -- |
| 12 Mar-18 Mar 2001 | -- | 27 | 3 | 1 | -- |
| 19 Mar-23 Mar 2001 | -- | 12 | 4 | -- | -- |
| 27 Mar-01 Apr 2001 | -- | 47 | 1 | 7 | -- |
| 02 Apr-08 Apr 2001 | -- | 13 | 1 | -- | 2 |
| 09 Apr-15 Apr 2001 | -- | 9 | -- | 10 | -- |
| 16 Apr-23 Apr 2001 | 1 | 10 | -- | 2 | -- |
| 23 Apr-29 Apr 2001 | -- | 9 | 1 | 7 | -- |
| 30 Apr-06 May 2001 | -- | 4 | -- | 6 | -- |
| 07 May-13 May 2001 | -- | 11 | -- | 3 | -- |
| 14 May-20 May 2001 | -- | 3 | -- | -- | -- |
| 28 May-03 Jun 2001 | -- | 9 | 2 | 9 | discontinuous (0.5-3 mm) |
| 02 Jul-08 Jul 2001 | -- | 9 | 2 | 9 | discontinuous (0.5-3 mm) |
| 09 Jul-15 Jul 2001 | 1 | 31 | 2 | 7 | discontinuous (0.5-3 mm) |
| 13 Aug-26 Aug 2001 | -- | 42 | 1 | 6 | continuous |
| 27 Aug-02 Sep 2001 | -- | 16 | 1 | 1 | continuous |
| 03 Sep-09 Sep 2001 | -- | 1 | 5 | 5 | discontinuous |
| 10 Sep-16 Sep 2001 | -- | 14 | -- | 4 | continuous |
| 17 Sep-23 Sep 2001 | -- | 13 | -- | 1 | continuous (0.5-3 mm) |
| 24 Sep-30 Sep 2001 | -- | 14 | -- | 4 | continuous (0.5-3 mm) |
During May, a thin-white plume reached to ~50 m above the summit. The Darwin VAAC reported that at 0120 on 15 July sulfur fumes entered the cabin of an aircraft flying from Singapore to Denpasar. At the time, the aircraft was flying at an altitude of ~2.4 km about 15 km SE of Ijen, the suspected source of the sulfur gas. During mid-August, the crater began to produce a white-grey plume. By the end of September, the plume reached up to ~100 m above the summit.
Information Contacts: Dali Ahmad, Volcanological Survey of Indonesia (VSI), Jalan Diponegoro No. 57, Bandung 40122, Indonesia (URL: http://www.vsi.esdm.go.id/).
Higher-than-normal seismic activity from October 2001 through at least 6 January 2002
During 1 October 2001 through at least 6 January 2002, activity at Ijen was higher than normal, though low visibility often restricted visual observation of the summit. Activity included heightened continuous tremor, shallow volcanic (B-type) earthquakes, and one small explosion earthquake (table 2). No deep volcanic (A-type) earthquakes were reported.
Table 2. Summary of seismicity at Ijen during 1 October 2001- 6 January 2002. The left-hand column shows time intervals; the other columns indicate the number of earthquakes or maximum tremor amplitudes seen during the time intervals. Courtesy of the Volcanological Survey of Indonesia (VSI).
| Date | Shallow volcanic earthquakes (B-type) | Small explosion earthquakes | Tectonic earthquakes | Continuous tremor (max. amp.) |
| 01 Oct-07 Oct 2001 | 10 | -- | 1 | 0.5-6 mm |
| 15 Oct-21 Oct 2001 | 4 | -- | 2 | 0.5-3 mm |
| 22 Oct-28 Oct 2001 | 5 | -- | 7 | 0.5-5 mm |
| 29 Oct-04 Nov 2001 | 6 | -- | -- | 0.5-6 mm |
| 05 Nov-11 Nov 2001 | 2 | -- | 2 | 0.5-2 mm |
| 12 Nov-18 Nov 2001 | 1 | 1 | 1 | 0.5-4 mm |
| 19 Nov-25 Nov 2001 | 4 | -- | -- | 0.5-5 mm |
| 26 Nov-02 Dec 2001 | 3 | -- | -- | 0.5-6 mm |
| 03 Dec-09 Dec 2001 | 3 | -- | -- | 0.5-3 mm |
| 17 Dec-30 Dec 2001 | 5 | -- | 3 | 0.5-4 mm |
| 31 Dec-06 Jan 2002 | 3 | -- | 1 | 0.5-4 mm |
During 1-7 October a thin, white, low-pressure plume was observed reaching ~50-100 m above the summit. Ijen volcano remained at Alert Level 2 (on a scale of 1-4) through at least 6 January 2002.
Information Contacts: Dali Ahmad, Volcanological Survey of Indonesia (VSI), Jalan Diponegoro No. 57, Bandung 40122, Indonesia (URL: http://www.vsi.esdm.go.id/).
Continuous tremor, volcanic and tectonic earthquakes through April 2002
During 7 January through at least 19 May 2002 at Ijen, seismicity was higher than normal. Shallow volcanic and tectonic earthquakes were recorded (table 3). One small explosion earthquake was recorded during the week of 28 January-3 February. A total of three deep volcanic (A-type) earthquakes were registered during early May. Continuous tremor occurred with a maximum amplitude of 0.5-4 mm until mid-March, when it decreased to 0.5-2 mm. During 8-14 April, a white, thin, medium-pressure plume rose 50 m above the summit crater. The following week, the tremor increased to 0.5-6 mm maximum amplitude and remained at similar levels through at least 19 May. The Alert Level remained at 2 during the report period.
Table 3. Earthquakes recorded at Ijen during 7 January through 19 May 2002. Courtesy VSI.
| Date | Shallow volcanic earthquakes (B-type) | Tectonic earthquakes |
| 07 Jan-13 Jan 2002 | 5 | 2 |
| 14 Jan-20 Jan 2002 | -- | -- |
| 21 Jan-27 Jan 2002 | -- | -- |
| 28 Jan-03 Feb 2002 | 9 | 1 |
| 04 Feb-10 Feb 2002 | 1 | 3 |
| 11 Feb-17 Feb 2002 | 4 | 1 |
| 18 Feb-24 Feb 2002 | 8 | -- |
| 25 Feb-03 Mar 2002 | 9 | 3 |
| 04 Mar-10 Mar 2002 | 12 | 4 |
| 11 Mar-17 Mar 2002 | 2 | 2 |
| 18 Mar-24 Mar 2002 | 1 | -- |
| 25 Mar-31 Mar 2002 | 2 | 2 |
| 01 Apr-07 Apr 2002 | -- | 2 |
| 08 Apr-14 Apr 2002 | 2 | -- |
| 15 Apr-21 Apr 2002 | 9 | 2 |
| 22 Apr-28 Apr 2002 | 11 | 1 |
| 29 Apr-05 May 2002 | 70 | 4 |
| 06 May-12 May 2002 | 42 | 3 |
| 13 May-19 May 2002 | 22 | 4 |
Information Contacts: Dali Ahmad, Volcanological Survey of Indonesia (VSI) (URL: http://www.vsi.esdm.go.id/).
Small explosion in late July 2002 accompanies increased seismicity; ash emissions
During 27 May through at least 8 September 2002 at Ijen, activity was above background levels. Seismicity was dominated by shallow volcanic (B-type) earthquakes. One small explosion occurred on 29 July, accompanying an increase in the number of B-type earthquakes (table 4). Ash was emitted during late July through mid-August. Continuous tremor occurred with a maximum amplitude of 0.5-6 mm. Fog obscured the view during most of the reporting period, but when the summit was visible, plumes were observed reaching up to 125 m above the volcano. Ijen remained at Alert Level 2.
Table 4. Earthquakes and plumes reported at Ijen during 27 May-8 September 2002. Courtesy VSI.
| Date | Deep volcanic earthquakes (A-type) | Shallow volcanic earthquakes (B-type) | Max amplitude of continuous tremor | Small explosion | Tectonic earthquakes | Plume Details |
| 27 May-02 Jun 2002 | -- | 6 | 0.5-4 mm | -- | -- | White-medium plume reached 50-125 m above the summit. |
| 03 Jun-09 Jun 2002 | -- | 10 | 0.5-4 mm | -- | -- | White-medium plume reached 50 m above the summit. |
| 10 Jun-16 Jun 2002 | -- | 12 | 0.5-4 mm | -- | 2 | -- |
| 17 Jun-23 Jun 2002 | 1 | 6 | 0.5-4 mm | -- | 4 | -- |
| 24 Jun-30 Jun 2002 | -- | 2 | 0.5-6 mm | -- | 2 | -- |
| 01 Jul-07 Jul 2002 | -- | 1 | 0.5-5 mm | -- | 2 | -- |
| 08 Jul-14 Jul 2002 | -- | 13 | 0.5-4 mm | -- | 2 | -- |
| 15 Jul-21 Jul 2002 | -- | 23 | 0.5-4 mm | -- | 1 | -- |
| 22 Jul-28 Jul 2002 | -- | 22 | 0.5-4 mm | -- | 10 | -- |
| 29 Jul-04 Aug 2002 | 4 | 40 | 0.5-3 mm | 1 on 29 July | -- | White-gray ash plume ~50 m above summit drifted E. |
| 05 Aug-11 Aug 2002 | -- | 31 | 0.5-6 mm | -- | 2 | White-gray ash plume ~50 m above summit drifted E. |
| 12 Aug-18 Aug 2002 | -- | 34 | 0.5-2 mm | -- | 4 | White-gray ash plume 50-75 m above summit drifted E. |
| 19 Aug-25 Aug 2002 | -- | 47 | 0.5-4 mm | -- | 8 | -- |
| 26 Aug-01 Sep 2002 | 2 | 59 | 0.5-4 mm | -- | 3 | -- |
| 02 Sep-08 Sep 2002 | -- | 65 | 0.5-3 mm | -- | 6 | -- |
Information Contacts: Volcanological Survey of Indonesia (VSI), Jalan Diponegoro No. 57, Bandung 40122, Indonesia (URL: http://www.vsi.esdm.go.id/).
Above-background seismicity through at least 8 December 2002
During 9 September through at least 8 December 2002 at Ijen, activity was above background levels. Seismicity was dominated by shallow volcanic (B-type) and tectonic earthquakes (table 5). During the week of 14-20 October, 1 deep-volcanic (A-type) earthquake was registered. Continuous tremor occurred, typically with a maximum amplitude of 0.5-3 mm.
Table 5. Earthquakes reported at Ijen during 9 September-8 December 2002. Courtesy VSI.
| Date | Shallow volcanic (B-type) | Tectonic |
| 09 Sep-15 Sep 2002 | 51 | 4 |
| 16 Sep-22 Sep 2002 | 72 | 5 |
| 23 Sep-29 Sep 2002 | 71 | 6 |
| 30 Sep-06 Oct 2002 | 67 | 5 |
| 07 Oct-13 Oct 2002 | 48 | 6 |
| 14 Oct-20 Oct 2002 | 96 | 2 |
| 21 Oct-27 Oct 2002 | 28 | 2 |
| 28 Oct-03 Nov 2002 | 73 | 2 |
| 04 Nov-10 Nov 2002 | 29 | 1 |
| 11 Nov-18 Nov 2002 | 29 | 17 |
| 02 Dec-08 Dec 2002 | 3 | 1 |
During 2-8 December VSI reported that tremor had a maximum peak-to-peak amplitudes of 0.5-12 mm. Throughout the report period, a "white-thin ash plume" [steam plume] was reported to rise 50-100 m above the volcano. Ijen remained at Alert Level 2.
Information Contacts: Dali Ahmad, Volcanological Survey of Indonesia (VSI), Jalan Diponegoro No. 57, Bandung 40122, Indonesia (URL: http://www.vsi.esdm.go.id/).
Decreased seismicity; fires detected on satellite imagery
During 9 December 2002-26 January 2003, the Volcanological Survey of Indonesia (VSI) reported that seismicity at Ijen was dominated by shallow volcanic and tectonic earthquakes (table 6). The number of weekly volcanic earthquakes decreased significantly in December compared to July-November 2002 (BGVN 27:08 and 27:11). One deep volcanic earthquake was registered during 13-19 January. Continuous tremor occurred throughout the report period. The Alert Level remained at 2.
Table 6. Seismicity at Ijen during 9 December 2002-26 January 2003. Courtesy VSI.
| Date | Shallow volcanic (B-type) | Tectonic | Tremor amplitude |
| 09 Dec-15 Dec 2002 | -- | -- | 0.5-12 mm |
| 16 Dec-22 Dec 2002 | 1 | 2 | 0.5-8 mm |
| 23 Dec-29 Dec 2002 | 3 | -- | -- |
| 30 Dec-05 Jan 2003 | 13 | 3 | 0.5-6 mm |
| 06 Jan-12 Jan 2003 | 13 | 3 | 0.5-6 mm |
| 13 Jan-19 Jan 2003 | 1 | 7 | 0.5-4 mm |
| 20 Jan-26 Jan 2003 | 9 | 7 | 0.5-1 mm |
Thermal anomalies were detected by MODIS throughout 2001 and 2002 adjacent to the Ijen (Kendeng) caldera. The center coordinates of the alert-pixels are widely dispersed, so it seems likely that these represent fires. Alerts occurred in August-September 2001, May 2002, and September-October 2002. The biggest anomaly occurred on 19 October 2002 close to Kawah Ijen, the only currently known locus of activity in the complex. This was characterized by four alert-pixels with a maximum alert ratio of +0.568. This is an extremely high ratio and is comparable to that seen elsewhere during lava effusion. However, VSI confirmed that there was no eruption that day, only a bush fire that also damaged seismic sensors.
Information Contacts: Dali Ahmad, Volcanological Survey of Indonesia (VSI), Jalan Diponegoro No. 57, Bandung 40122, Indonesia (URL: http://www.vsi.esdm.go.id/); Diego Coppola and David A. Rothery, Department of Earth Sciences, The Open University, Milton Keynes, MK7 6AA, UK. Thermal alerts courtesy of the HIGP MODIS Thermal Alerts Team (URL: http://modis.higp.hawaii.edu/).
Shallow volcanic earthquakes and continuous tremor recorded in October
The hazard status of Ijen was upgraded to Alert Level 2 (on a scale of 1-4) on 8 October. Seismicity the week of 6-12 October comprised four deep volcanic earthquakes, 21 shallow volcanic earthquakes, one emission event, and continuous tremor (0.5-2 mm amplitude). Only 16 shallow volcanic earthquakes were recorded the following week, along with continuous tremor (0.5-2 mm amplitude). Continuous tremor (0.5-4 mm amplitude) was recorded during 20-26 October, a week when the number of shallow volcanic events increased to 30. Gas plumes emitted from the crater rose up to 150 m high during October.
Information Contacts: Dali Ahmad, Hetty Triastuty, Nia Haerani, and Suswati, Volcanological Survey of Indonesia (VSI), Jalan Diponegoro No. 57, Bandung 40122, Indonesia (URL: http://www.vsi.esdm.go.id/).
November 2003:Tremor, type-A volcanic earthquakes; felt earthquake (MM III)
The pattern of shallow volcanic earthquakes reported at Ijen in BGVN 28:10 continued over the period 27 October-30 November 2003. White gas emissions rose 50-150 m from the crater, and a earthquake was felt on 4 November of Modified Mercali intensity III. Data in table 7 show slight variations in seismicity during the report interval. The volcano remained at alert level 2 (on a scale of 1-4).
Table 7. Seismicity registered at Ijen, 27 October-30 November 2003. Courtesy of VSI.
| Date | Deep volcanic (A-type) | Shallow volcanic (B-type) | Tremor | Tectonic | Emission |
| 27 Oct-02 Nov 2003 | 0 | 29 | continuous (0.5-2 mm) | 2 | 0 |
| 03 Nov-09 Nov 2003 | 0 | 18 | continuous (0.5-2 mm) | 6 | 2 |
| 10 Nov-16 Nov 2003 | 0 | 18 | continuous (0.5-2 mm) | 6 | 2 |
| 17 Nov-23 Nov 2003 | 0 | 26 | continuous (0.5-4 mm) | 7 | 0 |
| 24 Nov-30 Nov 2003 | 8 | 32 | continuous (0.5-2 mm) | 7 | 1 |
Information Contacts: Dali Ahmad, Hetty Triastuty, Nia Haerani, and Suswati, Vulcanological Survey of Indonesia (VSI), Jalan Diponegoro No. 57, Bandung 40122, Indonesia (URL: http://www.vsi.esdm.go.id/).
News report cites increased activity beginning on 17 June 2004
The Chief of the local National Park has been quoted as having reported an increase in activity beginning on 17 June 2004. This resulted in closing the area to visitors. Reuters quotes him as having said "There have been sulfuric rocks coming out of the edge of the crater and the fluid in it (the crater lake) has turned from green to white and has emitted hot foam. There are also increasing tremors."
Information Contacts: Reuters News Service.
Acidic crater lake and active solfatara investigations
Scientists from Simon Fraser and McGill universities conducted preliminary geophysical and geochemical field studies at Ijen (figure 4) between 13 and 26 August 2006. During this period, volcanic activity was low and restricted to persistent degassing of the solfatara in the SE part of the crater.
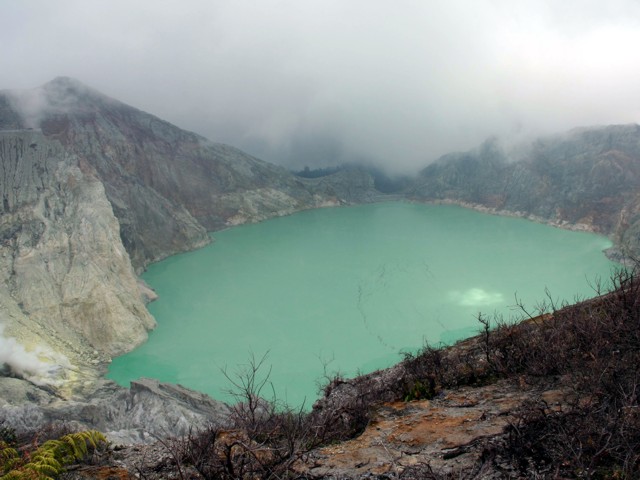 |
Figure 4. Photograph of the acid crater lake and solfatara (bottom left) in the active crater at Ijen, August 2006. View is from the E crater rim. Courtesy of G. Mauri. |
Measurements of temperature and pH were made every morning during 14-19 August at four locations: the Banyupuhit River, ~ 5 km from the Banyupuhit River source, the acid lake in the summit crater, and the E shore of the crater lake. Temperatures of the Banyupuhit River were 16-20°C, always above atmospheric temperature by ~ 1-3°C; the pH was ~ 0.4. Lake temperatures varied between 31 and 43°C and the pH was -0.02. The color of the crater lake was generally homogeneous, although large black to brown linear patches, probably sulfur deposits from the solfatara, were observed on the turquoise-green surface. These ephemeral patches were of variable size (e.g. several ten's of meters long and a few meters wide) and moved across the lake during the course of the day, but were not always evident throughout the day. The area near the E shore appeared lighter than the rest of the lake, probably due to a spring at the bottom of the inner E slope.
Pipes driven into the fumaroles are used to extract gases for sulfur mining (figure 5). Temperatures measured 50 cm down into four of those pipes ranged from 224 to 248°C. These measurements almost certainly represent minimum estimates of the true temperatures due to heat loss along the length of the extraction pipes. After the gases had exited less than 50 cm from the pipes, temperatures had dropped below 120°C, the melting point of native sulfur.
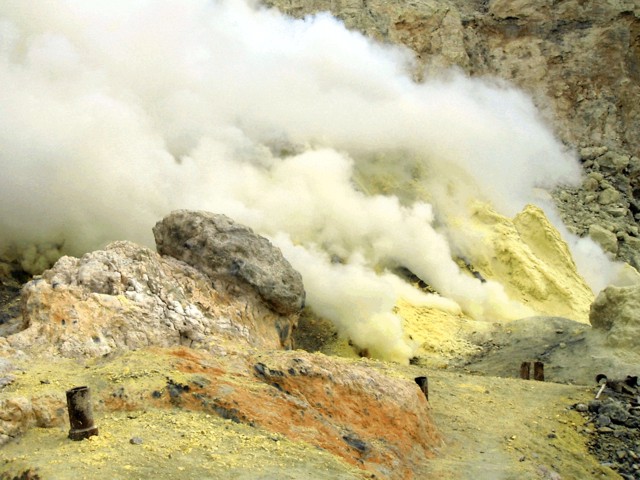 |
Figure 5. Close-up view of the solfatara at Ijen with fumarole temperature of more than 220°C. Note pipes for extracting sulfur gases. Courtesy of G. Mauri. |
A survey of sulfur dioxide (SO2) fluxes made by a portable spectrometer (FLYSPEC) on 21 and 23 August along the SE rim of the crater consisted of seven and twelve walking traverses through the plume, respectively. The gas plume produced directly from the active solfatara near the lake surface rose buoyantly before flowing over the crater rim. During the first survey (conducted over a 2-hour period), the concentration-pathlength of the gas in the plume fluctuated between 1,000 and 2,500 ppm-m. The wind speed (measured by handheld anemometer at plume height) during this time averaged 6.1 m/s and the resultant SO2 flux was therefore calculated to average 412 metric tons per day (t/d) with a standard deviation of 154 t/d. On 23 August, gas concentrations were somewhat lower, ranging between 500 and 2,000 ppm-m. The average wind speed during the survey period (2 hours) was 3.9 m/s and the resultant SO2 flux averaged 254 t/d, with a standard deviation of 117 t/d. Based on this very limited survey, the flux of SO2 was estimated to be 330 t/d.
Gravity surveys (Bouguer and dynamic) were conducted in the active crater and seven gravity stations were selected for future dynamic gravity monitoring. A digital elevation map was prepared (using digital photogrammetric mapping methods) to provide the spatial framework required for interpretation of the geophysical surveys.
The scientists also applied the self-potential (SP) method, also know as spontaneous potential, that measures electrical potentials developed in the Earth by electrochemical action between minerals and solutions with which they are in contact. SP mapping of the active summit crater showed two main hydrologic structures (figure 6). The first is a hydrogeologic zone on the E and NE rim characterized by a negative SP anomaly with a minimum at -100 mV (millivolts), an inverse SP/elevation gradient of -1.6 mV/m, and length of 1,500 m. This almost certainly represents inflow of meteoric water and groundwater.
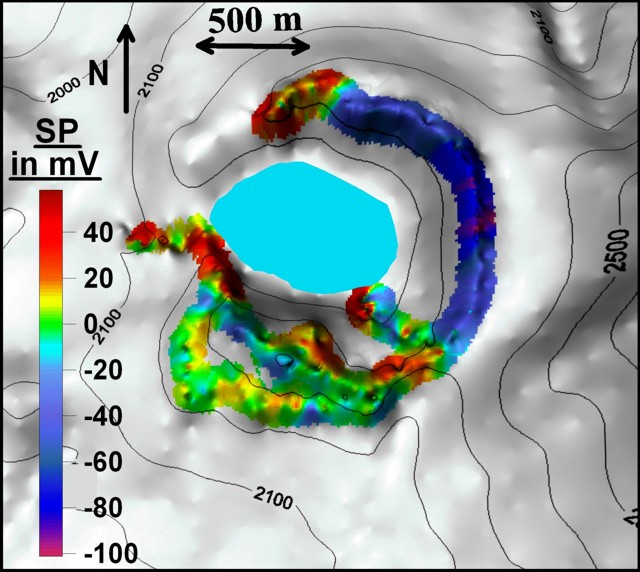 |
Figure 6. Self-potential survey results shown on a topographic map of the active crater of Ijen, August 2006. All the SP data were referenced at the Banyupuhit River and at a spring on the inner E slope of the crater. Contour line intervals are 100 m. Courtesy of G. Williams-Jones. |
The second structure is the main hydrothermal system located S, W, and N of the crater as well as in the southern inner slope of the crater, places where the surface expressions are solfataras. The SP maxima range between 48 and 60 mV and are located on the slope of the river below a dam on the outer W slope (+52 mV), on the N rim (+48 mV) and in the S part of the solfatara (+ 59 mV). Processing of the SP data along the crater profile by continuous wavelet transform (Mauri and others, 2006) shows that the hydrothermal fluid cells are near the surface (less than 200 m below the topographic surface) suggesting that the hydrothermal system is under high pressure with significant heat flux, as shown by the solfatara.
Reference. Mauri, G., Saracco, G., and Labazuy, P., 2006, Volcanic activity of the Piton de la Fournaise volcano characterized by temporal analysis of hydrothermal fluid movement, 1992 to 2005: AGU, Eos Trans, v. 87, no. 52, Fall Meet. Suppl., Abstract V51A-1653.
Information Contacts: Guillaume Mauri and Glyn Williams-Jones, Department of Earth Sciences, Simon Fraser University, Burnaby, BC V5A 1S6, Canada (URL: http://www.sfu.ca/earth-sciences.html); Willy (A.E.) Williams-Jones, Department of Earth and Planetary Sciences, McGill University, Montreal, Quebec, Canada (URL: http://www.mcgill.ca/eps/); Deddy Mulyadi, Center of Volcanology and Geological Hazard Mitigation (CVGHM), Diponegoro 57, Bandung, Jawa Barat 40122, Indonesia (URL: http://vsi.esdm.go.id/).
2007 field visit found degassing and increasing fumarole temperatures
Researchers from Simon Fraser University, McGill University, and the Institut Teknologi Bandung (ITB) conducted fieldwork at Ijen from 6 July to 2 August 2007. During this period, volcanic activity was restricted to persistent degassing of the solfatara (sulfurous fumarole) located on a small dome in the SE part of the crater (figure 7). However, local sulfur miners reported a decrease in the amount of mineable sulfur, a change presumably linked to increasing exit temperatures of the fumarole gases. Visual observation revealed no change in the crater lake level or fumarole activity compared to observations (BGVN 32:02) at roughly the same time last year (dry season).
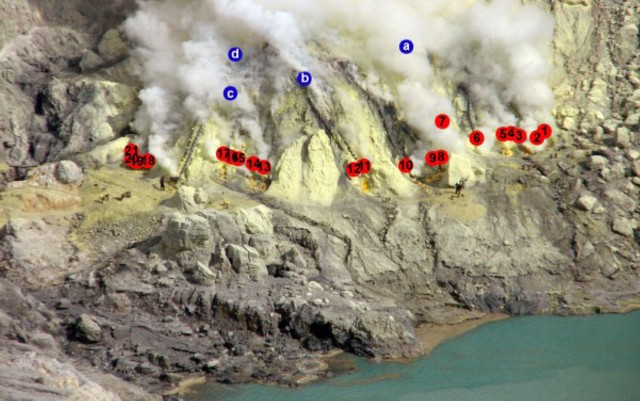 |
Figure 7. Overview of the N flank of the dome-like fumarole field (solfatara) as viewed from the crater rim of Ijen. Miners have installed pipes leading down from the dome. The pipes are used to condense sulphur, which is subsequently mined. Temperatures were measured in the pipes (numbered 1-21) and in fumaroles (lettered a-d) (see table 8). Fumarole temperatures were measured near the top of the dome. For scale, note sulphur miners near pipes 18 and 8/9. Courtesy of V. van Hinsberg. |
During the visit, exit temperatures measured at the pipes ranged from 115 to 270°C (table 8), similar to those measured in 2006. Fumaroles on top of the dome had substantially higher temperatures, ranging up to 600°C, with the hottest emitting orange flames. By comparison, fumarole temperatures reported for the top of the dome in 1999, the last year for which there are published data (BGVN 24:09), were less than 250°C.
Table 8. Temperature (°C) of gases measured at ~ 50 cm depth in pipes and fumaroles using a K-type thermocouple. Courtesy of Glyn Williams-Jones.
| Location | Temperature |
| Pipe 1 | -- |
| Pipe 2 | 235°C |
| Pipe 3 | -- |
| Pipe 4 | 255°C |
| Pipe 5 | 215°C |
| Pipe 6 | 210°C |
| Pipe 7 | 267°C |
| Pipe 8 | 216°C |
| Pipe 9 | 230°C |
| Pipe 10 | 210°C |
| Pipe 11 | 175°C |
| Pipe 12 | 116°C |
| Pipe 13 | 168°C |
| Pipe 14 | 199°C |
| Pipe 15 | 205°C |
| Pipe 16 | 155°C |
| Pipe 17 | 194°C |
| Pipe 18 | 178°C |
| Pipe 19 | -- |
| Pipe 20 | 187°C |
| Pipe 21 | 194°C |
| Fumarole A | >495°C |
| Fumarole B | 331°C |
| Fumarole C | 335°C |
| Fumarole D | 601°C |
Fumarolic sampling techniques included condensate bottles, and sublimates collected in silica tubes. In addition, they also used a Giggenbach bottle, a technique in which the escaping gases are bubbled through a caustic solution of NaOH in an evacuated flask. Reactions, such as those between the caustic solution and CO2 in the sampled gas, both remove some species from the gas and result in residual gases collected at the top of the flask. The samples obtained with the various techniques are typically studied and analyzed later in the lab.
Distinct variations in fumarole temperature observed during the course of the field campaign linked closely to weather conditions. On clear, wind-free days, fumarole temperatures were highest. The escaping fumes were generally white in color, and miners were forced to pour water on the pipes to induce sulfur condensation. On windy, clouded days, fumes were much denser and yellow in color, covering all surfaces in a veneer of sulfur. At Fumarole d, this change in weather conditions from clear and wind free to windy and cloudy corresponded to a drop in fumarole temperature from 600 to 450°C. The changes in fumarole conditions were observed to occur rapidly (i.e., within 15 minutes of a cold front moving in), suggesting to the researchers the likelihood of extensive interaction between magmatic and atmospheric gases immediately below the dome's surface.
Crater lake and Banyu Pahit river. The temperature of the crater lake was monitored daily on the S shore below the dome from 8 to 21 July 2007; it varied between 36.1 and 37.4°C. These variations also corresponded to changes in the weather. A transect along the Banyu Pahit river (see map, below) from the dam to the bridge at Watu Capil, revealed that the water was a few degrees above ambient where it emerged, but was close to the air temperature from 500 m downstream. A strong, persistent increase in discharge was observed on 21 July 2007, returning flow to the levels of 1999.
Elemental fluxes. A survey of sulfur dioxide (SO2) fluxes was made using a portable UV spectrometer (FLYSPEC) on 11, 12, and 27 July 2007 along the SE rim of the crater (~ 2,350 m elevation) and involved, respectively, eight, sixteen, and seven walking traverses under the plume with the instrument pointed upwards.
The gas plume produced directly from the active solfatara (~ 2,150 m elevation) rose buoyantly before flowing over the crater rim. On 11 July, the maximum concentration path length of the gas in the plume fluctuated between 1,800 and 2,600 ppm-m over the eight scans made during a period of 3.5 hours. The wind speed (measured with a handheld anemometer at plume height) during this time averaged 2.9 m/s and the resultant SO2 flux was therefore calculated to average 219 metric tons per day (t/d), with a standard deviation of 99 t/d. On 12 July, the average gas concentration was similar, ranging between 1,600 and 3,000 ppm-m. The average wind speed during this survey period (3 hours) fluctuated between 2.0 and 4.5 m/s and the resultant SO2 flux averaged 185 t/d, with a standard deviation of 60 t/d.
On 27 July average gas concentrations were considerably higher, ranging from 2,200 to 13,000 ppm-m over two hours. The higher concentrations were a result of the plume being less dispersed. The average wind speed during this period ranged from 2.6 to 4 m/s and the resultant SO2 flux averaged 215 t/d, with a standard deviation of 68 t/d. Based on this very limited three-day survey, the average daily flux of SO2 was estimated to be 206 t/d and was lower than that measured during a two day survey last year by ~ 130 t/d (BGVN 32:02).
The amount of native sulfur precipitating at the solfatara can be roughly estimated from that mined, given that the bulk of this sulfur is recovered. Approximately 100 miners extract sulfur, removing it from the crater in two trips each day, and carrying on average 60-80 kg of sulfur per trip. This corresponds to the deposition of 14 t/d.
Fumarole gas samples collected using Giggenbach flasks complemented the FLYSPEC measurements and determine the flux of elements other than SO2, CO2, and H2O. Rock samples and water samples taken from the lake and acid springs will allow further quantification of the output of volatiles and metals.
Self-potential surveys. These are surveys that involve measurement at the ground surface of the local, static, direct-current potentials between electrodes inserted to shallow depth at known separation distances. The method is sometimes also called spontaneous potential and abbreviated as SP. These potentials develop from numerous sources, including fluid flow, diffusion, and oxidation and reduction reactions between minerals in contact with water.
As in 2006 (BGVN 32:02), SP surveys were conducted on the summit rim and also down the S flank to the intersection of the Banyupuhit river (dashed line, figure 8) and the main road. The survey was complemented by ground temperature measurements, which found the only thermal anomaly was located in the immediate vicinity of the dome. In comparison to 2006, only the N rim of the crater showed a significant SP variation, with a decrease of SP of ~ 100mV. This variation may indicate a slight decrease of the hydrothermal activity. While the SP values are minima, the SP/elevation gradient is still slightly positive (+0.03 mV/m) suggesting that the hydrothermal system on the N rim is strong enough to compensate for the influence of the hydrological zone, characterized on the E and NE by negative SP (with a minimum at -120 mV) and an inverse SP/elevation gradient of -1.07 mV/m. This almost certainly represents the inflow of meteoric water and groundwater.
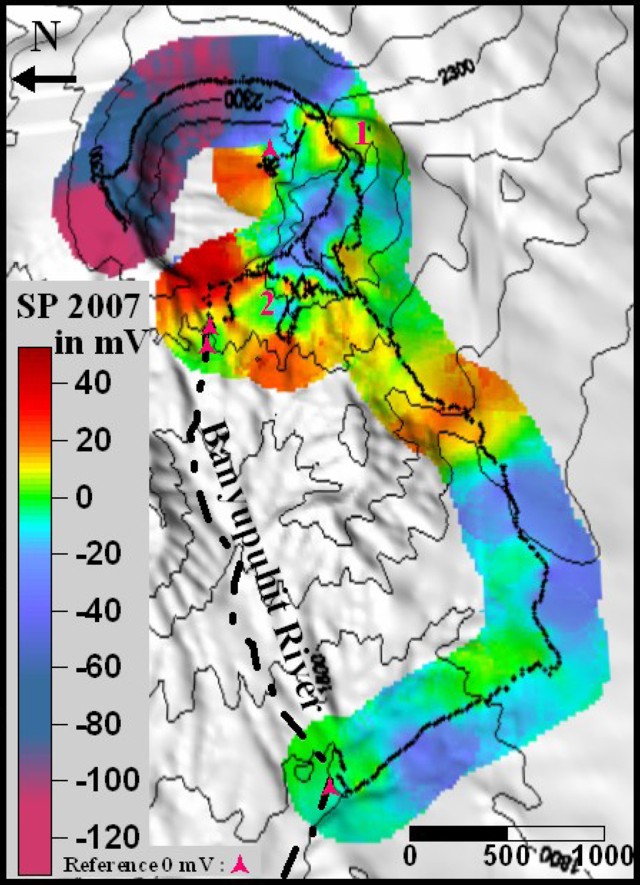 |
Figure 8. Self-potential (SP) survey results overlain on a digital elevation model (DEM) of the active crater of Kawah Ijen. All the SP data were referenced to the upper Banyupuhit river and to a spring on the inner E slope of the crater (triangles). Contour intervals are 100 m. Courtesy of G. Mauri and V. van Hinsberg. |
The 2006 SP survey suggested that the S and W flanks of the crater were characterized by a hydrothermal system; however, this year's SP and temperature study shows greater complexity. The main SP/elevation gradient is between -0.31 and -0.56 mV/m with a higher SP average than on the E rim (-4 mV in the S versus -70 mV in the E). This suggests that the S part of the crater is controlled mainly by the hydrological and underlying hydrothermal systems of the acid lake. Although some other small hydrothermal anomalies were found along the S and SW slopes (1 and 2 on figure 8), the area was principally characterized by hydrological systems.
Thus, while the presence of strong hydrothermal activity within the crater is unequivocal, the temperature and self-potential surveys to date show no evidence of it extending beyond the crater rim.
Information Contacts: Nathalie Vigouroux, Guillaume Mauri, and Glyn Williams-Jones, Department of Earth Sciences, Simon Fraser University, Burnaby, BC V5A 1S6, Canada (URL: http://www.sfu.ca/earth-sciences.html); Vincent van Hinsberg and Willy (A.E.) Williams-Jones, Department of Earth and Planetary Sciences, McGill University, Montreal, Quebec, Canada (URL: http://www.mcgill.ca/eps/); Asnawir Nasution, Department of Geology, Institut Teknologi Bandung, Bandung, Indonesia (URL: http://www.itb.ac.id).
Visual, geochemical, and geophysical observations during mid-2008
Our previous report on Ijen (BGVN 32:09) discussed the findings of a field visit during 6 July-2 August 2007 by researchers from Simon Fraser University, McGill University, and the Institut Teknologi Bandung (ITB). During their visit, this team documented degassing and increasing fumarole temperatures.
This team again conducted fieldwork at Ijen during 18 July-7 August 2008. This report discusses their findings. The East Java volcano is the scene of sulfur mining and a highly acidic lake.
Fumarole mound. In comparison to 2007, the fumarole mound of Kawah Ijen had changed substantially. The sulfur mining company had installed new pipes and constructed supporting walls. Combined with frequent spraying of water to cool the pipes, this has completely changed the surface coating of the mound. Furthermore, changes at the dome were noted. One area was flat in 2007, but sub-vertical in 2008, indicating an uplift of approximately 1 m. Uplift was also apparent in other areas, but could not be quantified.
Temperatures of the fumaroles were similar to those recorded in 2007. The exit temperature at the pipes varied between 150 and 230°C, with the highest values at pipes in flaming fumaroles (occasional flaming at pipe exits was observed when wind speed was low). Fumarole temperatures varied from 300°C (white fumes) to more than 580°C (flaming), but were highly variable with the weather conditions.
New fumarolic activity was observed W of the fumarole mound, both on the slope leading down to the lake and on the flank of the escarpment bordering the mound on the W (figure 9). According to the sulfur miners, these fumaroles appeared at the end of summer 2007. Temperatures were between 90 and 96°C and the fumaroles were coated in sulfur needles (figure 9). The location suggests a westward migration of the system.
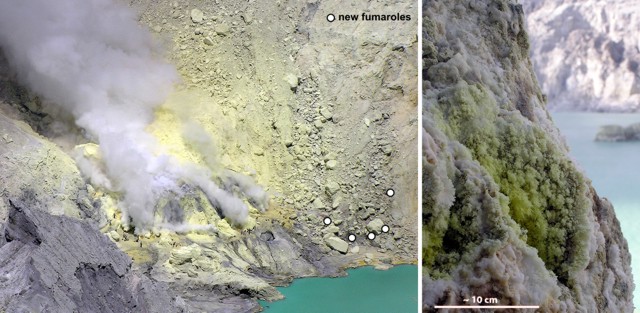 |
Figure 9. (left) Overview of the Kawah Ijen fumarole mound showing the locations of the new fumaroles (small dots). (right) Close up (with scale) of one of the new fumaroles on the flank of the escarpment bordering the mound on the W. Courtesy of the McGill University, Simon Fraser University, and the Institut Teknologi Bandung (ITB) research team. |
Giggenbach-bottles, condensates, silica tubes, and rock samples were collected on the fumarole mound. Measurements of SO2, CO2, and H2O in the fumes at the foot of the fumarole mound were also made using a multi-gas instrument (Shinohara, 2005).
Gas ratios and flux measurements. The ratios of H2O/CO2/SO2 gases in the fumarole gases were measured using a portable multi-gas sensor built at Simon Fraser University. A Licor IR spectrometer measured CO2 concentrations, an InterScan electochemical cell sensor measured SO2 contents, and a Vaisala P-T-RH weather station measured the H2O content of the plume. When compared to magmatic gas ratios estimated from undegassed melt inclusion data, the fumarole gases appear to span a range from relatively dry (H20-poor) and CO2-enriched compositions to H2O-enriched, CO2-poor compositions. All gas compositions were highly depleted in SO2.
Giggenbach gas samples from previous surveys (VSI unpublished data, Delmelle and Bernard, 2000) confirm that the gases from the mound have variable H2O/CO2 ratios. This trend cannot be explained by mixing of the gases with various amounts of atmosphere because nitrogen contents in the gas phase do not correlate. The Giggenbach data also confirms that the gases were depleted in total sulfur (SO2 + H2S + minor species) relative to magmatic ratios. These observations were consistent with the precipitation of sulfur-bearing compounds in the lake (Delmelle and Bernard, 2000).
The total flux of SO2 gas from the fumarole mound was measured using a FLYSPEC (portable UV spectrometer) and averages 200 tons/day. This translates to an average of 720 tons/day of CO2 and 3,900 tons/day of H2O released into the atmosphere. Combining the SO2 flux with the Stotal/element ratios in the gas measured with the Giggenbach bottles, the authors estimated the flux of certain metals and halogens into the atmosphere to be 10 tons/day Cl, 25 g/day Hg, and 1,000 g/day Se.
Lake and Banyu Pahit river. Crater lake conditions were the same as last year. Lake level was approximately 10 cm higher, water temperature at the foot of the fumaroles was 37-39°C and pH and electrical conductivity (EC) were -0.01 and 312.6 mS/cm, respectively. The acid spring in the valley next to the fumarole mound was also unchanged, with a temperature of 50°C, pH of 1.72, and EC of 20.1 mS/cm. Measurements of the gas bubbling up from the springs indicated that it contained more than 100 ppm SO2 and 2 wt. % CO2.
The team conducted a transect along the Banyu Pahit river from the dam on the western end of the lake, to where it meets the Paltuding-Pelalangan road. This revealed that the actual source of the river is a set of springs about halfway along this transect (figure 10), with the water emerging from a cliff on the E flank of the valley from between two lava flows. Two sets of earlier springs are present, one immediately below the dam with abundant gypsum deposits, and another where the first valley from the E merges with the Banyu Pahit (valley A in figure 10).
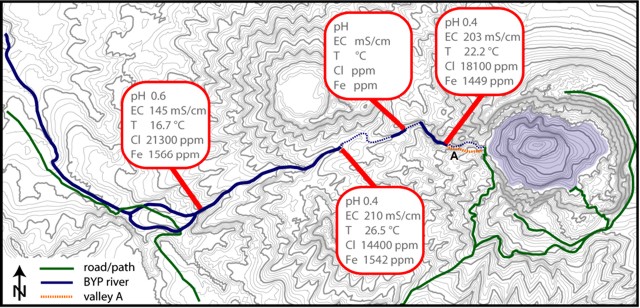 |
Figure 10. Overview map of Ijen showing the upstream part of the Banyu Pahit river, including locations of various springs as well as the pH, temperature (T), and EC of the water. The Cl and Fe content was determined by colorimetry. Courtesy of the McGill University, Simon Fraser University, and the Institut Teknologi Bandung (ITB) research team. |
Mapping along this transect revealed a thick sequence of phreatic, phreatomagmatic, and lahar deposits, as well as three distinct lava flows. Tracing these deposits upstream shows that they descended the Banyu Pahit valley, except for the most upstream part, where they follow valley A instead. This valley is blocked by a lava flow where it meets the lake, indicating that this flow postdates the deposits in the valley and that the section of the Banyu Pahit river immediately below the dam is relatively recent. The position of the second set of springs at the end of valley A may indicate that fluids are still making use of this original valley.
The team collected numerous samples of spring water, Banyu Pahit water, rocks and sediments along this part of the river to determine its sources and pathways. Preliminary field measurements are shown in figure 10.
Geophysical changes, summer 2006-2008. The gravity and differential GPS network of nine stations spread around the active crater, one at Paltuding and one at the volcanic observatory outside Ijen caldera were re-occupied each year. While no significant vertical deformation was observed on any of the stations, the dynamic gravity shows very strong variations between each year (figure 11). The mean error on gravity data was around 20 microGal, while the largest error was always less than 80 microGal. Between 2006 and 2007, the gravity change was of ~ 1,200 microGal (~ 1.2 mGal) and at the summit between 2007 and 2008 at ~ 300 microGal. This is in contrast to the "typical" gravity change of tens to hundreds microGal seen on active volcanoes (e.g., Rymer and others, 2005). At Ijen these changes are attributed to underground and surface water. Three arguments support this hypothesis, as follows.
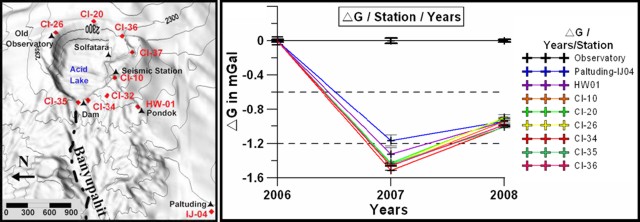 |
Figure 11. (left) Gravity survey stations from summer 2006 to summer 2008 on Kawah Ijen. The observatory station is the reference station, which was located outside the Ijen caldera at the volcanic observatory (SE corner of map). Stations labeled CI are around the crater rim. (right) Changes in gravity (DG, in milliGals) at for nine stations with respect to the years 2006-2008. Courtesy of the McGill University, Simon Fraser University, and the Institut Teknologi Bandung (ITB) research team. |
First, Kawah Ijen hosts a large and deep lake (~30 x 106 m3) (Takano and others, 2004), whose surface level changes over the years. While the survey was made during the dry season each year, there was still some change visible on shoreline of the lake. No accurate measurements were made until summer 2008.
Second, the water table, located on the E flank, flows towards the lake. No data of water depth existent for this water table, but the water flow generates a natural electrical current, which were measured each year by self-potential. As with the gravity variation, similar changes were observed on the electrical profile around the active crater. Between 2006 and 2007, a significant decrease of the SP anomalies (~ 120 mV) on the N and E crater rim was observed. (BGVN 32:09), while between 2007 and 2008, these anomaly increased (~ 70 mV) to an intermediate level, between 2006 and 2008.
Third, no significant deformation was observed since 2006 on the summit of Kawah Ijen.
The geophysical survey indicated that both gravity (figure 11) and self-potential (BGVN 32:09) show compatible variations during 2006-2008. There was a decrease of both gravity and self-potential between 2006 and 2007, followed by an increase between 2007 and 2008. This finding suggests that these variations were due to changes of the lake and fresh groundwater flowing from Gunung Merapi toward Kawah Ijen lake.
References. Delmelle, P., and Bernard, A., 2000, Downstream composition changes of acidic volcanic waters discharged into the Banyupahit stream, Ijen caldera, Indonesia:Journal of Volcanology and Geothermal Research, v. 97, p. 55–75.
Rymer, H., Locke, C.A., Brenes, J., and Williams-Jones, G., 2005, Magma plumbing processes for persistent activity at Poás Volcano, Costa Rica: Geophysical Research Letters, v. 32, p.. L08307, doi:10.1029/2004GL022284.
Shinohara, H., 2005, A new technique to estimate volcanic gas composition: plume measurements with an estimate of volcanic gas composition: plume measurements with a portable multi-sensor system: Journal of Volcanology and Geothermal Research, v. 143, p. 319-333.
Information Contacts: Vincent van Hinsberg, Stephanie Palmer, Julia King, and Willy (A.E.) Williams-Jones, Department of Earth and Planetary Sciences, McGill University, Montreal, Quebec, Canada (URL: http://www.mcgill.ca/eps/); Nathalie Vigouroux, Guillaume Mauri, and Glyn Williams-Jones, Department of Earth Sciences, Simon Fraser University, Burnaby, BC V5A 1S6, Canada (URL: http://www.sfu.ca/earth-sciences.html); Arif Susanto and Asnawir Nasution, Department of Geology, Institut Teknologi Bandung, Bandung, Indonesia (URL: http://www.itb.ac.id/).
Sharp increase in seismicity in December 2011 spurs evacuation preparations
Ijen, which hosts both the world's largest highly acidic lake and intensive sulfur mining operations, showed increased seismicity and SO2 emissions during October-December 2011. The increased activity caused the Center for Volcanology and Geological Hazard Mitigation (CVGHM) to raise the Alert Level from 1-2 (on a scale from 1-4) on 15 December. The Alert Level was then raised from 2-3 on 18 December following further increases in activity.
1 October-15 December 2011 activity. CVGHM reported increased seismicity beginning in October 2011. Seismicity remained increased, yet more-or-less constant, through 15 December (figure 12a). Shallow volcanic earthquakes showed the greatest increase. The onset of harmonic tremor was reported during the first week of December, and increased tremor amplitude was reported beginning on 5 December.
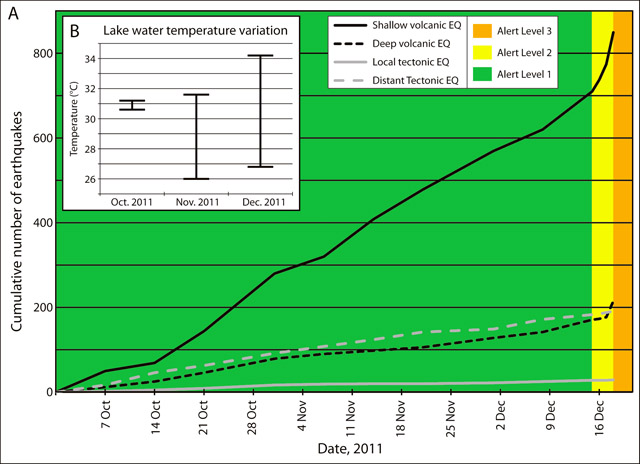 |
Figure 12. Reported seismicity (a) and crater lake temperatures (b) at Ijen during 1 October-17 December 2011. The Alert Level remained at 1 (green) until 15 December when it was raised to 2 (yellow); it was further increased to 3 (orange) on 18 December. Data courtesy of the Center for Volcanology and Geological Hazard Mitigation (CVGHM). |
Measured temperatures of the crater lake waters were mostly stable during October (ranging from 30.6-31.2°C), but showed significant variation and increased maximum temperatures during November and December 2011 (figure 12b). The measured pH of the crater lake waters also showed an increase during October-November, rising from 0.7±0.1 in October to 0.83±0.04 in November.
CVGHM also reported blasts of hot air and smoke that generated small plumes rising to 50-100 m above the peak in October, 50-150 m above the peak in November, and 50-200 m above the peak in December, outlining an increasing trend in the energy of the blasts. Plumes in October and November were reported to be sparse to medium white, while those in December were reported to be white to brown, indicating possible ash content in plumes generated during December.
During 1 October-15 December 2011, the color of the crater lake water remained whitish light green, and bubbling water was observed in the center of the lake. The area of bubbling water measured approximately 5 m in diameter. Clumps of sulphur were reported to coalesce in the center and on the shores of the crater lake. Vegetation in areas around the crater remained healthy.
On 15 December, CVGHM raised the Alert Level to 2, citing increased shallow and deep volcanic seismicity, the onset and increased amplitude of harmonic tremor 10 days prior, and visual observations as cause for concern. The CVGHM report expressed concern about possible phreatic, mud, or ash eruptions, and prohibited access to within 1 km of the crater lake.
Increased SO2 emissions. During the next few days, a sharp increase in shallow and deep volcanic seismicity (figure 12a) was accompanied by increased SO2 emissions. Observation on 17 December revealed the strong smell of sulphurous gases in the vicinity of the crater; so strong, in fact, that the CVGHM reported that measurements of lake water temperatures had become difficult without wearing a mask. The lake waters had changed color from whitish light green to completely white. All observations indicated an increased concentration of SO2 in the crater lake.
On 18 December, CVGHM raised the Alert Level to 3, and prohibited access to within 1.5 km of the crater lake. The Jakarta Post reported that the National Disaster Mitigation Agency (Badan Nasional Penanggulangan Bencana, BNPB) had prepared 466 million Indonesian Rupiah (US$51,260) in disaster-relief funds for the basic needs of evacuees for a two week period in the case that an evacuation occurred.
Information Contacts: Center for Volcanology and Geological Hazard Mitigation (CVGHM), Jl. Diponegoro 57, Bandung, West Java, Indonesia, 40 122 (URL: http://www.vsi.esdm.go.id/); The Jakarta Post, Jl. Palmerah Barat 142-143, Jakarta 10270 (URL: http://www.thejakartapost.com/).
2012 high seismicity, blasts, and subaqueous emissions; maps of complex
This report first documents earthquakes at or near Kawah Ijen and minor emissions within its crater lake during mid-December 2011 to mid-2012. These earthquakes and emissions were ongoing at press time.
The second and third subsections below present maps and background relating to the Ijen complex. As discussed in earlier reports, Ijen is the name often applied to the larger complex consisting of a large caldera and associated cones. Kawah Ijen is the name of the intracaldera cone that contains a crater with an acid briny lake 700 x 800 m in diameter. The coordinates cited in the header and Summary for this volcano refer to the approximate center of the lake (see photos of the lake in Photo Gallery and figure 4 in BGVN 32:02; Demelle and others, 2000; Takano and others, 2004). Kawah Ijen, the active vent of the complex, is known for hydrothermal and phreatic behavior in its crater lake. During this reporting interval an intrusion appears to have risen to a shallow depth beneath the crater lake. Subaqueous sulfur-bearing emissions seemingly occurred on the lake floor.
The last subsection briefly calls attention to sulfur mining near Kawah Ijen's crater lake. Laborers carry heavy loads of native sulfur across steep terrain as they breathe air rich in volcanic gases. Recent dental studies cited in this subsection compared the teeth and gums of laborers to residents living nearby who endured less exposure to the volcanic gases. They found that the laborers suffered more tooth and gum disorders.
Mid-December 2011 to mid-2012. According to a summary of activity by the Center for Volcanology and Geological Hazard Mitigation (CVGHM) and the USGS Volcano Disaster Assistance Program (VDAP), Ijen volcano has been in a state of heightened unrest centered at Kawah Ijen since May 2011, a time when teams installed, tested, and conducted training on the use of upgraded seismic instrumentation. As previously reported in BGVN 36:12, increased seismicity and fumarole temperatures caused CVGHM to raise the Alert Level from 1 to 2 (on a scale of 1-4) on 15 December 2011.
On 18 December, after observing further increases in both seismicity and degassing, CVGHM established Alert Level 3. In the next few months, scientists documented four periods of significant unrest. They occurred on 20 and 30 December 2011, 4 January 2012, and 2 March 2012.
On 1 January 2012, CVGHM recorded a swarm of earthquakes, raising concerns of renewed pressure in the then-inferred shallow magmatic system. The agency's reports also noted shifts in the rates of recent high-frequency earthquakes (believed to be associated with breaking rocks). Increases occurred in both low-frequency earthquakes and tremor (both believed to be associated with the movement of fluids). At the crater lake, debris (probably native sulfur) seen floating on the surface was judged as likely derived from emissions vented into the ~180-m-deep lake (Takano and others, 2004). Congruent with that interpretation, sulfurous-gas emissions measured just over the lake surface were very high at the time.
On 8 February 2012, after decreases in seismicity, and visual and thermal signs of unrest at Kawah Ijen, CVGHM lowered the Alert Level to 2.
Sharp increases in seismicity prevailed after 2 March 2012, which spurred CVGHM to raise the Alert Level to 3 on 12 March. Elevated crater lake temperatures (up to 43°C at 5 m depth) and gas plumes to 100-200 m above the summit had been reported. These observations led CVGHM and VDAP to suggest an intrusion of magma had reached the point where it caused perturbations to the extensive hydrothermal system in the shallow conduit and crater lake.
During 1-30 April 2012 white plumes from Kawah Ijen rose 100-200 m above the crater, and during 1-11 May diffuse white plumes rose 50-100 m above the crater. During this time and through 13 May, the amplitude and number of earthquakes gradually decreased and the crater lake water temperature decreased by 8°C. On 13 May 2012, CVGHM again lowered the Alert Level to 2. Later, on 24 July 2012, they again raised the Alert Level to 3. Authorities posted a 1.5-km-radius no-entry zone around the lake's center.
Visual and seismic observations published in CVGHM's report of 24 July 2012 indicated repeated hot air-blasts during 1-24 July. The blasts sent plumes rising to 50-100 m over the summit, and registered seismically as follows: 1-7 July, 8 blasts; 8-14 July, 12; 15-21 July, 40; and 22-24 July, 32. During those same intervals volcanic earthquakes occurred between 36 and 273 times per interval, with the maximum occurring during 15-21 July, the same interval as the largest number of air-blasts (but not the highest average rate of air blasts per day, which occurred during 22-24 July). Various other earthquake types were recorded in the same report. Although background seismicity typically had amplitudes in the range 0.5-5 mm, many of the larger amplitude air-blasts reached 20-40 mm with durations up to 18 seconds.
Maps, hazards, and Ijen's Merapi. The Ijen complex resides at the E end of Java just across the strait from Bali (figure 13, inset map). Kawah Ijen sits at the E end of the complex within the caldera (figure 13, main map).
|
Figure 13. (Inset, upper left) Overview map illustrating the Ijen volcanic complex located in Eastern Java, accross the strait from Bali. (Main map) The large sub-circular shape indicates the margin of the Ijen caldera. The active Kawah Ijen cone is in the E part of the caldera. The solid and dashed line segments respectively discriminate between the well constrained N topographic margin ("Kendeng caldera wall") and the inferred S margin. Associated volcanic centers reside both inside the caldera (lightly shaded triangles), and on the rim (solid black triangles). In this interpretation of the caldera, it is ~13 km wide. The caldera drains to the N in a river system that starts at the outflow from the crater lake. The major river is called Banyu Pahit (also spelled Banyuputhih). Raung and Suket cones sit W of and outside the Ijen complex. From van Hinsberg and others (2010). |
Figures 14 and 15 illustrate foreseen hazardous areas and the regional context, including cities around the Ijen complex. The circles shown on both maps are centered around the Kawah Ijen cone and its crater lake.
|
Figure 14. Map of the Ijen complex showing hazard zones (Yellow–Zone I; Pink–Zone II, and Red–Zone III; as described in the legend at right). For scale, a small (rather faint) inner red dashed ring around Kawah Ijen crater and the lake it encloses has a diameter of 1.5 km; the pink dashed ring, 6 km, and the outer yellow ring, 8 km. The lake's surface is at 2,200 m elevation. Note location of observation posts. The large urban area on the N coast has a population of 1.5 million and is here labeled Trigonco (but other local names apply, as seen in figure 15). Map extracted from an original prepared by Mulyana, A.R., Effendi, W., Karim, A., and Rukada, T. (2006). Courtesy of CVGHM and VDAP. |
|
Figure 15. A hazard map of the Ijen complex at slightly smaller scale than figure 14, with names of key drainages that could funnel floods, lahars, pyroclastic flows, and lavas. Original source unknown; from van Bergen and others (2000). |
Both figures 14 and 15 emphasize the attendant lahar hazards. Regarding floods and lahars, the crater lake at Kawah Ijen has a volume of ~30 million cubic meters, all or part of which could be expelled in an eruption or breakout due to crater-wall failure, an event that could send acidic brines down one or more of the drainages. About 5,000 people live within 10 km of the lake but farther away, many thousands more would be at risk in the event of large lahars.
The port cities to the N have a population of ~1.5 million and lie near the mouth of a river representing the main drainage from within the caldera, including the controlled outflow from the crater lake (figures 14 and 15).
As seen on a relief map (figure 16), Merapi (on the far E side of the caldera) forms the highest point in the complex, 2,799 m (and reflects the summit elevation value we typically provide for the complex). Merapi is the same name applied to the better-known, regularly erupting volcano in Central Java near the city of Yogyakarta. Another potential confusion is the volcano Marapi on the island of Sumatra.
|
Figure 16. Shaded relief map of the Ijen (shown here as the Idjen) volcanic complex published in 1937 ("Topogr. Dienst, 1937"). Kawah Ijen cone, with its associated crater and lake, appears near the E side of the complex on the flank of the taller Merapi cone. Prominent topographic highs are labeled, typically preceded by the letter G (from the word Gunung, which means peak or mount in Indonesian). Courtesy of Wikipedia. |
Figure 16 shows the Kendeng mountains defining the caldera's arcuate topographic margin bounding the N (with elevations up to 1,559 m). The lowest point of the caldera's N rim (~850 m) occurs near Blawan village at the breach in the caldera wall. Starting at the SE, the major cones on or near the S margin (on this map) are Merapi (2,799 m, and on its flanks, Kawah Ijen at 2,386 m), Rante, and the closely spaced Pendil Djampit.
Just N of Pendil Djampit lies a fault with offset down towards the caldera (figure 17). It trends NW and curves to the N, helping to establish the path of the inferred SW caldera margin (figure 13).
|
Figure 17. Sketch map of Ijen showing several faults and the morphology of the string of eruptive centers strung E to W across the caldera floor. From van Bergen and others (2000). |
A separate volcano in the GVP database, Raung (Raoeng) stratovolcano (3,332 m), forms a distant topographic feature well to the W of the flat caldera floor and SW boundary (figures 13, 16, and 17). As here defined, Raung includes two other remote cones as subfeatures. One is the cone located to Raung's NE, Soeket (Suket) stratovolcano (2,950 m). Both Suket and Raung lie along the western topographic divide for the drainage basin that feeds into the Ijen complex.
Model of the crater-lake system. Given the recent concerns about activity in Kawah Ijen's crater lake, a simple model of the shallow crust in this area provides a way to help visualize conditions and processes in the subsurface. Figure 18 shows the general situation as put forth in a simple sketch by Alain Bernard (van Bergen and others, 2000).
|
Figure 18. A simplified model of the environment and subsurface associated with Kawah Ijen's crater lake. This illustrates some of the factors associated with the lake's chemistry, including rainfall, runoff, surface-rock weathering, and the interconnected hydrothermal, geochemical, and magmatic systems. Taken from van Bergen and others (2000). |
van Bergen and others (2000) made the following remarks: "The lake chemistry is determined by dissolution of magmatic volatiles, fluid-rock interaction, evaporation of the lake water, dilution by meteoric water and recycling of lake water through seepage into the subsurface hydrothermal system. The lake acts as [a] chemical condenser for volatiles and as a calorimeter trapping heat supplied by a shallow magmatic reservoir. Magmatic volatiles can be supplied to the crater lake system by direct injection of magmatic vapours (SO2, H2S, HCl, and HF) via subaqueous fumaroles or via hot brines entering at the lake bottom."
van Hinsberg and others (2010) stated the following: "The crater lake of Kawah Ijen volcano represents the largest body of natural hyperacidic brine in the world (Delmelle and Bernard, 1994) and has been present since at least 1789 (cf. Bosch, 1858). It is characterised by a singularly high dissolved element load (>100 g/L) and very low pH. Fluids from the crater lake seep through [Kawah Ijen's] western flank to form the acid Banyu Pahit river, the water of which is eventually used for irrigation 40 km downstream [to the N] of the lake in the coastal plain of Asambagus."
Sulfur mining. A strongly active solfatara field (fumaroles that are characteristically sulfurous) is present in the SE part of Kawah Ijen's crater near the lakeshore, where sulfur-mining activities have existed for many decades (see figure 8 in BGVN 32:09). Local workers channel some of the fumarolic gases and molten condensates through pipes and out onto the ground. Once the liquid cools and hardens, workers break the solid sulfur into large pieces and load it into baskets for manual transport out of the crater. According to Wikipedia, miners carry loads of sulfur ore blocks ranging from 75 to 90 kg up a steep trail to the crater rim and then 3 km down the mountain to a weighing station. That and many other web sites show photos of the mining process. Among the more recent photos of the scene are those by Oliver Grunewald (2010) on the 'boston.com' web site. He points out that few of the miners possess gas masks.
Two dental studies of miners concluded that they had both higher incidence of dental erosion to the enamel on their teeth (Pranani and Wibisono, 2008) and the gum disease gingivitis (Anitasari and Wibisono, 2008). Both studies attribute these problems to exposure to sulfuric acid fumes. The studies were small (30 miners) and for comparison (control groups) used similar numbers of residents who lived around the mine but did not work as miners.
References. Anitasari, S. and Wibisono, G., 2008, Relationship between the length of sulphuric acid fumes exposure and the grade of gingivitis, Studies on the Sulphur Miners at Mount Ijen Banyuwangi East Java, Fakultas Kedokteran, Disusun oleh:NIM: G2A004170, Fakultas Kedokteran, Universitas Diponegoro, Semaran, 18 pp.
Bosch, C.J., 1858. Uitbarstingen der vulkanen Idjin en Raun (Banjoewangi). Tijdschrift voor Indische Taal-, Land- en Volkenkunde, Deel 7, 265–286.
Delmelle, P., Bernard, A., Kusakabe, M., Fischer, T.P., and Takanod, B., 2006, Geochemistry of the magmatic–hydrothermal system of Kawah Ijen volcano, East Java, Indonesia, J. of Volcanology and Geothermal Research, Vol. 97, Issues 1-4, April 2000, pp. 31-53.
Grunewald, O., 2010, Kawah Ijen at night, Updated 8 December 2010, Accessed 7 Sept 2012 (URL: http://www.boston.com/bigpicture/2010/12/kawah_ijen_by_night.html).
Topogr. Dienst, 1937, Atlas van Tropisch Nederland, original reproduced on Wikipedia Commons web site (http://commons.wikipedia.org/wiki/File:Ijen.JPG) entitled 'Ijen', Updated 17 June 2012, Accessed 29 August 2012.
Mulyana, A.R., Effendi, W., Karim, A., and Rukada, T., 2006, [Ijen hazards map, figure 14 (further citation details currently unavailable)].
Pranani, D. and Wibisono, G., 2008, The influence of sulphuric acid fumes exposure on the incidence of dental erosion, Study on sulphuric miner in Mount Ijen, Banyuwangi, East Java, Dyah Pranani, NIM: G2a004055, Fakultas Kedokteran, Universitas Diponegoro Semarang, 18 pp.
Takano, B., Suzuki, K., Sugimori, K., Ohba, T., Fazlullin, S.M., Bernard, A., Sumarti, S., Sukhyar, R., and Hirabayashi, M., 2004, Bathymetric and geochemical investigation of Kawah Ijen Crater Lake, East Java, Indonesia, J. of Volcanology and Geothermal Research, vol. 135, Issue 4, pp. 299–329.
van Bergen, M.J., Bernard, A., Sumarti, S., Sriwana, T., and Sitorus, K., 2000, Crater lakes of Java: Dieng, Kelud and Ijen, Excursion Guidebook, IAVCEI General Assembly, Bali 2000, 43 p.
van Hinsberg, V., Berlo, K., and van Bergen, M.J., 2010, Extreme alteration by hyperacidic brines at Kawah Ijen volcano, East Java, Indonesia: I. Textural and mineralogical imprint, J. of Volcanology and Geothermal Research, Vol. 198, Issues 1–2, pp. 253–263.
Information Contacts: Center of Volcanology and Geological Hazard Mitigation (CVGHM), Jalan Diponegoro 57, Bandung 40122, Indonesia (URL: http://www.vsi.esdm.go.id/); Volcano Disaster Assistance Program (VDAP), US Geological Survey (USGS), 1300 SE Cardinal Court, Bldg. 10, Suite 100, Vancouver, WA 98683.
|
|
||||||||||||||||||||||||||||
There is data available for 9 confirmed eruptive periods.
[ 2002 Jul 29 - 2002 Aug 15 ± 3 days ] Uncertain Eruption
| Episode 1 | Eruption (Explosive / Effusive) | Kawah Ijen | ||||||||||||||||||||||||||||
|---|---|---|---|---|---|---|---|---|---|---|---|---|---|---|---|---|---|---|---|---|---|---|---|---|---|---|---|---|---|
| 2002 Jul 29 - 2002 Aug 15 ± 3 days | Evidence from Unknown | ||||||||||||||||||||||||||||
|
List of 4 Events for Episode 1 at Kawah Ijen
|
|||||||||||||||||||||||||||||
[ 2000 Sep 1 ± 5 days - 2000 Sep 10 ± 3 days ] Uncertain Eruption
| Episode 1 | Eruption (Explosive / Effusive) | Kawah Ijen | ||||||||||||||||||||||||||||||||||||||
|---|---|---|---|---|---|---|---|---|---|---|---|---|---|---|---|---|---|---|---|---|---|---|---|---|---|---|---|---|---|---|---|---|---|---|---|---|---|---|---|
| 2000 Sep 1 ± 5 days - 2000 Sep 10 ± 3 days | Evidence from Unknown | ||||||||||||||||||||||||||||||||||||||
|
List of 6 Events for Episode 1 at Kawah Ijen
|
|||||||||||||||||||||||||||||||||||||||
1999 Jun 28 - 1999 Jun 28 Confirmed Eruption (Explosive / Effusive) VEI: 1 (?)
| Episode 1 | Eruption (Explosive / Effusive) | Kawah Ijen | ||||||||||||||||||||||||||||||||||||||||||||||||
|---|---|---|---|---|---|---|---|---|---|---|---|---|---|---|---|---|---|---|---|---|---|---|---|---|---|---|---|---|---|---|---|---|---|---|---|---|---|---|---|---|---|---|---|---|---|---|---|---|---|
| 1999 Jun 28 - 1999 Jun 28 | Evidence from Observations: Reported | ||||||||||||||||||||||||||||||||||||||||||||||||
|
List of 8 Events for Episode 1 at Kawah Ijen
|
|||||||||||||||||||||||||||||||||||||||||||||||||
1994 Feb 3 - 1994 Feb 3 Confirmed Eruption (Explosive / Effusive) VEI: 1
| Episode 1 | Eruption (Explosive / Effusive) | Kawah Ijen | |||||||||||||||||||||||
|---|---|---|---|---|---|---|---|---|---|---|---|---|---|---|---|---|---|---|---|---|---|---|---|---|
| 1994 Feb 3 - 1994 Feb 3 | Evidence from Observations: Reported | |||||||||||||||||||||||
|
List of 3 Events for Episode 1 at Kawah Ijen
|
||||||||||||||||||||||||
1993 Jul 3 - 1993 Aug 1 Confirmed Eruption (Explosive / Effusive) VEI: 1
| Episode 1 | Eruption (Explosive / Effusive) | Kawah Ijen | ||||||||||||||||||||||||||||
|---|---|---|---|---|---|---|---|---|---|---|---|---|---|---|---|---|---|---|---|---|---|---|---|---|---|---|---|---|---|
| 1993 Jul 3 - 1993 Aug 1 | Evidence from Observations: Reported | ||||||||||||||||||||||||||||
|
List of 4 Events for Episode 1 at Kawah Ijen
|
|||||||||||||||||||||||||||||
1952 Apr 22 - 1952 Apr 24 ± 1 days Confirmed Eruption (Explosive / Effusive) VEI: 1
| Episode 1 | Eruption (Explosive / Effusive) | Kawah Ijen | |||||||||||||||||||||||||||||||||
|---|---|---|---|---|---|---|---|---|---|---|---|---|---|---|---|---|---|---|---|---|---|---|---|---|---|---|---|---|---|---|---|---|---|---|
| 1952 Apr 22 - 1952 Apr 24 ± 1 days | Evidence from Observations: Reported | |||||||||||||||||||||||||||||||||
|
List of 5 Events for Episode 1 at Kawah Ijen
|
||||||||||||||||||||||||||||||||||
1936 Nov 5 - 1936 Nov 25 Confirmed Eruption (Explosive / Effusive) VEI: 2
| Episode 1 | Eruption (Explosive / Effusive) | Kawah Ijen | |||||||||||||||||||||||
|---|---|---|---|---|---|---|---|---|---|---|---|---|---|---|---|---|---|---|---|---|---|---|---|---|
| 1936 Nov 5 - 1936 Nov 25 | Evidence from Observations: Reported | |||||||||||||||||||||||
|
List of 3 Events for Episode 1 at Kawah Ijen
|
||||||||||||||||||||||||
1917 Feb 25 - 1917 Mar 14 Confirmed Eruption (Explosive / Effusive) VEI: 1
| Episode 1 | Eruption (Explosive / Effusive) | Kawah Ijen | ||||||||||||||||||
|---|---|---|---|---|---|---|---|---|---|---|---|---|---|---|---|---|---|---|---|
| 1917 Feb 25 - 1917 Mar 14 | Evidence from Observations: Reported | ||||||||||||||||||
|
List of 2 Events for Episode 1 at Kawah Ijen
|
|||||||||||||||||||
1817 Jan 15 - 1817 Feb 18 (?) Confirmed Eruption (Explosive / Effusive) VEI: 2
| Episode 1 | Eruption (Explosive / Effusive) | Kawah Ijen | ||||||||||||||||||||||||||||||||||||||||||||||||
|---|---|---|---|---|---|---|---|---|---|---|---|---|---|---|---|---|---|---|---|---|---|---|---|---|---|---|---|---|---|---|---|---|---|---|---|---|---|---|---|---|---|---|---|---|---|---|---|---|---|
| 1817 Jan 15 - 1817 Feb 18 (?) | Evidence from Observations: Reported | ||||||||||||||||||||||||||||||||||||||||||||||||
|
List of 8 Events for Episode 1 at Kawah Ijen
|
|||||||||||||||||||||||||||||||||||||||||||||||||
1796 Confirmed Eruption (Explosive / Effusive) VEI: 2
| Episode 1 | Eruption (Explosive / Effusive) | Kawah Ijen | |||||||||||||||||||||||
|---|---|---|---|---|---|---|---|---|---|---|---|---|---|---|---|---|---|---|---|---|---|---|---|---|
| 1796 - Unknown | Evidence from Observations: Reported | |||||||||||||||||||||||
|
List of 3 Events for Episode 1 at Kawah Ijen
|
||||||||||||||||||||||||
0640 BCE ± 50 years Confirmed Eruption (Explosive / Effusive)
| Episode 1 | Eruption (Explosive / Effusive) | Kawah Ijen | ||||||||||||||||||
|---|---|---|---|---|---|---|---|---|---|---|---|---|---|---|---|---|---|---|---|
| 0640 BCE ± 50 years - Unknown | Evidence from Isotopic: 14C (uncalibrated) | ||||||||||||||||||
|
List of 2 Events for Episode 1 at Kawah Ijen
|
|||||||||||||||||||
This compilation of synonyms and subsidiary features may not be comprehensive. Features are organized into four major categories: Cones, Craters, Domes, and Thermal Features. Synonyms of features appear indented below the primary name. In some cases additional feature type, elevation, or location details are provided.
Synonyms |
||||
| Kendeng | ||||
Cones |
||||
| Feature Name | Feature Type | Elevation | Latitude | Longitude |
| Anjar, Gunung | Cone | 1718 m | ||
| Cemara, Gunung
Tjemara, Gunung |
Cone | 1776 m | ||
| Cilik, Gunung
Tjilik, Gunung |
Cone | 1672 m | ||
| Gelaman, Gunung | Cone | 1762 m | ||
| Gendingwaluh, Gunung | Cone | 1519 m | ||
| Genteng, Gunung | Cone | 1712 m | ||
| Kukusan
Koekoesan |
Cone | 1994 m | ||
| Lingker, Gunung | Cone | 1630 m | ||
| Melaten, Gunung | Cone | 1552 m | ||
| Merapi, Gunung | Stratovolcano | 2769 m | 8° 3' 45.00" S | 114° 15' 45.00" E |
| Papak, Gunung | Cone | 2099 m | ||
| Pawenen, Gunung | Cone | 2123 m | ||
| Pendil, Gunung | Cone | 2368 m | 8° 6' 9.00" S | 114° 8' 8.00" E |
| Rante | Stratovolcano | 2590 m | 8° 5' 59.00" S | 114° 12' 51.00" E |
| Ringgit, Gunung | Cone | 1965 m | ||
| Widadaren | Cone | |||
Craters |
||||
| Feature Name | Feature Type | Elevation | Latitude | Longitude |
| Ijen
Kendeng |
Caldera | 1454 m | 8° 2' 30.00" S | 114° 11' 0.00" E |
| Ijen, Kawah
Idjen, Kawah |
Crater | 2154 m | 8° 3' 30.00" S | 114° 14' 30.00" E |
| Telagawaru | Crater | 1884 m | ||
| Wurung, Kawah
Woeroeng, Kawah |
Crater | 1708 m | 8° 3' 59.00" S | 114° 11' 59.00" E |
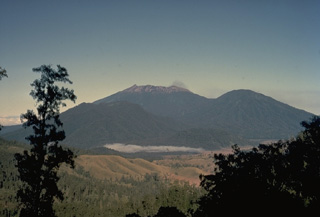 The summit of the massive Raung volcano, part of a group of volcanoes along a NW-SE-trending line near the eastern tip of Java, is truncated by a steep-walled, 2-km-wide caldera. This view from Ijen caldera NW of Raung shows Raung at the center and Gunung Suket on the right. Raung is one of Java's most active volcanoes, producing frequent explosive eruptions from a central cone within the caldera.
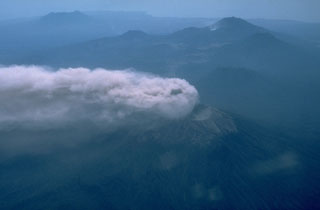 An aerial view from the SW on 12 September 1991 shows an eruption plume from Raung volcano in eastern Java dispersed to the NW by strong winds. Behind Raung is Ijen caldera, capped by the post-caldera cone of Gunung Merapi (upper right). The light spot below and to the left of Merapi is Kawah Ijen, a renowned crater lake. The flat-topped volcano at the upper left is Gunung Baluran, which occupies the NE-most tip of the island of Java.
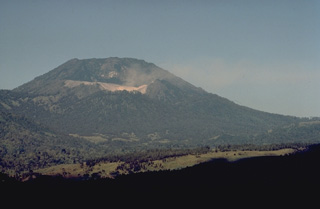 The light-colored area below the summit of flat-topped Gunung Merapi, the highest peak of Ijen volcano, is the crater rim of Kawah Ijen, the renowned sulfur-bearing lake. Gunung Merapi, seen here from within the caldera, was constructed over the eastern rim of the 20-km-wide Ijen caldera.
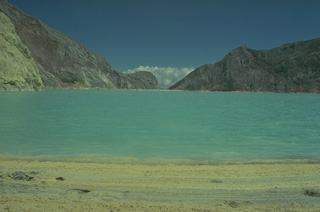 Kawah Ijen, at the eastern tip of Java, contains a 1-km-wide turquoise-colored crater lake with sulfur-stained walls. Strand lines of sulfur can be seen along the shores of the lake, where elemental sulfur is mined. Small phreatic eruptions have taken place from the lake in historical time.
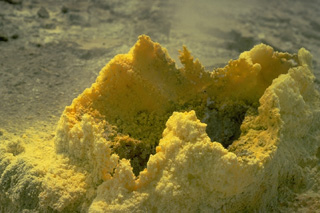 Brilliant yellow sulfur crystals are deposited around a fumarole vent in Indonesia's Kawah Ijen, a crater within the Ijen caldera at the eastern tip of the island of Java. Sulfur is deposited over broad areas around the Kawah Ijen crater lake and is mined for elemental sulfur.
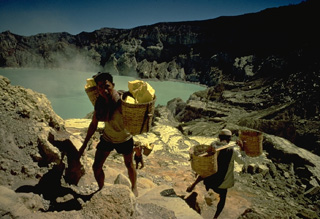 Kawah Ijen crater within the Ijen caldera is noted for its deposits of sulfur. Large blocks of the elementally pure sulfur are broken off with hammers and carried laboriously out of the crater in baskets before being transported to a sulfur mill on the SE flank of the caldera.
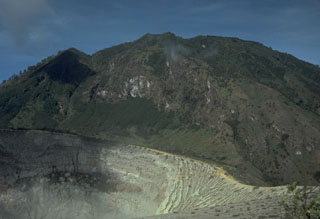 Kawah Ijen crater in the foreground is constructed on the flank of Gunung Merapi, the highest peak of the Ijen volcanic complex. Gunung Merapi, less known than the Merapi volcano of central Java, was constructed on the eastern rim of Ijen caldera.
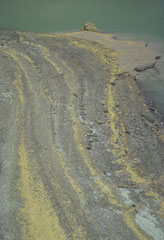 The yellow stripes in the foreground are strandlines of elemental sulfur particles that have been washed up on the shoreline of Kawah Ijen lake by wave action. The crater walls of Kawah Ijen have been the site of a long-term sulfur-mining operation.
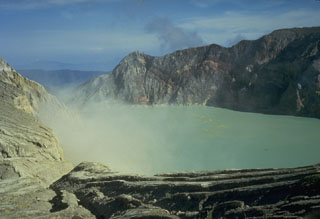 Active fumaroles on the SE crater wall of the highly acidic Kawah Ijen crater lake, within one of the cones that formed in the 20-km-wide Ijen caldera. The 1-km-wide turquoise-colored crater lake is near the eastern rim of Ijen caldera and has been the site of phreatic eruptions in historical time and is noted for its sulfur deposits.
 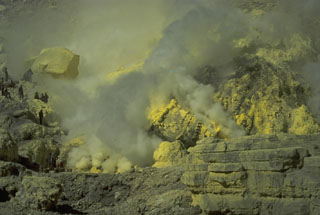 Sulfur miners (left) extract sulfur from the crater walls of Kawah Ijen. Large baskets of sulfur are carried up to the crater rim and down its flanks. The sulfur factory is located at Jambu, on the SE flank above Banyuwangi.
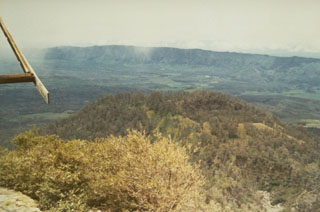 The floor of the 20-km-wide Ijen caldera and its western caldera rim are visible from the rim of Kawah Ijen, a post-caldera cone containing a crater lake. Following formation of the caldera during the Pleistocene, Gunung Merapi was constructed on its eastern rim along with other craters and cones within the southern part of the caldera and along its southern rim.
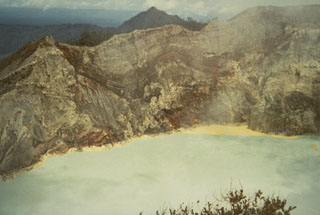 Hydrothermally altered rocks are exposed in the NW crater wall of Kawah Ijen in 1973. Rafts of yellow floating sulfur line the shore of the turquoise-colored crater lake. The walls of the 1.2-km-wide crater rise to more than 200 m above the surface of the lake, which has a maximum depth of 200 m.
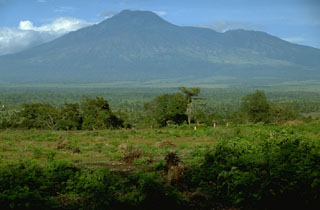 Gunung Merapi, less known than the renowned Merapi volcano of central Java, is located on the E rim of the 20-km-wide Ijen caldera in easternmost Java. The crater lake of Kawah Ijen is located behind the right-hand skyline of this view from the NW.
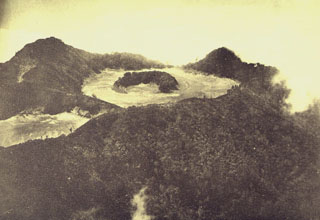 Gunung Merapi, constructed on the eastern rim of Ijen caldera, is the volcano's highest peak. The summit of Gunung Merapi, seen here in an aerial view from the NW, is truncated by a flat-floored crater that contains an arcuate forested rim of a cone.
 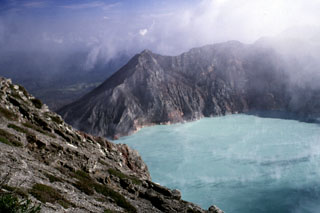 The steaming surface of Kawah Ijen crater lake from the southern rim in July 2000. The outlet of the lake is blocked by a small dam to the left. The maximum depth of the lake in 1996 was 180 m and the volume of the lake had gradually decreased from 0.044 km3 in 1922 to 0.036 km3 in 1996. The location of the most active vents below the lake surface have shifted to the W, towards the dam.
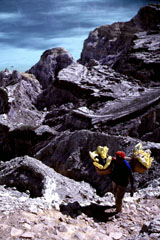 A sulfur miner carries baskets of elementally pure sulfur from a geothermal area near the shore of Kawah Ijen lake in eastern Java. Large blocks of sulfur are broken off and carried out of the crater in baskets before being transported to a sulfur mill on the SE flank of the Ijen caldera. The perspective in this view from near the SE crater lake rim looks down on the surface of the crater lake.
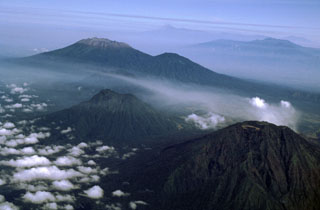 Raung volcano, with its unvegetated summit caldera and Suket peak to the NE, is at the upper left in this aerial view from the eastern tip of Java. In the foreground are Gunung Rante (left-center) and Gunung Merapi (lower right), constructed near the margin of the Ijen caldera complex. The Semeru-Tengger caldera complex is on the far right-center horizon, and the Iyang-Argapura complex is on the upper right.
The following 1 samples associated with this volcano can be found in the Smithsonian's NMNH Department of Mineral Sciences collections, and may be availble for research (contact the Rock and Ore Collections Manager). Catalog number links will open a window with more information.
| Catalog Number | Sample Description | Lava Source | Collection Date |
|---|---|---|---|
| NMNH 116701-3 | Pyroclastic Rock | -- | -- |
| Copernicus Browser | The Copernicus Browser replaced the Sentinel Hub Playground browser in 2023, to provide access to Earth observation archives from the Copernicus Data Space Ecosystem, the main distribution platform for data from the EU Copernicus missions. |
| MIROVA | Middle InfraRed Observation of Volcanic Activity (MIROVA) is a near real time volcanic hot-spot detection system based on the analysis of MODIS (Moderate Resolution Imaging Spectroradiometer) data. In particular, MIROVA uses the Middle InfraRed Radiation (MIR), measured over target volcanoes, in order to detect, locate and measure the heat radiation sourced from volcanic activity. |
| MODVOLC Thermal Alerts | Using infrared satellite Moderate Resolution Imaging Spectroradiometer (MODIS) data, scientists at the Hawai'i Institute of Geophysics and Planetology, University of Hawai'i, developed an automated system called MODVOLC to map thermal hot-spots in near real time. For each MODIS image, the algorithm automatically scans each 1 km pixel within it to check for high-temperature hot-spots. When one is found the date, time, location, and intensity are recorded. MODIS looks at every square km of the Earth every 48 hours, once during the day and once during the night, and the presence of two MODIS sensors in space allows at least four hot-spot observations every two days. Each day updated global maps are compiled to display the locations of all hot spots detected in the previous 24 hours. There is a drop-down list with volcano names which allow users to 'zoom-in' and examine the distribution of hot-spots at a variety of spatial scales. |
|
WOVOdat
Single Volcano View Temporal Evolution of Unrest Side by Side Volcanoes |
WOVOdat is a database of volcanic unrest; instrumentally and visually recorded changes in seismicity, ground deformation, gas emission, and other parameters from their normal baselines. It is sponsored by the World Organization of Volcano Observatories (WOVO) and presently hosted at the Earth Observatory of Singapore.
GVMID Data on Volcano Monitoring Infrastructure The Global Volcano Monitoring Infrastructure Database GVMID, is aimed at documenting and improving capabilities of volcano monitoring from the ground and space. GVMID should provide a snapshot and baseline view of the techniques and instrumentation that are in place at various volcanoes, which can be use by volcano observatories as reference to setup new monitoring system or improving networks at a specific volcano. These data will allow identification of what monitoring gaps exist, which can be then targeted by remote sensing infrastructure and future instrument deployments. |
| Volcanic Hazard Maps | The IAVCEI Commission on Volcanic Hazards and Risk has a Volcanic Hazard Maps database designed to serve as a resource for hazard mappers (or other interested parties) to explore how common issues in hazard map development have been addressed at different volcanoes, in different countries, for different hazards, and for different intended audiences. In addition to the comprehensive, searchable Volcanic Hazard Maps Database, this website contains information about diversity of volcanic hazard maps, illustrated using examples from the database. This site is for educational purposes related to volcanic hazard maps. Hazard maps found on this website should not be used for emergency purposes. For the most recent, official hazard map for a particular volcano, please seek out the proper institutional authorities on the matter. |
| IRIS seismic stations/networks | Incorporated Research Institutions for Seismology (IRIS) Data Services map showing the location of seismic stations from all available networks (permanent or temporary) within a radius of 0.18° (about 20 km at mid-latitudes) from the given location of Ijen. Users can customize a variety of filters and options in the left panel. Note that if there are no stations are known the map will default to show the entire world with a "No data matched request" error notice. |
| UNAVCO GPS/GNSS stations | Geodetic Data Services map from UNAVCO showing the location of GPS/GNSS stations from all available networks (permanent or temporary) within a radius of 20 km from the given location of Ijen. Users can customize the data search based on station or network names, location, and time window. Requires Adobe Flash Player. |
| DECADE Data | The DECADE portal, still in the developmental stage, serves as an example of the proposed interoperability between The Smithsonian Institution's Global Volcanism Program, the Mapping Gas Emissions (MaGa) Database, and the EarthChem Geochemical Portal. The Deep Earth Carbon Degassing (DECADE) initiative seeks to use new and established technologies to determine accurate global fluxes of volcanic CO2 to the atmosphere, but installing CO2 monitoring networks on 20 of the world's 150 most actively degassing volcanoes. The group uses related laboratory-based studies (direct gas sampling and analysis, melt inclusions) to provide new data for direct degassing of deep earth carbon to the atmosphere. |
| Large Eruptions of Ijen | Information about large Quaternary eruptions (VEI >= 4) is cataloged in the Large Magnitude Explosive Volcanic Eruptions (LaMEVE) database of the Volcano Global Risk Identification and Analysis Project (VOGRIPA). |
| EarthChem | EarthChem develops and maintains databases, software, and services that support the preservation, discovery, access and analysis of geochemical data, and facilitate their integration with the broad array of other available earth science parameters. EarthChem is operated by a joint team of disciplinary scientists, data scientists, data managers and information technology developers who are part of the NSF-funded data facility Integrated Earth Data Applications (IEDA). IEDA is a collaborative effort of EarthChem and the Marine Geoscience Data System (MGDS). |

