
The Pusat Vulkanologi dan Mitigasi Bencana Geologi (PVMBG) reported that eruptive activity at Raung continued during 9-15 July. On most days white plumes were visible rising as high as 800 m above the summit and drifting N and S; weather conditions sometimes prevented visual observations. At 1923 on 11 July an ash plume was seen by a ground observer rising 800 m above the summit and drifting S and SW. The Alert Level remained at 2 (on a scale of 1-4) and the public was warned to stay 3 km away from the summit crater.
Source: Pusat Vulkanologi dan Mitigasi Bencana Geologi (PVMBG, also known as CVGHM)
Ash plume in July 2022 and intermittent thermal activity
Raung, located in easternmost Java, Indonesia, was constructed SW of the Ijen caldera rim. The summit is truncated by a steep-walled, 2-km-wide caldera that has been the site of frequent eruptions in the past. Over 60 eruptions have been recorded since the late 16th century, consisting of explosions with ash plumes, Strombolian activity, and lava flows. The most recent eruption ended during April 2021 and was characterized by thermal and explosive activity, ash plumes, and sulfur dioxide plumes (BGVN 46:07). This report describes a new eruption during July that consisted of an ash plume and intermittent thermal anomalies that occurred through September 2022, based on reports from Pusat Vulkanologi dan Mitigasi Bencana Geologi (PVMBG, also known as the Indonesian Center for Volcanology and Geological Hazard Mitigation, CVGHM) and various satellite data.
Activity at Raung has been relatively low since the January-April 2021 eruption, but has included occasional sulfur dioxide emissions between June 2021 and early July 2022, detected by the TROPOMI instrument on the Sentinel-5P satellite (figure 49). The emissions during 4 and 5 July 2022 formed more distinctive and stronger plumes. According to the MIROVA graph, there was a cluster of strong thermal anomalies detected during early January 2021, during March-May 2021, and May-September 2022; a period of no thermal activity followed the early January 2021 activity during November 2021-April 2022 (figure 50). Thermal activity resumed in May, which gradually increased in power in early June, and then began to decline in late June. This activity was also observed in Sentinel-2 infrared satellite imagery at the summit crater on 15 and 30 May, 9, 14, 19, 24, and 29 June, and 9, 19, and 24 July (figure 51).
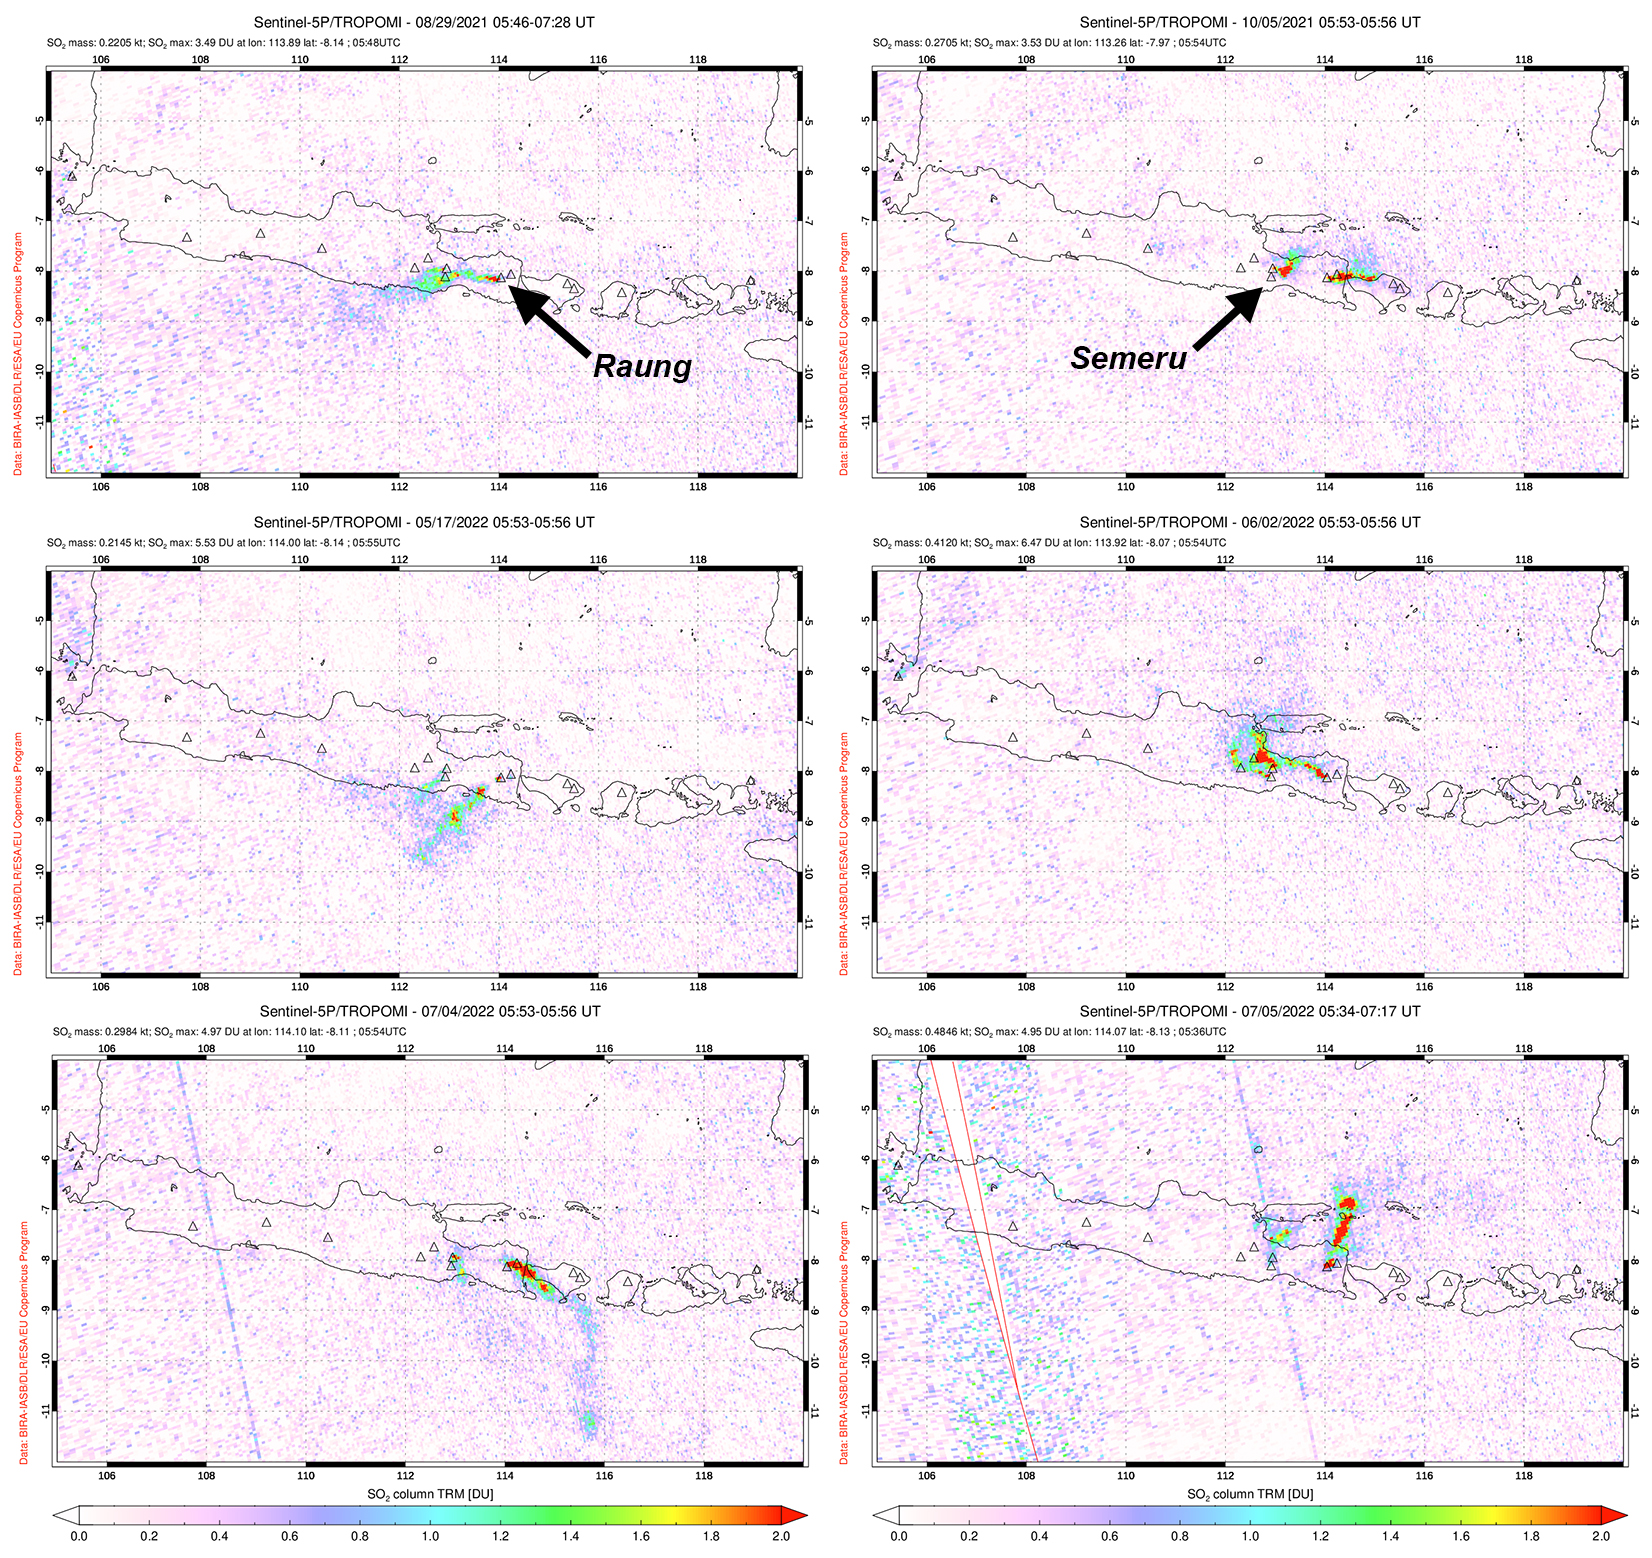 |
Figure 49. Intermittent sulfur dioxide emissions were captured rising from Raung on 29 June 2021 (top left), 5 October 2021 (top right), 17 May 2022 (middle left), and 2 June 2022 (middle right) by the TROPOMI instrument on the Sentinel-5P satellite. Each of the plumes shown here exceed 2 DUs (Dobson Units) and drift in different directions. Stronger defined sulfur dioxide plumes were detected on 4 and 5 July 2022 (bottom left and right, respectively), and drifted SE and NE. Emissions originating further W are from Semeru. Courtesy of NASA Global Sulfur Dioxide Monitoring Page. |
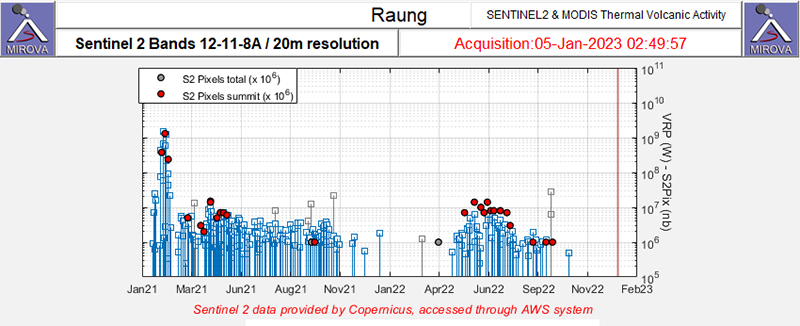 |
Figure 50. Moderate to strong clusters of thermal anomalies (red dots) were detected in the summit area of Raung during early January 2021, March-May 2021, and May-September 2022 as recorded by the Sentinel-2 MODIS Thermal Volcanic Activity data (bands 12, 11, 8A). There was a break in thermal activity were also shown during November 2021-early April 2022. Courtesy of MIROVA. |
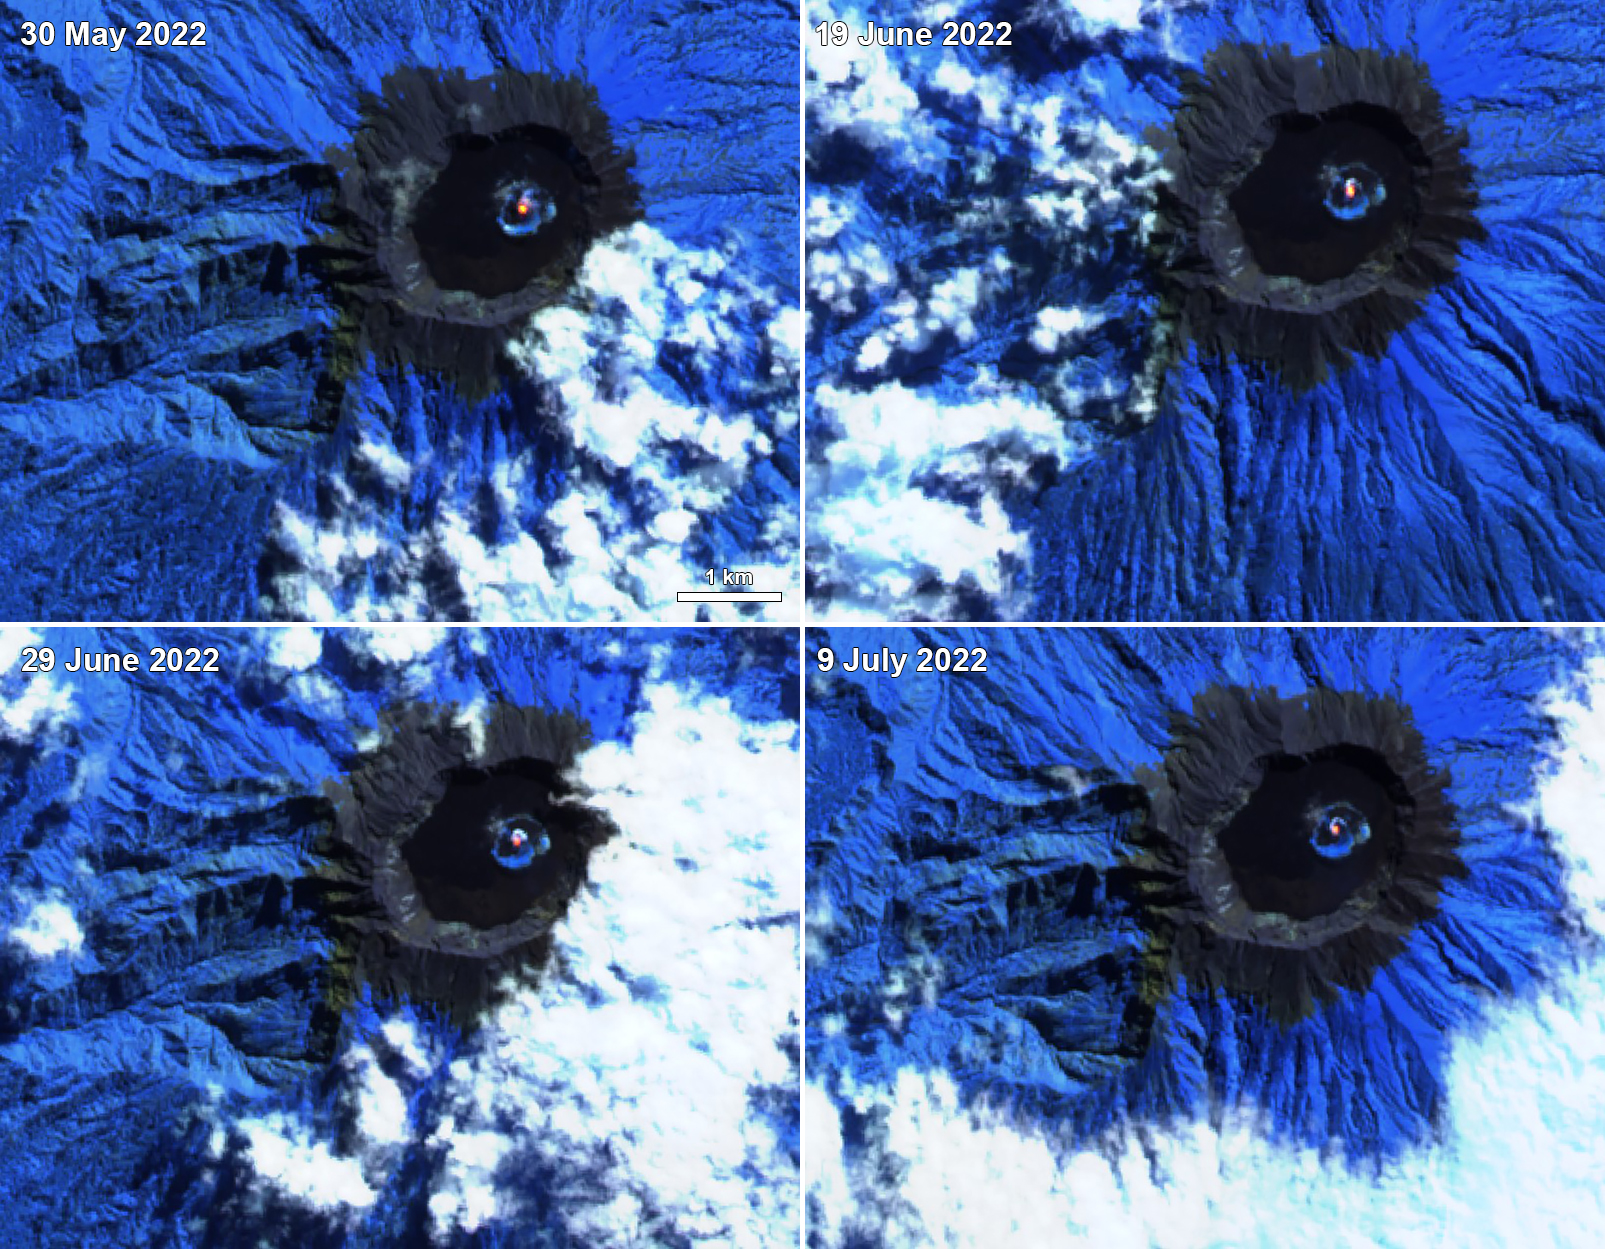 |
Figure 51. Sentinel-2 satellite imagery showed intermittent thermal anomalies in the summit crater of Raung on 30 May 2022 (top left), 19 June 2022 (top right), 29 June 2022 (bottom left), and 9 July 2022 (bottom right). Images use “atmospheric penetration” rendering (bands 12, 11, 8a). Courtesy of Sentinel Hub Playground. |
According to PVMBG, a short-lived eruption occurred at 1719 on 27 July 2022, which produced a gray ash plume that rose 1-1.5 km above the summit and drifted W and NW. A thermal anomaly was observed on 28 July in satellite images, and data from the GPS network indicated inflation. Continuous tremor events were reported during 29 July. As a result of these events, the Volcano Alert Level (VAL) was raised to 2 (on a scale of 1-4) that same day.
Information Contacts: Pusat Vulkanologi dan Mitigasi Bencana Geologi (PVMBG, also known as Indonesian Center for Volcanology and Geological Hazard Mitigation, CVGHM), Jalan Diponegoro 57, Bandung 40122, Indonesia (URL: http://www.vsi.esdm.go.id/); MAGMA Indonesia, Kementerian Energi dan Sumber Daya Mineral (URL: https://magma.esdm.go.id/v1); MIROVA (Middle InfraRed Observation of Volcanic Activity), a collaborative project between the Universities of Turin and Florence (Italy) supported by the Centre for Volcanic Risk of the Italian Civil Protection Department (URL: http://www.mirovaweb.it/); NASA Global Sulfur Dioxide Monitoring Page, Atmospheric Chemistry and Dynamics Laboratory, NASA Goddard Space Flight Center (NASA/GSFC), 8800 Greenbelt Road, Goddard, Maryland, USA (URL: https://so2.gsfc.nasa.gov/); Sentinel Hub Playground (URL: https://www.sentinel-hub.com/explore/sentinel-playground).
2025: March
| May
| June
| July
2024: December
2023: May
| December
2022: July
2021: January
| February
| March
| April
| August
2020: July
| August
| September
| November
2016: October
2015: April
| May
| June
| July
| August
| September
2014: January
| June
2013: April
2012: October
2007: July
| August
2002: May
| June
| August
The Pusat Vulkanologi dan Mitigasi Bencana Geologi (PVMBG) reported that eruptive activity at Raung continued during 9-15 July. On most days white plumes were visible rising as high as 800 m above the summit and drifting N and S; weather conditions sometimes prevented visual observations. At 1923 on 11 July an ash plume was seen by a ground observer rising 800 m above the summit and drifting S and SW. The Alert Level remained at 2 (on a scale of 1-4) and the public was warned to stay 3 km away from the summit crater.
Source: Pusat Vulkanologi dan Mitigasi Bencana Geologi (PVMBG, also known as CVGHM)
The Pusat Vulkanologi dan Mitigasi Bencana Geologi (PVMBG) reported that eruptive activity at Raung continued during 2-8 July. Gray or white-and-gray ash plumes rose 400-1,000 m above the crater rim and drifted S and SW during 2, 4-5, and 7 July. Incandescence at the summit was sometimes visible in webcam images. The Alert Level remained at 2 (on a scale of 1-4) and the public was warned to stay 3 km away from the summit crater.
Source: Pusat Vulkanologi dan Mitigasi Bencana Geologi (PVMBG, also known as CVGHM)
The Pusat Vulkanologi dan Mitigasi Bencana Geologi (PVMBG) reported that eruptive activity at Raung continued during 25 June-1 July. No emissions were visible during 25-28 June, likely due to weather conditions. Daily ash plumes during 29 June-1 July rose as high has as 600 m above the crater rim and drifted NW and W. Incandescence at the summit was sometimes visible in webcam images. The Alert Level remained at 2 (on a scale of 1-4) and the public was warned to stay 3 km away from the summit crater.
Source: Pusat Vulkanologi dan Mitigasi Bencana Geologi (PVMBG, also known as CVGHM)
The Pusat Vulkanologi dan Mitigasi Bencana Geologi (PVMBG) reported that Raung continued to erupt during 18-25 June. Seismicity during 16-18 June fluctuated but increased overall. A thermal anomaly on the crater floor was identified in a satellite image on 18 June. Ash plumes rose 500-1,100 m above the crater rim and drifted in multiple directions. Ash plumes during 19-20 June rose as high has 2 km above the crater rim and drifted SE, S, SW, and W. Incandescence emanated from the summit crater during 0302-0500 on 20 June; seismicity decreased that same day. Ash plumes rose 1-2 km above the crater rim and drifted S, SW, and W. PVMBG noted that eruptive activity during 5-20 June produced ash plumes that mostly deposited ash around the crater area. An ash plume on each day during 21-23 June rose 300-600 m above the crater rim and drifted N, NW, W, and SW. The Alert Level remained at 2 (on a scale of 1-4) and the public was warned to stay 3 km away from the summit crater.
Source: Pusat Vulkanologi dan Mitigasi Bencana Geologi (PVMBG, also known as CVGHM)
The Pusat Vulkanologi dan Mitigasi Bencana Geologi (PVMBG) reported that the eruption continued at Raung during 11-17 June. Plumes were reported on 11 June reaching 750 m above the summit and drifting E, NE, and W. On 12 June PVMBG issued a special report noting that ongoing eruptions had increased in intensity and that ash plumes were rising approximately 1,000 m above the summit. Moderate eruptions continued on 13 June, with the plume drifting S, SW, and W. On 14 June the plume height was reported as 1,500 m, and on 15 June the plume height was 1,200 m. The Alert Level remained at 2 (on a scale of 1-4) and the public was warned to stay 3 km away from the summit crater.
Source: Pusat Vulkanologi dan Mitigasi Bencana Geologi (PVMBG, also known as CVGHM)
The Pusat Vulkanologi dan Mitigasi Bencana Geologi (PVMBG) reported that ash was present in emissions at Raung during 5-7 June. Emissions became continuous around 0600 on 5 June. The ash-bearing white to medium-gray plumes rose 600 m above the summit and drifted NE. Seismic energy did not increase and deformation data showed subsidence, suggesting that the source of the emissions was relatively shallow. Gray gas-and-ash plumes were continuous on 7 June, and possibly continuous at least through 2329 on 8 June, rising to 400 m above the crater rim. Ashfall was reported in the Linggusar and Sumberwringin area, Bondowoso Regency, about 17 km NNW. The Alert Level remained at 2 (on a scale of 1-4) and the public was warned to stay 3 km away from the summit crater.
Source: Pusat Vulkanologi dan Mitigasi Bencana Geologi (PVMBG, also known as CVGHM)
The Pusat Vulkanologi dan Mitigasi Bencana Geologi (PVMBG) reported increasing volcanic activity at Raung on 16 May. At 0551 an observer saw an ash plume rise to around 1,250 m above the summit and drift S to SW. According to the Darwin VAAC the plume had dissipated by 1140 that same day. The Alert Level remained at 2 (on a scale of 1-4) and the public was warned to stay 3 km away from the summit crater.
Sources: Pusat Vulkanologi dan Mitigasi Bencana Geologi (PVMBG, also known as CVGHM); Darwin Volcanic Ash Advisory Centre (VAAC)
The Pusat Vulkanologi dan Mitigasi Bencana Geologi (PVMBG) reported that at 0509 on 9 May an ash plume rose around 1 km above Raung’s summit crater rim and drifted N and NW. The Alert Level remained at 2 (on a scale of 1-4) and the public was warned to stay 3 km away from the summit crater.
Source: Pusat Vulkanologi dan Mitigasi Bencana Geologi (PVMBG, also known as CVGHM)
The Pusat Vulkanologi dan Mitigasi Bencana Geologi (PVMBG) reported that a dense gray ash plume rose around 1.5 km above Raung’s summit crater rim and drifted W and NW at 0659 on 13 March. The Alert Level remained at 2 (on a scale of 1-4) and the public was warned to stay 3 km away from the summit crater.
Source: Pusat Vulkanologi dan Mitigasi Bencana Geologi (PVMBG, also known as CVGHM)
The Pusat Vulkanologi dan Mitigasi Bencana Geologi (PVMBG) reported an eruption at Raung on 24 December. The eruption occurred at 0930 and lasted about four minutes and 42 seconds. A dense gray ash plume rose around 2 km above the summit and drifted E. The seismic network detected subsequent eruptive events at 1025, 1031, and 1035, though foggy weather prevented visual observations. According to the Darwin VAAC an ash plume from an eruption already in progress was identified in a satellite image at 1000 rising to 6.1 km (20,000 ft) a.s.l., or 2.8 km above the summit, and drifting NE. A second, discrete eruption plume was identified in a satellite image at 1050 rising to 7.9 km (26,000 ft) a.s.l., or 4.6 km above the summit, and drifting NW. The Alert Level remained at 2 (on a scale of 1-4) and the public was warned to stay 3 km away from the summit crater.
Sources: Pusat Vulkanologi dan Mitigasi Bencana Geologi (PVMBG, also known as CVGHM); Darwin Volcanic Ash Advisory Centre (VAAC)
The Pusat Vulkanologi dan Mitigasi Bencana Geologi (PVMBG) issued a Volcano Observatory Notice for Aviation (VONA) for Raung at 1751 on 12 December, noting that white plumes rose 500 m above the summit and volcanic tremor was recorded by the seismic network. Increasing volcanic activity prompted the release of another VONA at 2003 on 15 December; the Aviation Color Code was raised to Yellow (the second lowest color on a four-color scale). An eruptive event produced a medium-dense to dense ash plume that rose 500 m above the summit and drifted E and SE. According to the Darwin VAAC the ash plume had dissipated by 0940 on 16 December. The Alert Level remained at 2 (on a scale of 1-4) and the public was warned to stay 3 km away from the summit crater.
Sources: Pusat Vulkanologi dan Mitigasi Bencana Geologi (PVMBG, also known as CVGHM); Darwin Volcanic Ash Advisory Centre (VAAC)
PVMBG reported that during 1-17 December the maximum height of steam-and-gas plumes at Raung was 500 m above the summit. An M 2.6 local tectonic earthquake was detected on 18 December and afterwards plumes rose as high as 1 km. Seismicity during December indicated that fluid movement was concentrated at shallow depths; signals indicating emissions significantly increased on 18 December. Deformation data indicated a trend of deflation. On 18 December PVMBG raised the Alert Level to 2 (on a scale of 1-4) noting that the visual observations and seismic data indicated unstable conditions. The pubic was warned to stay 3 km away from the summit crater.
Source: Pusat Vulkanologi dan Mitigasi Bencana Geologi (PVMBG, also known as CVGHM)
PVMBG reported that during 1-30 April white steam-and-gas plumes of moderate intensity rose as high as 200 m above Raung’s summit. Monitoring data along with visual observations did not suggest elevated levels of activity. The Alert Level was lowered to 1 (on a scale of 1-4) on 2 May and the pubic was reminded to stay 500 m away from the crater.
Source: Pusat Vulkanologi dan Mitigasi Bencana Geologi (PVMBG, also known as CVGHM)
According to PVMBG an eruption at Raung at 1719 on 27 July produced a gray ash plume that rose 1-1.5 km above the summit and drifted W and NW. On 28 July a thermal anomaly in the crater was identified in satellite images and data from the GPS network indicated inflation, likely from an intrusion of magma. Seismicity on 29 July was dominated by continuous tremor. The Alert Level was raised to 2 (on a scale of 1-4) that same day, and the public was warned to stay 3 km away from the crater.
Source: Pusat Vulkanologi dan Mitigasi Bencana Geologi (PVMBG, also known as CVGHM)
PVMBG reported that neither explosive nor effusive activity had been recorded at Raung since February, and emissions were not observed during 1 July-8 August. Seismicity had declined and deformation data indicated a trend of deflation. The Alert Level was lowered to 1 (on a scale of 1-4) on 9 August, and the public was warned to stay away from the crater.
Source: Pusat Vulkanologi dan Mitigasi Bencana Geologi (PVMBG, also known as CVGHM)
PVMBG reported that gray-and-white ash plumes rose 50-400 m above Raung's summit during 13-14 April and drifted N, NE, E, and S. Emissions were white and rose as high as 400 m during 15-16 and 19 April. Weather conditions prented visual observations on some days. The Alert Level remained at 2 (on a scale of 1-4), and the public was warned to remain outside of the 2-km exclusion zone.
Source: Pusat Vulkanologi dan Mitigasi Bencana Geologi (PVMBG, also known as CVGHM)
PVMBG reported that daily gray-and-white ash plumes rose 50-600 m above Raung's summit during 6-13 April and drifted mainly N, E, and S. The Alert Level remained at 2 (on a scale of 1-4), and the public was warned to remain outside of the 2-km exclusion zone.
Source: Pusat Vulkanologi dan Mitigasi Bencana Geologi (PVMBG, also known as CVGHM)
PVMBG reported that daily gray-and-white ash plumes rose 50-500 m above Raung's summit during 31 March-5 April and drifted N and S. The Alert Level remained at 2 (on a scale of 1-4), and the public was warned to remain outside of the 2-km exclusion zone.
Source: Pusat Vulkanologi dan Mitigasi Bencana Geologi (PVMBG, also known as CVGHM)
PVMBG reported that daily gray-and-white ash plumes rose 50-1,200 m above Raung's summit during 24-29 March. Ash plumes drifted in different directions. The Alert Level remained at 2 (on a scale of 1-4), and the public was warned to remain outside of the 2-km exclusion zone.
Source: Pusat Vulkanologi dan Mitigasi Bencana Geologi (PVMBG, also known as CVGHM)
PVMBG reported that daily gray-and-white ash plumes rose 300-900 m above Raung’s summit during 16-23 March. Ash plumes drifted mainly N, E, and S. The Alert Level remained at 2 (on a scale of 1-4), and the public was warned to remain outside of the 2-km exclusion zone.
Source: Pusat Vulkanologi dan Mitigasi Bencana Geologi (PVMBG, also known as CVGHM)
PVMBG reported that daily gray ash plumes rose 100-1,200 m above Raung’s summit during 10-16 March. Ash plumes drifted mainly N, NE, E, and S. The Alert Level remained at 2 (on a scale of 1-4), and the public was warned to remain outside of the 2-km exclusion zone.
Source: Pusat Vulkanologi dan Mitigasi Bencana Geologi (PVMBG, also known as CVGHM)
PVMBG reported that daily gray ash plumes rose 200-1,200 m above Raung’s summit during 2-9 March. Ash plumes drifted mainly E and S. The Alert Level remained at 2 (on a scale of 1-4), and the public was warned to remain outside of the 2-km exclusion zone.
Source: Pusat Vulkanologi dan Mitigasi Bencana Geologi (PVMBG, also known as CVGHM)
PVMBG reported that daily gray ash plumes rose 200-1,200 m above Raung’s summit during 24 February-2 March. Ash plumes were sometimes dense and drifted mainly N, E, and S. The Alert Level remained at 2 (on a scale of 1-4), and the public was warned to remain outside of the 2-km exclusion zone.
Source: Pusat Vulkanologi dan Mitigasi Bencana Geologi (PVMBG, also known as CVGHM)
PVMBG reported that daily gray and sometimes black ash plumes rose 200-1,200 m above Raung’s summit during 17-23 February. Ash plumes were sometimes dense and drifted mainly N, NE, E, and S. The Alert Level remained at 2 (on a scale of 1-4), and the public was warned to remain outside of the 2-km exclusion zone.
Source: Pusat Vulkanologi dan Mitigasi Bencana Geologi (PVMBG, also known as CVGHM)
PVMBG reported that daily gray ash plumes rose as high as 2.5 km above Raung’s summit during 10-16 February. Ash plumes were sometimes dense and drifted N, NE, E, and S. The Alert Level remained at 2 (on a scale of 1-4), and the public was warned to remain outside of the 2-km exclusion zone.
Source: Pusat Vulkanologi dan Mitigasi Bencana Geologi (PVMBG, also known as CVGHM)
PVMBG reported that daily gray ash plumes rose as high as 1 km above Raung’s summit and drifted S and E during 3-6 February. Ash plumes rose 1.2-2 km above the summit during 7-9 February and drifted SE and E. Incandescence from the crater was often seen reflected in the emissions, and rumbling and roaring was sometimes heard. The Alert Level remained at 2 (on a scale of 1-4), and the public was warned to remain outside of the 2-km exclusion zone.
Source: Pusat Vulkanologi dan Mitigasi Bencana Geologi (PVMBG, also known as CVGHM)
PVMBG reported that daily gray-to-brown ash plumes rose 400-700 m above Raung’s summit and drifted SE, E, and NE during 26 January-2 February. Incandescence from the crater was often seen reflected in the emissions and rumbling was sometimes heard. At 2354 on 2 February an ash plume rose 1 km and drifted E. The Alert Level remained at 2 (on a scale of 1-4), and the public was warned to remain outside of the 2-km exclusion zone.
Source: Pusat Vulkanologi dan Mitigasi Bencana Geologi (PVMBG, also known as CVGHM)
A brown-gray ash plume from Raung rose 100-400 m above the crater rim and drifted E at 0520 on 21 January, prompting PVMBG to raise the Alert Level to 2 (on a scale of 1-4). Gray plumes rose 200-600 m above the crater rim and drifted E on the next day. White-and-gray plumes rose 200-500 m on 23 January and drifted WSW, and crater incandescence was visible in webcam images. During 24-25 January ash plumes rose 500 m and drifted E and S, and Strombolian activity was visible.
Source: Pusat Vulkanologi dan Mitigasi Bencana Geologi (PVMBG, also known as CVGHM)
PVMBG reported that during 1-3 October dense gray plumes rose 50-300 m above Raung’s summit; neither eruptions nor gas emissions were visible afterwards, through 26 November. Seismicity decreased and deflation was recorded. The Alert Level was lowered to 1 (on a scale of 1-4) on 27 November, and the public was warned to stay away from the summer crater.
Source: Pusat Vulkanologi dan Mitigasi Bencana Geologi (PVMBG, also known as CVGHM)
PVMBG reported that eruptive activity at Raung continued during 28 September-4 October with white-and-gray plumes rising 100-400 m above the crater rim. The Alert Level remained at 2 (on a scale of 1-4), and the public was warned to remain outside of the 2-km exclusion zone.
Source: Pusat Vulkanologi dan Mitigasi Bencana Geologi (PVMBG, also known as CVGHM)
PVMBG reported that on 21 August white-and-brown emissions rose 100 m above Raung’s summit and drifted N and S. White plumes rose as high as 100 m during 22-26 August; weather conditions prevented visual observations during 27-31 August. The Alert Level remained at 2 (on a scale of 1-4), and the public was warned to remain outside of the 2-km exclusion zone.
Source: Pusat Vulkanologi dan Mitigasi Bencana Geologi (PVMBG, also known as CVGHM)
PVMBG reported that gray emissions rose 200 m above Raung’s summit and drifted S during 11-12 August. White plumes rose as high as 100 m and drifted N and S on a few days during 13-18 August; weather conditions sometimes prevented visual observations. The Alert Level remained at 2 (on a scale of 1-4), and the public was warned to remain outside of the 2-km exclusion zone.
Source: Pusat Vulkanologi dan Mitigasi Bencana Geologi (PVMBG, also known as CVGHM)
PVMBG reported that an eruptive event at Raung was detected on 1 August, though weather conditions prevented visual confirmation. Weather conditions continued to obscure of views of the volcano during 5-11 August; white plumes were visible rising 100-200 m above the summit during some of the breaks in cloud cover. The Alert Level remained at 2 (on a scale of 1-4), and the public was warned to remain outside of the 2-km exclusion zone.
Source: Pusat Vulkanologi dan Mitigasi Bencana Geologi (PVMBG, also known as CVGHM)
PVMBG reported that during 1 January-15 July white plumes at Raung rose as high as 50 m above the summit. Seismicity increased on 13 July and then again on 16 July. At 1052 on 16 July observers noted that the color of the emissions had become brownish white and rose higher. A VONA stated that at 1353 an ash plume rose 100 m above the summit and drifted N. At 1356 the color of the emissions changed to white and gray, and plumes rose to 100 m above the summit. During the rest of the day gray and reddish-colored plumes rose 50-200 m. There were 60 emissions recorded in total. During 0000-0600 on 17 July there were a total of 26 emissions characterized by brownish ash plumes rising 50-200 m. PVMBG raised the Alert Level to 2 (on a scale of 1-4), and the public was reminded not to approach the crater within a 2-km radius.
Source: Pusat Vulkanologi dan Mitigasi Bencana Geologi (PVMBG, also known as CVGHM)
PVMBG reported that, although inclement weather conditions often prevented visual observations of Raung during 1 June-19 October, white plumes were occasionally seen rising as high as 300 m above the crater. Seismicity fluctuated but continued to decrease, and then was stable. The Alert Level remained was lowered to 1 (on a scale of 1-4) on 20 October, and the public was reminded not to approach the crater.
Source: Pusat Vulkanologi dan Mitigasi Bencana Geologi (PVMBG, also known as CVGHM)
PVMBG reported that, although inclement weather conditions often prevented visual observations of Raung during 25 August-21 September, white plumes were occasionally seen rising as high as 200 m above the crater. Seismicity fluctuated but continued to decrease. The Alert Level remained at 2 (on a scale of 1-4), and the public was reminded not to approach the crater within a 2-km radius.
Source: Pusat Vulkanologi dan Mitigasi Bencana Geologi (PVMBG, also known as CVGHM)
PVMBG reported that ash plumes from Raung rose as high as 1 km above the crater during 16-24 August and drifted NW. Seismicity fluctuated but continued to decrease. The Alert Level was lowered to 2 (on a scale of 1-4) on 24 August, and the public was reminded not to approach the crater within a 2-km radius.
Source: Pusat Vulkanologi dan Mitigasi Bencana Geologi (PVMBG, also known as CVGHM)
PVMBG reported that the eruption at Raung was ongoing during 24 July-10 August. Ash plumes rose 1.5 km above the crater and crater incandescence was visible. Seismicity fluctuated but remained elevated; RSAM values peaked on 4 August (the highest recorded since the beginning of the eruption) and then decreased again. The Alert Level remained at 3 (on a scale of 1-4), and the public was reminded not to approach the crater within a 3-km radius. Based on satellite observations and wind data, the Darwin VAAC reported that during 12-14, 16, and 18 August multiple ash plumes from Raung rose to altitudes of 3.7-4 km (12,000-13,000 ft) a.s.l. and drifted 20-110 km W and WSW.
Sources: Pusat Vulkanologi dan Mitigasi Bencana Geologi (PVMBG, also known as CVGHM); Darwin Volcanic Ash Advisory Centre (VAAC)
Based on weather models, webcam views, and information from PVMBG, the Darwin VAAC reported that during 5-11 August ash plumes from Raung rose to altitudes of 4.3-5.2 km (14,000-17,000 ft) a.s.l. and drifted as far as 760 km ESE, SE, SSE, and SW.
Source: Darwin Volcanic Ash Advisory Centre (VAAC)
On 4 August BNPB reported that during the previous three days the Strombolian eruption at Raung increased in intensity. Ash fell in Sempu, Songgon, Glenmore, Gambiran, and Banyuwangi. On 4 August dense blackish gray ash plumes rose 800 m and drifted SE. Based on satellite-image and wind data, the Darwin VAAC reported that during 29 July-4 August multiple ash plumes rose to altitudes of 4.3-4.9 km (14,000-16,000 ft) a.s.l. and drifted as far as 240 km in multiple directions. The Alert Level remained at 3 (on a scale of 1-4), and the public was reminded not to approach the crater within a 3-km radius.
Sources: Badan Nacional Penanggulangan Bencana (BNPB); Darwin Volcanic Ash Advisory Centre (VAAC)
PVMBG reported that the eruption at Raung was ongoing during 16-23 July. Ash plumes rose 2 km and incandescence at the crater was visible. Seismicity fluctuated but remained elevated. The Alert Level remained at 3 (on a scale of 1-4), and the public was reminded not to approach the crater within a 3-km radius. Based on PVMBG information, and satellite-image and pilot observations, the Darwin VAAC reported that during 22-28 July ash multiple ash plumes from Raung rose to varying altitudes of 4.3-5.2 km (14,000-17,000 ft) a.s.l. and drifted as far as 400 km NW, W, SSW, S, and SSE. A news article from 29 July noted that 18 flights at most had been canceled during the previous few days due to the ash plumes, and that the Notohadinegoro Airport (2,100 km SW) had been temporarily closed.
Sources: Darwin Volcanic Ash Advisory Centre (VAAC); Pusat Vulkanologi dan Mitigasi Bencana Geologi (PVMBG, also known as CVGHM); The Jakarta Post
Based on PVMBG information, and satellite-image and pilot observations, the Darwin VAAC reported that during 15-21 July ash multiple ash plumes from Raung rose to varying altitudes of 3.7-6.1 km (12,000-20,000 ft) a.s.l. and drifted as far as 340 km in multiple directions. On 16 July BNPB reported that a dense gray-to-black ash plume rose as high as 2 km above Raung's crater rim and drifted WNW. Incandescent lava at the summit was visible and tremor was continuous. Roaring and thumping sounds were reported by residents. Ashfall was reported in areas downwind, including Cumedak (19 km W) and Sumberjambe (13 km NW). According to a news article, the Juanda International Airport in Surabaya reopened on 17 July after on-and-off closures the previous week. BNPB noted that the eruption continued on 18 July with ash plumes rising as high as 1.5 km and drifting N. Tremor continued, although the amplitude had declined during the previous week. The Alert Level remained at 3 (on a scale of 1-4), and the public was reminded not to approach the crater within a 3-km radius.
Sources: Badan Nacional Penanggulangan Bencana (BNPB); Darwin Volcanic Ash Advisory Centre (VAAC); ch-aviation
PVMBG reported that during 1-8 July gray plumes rose 100-500 m above Raung’s crater rim, crater incandescence was observed, and rumbling and thumping sounds were noted. Seismicity was dominated by high-amplitude tremor; deformation data suggested magma migrating to the surface. The Alert Level remained at 3 (on a scale of 1-4), and the public was reminded not to approach the crater within a 3-km radius. BNPB reported that gray ash plumes continued to rise as high as 500 m above the crater through 11 July. Ash plumes drifted in various directions depending on the altitude: SE and S at lower altitudes and SE, S, W, and N at higher altitudes.
Based on PVMBG notices, wind data, and satellite images, the Darwin VAAC reported that during 8-12 July ash plumes rose to an altitude of 4.3-5.2 km (14,000-17,000 ft) a.s.l. and drifted as far as 1,040 km E, SE, and S. According to news articles, increased activity during 9-10 July caused flight cancelations and several airports to close, including those on Bali and Lombok, and in Banyuwangi and Jember in East Java. The article also noted that dozens of flight had been canceled during the previous week. Another article noted that the Bali airport, in addition to another airport in Java, again closed on 12 July, a day after it had reopened.
Sources: Badan Nacional Penanggulangan Bencana (BNPB); Darwin Volcanic Ash Advisory Centre (VAAC); Agence France-Presse (AFP); The Weather Channel
Based on notices from the Ujung Padang MWO and PVMBG, satellite images, and pilot observations, the Darwin VAAC reported that during 1 and 3-7 July ash plumes from Raung rose to altitudes of 3.7-6.1 km (12,000-20,000 ft) a.s.l. and drifted 25-110 km E, ESE, and SE. According to news articles, flights in and out of an airport in Bali were cancelled due to ash emissions during 3-4 July. On 5 July BNPB reported that roaring was heard from continuous explosions and Strombolian activity at Raung. Dense white-and-gray plumes rose as high as 400 m and drifted SE. The Alert Level remained at 3 (on a scale of 1-4), and the public was reminded not to approach the crater within a 3-km radius.
Sources: Badan Nacional Penanggulangan Bencana (BNPB); Darwin Volcanic Ash Advisory Centre (VAAC); WA Today
PVMBG reported that, during times of clear weather during 1-28 June, white plumes were observed rising as high as 300 m above Raung's crater rim. Rumbling was frequently heard at the observation post. Seismic tremor sharply increased on 21 June, and crater incandescence was observed on 25 and 28 June. BNPB reported that increased activity on 28 June was characterized by Strombolian activity, roaring, ash plumes that rose 300 m, and a loud thumping sound heard 20 km away at 2000. Incandescence from the crater was clearly visible from the observation post in Banyuwangi. PVMBG raised the Alert Level to 3 (on a scale of 1-4) on 29 June, and reminded the public not to approach the crater within a 3-km radius.
Sources: Pusat Vulkanologi dan Mitigasi Bencana Geologi (PVMBG, also known as CVGHM); Badan Nacional Penanggulangan Bencana (BNPB)
PVMBG reported that, during infrequent times of clear weather during 1 February-21 May, gray and gray-to-brown plumes were observed rising as high as 300 m above Raung's crater rim. Rumbling was frequently heard at the observation post. Crater incandescence was observed during February and on 12 April. Seismicity fluctuated and was dominated by tremor. The Alert Level remained at 2 (on a scale of 1-4); residents and tourists were reminded not to approach the craters within a 2-km radius.
Source: Pusat Vulkanologi dan Mitigasi Bencana Geologi (PVMBG, also known as CVGHM)
PVMBG reported that, during infrequent times of clear weather in December 2014 and January 2015, white plumes were observed rising as high as 500 m above Raung's crater rim. In February and during 1-14 March plumes were gray-white and rose to a maximum height of 200 m. Crater incandescence and rumbling was reported. During 15 March-7 April emissions were gray-brown and rose as high as 200 m; rumbling continued to be heard. During 8-15 April gray-brown plumes rose as high as 300 m. Rumbling was heard on 8 April and crater incandescence was observed on 12 April. Continuous tremor was recorded during December 2014-12 January 2015; tremor was not continuous starting on 13 January, and RSAM values declined. The Alert Level remained at 2 (on a scale of 1-4).
Source: Pusat Vulkanologi dan Mitigasi Bencana Geologi (PVMBG, also known as CVGHM)
PVMBG reported that RSAM values from Raung showed an increase in energy during March-April. Additionally, during March-April, the daily number of volcanic earthquakes was dominated by tremor (with an increase in tremor amplitude); however, since the beginning of May, the number and the amplitude of tremor decreased.
During 1-17 June, when weather permitted, a weak solfatera plume was visible rising up to 100 m above the summit. On 17 June the Alert Level was lowered to 1 (on a scale of 1-4).
Source: Pusat Vulkanologi dan Mitigasi Bencana Geologi (PVMBG, also known as CVGHM)
PVMBG reported that on 1 January seismicity at Raung increased, on 3 January diffuse white gas plumes rose 100 m and drifted W, and on 4 January diffuse brownish plumes also rose 100 m and drifted W. On 5 January the Alert Level was raised to 2 (on a scale of 1-4).
Source: Pusat Vulkanologi dan Mitigasi Bencana Geologi (PVMBG, also known as CVGHM)
CVGHM reported that during March white plumes rose at most 400 m above Raung. Seismicity decreased significantly on 25 March, and tremor was absent starting in April. On 5 April the Alert level was lowered to 2 (on a scale of 1-4). Visitors and residents were warned not to approach the crater within a 1.8-km radius.
Source: Pusat Vulkanologi dan Mitigasi Bencana Geologi (PVMBG, also known as CVGHM)
Seismicity at Raung increased on 17 October and remained elevated, prompting CVGHM to raise the Alert Level to 2 (on a scale of 1-4) on 18 October. During 18-22 October white plumes rose 50-75 m above the crater. Seismic activity increased significantly on 22 October. That same day the Alert Level was raised to 3. Visitors and residents were warned not to approach the crater within a 3-km radius.
Source: Pusat Vulkanologi dan Mitigasi Bencana Geologi (PVMBG, also known as CVGHM)
Based on observations of satellite imagery, the Darwin VAAC reported that an ash plume from Raung rose to an altitude of 4.6 km (15,000 ft) a.s.l. during 26-27 August and drifted E.
Source: Darwin Volcanic Ash Advisory Centre (VAAC)
Based on a pilot report, the Darwin VAAC reported that an ash plume possibly from Raung rose to an altitude of 1.5 km (5,000 ft) a.s.l. Ash was not visible on satellite imagery.
Source: Darwin Volcanic Ash Advisory Centre (VAAC)
Based on pilot reports and satellite imagery, the Darwin VAAC reported that an ash plume was visible rising from Raung on 25 August at 1534. The cloud reached a height of ~9.2 km a.s.l. and drifted to the W at high levels and to the E at lower levels.
Source: Darwin Volcanic Ash Advisory Centre (VAAC)
The Darwin VAAC received reports stating that on 12 August at 1720 ash was visible drifting NW of Raung around summit level. The summit was partially obscured by meteorological clouds and no ash was identifiable on satellite imagery.
Source: Darwin Volcanic Ash Advisory Centre (VAAC)
The Darwin VAAC reported that possible ash clouds emitted from Raung were visible on satellite imagery. The clouds were at heights below 4.6 a.s.l. and were observed on 5 June at 0840 drifting to the S, on 7 June at 0934 drifting to the SW, and on 8 June at 1132 drifting to the NW.
Source: Darwin Volcanic Ash Advisory Centre (VAAC)
A pilot reported observing an ash plume that was emitted from Raung on 2 June at 1625. The plume rose to a height of ~4.5 km a.s.l. and drifted to the S. According to the Darwin VAAC, ash was not visible on satellite imagery.
Source: Darwin Volcanic Ash Advisory Centre (VAAC)
Reports are organized chronologically and indexed below by Month/Year (Publication Volume:Number), and include a one-line summary. Click on the index link or scroll down to read the reports.
Eruption cloud on 18 July
Raung erupted 18 July, emitting dark clouds of tephra to 6,000 m. Activity apparently began with a weak earth tremor at about 0300, felt by inhabitants of the tea and coffee plantations on the slopes and in the areas around Kalibaru and Glenmore, at the S foot of the volcano. On 19 July at about 0500 an earthquake was felt, and inhabitants at the foot of Raung reported hearing two consecutive explosions. A seismograph post for Ijen Volcano (8.058°S, 114.242°W) at Pal Tuding, which also monitors Raung, registered vibrations with a maximum amplitude of 3.9 mm.
Two eruptions on 19 July were reported by a Garuda Airlines pilot flying from Jakarta (about 840 km NW of Raung) to Denpasar (on Bali, about 140 km SE) and back. One eruption occurred around 0511 and the other around 1130. The pilot estimated that columns of "smoke" reached 0.6-0.9 km height. Flights have been diverted from near the volcano.
Ash fell lightly all day, leaving a whitish coat on the leaves of tea and coffee plants. An employee of one tea plantation said part of the top leaves were damaged and withered. Light ashfall was reported until 20 July.
Information Contacts: Kompas, Jakarta; AFP.
Many small explosions; light ashfalls
"Raung resumed activity during November with a series of small explosions. The summit crater has not been visited since the start of the latest activity. However, observations begun 1 November from the new Raung observation post about 15 km SE of the summit at 700 m altitude (at Mangaran) indicated that the explosions have been centered along the E side of the large summit crater, near the recently active eruptive vent on the crater floor. At least 44 explosion clouds were observed during November, mostly whitish in color but dark gray ash-laden clouds were also seen. On 15 November, light ashfall was reported from SE flank villages (Bejong, Mangaran, and Seragi) and from Banjuyangi City, 35 km ESE of the volcano. The Mangaran seismometer recorded 52 explosion earthquakes during November. Activity was continuing as of 12 December."
"The last eruption of Raung that produced a lava flow was in 1973. That flow was confined to the summit crater. Explosions similar to the November activity have frequently been reported over the last decade."
Information Contacts: T. Casadevall and L. Pardyanto, VSI; Antara News Service, Jakarta.
Small summit explosions during November
No explosions were recorded in December.
Information Contacts: Suparto S. and T. Casadevall, VSI.
Strombolian activity and seismicity
Strombolian activity in the bottom of the crater was photographed by Michel Halbwach (Univ of Savoie, France) in July/August 1988, during overflights in an ultralight aircraft arranged in cooperation with the Federation Aerosport of Indonesia (FASI). Activity was continuing in March, when brownish plumes that rose 100-150 m above the summit were seen 41 times. Recorded March seismicity included: 1,771 episodes of volcanic tremor and plume emission tremor, 90 strong tectonic earthquakes, one local tectonic earthquake, and one A-type and 11 B-type volcanic earthquakes.
Additional aerial monitoring of activity at Raung and other volcanoes has been proposed by FASI and VSI.
Information Contacts: VSI.
Numerous small explosions
During the last week of July, 45 visible explosions ejected plumes to 75-150 m above the summit before winds carried them S. Between explosions, weak white fumes reached 50 m above the crater. Recorded earthquakes were: distant tectonic (50), local tectonic (2), volcanic A-type (1), volcanic B-type (2), explosions (1,574), and volcanic tremor (1).
Information Contacts: VSI.
Frequent light ash emissions
Raung continued to emit brownish-gray ash clouds to 200-300 m above the crater, with light ashfall NW of the volcano. A daily average of 104 ash pulses, one tremor event, and two tectonic earthquakes were detected during July.
Information Contacts: VSI.
Dense plumes
The crew of Qantas flight 41 (Sydney-Jakarta) observed a very dense black plume emerging intermittently from a flank vent on 10 September at 1508. The plume was drifting N at ~6 km altitude, well below the aircraft's altitude of nearly 12 km. A voluminous, dense, mostly white plume with small pulses of ash in its center was observed from a commercial flight two days later.
Information Contacts: ICAO; J. Post, SI.
Continued ash emission
Vigorous ash emissions, rising to 300-600 m, were observed from an aircraft on 3 October.
Information Contacts: N. MacLeod, Ridgefield WA, USA.
Infrared Space Shuttle photograph shows devegetated summit area
An infrared Space Shuttle photograph (figure 1) taken in May 1992 showed clear views of both Raung and the Ijen volcanic complex. Neither volcano was erupting, but the caldera lake in Kawah Ijen and the devegetated caldera and summit region at Raung were obvious features. The Ijen Caldera was clearly defined, along with some post-caldera cones on its southern margin (Kawah Ijen and Gunung Merapi, Gunung Rante, and Gunung Pendil).
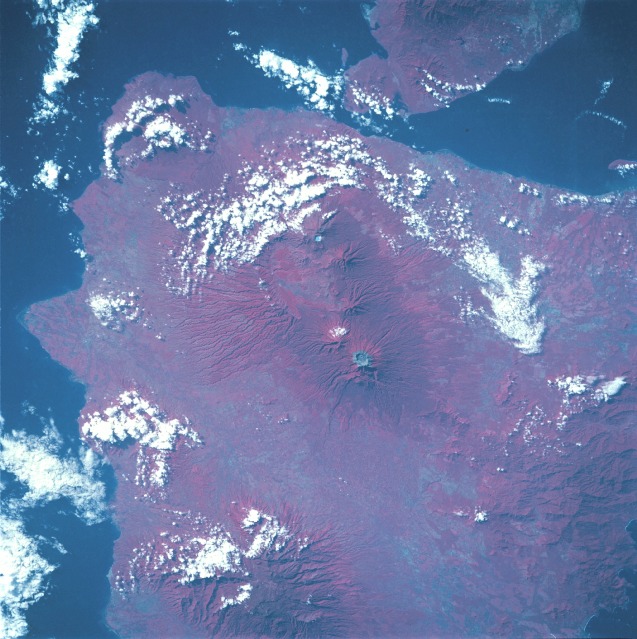 |
Figure 1. This near-vertical color infrared photograph shows both Raung volcano and the Ijen volcanic complex on the E end of Java; the summit of Baluran, at the NE tip of the island, is hidden by clouds. Raung, the tall feature near the center of this photograph with a NE-flank vent (Gunung Suket), has a very wide caldera surrounded by a grayish rim. The difference in color of the rim and the flanks is caused by the rim's lack of vegetation compared with the healthy and extensive vegetation on the flanks. The large elongate Ijen Caldera NE of Raung has numerous cones on its margin, the most obvious being Kawah Ijen with its acidic crater lake. North is to the left; the tip of the island is pointing NE. NASA Photo ID: STS049-097-050, May 1992. |
Information Contacts: NASA JSC Digital Image Collection (URL: http://images.jsc.nasa.gov/).
Aviation report of a plume, but not seen on satellite imagery
An aviation report stated that at 1705 on 15 August "smoke" from Raung at an altitude of 6 km was drifting W. Following this report, aviation notices were posted in Indonesia, New Zealand, and Australia for the next 24 hours. No plume was observed by Australian meteorologists on satellite imagery from 1800 on 15 August through 2050 the next day.
The last reported eruption, which occurred sometime between January and June 1993, generated an ash column 600 m above the rim and caused ashfall in the surrounding area.
Information Contacts: BOM Darwin, Australia.
Aviators report April ash plume to 5 km and June "smoke" plume to 6 km altitude
On 10 April an ash cloud was reported drifting to the E at 5 km altitude. The Bureau of Meteorology had learned from the Volcanological Survey of Indonesia that the volcano had been erupting continuously, but ash was ejected only ~ 150 m above the crater. On 1 June a Qantas pilot described "smoke" at 6.1 km, drifting W. Similar reports were received on 18 and 22 June, but heavy clouds hampered the detection of ash in satellite imagery.
Information Contacts: Bureau of Meteorology, Northern Territory Regional Office, P.O. Box 735, Darwin NT 0801, Australia.
9 July ash plume ends 3-year interval without reported eruptions
At 1720 on 9 July 2000 an air report to the Darwin VAAC noted an ash cloud near Raung with a growing plume at an unknown height. The plume discharged from Raung. Visible satellite imagery taken at 1630, hours before the air report was made, disclosed Raung surrounded by scattered low clouds, with a possible low-level ash plume extending 25 km to the NW. There was no evidence of ash in subsequent satellite imagery. No signs of activity were observed at Raung by Lee Siebert when passing nearby on commercial aircraft at about noon on 10 July and mid-morning on 11 July.
Information Contacts: Darwin VAAC, Bureau of Meteorology, Northern Territory Regional Office, PO Box 40050, Casuarina Northern Territory 0811 Australia (URL: http://www.bom.gov.au/info/vaac/); Lee Siebert, Global Volcanism Program, Smithsonian Institution, Washington, DC 20560-0119 USA.
Ash plumes to 4.6 km altitude reported in early June 2002
On 2 June 2002 at 1625, a pilot reported observing an ash plume emitted from Raung. The plume rose to a height of ~4.5 km altitude and drifted to the S. According to the Darwin VAAC, ash clouds were visible on satellite imagery a few days later. The clouds were at heights below 4.6 km altitude and were observed on 5 June at 0840 drifting S, on 7 June at 0934 drifting SW, and on 8 June at 1132 drifting NW.
According to the Volcanological Survey of Indonesia (VSI), Raung has been erupting for at least a decade, and recent eruptions are events within a single, broader eruptive period. Thus, the above-noted ash eruptions from June were noteworthy outbursts within a longer sustained eruption.
Information Contacts: Darwin Volcanic Ash Advisory Center (VAAC), Bureau of Meteorology, Northern Territory Regional Office, PO Box 40050, Casuarina, NT 0811, Australia (URL: http://www.bom.gov.au/info/vaac/); Nia Haerani, Volcanological Survey of Indonesia (VSI), Jalan Diponegoro No. 57, Bandung 40122, Indonesia (URL: http://www.vsi.esdm.go.id/).
Aviation reports describe ash plumes during 1999 to 2002
Raung volcano was last discussed in BGVN 27:07, when a pilot reported ash plumes to 4.6 km altitude in early June 2002. That issue of theBulletin also noted a Volcanological Survey of Indonesia (VSI) comment that Raung had been erupting for at least a decade, with recent eruptions being events within a single, broader eruptive period.
The Darwin Volcanic Ash Advisory Center (VAAC) subsequently received reports that on 12 August 2002 ash was visible drifting NW of Raung around the summit level. The summit was partially obscured by clouds and no ash was identified on satellite imagery. On 25 August 2002, based on pilot observations and satellite imagery, the VAAC reported a visible ash plume rising to about 9.2 km, drifting to the W at high levels and to the E at lower levels.
The Darwin VAAC has an archive of their reports available on their website. Those for Raung are summarized in table 1. The last set of reports (25 August 2002) discussed a plume becoming increasingly diffuse over a 16.5-hour interval.
Table 1. Dates and principal comments in Darwin VAAC reports concerning Raung, July 1999-February 2004. Dates and times are not local but instead refer to the Prime Meridian, for example 04/2240Z means the fourth day of the stated month at 2240 UMT. Similar or duplicate message are not shown. In general, ash cloud trajectory information has been omitted. In a few cases the VAAC delineated bounding area surrounding an observed ash cloud ("OBS ASH CLOUD"), delineated with a series of latitude and longitude coordinates (eg. S00700, E11000; which translates to 7 degrees S, 110 degrees E). In the original reports, altitudes were given in shorthand (eg. FL 100, which corresponds to 10,000 feet altitude; 3,048.0 m altitude, but typically not known to better than two significant figures and thus here rounded to ~ 3.0 km altitude). Courtesy of the Darwin VAAC.
| Date | Text from Volcanic Ash Advisory |
| 30 Jul 1999 | INFORMATION SOURCE: AIREP reported plume height to FL 150 [~4.6 km altitude] and drifting to SW. ASH CLOUD: 30/1025UTC IR satellite imagery shows cloud in the area with possible extension to the SSW. Nature of this extension not discernable. |
| 09 Jul 2000 | INFORMATION SOURCE: AIREP QFA123. ERUPTION DETAILS: Ash cloud active with growing plume reported at 09/0920 UTC. Height unknown. ASH CLOUD: Visible satellite imagery at 09/0830 UTC shows Mt. Raung surrounded by scattered low- level clouds with a possible low-level ash plume extending 25 kilometres to the northwest. No evidence is visible on subsequent imagery. |
| 02 Jun 2002 | INFORMATION SOURCE: AIREP QANTAS, GMS Satellite Imagery. ERUPTION DETAILS: Ash plume to FL150 [~4.6 km altitude] reported 02/0825Z, drifting south at 15 knots. OBS ASH DATE/TIME: 02/0825Z. OBS ASH CLOUD: Ash cloud not identifiable from satellite data. |
| 05 Jun 2002 | INFORMATION SOURCE: Satellite Imagery. ERUPTION DETAILS: Possible ash cloud below FL150 [~4.6 km altitude] drifting south at 10/15 knots. OBS ASH DATE/TIME: 04/2240Z. OBS ASH CLOUD: Ash cloud identifiable from satellite data. |
| 07 Jun 2002 | INFORMATION SOURCE: Satellite Imagery. ERUPTION DETAILS: Possible ash cloud below FL150 [~4.6 km altitude] drifting SW at 10/15 knots. OBS ASH DATE/TIME: 06/2334Z. OBS ASH CLOUD: Ash cloud identifiable from satellite data extending SW from Ruang 10NM either side of a line S0800 E11400 S0850 E11360. |
| 12 Aug 2002 | INFORMATION SOURCE: AIREP QFA29 via QANTAS OPERATIONS, GMS/NOAA satellite. ERUPTION DETAILS: Ash plume to FL120 [~3.7 km altitude] reported at 12/0920Z, drifting northwest. OBS ASH DATE/TIME: 12/0920Z. OBS ASH CLOUD: Ash cloud not identifiable from satellite data. Summit partially obscured by cloud. |
| 25 Aug 2002 | INFORMATION SOURCE: AIREP QFA29, NOAA16 SATELLITE. ERUPTION DETAILS: Ash plume to FL300 [~9.1 km altitude] reported 25/0734Z drifting west, low-level drift towards the east. OBS ASH DATE/TIME: 28/0611Z. OBS ASH CLOUD: S0807 E11402 S0812 E11342 S0807 E11335 S0800 E11347 S0807 E11402. |
| 25 Aug 2002 | INFORMATION SOURCE: AIREP QFA29, NOAA16 SATELLITE, GMS SATELLITE. ERUPTION DETAILS: Ash plume to FL300 [~9.1 km altitude] reported 25/0734Z drifting west, low-level drift towards the east. OBS ASH DATE/TIME: 25/1332Z OBS ASH CLOUD: FL100/350 [~10.7 km altitude] S0735 E11122 S0817 E11119 S0805 E11017 S0731 E11031 S0735 E11122. |
| 25 Aug 2002 | ERUPTION DETAILS: Ash plume to FL300 [~9.1 km altitude] reported 25/0734Z drifting west, low-level drift towards the east. OBS ASH DATE/TIME: 25/1932Z OBS ASH CLOUD: FL100/350 [~10.7 km altitude] S0700 E11000 S0800 E11000 S0800 E10630 S0700E10630 S0700 E11000. Ash cloud getting more diffuse and difficult todefine with satellite imagery. |
| 25 Aug 2002 | INFORMATION SOURCE: AIREP QFA29. NOAA/GMS SATELLITE. ERUPTION DETAILS: Ash plume to FL300 [~9.1 km altitude] reported 25/0734Z drifting west, low-level drift towards the east. OBS ASH DATE/TIME: 26/0132Z OBS ASH CLOUD: Ash cloud not visible on satellite imagery. |
Information Contacts: Darwin Volcanic Ash Advisory Center (VAAC), Bureau of Meteorology, Northern Territory Regional Office, PO Box 40050, Casuarina, NT 0811, Australia (URL: http://www.bom.gov.au/info/vaac/); Nia Haerani, Volcanological Survey of Indonesia (VSI), Jalan Diponegoro No. 57, Bandung 40122, Indonesia (URL: http://www.vsi.esdm.go.id/).
MODIS-MODVOLC infrared hot spots 3 June-8 Oct 2004; aerial photos from 2001
Though frequently active, Raung is seldom the subject of reports from either the news media or the Directorate of Volcanology and Geological Hazard Mitigation (DVGHM). The most recent Darwin VAAC report was issued late on 26 August 2002 (UTC). It noted that aviators had estimated an ash plume at ~ 10 km altitude drifting W (reported 25 August in an AIREP). Ash clouds were not visible on NOAA/GMS satellite imagery. A summary of Darwin VAAC reports of Raung for the period July 1999-August 2002 was given in BGVN 29:01.
There were nine anomalous Moderate Resolution Imaging Spectroradiometer (MODIS) observations of volcanic hot spots at Raung during 3 June-8 October 2004 (table 2). The 2004 alerts were the first detected by MODIS at Raung. Minor explosive activity documented intermittently during 1999 to 2002 (BGVN 29:01) did not have a thermal component sufficient to trigger alerts.
Table 2. Thermal anomalies at Raung observed with MODIS during 2004. Some of the UTC times were for the previous date. Spectral radiance for the hot pixels in band 21 (central wavelength of 3.959 µm) are in units of watts per square meter per steradian per micron (W-2 sr-1 µm-1). Courtesy of the Hawaiian Institute of Geophysics and Planetology.
| Date | Local Time | UTC | Spectral Radiance |
| 15 Apr 2004 | 2300 | 1500 | 0.852 |
| 16 Apr 2004 | 0200 | 1800 (15 Apr) | 0.847 |
| 22 Apr 2004 | 2310 | 1510 | 0.814 |
| 02 May 2004 | 0200 | 1800 (01 May) | 0.813 |
| 03 Jun 2004 | 0200 | 1800 (02 Jun) | 0.677 |
| 18 Jun 2004 | 2300 | 1500 | 0.729 |
| 04 Jul 2004 | 2300 | 1500 | 0.795 |
| 11 Jul 2004 | 2310 | 1510 | 0.814 |
| 14 Jul 2004 | 0155 | 1755 (13 Jul) | 0.778 |
| 22 Sep 2004 | 2300 | 1500 | 0.849 |
| 23 Sep 2004 | 0200 | 1800 (22 Sep) | 0.740 |
| 29 Sep 2004 | 2305 | 1505 | 0.893 |
| 08 Oct 2004 | 2300 | 1500 | 0.776 |
No ground observations have been reported during 2004, but in a message from Dali Ahmad (DVGHM), he noted the absence of observed emissions during 2004. With respect to the thermal alerts, he speculated that they could conceivably have originated from brush fires. Rob Wright commented that the levels of radiance in the 2004 alerts were both "too weak and too intermittent to be lava flows" and stood near the system's lower threshold. Similar weak anomalies occur at volcanoes such as Villarrica and during intervals at Anatahan, but the source of the alerts at Raung remains uncertain.
Clear aerial photographs of Raung were taken on 26 and 30 July 2001 (figure 2) by Franz Jeker of Singapore Airlines as he flew past in descent towards, or ascent from, the Bali airport. Jeker also included a detailed map of the Raung area (figure 3).
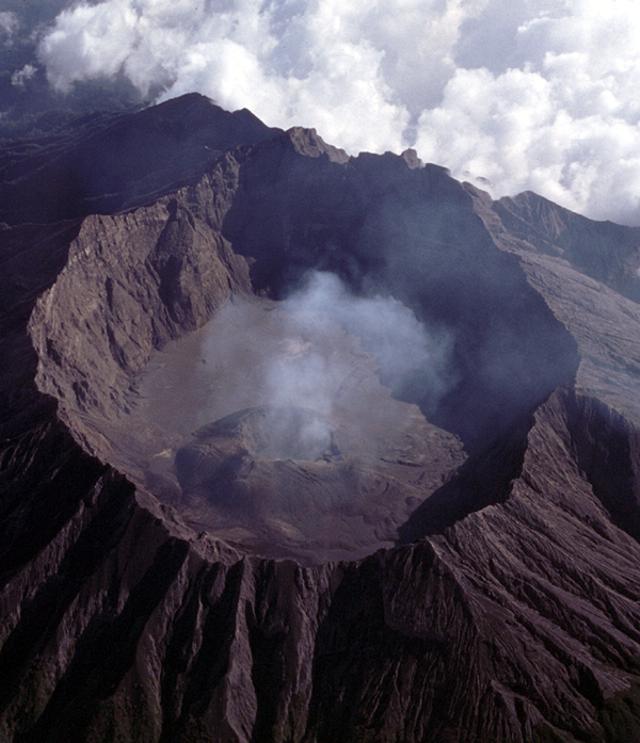 |
Figure 2. A photograph taken on 26 July 2001 of a small fumarolic plume from the central crater of Raung looking SW during a fly-by of a commercial airplane across the NNE flank. Courtesy of F. Jeker. |
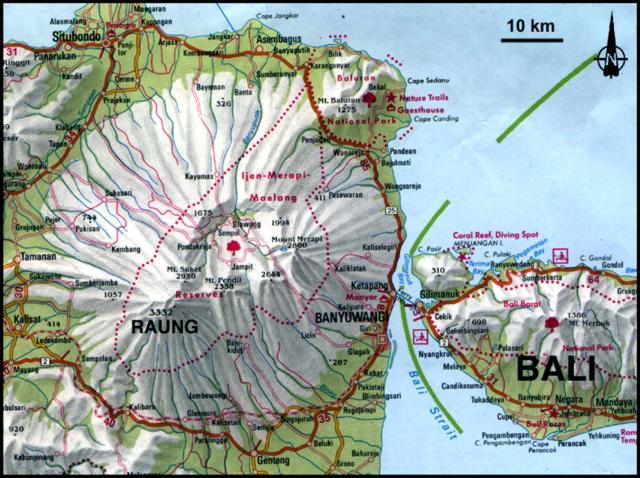 |
Figure 3. Map showing relative locations of Raung volcano at the SW end of Java, and adjacent Bali. Courtesy of F. Jeker. |
Information Contacts: Directorate of Volcanology and Geological Hazard Mitigation (DVGHM), Jalan Diponegoro 57, Bandung 40122, Indonesia (URL: http://www.vsi.esdm.go.id/); Darwin Volcanic Ash Advisory Center (VAAC), Bureau of Meteorology, Northern Territory Regional Office, PO Box 40050, Casuarina, NT 0811, Australia (URL: http://www.bom.gov.au/info/vaac/); Hawai'i Institute of Geophysics and Planetology (URL: http://modis.higp.hawaii.edu); Franz Jeker, Rigistrasse 10, 8173 Neerach, Switzerland.
Uncertain July 2007 ash plume; August 2007 ash plume seen for several hours
Nine anomalous Moderate Resolution Imaging Spectroradiometer (MODIS) observations of volcanic hot spots were reported during 3 June-8 October 2004 (BGVN 30:01). No other activity was reported from Raung until 26 July 2007. That day the Darwin Volcanic Ash Advisory Center (VAAC) indicated that a pilot had observed an ash plume, possibly from Raung, which their ash advisory reported as follows: "AIREP [an aircraft observation] reported ash cloud observed over volcano on eastern tip of Java. Plume up to 5000 feet [~ 1.2 km] above summit. Volcano assumed to be Raung. Ash not seen on latest satellite pass due to cloud."
Darwin VAAC produced five reports in reference to a Raung ash plume emitted on 26 August 2007. Visible wavelength imagery on MT SAT disclosed a plume at FL 150 (15,000 feet, or 4.6 km altitude) drifting E at ~ 10 km/hr (at 0430 UTC on 26 August). The last view of the cloud was reported at 0833 UTC, still at the same altitude and moving at the same velocity. That plume rose to an altitude of 1.5 km. Ash was not visible on satellite imagery. The Darwin VAAC reported that satellite imagery had detected an ash plume from Raung during 26-27 August that rose to an altitude of 4.6 km and drifted E.
Information Contacts: Darwin Volcanic Ash Advisory Center, Bureau of Meteorology, Northern Territory Regional Office, PO Box 40050, Casuarina, Northern Territory 0811, Australia (URL: http://www.bom.gov.au/info/vaac/).
New eruption during 12-17 June sends ash plumes to 4.5 km altitude
In an Antara News report, Balok Suryadi, an observer at the Center of Volcanology and Geological Hazard Mitigation (CVGHM) Raung monitoring post at Sumber Arum village, described clouds of "smoke and ash" that occurred on 12 and 13 June. He was also quoted in the 19 June article as saying that activity was "likely" continuing but that it could not be clearly monitored from the observation post.
Another ash eruption was seen rising through the clouds on 17 June 2008 around 1500. This event was photographed by Karim Kebaili while flying from Bali to Jakarta approximately 30 minutes after take-off (figure 4). The same eruption was seen at 1430 by pilot Nigel Demery, who stated that the ash cloud initially rose to about 4.5 km altitude but had dissipated on his return flight about two hours later. The Darwin VAAC was unable to identify the plume in satellite imagery due to meteorological clouds.
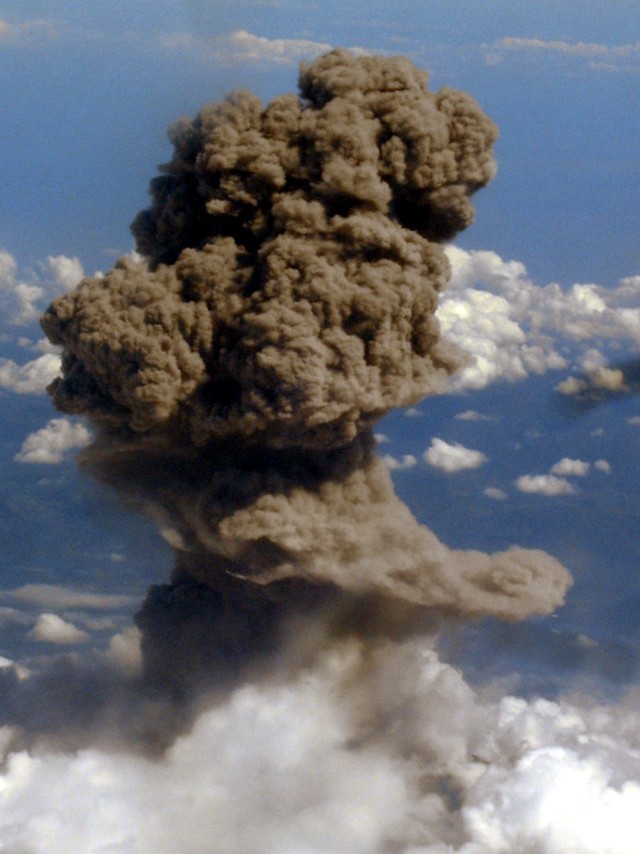 |
Figure 4. Ash plume rising from Raung at about 1500 on 17 June 2008. Courtesy of Karim Kebaili. |
Thermal anomalies were detected by the MODIS instrument aboard the Terra satellite on 23 July 2005 and 15 August 2005. No additional thermal anomalies were detected through the end of June 2008. However, ash plumes were reported by pilots on 26 July 2007 and seen in satellite imagery on 26 August 2007 (BGVN 32:09).
Information Contacts: Rebecca Patrick, Darwin Volcanic Ash Advisory Centre (VAAC), Bureau of Meteorology, Northern Territory Regional Office, PO Box 40050, Casuarina, Northern Territory 0811, Australia (URL: http://www.bom.gov.au/info/vaac); Center of Volcanology and Geological Hazard Mitigation (CVGHM), Jalan Diponegoro 57, Bandung 40122, Indonesia (URL: http://www.vsi.esdm.go.id/); Nigel Demery, Indonesia; Karim Kebaili, Indonesia; Antara News (URL: http://www.antara.co.id/); Hawai'i Institute of Geophysics and Planetology (HIGP) Thermal Alerts System, School of Ocean and Earth Science and Technology (SOEST), Univ. of Hawai'i, 2525 Correa Road, Honolulu, HI 96822, USA (URL: http://modis.higp.hawaii.edu/).
Strong eruptive activity and lava in the summit crater during June-August 2015
Prior to January 2014, the most recent reported activity was during 12-17 June 2008, when ash plumes were seen rising to 4.5 km altitude (BGVN 33:06). Sporadic white and brownish plume emissions were noted between 2012 and early 2015, along with periods of increased seismicity and thermal anomalies. Gray plumes, presumably due to ash, were reported beginning on 1 February 2015. Seismicity and thermal anomalies preceded stronger eruptive activity that began in mid-to-late June 2015; the last reported gray plume was on 22 August 2015. Thermal anomalies also decreased after mid-August 2015.
Activity during 2012-2013. Seismicity increased on 17 October 2012, prompting the Pusat Vulkanologi dan Mitigasi Bencana Geologi (PVMBG) to raise the Alert Level to 2 (on a scale of 1-4) on 18 October. During 18-22 October white plumes rose 50-75 m above the crater. Seismic activity increased significantly again on 22 October. That same day the Alert Level was raised to 3; visitors and residents were warned not to approach the crater within a 3-km radius. Strong thermal anomalies identified by MODVOLC, based on MODIS infrared satellite data, began on 14 October and continued through 8 November 2012. Two additional weak anomalies were detected on 29 November and 1 December 2012.
PVMBG reported that during March 2013 white plumes rose to 400 m above the summit. Seismicity decreased significantly on 25 March; tremor was absent starting in April. On 5 April the Alert level was lowered to 2. Despite decreased seismicity, four MODVOLC thermal anomalies, based on MODIS satellite data, were recorded between 29 June and 31 July 2013.
Activity during 2014. PVMBG reported that on 1 January 2014 seismicity increased. On 3 January diffuse white gas plumes rose 100 m and drifted W; on 4 January diffuse brownish plumes also rose 100 m and drifted W. On 5 January the Alert Level was raised to 2.
PVMBG reported that RSAM values showed an increase in energy during March-April 2014. Also during this timeframe, the daily number of volcanic earthquakes was dominated by tremor (with an increase in tremor amplitude). However, beginning in May, the number and the amplitude of tremor decreased.
During 1-17 June 2014, when weather permitted, a weak solfatara plume was visible rising up to 100 m above the summit. On 17 June the Alert Level was lowered to 1. Thermal anomalies, based on MODIS satellite data, were recorded beginning 28 November 2014 and continuing through 25 February 2015.
Activity during 2015. From December 2014 through January 2015, white plumes were observed rising to 500 m above the crater rim. Throughout February and during 1-14 March plumes were gray-white and rose to a maximum height of 200 m. Crater incandescence and rumbling was also reported on 14 February. During 15 March-7 April gray-brown emissions rose to 200 m; rumbling was frequently heard. During 8 April- 21 May gray and gray-brown plumes rose to 300 m. Crater incandescence was observed again on 12 April. Seismicity fluctuated and was dominated by tremor. Rumbling was frequently heard during this interval. The Alert Level remained at 2; residents and tourists were reminded not to approach the craters within a 2-km radius.
Continuous tremor was recorded during December 2014-12 January 2015; tremor was not continuous starting on 13 January, and RSAM values declined. A weak thermal anomaly was recorded on 17 April 2015.
PVMBG reported that during times of clear weather during 1-28 June, white plumes were observed rising as high as 300 m above the crater rim. Rumbling was frequently heard at the observation post. Seismic tremor sharply increased on 21 June, and crater incandescence was observed on 25 and 28 June. BNPB reported that increased activity on 28 June was characterized by Strombolian activity, roaring, ash plumes that rose 300 m, and a loud thumping sound heard 20 km away at 2000. Incandescence from the crater was clearly visible from the observation post in Banyuwangi. PVMBG raised the Alert Level to 3 on 29 June, and reminded the public not to approach the crater within a 3-km radius.
Based on notices from the Ujung Padang Meteorological Watch Office (MWO) and PVMBG, satellite images, and pilot observations, the Darwin VAAC reported that during 1 and 3-7 July ash plumes rose to altitudes of 3.7-6.1 km and drifted 25-110 km E, ESE, and SE. According to news articles, flights in and out of an airport in Bali were cancelled due to ash emissions during 3-4 July. On 5 July BNPB reported that roaring was heard from continuous explosions and Strombolian activity. Dense white-and-gray plumes rose as high as 400 m and drifted SE.
During 1-8 July PVMBG reported that gray plumes rose 100-500 m above the crater rim, crater incandescence was observed, and rumbling and thumping noises were noted. Seismicity was dominated by high-amplitude tremor, and deformation data suggested magma migrating towards the surface. BNPB reported that gray ash plumes continued to rise as high as 500 m above the crater through 11 July (figure 5). Ash plumes drifted in various directions depending on the altitude; plumes drifted SE and S at lower altitudes and SE, S, W, and N at higher altitudes.
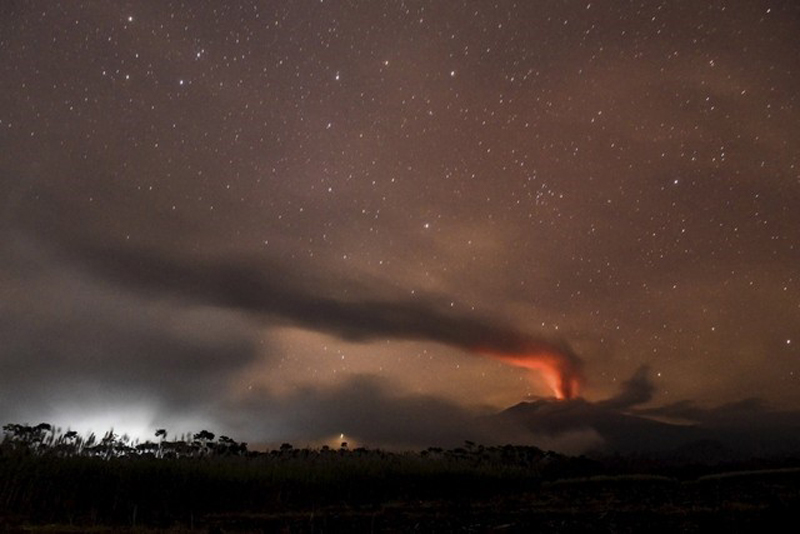 |
Figure 5. Volcanic ash and clouds are illuminated by lava from the crater of Mount Raung as seen from Songgon (Banyuwangi, East Java) on 11 July 2015. Courtesy of Reuters/Zabur Karuru/Antara Foto. |
Based on PVMBG notices, wind data, and satellite images, the Darwin VAAC reported that during 8-12 July ash plumes rose to an altitude of 4.3-5.2 km and drifted as far as 1,040 km E, SE, and S. According to news articles, increased activity during 9-10 July caused flight cancelations and several airports to close, including airports on Bali and Lombok, as well as Banyuwangi and Jember in East Java. One article noted that dozens of flight had been canceled during the previous week. Another article noted that the Bali airport, in addition to another airport in Java, again closed on 12 July, a day after it had reopened.
Information from PVMBG along with satellite-image and pilot observations, allowed the Darwin VAAC to report that during 15-21 July ash plumes rose to varying altitudes of 3.7-6.1 km and drifted as far as 340 km in multiple directions. On 16 July BNPB reported that a dense gray-to-black ash plume rose as high as 2 km above the crater rim and drifted WNW. Incandescent lava at the summit was visible, and tremor was continuous. Roaring and thumping sounds were reported by residents. Ashfall was reported in areas downwind, including Cumedak (19 km W) and Sumberjambe (13 km NW). According to a news article, the Juanda International Airport in Surabaya reopened on 17 July after on-and-off closures the previous week. BNPB noted that the eruption continued on 18 July with ash plumes rising as high as 1.5 km and drifting N. Tremor continued although the amplitude had declined during the previous week.
During 16-23 July PVMBG reported ash plumes rising to 2 km, and incandescence was visible at the crater. Seismicity fluctuated but remained elevated. Based on PVMBG information, and satellite-image and pilot observations, the Darwin VAAC reported that during 22-28 July ash multiple ash plumes rose to varying altitudes of 4.3-5.2 km and drifted as far as 400 km NW, W, SSW, S, and SSE. A news article from 29 July noted that 18 flights at most had been canceled during the previous few days due to the ash plumes, and that the Notohadinegoro Airport (2,100 km SW) had been temporarily closed.
On 4 August BNPB reported that during the previous three days the Strombolian eruption had increased in intensity. Ash fell in Sempu, Songgon, Glenmore, Gambiran, and Banyuwangi. On 4 August dense blackish gray ash plumes rose 800 m and drifted SE. Based on satellite-image and wind data, the Darwin VAAC reported that during 29 July-4 August multiple ash plumes rose to altitudes of 4.3-4.9 km and drifted as far as 240 km in multiple directions.
PVMBG reported that during 24 July-10 August ash plumes rose 1.5 km above the crater with visible incandescence at the crater. Seismicity fluctuated but remained elevated; RSAM values peaked on 4 August (the highest recorded since the beginning of the eruption) and then decreased significantly after mid-August (figure 6). Based on satellite observations and wind data, the Darwin VAAC reported that during 12-14, 16, and 18 August multiple ash plumes rose to altitudes of 3.7-4 km and drifted 20-110 km W and WSW (figure 7).
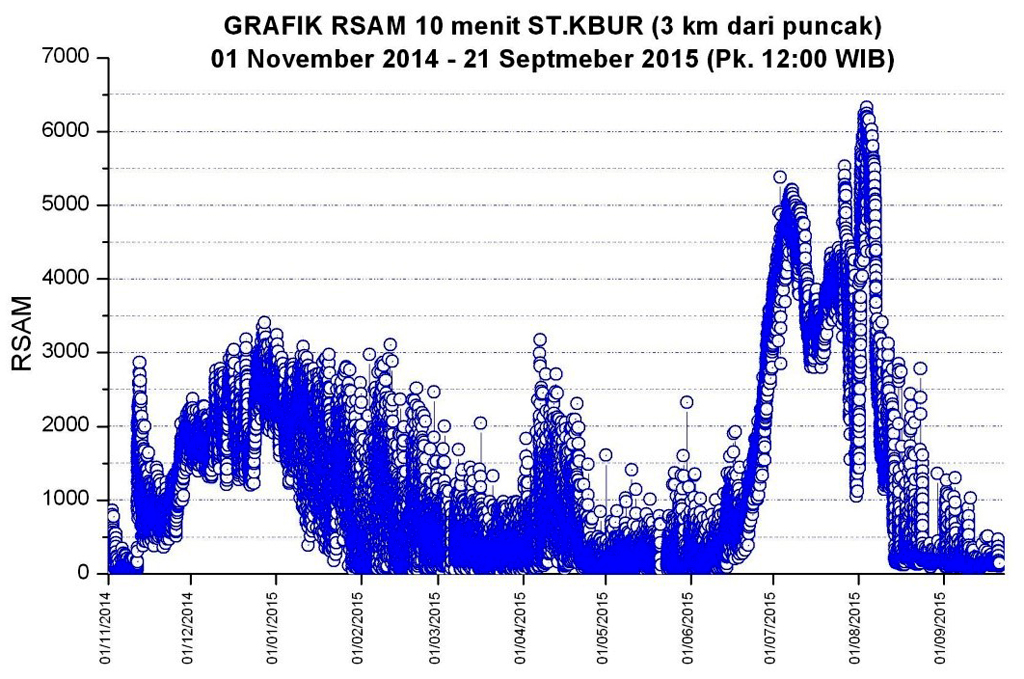 |
Figure 6. Realtime Seismic Amplitude Measurement (RSAM) measurements at Raung between 1 November and 21 September 2015. Courtesy of PVMBG. |
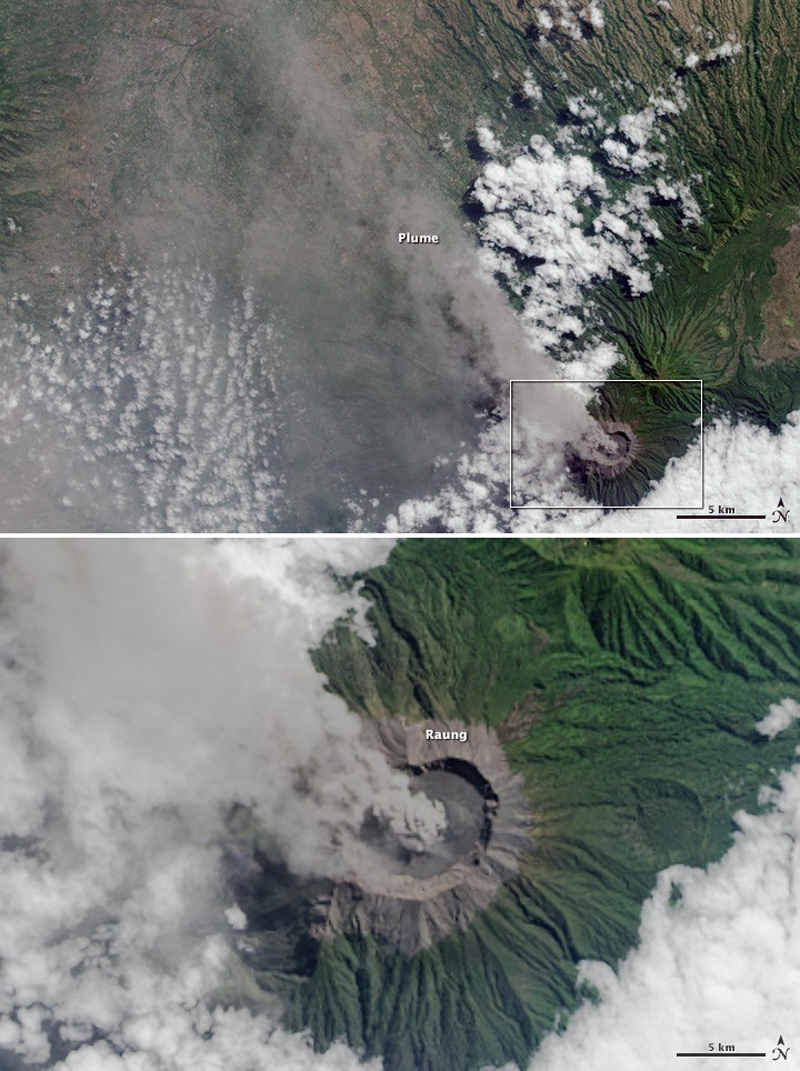 |
Figure 7. On 27 July 2015 the Operational Land Imager (OLI) on Landsat 8 captured a view of ash and volcanic gases drifting NW from Raung. The lower image shows a closer view of the volcano's caldera. Courtesy of NASA Earth Observatory; image by Jesse Allen (Landsat data from the U.S. Geological Survey) and caption by Adam Voiland. |
PVMBG reported that ash plumes rose as high as 1 km above the crater during 16-24 August and drifted NW. Seismicity fluctuated but continued to decrease. The Alert Level, which had remained at 3 since 29 June, was lowered to 2 on 24 August; the public was reminded not to approach the crater within a 2-km radius.
Based on weather models, webcam and satellite data, pilot observations, and information from PVMBG, the Darwin VAAC reported that on 19 August ash plumes rose to an altitude of 3.7 km and drifted 65-95 km NW, WNW, and W. On 22 August a low-level ash plume drifted 55 km NW.
PVMBG reported that, although inclement weather conditions often prevented visual observations during 25 August-21 September, white plumes were occasionally seen rising as high as 200 m above the crater. Seismicity fluctuated but continued to decrease. The Alert Level remained at 2 (on a scale of 1-4), and the public was reminded not to approach the crater within a 2-km radius.
In 2015 the MODVOLC system using infrared MODIS satellite data indicated a small anomaly on 17 April and then steady thermal anomalies beginning 20 June. The last anomaly located at the summit crater, a single weak alert pixel recorded on 29 August 2015, was a full week after the previous anomaly was identified on 22 August.
MODIS data analyzed by the Middle InfraRed Observation of Volcanic Activity (MIROVA) project from February 2015 through January 2016 (figure 8) showed a large spike in power output beginning in mid-June 2015. The slow descent after approximately the first week of August may be due to cooling of lava in the crater rather than to ongoing activity.
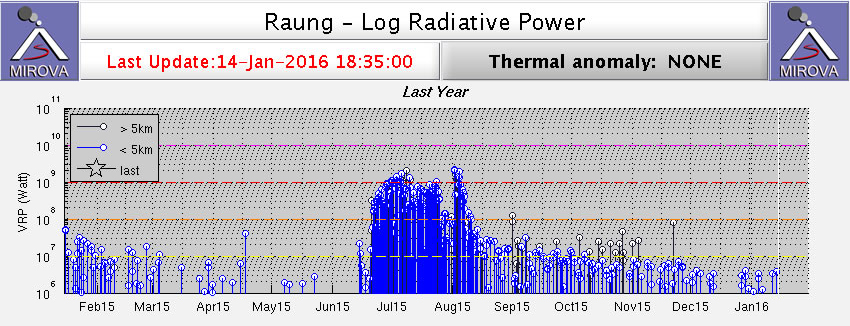 |
Figure 8. MODIS data analyzed by MIROVA shows a spike in power output coinciding with the beginning of elevated seismicity and ash plumes in June 2015. Courtesy of MIROVA. |
Information Contacts: Pusat Vulkanologi dan Mitigasi Bencana Geologi (PVMBG, also known as Indonesian Center for Volcanology and Geological Hazard Mitigation, CVGHM), Jalan Diponegoro 57, Bandung 40122, Indonesia (URL: http://www.vsi.esdm.go.id/); Badan Nasional Penanggulangan Bencana (BNPB), National Disaster Management Agency, Graha BNPB - Jl. Scout Kav.38, East Jakarta 13120, Indonesia (URL: http://www.bnpb.go.id/); Darwin Volcanic Ash Advisory Centre (VAAC), Bureau of Meteorology, Northern Territory Regional Office, PO Box 40050, Casuarina, NT 0811, Australia (URL: http://www.bom.gov.au/info/vaac/); Hawai'i Institute of Geophysics and Planetology (HIGP), MODVOLC Thermal Alerts System, School of Ocean and Earth Science and Technology (SOEST), Univ. of Hawai'i, 2525 Correa Road, Honolulu, HI 96822, USA (URL: http://modis.higp.hawaii.edu/, http://modis.higp.hawaii.edu/); MIROVA (Middle InfraRed Observation of Volcanic Activity), a collaborative project between the Universities of Turin and Florence (Italy) supported by the Centre for Volcanic Risk of the Italian Civil Protection Department (URL: http://www.mirovaweb.it/); NASA Earth Observatory, EOS Project Science Office, NASA Goddard Space Flight Center, Goddard, Maryland, USA (URL: http://earthobservatory.nasa.gov/); ch-aviation GmbH, Quaderstrasse 8, 7000 Chur, Switzerland (URL: http://www.ch-aviation.com/portal/news/38959-surabaya-indonesia-reopens-despite-mt-raung-eruption); WA Today, East Perth, WA, Australia (URL: http://www.watoday.com.au/wa-news/volcano-causes-more-bali-flight-cancellations-20150704-gi56a5.html); The Weather Channel (URL: http://www.weather.com/news/news/indonesia-mount-raung-volcan); The National, Abu Dhabi Media, Abu Dhabi, United Arab Emirates (URL: http://www.thenational.ae/world/mount-raung-eruption-causes-closure-of-bali-airport-again); The Jakarta Post, PT Niskala Media Tenggara, Jl. Palmerah Barat No. 142-143, Jakarta 10270, Indonesia (URL: http://www.thejakartapost.com/news/2015/07/29/mount-raungs-eruption-cancels-18-flights-jember.html).
Eruptions confirmed during 2012- 2013; lava fills inner crater in November 2014-August 2015
A massive stratovolcano in easternmost Java, Raung has over sixty recorded eruptions dating back to the late 16th Century. Explosions with ash plumes, Strombolian activity, and lava flows from a cinder cone within the 2-km-wide summit crater have been the most common activity. Visual reports of activity have often come from commercial airline flights that pass near the summit; Pusat Vulkanologi dan Mitigasi Bencana Geologi (PVMBG, also known as Indonesian Center for Volcanology and Geological Hazard Mitigation, CVGHM) has installed webcams to monitor activity in recent years. An eruption in 2015 produced a large volume of lava within the summit crater and formed a new pyroclastic cone in the same location as the previous one. Confirmation and details of eruptions in 2012, 2013, and 2014-2015 are covered in this report with information provided by PVMBG, the Darwin Volcanic Ash Advisory Center (VAAC), several sources of satellite data, and visitors to the volcano.
Newly available visual and satellite information confirm eruptions at Raung during October 2012-January 2013, June-July 2013, and extend the beginning of the 2015 eruption back to November 2014. The 2015 eruption was the largest in several decades; Strombolian activity was reported for many months and fresh lava flows covered the crater floor. Raung was quiet after the 2015 eruption ended in August of that year until July 2020.
Eruption during October 2012-January 2013. A MODVOLC thermal alert appeared inside the summit crater of Raung on 14 October 2012, followed by another four alerts on 16 October. Multiple daily alerts were reported on many days through 8 November, most within the main crater. Single alerts appeared on 29 November and 1 December 2012 (figure 9). PVMBG raised the Alert Level on 17 October from 1 to 2 due to increased seismicity and raised it further to Level 3 on 22 October. A local news report by Aris Yanto indicted that a minor Strombolian eruption occurred inside the crater on 19 October. Strombolian activity was also observed inside the inner crater on 5 November 2012 by visitors (figure 10); they reported loud rumbling sounds that could be heard up to 15 km from the crater.
 |
Figure 9. Thermal activity at Raung during October and November 2012 included multiple days of multi-pixel anomalies, with almost all activity concentrated within the summit crater. Strombolian activity was observed on 5 November. Image shows all pixels from 23 September-1 December 2012. Courtesy of MODVOLC. |
 |
Figure 10. Strombolian activity was observed inside the inner crater of Raung on 5 November 2012 by visitors. They reported loud rumbling sounds that could be heard up to 15 km from the crater. Photo by Galih, courtesy of Volcano Discovery. |
The Darwin VAAC issued an advisory of an eruption plume to 9.1 km altitude reported at 0237 UTC on 8 November 2012. In a second advisory about two hours later they noted that an ash plume was not visible in satellite imagery. A press article released by the Center for Volcanology and Geological Hazard Mitigation (PVMBG) indicated that gray ash plumes were observed on 6 January 2013 that rose 300 m above the summit crater rim. Incandescence was observed around the crater and thundering explosions were heard by nearby residents.
Eruption during June-July 2013. Two MODVOLC thermal alerts were measured inside the summit crater on 29 June 2013. A photo taken on 21 July showed minor Strombolian activity at the inner crater (figure 11). A weak SO2 anomaly was detected in the vicinity of Raung by the OMI instrument on the Aura satellite on 27 July. Thermal alerts were recorded on 29 and 31 July. When Google Earth imagery from 14 March 2011 created by Maxar Technologies is compared with imagery from 29 July 2013 captured by Landsat/Copernicus, dark tephra is filling the inner crater in the 2013 image; it was not present in 2011 (figure 12).
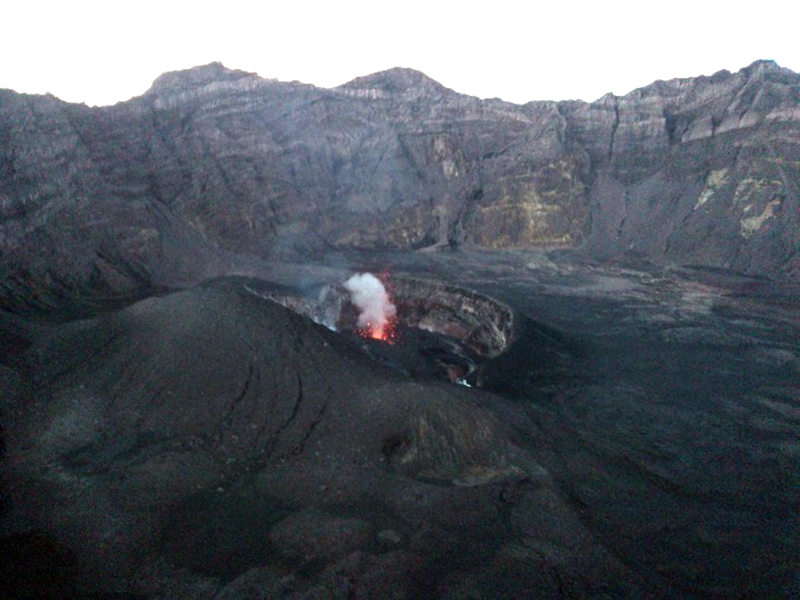 |
Figure 11. Strombolian activity was observed inside the inner crater at the summit of Raung on 21 July 2013. Photo by Agus Kurniawan, courtesy of Volcano Discovery. |
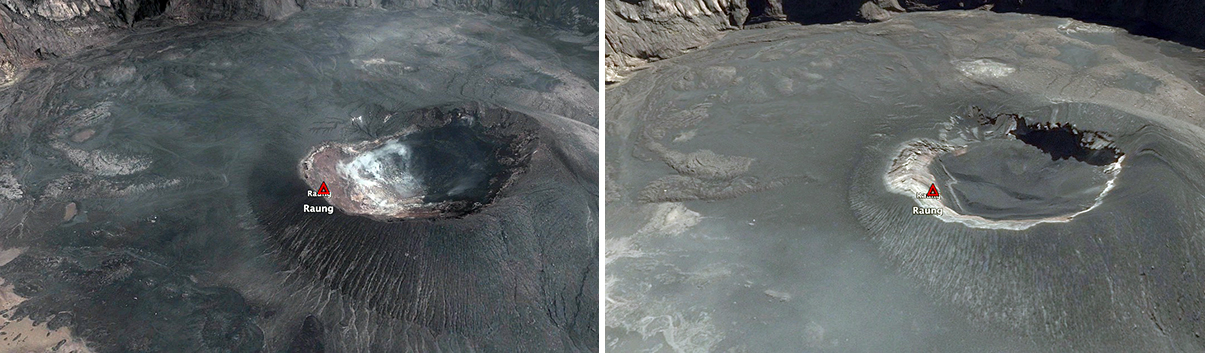 |
Figure 12. Satellite imagery from Google Earth showing the eroded pyroclastic cone inside the summit crater of Raung on 14 March 2011 (left) and 29 July 2013 (right). Dark tephra deposits filling the inner crater in the 2013 image were not present in 2011. The crater of the pyroclastic cone is 200 m wide; N is to the top of the images. Courtesy of Google Earth. |
Eruption during November 2014-August 2015. Information about this eruption was previously reported (BGVN 41:12), but additional details are provided here. Landsat-8 imagery from 28 October 2014 indicated clear skies and little activity within the summit crater. Local observers reported steam plumes beginning in mid-November (figure 13). MODVOLC thermal alerts within the summit crater were issued on 28 and 30 November, and then 15 alerts were issued on seven days in December. Thermal Landsat-8 imagery from cloudy days on 29 November and 15 December indicated an anomaly over the area of the pyroclastic cone inside the summit crater (figure 14).
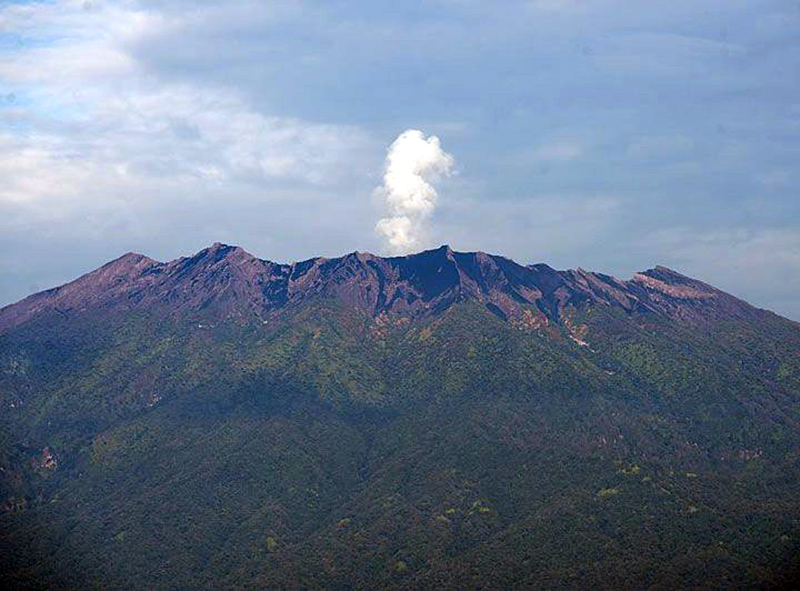 |
Figure 13. Local observers reported steam plumes at Raung beginning in mid-November 2014; this one was photographed on 17 November 2014. Courtesy of Volcano Discovery. |
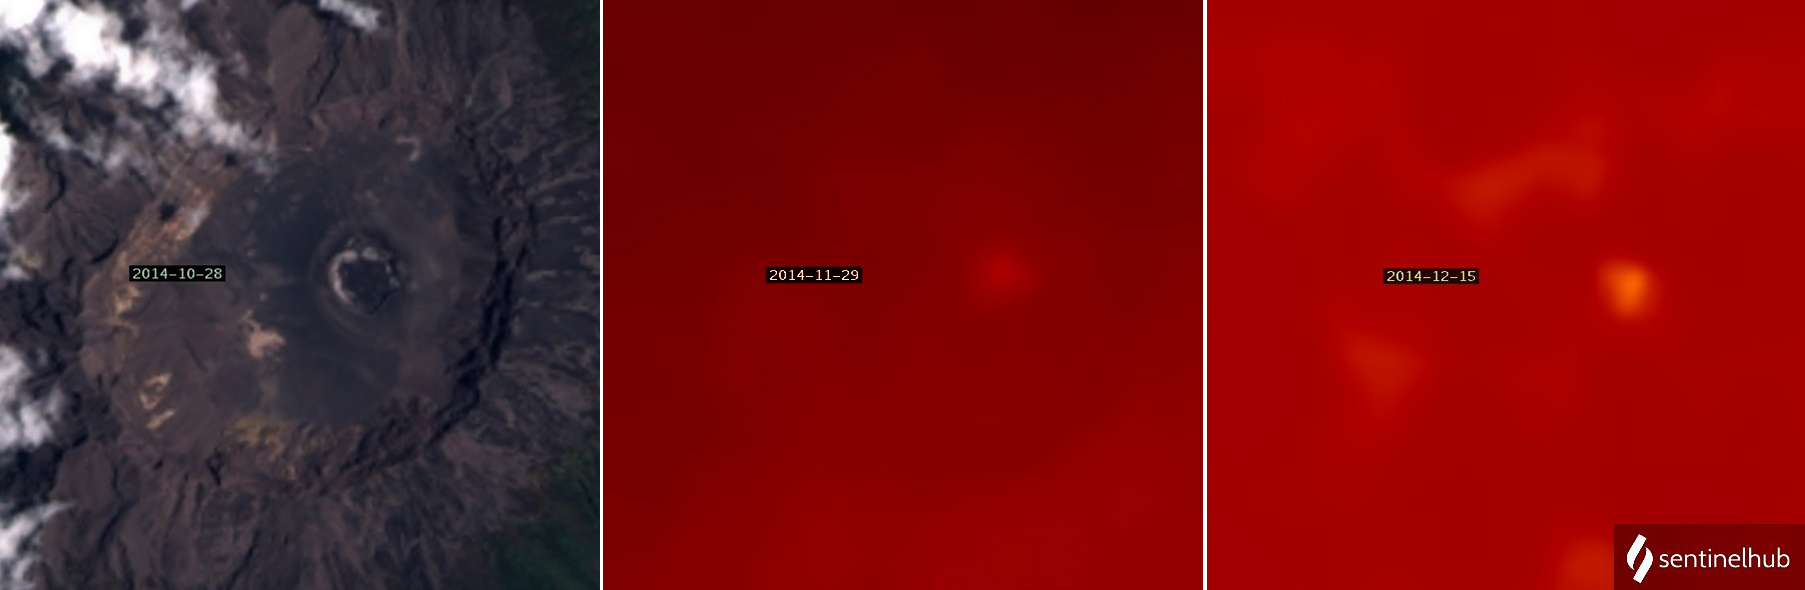 |
Figure 14. Satellite evidence of new eruptive activity at Raung first appeared on 29 November 2014. The true color-pansharpened Landsat-8 image of Raung from 28 October 2014 (left) shows the summit crater and an eroded pyroclastic cone with its own crater (the inner crater) with no apparent activity. Although dense meteoric clouds on 29 November (center) and 15 December 2014 (right) blocked true color imagery, thermal imagery indicated a thermal anomaly from the center of the pyroclastic cone on both dates. Courtesy of Sentinel Hub Playground. |
In January 2015 the MODVOLC system identified 25 thermal anomalies in MODIS data, with a peak of eight alerts on 8 January. Visitors to the summit crater on 6 January witnessed explosions from the inner crater approximately every 40 minutes that produced gas and small amounts of ash and tephra. They reported lava flowing continuously from the inner crater onto the larger crater floor, and incandescent activity was seen at night (figure 15). Landsat-8 images from 16 January showed a strong thermal anomaly covering an area of fresh lava (figure 16).
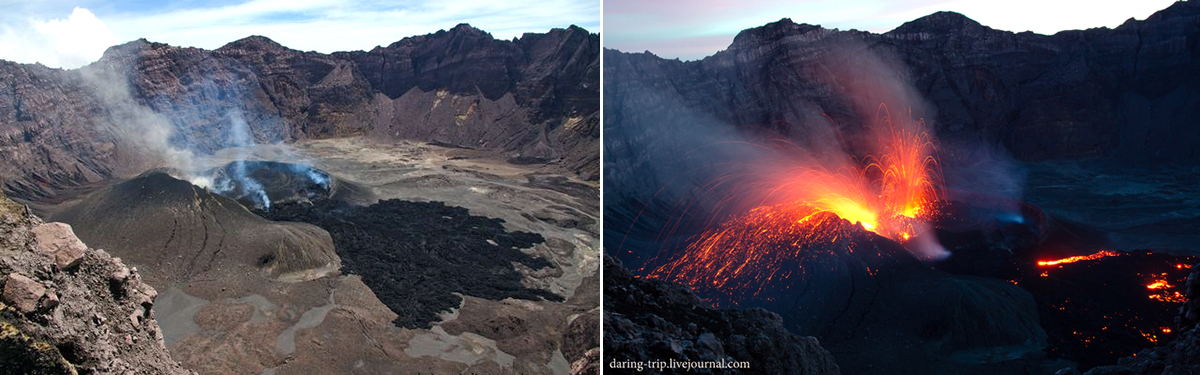 |
Figure 15. Visitors to the summit crater of Raung on 6 January 2015 witnessed explosions from the inner crater approximately every 40 minutes that produced abundant gas and small amounts of ash and tephra. Lava was flowing continuously from the inner crater onto the larger crater floor, and incandescent activity was observed at night. Photos by Sofya Klimova, courtesy of Volcano Discovery. |
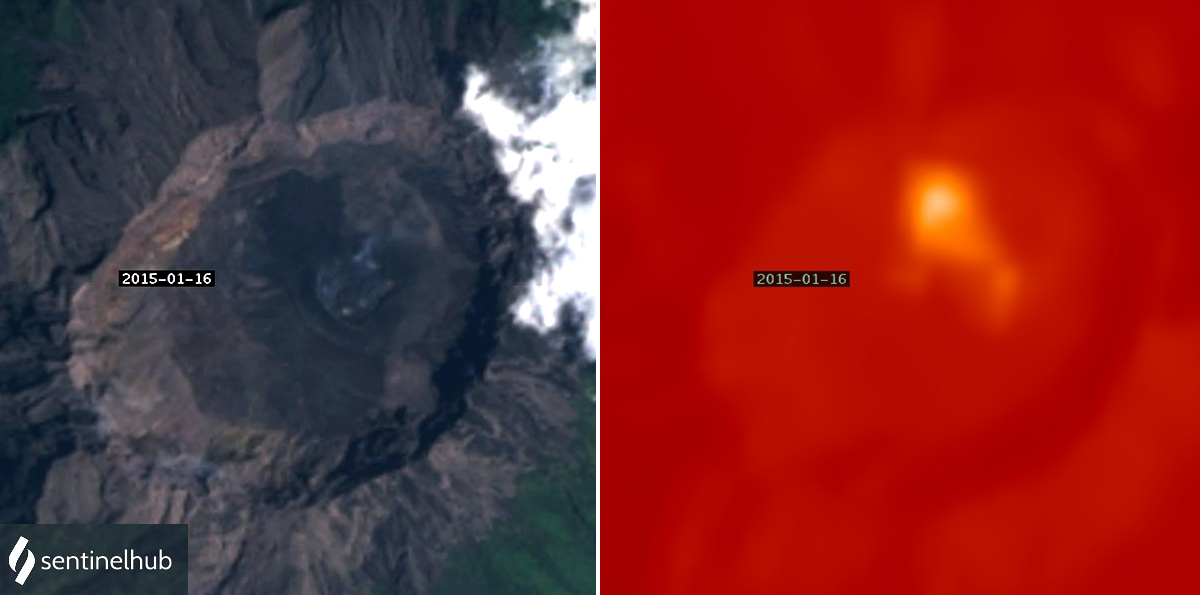 |
Figure 16. On a clear 16 January 2015, Landsat-8 satellite imagery revealed fresh lava flows NW of the pyroclastic cone within the summit crater at Raung. A strong thermal anomaly matches up with the dark material, suggesting that it flowed NW from within the pyroclastic cone. Left image is true color-pansharpened rendering, right image is thermal rendering. Courtesy of Sentinel Hub Playground. |
Satellite images were obscured by meteoric clouds during February 2015, but PVMBG reported gray and brown plumes rising 300 m multiple times and incandescence and rumbling on 14 February. Visitors to the summit crater during the second half of February reported Strombolian activity with lava fountains from the inner crater, at times as frequently as every 15 minutes (figure 17). Loud explosions and rumbling were heard 10-15 km away. MODVOLC thermal alerts stopped on 25 February and did not reappear until late June.
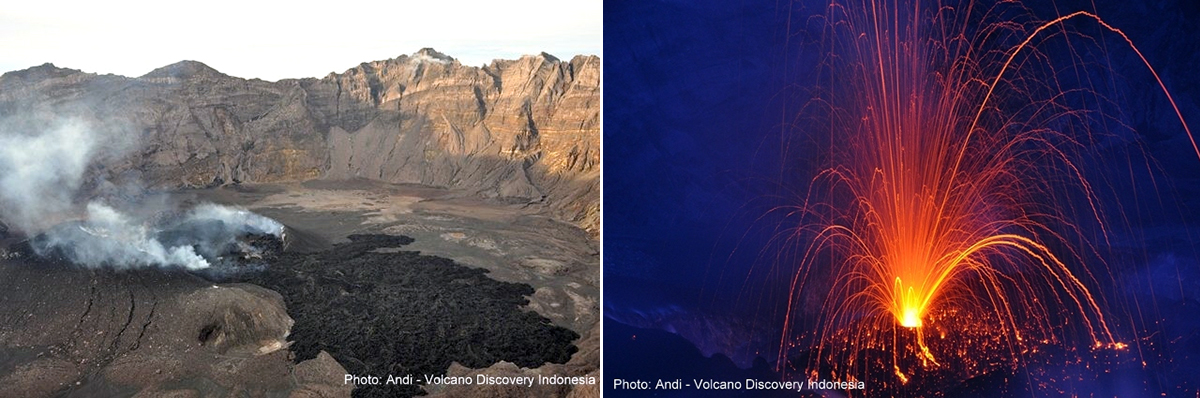 |
Figure 17. A report issued on 25 February 2015 from visitors to the summit of Ruang noted large Strombolian explosions with incandescent ejecta and lava flowing across the crater floor. The fresh lava on the crater floor covered a noticeably larger area than that shown in early January (figure 15). Photo by Andi, courtesy of Volcano Discovery. |
PVMBG raised the Alert Level to 2 in mid-March 2015. Weak thermal anomalies located inside and NW of the pyroclastic cone were present in satellite imagery on 21 March. PVMBG reported gray and brown emissions during March, April, and May rising as high as 300 m above the crater. Landsat imagery from 22 April showed a small emission inside the pyroclastic cone, and on 8 May showed a clearer view of the fresh black lava NW and SW of the pyroclastic cone (figure 18).
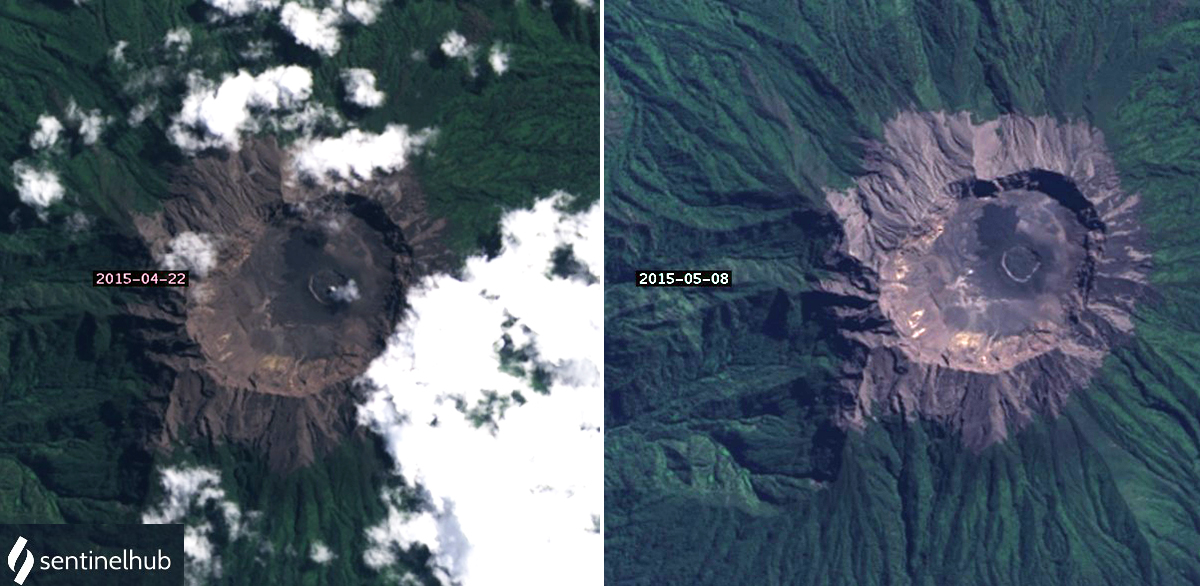 |
Figure 18. Fresh lava was visible in Landsat-8 satellite imagery in April and May 2015 at Raung. A small emission was present inside the pyroclastic cone at the summit of Raung on 22 April 2015 (left). Fresh dark material is also evident in the SW quadrant of the summit crater that was not visible on 16 January 2015. A clear view on 8 May 2015 also shows the extent of the fresh black material around the pyroclastic cone (right). The summit crater is 2 km wide. Courtesy of Sentinel Hub Playground. |
Nine MODVOLC thermal alerts appeared inside the summit crater on 21 June 2015 after no alerts since late February, suggesting an increase in activity. The Darwin VAAC issued the first ash advisory for 2015 on 24 June noting an aviation report of recent ash. The following day the Ujung Pandang Meteorological Weather Office (MWO) reported an ash emission drifting W at 3.7 km altitude. The same day, 25 June, Landsat-8 imagery clearly showed a new lava flow on the W side of the crater and a strong thermal anomaly. The thermal data showed a point source of heat widening SW from the center of the crater and a second point source of heat that appeared to be inside the pyroclastic cone. A small ash plume was visible over the cone (figure 19). Strombolian activity and ash plumes were reported by BNPB and PVMBG in the following days. On 26 June the Darwin VAAC noted the hotspot had remained visible in infrared imagery for several days. PVMBG reported an ash emission to 3 km altitude on 29 June.
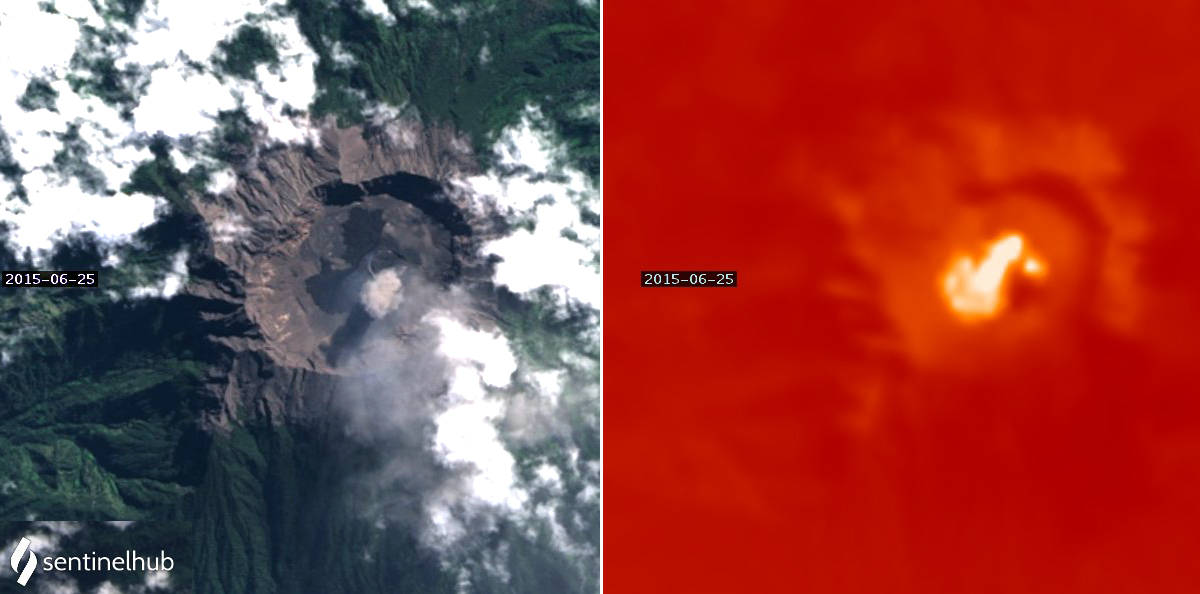 |
Figure 19. A new lava flow and strong thermal anomaly appeared inside the summit crater of Raung on 25 June 2015 in Landsat-8 imagery. The new flow was visible on the W side of the crater. The darker area extending SW from the rising ash plume is a shadow. The thermal data showed a point source of heat widening SW from the center of the crater and spreading out in the SW quadrant and a second point source of heat on the flank of the pyroclastic cone. Left image is True color-pansharpened rendering, and right image is thermal rendering. Courtesy of Sentinel Hub Playground. |
Activity increased significantly during July 2015 (BGVN 41:12). Ash plumes rose as high as 6.7 km altitude and drifted hundreds of kilometers in multiple directions, forcing multiple shutdowns at airports on Bali and Lombok, as well as Banyuwangi and Jember in East Java. The Darwin VAAC issued 152 ash advisories during the month. Ashfall was reported up to 20 km W during July and 20-40 km SE during early August. Visitors to the summit in early July observed a new pyroclastic cone growing inside the inner crater from incandescent ejecta and dense ash emissions (figure 20). Landsat-8 imagery from 11 July showed a dense ash plume drifting SE, fresh black lava covering the 2-km-wide summit caldera floor, and a very strong thermal anomaly most intense at the center near the pyroclastic cone and cooler around the inner edges of the crater (figure 21). On 12 July, the Moderate Resolution Imaging Spectroradiometer (MODIS) on NASA’s Aqua satellite captured a view of an ash-and-gas plume drifting hundreds of kilometers SE from Raung (figure 22).
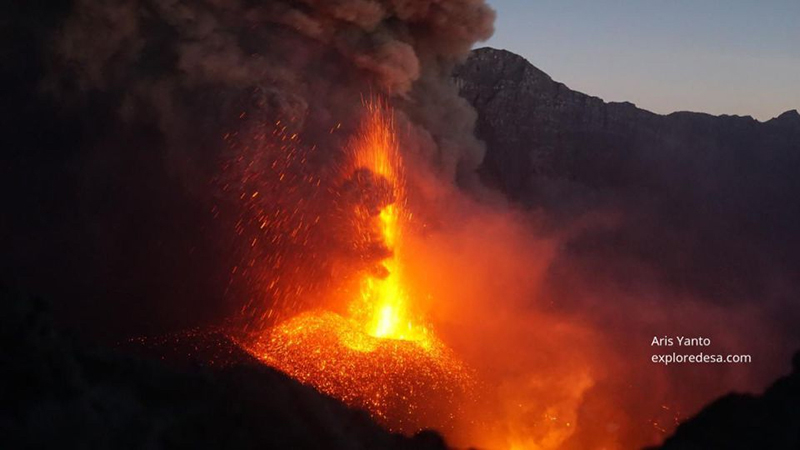 |
Figure 20. A new pyroclastic cone was growing inside the inner crater at the summit of Raung when photographed by Aris Yanto in early July 2015. Courtesy of Volcano Discovery. |
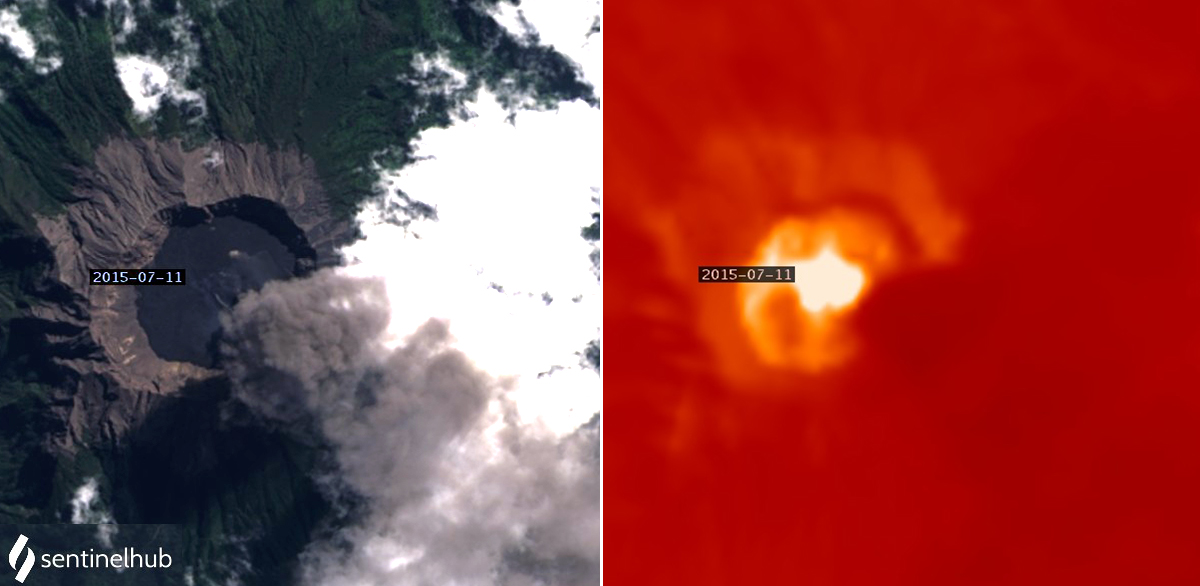 |
Figure 21. Landsat-8 imagery of Raung during July 2015 indicated dense ash emissions and a large thermal anomaly caused by fresh lava. On 11 July a dense ash plume drifted SE and a strong thermal anomaly was centered inside the summit crater. The 2-km-wide crater floor was covered with fresh lava (compare with 25 June image in figure 19). Courtesy of Sentinel Hub Playground. |
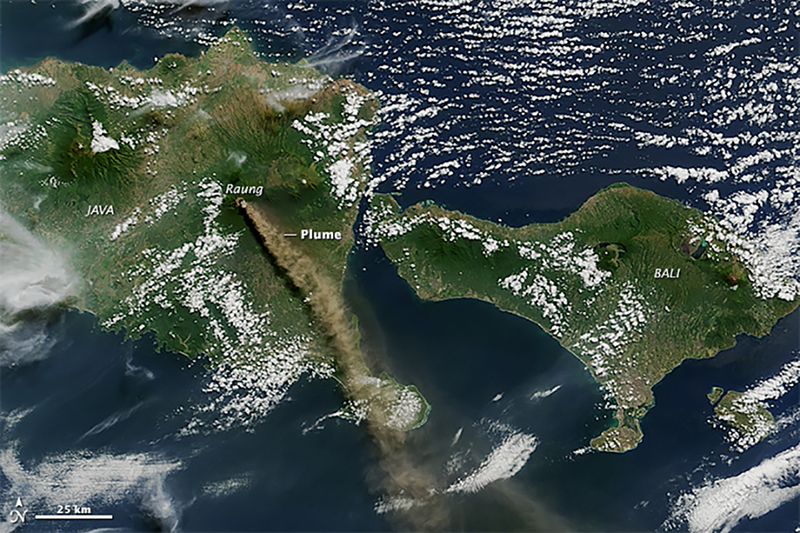 |
Figure 22. On 12 July 2015 the Moderate Resolution Imaging Spectroradiometer (MODIS) on NASA’s Aqua satellite captured a natural-color view of a plume of ash and volcanic gases drifting hundreds of kilometers SE from Raung. Courtesy of NASA Earth Observatory. |
A satellite image on 20 July showed fresh incandescent lava covering the floor of the summit crater and a dense ash plume drifting N from the summit (figure 23). Incandescent ejecta emerged from two vents on the new pyroclastic cone inside the inner crater on 26 July (figure 24). On 27 July a dense ash plume was visible again in satellite imagery drifting NW and the hottest part of the thermal anomaly was in the SE quadrant of the crater (figure 25). Substantial SO2 plumes were recorded by the OMI instrument on the Aura satellite during July and early August 2015 (figure 26).
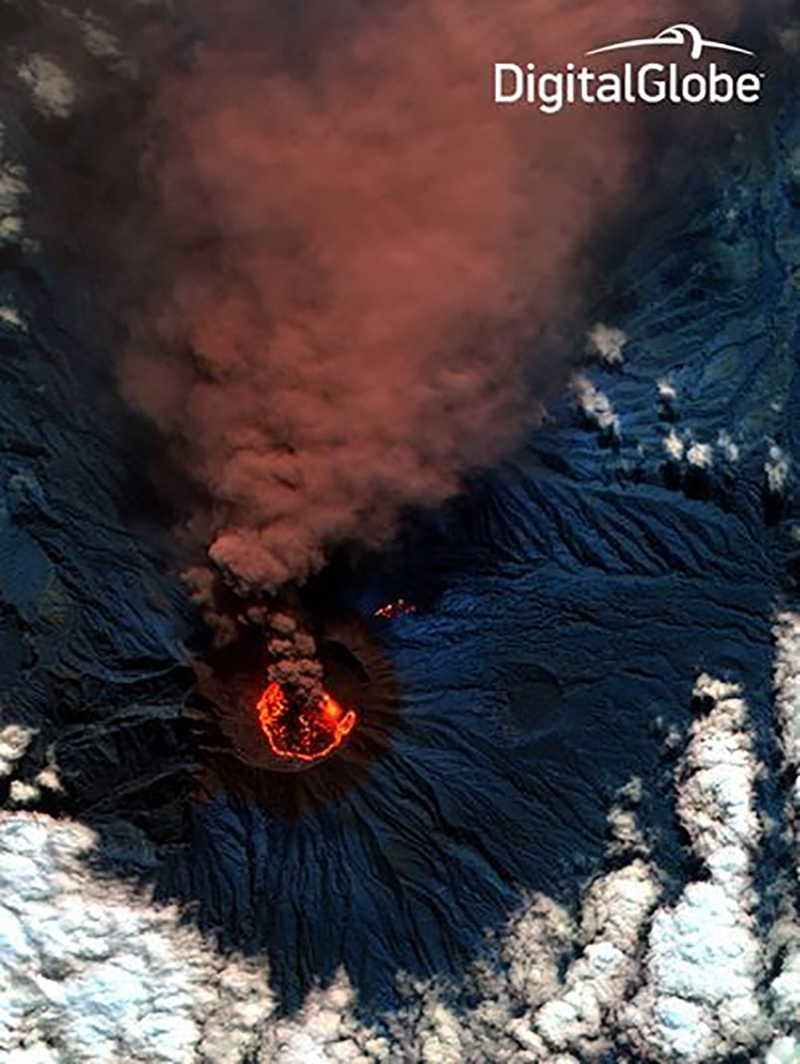 |
Figure 23. A satellite image of the summit of Raung on 20 July 2015 showed fresh, incandescent lava covering the floor of the summit crater and a dense ash plume drifting N from the summit. Thermal activity on the NE flank was likely the result of incandescent ejecta from the crater causing a fire. Image created by DigitalGlobe, captured by WorldView3, courtesy of Volcano Discovery. |
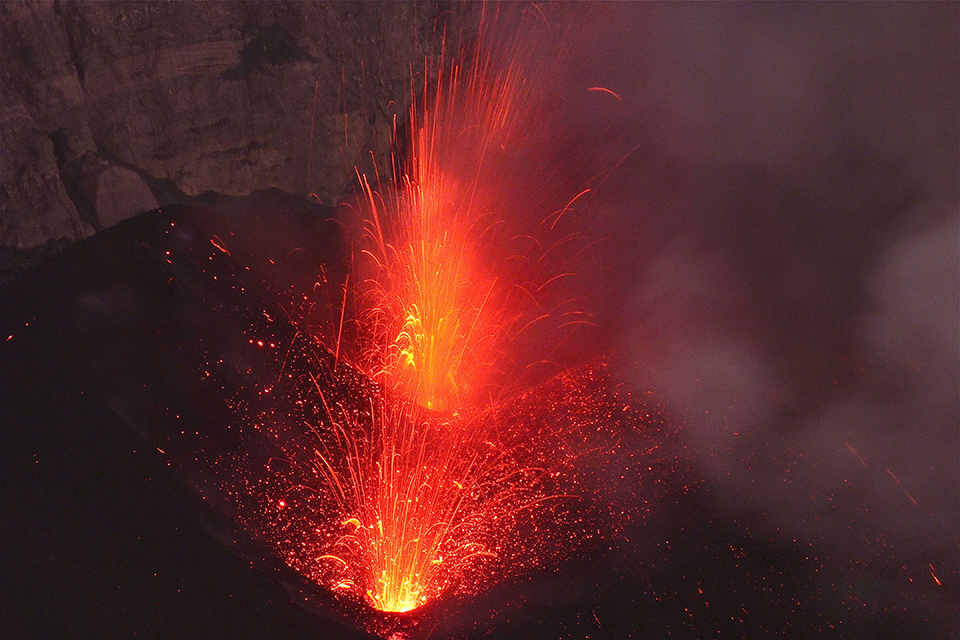 |
Figure 24. Incandescent ejecta emerged from two vents on the new pyroclastic cone growing inside the inner crater of Raung on 26 July 2015. Photo by Vianney Tricou, used with permission, courtesy of Volcano Discovery. |
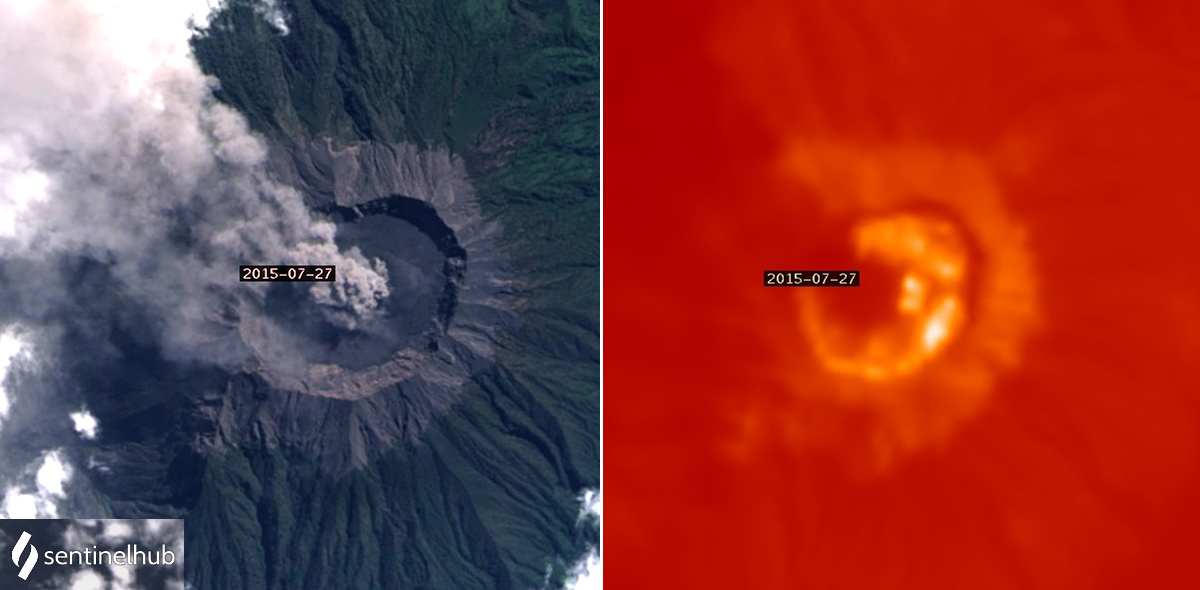 |
Figure 25. Landsat-8 imagery of Raung during July 2015 indicated dense ash emissions and large thermal anomalies from fresh lava. The 2-km-wide crater floor was fully covered with fresh lava by 11 July. On 27 July the dense ash plume was drifting NW and the highest heat was concentrated in the SE quadrant of the crater. Courtesy of Sentinel Hub Playground. |
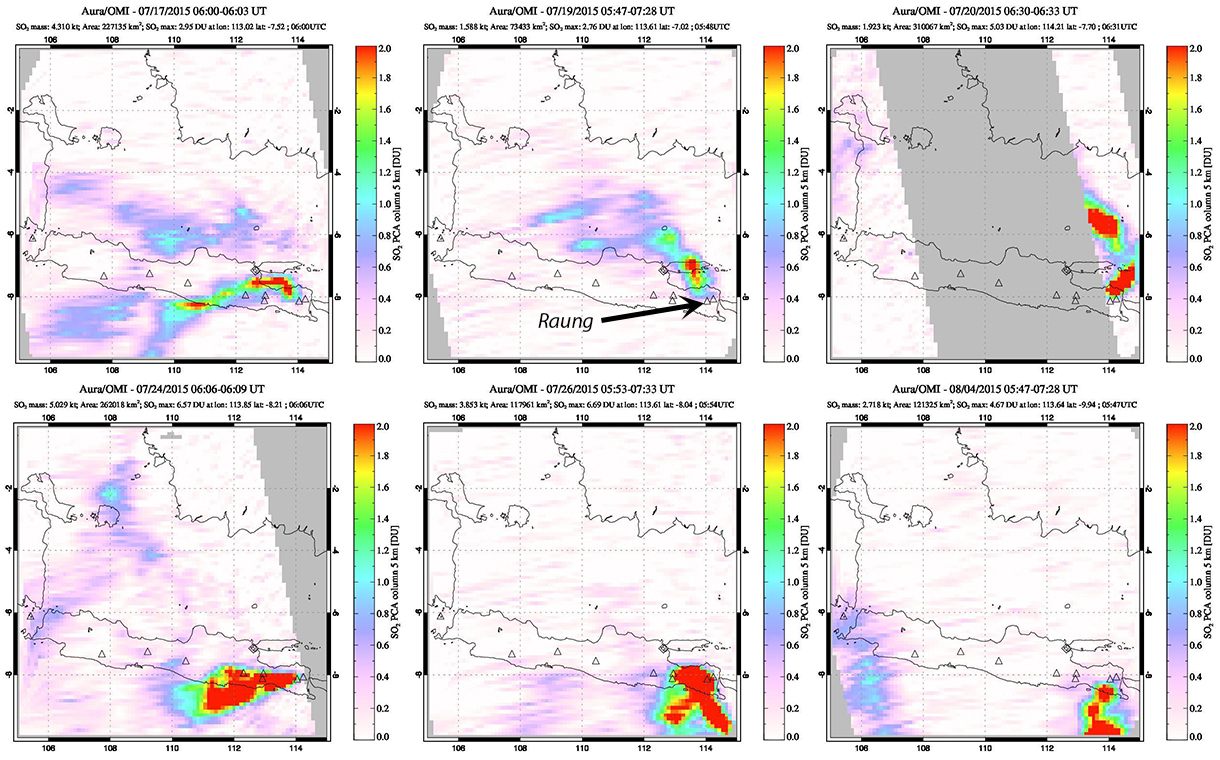 |
Figure 26. Substantial plumes of sulfur dioxide from Raung were measured by the OMI instrument on the AURA satellite during July and August 2015. The first plumes were measured in mid-June; they intensified during the second half of July and the first week of August, but had decreased by mid-August. Wind directions were highly variable throughout the period. The date is recorded above each image. Courtesy of NASA Global Sulfur Dioxide Page. |
Significant ash emissions continued into early August 2015 with numerous flight cancellations. The Darwin VAAC reported ash plumes rising to 5.2 km altitude and extending as far as 750 km SE during the first two weeks in August (figure 27). Satellite imagery indicated a small ash plume drifting W from the center of the crater on 12 August and weak thermal anomalies along the E and S rim of the floor of the crater (figure 28). The summit crater was covered with fresh lava on 14 August when viewed by visitors, and ash emissions rose a few hundred meters above the crater rim from a vent in the SW side of the pyroclastic cone (figure 29). The visitors observed pulsating ash emissions rising from the SW vent on the large double-crater new cinder cone. The larger vent to the NE was almost entirely inactive except for two small, weakly effusive vents on its inner walls.
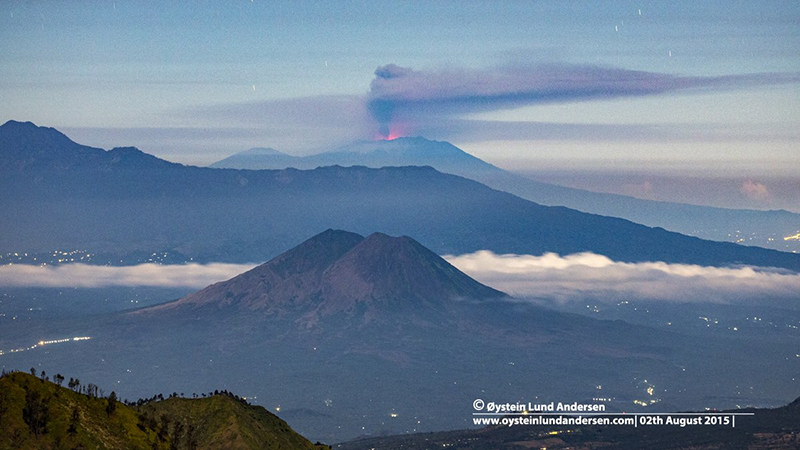 |
Figure 27. A dense ash plume drifted many kilometers S from Raung on 2 August 2015 in this view from nearly 100 km W. Incandescence at the summit indicated ongoing activity from the major 2015 eruption. In the foreground is Lamongan volcano whose last known eruption occurred in 1898. Courtesy of Øystein Lund Andersen, used with permission. |
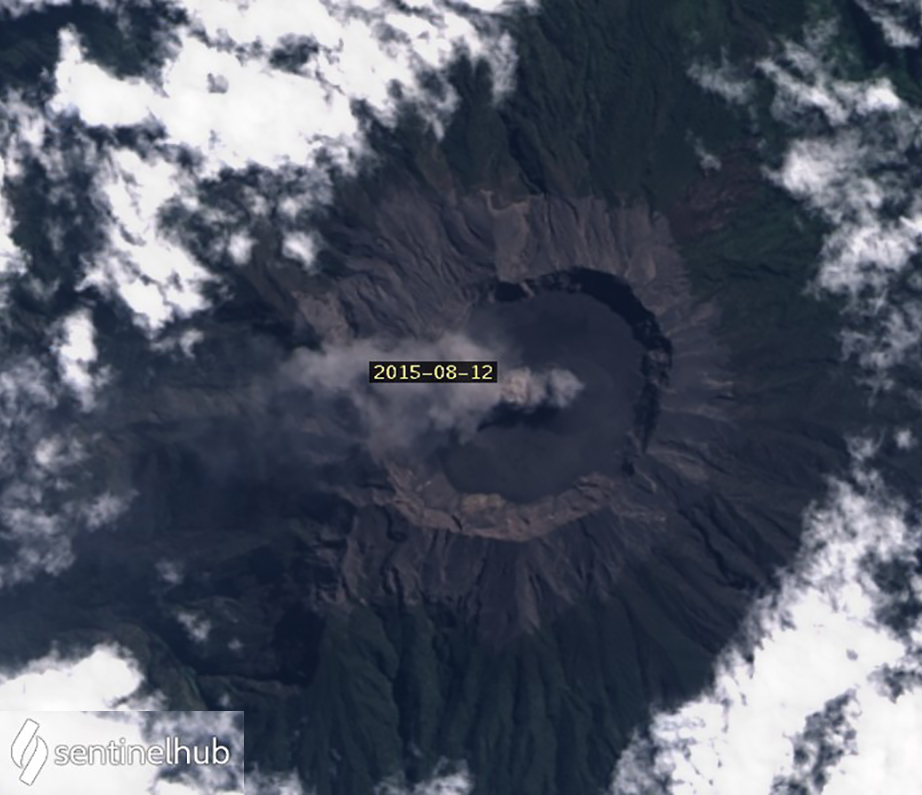 |
Figure 28. Landsat-8 satellite imagery of Raung indicated a small ash plume drifting W from the center of the crater on 12 August 2015. Courtesy of Sentinel Hub Playground. |
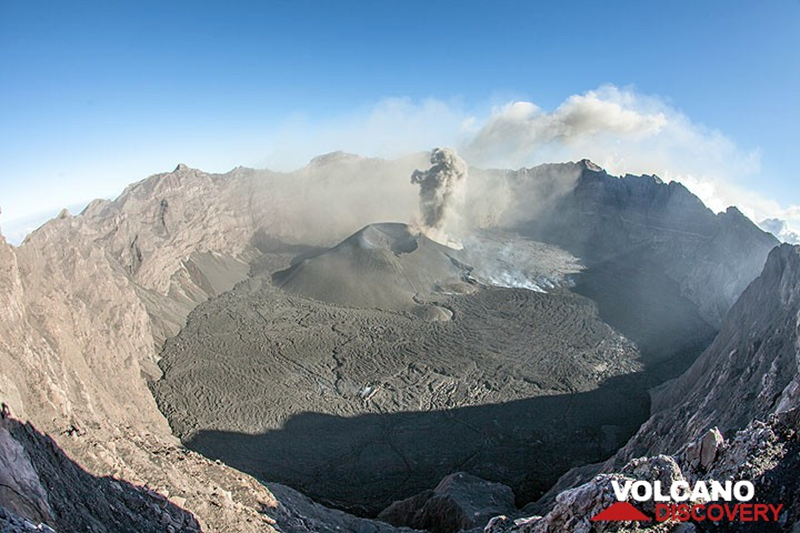 |
Figure 29. The summit crater of Raung on 14 August 2015 was filled with fresh lava from an eruption that began in November 2014. Ash emissions from a vent in the side of the newly grown pyroclastic cone within the crater rose a few hundred meters above the crater rim. Courtesy of Volcano Discovery. |
The lengthy sequence of multiple daily VAAC reports that began in late June ended on 16 August 2015 with reports becoming more intermittent and ash plume heights rising to only 3.7-3.9 km altitude. Multiple discontinuous eruptions to 3.9 km altitude were reported on 18 August. The plumes extended about 100 km NW. The last report of an ash plume was from an airline on 22 August noting a low-level plume 50 km NW. Two MODVOLC alerts were issued that day. By 28 August only a very small steam plume was present at the center of the crater; the southern half of the edge of the crater floor still had small thermal anomalies (figure 30). The last single MODVOLC thermal alerts were on 29 August and 7 September. The Alert Level was lowered to 2 on 24 August 2015, and further lowered to 1 on 20 October 2016.
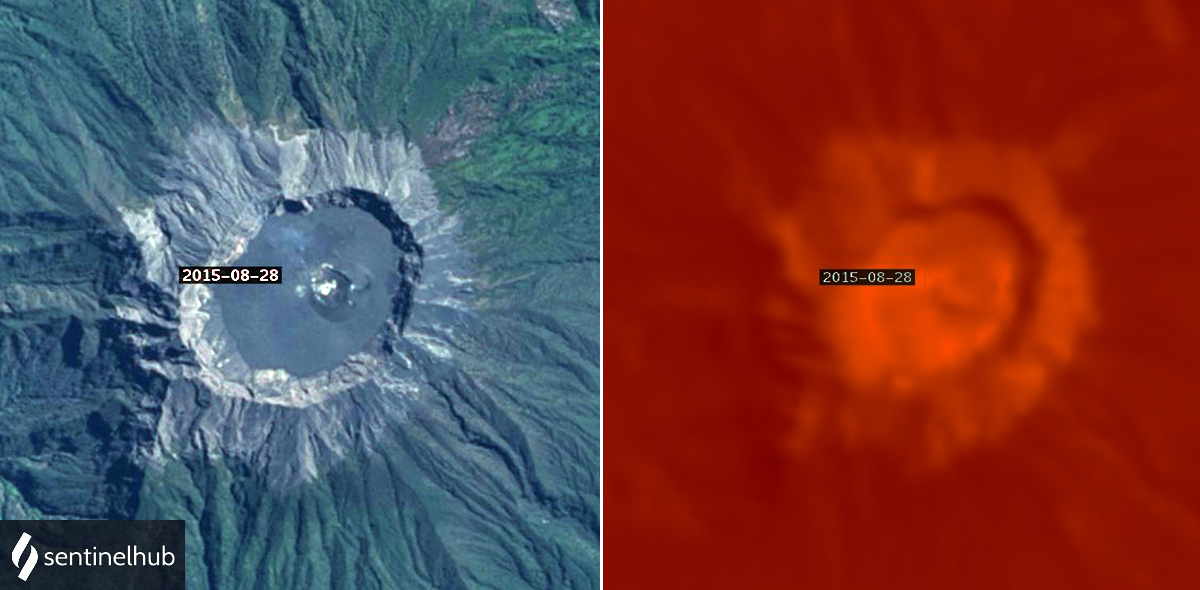 |
Figure 30. By 28 August 2015 only a very small steam plume was present at the center of the summit crater of Raung, and the southern half of the edge of the crater floor only had weak thermal anomalies from cooling lava. Courtesy of Sentinel Hub Playground. |
Information Contacts: Pusat Vulkanologi dan Mitigasi Bencana Geologi (PVMBG, also known as Indonesian Center for Volcanology and Geological Hazard Mitigation, CVGHM), Jalan Diponegoro 57, Bandung 40122, Indonesia (URL: http://www.vsi.esdm.go.id/); Badan Nasional Penanggulangan Bencana (BNPB), National Disaster Management Agency, Graha BNPB - Jl. Scout Kav.38, East Jakarta 13120, Indonesia (URL: http://www.bnpb.go.id/); Hawai'i Institute of Geophysics and Planetology (HIGP) - MODVOLC Thermal Alerts System, School of Ocean and Earth Science and Technology (SOEST), Univ. of Hawai'i, 2525 Correa Road, Honolulu, HI 96822, USA (URL: http://modis.higp.hawaii.edu/); Darwin Volcanic Ash Advisory Centre (VAAC), Bureau of Meteorology, Northern Territory Regional Office, PO Box 40050, Casuarina, NT 0811, Australia (URL: http://www.bom.gov.au/info/vaac/);Google Earth (URL: https://www.google.com/earth/); Sentinel Hub Playground (URL: https://www.sentinel-hub.com/explore/sentinel-playground); NASA Earth Observatory, EOS Project Science Office, NASA Goddard Space Flight Center, Goddard, Maryland, USA (URL: http://earthobservatory.nasa.gov/, https://earthobservatory.nasa.gov/images/86213/eruption-of-raung-volcano); Tom Pfeiffer, Volcano Discovery (URL: http://www.volcanodiscovery.com/); Aris Yanto (URL: https://www.exploredesa.com/2012/11/mount-raung-produce-of-vulcanic-ash-plume-and-continue-eruption/); DigitalGlobe (URL: https://www.maxar.com/, https://twitter.com/Maxar/status/875449111398547457); Øystein Lund Andersen (URL: https://twitter.com/OysteinVolcano/status/1194879946042142726, http://www.oysteinlundandersen.com).
Explosions with ash plumes and a thermal anomaly at the summit crater, July-October 2020
A massive stratovolcano in easternmost Java, Raung has over sixty recorded eruptions dating back to the late 16th Century. Explosions with ash plumes, Strombolian activity, and lava flows from a cinder cone within the 2-km-wide summit crater have been the most common activity. Pusat Vulkanologi dan Mitigasi Bencana Geologi (PVMBG, also known as Indonesian Center for Volcanology and Geological Hazard Mitigation, CVGHM) has installed webcams to monitor activity in recent years. An eruption from late 2014 through August 2015 produced a large volume of lava within the summit crater and formed a new pyroclastic cone in the same location as the previous one. The eruption that began in July 2020 is covered in this report with information provided by PVMBG, the Darwin Volcanic Ash Advisory Center (VAAC), and several sources of satellite data.
The 2015 eruption was the largest in several decades; Strombolian activity was reported for many months and fresh lava flows covered the crater floor (BGVN 45:09). Raung was quiet after the eruption ended in August of that year until July of 2020 when seismicity increased on 13 July and brown emissions were first reported on 16 July. Tens of explosions with ash emissions were reported daily during the remainder of July 2020. Explosive activity decreased during August, but thermal activity didn’t decrease until mid-September. The last ash emissions were reported on 3 October and the last thermal anomaly in satellite data was recorded on 7 October 2020.
Eruption during July-October 2020. No further reports of activity were issued after August 2015 until July 2020. Clear Google Earth imagery from October 2017 and April 2018 indicated the extent of the lava from the 2015 eruption, but no sign of further activity (figure 31). By August 2019, many features from the 2015 eruption were still clearly visible from the crater rim (figure 32).
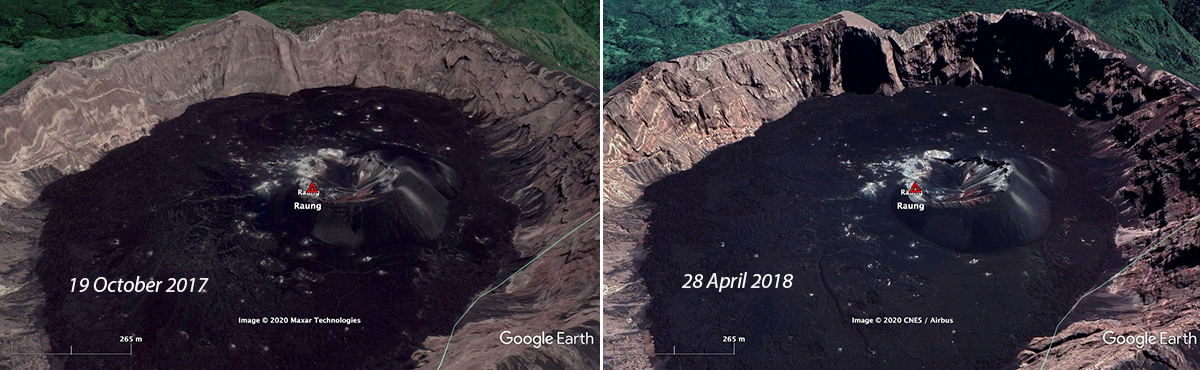 |
Figure 31. Little change can be seen at the summit of Raung in Google Earth images dated 19 October 2017 (left) and 28 April 2018 (right). The summit crater was full of black lava flows from the 2015 eruption. Courtesy of Google Earth. |
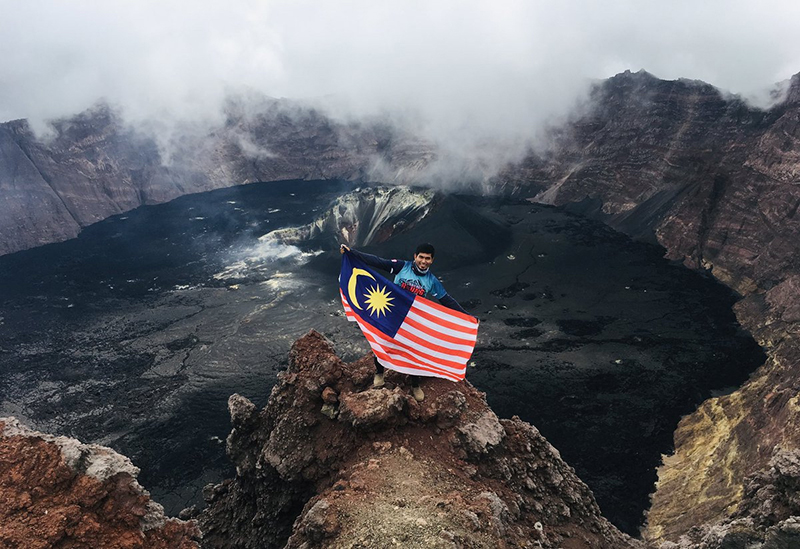 |
Figure 32. A Malaysian hiker celebrated his climbing to the summit of Raung on 30 August 2019. Weak fumarolic activity was visible from the base of the breached crater of the cone near the center of the summit crater, and many features of the lava flow that filled the crater in 2015 were still well preserved. Courtesy of MJ. |
PVMBG reported that the number and type of seismic events around the summit of Raung increased beginning on 13 July 2020, and on 16 July the height of the emissions from the crater rose to 100 m and the emission color changed from white to brown. About three hours later the emissions changed to gray and white. The webcams captured emissions rising 50-200 m above the summit that included 60 explosions of gray and reddish ash plumes (figure 33). The Raung Volcano Observatory released a VONA reporting an explosion with an ash plume that drifted N at 1353 local time (0653 UTC). The best estimate of the ash cloud height was 3,432 m based on ground observation. They raised the Aviation Color Code from unassigned to Orange. About 90 minutes later they reported a second seismic event and ash cloud that rose to 3,532 m, again based on ground observation. The Darwin VAAC reported that neither ash plume was visible in satellite imagery. The following day, on 17 July, PVMBG reported 26 explosions between midnight and 0600 that produced brown ash plumes which rose 200 m above the crater. Based on these events, PVMBG raised the Alert Level of Raung from I (Normal) to II (Alert) on a I-II-III-IV scale. By the following day they reported 95 explosive seismic events had occurred. They continued to observe gray ash plumes rising 100-200 m above the summit on clear days and 10-30 daily explosive seismic events through the end of July; plume heights dropped to 50-100 m and the number of explosive events dropped below ten per day during the last few days of the month.
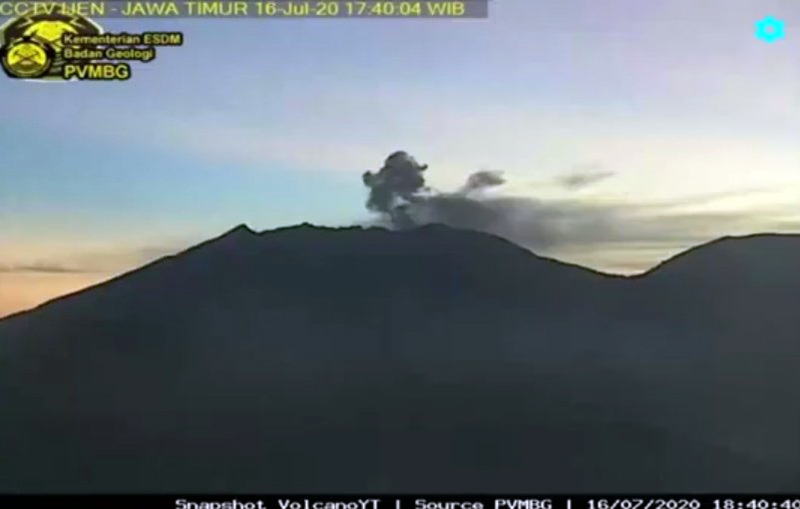 |
Figure 33. An ash plume rose from the summit of Raung on 16 July 2020 at the beginning of a new eruption. The last previous eruption was in 2015. Courtesy of Volcano Discovery and PVMBG. |
After a long period of no activity, MIROVA data showed an abrupt return to thermal activity on 16 July 2020; a strong pulse of heat lasted into early August before diminishing (figure 34). MODVOLC thermal alert data recorded two alerts each on 18 and 20 July, and one each on 21 and 30 July. Satellite images showed no evidence of thermal activity inside the summit crater from September 2015 through early July 2020. Sentinel-2 satellite imagery first indicated a strong thermal anomaly inside the pyroclastic cone within the crater on 19 July 2020; it remained on 24 and 29 July (figure 35). A small SO2 signature was measured by the TROPOMI instrument on the Sentinel-5P satellite on 25 July.
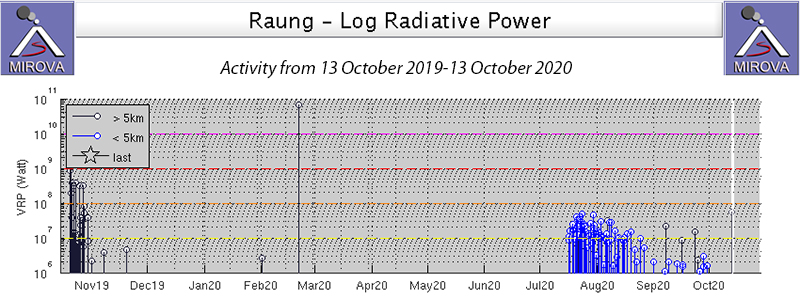 |
Figure 34. MIROVA thermal anomaly data indicated renewed activity on 16 July 2020 at Raung as seen in this graph of activity from 13 October 2019 through September 2020. Satellite images indicated that the dark lines at the beginning of the graph are from a large area of fires that burned on the flank of Raung in October 2019. Heat flow remained high through July and began to diminish in mid-August 2020. Courtesy of MIROVA. |
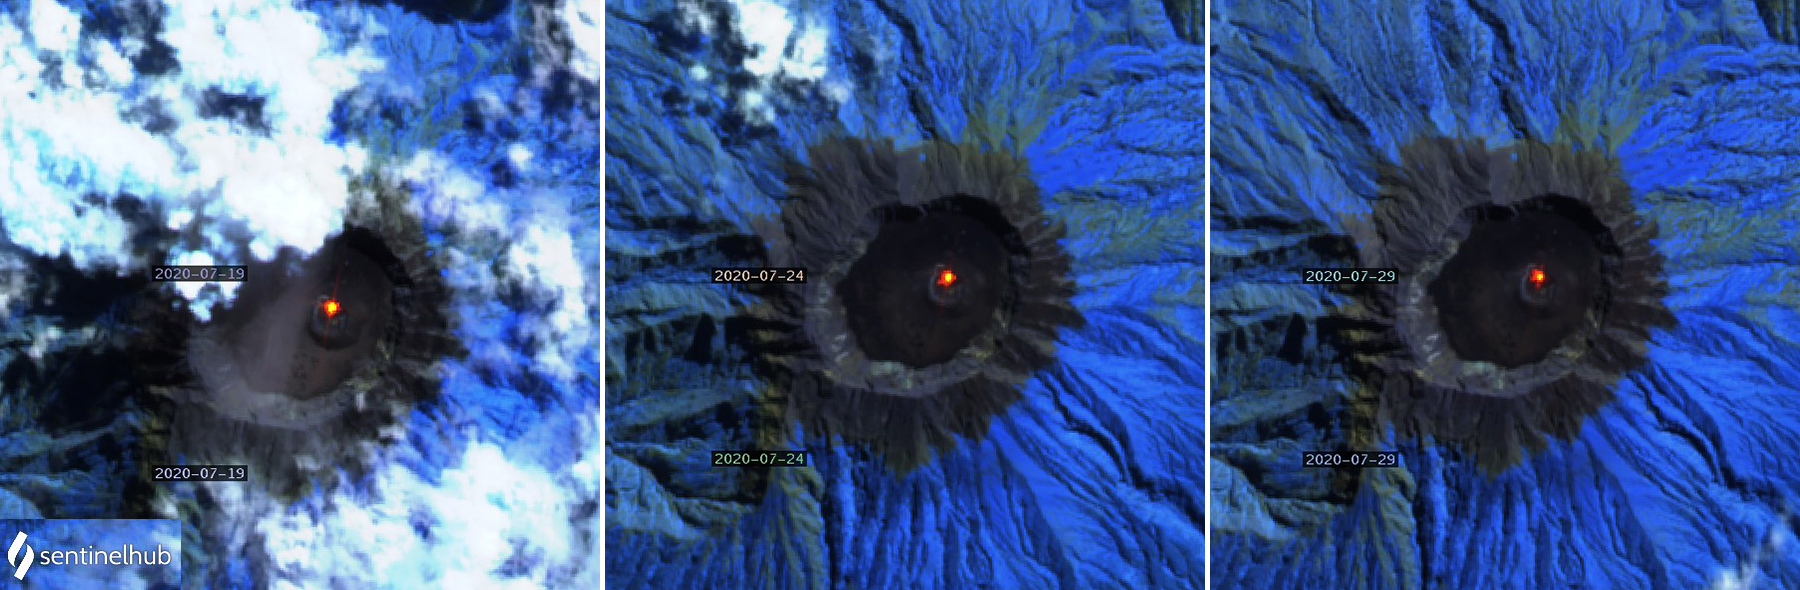 |
Figure 35. Thermal anomalies were distinct inside the crater of the pyroclastic cone within the summit crater of Raung on 19, 24, and 29 July 2020. Data is from the Sentinel-2 satellite shown with Atmospheric penetration rendering (bands 12, 11, 8A). Courtesy of Sentinel Hub Playground. |
After an explosion on 1 August 2020 emissions from the crater were not observed again until steam plumes were seen rising 100 m on 7 August. They were reported rising 100-200 m above the summit intermittently until a dense gray ash plume was reported by PVMBG on 11 August rising 200 m. After that, diffuse steam plumes no more than 100 m high were reported for the rest of the month except for white to brown emissions to 100 m on 21 August. Thermal anomalies of a similar brightness to July from the same point within the summit crater were recorded in satellite imagery on 3, 8, 13, 18, and 23 August. Single MODVOLC thermal alerts were reported on 1, 8, 12, and 19 August.
In early September dense steam plumes rose 200 m above the crater a few times but were mostly 50 m high or less. White and gray emissions rose 50-300 m above the summit on 15, 20, 27, and 30 September. Thermal anomalies were still present in the same spot in Sentinel-2 satellite imagery on 2, 7, 12, 17, and 27 September, although the signal was weaker than during July and August (figure 36). PVMBG reported gray emissions rising 100-300 m above the summit on 1 October 2020 and two seismic explosion events. Gray emissions rose 50-200 m the next day and nine explosions were recorded. On 3 October, emissions were still gray but only rose 50 m above the crater and no explosions were reported. No emissions were observed from the summit crater for the remainder of the month. Sentinel-2 satellite imagery showed a hot spot within the summit crater on 2 and 7 October, but clear views of the crater on 12, 17, and 22 October showed no heat source within the crater (figure 37).
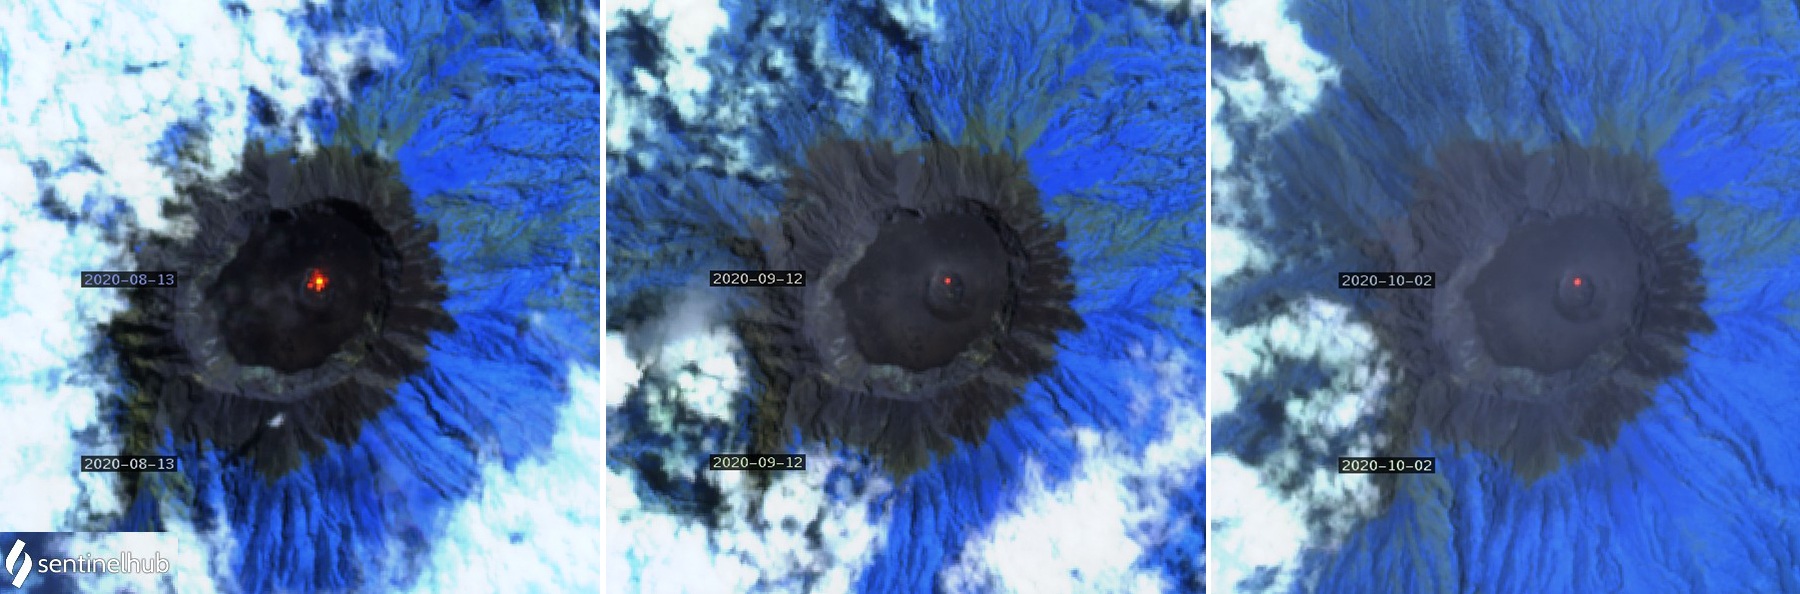 |
Figure 36. The thermal anomaly at Raung recorded in Sentinel-2 satellite data decreased in intensity between August and October 2020. It was relatively strong on 13 August (left) but had decreased significantly by 12 September (middle) and remained at a lower level into early October (right). Data shown with Atmospheric penetration rendering (bands 12, 11, 8A). Courtesy of Sentinel Hub Playground |
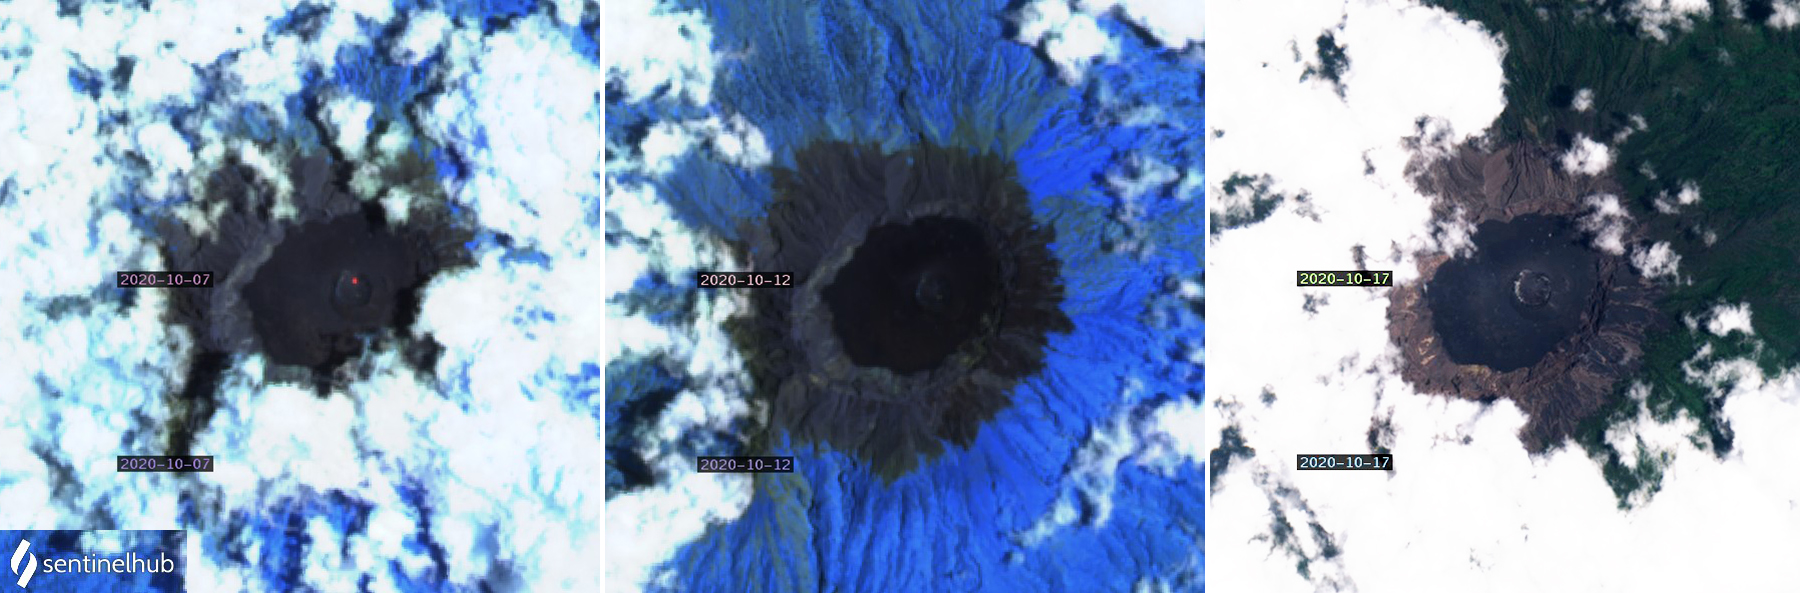 |
Figure 37. A small but distinct thermal anomaly was still present within the pyroclastic cone inside the summit crater of Raung on 7 October 2020 (left) but was gone by 12 October (middle) and did not reappear in subsequent clear views of the crater through the end of October. Satellite imagery of 7 and 12 October processed with Atmospheric penetration rendering (bands 12, 11, 8A). Natural color rendering (bands 4, 3, 2) from 17 October (right) shows no clear physical changes to the summit crater during the latest eruption. Courtesy of Sentinel Hub Playground. |
Information Contacts: Pusat Vulkanologi dan Mitigasi Bencana Geologi (PVMBG, also known as Indonesian Center for Volcanology and Geological Hazard Mitigation, CVGHM), Jalan Diponegoro 57, Bandung 40122, Indonesia (URL: http://www.vsi.esdm.go.id/); Hawai'i Institute of Geophysics and Planetology (HIGP) - MODVOLC Thermal Alerts System, School of Ocean and Earth Science and Technology (SOEST), Univ. of Hawai'i, 2525 Correa Road, Honolulu, HI 96822, USA (URL: http://modis.higp.hawaii.edu/); Darwin Volcanic Ash Advisory Centre (VAAC), Bureau of Meteorology, Northern Territory Regional Office, PO Box 40050, Casuarina, NT 0811, Australia (URL: http://www.bom.gov.au/info/vaac/); MIROVA (Middle InfraRed Observation of Volcanic Activity), a collaborative project between the Universities of Turin and Florence (Italy) supported by the Centre for Volcanic Risk of the Italian Civil Protection Department (URL: http://www.mirovaweb.it/); Global Sulfur Dioxide Monitoring Page, Atmospheric Chemistry and Dynamics Laboratory, NASA Goddard Space Flight Center (NASA/GSFC), 8800 Greenbelt Road, Goddard, Maryland, USA (URL: https://so2.gsfc.nasa.gov/); Google Earth (URL: https://www.google.com/earth/); Sentinel Hub Playground (URL: https://www.sentinel-hub.com/explore/sentinel-playground); Tom Pfeiffer, Volcano Discovery (URL: http://www.volcanodiscovery.com/); MJ (URL: https://twitter.com/MieJamaludin/status/1167613617191043072).
Renewed thermal and explosive activity from late January into May 2021
A massive stratovolcano in easternmost Java, Raung has over sixty recorded eruptions dating back to the late 16th Century. Explosions with ash plumes, Strombolian activity, and lava flows from a cinder cone within the 2-km-wide summit crater have been common. Pusat Vulkanologi dan Mitigasi Bencana Geologi (PVMBG, also known as the Indonesian Center for Volcanology and Geological Hazard Mitigation, CVGHM) has installed webcams to monitor activity in recent years. An eruption from late 2014 through August 2015 produced a large volume of lava within the summit crater and formed a new pyroclastic cone in the same location as the previous one. A smaller eruption during July-October 2020 was followed by explosions, ash emissions, and thermal anomalies during January-May 2021 which are covered in this report with information provided by PVMBG, the Darwin Volcanic Ash Advisory Center (VAAC), and several sources of satellite data.
The Alert Level at Raung was lowered from II to I on 27 November 2020 after the last reported activity in early October. Only occasional steam plumes were observed after that time until brown and gray emissions from the summit appeared on 21 January 2021; this led PVMBG to raise the Alert Level back to II. Daily seismicity and ash emissions increased in intensity and frequency with the strongest explosive activity reported during 7-12 February. Ash emissions continued daily throughout February and March but decreased gradually in plume height and ash content. A faint thermal anomaly appeared in satellite imagery inside the pyroclastic cone of the summit crater on 16 March, and similar anomalies were visible multiple times during April and early May. Intermittent ash emissions continued for the first half of April; only steam was observed after minor ash was detected on 14 April. The last thermal anomaly was observed on 15 May 2021. The MIROVA graph of Log Radiative Power for the year ending on 28 June 2021 clearly shows the July-October 2020 event followed by the latest activity that started in late January 2021, peaked in early February, and continued at lower thermal energy levels during March-May (figure 38).
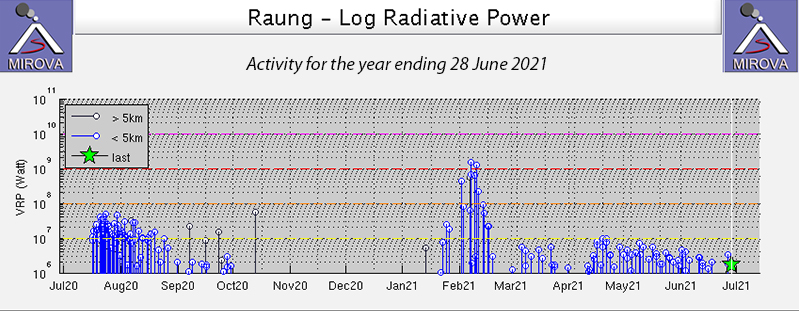 |
Figure 38. The MIROVA graph of thermal energy at Raung for the year ending on 28 June 2021 clearly shows both the late July-October 2020 and the late January-May 2021 activity. The strongest explosive and thermal activity for the latest eruption occurred in early February. Courtesy of MIROVA. |
After the last observations of ash in the summit emissions on 3 October 2020 and a weak thermal anomaly on the 7th (BGVN 45:12), no emissions were reported for the rest of October and November and seismicity decreased significantly. As a result, on 27 November PVMBG lowered the Alert Level from II to I (Normal). No activity was reported during December 2020, although satellite imagery on 21 December indicated substantial steam emissions from the summit crater. No further activity was reported until 21 January 2021 when harmonic tremors were detected along with gray and brown emissions seen rising 100-400 m above the crater. The Alert Level was raised back to II. Gray ash plumes 200-600 m high were reported daily through the remainder of January (figure 39), along with several hundred non-harmonic tremors each day. VONAs were issued daily from 21-24 and on 27 January, with continuous ash emissions reported rising to 3.4-3.9 km altitude and drifting E and SE. The Darwin VAAC reported that most of the emissions were not visible in satellite imagery, and their reports were based on ground observations from PVMBG, VONAs, or Pilot Reports.
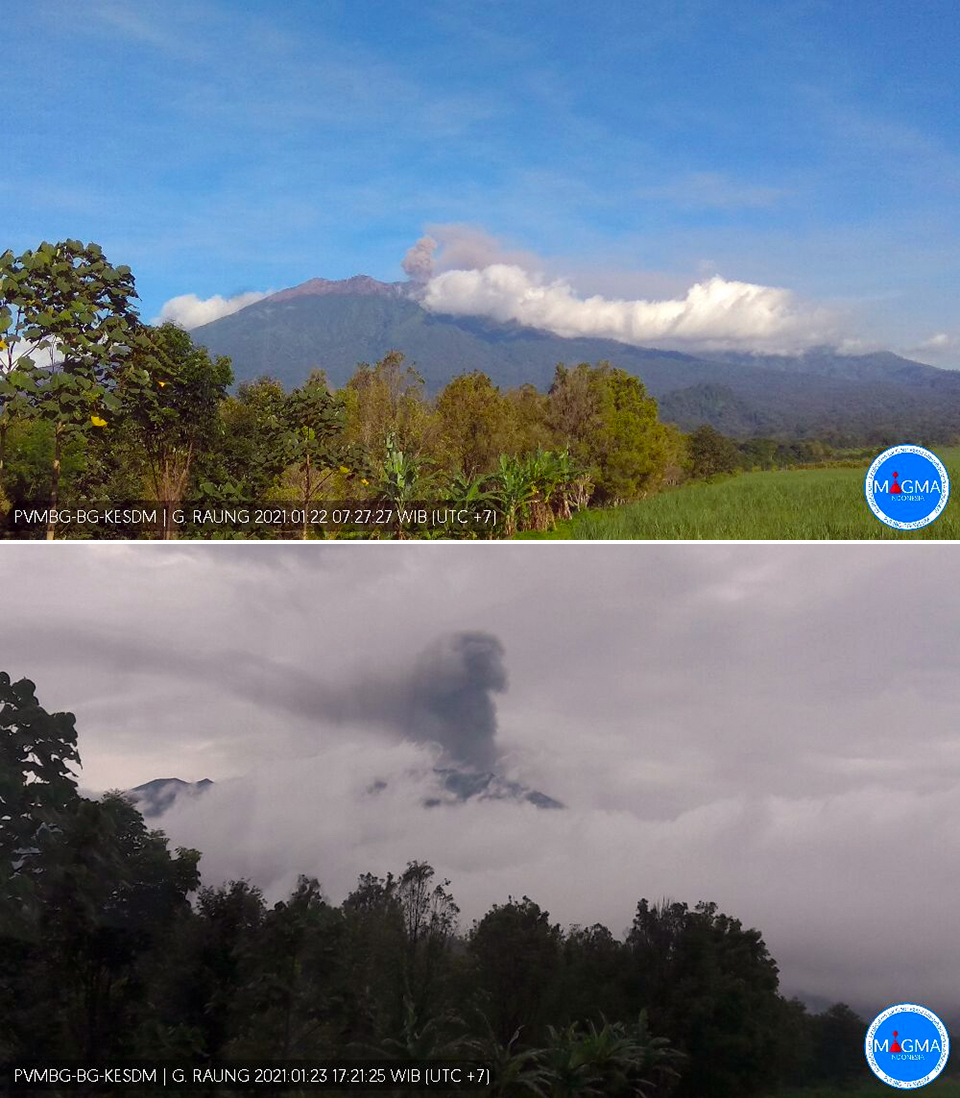 |
Figure 39. Ash emissions at Raung began on 21 January 2021 after a three month break and were reported daily through 24 January including on 22 and 23 January 2021, shown here. Courtesy of PVMBG and MAGMA. |
Activity intensified significantly at the beginning of February 2021. PVMBG reported dense gray ash emissions rising 500 m above the summit on 1 February. Ash emissions increased to 1,000 m high the next day and continued daily through 5 February. The Darwin VAAC reported continuous ash emissions rising to 3.9-4.3 km altitude (600-1,000 m above the summit) and drifting NE and E during 1-3 and 6-7 February. On 6 and 7 February loud noises and incandescence were reported and on 7 February gray and black ash emissions rose 1,200 m above the summit and drifted ESE producing ashfall at the Raung Observatory in Sragi Village (25 km SE). Multiple pilot reports to the Darwin VAAC indicated ash emissions moving E at 4.9-7 km altitude throughout the day. The next day gray and black plumes rose 2,000 m above the crater and ashfall was again reported at the Raung Observatory from the ESE drifting plume.
The plumes on 9 February were 2,500 m above the summit drifting ESE and accompanied by loud noises. Sentinel-2 satellite imagery recorded a significant thermal anomaly and a large ash plume on 9 February (figures 40 and 41); the plume drifted more than 100 km ESE and was visible beyond the E coast of Java. During 10-12 February gray and black ash plumes rose 2,000 m above the crater each day. Continuous emissions rising to 5.5 km altitude (2,200 m above the summit) were reported in multiple VONA’s first on 8 February and continuing daily through 13 February. By 14 February a ring-shaped thermal anomaly was still visible inside the summit crater (figure 42). For the remainder of the month, plume height diminished to 300-1,000 m above the summit with occasional pulses that rose to 1,200 m. The Darwin VAAC reported daily ash emissions that rose to 4.3-4.9 km altitude and drifted N and E through 20 February. From 22-27 February daily emissions were noted at 3.9-4.3 km altitude drifting NE, E, and S.
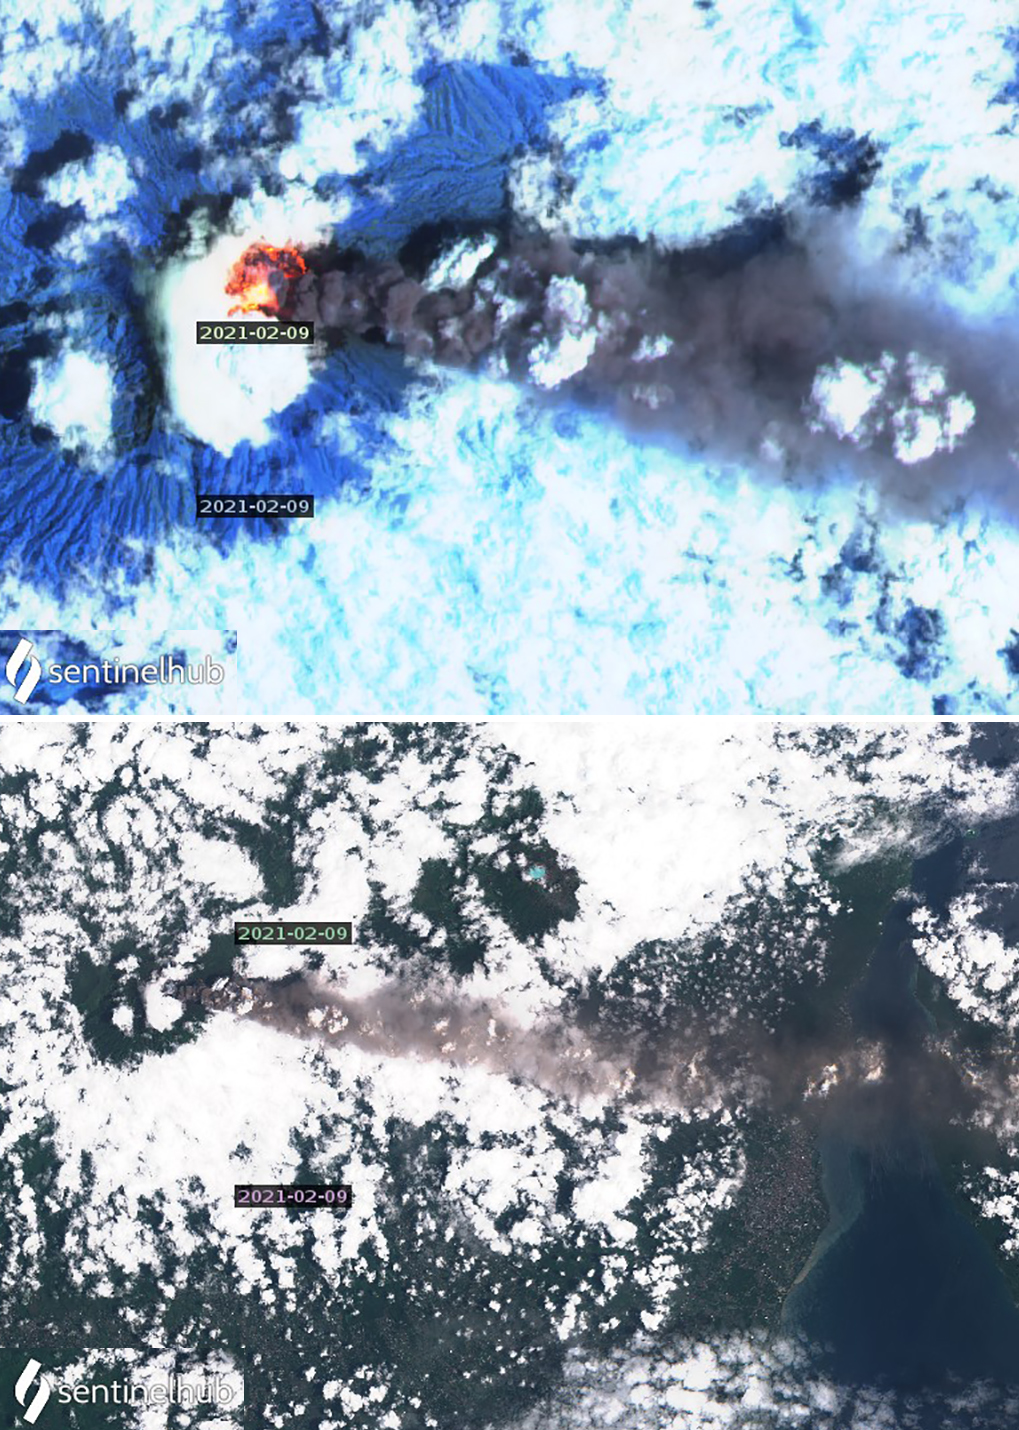 |
Figure 40. A major explosion at Raung on 9 February 2021 was captured in Sentinel-2 satellite imagery. It produced ash emissions that rose to 5.5 km altitude and a dense black ash plume that drifted over one hundred km ESE. A large thermal anomaly filled the summit crater. Top image uses Atmospheric penetration rendering (bands 12, 11, 8a) and bottom image uses Natural color rendering (bands 4,3,2). Courtesy of Sentinel Hub Playground. |
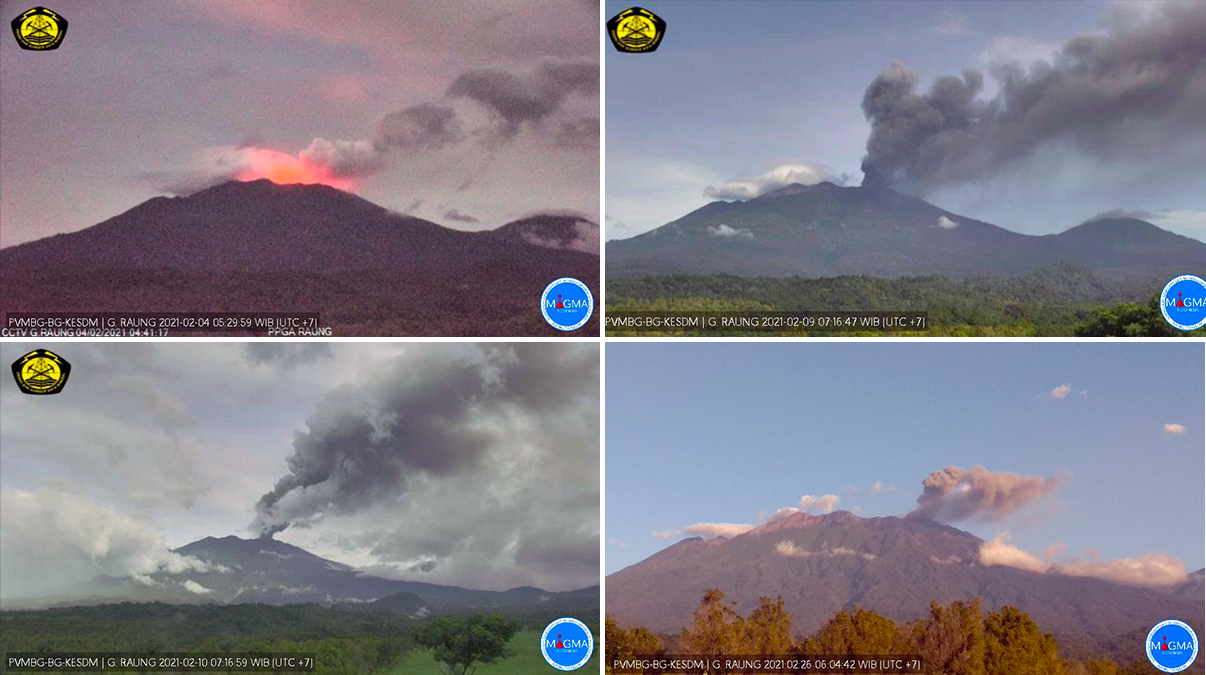 |
Figure 41. Incandescence seen above the Raung summit crater and dense black and gray ash plumes occurred frequently during February 2021 including on 4, 9, 10, and 26 February. Courtesy of PVMBG and MAGMA. |
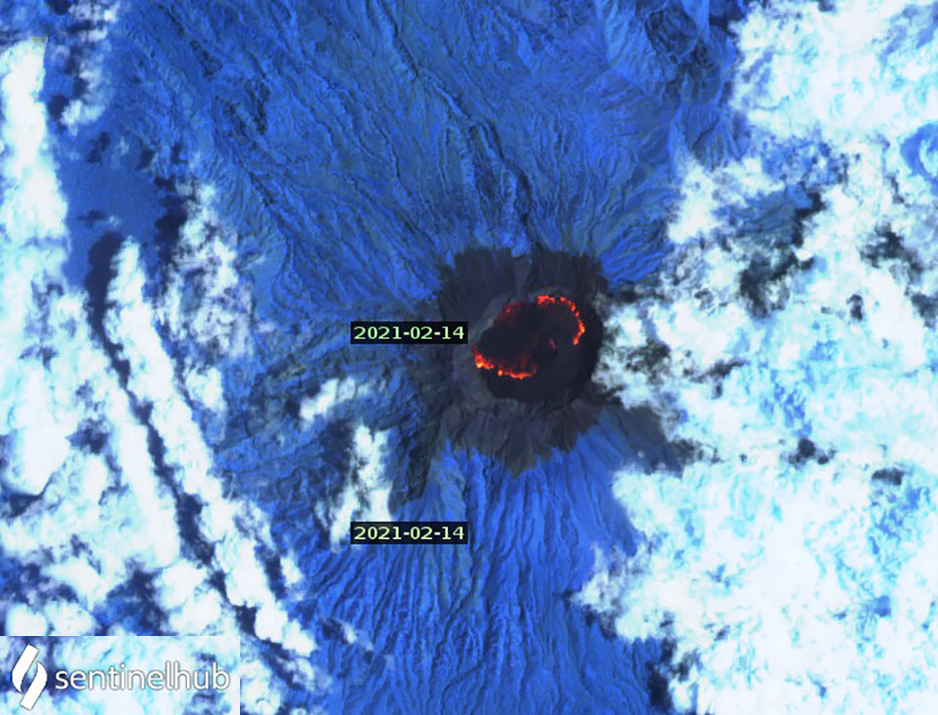 |
Figure 42. A thermal anomaly ringed the inside of the summit crater at Raung on 14 February. Sentinel-2 image uses Atmospheric penetration rendering (bands 12, 11, 8a). Courtesy of Sentinel Hub Playground. |
Continuous tremor appeared on 1 February and increased significantly in amplitude from 1 to 5 mm. They rose the next day to 14 mm amplitude and remained at 13-16 m amplitude through 6 February. They dropped to 7 mm amplitude after that until 12 February and then returned to 1 mm amplitude for the remainder of the month. A small SO2 anomaly was recorded in satellite data on 1 February and a significant plume of gas appeared on 7 February that continued daily through 12 February (figure 43).
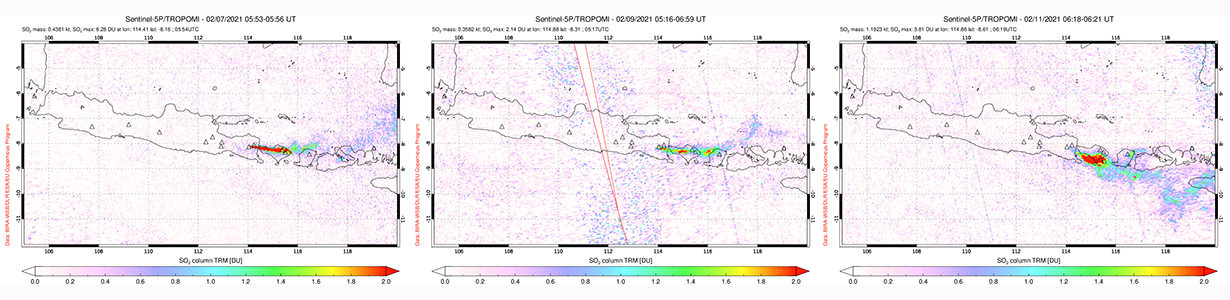 |
Figure 43. A significant SO2 anomaly from Raung was captured by the TROPOMI instrument on the Sentinel 5P satellite on 7 February and continued daily through 12 February 2021. Courtesy of NASA Global Sulfur Dioxide Monitoring Page. |
Steam and ash emissions in March 2021 were reported daily by PVMBG. During 1-3 March the gray plumes rose 200-600 m above the crater, then from 4 to 9 March they contained moderate to heavy ash content and rose 300-1,000 m above the crater. The Darwin VAAC reported ash emissions drifting E and NE at 3.9-4.3 km altitude during 3-10 March. Plume height varied from 500-1,200 m above the crater during 10-21 March with up to moderate ash density. On 13 March the ash plume was clearly discernable in satellite imagery drifting W at 4.3 km altitude (figure 44). On 22 March the ash plume rose to 900 m and small quantities of ash were reported at the Raung Observatory in Sragi. From 23 March through the end of the month gray ash plumes were reported at 50-1,200 m high with generally low to moderate ash density. VAAC reports issued during 23-27 March reported plumes at 3.7-4.6 km altitude drifting ESE, W, and NW (figure 45). They were clearly seen in visible satellite imagery on 26 March drifting NW at 3.7 km altitude. A single faint thermal anomaly was discernable in Sentinel-2 satellite imagery from the center of the pyroclastic cone inside the summit crater on 16 March.
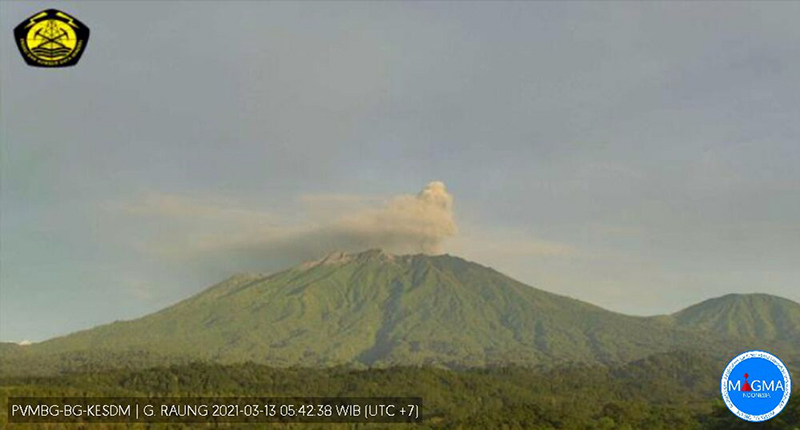 |
Figure 44. An ash plume at Raung on 13 March 2021 rose several hundred meters above the volcano and was clearly discernible in satellite images by the Darwin VAAC. Courtesy of PVMBG and MAGMA. |
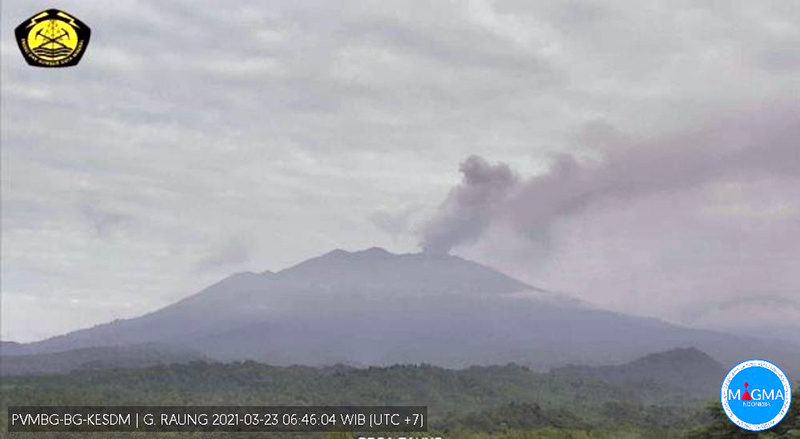 |
Figure 45. An ash plume from Raung on 23 March 2021 drifted ESE several hundred meters above the summit. Ash emissions from Raung during 23-27 March rose to 3.7-4.6 km altitude and drifted ESE, W, and NW. Courtesy of PVMBG and MAGMA. |
Emissions from Raung contained ash during the first half of April 2021. The plumes were gray or white and gray and rose 50-600 m above the summit (figure 46). The Darwin VAAC reported a minor ash plume that rose to 2.4 km altitude and drifted N on 12 April. A report by PVMBG of gray plumes rising 50-400 m high on 14 April was the last indication of ash emissions for the month. For the remainder of the month only steam plumes were seen, rising 75-500 m above the summit. A webcam image taken after dark on 17 April showed incandescence at the summit crater. Two clear satellite images on 20 and 30 April revealed small thermal anomalies inside the pyroclastic cone in the summit crater (figure 47). A small SO2 plume was detected by satellite instruments on 29 April.
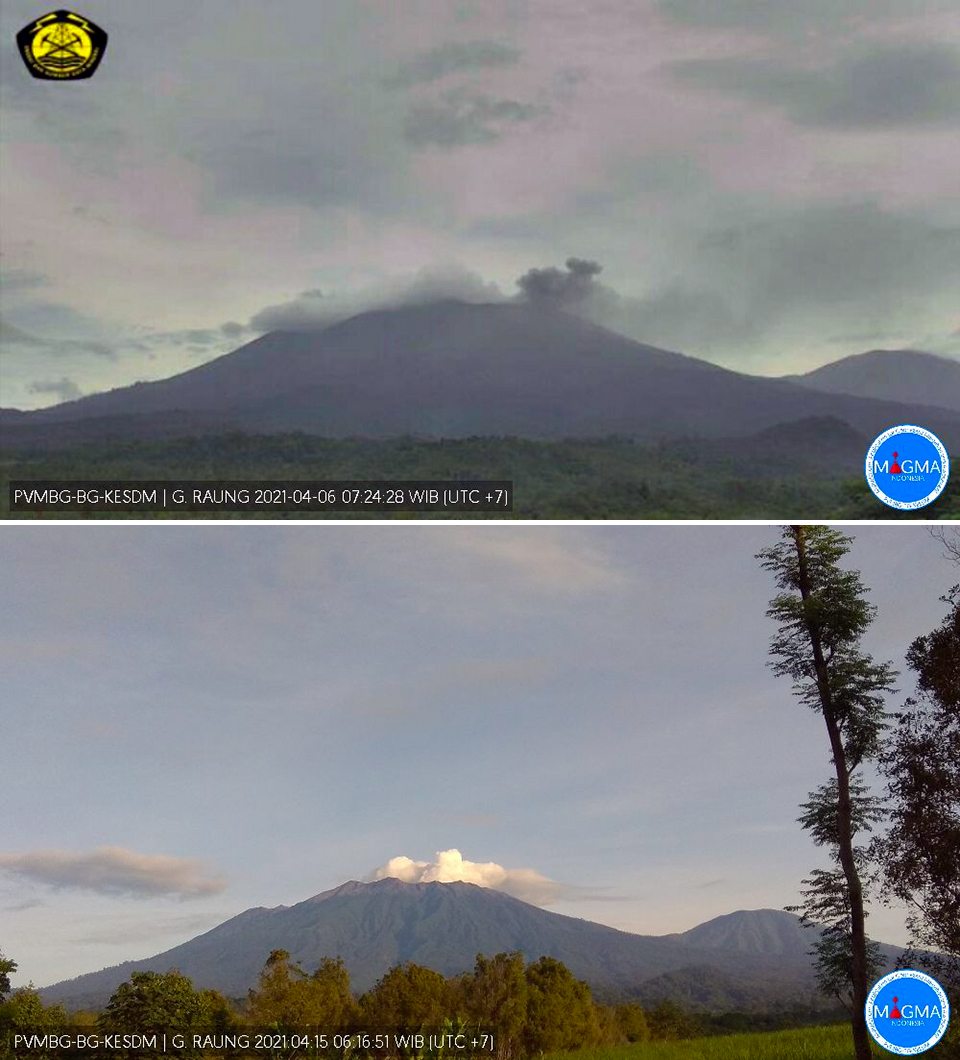 |
Figure 46. Ash emissions were weak during the first half of April 2021 at Raung as seen on 6 April 2021 (top) and only steam plumes were recorded from 15 April onward (bottom). Courtesy of PVMBG and MAGMA. |
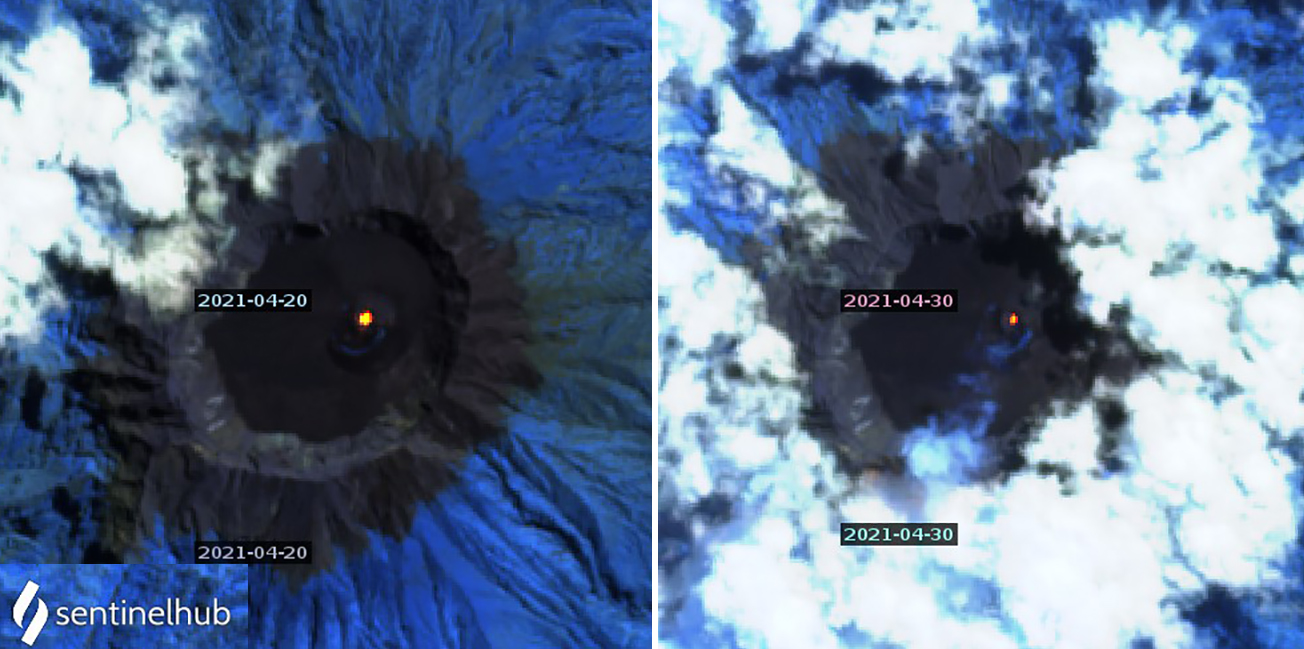 |
Figure 47. Small thermal anomalies were visible inside the pyroclastic cone in the summit crater of Raung on 20 and 30 April 2021. Sentinel-2 images use Atmospheric penetration rendering (bands 12, 11, 8a). Courtesy of Sentinel Hub Playground. |
For most of May 2021 cloudy skies obscured views of the volcano. Occasionally white steam plumes were observed rising up to 400 m above the summit. On 5, 10, and 15 May weak thermal anomalies located inside the pyroclastic cone in the summit crater appeared in satellite images. Distinct SO2 anomalies appeared more frequently during May than any other month of the reporting period except February (figure 48). During June 2021, no thermal anomalies were present in the five satellite images with clear views of the summit. The summit was cloudy in about half of the webcam images taken during June; when visible, white steam plumes were noted that rose generally 50-200 m except on 22 June when they rose 100-400 m high.
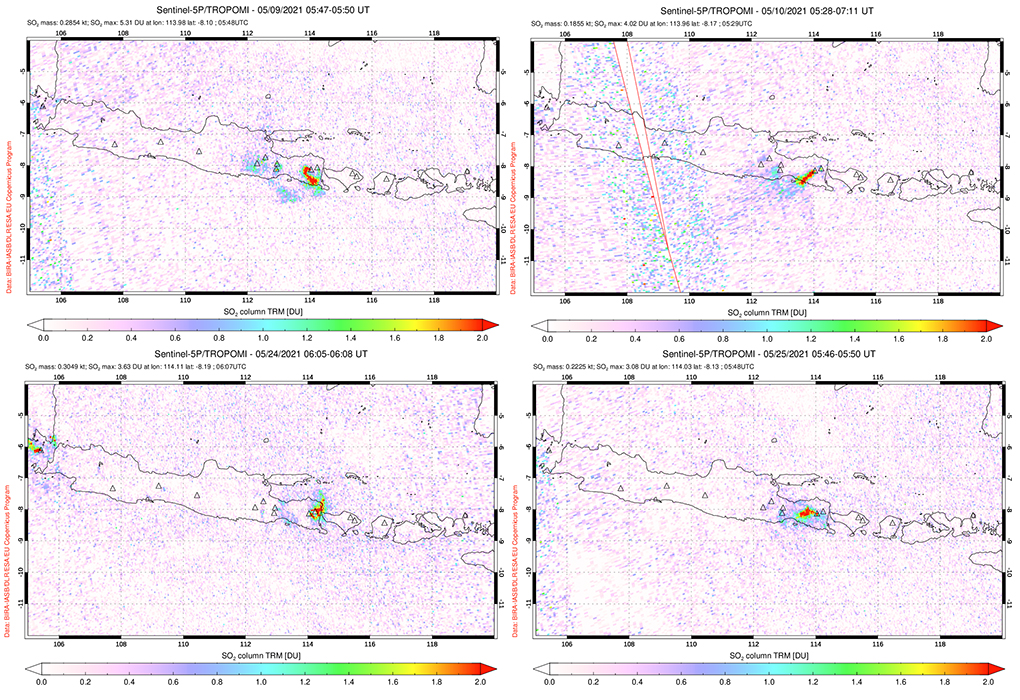 |
Figure 48. Distinct SO2 plumes drifted in multiple directions from Raung on several days during May 2021 including on 9, 10, 24, and 25 May. Courtesy of NASA Global Sulfur Dioxide Monitoring Page. |
Information Contacts: Pusat Vulkanologi dan Mitigasi Bencana Geologi (PVMBG, also known as Indonesian Center for Volcanology and Geological Hazard Mitigation, CVGHM), Jalan Diponegoro 57, Bandung 40122, Indonesia (URL: http://www.vsi.esdm.go.id/); MAGMA Indonesia, Kementerian Energi dan Sumber Daya Mineral (URL: https://magma.esdm.go.id/v1); MIROVA (Middle InfraRed Observation of Volcanic Activity), a collaborative project between the Universities of Turin and Florence (Italy) supported by the Centre for Volcanic Risk of the Italian Civil Protection Department (URL: http://www.mirovaweb.it/); NASA Global Sulfur Dioxide Monitoring Page, Atmospheric Chemistry and Dynamics Laboratory, NASA Goddard Space Flight Center (NASA/GSFC), 8800 Greenbelt Road, Goddard, Maryland, USA (URL: https://so2.gsfc.nasa.gov/); Sentinel Hub Playground (URL: https://www.sentinel-hub.com/explore/sentinel-playground).
Ash plume in July 2022 and intermittent thermal activity
Raung, located in easternmost Java, Indonesia, was constructed SW of the Ijen caldera rim. The summit is truncated by a steep-walled, 2-km-wide caldera that has been the site of frequent eruptions in the past. Over 60 eruptions have been recorded since the late 16th century, consisting of explosions with ash plumes, Strombolian activity, and lava flows. The most recent eruption ended during April 2021 and was characterized by thermal and explosive activity, ash plumes, and sulfur dioxide plumes (BGVN 46:07). This report describes a new eruption during July that consisted of an ash plume and intermittent thermal anomalies that occurred through September 2022, based on reports from Pusat Vulkanologi dan Mitigasi Bencana Geologi (PVMBG, also known as the Indonesian Center for Volcanology and Geological Hazard Mitigation, CVGHM) and various satellite data.
Activity at Raung has been relatively low since the January-April 2021 eruption, but has included occasional sulfur dioxide emissions between June 2021 and early July 2022, detected by the TROPOMI instrument on the Sentinel-5P satellite (figure 49). The emissions during 4 and 5 July 2022 formed more distinctive and stronger plumes. According to the MIROVA graph, there was a cluster of strong thermal anomalies detected during early January 2021, during March-May 2021, and May-September 2022; a period of no thermal activity followed the early January 2021 activity during November 2021-April 2022 (figure 50). Thermal activity resumed in May, which gradually increased in power in early June, and then began to decline in late June. This activity was also observed in Sentinel-2 infrared satellite imagery at the summit crater on 15 and 30 May, 9, 14, 19, 24, and 29 June, and 9, 19, and 24 July (figure 51).
|
Figure 49. Intermittent sulfur dioxide emissions were captured rising from Raung on 29 June 2021 (top left), 5 October 2021 (top right), 17 May 2022 (middle left), and 2 June 2022 (middle right) by the TROPOMI instrument on the Sentinel-5P satellite. Each of the plumes shown here exceed 2 DUs (Dobson Units) and drift in different directions. Stronger defined sulfur dioxide plumes were detected on 4 and 5 July 2022 (bottom left and right, respectively), and drifted SE and NE. Emissions originating further W are from Semeru. Courtesy of NASA Global Sulfur Dioxide Monitoring Page. |
|
Figure 50. Moderate to strong clusters of thermal anomalies (red dots) were detected in the summit area of Raung during early January 2021, March-May 2021, and May-September 2022 as recorded by the Sentinel-2 MODIS Thermal Volcanic Activity data (bands 12, 11, 8A). There was a break in thermal activity were also shown during November 2021-early April 2022. Courtesy of MIROVA. |
|
Figure 51. Sentinel-2 satellite imagery showed intermittent thermal anomalies in the summit crater of Raung on 30 May 2022 (top left), 19 June 2022 (top right), 29 June 2022 (bottom left), and 9 July 2022 (bottom right). Images use “atmospheric penetration” rendering (bands 12, 11, 8a). Courtesy of Sentinel Hub Playground. |
According to PVMBG, a short-lived eruption occurred at 1719 on 27 July 2022, which produced a gray ash plume that rose 1-1.5 km above the summit and drifted W and NW. A thermal anomaly was observed on 28 July in satellite images, and data from the GPS network indicated inflation. Continuous tremor events were reported during 29 July. As a result of these events, the Volcano Alert Level (VAL) was raised to 2 (on a scale of 1-4) that same day.
Information Contacts: Pusat Vulkanologi dan Mitigasi Bencana Geologi (PVMBG, also known as Indonesian Center for Volcanology and Geological Hazard Mitigation, CVGHM), Jalan Diponegoro 57, Bandung 40122, Indonesia (URL: http://www.vsi.esdm.go.id/); MAGMA Indonesia, Kementerian Energi dan Sumber Daya Mineral (URL: https://magma.esdm.go.id/v1); MIROVA (Middle InfraRed Observation of Volcanic Activity), a collaborative project between the Universities of Turin and Florence (Italy) supported by the Centre for Volcanic Risk of the Italian Civil Protection Department (URL: http://www.mirovaweb.it/); NASA Global Sulfur Dioxide Monitoring Page, Atmospheric Chemistry and Dynamics Laboratory, NASA Goddard Space Flight Center (NASA/GSFC), 8800 Greenbelt Road, Goddard, Maryland, USA (URL: https://so2.gsfc.nasa.gov/); Sentinel Hub Playground (URL: https://www.sentinel-hub.com/explore/sentinel-playground).
|
|
||||||||||||||||||||||||||
There is data available for 70 confirmed eruptive periods.
2025 Mar 13 - 2025 Jul 11 Confirmed Eruption (Explosive / Effusive)
| Episode 1 | Eruption (Explosive / Effusive) | ||||
|---|---|---|---|---|
| 2025 Mar 13 - 2025 Jul 11 | Evidence from Observations: Reported | |||
2024 Dec 15 - 2024 Dec 24 Confirmed Eruption (Explosive / Effusive) VEI: 2
| Episode 1 | Eruption (Explosive / Effusive) | |||||||||||||||||||
|---|---|---|---|---|---|---|---|---|---|---|---|---|---|---|---|---|---|---|---|
| 2024 Dec 15 - 2024 Dec 24 | Evidence from Observations: Reported | ||||||||||||||||||
|
List of 2 Events for Episode 1
|
|||||||||||||||||||
2022 May 14 - 2022 Sep 27 Confirmed Eruption (Explosive / Effusive) VEI: 2
| Episode 1 | Eruption (Explosive / Effusive) | ||||||||||||||||||||||||
|---|---|---|---|---|---|---|---|---|---|---|---|---|---|---|---|---|---|---|---|---|---|---|---|---|
| 2022 May 14 - 2022 Sep 27 | Evidence from Observations: Satellite (infrared) | |||||||||||||||||||||||
|
List of 3 Events for Episode 1
|
||||||||||||||||||||||||
2021 Jan 21 - 2021 Apr 14 Confirmed Eruption (Explosive / Effusive) VEI: 2
| Episode 1 | Eruption (Explosive / Effusive) | ||||||||||||||||||||||||||||||||||
|---|---|---|---|---|---|---|---|---|---|---|---|---|---|---|---|---|---|---|---|---|---|---|---|---|---|---|---|---|---|---|---|---|---|---|
| 2021 Jan 21 - 2021 Apr 14 | Evidence from Observations: Reported | |||||||||||||||||||||||||||||||||
|
List of 5 Events for Episode 1
|
||||||||||||||||||||||||||||||||||
2020 Jul 16 - 2020 Oct 3 Confirmed Eruption (Explosive / Effusive) VEI: 1
| Episode 1 | Eruption (Explosive / Effusive) | ||||||||||||||
|---|---|---|---|---|---|---|---|---|---|---|---|---|---|---|
| 2020 Jul 16 - 2020 Oct 3 | Evidence from Observations: Reported | |||||||||||||
|
List of 1 Events for Episode 1
|
||||||||||||||
2014 Nov 23 ± 5 days - 2015 Aug 30 ± 8 days Confirmed Eruption (Explosive / Effusive) VEI: 2
| Episode 1 | Eruption (Explosive / Effusive) | Summit crater | ||||||||||||||||||||||||||||||||||||||||||||||||||||||||||||||||||||||||||||||||||||||||||||||||||||||||||||||||||||||||||||||||||||||||||||||||||||||||||||||||||||||||||||||||||||||||||||||||||||||||||||||||||||||||||||||||||||||||||||||||||||||||||||||||||||||||||||||||||||||||||||||||||||||||||||||||||||||||||||||||||||||||||||||||||||||||||||||||||||||||||||||||||||||||||||||||||||||||||||||||||||||||||||||||||||||||||||
|---|---|---|---|---|---|---|---|---|---|---|---|---|---|---|---|---|---|---|---|---|---|---|---|---|---|---|---|---|---|---|---|---|---|---|---|---|---|---|---|---|---|---|---|---|---|---|---|---|---|---|---|---|---|---|---|---|---|---|---|---|---|---|---|---|---|---|---|---|---|---|---|---|---|---|---|---|---|---|---|---|---|---|---|---|---|---|---|---|---|---|---|---|---|---|---|---|---|---|---|---|---|---|---|---|---|---|---|---|---|---|---|---|---|---|---|---|---|---|---|---|---|---|---|---|---|---|---|---|---|---|---|---|---|---|---|---|---|---|---|---|---|---|---|---|---|---|---|---|---|---|---|---|---|---|---|---|---|---|---|---|---|---|---|---|---|---|---|---|---|---|---|---|---|---|---|---|---|---|---|---|---|---|---|---|---|---|---|---|---|---|---|---|---|---|---|---|---|---|---|---|---|---|---|---|---|---|---|---|---|---|---|---|---|---|---|---|---|---|---|---|---|---|---|---|---|---|---|---|---|---|---|---|---|---|---|---|---|---|---|---|---|---|---|---|---|---|---|---|---|---|---|---|---|---|---|---|---|---|---|---|---|---|---|---|---|---|---|---|---|---|---|---|---|---|---|---|---|---|---|---|---|---|---|---|---|---|---|---|---|---|---|---|---|---|---|---|---|---|---|---|---|---|---|---|---|---|---|---|---|---|---|---|---|---|---|---|---|---|---|---|---|---|---|---|---|---|---|---|---|---|---|---|---|---|---|---|---|---|---|---|---|---|---|---|---|---|---|---|---|---|---|---|---|---|---|---|---|---|---|---|---|---|---|---|---|---|---|---|---|---|---|---|---|---|---|---|---|---|---|---|---|---|---|---|---|---|---|---|---|---|---|---|---|---|---|---|---|---|---|---|---|---|---|---|---|---|---|---|---|---|---|---|---|---|---|---|---|---|---|---|---|---|---|---|---|---|---|---|---|
| 2014 Nov 23 ± 5 days - 2015 Aug 30 ± 8 days | Evidence from Observations: Reported | ||||||||||||||||||||||||||||||||||||||||||||||||||||||||||||||||||||||||||||||||||||||||||||||||||||||||||||||||||||||||||||||||||||||||||||||||||||||||||||||||||||||||||||||||||||||||||||||||||||||||||||||||||||||||||||||||||||||||||||||||||||||||||||||||||||||||||||||||||||||||||||||||||||||||||||||||||||||||||||||||||||||||||||||||||||||||||||||||||||||||||||||||||||||||||||||||||||||||||||||||||||||||||||||||||||||||||||
|
List of 84 Events for Episode 1 at Summit crater
|
|||||||||||||||||||||||||||||||||||||||||||||||||||||||||||||||||||||||||||||||||||||||||||||||||||||||||||||||||||||||||||||||||||||||||||||||||||||||||||||||||||||||||||||||||||||||||||||||||||||||||||||||||||||||||||||||||||||||||||||||||||||||||||||||||||||||||||||||||||||||||||||||||||||||||||||||||||||||||||||||||||||||||||||||||||||||||||||||||||||||||||||||||||||||||||||||||||||||||||||||||||||||||||||||||||||||||||||
[ 2014 Jan 4 - 2014 Jan 4 ] Uncertain Eruption
| Episode 1 | Eruption (Explosive / Effusive) | |||||||||||||||||||
|---|---|---|---|---|---|---|---|---|---|---|---|---|---|---|---|---|---|---|---|
| 2014 Jan 4 - 2014 Jan 4 | Evidence from Observations: Reported | ||||||||||||||||||
|
List of 2 Events for Episode 1
|
|||||||||||||||||||
2013 Jun 29 - 2013 Jul 31 Confirmed Eruption (Explosive / Effusive) VEI: 1
| Episode 1 | Eruption (Explosive / Effusive) | Summit crater | |||||||||||||||||||||||||||||||||
|---|---|---|---|---|---|---|---|---|---|---|---|---|---|---|---|---|---|---|---|---|---|---|---|---|---|---|---|---|---|---|---|---|---|---|
| 2013 Jun 29 - 2013 Jul 31 | Evidence from Observations: Reported | |||||||||||||||||||||||||||||||||
|
List of 5 Events for Episode 1 at Summit crater
|
||||||||||||||||||||||||||||||||||
2012 Oct 16 ± 2 days - 2013 Jan 6 Confirmed Eruption (Explosive / Effusive) VEI: 1
| Episode 1 | Eruption (Explosive / Effusive) | Summit crater | ||||||||||||||||||||||||||||||||||||||||||||||||||||||||||||||||||||||||||||||
|---|---|---|---|---|---|---|---|---|---|---|---|---|---|---|---|---|---|---|---|---|---|---|---|---|---|---|---|---|---|---|---|---|---|---|---|---|---|---|---|---|---|---|---|---|---|---|---|---|---|---|---|---|---|---|---|---|---|---|---|---|---|---|---|---|---|---|---|---|---|---|---|---|---|---|---|---|---|---|---|
| 2012 Oct 16 ± 2 days - 2013 Jan 6 | Evidence from Observations: Reported | ||||||||||||||||||||||||||||||||||||||||||||||||||||||||||||||||||||||||||||||
| Multiple MODVOLC thermal alerts began on 14 October and were frequent through 8 November 2012. Incandescent ejecta was observed within the summit crater on 17 October and 5 November. An ash plume, incandescence, and loud noises were reported on 6 January 2013. A comparison of March 2011 and 29 July 2013 satellite images reveals tephra filling the summit crater in 2013 where it was empty in 2011; eruptive activity that caused this could have happened during October 2012-January 2013 or June-July 2013. | |||||||||||||||||||||||||||||||||||||||||||||||||||||||||||||||||||||||||||||||
|
List of 14 Events for Episode 1 at Summit crater
|
|||||||||||||||||||||||||||||||||||||||||||||||||||||||||||||||||||||||||||||||
2008 Jun 12 - 2008 Jun 17 (?) Confirmed Eruption (Explosive / Effusive) VEI: 2
| Episode 1 | Eruption (Explosive / Effusive) | ||||||||||||||||||||||||
|---|---|---|---|---|---|---|---|---|---|---|---|---|---|---|---|---|---|---|---|---|---|---|---|---|
| 2008 Jun 12 - 2008 Jun 17 (?) | Evidence from Observations: Reported | |||||||||||||||||||||||
|
List of 3 Events for Episode 1
|
||||||||||||||||||||||||
2007 Jul 26 - 2007 Aug 26 Confirmed Eruption (Explosive / Effusive) VEI: 2
| Episode 1 | Eruption (Explosive / Effusive) | ||||||||||||||||||||||||
|---|---|---|---|---|---|---|---|---|---|---|---|---|---|---|---|---|---|---|---|---|---|---|---|---|
| 2007 Jul 26 - 2007 Aug 26 | Evidence from Observations: Reported | |||||||||||||||||||||||
|
List of 3 Events for Episode 1
|
||||||||||||||||||||||||
[ 2005 Jul 23 (?) - 2005 Aug 15 (?) ] Uncertain Eruption
| Episode 1 | Eruption (Explosive / Effusive) | |||||||||||||||||||
|---|---|---|---|---|---|---|---|---|---|---|---|---|---|---|---|---|---|---|---|
| 2005 Jul 23 (?) - 2005 Aug 15 (?) | Evidence from Unknown | ||||||||||||||||||
|
List of 2 Events for Episode 1
|
|||||||||||||||||||
[ 2004 Apr 15 (?) - 2004 Oct 8 (?) ] Uncertain Eruption
| Episode 1 | Eruption (Explosive / Effusive) | |||||||||||||||||||
|---|---|---|---|---|---|---|---|---|---|---|---|---|---|---|---|---|---|---|---|
| 2004 Apr 15 (?) - 2004 Oct 8 (?) | Evidence from Unknown | ||||||||||||||||||
|
List of 2 Events for Episode 1
|
|||||||||||||||||||
2002 Jun 16 (on or before) ± 15 days - 2002 Aug 25 (on or after) Confirmed Eruption (Explosive / Effusive) VEI: 2
| Episode 1 | Eruption (Explosive / Effusive) | ||||||||||||||||||||||||
|---|---|---|---|---|---|---|---|---|---|---|---|---|---|---|---|---|---|---|---|---|---|---|---|---|
| 2002 Jun 16 (on or before) ± 15 days - 2002 Aug 25 (on or after) | Evidence from Observations: Reported | |||||||||||||||||||||||
|
List of 3 Events for Episode 1
|
||||||||||||||||||||||||
2000 Jul 9 - 2000 Jul 9 Confirmed Eruption (Explosive / Effusive) VEI: 2 (?)
| Episode 1 | Eruption (Explosive / Effusive) | ||||||||||||||||||||||||
|---|---|---|---|---|---|---|---|---|---|---|---|---|---|---|---|---|---|---|---|---|---|---|---|---|
| 2000 Jul 9 - 2000 Jul 9 | Evidence from Observations: Reported | |||||||||||||||||||||||
|
List of 3 Events for Episode 1
|
||||||||||||||||||||||||
1999 Jul 30 Confirmed Eruption (Explosive / Effusive) VEI: 2
| Episode 1 | Eruption (Explosive / Effusive) | ||||||||||||||||||||||||
|---|---|---|---|---|---|---|---|---|---|---|---|---|---|---|---|---|---|---|---|---|---|---|---|---|
| 1999 Jul 30 - Unknown | Evidence from Observations: Reported | |||||||||||||||||||||||
|
List of 3 Events for Episode 1
|
||||||||||||||||||||||||
1997 Apr 16 (on or before) ± 15 days Confirmed Eruption (Explosive / Effusive) VEI: 2
| Episode 1 | Eruption (Explosive / Effusive) | ||||||||||||||||||||||||
|---|---|---|---|---|---|---|---|---|---|---|---|---|---|---|---|---|---|---|---|---|---|---|---|---|
| 1997 Apr 16 (on or before) ± 15 days - Unknown | Evidence from Observations: Reported | |||||||||||||||||||||||
|
List of 3 Events for Episode 1
|
||||||||||||||||||||||||
[ 1995 Aug 15 ] Uncertain Eruption
| Episode 1 | Eruption (Explosive / Effusive) | ||||||||||||||||||||||||
|---|---|---|---|---|---|---|---|---|---|---|---|---|---|---|---|---|---|---|---|---|---|---|---|---|
| 1995 Aug 15 - Unknown | Evidence from Unknown | |||||||||||||||||||||||
|
List of 3 Events for Episode 1
|
||||||||||||||||||||||||
1995 Mar 16 ± 15 days - 1995 Mar 16 ± 15 days Confirmed Eruption (Explosive / Effusive) VEI: 1
| Episode 1 | Eruption (Explosive / Effusive) | |||||||||||||||||||
|---|---|---|---|---|---|---|---|---|---|---|---|---|---|---|---|---|---|---|---|
| 1995 Mar 16 ± 15 days - 1995 Mar 16 ± 15 days | Evidence from Observations: Reported | ||||||||||||||||||
|
List of 2 Events for Episode 1
|
|||||||||||||||||||
1994 Jul 14 - 1994 Jul 14 Confirmed Eruption (Explosive / Effusive) VEI: 1
| Episode 1 | Eruption (Explosive / Effusive) | |||||||||||||||||||
|---|---|---|---|---|---|---|---|---|---|---|---|---|---|---|---|---|---|---|---|
| 1994 Jul 14 - 1994 Jul 14 | Evidence from Observations: Reported | ||||||||||||||||||
|
List of 2 Events for Episode 1
|
|||||||||||||||||||
1993 Apr 1 ± 90 days Confirmed Eruption (Explosive / Effusive) VEI: 1
| Episode 1 | Eruption (Explosive / Effusive) | ||||||||||||||||||||||||
|---|---|---|---|---|---|---|---|---|---|---|---|---|---|---|---|---|---|---|---|---|---|---|---|---|
| 1993 Apr 1 ± 90 days - Unknown | Evidence from Observations: Reported | |||||||||||||||||||||||
|
List of 3 Events for Episode 1
|
||||||||||||||||||||||||
1991 Sep 10 - 1991 Nov 12 (?) Confirmed Eruption (Explosive / Effusive) VEI: 2
| Episode 1 | Eruption (Explosive / Effusive) | ||||||||||||||||||||||||
|---|---|---|---|---|---|---|---|---|---|---|---|---|---|---|---|---|---|---|---|---|---|---|---|---|
| 1991 Sep 10 - 1991 Nov 12 (?) | Evidence from Observations: Reported | |||||||||||||||||||||||
|
List of 3 Events for Episode 1
|
||||||||||||||||||||||||
1990 Jan 16 (on or before) - 1990 Dec 16 (on or after) ± 15 days Confirmed Eruption (Explosive / Effusive) VEI: 2
| Episode 1 | Eruption (Explosive / Effusive) | |||||||||||||||||||||||||||||
|---|---|---|---|---|---|---|---|---|---|---|---|---|---|---|---|---|---|---|---|---|---|---|---|---|---|---|---|---|---|
| 1990 Jan 16 (on or before) - 1990 Dec 16 (on or after) ± 15 days | Evidence from Observations: Reported | ||||||||||||||||||||||||||||
|
List of 4 Events for Episode 1
|
|||||||||||||||||||||||||||||
1987 May 16 ± 15 days - 1989 Jul 28 ± 3 days Confirmed Eruption (Explosive / Effusive) VEI: 1
| Episode 1 | Eruption (Explosive / Effusive) | ||||||||||||||||||||||||||||||||||
|---|---|---|---|---|---|---|---|---|---|---|---|---|---|---|---|---|---|---|---|---|---|---|---|---|---|---|---|---|---|---|---|---|---|---|
| 1987 May 16 ± 15 days - 1989 Jul 28 ± 3 days | Evidence from Observations: Reported | |||||||||||||||||||||||||||||||||
|
List of 5 Events for Episode 1
|
||||||||||||||||||||||||||||||||||
1985 Aug 23 - 1986 Feb 28 Confirmed Eruption (Explosive / Effusive) VEI: 2
| Episode 1 | Eruption (Explosive / Effusive) | ||||||||||||||||||||||||
|---|---|---|---|---|---|---|---|---|---|---|---|---|---|---|---|---|---|---|---|---|---|---|---|---|
| 1985 Aug 23 - 1986 Feb 28 | Evidence from Observations: Reported | |||||||||||||||||||||||
|
List of 3 Events for Episode 1
|
||||||||||||||||||||||||
1982 Jul 18 - 1982 Jul 20 Confirmed Eruption (Explosive / Effusive) VEI: 3
| Episode 1 | Eruption (Explosive / Effusive) | |||||||||||||||||||||||||||||||||||||||
|---|---|---|---|---|---|---|---|---|---|---|---|---|---|---|---|---|---|---|---|---|---|---|---|---|---|---|---|---|---|---|---|---|---|---|---|---|---|---|---|
| 1982 Jul 18 - 1982 Jul 20 | Evidence from Observations: Reported | ||||||||||||||||||||||||||||||||||||||
|
List of 6 Events for Episode 1
|
|||||||||||||||||||||||||||||||||||||||
1978 Jan 16 ± 15 days - 1979 Dec 16 (on or after) ± 15 days Confirmed Eruption (Explosive / Effusive) VEI: 1
| Episode 1 | Eruption (Explosive / Effusive) | |||||||||||||||||||||||||||||
|---|---|---|---|---|---|---|---|---|---|---|---|---|---|---|---|---|---|---|---|---|---|---|---|---|---|---|---|---|---|
| 1978 Jan 16 ± 15 days - 1979 Dec 16 (on or after) ± 15 days | Evidence from Observations: Reported | ||||||||||||||||||||||||||||
|
List of 4 Events for Episode 1
|
|||||||||||||||||||||||||||||
1977 Jun 9 - 1977 Jun 30 Confirmed Eruption (Explosive / Effusive) VEI: 2
| Episode 1 | Eruption (Explosive / Effusive) | |||||||||||||||||||||||||||||
|---|---|---|---|---|---|---|---|---|---|---|---|---|---|---|---|---|---|---|---|---|---|---|---|---|---|---|---|---|---|
| 1977 Jun 9 - 1977 Jun 30 | Evidence from Observations: Reported | ||||||||||||||||||||||||||||
|
List of 4 Events for Episode 1
|
|||||||||||||||||||||||||||||
1976 Jun 7 - 1976 Nov 21 Confirmed Eruption (Explosive / Effusive) VEI: 2
| Episode 1 | Eruption (Explosive / Effusive) | ||||||||||||||||||||||||
|---|---|---|---|---|---|---|---|---|---|---|---|---|---|---|---|---|---|---|---|---|---|---|---|---|
| 1976 Jun 7 - 1976 Nov 21 | Evidence from Observations: Reported | |||||||||||||||||||||||
|
List of 3 Events for Episode 1
|
||||||||||||||||||||||||
1975 Mar 16 ± 15 days - 1975 May 16 ± 15 days Confirmed Eruption (Explosive / Effusive) VEI: 1
| Episode 1 | Eruption (Explosive / Effusive) | ||||||||||||||||||||||||
|---|---|---|---|---|---|---|---|---|---|---|---|---|---|---|---|---|---|---|---|---|---|---|---|---|
| 1975 Mar 16 ± 15 days - 1975 May 16 ± 15 days | Evidence from Observations: Reported | |||||||||||||||||||||||
|
List of 3 Events for Episode 1
|
||||||||||||||||||||||||
1974 Jun 15 - 1974 Jul 17 (?) Confirmed Eruption (Explosive / Effusive) VEI: 2
| Episode 1 | Eruption (Explosive / Effusive) | |||||||||||||||||||
|---|---|---|---|---|---|---|---|---|---|---|---|---|---|---|---|---|---|---|---|
| 1974 Jun 15 - 1974 Jul 17 (?) | Evidence from Observations: Reported | ||||||||||||||||||
|
List of 2 Events for Episode 1
|
|||||||||||||||||||
1973 May 16 ± 15 days - 1973 Oct 16 ± 15 days Confirmed Eruption (Explosive / Effusive) VEI: 1
| Episode 1 | Eruption (Explosive / Effusive) | ||||||||||||||||||||||||
|---|---|---|---|---|---|---|---|---|---|---|---|---|---|---|---|---|---|---|---|---|---|---|---|---|
| 1973 May 16 ± 15 days - 1973 Oct 16 ± 15 days | Evidence from Observations: Reported | |||||||||||||||||||||||
|
List of 3 Events for Episode 1
|
||||||||||||||||||||||||
1971 Sep 14 - 1971 Sep 14 Confirmed Eruption (Explosive / Effusive) VEI: 1
| Episode 1 | Eruption (Explosive / Effusive) | ||||||||||||||||||||||||
|---|---|---|---|---|---|---|---|---|---|---|---|---|---|---|---|---|---|---|---|---|---|---|---|---|
| 1971 Sep 14 - 1971 Sep 14 | Evidence from Observations: Reported | |||||||||||||||||||||||
|
List of 3 Events for Episode 1
|
||||||||||||||||||||||||
1956 Feb 13 - 1956 Mar 25 Confirmed Eruption (Explosive / Effusive) VEI: 3
| Episode 1 | Eruption (Explosive / Effusive) | |||||||||||||||||||||||||||||||||||||||||||||||||
|---|---|---|---|---|---|---|---|---|---|---|---|---|---|---|---|---|---|---|---|---|---|---|---|---|---|---|---|---|---|---|---|---|---|---|---|---|---|---|---|---|---|---|---|---|---|---|---|---|---|
| 1956 Feb 13 - 1956 Mar 25 | Evidence from Observations: Reported | ||||||||||||||||||||||||||||||||||||||||||||||||
|
List of 8 Events for Episode 1
|
|||||||||||||||||||||||||||||||||||||||||||||||||
1955 Jan 18 - 1955 Jan 18 Confirmed Eruption (Explosive / Effusive) VEI: 2 (?)
| Episode 1 | Eruption (Explosive / Effusive) | ||||||||||||||||||||||||
|---|---|---|---|---|---|---|---|---|---|---|---|---|---|---|---|---|---|---|---|---|---|---|---|---|
| 1955 Jan 18 - 1955 Jan 18 | Evidence from Observations: Reported | |||||||||||||||||||||||
|
List of 3 Events for Episode 1
|
||||||||||||||||||||||||
1953 Jan 31 - 1953 Apr 15 ± 5 days Confirmed Eruption (Explosive / Effusive) VEI: 3
| Episode 1 | Eruption (Explosive / Effusive) | |||||||||||||||||||||||||||||||||||||||||||||||||||||||||||
|---|---|---|---|---|---|---|---|---|---|---|---|---|---|---|---|---|---|---|---|---|---|---|---|---|---|---|---|---|---|---|---|---|---|---|---|---|---|---|---|---|---|---|---|---|---|---|---|---|---|---|---|---|---|---|---|---|---|---|---|
| 1953 Jan 31 - 1953 Apr 15 ± 5 days | Evidence from Observations: Reported | ||||||||||||||||||||||||||||||||||||||||||||||||||||||||||
|
List of 10 Events for Episode 1
|
|||||||||||||||||||||||||||||||||||||||||||||||||||||||||||
1944 Jun 30 - 1945 Apr 19 Confirmed Eruption (Explosive / Effusive) VEI: 2
| Episode 1 | Eruption (Explosive / Effusive) | |||||||||||||||||||||||||||||
|---|---|---|---|---|---|---|---|---|---|---|---|---|---|---|---|---|---|---|---|---|---|---|---|---|---|---|---|---|---|
| 1944 Jun 30 - 1945 Apr 19 | Evidence from Observations: Reported | ||||||||||||||||||||||||||||
|
List of 4 Events for Episode 1
|
|||||||||||||||||||||||||||||
1943 Mar 17 - 1943 Jun 18 Confirmed Eruption (Explosive / Effusive) VEI: 2
| Episode 1 | Eruption (Explosive / Effusive) | |||||||||||||||||||||||||||||
|---|---|---|---|---|---|---|---|---|---|---|---|---|---|---|---|---|---|---|---|---|---|---|---|---|---|---|---|---|---|
| 1943 Mar 17 - 1943 Jun 18 | Evidence from Observations: Reported | ||||||||||||||||||||||||||||
|
List of 4 Events for Episode 1
|
|||||||||||||||||||||||||||||
1941 Dec 13 Confirmed Eruption (Explosive / Effusive) VEI: 2
| Episode 1 | Eruption (Explosive / Effusive) | ||||||||||||||||||||||||
|---|---|---|---|---|---|---|---|---|---|---|---|---|---|---|---|---|---|---|---|---|---|---|---|---|
| 1941 Dec 13 - Unknown | Evidence from Observations: Reported | |||||||||||||||||||||||
|
List of 3 Events for Episode 1
|
||||||||||||||||||||||||
1940 Confirmed Eruption (Explosive / Effusive) VEI: 2
| Episode 1 | Eruption (Explosive / Effusive) | |||||||||||||||||||
|---|---|---|---|---|---|---|---|---|---|---|---|---|---|---|---|---|---|---|---|
| 1940 - Unknown | Evidence from Observations: Reported | ||||||||||||||||||
|
List of 2 Events for Episode 1
|
|||||||||||||||||||
1938 Aug 13 - 1939 Jan 10 (on or after) Confirmed Eruption (Explosive / Effusive) VEI: 2
| Episode 1 | Eruption (Explosive / Effusive) | ||||||||||||||||||||||||
|---|---|---|---|---|---|---|---|---|---|---|---|---|---|---|---|---|---|---|---|---|---|---|---|---|
| 1938 Aug 13 - 1939 Jan 10 (on or after) | Evidence from Observations: Reported | |||||||||||||||||||||||
|
List of 3 Events for Episode 1
|
||||||||||||||||||||||||
1937 Oct 27 - 1937 Nov 27 Confirmed Eruption (Explosive / Effusive) VEI: 2
| Episode 1 | Eruption (Explosive / Effusive) | |||||||||||||||||||
|---|---|---|---|---|---|---|---|---|---|---|---|---|---|---|---|---|---|---|---|
| 1937 Oct 27 - 1937 Nov 27 | Evidence from Observations: Reported | ||||||||||||||||||
|
List of 2 Events for Episode 1
|
|||||||||||||||||||
1936 Aug 22 - 1936 Dec 11 Confirmed Eruption (Explosive / Effusive) VEI: 2
| Episode 1 | Eruption (Explosive / Effusive) | |||||||||||||||||||
|---|---|---|---|---|---|---|---|---|---|---|---|---|---|---|---|---|---|---|---|
| 1936 Aug 22 - 1936 Dec 11 | Evidence from Observations: Reported | ||||||||||||||||||
|
List of 2 Events for Episode 1
|
|||||||||||||||||||
1933 Nov 21 - 1933 Dec 6 Confirmed Eruption (Explosive / Effusive) VEI: 2
| Episode 1 | Eruption (Explosive / Effusive) | |||||||||||||||||||
|---|---|---|---|---|---|---|---|---|---|---|---|---|---|---|---|---|---|---|---|
| 1933 Nov 21 - 1933 Dec 6 | Evidence from Observations: Reported | ||||||||||||||||||
|
List of 2 Events for Episode 1
|
|||||||||||||||||||
1929 Apr 27 ± 60 days Confirmed Eruption (Explosive / Effusive) VEI: 2
| Episode 1 | Eruption (Explosive / Effusive) | |||||||||||||||||||
|---|---|---|---|---|---|---|---|---|---|---|---|---|---|---|---|---|---|---|---|
| 1929 Apr 27 ± 60 days - Unknown | Evidence from Observations: Reported | ||||||||||||||||||
|
List of 2 Events for Episode 1
|
|||||||||||||||||||
1928 Nov Confirmed Eruption (Explosive / Effusive) VEI: 2
| Episode 1 | Eruption (Explosive / Effusive) | |||||||||||||||||||
|---|---|---|---|---|---|---|---|---|---|---|---|---|---|---|---|---|---|---|---|
| 1928 Nov - Unknown | Evidence from Observations: Reported | ||||||||||||||||||
|
List of 2 Events for Episode 1
|
|||||||||||||||||||
1927 Aug 2 - 1928 Mar (?) Confirmed Eruption (Explosive / Effusive) VEI: 2
| Episode 1 | Eruption (Explosive / Effusive) | Central cone and NW crater wall | |||||||||||||||||||||||||||||||||
|---|---|---|---|---|---|---|---|---|---|---|---|---|---|---|---|---|---|---|---|---|---|---|---|---|---|---|---|---|---|---|---|---|---|---|
| 1927 Aug 2 - 1928 Mar (?) | Evidence from Observations: Reported | |||||||||||||||||||||||||||||||||
|
List of 5 Events for Episode 1 at Central cone and NW crater wall
|
||||||||||||||||||||||||||||||||||
[ 1924 Aug 20 ] Uncertain Eruption
| Episode 1 | Eruption (Explosive / Effusive) | |||||||||||||||||||
|---|---|---|---|---|---|---|---|---|---|---|---|---|---|---|---|---|---|---|---|
| 1924 Aug 20 - Unknown | Evidence from Unknown | ||||||||||||||||||
|
List of 2 Events for Episode 1
|
|||||||||||||||||||
1924 Feb (on or before) Confirmed Eruption (Explosive / Effusive) VEI: 2
| Episode 1 | Eruption (Explosive / Effusive) | ||||||||||||||||||||||||
|---|---|---|---|---|---|---|---|---|---|---|---|---|---|---|---|---|---|---|---|---|---|---|---|---|
| 1924 Feb (on or before) - Unknown | Evidence from Observations: Reported | |||||||||||||||||||||||
|
List of 3 Events for Episode 1
|
||||||||||||||||||||||||
1921 Feb 14 ± 4 days - 1921 Apr Confirmed Eruption (Explosive / Effusive) VEI: 2
| Episode 1 | Eruption (Explosive / Effusive) | 1913 cone | ||||||||||||||||||||||||||||
|---|---|---|---|---|---|---|---|---|---|---|---|---|---|---|---|---|---|---|---|---|---|---|---|---|---|---|---|---|---|
| 1921 Feb 14 ± 4 days - 1921 Apr | Evidence from Observations: Reported | ||||||||||||||||||||||||||||
|
List of 4 Events for Episode 1 at 1913 cone
|
|||||||||||||||||||||||||||||
1917 Feb 22 Confirmed Eruption (Explosive / Effusive) VEI: 2
| Episode 1 | Eruption (Explosive / Effusive) | |||||||||||||||||||
|---|---|---|---|---|---|---|---|---|---|---|---|---|---|---|---|---|---|---|---|
| 1917 Feb 22 - Unknown | Evidence from Observations: Reported | ||||||||||||||||||
|
List of 2 Events for Episode 1
|
|||||||||||||||||||
1916 Nov - 1916 Dec Confirmed Eruption (Explosive / Effusive) VEI: 2
| Episode 1 | Eruption (Explosive / Effusive) | |||||||||||||||||||
|---|---|---|---|---|---|---|---|---|---|---|---|---|---|---|---|---|---|---|---|
| 1916 Nov - 1916 Dec | Evidence from Observations: Reported | ||||||||||||||||||
|
List of 2 Events for Episode 1
|
|||||||||||||||||||
1915 May Confirmed Eruption (Explosive / Effusive) VEI: 2
| Episode 1 | Eruption (Explosive / Effusive) | |||||||||||||||||||
|---|---|---|---|---|---|---|---|---|---|---|---|---|---|---|---|---|---|---|---|
| 1915 May - Unknown | Evidence from Observations: Reported | ||||||||||||||||||
|
List of 2 Events for Episode 1
|
|||||||||||||||||||
1913 May 10 - 1913 Dec Confirmed Eruption (Explosive / Effusive) VEI: 2
| Episode 1 | Eruption (Explosive / Effusive) | |||||||||||||||||||||||||||||
|---|---|---|---|---|---|---|---|---|---|---|---|---|---|---|---|---|---|---|---|---|---|---|---|---|---|---|---|---|---|
| 1913 May 10 - 1913 Dec | Evidence from Observations: Reported | ||||||||||||||||||||||||||||
|
List of 4 Events for Episode 1
|
|||||||||||||||||||||||||||||
1903 Nov 28 - 1904 Jan Confirmed Eruption (Explosive / Effusive) VEI: 2
| Episode 1 | Eruption (Explosive / Effusive) | |||||||||||||||||||||||||||||
|---|---|---|---|---|---|---|---|---|---|---|---|---|---|---|---|---|---|---|---|---|---|---|---|---|---|---|---|---|---|
| 1903 Nov 28 - 1904 Jan | Evidence from Observations: Reported | ||||||||||||||||||||||||||||
|
List of 4 Events for Episode 1
|
|||||||||||||||||||||||||||||
1902 Feb 16 - 1902 Feb 27 (on or after) Confirmed Eruption (Explosive / Effusive) VEI: 2
| Episode 1 | Eruption (Explosive / Effusive) | ||||||||||||||||||||||||||||||||||
|---|---|---|---|---|---|---|---|---|---|---|---|---|---|---|---|---|---|---|---|---|---|---|---|---|---|---|---|---|---|---|---|---|---|---|
| 1902 Feb 16 - 1902 Feb 27 (on or after) | Evidence from Observations: Reported | |||||||||||||||||||||||||||||||||
|
List of 5 Events for Episode 1
|
||||||||||||||||||||||||||||||||||
1897 Apr Confirmed Eruption (Explosive / Effusive) VEI: 2
| Episode 1 | Eruption (Explosive / Effusive) | |||||||||||||||||||
|---|---|---|---|---|---|---|---|---|---|---|---|---|---|---|---|---|---|---|---|
| 1897 Apr - Unknown | Evidence from Observations: Reported | ||||||||||||||||||
|
List of 2 Events for Episode 1
|
|||||||||||||||||||
1896 Aug Confirmed Eruption (Explosive / Effusive) VEI: 2
| Episode 1 | Eruption (Explosive / Effusive) | |||||||||||||||||||||||||||||
|---|---|---|---|---|---|---|---|---|---|---|---|---|---|---|---|---|---|---|---|---|---|---|---|---|---|---|---|---|---|
| 1896 Aug - Unknown | Evidence from Observations: Reported | ||||||||||||||||||||||||||||
|
List of 4 Events for Episode 1
|
|||||||||||||||||||||||||||||
1890 Jul - 1890 Sep 15 ± 2 days Confirmed Eruption (Explosive / Effusive) VEI: 2
| Episode 1 | Eruption (Explosive / Effusive) | ||||||||||||||||||||||||
|---|---|---|---|---|---|---|---|---|---|---|---|---|---|---|---|---|---|---|---|---|---|---|---|---|
| 1890 Jul - 1890 Sep 15 ± 2 days | Evidence from Observations: Reported | |||||||||||||||||||||||
|
List of 3 Events for Episode 1
|
||||||||||||||||||||||||
1885 Jun 21 - 1885 Jun 22 Confirmed Eruption (Explosive / Effusive) VEI: 2
| Episode 1 | Eruption (Explosive / Effusive) | ||||||||||||||||||||||||
|---|---|---|---|---|---|---|---|---|---|---|---|---|---|---|---|---|---|---|---|---|---|---|---|---|
| 1885 Jun 21 - 1885 Jun 22 | Evidence from Observations: Reported | |||||||||||||||||||||||
|
List of 3 Events for Episode 1
|
||||||||||||||||||||||||
1881 Confirmed Eruption (Explosive / Effusive)
| Episode 1 | Eruption (Explosive / Effusive) | ||||||||||||||||||||||||
|---|---|---|---|---|---|---|---|---|---|---|---|---|---|---|---|---|---|---|---|---|---|---|---|---|
| 1881 - Unknown | Evidence from Observations: Reported | |||||||||||||||||||||||
|
List of 3 Events for Episode 1
|
||||||||||||||||||||||||
1864 Jul 2 - 1864 Dec Confirmed Eruption (Explosive / Effusive) VEI: 2
| Episode 1 | Eruption (Explosive / Effusive) | ||||||||||||||||||||||||
|---|---|---|---|---|---|---|---|---|---|---|---|---|---|---|---|---|---|---|---|---|---|---|---|---|
| 1864 Jul 2 - 1864 Dec | Evidence from Observations: Reported | |||||||||||||||||||||||
|
List of 3 Events for Episode 1
|
||||||||||||||||||||||||
1860 Sep (on or before) Confirmed Eruption (Explosive / Effusive) VEI: 2
| Episode 1 | Eruption (Explosive / Effusive) | ||||||||||||||||||||||||
|---|---|---|---|---|---|---|---|---|---|---|---|---|---|---|---|---|---|---|---|---|---|---|---|---|
| 1860 Sep (on or before) - Unknown | Evidence from Observations: Reported | |||||||||||||||||||||||
|
List of 3 Events for Episode 1
|
||||||||||||||||||||||||
1859 Dec 14 Confirmed Eruption (Explosive / Effusive) VEI: 2
| Episode 1 | Eruption (Explosive / Effusive) | |||||||||||||||||||
|---|---|---|---|---|---|---|---|---|---|---|---|---|---|---|---|---|---|---|---|
| 1859 Dec 14 - Unknown | Evidence from Observations: Reported | ||||||||||||||||||
|
List of 2 Events for Episode 1
|
|||||||||||||||||||
1849 Dec 1 ± 30 days Confirmed Eruption (Explosive / Effusive)
| Episode 1 | Eruption (Explosive / Effusive) | ||||||||||||||
|---|---|---|---|---|---|---|---|---|---|---|---|---|---|---|
| 1849 Dec 1 ± 30 days - Unknown | Evidence from Observations: Reported | |||||||||||||
|
List of 1 Events for Episode 1
|
||||||||||||||
1838 Confirmed Eruption (Explosive / Effusive) VEI: 2
| Episode 1 | Eruption (Explosive / Effusive) | |||||||||||||||||||||||||||||
|---|---|---|---|---|---|---|---|---|---|---|---|---|---|---|---|---|---|---|---|---|---|---|---|---|---|---|---|---|---|
| 1838 - Unknown | Evidence from Observations: Reported | ||||||||||||||||||||||||||||
|
List of 4 Events for Episode 1
|
|||||||||||||||||||||||||||||
1817 Jan 16 - 1817 Feb 10 (?) Confirmed Eruption (Explosive / Effusive) VEI: 4 (?)
| Episode 1 | Eruption (Explosive / Effusive) | |||||||||||||||||||||||||||||||||||||||
|---|---|---|---|---|---|---|---|---|---|---|---|---|---|---|---|---|---|---|---|---|---|---|---|---|---|---|---|---|---|---|---|---|---|---|---|---|---|---|---|
| 1817 Jan 16 - 1817 Feb 10 (?) | Evidence from Observations: Reported | ||||||||||||||||||||||||||||||||||||||
|
List of 6 Events for Episode 1
|
|||||||||||||||||||||||||||||||||||||||
1815 Dec 31 ± 365 days Confirmed Eruption (Explosive / Effusive) VEI: 2
| Episode 1 | Eruption (Explosive / Effusive) | ||||||||||||||||||||||||
|---|---|---|---|---|---|---|---|---|---|---|---|---|---|---|---|---|---|---|---|---|---|---|---|---|
| 1815 Dec 31 ± 365 days - Unknown | Evidence from Observations: Reported | |||||||||||||||||||||||
|
List of 3 Events for Episode 1
|
||||||||||||||||||||||||
1812 - 1814 (?) Confirmed Eruption (Explosive / Effusive) VEI: 2
| Episode 1 | Eruption (Explosive / Effusive) | |||||||||||||||||||||||||||||
|---|---|---|---|---|---|---|---|---|---|---|---|---|---|---|---|---|---|---|---|---|---|---|---|---|---|---|---|---|---|
| 1812 - 1814 (?) | Evidence from Observations: Reported | ||||||||||||||||||||||||||||
|
List of 4 Events for Episode 1
|
|||||||||||||||||||||||||||||
1804 ± 4 years Confirmed Eruption (Explosive / Effusive) VEI: 2
| Episode 1 | Eruption (Explosive / Effusive) | |||||||||||||||||||
|---|---|---|---|---|---|---|---|---|---|---|---|---|---|---|---|---|---|---|---|
| 1804 ± 4 years - Unknown | Evidence from Observations: Reported | ||||||||||||||||||
|
List of 2 Events for Episode 1
|
|||||||||||||||||||
1793 ± 6 years Confirmed Eruption (Explosive / Effusive) VEI: 2
| Episode 1 | Eruption (Explosive / Effusive) | |||||||||||||||||||
|---|---|---|---|---|---|---|---|---|---|---|---|---|---|---|---|---|---|---|---|
| 1793 ± 6 years - Unknown | Evidence from Observations: Reported | ||||||||||||||||||
|
List of 2 Events for Episode 1
|
|||||||||||||||||||
1730 Confirmed Eruption (Explosive / Effusive) VEI: 3 (?)
| Episode 1 | Eruption (Explosive / Effusive) | |||||||||||||||||||||||||||||||||||||||
|---|---|---|---|---|---|---|---|---|---|---|---|---|---|---|---|---|---|---|---|---|---|---|---|---|---|---|---|---|---|---|---|---|---|---|---|---|---|---|---|
| 1730 - Unknown | Evidence from Observations: Reported | ||||||||||||||||||||||||||||||||||||||
|
List of 6 Events for Episode 1
|
|||||||||||||||||||||||||||||||||||||||
1638 Confirmed Eruption (Explosive / Effusive) VEI: 4 (?)
| Episode 1 | Eruption (Explosive / Effusive) | |||||||||||||||||||||||||||||||||||||||
|---|---|---|---|---|---|---|---|---|---|---|---|---|---|---|---|---|---|---|---|---|---|---|---|---|---|---|---|---|---|---|---|---|---|---|---|---|---|---|---|
| 1638 - Unknown | Evidence from Observations: Reported | ||||||||||||||||||||||||||||||||||||||
|
List of 6 Events for Episode 1
|
|||||||||||||||||||||||||||||||||||||||
1597 Jan 17 - 1597 Feb 2 (on or after) Confirmed Eruption (Explosive / Effusive) VEI: 3
| Episode 1 | Eruption (Explosive / Effusive) | |||||||||||||||||||||||||||||
|---|---|---|---|---|---|---|---|---|---|---|---|---|---|---|---|---|---|---|---|---|---|---|---|---|---|---|---|---|---|
| 1597 Jan 17 - 1597 Feb 2 (on or after) | Evidence from Observations: Reported | ||||||||||||||||||||||||||||
|
List of 4 Events for Episode 1
|
|||||||||||||||||||||||||||||
1593 Confirmed Eruption (Explosive / Effusive) VEI: 5 (?)
| Episode 1 | Eruption (Explosive / Effusive) | ||||||||||||||||||||||||||||||||||
|---|---|---|---|---|---|---|---|---|---|---|---|---|---|---|---|---|---|---|---|---|---|---|---|---|---|---|---|---|---|---|---|---|---|---|
| 1593 - Unknown | Evidence from Observations: Reported | |||||||||||||||||||||||||||||||||
|
List of 5 Events for Episode 1
|
||||||||||||||||||||||||||||||||||
[ 1586 ] Uncertain Eruption
| Episode 1 | Eruption (Explosive / Effusive) | |||||||||||||||||||||||||||||
|---|---|---|---|---|---|---|---|---|---|---|---|---|---|---|---|---|---|---|---|---|---|---|---|---|---|---|---|---|---|
| 1586 - Unknown | Evidence from Unknown | ||||||||||||||||||||||||||||
|
List of 4 Events for Episode 1
|
|||||||||||||||||||||||||||||
This compilation of synonyms and subsidiary features may not be comprehensive. Features are organized into four major categories: Cones, Craters, Domes, and Thermal Features. Synonyms of features appear indented below the primary name. In some cases additional feature type, elevation, or location details are provided.
Synonyms |
||||
| Raoeng | Rawon | Ringgit | Roung | ||||
Cones |
||||
| Feature Name | Feature Type | Elevation | Latitude | Longitude |
| Gadung, Gunung | Former cone | 2300 m | 8° 6' 57.00" S | 114° 1' 8.00" E |
| Pajungan, Gunung | Cone | 2347 m | 8° 6' 44.00" S | 114° 0' 37.00" E |
| Suket
Soeket |
Stratovolcano | 2940 m | 8° 5' 6.00" S | 114° 4' 47.00" E |
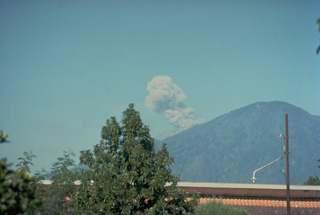 An ash plume rises above the summit of Raung volcano, almost hidden behind a forested cone of the Ijen volcanic complex, in this August 1976 view from the east. Explosive eruptions took place from Gunung Raung from June until November 1976.
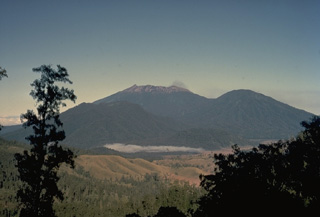 The summit of the massive Raung volcano, part of a group of volcanoes along a NW-SE-trending line near the eastern tip of Java, is truncated by a steep-walled, 2-km-wide caldera. This view from Ijen caldera NW of Raung shows Raung at the center and Gunung Suket on the right. Raung is one of Java's most active volcanoes, producing frequent explosive eruptions from a central cone within the caldera.
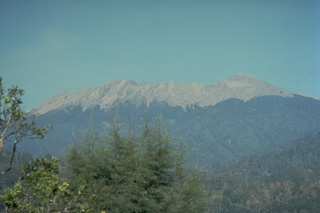 The irregular summit of Raung volcano, seen here from near the village of Jampit in the caldera of neighboring Ijen volcano to its NE, is truncated by a 2-km-wide caldera. Frequent explosive eruptions during historical time keep the summit of the volcano unvegetated.
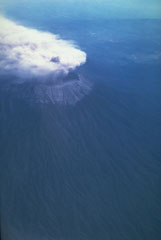 Ash plume rose above Raung volcano on 10 and 12 September, and 3 October 1991. Although the initial report was of flank vent activity, photographs such as this one on 12 September taken from the south, show the eruption occurring at the summit caldera and the plume being dispersed by the wind to the NW.
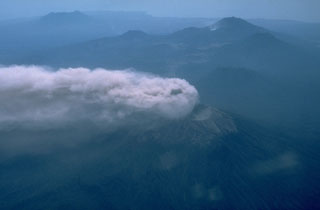 An aerial view from the SW on 12 September 1991 shows an eruption plume from Raung volcano in eastern Java dispersed to the NW by strong winds. Behind Raung is Ijen caldera, capped by the post-caldera cone of Gunung Merapi (upper right). The light spot below and to the left of Merapi is Kawah Ijen, a renowned crater lake. The flat-topped volcano at the upper left is Gunung Baluran, which occupies the NE-most tip of the island of Java.
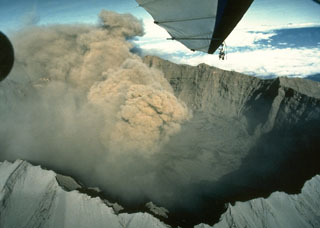 An ash plume from the scoria cone within the caldera rises above the rim of the 2-km-wide Raung caldera in July 1988. Raung has erupted frequently in historical time.
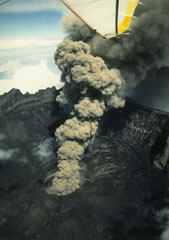 An eruption plume from a scoria cone on the floor of the 2-km-wide Raung caldera rises high above the caldera rim in July 1988. Frequent explosive eruptions occurred at Raung from 1987 through July 1989. During August and September 1988 more than 300-400 individual eruptions were recorded.
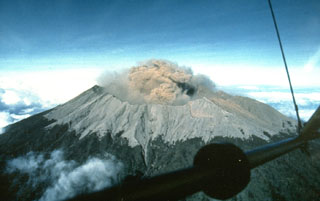 Raung volcano, near the eastern tip of Java, contains a 2-km-wide summit caldera. One of Java's most active volcanoes, Raung produces frequent moderate explosive eruptions, like this one in 1988 from a cone within the caldera, that keep the upper flanks of the volcano sparsely vegetated. Raung forms part of a NW-SE-trending chain of volcanoes constructed near the SW rim of Ijen caldera.
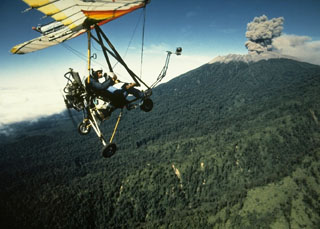 An ultralight aircraft was used by scientists from France and the Volcanological Survey of Indonesia to monitor activity at Raung in 1988. This July view shows an ash plume rising above the forested northern flank of Raung volcano. Hundreds of explosive eruptions were recorded during August and September 1988. This eruption began in 1987 and continued into 1989.
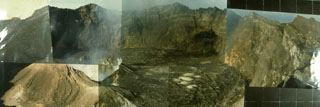 This composite photo shows the steep-walled, 2-km-wide summit caldera of Raung volcano. A 90-m-high scoria cone shown producing a plume on the caldera floor at the left began to form in 1902 and is the source of recent explosive eruptions. Fresh lava flows cover the caldera floor.
 Rice fields cover an area formed by debris avalanche deposits in front of Raung volcano to the W. The northern and southern walls forming cliffs to the left and right sides of the photo are scarps from the collapse event, which produced one of the world's largest debris avalanches that nearly reached the Indian Ocean.
 This view from the west flank of Raung volcano shows the rounded forested peak of Gunung Pajungan (left center), which grew near the headwall of the horseshoe-shaped scar produced by gravitational collapse of Gunung Gadung. Behind it, above the clouds, is the rim of the historically active summit caldera of Raung volcano.
 This hilly terrain is part of a massive debris-avalanche deposit that formed as a result of collapse of Gunung Gadung on the west side of Raung volcano. The debris-avalanche deposit has an estimated volume of about 25 km3. The avalanche banked against the slopes of Iyang-Argapura volcano and was deflected to the SW, traveling nearly to the Indian Ocean.
 This 20-m-high conical hill is a hummock that is part of a massive debris avalanche deposit produced by the collapse of Gunung Gadung, a stratovolcano on the west side of Raung volcano. The hummocky topography produced by the massive landslide extends many tens of km from the volcano.
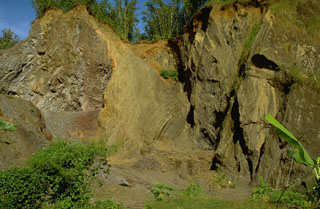 An outcrop in a quarry showing the internal structure of a debris avalanche hummock, with bedded layers of tephra on the right and a segment of a lava flow on the left. Both the massive lava and the unconsolidated tephra layers were transported relatively intact for about 30 km within a debris avalanche from Raung volcano in eastern Java. The preservation of original stratigraphy from within the volcano is a common feature of debris avalanche deposits.
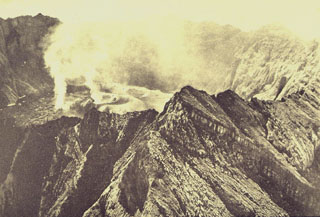 Gas-and-steam plumes rise above the 1913 crater in this August 1922 aerial photo of Raung's summit caldera, taken from the NW. A lava flow covers the caldera floor to the left of the 1913 cone.
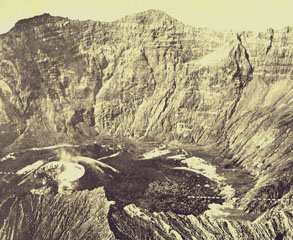 The cone at the lower left on the floor of Raung's summit caldera formed during an eruption in 1913. A lava flow erupted from the cone, extending to the right across the caldera floor. This aerial photo, taken some time before 1926, shows the steep, roughly 500-m-high SW caldera wall in the background.
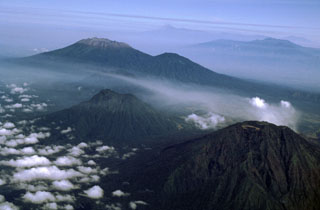 Raung volcano, with its unvegetated summit caldera and Suket peak to the NE, is at the upper left in this aerial view from the eastern tip of Java. In the foreground are Gunung Rante (left-center) and Gunung Merapi (lower right), constructed near the margin of the Ijen caldera complex. The Semeru-Tengger caldera complex is on the far right-center horizon, and the Iyang-Argapura complex is on the upper right.
There are no samples for Raung in the Smithsonian's NMNH Department of Mineral Sciences Rock and Ore collection.
| Copernicus Browser | The Copernicus Browser replaced the Sentinel Hub Playground browser in 2023, to provide access to Earth observation archives from the Copernicus Data Space Ecosystem, the main distribution platform for data from the EU Copernicus missions. |
| MIROVA | Middle InfraRed Observation of Volcanic Activity (MIROVA) is a near real time volcanic hot-spot detection system based on the analysis of MODIS (Moderate Resolution Imaging Spectroradiometer) data. In particular, MIROVA uses the Middle InfraRed Radiation (MIR), measured over target volcanoes, in order to detect, locate and measure the heat radiation sourced from volcanic activity. |
| MODVOLC Thermal Alerts | Using infrared satellite Moderate Resolution Imaging Spectroradiometer (MODIS) data, scientists at the Hawai'i Institute of Geophysics and Planetology, University of Hawai'i, developed an automated system called MODVOLC to map thermal hot-spots in near real time. For each MODIS image, the algorithm automatically scans each 1 km pixel within it to check for high-temperature hot-spots. When one is found the date, time, location, and intensity are recorded. MODIS looks at every square km of the Earth every 48 hours, once during the day and once during the night, and the presence of two MODIS sensors in space allows at least four hot-spot observations every two days. Each day updated global maps are compiled to display the locations of all hot spots detected in the previous 24 hours. There is a drop-down list with volcano names which allow users to 'zoom-in' and examine the distribution of hot-spots at a variety of spatial scales. |
|
WOVOdat
Single Volcano View Temporal Evolution of Unrest Side by Side Volcanoes |
WOVOdat is a database of volcanic unrest; instrumentally and visually recorded changes in seismicity, ground deformation, gas emission, and other parameters from their normal baselines. It is sponsored by the World Organization of Volcano Observatories (WOVO) and presently hosted at the Earth Observatory of Singapore.
GVMID Data on Volcano Monitoring Infrastructure The Global Volcano Monitoring Infrastructure Database GVMID, is aimed at documenting and improving capabilities of volcano monitoring from the ground and space. GVMID should provide a snapshot and baseline view of the techniques and instrumentation that are in place at various volcanoes, which can be use by volcano observatories as reference to setup new monitoring system or improving networks at a specific volcano. These data will allow identification of what monitoring gaps exist, which can be then targeted by remote sensing infrastructure and future instrument deployments. |
| Volcanic Hazard Maps | The IAVCEI Commission on Volcanic Hazards and Risk has a Volcanic Hazard Maps database designed to serve as a resource for hazard mappers (or other interested parties) to explore how common issues in hazard map development have been addressed at different volcanoes, in different countries, for different hazards, and for different intended audiences. In addition to the comprehensive, searchable Volcanic Hazard Maps Database, this website contains information about diversity of volcanic hazard maps, illustrated using examples from the database. This site is for educational purposes related to volcanic hazard maps. Hazard maps found on this website should not be used for emergency purposes. For the most recent, official hazard map for a particular volcano, please seek out the proper institutional authorities on the matter. |
| IRIS seismic stations/networks | Incorporated Research Institutions for Seismology (IRIS) Data Services map showing the location of seismic stations from all available networks (permanent or temporary) within a radius of 0.18° (about 20 km at mid-latitudes) from the given location of Raung. Users can customize a variety of filters and options in the left panel. Note that if there are no stations are known the map will default to show the entire world with a "No data matched request" error notice. |
| UNAVCO GPS/GNSS stations | Geodetic Data Services map from UNAVCO showing the location of GPS/GNSS stations from all available networks (permanent or temporary) within a radius of 20 km from the given location of Raung. Users can customize the data search based on station or network names, location, and time window. Requires Adobe Flash Player. |
| DECADE Data | The DECADE portal, still in the developmental stage, serves as an example of the proposed interoperability between The Smithsonian Institution's Global Volcanism Program, the Mapping Gas Emissions (MaGa) Database, and the EarthChem Geochemical Portal. The Deep Earth Carbon Degassing (DECADE) initiative seeks to use new and established technologies to determine accurate global fluxes of volcanic CO2 to the atmosphere, but installing CO2 monitoring networks on 20 of the world's 150 most actively degassing volcanoes. The group uses related laboratory-based studies (direct gas sampling and analysis, melt inclusions) to provide new data for direct degassing of deep earth carbon to the atmosphere. |
| Large Eruptions of Raung | Information about large Quaternary eruptions (VEI >= 4) is cataloged in the Large Magnitude Explosive Volcanic Eruptions (LaMEVE) database of the Volcano Global Risk Identification and Analysis Project (VOGRIPA). |
| EarthChem | EarthChem develops and maintains databases, software, and services that support the preservation, discovery, access and analysis of geochemical data, and facilitate their integration with the broad array of other available earth science parameters. EarthChem is operated by a joint team of disciplinary scientists, data scientists, data managers and information technology developers who are part of the NSF-funded data facility Integrated Earth Data Applications (IEDA). IEDA is a collaborative effort of EarthChem and the Marine Geoscience Data System (MGDS). |

