


AVO changed both the Aviation Color Code and Volcano Alert Level for Veniaminof to Green and Normal, respectively, on 8 July, noting that seismic stations were back online. The monitoring network consists of local and regional seismic stations, regional infrasound networks, lightning detection, and satellite image monitoring.
Source: US Geological Survey Alaska Volcano Observatory (AVO)
New eruption during February-April 2021 with ash plumes from summit and flank vents
Veniaminof, located on the Alaskan Peninsula, is truncated by a steep-walled, 8 x 11 km, glacier-filled caldera that formed around 3,700 years ago. There have been 14 eruptions over the past 38 years. It is monitored by the Alaska Volcanic Observatory (AVO) and the Anchorage Volcanic Ash Advisory Center (VAAC). A new eruption began in late February 2021 after more than a year of inactivity following an eruption during September-December 2018 which included Strombolian activity, an 800-m-long lava flow, and minor ash emissions (BGVN 44:01). This latest eruption that began in late February 2021 included thermal activity from two vents and ended in early April 2021.
Observations during 2019-2020. According to AVO, eruptive activity had significantly declined by the end of December 2018, but unrest characterized by seismic events continued into January 2019. During 1-3 January seismic tremor was at a low level and surface temperatures were slightly elevated, indicative of cooling lava. On 4 January AVO reduced the Aviation Color Code (ACC) to Yellow (the third highest level on a four-color scale) and the Volcanic Alert Level (VAL) to Advisory after satellite images showed that the extent of the lava flow in the summit caldera had not changed since late December 2018 and thermal images showed greatly reduced intensity.
Seismic tremor and occasional weak gas-and-steam emissions continued through April 2019, along with weakly elevated surface temperatures. On 30 April AVO lowered the ACC to Green and the VAL to Normal following four months of decreasing unrest, though low-level tremor, slightly elevated surface temperatures, and weak gas-and-steam emissions continued. Pilot reports of gas-and-steam emissions on 1 August coincided with low-level tremor, but by 25 August activity had returned to background levels.
AVO did not report further indications of unrest until 18 June 2020, when there was an increase in seismicity. Periods of low-amplitude seismic tremor decreased in frequency during 19-20 June and were not detected by the 21st. Minimal activity continued through early August.
Activity during January-April 2021. Analysis of satellite, webcam, and regional infrasound data by AVO suggested that new eruptive activity occurred on 28 February 2021, initially characterized by increased sulfur dioxide emissions, followed by elevated surface temperatures. A small melt pit was forming in the glacier above the flank vent. At 0513 on 4 March infrasound sensors recorded a small explosion and subsequent continuous low-level ash emissions, prompting AVO to raise the ACC to Orange and the VAL to Watch. A low-level ash plume rose to an altitude less than 3 km and drifted SSE was visible in satellite and webcam images; minor ash deposits were visible at the summit. Weak emissions continued at least through 1048 that day. On 5 March sulfur dioxide emissions were visible in a webcam image.
Numerous small explosions were recorded during 6-7 March, some of which were heard and felt by residents in Perryville (35 km SE). Elevated surface temperatures were identified in satellite images, suggesting lava was at or near the surface. During clear weather days, low-level gas-and-ash plumes were visible in satellite and webcam data and observed by pilots. The plumes mainly stayed below an altitude of 3 km, but at times rose as high as 4.6 km and drifted 150 km NE. On 7 March satellite images showed that the emissions originated from a small cone in the summit caldera (figure 35). Additionally, lava was likely effusing under the intra-caldera glacier in an area on the flank about 1 km E of the summit. This area produced incandescence and strongly elevated surface temperatures, as well as a small gas-and-steam plume. During 8-9 March satellite images showed that a small gas-rich plume rose to 4.6 km altitude that extended about 10 km NE.
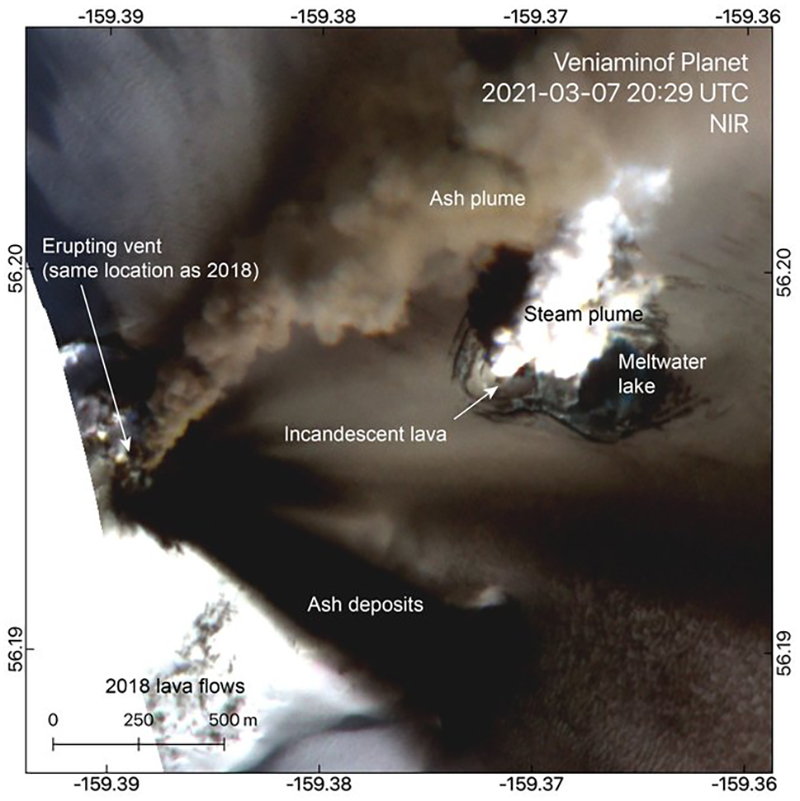 |
Figure 35. High-resolution satellite image of Veniaminof taken on 7 March 2021, showing an ash plume from the erupting vent near the summit and a steam plume from the lava-heated meltwater lake about 1 km E. Tephra was deposited at least 22 km SE and 14 km NE. Image by Hannah Dietterich; courtesy of AVO. |
Explosions during 9-10 March, as detected on geophysical networks, produced ash emissions that rose to an altitude of 2.1-3 km and drifted 200 km NE and SE (figure 36). Ash deposits on the snow were observed up to 20 km from the vent, and gas-and-steam plumes from both vents were visible from the air on 11 March (figure 37). Explosions and ash emissions declined to lower levels after these events, though new ash deposits within the caldera extending as far as 10 km SE were sometimes identified in satellite images. Lava continued to effuse under the intra-caldera glacier in an area on the flank about 1 km E of the cone’s summit. Elevated surface temperatures over this area were identified in infrared satellite data during most days, along with gas-and-steam plumes and a broadening collapse pit in the ice. Data from local seismic stations were back online by 12 March and showed elevated seismicity and tremor through 15 March. During 15-16 March gas-and-steam and-ash plumes were again identified in satellite images.
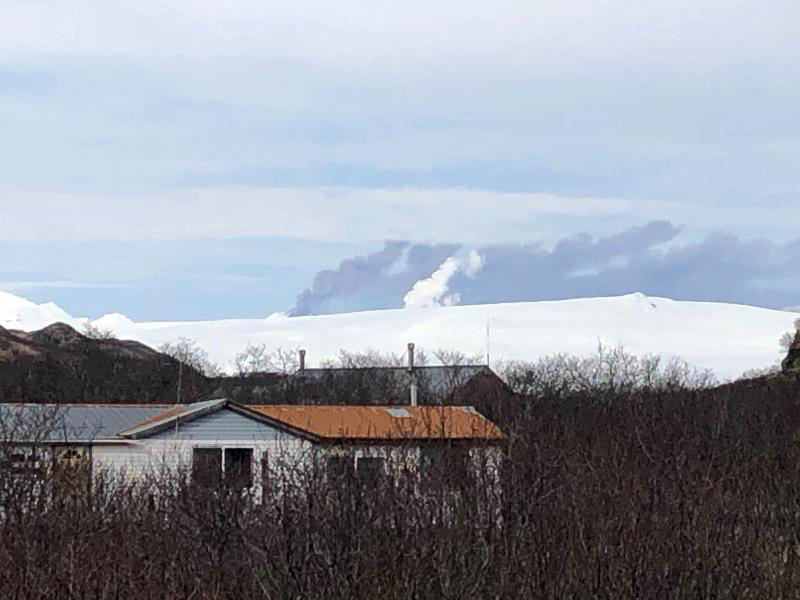 |
Figure 36. White gas-and-steam and ash emissions from Veniaminof, as viewed from Perryville (35 km SE) on 9 March 2021. Photo by Austin Shangin; courtesy of AVO. |
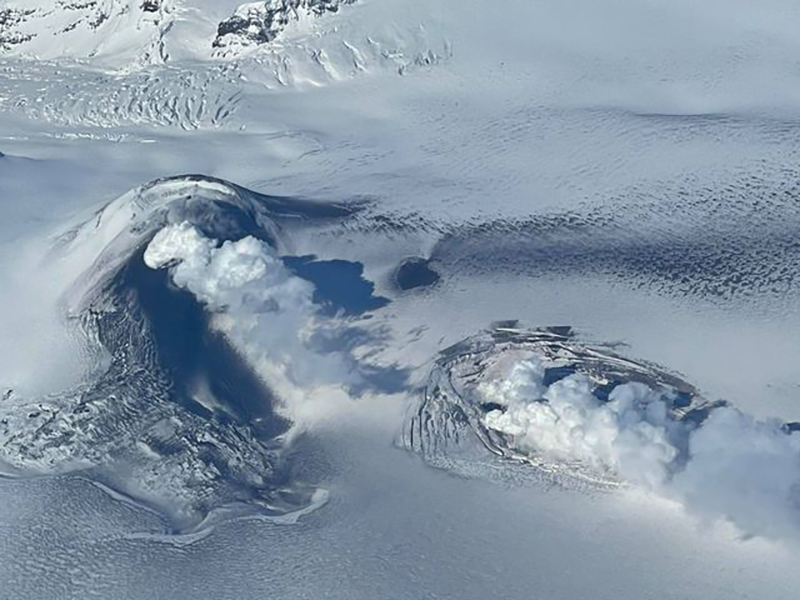 |
Figure 37. Photo of Veniaminof from an ACE Air flight taken on 11 March 2021 at 1330. Ash deposits (dark gray) and white gas-and-steam emissions were visible. Photo by Ben David Jacob; courtesy of AVO. |
Similar activity continued during 17-23 March. Low surface temperatures were visible in satellite images, along with gas-and-steam plumes; low-level tremor was recorded in local seismic data. During the morning of 21 March small explosions were identified using seismic data and infrasound sensors in Chignik Lagoon (55 km NE). A gas plume drifted SE at an altitude of 1.5 km. Weak explosions were detected again during 22-23 March (figure 38). Sulfur dioxide plumes were also identified in satellite data. Minor ash emissions rose hundreds of meters and rapidly dissipated, though on 23 March a pilot saw an ash plume rise to an altitude of 3 km. Satellite data during 22-23 March showed highly elevated surface temperatures and subsidence of the glacial ice over the flank vent where lava was discharging. Highly elevated surface temperatures were detected by the MODVOLC Thermal Alert System and in infrared satellite images, along with ash deposits on 23 March that were primarily confined to the summit and upper flanks; low-level tremor was also recorded.
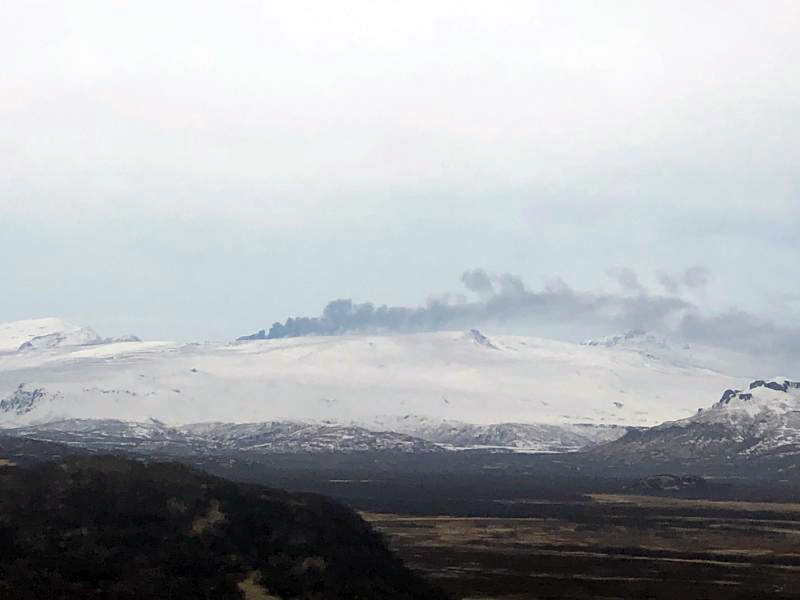 |
Figure 38. Ash emissions from Veniaminof as viewed from Perryville on 23 March 2021. Photo by Austin Shangin; courtesy of AVO. |
During 24 March explosions were recorded in local seismic data and with infrasound sensors; frequent explosive booming sounds (several per minute) were reported by residents in Perryville and Chignik Lagoon. Cloud cover prevented visual confirmation during this period of increased seismicity. On 25 March fresh ash deposits extending 10 km SE were observed on the summit caldera in satellite images. Satellite data also showed highly elevated surface temperatures at the summit and flank vent during clear weather days on 25, 28, and 29 March. Discrete, short-lived ash emissions were detected during the afternoon and evening of 27 March in images from the FAA webcam in Perryville. The intermittent events lasted several minutes and produced small ash clouds that rose less than 300 m above the vent and drifted SE. On 5 April low-level ash emissions were recorded by the webcam, resulting in tephra deposits to the SE. Eruptive and seismic activity declined after 5 April with no further reports through the end of the month.
Hotspots in March were observed on 10, 13, 15, 17, 22, 23, and 28 March, and were especially prominent on 23 March. No MODIS thermal anomalies were recorded by MODVOLC after 24 December 2018 until 10 March 2021, and none were recorded in April 2021. MIROVA (Middle InfraRed Observation of Volcanic Activity) analysis of MODIS satellite data showed a cluster of weak-to-moderate thermal anomalies during March 2021; three anomalies were detected during December 2020 and two during late January 2021 (figure 39). Sentinel-2 infrared satellite imagery showed a strong gray ash plume drifting NE on 9 March, accompanied by a weak thermal anomaly; thermal anomalies associated with both vents were clearly visible on 21 and 24 March (figure 40). AVO reported on 29 March that elevated surface temperatures were observed in overnight satellite images, which suggested that lava effusion was occurring from a flank vent into the caldera ice sheet. This activity continued to be reported through 3 April, though it was not reported that lava breached the surface. A weak thermal anomaly was visible on 30 April.
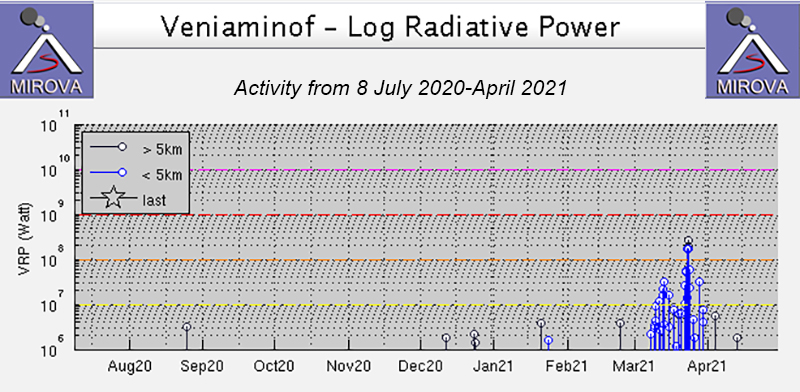 |
Figure 39. Plot showing a cluster of weak-to-moderate thermal anomalies at Veniaminof identified using MODIS data by the MIROVA system (Log Radiative Power) during 8 July 2020 through April 2021. Hotspots were concentrated in March 2021, many reaching a moderate to high range of thermal activity. Three weak anomalies were detected during December 2020 and two during late January 2021. Courtesy of MIROVA. |
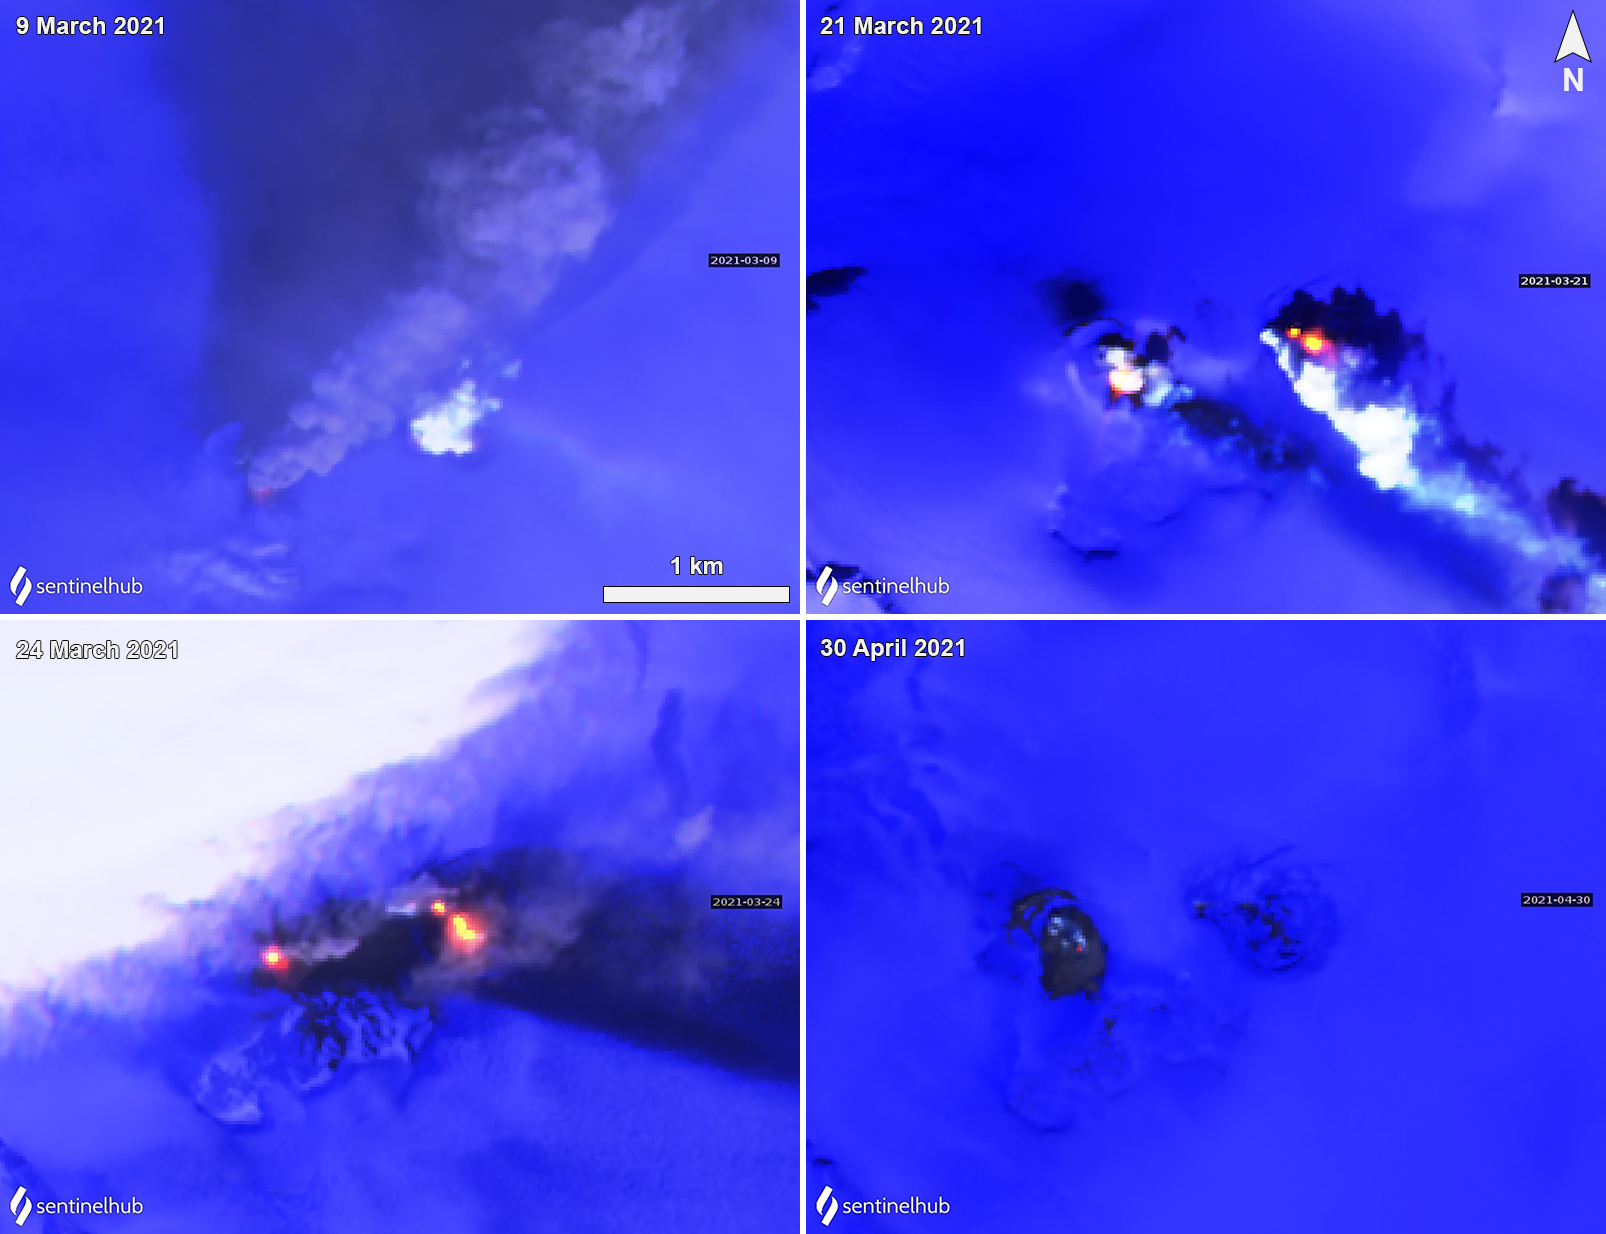 |
Figure 40. Sentinel-2 infrared satellite imagery showed a strong ash plume drifting NE from Veniaminof on 9 March 2021 (top left). Thermal anomalies were also visible in the summit crater on 21 and 24 March (top right and bottom left), which had decreased visibly by 30 April (bottom right). Sentinel-2 satellite images with “Atmospheric penetration” (bands 12, 11, 8A) rendering. Courtesy of Sentinel Hub Playground. |
Information Contacts: Alaska Volcano Observatory (AVO), a cooperative program of a) U.S. Geological Survey, 4200 University Drive, Anchorage, AK 99508-4667 USA (URL: https://avo.alaska.edu/), b) Geophysical Institute, University of Alaska, PO Box 757320, Fairbanks, AK 99775-7320, USA, and c) Alaska Division of Geological & Geophysical Surveys, 3354 College Rd., Fairbanks, AK 99709, USA (URL: http://dggs.alaska.gov/); Hawai'i Institute of Geophysics and Planetology (HIGP) - MODVOLC Thermal Alerts System, School of Ocean and Earth Science and Technology (SOEST), Univ. of Hawai'i, 2525 Correa Road, Honolulu, HI 96822, USA (URL: http://modis.higp.hawaii.edu/); MIROVA (Middle InfraRed Observation of Volcanic Activity), a collaborative project between the Universities of Turin and Florence (Italy) supported by the Centre for Volcanic Risk of the Italian Civil Protection Department (URL: http://www.mirovaweb.it/); Sentinel Hub Playground (URL: https://www.sentinel-hub.com/explore/sentinel-playground).
2021: January
| March
| April
| May
| July
2020: June
2019: April
| July
| August
2018: August
| September
| October
| November
| December
2015: September
| October
2013: June
| July
| August
| September
| October
2009: May
2008: February
| April
2006: March
| April
2005: January
| February
| March
| September
| November
2004: February
| April
| May
| June
| July
| August
| September
| October
| December
2003: January
| February
| March
| April
2002: September
| October
| November
| December
AVO changed both the Aviation Color Code and Volcano Alert Level for Veniaminof to Green and Normal, respectively, on 8 July, noting that seismic stations were back online. The monitoring network consists of local and regional seismic stations, regional infrasound networks, lightning detection, and satellite image monitoring.
Source: US Geological Survey Alaska Volcano Observatory (AVO)
No eruptive activity at Veniaminof had been recorded in seismic or infrasound data since early April. On 12 May AVO changed both the Aviation Color Code and Volcano Alert Level to Unassigned, noting that several seismic station outages impeded the ability to detect seismic unrest at the volcano. Monitoring was ongoing based on the utilization of the remaining seismic stations, the regional infrasound networks, the detection of lightning, and satellite image monitoring.
Source: US Geological Survey Alaska Volcano Observatory (AVO)
AVO reported that eruptive activity at Veniaminof had declined during the previous few weeks; no emissions were visible after ash emissions on 5 April and seismicity continued to decline. On 21 April the Volcano Alert Level was lowered to Advisory and the Aviation Color Code was lowered to Yellow.
Source: US Geological Survey Alaska Volcano Observatory (AVO)
AVO reported that during 31 March-1 April clear satellite and web camera images of Veniaminof showed no signs of emissions. On 2 April the Volcano Alert Level was lowered to Advisory and the Aviation Color Code was lowered to Yellow. Satellite data showed elevated surface temperatures, especially over the flank-vent lava flows through 4 April. Low-level ash emissions were recorded by the webcam on 5 April, prompting AVO to raise the Volcano Alert Level and Aviation Color Code to Watch and Orange, respectively. Tephra deposits were visible to the SE.
Source: US Geological Survey Alaska Volcano Observatory (AVO)
AVO reported that eruptive activity at Veniaminof continued during 24-25 and 27-30 March. Highly elevated surface temperatures were visible in satellite images along with ash deposits that were primarily confined to the summit and upper flanks on 23 March. Low-level tremor was recorded in local seismic data. During 24 March explosions were recorded in local seismic data and in infrasound data sensors; frequent explosive booming (several per minute) was reported by residents in Perryville (35 km SE) and Chignik Lagoon (55 km NE). Cloud cover prevented visual confirmation during this period of increased seismicity. Fresh ash deposits extending 10 km SE in the summit caldera were observed in satellite data on 25 March. Satellite data also showed highly elevated surface temperatures at the summit and flank vent during clear weather days on 25, 28, and 29 March. Discrete, short-lived ash emissions were detected during the afternoon and evening of 27 March in images from the FAA webcam in Perryville. The intermittent events lasted several minutes and produced small ash clouds that rose less than 300 m (1,000 ft) above the vent and drifted SE, which may have resulted in trace ashfall in Perryville, though there was no confirmed evidence. The Volcano Alert Level remained at Watch and the Aviation Color Code remained at Orange.
Source: US Geological Survey Alaska Volcano Observatory (AVO)
AVO reported that the eruption at Veniaminof continued during 17-23 March. Low surface temperatures were visible in satellite images along with steam-and-gas plumes. Low-level tremor was recorded in local seismic data. During the morning of 21 March small explosions were identified using seismic data and infrasound sensors in Chignik Lagoon. A volcanic gas cloud drifted SE at or below 1.5 km (5,000 ft) a.s.l. Small explosions were detected again during 21-23 March. Sulfur dioxide plumes were identified in satellite data. Minor ash emissions rose hundreds of meters and rapidly dissipated, though on 23 March a pilot saw an ash plume rise to 3 km (10,000 ft) a.s.l. Satellite data during 22-23 March showed highly elevated surface temperatures and subsidence of the glacial ice over the flank vent where lava was erupting. The Volcano Alert Level remained at Watch and the Aviation Color Code remained at Orange.
Source: US Geological Survey Alaska Volcano Observatory (AVO)
AVO reported that the eruption at Veniaminof continued during 9-16 March. Ash emissions rose to 2.1-3 km (7,000-10,000 ft) a.s.l. and drifted 200 km NE and SE during 9-10 March. Explosions and ash emissions declined to lower levels the rest of the week, though new ash deposits within the caldera, and as far as 10 km SE, were sometimes identified in satellite images. Lava continued to effuse under the intra-caldera glacier in an area on the flank about 1 km E of the cone’s summit. Elevated surface temperatures over this area were identified in a satellite images during most days, along with steam plumes and a broadening collapse pit in the ice from melting around the eruption site. Data from local seismic stations were back online by 12 March and showed elevated seismicity and tremor through 15 March. Steam-and-has plumes were identified in satellite images during 15-16 March. The Volcano Alert Level remained at Watch and the Aviation Color Code remained at Orange.
Source: US Geological Survey Alaska Volcano Observatory (AVO)
AVO reported that elevated sulfur dioxide gas emissions at Veniaminof were first detected on 1 March and elevated surface temperatures were identified in satellite images sometime during 2-3 March. At 0513 on 4 March infrasound sensors recorded a small explosion, prompting AVO to raise the Volcano Alert Level to Watch and the Aviation Color Code to Orange. A low-level ash plume, to less than 3 km (10,000 ft) a.s.l., was visible in satellite and webcam images drifting SSE and minor ash deposits around the volcano were visible. Small emissions continued at least through 1048 that day. Sulfur dioxide emissions were visible in a webcam image on 5 March. Numerous small explosions were recorded during 6-7 March; some of them were heard and felt by residents in Perryville (35 km SE). Elevated surface temperatures were identified in satellite images, suggesting lava near or at the surface. During times of clear weather low-level gas-and-ash plumes were visible in satellite and webcam data and observed by pilots. The plumes mainly stayed below 3 km (10,000 ft) a.s.l., but at times went as high as 4.6 km (15,000 ft) a.s.l., and drifted 150 km NE.
On 7 March satellite images revealed that the emissions originated from a small cone in the summit caldera. Additionally, lava was likely effusing under the intra-caldera glacier in an area on the flank about 1 km E of the cone’s summit. This area produced incandescence and strongly elevated surface temperatures, as well as a small steam plume and meltwater. During 8-9 March satellite images showed a small, steam-rich plume drifting about 10 km NE at 4.6 km (15,000 ft) a.s.l.
Source: US Geological Survey Alaska Volcano Observatory (AVO)
AVO reported that seismic data for Veniaminof had not been received since 8 December 2020 due to a problem with the satellite link at Port Heiden. Both the Aviation Color Code and the Volcano Alert Level were changed to Unassigned on 15 January, reflecting the lack of available seismic data to detect unrest.
Source: US Geological Survey Alaska Volcano Observatory (AVO)
On 18 June AVO stated that periods of seismic tremor and occasional earthquakes had been recorded at Veniaminof over the past few days. The increase above background levels prompted AVO to raise the Volcano Alert Level to Advisory and the Aviation Color Code to Yellow. Periods of low-amplitude seismic tremor decreased in frequency during 19-20 June, and were not detected at all by 21 June.
Source: US Geological Survey Alaska Volcano Observatory (AVO)
AVO lowered the Volcano Alert Level to Normal for Veniaminof and the Aviation Color Code to Green on 25 August, noting that the volcano returned to background activity after low-level tremor was detected and a pilot saw steaming on 1 August.
Source: US Geological Survey Alaska Volcano Observatory (AVO)
AVO reported that seismic unrest at Veniaminof continued during 7-13 August with low-frequency earthquakes being common. Satellite and webcam views showed nothing unusual. The Volcano Alert Level remained at Advisory and the Aviation Color Code remained at Yellow.
Source: US Geological Survey Alaska Volcano Observatory (AVO)
Low-level tremor at Veniaminof coincided with a pilot observation of a steam plume at 1230 on 1 August, prompting AVO to raise the Aviation Color Code to Yellow and the Volcano Alert Level to Advisory. On 2 August AVO noted that tremor had subsided, though low-level seismicity persisted at least through 6 August. Elevated surface temperatures were visible in satellite images. A small steam plume was also visible on 3 August.
Source: US Geological Survey Alaska Volcano Observatory (AVO)
On 30 April AVO lowered the Aviation Color Code for Veniaminof to Green and the Volcano Alert Level to Normal, noting that signs of unrest had continued to decline over the previous four months since the eruption ended in early January. Low-level tremor, slightly elevated surface temperatures, and minor steam emissions continued and considered typical activity for a post-eruptive period.
Source: US Geological Survey Alaska Volcano Observatory (AVO)
AVO reported that seismic data indicated that the eruption of lava from the cone in Veniaminof’s ice-filled summit caldera possibly paused on 6 December. Satellite data acquired on 10 December suggested lava effusion had stopped, though weak explosive activity from the vent possibly still occurred. No eruptive activity was evident in satellite and webcam images on the morning of 13 December. However, beginning in the afternoon intermittent tremor appeared and gradually became continuous. A plume, possibly containing ash, and elevated surface temperatures were identified in satellite and webcam images. A strong thermal anomaly was visible in satellite and webcam data during 14-15 December, and together with an eruption plume, was consistent with lava fountaining at the summit vent. By 16 December a lava flow was erupting from the vent. The Aviation Color Code remained at Orange (the second highest level on a four-color scale) and the Volcano Alert Level remained at Watch (the second highest level on a four-level scale).
Source: US Geological Survey Alaska Volcano Observatory (AVO)
AVO reported that on 2 December satellite data revealed that a third lobe of lava from the cone in Veniaminof’s ice-filled summit caldera had traveled a short distance down the SE flank of the cone. All three lobes produced sometimes voluminous steam plumes due to their interaction with the ice and snow. The eruption of lava continued during 4-5 December. Satellite and webcam data showed elevated surface temperatures. Steam plumes with possible diffuse ash were periodically identified in webcam and satellite images. On 6 December seismicity changed from nearly continuous, low-level volcanic tremor to intermittent, small, low-frequency events and short bursts of tremor, possibly indicating that lava effusion had slowed or stopped. Variable seismicity continued through 12 December, though there was no visual confirmation of lava effusion. The Aviation Color Code remained at Orange (the second highest level on a four-color scale) and the Volcano Alert Level remained at Watch (the second highest level on a four-level scale).
Source: US Geological Survey Alaska Volcano Observatory (AVO)
AVO reported that the eruption of lava from the cone in Veniaminof’s ice-filled summit caldera continued during 27 November-3 December. Satellite and webcam data showed elevated surface temperatures. Steam and diffuse ash plumes were periodically identified in webcam and satellite images. During 27-28 November acoustic waves were recorded by regional infrasound sensors. Continuous low-amplitude tremor was recorded until the network went offline following a M 7 tectonic earthquake near Anchorage on 30 November. The Aviation Color Code remained at Orange (the second highest level on a four-color scale) and the Volcano Alert Level remained at Watch (the second highest level on a four-level scale).
Source: US Geological Survey Alaska Volcano Observatory (AVO)
Ash emissions from the cone in Veniaminof’s ice-filled summit caldera significantly increased overnight during 20-21 November, prompting AVO to raise the Aviation Color Code to Red and the Volcano Alert Level to Warning (the highest levels on four-level scales). Ash emissions rose to below 4.6 km (15,000 ft) a.s.l. and drifted more than 240 km SE. On 21 November observers and webcam views in Perryville (35 km SE) indicated continuous ash emissions through most of the day; ash plumes drifted SE, extending as far as 400 km by around 1445. A short eruptive pulse was recorded during 1526-1726, and then afterwards ash plumes rose to below 3 km (10,000 ft) a.s.l. Low-altitude ash emissions on 22 November drifted 100 km S. Minor ashfall was reported in Perryville. AVO lowered the Aviation Color Code and Volcano Alert Level to Orange and Watch, respectively, because of decreased ash emissions. Elevated thermal anomalies were identified in satellite data overnight, and incandescence was visible from a Perryville webcam, suggesting continuing lava effusion which had been obscured by the increased period of ash emissions. Lava effusion was persistent through 27 November.
Source: US Geological Survey Alaska Volcano Observatory (AVO)
AVO reported that the eruption from the cone in Veniaminof’s ice-filled summit caldera, continued at low levels during 14-20 November. Satellite and webcam data showed elevated surface temperatures from minor lava spattering and lava effusion. Relatively continuous low-amplitude tremor was recorded. Steam and diffuse ash plumes were periodically identified in webcam and satellite images; plumes rose as high as 4.9 km (16,000 ft) a.s.l. on 16 November. Recent satellite data showed that the lava flows had traveled as far as 1.2 km from the vent. Fractures in the ice sheet adjacent to the lava flow continued to grow due to meltwater flowing beneath the ice sheet. The Aviation Color Code remained at Orange (the second highest level on a four-color scale) and the Volcano Alert Level remained at Watch (the second highest level on a four-level scale).
Source: US Geological Survey Alaska Volcano Observatory (AVO)
AVO reported that the eruption from the cone in Veniaminof’s ice-filled summit caldera, continued at low levels during 7-13 November. Satellite and webcam data showed elevated surface temperatures from minor lava spattering and lava effusion. Continuous low-amplitude tremor was recorded. Steam and diffuse ash plumes periodically identified in webcam and satellite images rose as high as 3 km (10,000 ft) a.s.l. and drifted S and W. Recent satellite data showed that the lava flows had traveled as far as 1.2 km from the vent. Fractures in the ice sheet adjacent to the lava flow continued to grow due to meltwater flowing beneath the ice sheet. The Aviation Color Code remained at Orange (the second highest level on a four-color scale) and the Volcano Alert Level remained at Watch (the second highest level on a four-level scale).
Source: US Geological Survey Alaska Volcano Observatory (AVO)
AVO reported that the eruption from the cone in Veniaminof’s ice-filled summit caldera, continued during 31 October-6 November. Satellite data showed elevated surface temperatures from minor lava spattering and flows. Low-amplitude continuous tremor was recorded. The webcam in Perryville, 35 km SE, periodically recorded diffuse ash emissions and incandescence from the cone. Based on a pilot observation and satellite data, a diffuse ash plume rose to 4.3 km (14,000 ft) a.s.l. and drifted E on 5 November. The Aviation Color Code remained at Orange (the second highest level on a four-color scale) and the Volcano Alert Level remained at Watch (the second highest level on a four-level scale).
Source: US Geological Survey Alaska Volcano Observatory (AVO)
AVO reported that the eruption from the cone in Veniaminof’s ice-filled summit caldera, continued during 24-30 October. Satellite data showed elevated surface temperatures from minor lava fountaining and flows. Low-amplitude continuous tremor was detected. The webcam in Perryville, 35 km SE, periodically recorded diffuse ash emissions that often rapidly dissipated; minor ashfall was recorded in Perryville on 25 October. Based on satellite data acquired on 25 October the lava flows had traveled as far as 1.2 km from the vent, and the area of the flow field had doubled in the past month. Fractures in the ice sheet adjacent to the lava flow continued to grow due to meltwater flowing beneath the ice sheet. The Aviation Color Code remained at Orange (the second highest level on a four-color scale) and the Volcano Alert Level remained at Watch (the second highest level on a four-level scale).
Source: US Geological Survey Alaska Volcano Observatory (AVO)
AVO reported that the eruption at Veniaminof continued during 10-16 October, as evidenced by elevated surface temperatures from lava fountains and flows visible in satellite and webcam data, and low-level continuous tremor. Satellite data indicated that the W part of the S-flank flow field was active. A persistent steam plume, visible in webcam views, also contained sulfur dioxide and possible ash. The plume was particularly robust on 18 October, drifting 30 km NE; plumes drifted NE on 19 October and S the next morning. The Aviation Color Code remained at Orange and the Volcano Alert Level remained at Watch.
Source: US Geological Survey Alaska Volcano Observatory (AVO)
AVO reported that the eruption at Veniaminof continued during 10-16 October, as evidenced by elevated surface temperatures in satellite data, and low-level continuous tremor. Satellite data indicated that the E part of the S-flank flow field remained active. The Aviation Color Code remained at Orange and the Volcano Alert Level remained at Watch.
Source: US Geological Survey Alaska Volcano Observatory (AVO)
AVO reported that the eruption at Veniaminof continued during 3-9 October based on periodic incandescence recorded by the FAA web camera in Perryville (35 km S), elevated surface temperatures in thermal satellite data, and elevated tremor levels. Minor steam-and-ash plumes were sometimes visible during clear daytime conditions. The Aviation Color Code remained at Orange and the Volcano Alert Level remained at Watch.
Source: US Geological Survey Alaska Volcano Observatory (AVO)
AVO reported that the eruption at Veniaminof continued during 26 September-2 October, as evidenced by nighttime incandescence recorded by the FAA web camera in Perryville (35 km S), elevated surface temperatures in thermal satellite data, and elevated tremor levels. A gas plume was occasionally visible during clear daytime conditions. On 26 September lava fountains, visible in webcam images, rose from a second vent located 75 m N of the vent producing lava flows. Minor ash emissions associated with lava fountaining possibly rose as high as km (15,000 ft) a.s.l. and quickly dispersed. The lava flow had traveled 1 km down the S flank of the summit cone by 1 October. The Aviation Color Code remained at Orange and the Volcano Alert Level remained at Watch.
Source: US Geological Survey Alaska Volcano Observatory (AVO)
AVO reported that the eruption at Veniaminof continued during 19-25 September, as evidenced by nighttime incandescence recorded by the FAA web camera in Perryville (35 km S), elevated surface temperatures in thermal satellite data, and elevated seismic activity. A gas plume was occasionally visible during clear daytime conditions. A lava flow had traveled 800 m down the S flank of the summit cone by 14 September, though satellite images from 18 September indicated no further advancement. The Aviation Color Code remained at Orange and the Volcano Alert Level remained at Watch.
Source: US Geological Survey Alaska Volcano Observatory (AVO)
AVO reported that the eruption at Veniaminof continued during 12-18 September. A lava flow had traveled 800 m down the S flank of the summit cone by 14 September, remaining confined to the ice-filled summit caldera. A webcam in Perryville (35 km S) recorded nighttime incandescence, and sporadic gas emissions in the day during clear conditions. Elevated surface temperatures were identified in satellite images, and seismicity remained elevated. The Aviation Color Code remained at Orange and the Volcano Alert Level remained at Watch.
Source: US Geological Survey Alaska Volcano Observatory (AVO)
On 4 September low-level ash emissions (less than 3 km or 10,000 ft a.s.l.) from Veniaminof were evident in webcam images and confirmed by observers in Perryville (35 km S), prompting AVO to raise the Aviation Color Code to Orange and the Volcano Alert Level to Watch. Seismicity was elevated. During 4-6 September pulsating, low-altitude ash plumes were visible from a Perryville webcam and reported by a pilot, and a small thermal anomaly was visible in satellite data. On 7 September the thermal signal increased, suggesting lava fountaining at the summit. Webcam images the next day showed minor ash or steam near the summit cone. Ash deposits on the snowfield formed a “V” shape from the summit, extending to the SSW and SE. On 9 September a lava flow, about 800 m long, was identified on the S flank in satellite data. Witnesses aboard a ferry passing Veniaminof early the next morning noted lava fountaining and an active lava flow. Lava flows continued on 11 September, though were confined to the summit caldera.
Source: US Geological Survey Alaska Volcano Observatory (AVO)
Late on 2 September seismic activity at Veniaminof increased, indicative of unrest, prompting AVO to raise the Aviation Color Code to Yellow and the Volcano Alert Level to Advisory. The report noted no other signs of eruptive activity.
Source: US Geological Survey Alaska Volcano Observatory (AVO)
AVO reported that slightly elevated levels of seismicity continued to be detected at Veniaminof during 7-13 October. Minor steam emissions were recorded by the webcam on 7 October. The Aviation Color Code remained at Yellow and the Volcano Alert Level remained at Advisory.
Source: US Geological Survey Alaska Volcano Observatory (AVO)
Volcanic tremor at Veniaminof increased during 30 September-1 October, prompting AVO to raise the Aviation Color Code to Yellow and the Volcano Alert Level to Advisory. Slightly elevated levels of seismicity continued through at least 6 October.
Source: US Geological Survey Alaska Volcano Observatory (AVO)
Lava effusion from Veniaminof's intracaldera cone resumed on 6 October, prompting AVO to raise the Volcano Alert Level to Watch and the Aviation Color code to Orange.
On 17 October AVO noted that seismicity had decreased during the previous week and satellite observations during periods of clear weather showed no evidence of eruptive activity. The Aviation Color Code was lowered to Yellow and the Volcano Alert Level was lowered to Advisory. Seismicity remained above background levels during 17-22 October.
Source: US Geological Survey Alaska Volcano Observatory (AVO)
On 20 September AVO reported that, based on a decrease in seismicity at Veniaminof and no eruptive activity observed by satellite or the web camera over the previous week, the Aviation Color Code was lowered to Yellow and the Volcano Alert Level was lowered to Advisory. Low-level seismic tremor continued during 21-24 September.
Source: US Geological Survey Alaska Volcano Observatory (AVO)
AVO reported continuous seismic tremor at Veniaminof during 11-17 September, and elevated surface temperatures detected in satellite images that were consistent with lava effusion and fountaining. On 11 September a diffuse steam plume possibly containing ash was recorded by the web cam in Perryville, 32 km SSE. Weak thermal anomalies and decreased levels of tremor during 14-16 September possibly indicated ongoing but diminished lava effusion. No unusual or eruptive activity was observed in web cam images through 17 September. The Volcano Alert Level remained at Watch and the Aviation Color code remained at Orange.
Source: US Geological Survey Alaska Volcano Observatory (AVO)
AVO reported continuous seismic tremor at Veniaminof during 4-10 September, and elevated surface temperatures detected in satellite images consistent with lava effusion and fountaining. Cloud cover sometimes prevented web cam views (from Perryville, 32 km SSE) of the intracaldera cone, although on 4 September a diffuse ash plume was observed rising several hundred feet above the cone and drifting E. On 7 September the web cam recorded a plume more steam-rich than in recent days. No ash emissions were visible in web cam images on 10 September. The Volcano Alert Level remained at Watch and the Aviation Color code remained at Orange.
Source: US Geological Survey Alaska Volcano Observatory (AVO)
AVO reported that during 27-29 August seismicity at Veniaminof was characterized by discreet episodic tremor bursts, likely associated with lava effusion and minor ash emissions. Satellite images detected prominent thermal anomalies at the intracaldera cone. Activity increased on 30 August and was some of the strongest detected since the eruption began in early June; intense seismicity, lava fountaining, and ash emissions to 4.6-6.1 km (15,000-20,000 ft) a.s.l. were observed. Ash plumes drifted SE and caused ashfall in areas downwind including Perryville (32 km SSE). Elevated and continuous tremor persisted during 31 August-3 September; cloud cover and fog obscured web-cam and satellite views. The Volcano Alert Level remained at Watch and the Aviation Color code remained at Orange.
Source: US Geological Survey Alaska Volcano Observatory (AVO)
AVO reported that on 20 August residents of Perryville (32 km SSE) reported hearing loud explosions coming from Veniaminof, and air waves were detected by infrasound equipment in Dillingham (322 km NE). Trace amounts of ash fell in Perryville. During 20-21 August seismic activity at Veniaminof decreased; seismicity became more episodic and fluctuated between periods of relative quiet and short periods of low-level, nearly continuous tremor. Minor ash-and-steam emissions likely continued, but effusion of lava may have slowed down or possibly stopped. Elevated surface temperatures at the cone were observed in satellite data.
Seismicity during 22-26 August remained low; small ash bursts were probably produced during short periods of elevated tremor. During 23-26 August satellite data showed weak thermal anomalies at the intracaldera cone and very minor ash emissions were occasionally observed in web camera views from Perryville. During 26-27 August seismicity was characterized by nearly continuous, gradually fluctuating tremor possibly indicative of low-level ash emission and probable lava effusion. Satellite images detected a thermal signal at the intracaldera cone. Web camera views from Perryville showed a slightly more robust ash plume, extending ESE beyond the caldera rim. The Volcano Alert Level remained at Watch and the Aviation Color code remained at Orange.
Source: US Geological Survey Alaska Volcano Observatory (AVO)
AVO reported that during 13-15 August seismic tremor at Veniaminof was high, and persistent elevated surface temperatures consistent with lava effusion were visible on satellite imagery. During 16-17 August the high levels of tremor became sustained; seismicity remained high through 20 August. Very high surface temperatures were detected in images during 16-17 August; only weak thermal signals were evident through the cloud cover in satellite data during 17-18 August. Clear views on 18 August from the FAA web-camera in Perryville (32 km SSE) showed minor ash emissions. During a helicopter overflight on 19 August geologists observed two active lava flows from the cone, and lava flowing passively over ice at the foot of the cone. Elevated surface temperatures were detected in satellite data during 19-20 August. Clear web-camera views showed minor ash emissions rising to an altitude of 3.7 (12,000 ft) a.s.l. and drifting W and then SSE, just past the caldera rim. The Volcano Alert Level remained at Watch and the Aviation Color code remained at Orange.
Source: US Geological Survey Alaska Volcano Observatory (AVO)
AVO reported that during 7-11 August seismicity at Veniaminof remained above background levels. Cloud cover obscured views of the cinder cone inside the caldera during 7-8 August. Slightly elevated surface temperatures, consistent with cooling lava flows, were detected in partly cloudy satellite images during 9-10 August. On 11 August cloud cover prevented satellite image views, and web-camera views showed nothing significant. During 11-12 August seismic tremor increased and persistent elevated surface temperatures, consistent with lava effusion, were visible in satellite imagery. The web camera in Perryville (32 km SSE) recorded intermittent steam-and-ash plumes; one on 12 August rose 3.7 km (12,000 ft) a.s.l. and drifted W. Seismic tremor has remained high on 13 August. The Volcano Alert Level remained at Watch and the Aviation Color code remained at Orange.
Source: US Geological Survey Alaska Volcano Observatory (AVO)
AVO reported that the ongoing low-level eruption of Veniaminof, characterized by lava effusion and emissions of minor amounts of ash and steam, continued during 31 July-6 August. Although seismic activity decreased during 31 July-2 August, it still remained above background levels, and small discrete events continued to be detected. Cloud cover prevented satellite image and web-camera views. The Volcano Alert Level remained at Watch and the Aviation Color code remained at Orange.
Source: US Geological Survey Alaska Volcano Observatory (AVO)
AVO reported that the ongoing low-level eruption of Veniaminof, characterized by lava effusion and emissions of minor amounts of ash and steam, continued during 24-30 July, indicated by fluctuating volcanic tremor and occasional small explosions detected by the seismic network. On most days satellite images showed elevated surface temperatures at the cinder cone inside the caldera consistent with lava effusion. On 25 July a pilot reported an ash plume that rose 60-100 m above the cone and drifted almost 25 km S, and a "river of lava" flowing down from the cone. On 27 July a pilot observed an ash emission that rose 300-600 m and drifted NW. A water-rich plume likely containing minor amounts of ash was detected in satellite images drifting NW at an altitude of 4.5 km (15,000 ft) a.s.l. on 29 July. The Volcano Alert Level remained at Watch and the Aviation Color code remained at Orange.
Source: US Geological Survey Alaska Volcano Observatory (AVO)
AVO reported that the ongoing low-level eruption of Veniaminof, characterized by lava effusion and emission of minor amounts of ash and steam, continued during 17-23 July, indicated by nearly continuous volcanic tremor and occasional small explosions detected by the seismic network. On most days satellite images showed elevated surface temperatures at the cinder cone inside the caldera consistent with lava effusion. The web camera in Perryville (32 km SSE) recorded nighttime incandescence and low-level ash-and-steam plumes during 22-23 July. The Volcano Alert Level remained at Watch and the Aviation Color code remained at Orange.
Source: US Geological Survey Alaska Volcano Observatory (AVO)
AVO reported that the ongoing low-level eruption of Veniaminof, characterized by lava effusion and emission of minor amounts of ash and steam, continued during 10-16 July, indicated by nearly continuous volcanic tremor and occasional small explosions detected by the seismic network. Satellite images showed elevated surface temperatures at the cinder cone inside the caldera consistent with lava effusion. Images also showed that most of the lava flows traveled S of the cone a short distance (hundreds of meters). The web camera in Perryville (32 km SSE) recorded very weak emissions of vapor, possibly containing minor amounts of ash, within the caldera during 9-10 July; incandescence from the cone was visible during 10-11 July. The Volcano Alert Level remained at Watch and the Aviation Color code remained at Orange.
Source: US Geological Survey Alaska Volcano Observatory (AVO)
AVO reported that the ongoing low-level eruption of Veniaminof, characterized by lava effusion and emission of minor amounts of ash and steam, continued during 3-9 July, indicated by nearly continuous volcanic tremor and occasional small explosions detected by the seismic network. Satellite images showed elevated surface temperatures at the cinder cone inside the caldera consistent with lava effusion most days. Images also showed that most of the lava flows traveled S of the cone a short distance (hundreds of meters). The web camera in Perryville (32 km SSE) recorded very weak emissions of vapor, possibly containing minor amounts of ash, within the caldera for several hours on 9 July. The Volcano Alert Level remained at Watch and the Aviation Color code remained at Orange.
Source: US Geological Survey Alaska Volcano Observatory (AVO)
AVO reported that the ongoing low-level eruption of Veniaminof, characterized by lava effusion and emission of minor amounts of ash and steam, continued during 26 June-2 July, indicated by nearly continuous volcanic tremor and occasional small explosions detected by the seismic network. Satellite images showed elevated surface temperatures at the cinder cone inside the caldera consistent with lava effusion. During 26-30 June web camera images from Perryville (32 km SSE) showed a small light-colored plume rising above the cone to just above the rim of the caldera, and night time images showed persistent incandescence from the cone. The Volcano Alert Level remained at Watch and the Aviation Color code remained at Orange.
Source: US Geological Survey Alaska Volcano Observatory (AVO)
AVO reported that the eruption of Veniaminof continued during 18-25 June, indicated by volcanic tremor detected by the seismic network. Cloudy weather sometimes prevented views of the caldera, although most days satellite images showed very high elevated surface temperatures at the cinder cone inside the caldera consistent with lava effusion. On 18 June small ash clouds that rose less than 4.6 km (15,000 ft) a.s.l. were intermittently observed in web-camera images. On 24 June satellite images detected elevated surface temperatures and a plume that drifted SW. The web camera recorded a small area of incandescence on the intracaldera cone. On 25 June the web camera showed a light-colored plume rising from the intracaldera cone to just above the caldera rim. The Volcano Alert Level remained at Watch and the Aviation Color code remained at Orange.
Source: US Geological Survey Alaska Volcano Observatory (AVO)
AVO reported that seismic tremor was detected at Veniaminof on 12 June. Elevated surface temperatures were detected in satellite images at 0525 on 13 June, likely indicating an intra-caldera eruption. In response, AVO raised the Volcano Alert Level to Watch and the Aviation Color code to Orange. Seismic tremor continued that day, indicative of low-level effusive activity and small explosions. At 2323 a pilot observed ash at an altitude of 3.7 km (12,000 ft) a.s.l. and a lava flow effusing from the intra-caldera cinder cone. Residents in Perryville (32 km SSE) and Port Moller (77 km WSW) also observed ash emissions at about 2330. During 15-18 June satellite images showed very high elevated surface temperatures at the intra-caldera cinder cone consistent with continued lava effusion. No plumes were observed in satellite images nor reported by pilots or local observers. Volcanic tremor continued to be detected.
Source: US Geological Survey Alaska Volcano Observatory (AVO)
On 8 June AVO reported that gradually increasing seismic tremor at Veniaminof had been detected during the previous two days. The Aviation Color Code was raised to Yellow and the Volcano Alert Level was raised to Advisory. Clear web-camera and satellite views showed nothing unusual at the volcano. During 8-10 June seismicity continued to increase and a persistent steam plume rose from the central cone within the caldera.
Source: US Geological Survey Alaska Volcano Observatory (AVO)
On 26 May, AVO reported that seismicity from Veniaminof had decreased during the previous week. The Volcanic Alert Level was lowered to Normal and the Aviation Color Code was lowered to Green.
Source: US Geological Survey Alaska Volcano Observatory (AVO)
During 6-7 May, seismic activity from Veniaminof increased, prompting AVO to raise the Volcanic Alert Level to Advisory and the Aviation Color Code to Yellow. Small magnitude earthquakes occurred at rates of 5-10 per hour during quieter periods and 1-3 per minute during periods of more intense activity. Visual observations indicated typical steaming from the summit caldera cone. Seismicity remained elevated during 8-12 May. Minor ash-producing explosions last occurred in March 2008.
Source: US Geological Survey Alaska Volcano Observatory (AVO)
AVO reported on 3 May that the Volcanic Alert Level for Veniaminof was lowered to Normal and the Aviation Color Code was lowered to Green due to the absence of ash emissions and elevated surface temperatures. Seismicity was still above past background levels, but the rate and intensity had declined over the previous several weeks.
Source: US Geological Survey Alaska Volcano Observatory (AVO)
AVO reported elevated seismic activity from Veniaminof during 27 February-4 March. Web camera views showed steaming from the cone and occasional small ash bursts that rose to 200 m above the crater on 27 February. During 28 February-3 March views were obscured by cloud cover; low-level steaming was seen on 29 February during a break in the weather.
Source: US Geological Survey Alaska Volcano Observatory (AVO)
AVO reported that on 22 February several minor ash bursts from Veniaminof were recorded by the seismic network and observed on web camera footage. The bursts rose to an altitude of below 2.7 km (9,000 ft) a.s.l. but fallout was confined to the crater. Sporadic increases in seismic activity were noted since 11 February, including tremor episodes that lasted 1-2 minutes and occurred several times per hour. The Aviation color code was raised to Yellow and the Alert Level was raised to Advisory. Steam plumes emitted from the intra-caldera cinder cone were seen on video footage during 23-25 February and seismic levels were elevated during 23-26 February.
Source: US Geological Survey Alaska Volcano Observatory (AVO)
During 7-14 April, seismicity at Veniaminof remained at low levels, but above background. Views of the volcano were obscured by clouds during the report period, and AVO received no information about ash clouds or activity at the volcano. The Concern Color Code remained at Yellow.
Source: US Geological Survey Alaska Volcano Observatory (AVO)
During 31 March to 7 April, low-altitude ash emissions occurred from Veniaminof and seismicity remained at low levels. On 6 April, a pilot reported an ash plume at a height of ~3 km (10,000 ft) a.s.l. The Concern Color Code remained at Yellow.
Source: US Geological Survey Alaska Volcano Observatory (AVO)
Web-camera images of Veniaminof on 24 March showed a steam-and-ash plume drifting from the summit cone at a height less than 2.3 km (7,600 ft) a.s.l. This level of activity was similar to activity on 23 March, but higher than activity on 21 and 22 March when a very diffuse steam-and-ash plume was confined to the summit caldera. The flow of seismic data from Veniaminof stopped on the evening of 21 March due to technical problems. The Concern Color Code remained at Yellow.
Source: US Geological Survey Alaska Volcano Observatory (AVO)
During 3-10 March, seismicity at Veniaminof was low but slightly above background. Clear web camera views on 9 March showed small diffuse ash plumes extending a short distance from the intracaldera cone. On 10 March, a pilot reported low-level ash emitted form the intracaldera cone. The Concern Color Code remained at Yellow.
Source: US Geological Survey Alaska Volcano Observatory (AVO)
The Concern Color Code at Veniaminof was increased from Green to Yellow on 3 March. That morning ash emissions rose a few hundred meters above the intracaldera cone, drifted E, and dissipated rapidly. Ashfall was expected to be minor and confined to the summit caldera. Seismicity was low and did not indicate that a significantly larger eruption was imminent. AVO expected that steam-and-ash emissions may continue intermittently for days to weeks and could pose a hazard to people and low-flying aircraft in the vicinity of the active cone.
Source: US Geological Survey Alaska Volcano Observatory (AVO)
The Concern Color Code at Veniaminof was increased on 4 November from Green to Yellow after a low-level minor ash emission occurred from the intracaldera cone beginning at 0929. Ash rose a few hundred meters above the cone, drifted E, and dissipated rapidly. Minor ashfall was probably confined to the summit caldera. During the previous 2 weeks, occasional steaming from the intracaldera cone was observed. Very weak seismic tremor and a few small discrete seismic events were recorded at the station closest to the active cone. However, AVO reported that there were no indications from seismic data that a significantly larger eruption was imminent. They expect that steam and ash emissions may continue intermittently and could pose a hazard to people and low-flying aircraft in the vicinity of the active cone.
Source: US Geological Survey Alaska Volcano Observatory (AVO)
AVO decreased the Concern Color Code at Veniaminof from Yellow to Green (the lowest level) on 28 September after seismicity at the volcano had been at background levels for over a week and there was no evidence to suggest that minor ash explosions were continuing.
Source: US Geological Survey Alaska Volcano Observatory (AVO)
Cloudy weather during 16-23 September prohibited web camera and satellite observations of Veniaminof, but seismic data indicated diminishing activity. Some minor ash emissions may have occurred, with diffuse ash plumes rising less than ~3 km (10,000 ft) a.s.l. Veniaminof remained at Concern Color Code Yellow.
Source: US Geological Survey Alaska Volcano Observatory (AVO)
Based on interpretations of seismic data at Veniaminof, minor ash emission continued at a very low rate of 1-5 events per day. AVO reported that it was likely that diffuse ash plumes rose to heights less than ~3 km (10,000 ft) a.s.l. and were confined to the summit caldera. Veniaminof remained at Concern Color Code Yellow.
Source: US Geological Survey Alaska Volcano Observatory (AVO)
On 7 September, AVO raised the Concern Color Code at Veniaminof from Green to Yellow after several minor bursts of ash occurred at the volcano during the afternoon. Ash bursts continued to occur through at least 9 September, with ash rising less than 3 km (10,000 ft) a.s.l. The ash was confined to the caldera. AVO reported that there were no indications that more vigorous activity was imminent or even likely. They expected that steam-and-ash emissions similar to those observed on 7 September might continue intermittently and could pose a hazard to people and low-flying aircraft in the vicinity of the active cone.
Source: US Geological Survey Alaska Volcano Observatory (AVO)
A reduction in activity at Veniaminof during 25 February to 4 March led AVO to reduce the Concern Color Code from Yellow to Green, the lowest level. For more than a week seismic activity was at background levels, periods of volcanic tremor had ceased, and there were no discrete events associated with ash bursts. Only minor emissions of steam were observed on the web camera and satellite imagery. AVO received no reports of ash emissions from pilots or observers on the ground. They concluded that given the decline in seismicity it appeared that the most recent episode of eruptive activity had ended at Veniaminof.
Source: US Geological Survey Alaska Volcano Observatory (AVO)
Seismic activity decreased substantially at Veniaminof during 18-25 February in comparison to previous weeks, leading AVO to decrease the Concern Color Code from Orange to Yellow. Periods of volcanic tremor diminished, and no discrete events associated with ash bursts had occurred for several days. Only minor steam emissions were seen. AVO received no reports of ash emissions from pilots or ground observers. AVO concluded that given the decline in seismicity, it appeared that the most recent episode of Strombolian eruptive activity at Veniaminof had ended.
Source: US Geological Survey Alaska Volcano Observatory (AVO)
During 11-18 February, it was likely that low-level Strombolian eruptive activity continued at Veniaminof based on seismic data and satellite imagery. Cloudy conditions obscured web camera views of the volcano, and no ash emissions were observed above the cloud cover. Seismicity remained above background levels at Veniaminof. The character of the seismicity changed slightly during the report period, with frequent periods of continuous banded volcanic tremor occurring, but the amplitudes of earthquakes did not increase. This activity was consistent with explosions from the active cone; however, there was no indication that these bursts are rose more than 4 km a.s.l. Veniaminof remained at Concern Color Code Orange.
Source: US Geological Survey Alaska Volcano Observatory (AVO)
Low-level Strombolian eruptive activity continued at Veniaminof during 4-11 February. On 9 February, an ash burst rose hundreds of meters above the intracaldera cone. Satellite images continued to show a thermal anomaly in the vicinity of the intracaldera cone, consistent with the presence of hot material at the vent. Seismicity remained above background levels at the volcano. On the morning of 10 February there was a distinct increase in the amplitude and frequency of earthquakes. The increase continued through 11 February. This activity was consistent with more energetic explosions from the active cone, however there were no indications that the bursts rose higher than 4 km a.s.l. Veniaminof remained at Concern Color Code Orange.
Source: US Geological Survey Alaska Volcano Observatory (AVO)
On the evening of 3 February, Strombolian activity at Veniaminof was visible by residents of Perryville ~30 km from the volcano. Activity was also observed on web camera views and seen by satellite as an increase in radiated surface heat. An increase in seismicity suggested that Strombolian activity may have continued through 4 February while the volcano was obscured by clouds.
During 28 January to 4 February, seismicity at Veniaminof was similar to levels for the previous week, with low-amplitude tremor and occasional larger bursts. During clear weather, satellite imagery showed anomalous heat at the summit cone, consistent with hot blocks and ash being ejected from the active vent. The web camera showed intermittent ash plumes reaching as high as 3 km a.s.l. Veniaminof remained at Concern Color Code Orange.
Source: US Geological Survey Alaska Volcano Observatory (AVO)
During 21-28 January, seismic data, web camera views, and satellite images all indicated that low-level ash emissions at Veniaminof continued. Seismicity was similar to levels observed during the previous week, consisting of low-amplitude volcanic tremor with occasional larger bursts. During periods of clear weather, satellite imagery showed anomalous heat at the summit cone, consistent with hot blocks and ash being ejected from the active vent. The web camera showed intermittent ash plumes reaching as high as 3 km a.s.l. Occasional stronger bursts of seismic tremor around 28 January may have indicated plumes to higher levels, but not above 4 km a.s.l. Veniaminof remained at Concern Color Code Orange.
Source: US Geological Survey Alaska Volcano Observatory (AVO)
During 14-21 January, seismic data, web camera views, and satellite images indicated that low-level ash emissions continued at Veniaminof. Seismicity was similar to levels observed during the previous week, consisting of low-amplitude volcanic tremor with occasional larger bursts. During clear weather, satellite imagery showed anomalous heat at the summit cone, consistent with hot blocks and ash being ejected from the active vent. In addition, the web camera showed intermittent ash plumes reaching as high as 3 km a.s.l. Occasional stronger bursts of seismic tremor during 20-21 January may have indicated plumes to higher levels, but not above 4 km. Veniaminof remained at Concern Color Code Orange.
Source: US Geological Survey Alaska Volcano Observatory (AVO)
On 12 January the Anchorage VAAC reported emission of a thin ash cloud, visible on the Perryville NetCam, that rose between 3-4 km a.s.l., extended ENE, and dissipated within ~55 km of the volcano.
On 14 January, a satellite image showed a thermal anomaly in the vicinity of the Veniaminof's summit. Although the anomaly appeared less intense than when first detected on 8 January and volcanic activity seemed to have declined significantly since 12 January, activity still remained significantly higher than normal with occasional bursts of volcanic tremor. Therefore, Veniaminof remained at Concern Color Code Orange.
Sources: Anchorage Volcanic Ash Advisory Center (VAAC); US Geological Survey Alaska Volcano Observatory (AVO)
AVO raised the Concern Color Code at Veniaminof from Yellow to Orange on 10 January as ash emissions from the volcano's intracaldera cone reached heights of nearly 4 km during 8-10 January. Seismicity remained at elevated levels and satellite images showed a persistent thermal anomaly at the intracaldera cone. On 11 January, the Anchorage VAAC reported emission of a thin ash cloud to ~3 km a.s.l. visible on the Perryville NetCam
Sources: Anchorage Volcanic Ash Advisory Center (VAAC); US Geological Survey Alaska Volcano Observatory (AVO)
AVO raised the Concern Color Code at Veniaminof from Green to Yellow on 4 January because around that time several small ash emissions from the volcano's intracaldera cone were observed on the Internet camera in Perryville. Ash emissions were visible starting around 0938, but may have been obscured by meteorological clouds in previous images. The discrete ash emissions were small, rose hundreds of meters above the cone, and dissipated as they drifted E. Minor ash fall was probably confined to the summit caldera. Very weak seismic tremor was recorded beginning on 1 January, and increased slightly over the next 2 days. These seismic signals were similar to those recorded during steam-and-ash emissions in April to October, 2004. However, there were no indications from seismic data that events significantly larger than those observed around 4 January are imminent. AVO expects that steam-and-ash emissions may continue intermittently and could pose a hazard to people and low-flying aircraft in the vicinity of the active cone.
Source: US Geological Survey Alaska Volcano Observatory (AVO)
AVO lowered the Concern Color Codeat Veniaminof on 26 October from Yellow to Green. Seismicity, which had been associated with ash emissions that occurred during the summer of 2004, decreased to levels that indicated ash, ash-and-steam, or steam emissions were no longer occurring on a regular basis. Since early September, no ash emissions were seen on the web camera and no evidence of ash was visible on satellite imagery. Also, AVO had received no recent reports of ash from pilots or ground observers. AVO considered the intermittent, low-level seismic tremor that continued to be recorded at the volcano to be part of the background activity. They reported that steaming from the intracaldera cone may still occur.
Source: US Geological Survey Alaska Volcano Observatory (AVO)
Low-level tremor continued at Veniaminof during 8-15 October, correlating with weak steaming of the intracaldera cone as observed on the web camera. No ash emissions were observed, although cloudy conditions over the caldera restricted viewing for much of the week. Veniaminof remained at Concern Color Code Yellow.
Source: US Geological Survey Alaska Volcano Observatory (AVO)
During 24 September to 1 October, low-level tremor and intermittent small tremor bursts may have occurred at Veniominof, but high winds in the area made analysis of seismic records inconclusive. The winds were strong enough to produce an overshadowing effect on seismic records that could hide evidence of low-level tremor. If the tremor episodes continued, they likely represented low-level ash-and-steam emissions similar to those observed over the previous 4 months. Cloudy conditions obscured views of the volcano in web camera and satellite data. Veniaminof remained at Concern Color Code Yellow.
Source: US Geological Survey Alaska Volcano Observatory (AVO)
Low-level tremor and intermittent tremor bursts continued at Veniaminof during 17-24 September. Tremor episodes likely represented low-level ash-and-steam emissions similar to those observed over the previous 4 months, although cloudy conditions obscured views of the volcano in web camera and satellite imagery. Veniaminof remained at Concern Color Code Yellow.
Source: US Geological Survey Alaska Volcano Observatory (AVO)
Low-level seismic tremor and intermittent tremor bursts continue to be recorded at Veniaminof. Tremor episodes likely represent low-level ash and steam emissions similar to those observed over the past four months. Minor emissions of volcanic ash and steam were occasionally observed using web camera images during times of clear weather. Veniaminof remained at Concern Color Code Yellow.
Source: US Geological Survey Alaska Volcano Observatory (AVO)
Both low-level tremor and intermittent bursts of tremor continued at Veniaminof during 3-10 September. AVO scientists believed these tremor episodes likely represented low-level ash-and-steam emissions similar to those observed during the previous 4 months. Minor emissions of ash and steam were occasionally seen on the web camera during clear weather. Veniaminof remained at Concern Color Code Yellow.
Source: US Geological Survey Alaska Volcano Observatory (AVO)
Both low-level tremor and intermittent bursts of tremor continued at Veniaminof during 27 August to 3 September. AVO scientists believed tremor episodes likely represented low-level ash-and-steam emissions similar to those observed during the previous 2 months. Minor emissions of ash and steam were occasionally seen on the web camera during clear weather. Veniaminof remained at Concern Color Code Yellow.
Source: US Geological Survey Alaska Volcano Observatory (AVO)
During 20-27 August, low-level seismic tremor and intermittent tremor bursts continued at Veniaminof. Inclement weather prohibited direct observations and satellite views. AVO scientists believed tremor episodes likely represented low-level ash-and-steam emissions similar to those observed during the previous 2 months. Veniaminof remained at Concern Color Code Yellow.
Source: US Geological Survey Alaska Volcano Observatory (AVO)
Episodes of volcanic tremor continued intermittently at Veniaminof during 13-20 August. Occasional small ash-and-steam emissions occurred during the report week that were similar to those observed over the previous 2 months. None rose above 3 km a.s.l. Veniaminof remained at Concern Color Code Yellow.
Source: US Geological Survey Alaska Volcano Observatory (AVO)
During 6-13 August, frequent small ash-and-steam emissions from Veniaminof were visible on the web camera in Perryville and confirmed by AVO geologists working in the area. The emissions did not exceed a height of 3 km a.s.l. and were similar to those commonly observed in the past 2 months. Bursts of volcanic tremor recorded intermittently on 17 August were probably associated with low-level, short-term ash emissions. Veniaminof remained at Concern Color Code Yellow.
Source: US Geological Survey Alaska Volcano Observatory (AVO)
Episodes of volcanic tremor continued intermittently at Veniaminof from 30 July to 6 August. No visual observations of ash emissions had been made since 22 July, although the recorded seismicity was similar to that observed during ash emissions in the previous weeks. During the report period, occasional low-level steam plumes were seen on the AVO web camera. Veniaminof remained at Concern Color Code Yellow.
Source: US Geological Survey Alaska Volcano Observatory (AVO)
Episodes of volcanic tremor continued intermittently at Veniaminof during 22-30 July. No visual observations of ash emissions were made after 22 July, although the recorded seismicity was similar to that observed during ash emissions in the previous few months. Most such emissions did not reach 3 km a.s.l., though a few reportedly reached as high as 3.7 km. Veniaminof remained at Concern Color Code Yellow.
Source: US Geological Survey Alaska Volcano Observatory (AVO)
Small steam-and-ash emissions were accompanied by periods of volcanic tremor at Veniaminof during 16-23 July. On 22 July at 1229, an AVO field crew witnessed a small ash burst rise a few hundred meters above the summit of the intracaldera cone. This type of activity prevailed at Veniaminof during the previous 3 months. During periods of repose in the report week, the cone produced variable amounts of white steam from at least two separate craters near its top. The snow-and-ice field over much of the caldera was covered with a discontinuous, 1- to 2-mm thick ash blanket. Veniaminof remained at Concern Color Code Yellow.
Source: US Geological Survey Alaska Volcano Observatory (AVO)
Short intervals of low-level volcanic tremor continued intermittently at Veniaminof during 9-16 July. According to AVO, the episodes of tremor correlated well with small ash-and-steam emissions that may have reached as high as 3.6 km a.s.l. Veniaminof remained at Concern Color Code Yellow.
Source: US Geological Survey Alaska Volcano Observatory (AVO)
Many episodes of short-lived bursts of volcanic tremor continued at Veniaminof during 7-13 July. AVO reported that the tremor correlated well with ash-and-steam plumes as high as 1.5 km a.s.l. Veniaminof remained at Concern Color Code Yellow.
Source: US Geological Survey Alaska Volcano Observatory (AVO)
Short intervals of volcanic tremor occurred at Veniaminof during 25 June to 2 July. AVO reported that the tremor could be indicative of small, low-level ash-and-steam emissions. Small amounts of dark ash were seen in the ice-filled caldera on 27 June. Veniaminof remained at Concern Color Code Yellow.
Source: US Geological Survey Alaska Volcano Observatory (AVO)
During 11-18 June, bursts of volcanic tremor continued intermittently at Veniaminof that may have been indicative of small, low-level ash emissions. On 16 June at 2350, a pilot observed an ash cloud that rose to a height of ~2.7 km a.s.l. The plume was also visible on satellite imagery. Veniaminof remained at Concern Color Code Yellow.
Source: US Geological Survey Alaska Volcano Observatory (AVO)
Bursts of volcanic tremor continued at Veniaminof during 4-11 June. The only significant ash emissions occurred during the evening of 30-31 May. No emission exceeded 3 km a.s.l. Veniaminof remained at Concern Color Code Yellow.
Source: US Geological Survey Alaska Volcano Observatory (AVO)
During 21-28 May, the level of volcanic activity at Veniaminof was generally lower than during the previous week. Sequences of tremor accompanying ash bursts continued. On video, weak steaming and low ash bursts were seen emanating from the intracaldera cone. Most of the ash bursts did not rise above the active cone (2,156 m). Satellite imagery on 26 May showed ash deposits on the N and SE portions of the caldera. Veniaminof remained at Concern Color Code Yellow.
Source: US Geological Survey Alaska Volcano Observatory (AVO)
Unrest continued at Veniaminof during 14-21 May, characterized by intermittent volcanic tremor. The tremor was similar to seismic signals recorded the previous month in association with small ash plumes, suggesting that ash bursts continued. A pilot report on 18 May indicated the presence of an ash plume rising to heights of 300-900 m above the volcano's summit and extending ~32 km NE. Veniaminof remained at Concern Color Code Yellow.
Source: US Geological Survey Alaska Volcano Observatory (AVO)
During 7-14 May unrest continued at Veniaminof, characterized by intermittent low-level volcanic tremor and small volcanic earthquakes. No emissions were seen. In comparison to the previous week, seismicity was more intermittent and lower in amplitude. However, seismicity suggested that ash bursts occasionally occurred. Veniaminof remained at Concern Color Code Yellow.
Source: US Geological Survey Alaska Volcano Observatory (AVO)
Unrest continued at Veniaminof during 30 April to 7 May, characterized by small intermittent ash emissions, low-level volcanic tremor, and small volcanic earthquakes. Small ash emissions were observed during periods of clear weather during 1-3 May, rising to 2.4-2.8 km a.s.l. Seismicity was at levels similar to the previous week, suggesting that ash-burst activity continued. Satellite imagery showed ash deposits on the volcano's snow-covered flanks as far as ~8 km from the vent. A pilot reported seeing ash as far as 33 km from the cone. Veniaminof remained at Concern Color Code Yellow.
Sources: Anchorage Volcanic Ash Advisory Center (VAAC); US Geological Survey Alaska Volcano Observatory (AVO)
Unrest at Veniaminof during 23-30 April was characterized by small intermittent ash emissions, low-level volcanic tremor, and small volcanic earthquakes. Small ash emissions were observed during clear weather on 25 and 28 April rising to ~1 km above the active cone. Seismic activity fluctuated, but remained above background levels. There were no indications that more vigorous activity was imminent. Veniaminof remained at Concern Color Code Yellow.
Source: US Geological Survey Alaska Volcano Observatory (AVO)
After a period of heightened seismicity at Veniaminof during 14-17 April that led AVO to increase the Concern Color Code from Green to Yellow, there was a marked decrease in the episodes of low-level volcanic tremor and small volcanic earthquakes through 26 April. A newly installed internet-based video camera located in Perryville allowed AVO to observe the volcano during clear weather. During the afternoon and evening of 25 April, more than 25 small steam-and-ash emissions were seen during an 8-hour period, producing clouds that rose 300-600 m above the active cone. These clouds typically were confined to the summit caldera, but could pose a hazard to people and low-flying aircraft in the immediate vicinity of the active cone. Through 26 April, Veniaminof remained at Concern Color Yellow.
Source: US Geological Survey Alaska Volcano Observatory (AVO)
During 10-17 April, Veniaminof showed heightened seismicity with several episodes of volcanic tremor and earthquakes. Seismicity decreased significantly prior to the emission of a gas plume with some ash throughout 18 April. The most vigorous phase occurred at about 1730 on 18 April when the plume rose to ~0.5 km above the crater. At about 1130 on 19 April another period of heightened seismic activity began. Due to the increased activity, Veniaminof was upgraded to Concern Color Code Yellow.
Source: US Geological Survey Alaska Volcano Observatory (AVO)
Following reports of low-level steam-and-ash emissions from Veniaminof during the week of 15 February, satellite imagery on 22 February showed very localized ash deposits within the ice-filled caldera. No additional signs of volcanic activity were visible on satellite imagery during 23-27 February, and there were no more reports of ash-plume sightings from Perryville. Seismicity remained at low levels, and the thermal signature of the intracaldera cone was unchanged from previous months. AVO determined that the small ash bursts were most likely the result of minor explosions caused by the heating of ground water below the intracaldera cone. Veniaminof remained at Concern Color Code Green.
Source: US Geological Survey Alaska Volcano Observatory (AVO)
During the week of 15 February, AVO received several reports of small ash clouds rising "several hundred feet" above the intracaldera cinder-and-spatter cone of Veniaminof. Residents of Perryville reported a "black puff" of ash on 16 February followed by strong steaming, and a pilot reported a small black ash cloud on 19 February. Satellite imagery on 19 February at 1410 showed a small, dark trail on the snow leading away from the intracaldera cone that was likely a very localized ash deposit. No significant seismic activity or thermal anomalies on satellite data were recorded during the week. Due to the lack of significant seismic activity beneath the volcano, AVO concluded that these small ash clouds were the result of minor explosions caused by the heating of ground water below the intracaldera cone. Veniaminof remained at Concern Color Code Green.
Source: US Geological Survey Alaska Volcano Observatory (AVO)
Seismic activity remained at very low levels at Veniaminof during 4-11 April. Tremor was almost completely absent, and only a few low-frequency events were recorded. Satellite images during the week did not reveal any elevated surface temperatures, ash emissions, or ash deposits at the volcano. Due to the decline in seismicity, AVO lowered the Concern Color Code for Veniaminof from Yellow to Green. AVO stated that while Veniaminof is in its current state of activity, low-level steaming and minor ash emissions may periodically occur.
Source: US Geological Survey Alaska Volcano Observatory (AVO)
Seismicity dramatically decreased at Veniaminof during 28 March to 4 April. However, short periods of volcanic tremor and low-frequency events continued to occur. AVO reported that low-level steaming and minor ash emissions might occur at any time. The Concern Color Code remained at Yellow.
Source: US Geological Survey Alaska Volcano Observatory (AVO)
The elevated seismicity that began in mid-December 2002 at Veniaminof continued during 21-28 March, but declined in comparison to previous weeks. Seismicity was characterized by very low amplitude tremor. The Concern Color Code remained at Yellow.
Source: US Geological Survey Alaska Volcano Observatory (AVO)
The elevated seismicity that began in mid-December 2002 at Veniaminof continued during 7-14 March. On 11 March a 4-hour period of continuous seismic tremor was recorded, followed by 17 hours of discrete seismic events and 3- to 4-minute-long tremor bursts. This culminated with another 4-hour period of continuous tremor on 12 March. Seismicity then declined, and by the 14th was characterized by the occurrence of about one small-amplitude discrete seismic event every 1-2 minutes. AVO reported that based on this seismicity, low-level steaming and minor ash-emissions may occur at any time. The Concern Color Code remained at Yellow.
Source: US Geological Survey Alaska Volcano Observatory (AVO)
The elevated seismicity that began at Veniaminof in mid-December 2002 continued through 7-14 February. Discrete seismic events occurred at rates up to 1 event per minute. AVO stated that at this level of seismic unrest, low-level steaming, and minor ash emissions may occur at any time. No elevated surface temperatures, ash emissions, or ash deposits were noted on satellite images. The Concern Color Code remained at Yellow.
Source: US Geological Survey Alaska Volcano Observatory (AVO)
The elevated seismicity that began at Veniaminof in mid-December 2002 continued through 31 January to 7 February. Discrete seismic events occurred at rates up to 1 event per minute. AVO stated that at this level of seismic unrest, low-level steaming and minor ash emissions may occur at any time. No elevated surface temperatures, ash emissions, or ash deposits were noted on satellite images. The Concern Color Code remained at Yellow.
Source: US Geological Survey Alaska Volcano Observatory (AVO)
The elevated seismicity that began at Veniaminof in mid-December 2002 continued through 24-31 January. Discrete seismic events occurred at rates up to 1-2 events per minute, although event rates and peak amplitudes decreased somewhat over the last 2 days. The Concern Color Code remained at Yellow.
Source: US Geological Survey Alaska Volcano Observatory (AVO)
The elevated seismicity that began in mid-December 2002 at Veniaminof continued during 17-24 January. As during the previous week, periods of nearly constant seismicity were recorded during the report week. Discrete seismic events occurred at rates up to 1-2 events per minute, along with moderate levels of volcanic tremor. Satellite imagery did not reveal increased surface temperatures, ash emission, or ash deposits. Visual observations on 22 January from the village of Perryville, located 35 km SSW of the volcano, revealed that white steam was rising from the intracaldera cone. The steaming was similar to that observed over the previous several months. The Concern Color Code remained at Yellow.
Source: US Geological Survey Alaska Volcano Observatory (AVO)
The elevated seismicity that began in mid-December 2002 at Veniaminof continued during 10-17 January. As during the previous week, periods of nearly constant seismicity were recorded during the report week. Discrete seismic events occurred at rates up to 1-2 events per minute, along with moderate levels of volcanic tremor. The Concern Color Code remained at Yellow.
Source: US Geological Survey Alaska Volcano Observatory (AVO)
The elevated seismicity that began in mid-December 2002 at Veniaminof continued during 3-10 January. Nearly constant periods of seismicity were recorded during the report week. Discrete seismic events occurred at rates up to 1-2 events per minute, along with moderate levels of volcanic tremor. The Concern Color Code remained at Yellow.
Source: US Geological Survey Alaska Volcano Observatory (AVO)
Periods of nearly constant seismicity at Veniaminof since 31 December led AVO to raise the Concern Color Code from Green to Yellow on 6 January. Seismicity had been increasing since mid-December. No thermal anomalies were detected on satellite imagery. AVO stated that there were no indications of an imminent eruption, although low-level steaming and minor ash emission may occur.
Source: US Geological Survey Alaska Volcano Observatory (AVO)
On 18 November AVO lowered the Concern Color Code at Veniaminof from Yellow to Green. Since early October they had received no pilot reports or other observations of activity at the volcano. Also, they had not detected thermal anomalies in any clear satellite images. Though seismicity remained above levels recorded this summer, it has remained roughly constant for the past month at a level notably lower than in September, when the color code was raised to Yellow. AVO stated that while Veniaminof is in its current state of activity, low-level steaming and minor ash emissions may periodically occur.
Source: US Geological Survey Alaska Volcano Observatory (AVO)
Veniaminof remained restless during 25 October to 1 November. Although the current seismic activity is lower than when first noted in early September, it is still above background level. AVO received video footage recorded in early October that showed minor ash emission from the intracaldera cone. The ash rose about 100-200 m above the cone and drifted a short distance before dispersing. A faint covering of ash was visible on the caldera ice field extending from the base of the cone. These observations are consistent with the elevated level of seismicity and are indicative of the type of minor activity that is occurring. Due to the continuing seismicity and reports of minor ash emissions the Concern Color Code at Veniaminof remained at Yellow.
Source: US Geological Survey Alaska Volcano Observatory (AVO)
Veniaminof remained restless during 18-25 October. Although the current seismic activity is lower than when first noted in early September, it is still above background level. No new visual observations of Veniaminof were received since the last update. No thermal anomalies were observed in satellite views. AVO considered the activity at Veniaminof to be minor, but the exact nature of the unrest was unknown. Veniaminof remained at Concern Color Code Yellow.
Source: US Geological Survey Alaska Volcano Observatory (AVO)
Veniaminof remained restless during 11-18 October. Although seismicity was lower than when first noted in early September, it was still above background levels. No new visual observations had been received since the last update. However, local observations of low-level activity earlier in the month confirm that small explosions at the intracaldera cone are possible at any time and may not correspond with a noticeably elevated level of seismicity. No thermal anomalies were observed on satellite imagery. AVO considered the activity at Veniaminof to be minor, but the exact nature of the unrest was unknown. Veniaminof remained at Concern Color Code Yellow.
Source: US Geological Survey Alaska Volcano Observatory (AVO)
Veniaminof remained restless during 4-11 October. Although seismicity was lower than when first noted in early September, it was still above background levels. Visual observations of Veniaminof during the week were intermittent and inconclusive. No thermal anomalies were observed on satellite imagery. AVO considered the activity at Veniaminof to be minor, but the exact nature of the unrest remained unknown. The Level of Concern Color Code remained Yellow due to the continuing seismicity.
Source: US Geological Survey Alaska Volcano Observatory (AVO)
Veniaminof remained restless during 26 September to 4 October. Seismicity was lower than when it was first noted in early September, although it was still above background level. Visual observations of Veniaminof were intermittent and inconclusive. AVO received reports ranging from minor-steam and possible ash emissions, to no signs of activity. A satellite image recorded on 2 October suggested an apparent gray, diffuse deposit extending across the caldera from the historically active intracaldera cinder cone. This could reflect a small explosion, vigorous steam emission, or redistribution of material on the cone by strong winds. No thermal anomalies were observed on satellite imagery. AVO considered the activity at Veniaminof to be minor, but the exact nature of the unrest remained unknown. Due to the continuing seismicity and reports of unusual steaming, the Concern Color Code remained at Yellow.
Source: US Geological Survey Alaska Volcano Observatory (AVO)
AVO reported that seismic unrest that began at Veniaminof on 10 September continued through the 27th. The intensity of tremor and small earthquakes under the volcano had decreased since the 10th, but remained above the background level established during the summer of 2002. Visual observations of Veniaminof were hampered by poor weather. On 24 September, residents of Perryville, 35 km S of the volcano, reported and photographed small bursts of steam, possibly containing minor amounts of ash, rising just above the historically active intracaldera cinder cone. Without additional observations, AVO could not determine if this indicated very low-level eruptive activity or vigorous steaming from the cone. On several occasions of relatively clear weather conditions, AVO observed no signs of elevated temperature or ash emission on satellite imagery. Due to the continuing seismicity and reports of unusual steaming, the Concern Color Code remained at Yellow.
Source: US Geological Survey Alaska Volcano Observatory (AVO)
Pulses of low-frequency tremor were first recorded on 10 September by several seismic stations at Veniaminof. Until at least 20 September the overall level of seismicity decreased, but remained above background. AVO did not receive any reports of anomalous activity, and poor weather limited satellite observations. Due to the anomalous seismicity, the Concern Color Code remained at Yellow.
Source: US Geological Survey Alaska Volcano Observatory (AVO)
On 10 September AVO detected 1-minute-long pulses of low-frequency tremor occurring every 2-5 minutes on several seismic stations at Veniaminof. This type of seismicity is indicative of volcanic unrest. Retrospective analysis of seismic data suggested that tremor began as early as 8 September. Through at least 16 September the overall level of seismicity decreased, but remained above background levels. Veniaminof was at Concern Color Code Yellow.
Source: US Geological Survey Alaska Volcano Observatory (AVO)
Reports are organized chronologically and indexed below by Month/Year (Publication Volume:Number), and include a one-line summary. Click on the index link or scroll down to read the reports.
Strombolian activity and lava flow from cone in ice-filled caldera
Pilots began to report eruption clouds from Veniaminof late 4 June, noting that plumes containing some ash rose to about 4.5 km altitude. Residents of Perryville (population 100, about 25 km S of the volcano) saw incandescence and dark skies on 7 June at about 0130. Later that day, USGS personnel flew over Veniaminof. In the S part of the 10-km-diameter, ice-filled caldera, Strombolian activity was occurring from two vents on a cone that rises about 300 m above the ice and had previously been the site of fumarolic activity. Cherry-red molten material was ejected several times per minute to roughly 30-60 m height. The lowest 150 m of the eruption column was tephra-rich, but above that height the plume was wispy and light gray. About 50 km2 of ice, chiefly to the S and SW, was coated with a very thin layer of ash. In the ice just SE of the cone, a prominent set of ring fractures defined a circular depression, produced by melting, that was estimated to be about 0.5 km in diameter and no more than 20 m deep.
By the next USGS overflight, at 1500 on 9 June, Strombolian activity was more vigorous and lava was flowing down the S side of the cone. Bombs and scoria were ejected every 3-5 seconds to about 2400 m altitude, about 250 m above the summit of the cone. Tephra had begun to fill the cone's crater and an increasing number of bombs were falling on its flanks. Lava flowed from the summit down the steeply sloping S side of the cone onto the ice field, where a large E-W-trending dumbbell-shaped depression had formed. Lava flowed into the W part of the dumbbell and sank into the ice, from which billowing clouds of steam were rising. The base of the lava flow was roughly 100 m in diameter. Open water was present in the narrow area between the two parts of the dumbbell, and the E part was characterized by an unusual fracture pattern. The E part of this feature closely approached, but did not touch, the depression in the ice observed 2 days earlier. The timing of the beginning of lava flow activity was uncertain, but a pilot who flew past the volcano at 1330 on 8 June saw no steam clouds, so lava probably had not begun to flow onto the ice by then.
A short-period seismic instrument located at Ivanof Bay, about 30 km from the volcano, was operating in its standard event-triggered mode until it was reset to record continuously 8 June. Between 8 and 10 June, it recorded nearly continuous low-amplitude tremor, with occasional larger discrete bursts that reached (preliminary) magnitudes of 1-2 (figure 1). No unusual discharge from streams draining the caldera has been observed. An eruption from Veniaminof was last reported in 1944 [but see 8:6].
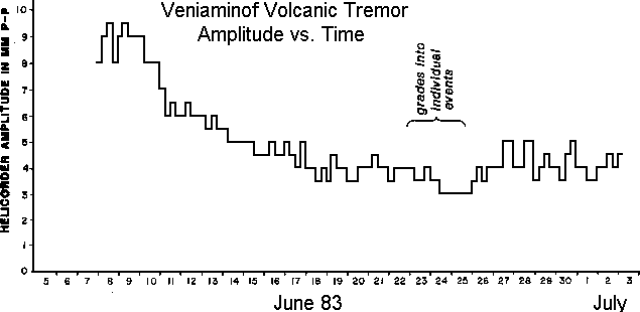 |
Figure 1. Volcanic tremor amplitude vs. time, 8 June-2 July 1983. Station IVF (Ivanof Bay) has a 1-Hz vertical geophone and is located 31 km SSW of the volcano's summit. The signal is radio-telemetered to a central recording site and is recorded on both an event-triggered digital system and on a helicorder. The plot shows the helicorder amplitude of the approximately 1.2 Hz volcanic tremor at 6-hour intervals; measurements were taken for the peak-to-peak waveform with an amplitude that was attained or exceeded at least three times during the 6-hour period. On 23-24 June the signal changed gradually from continuous tremor of variable amplitude to discrete individual events (dates are GMT). Courtesy of Stephen McNutt. [Originally appeared in 8:8.] |
Information Contacts: T. Miller, USGS, Anchorage; S. McNutt, LDGO.
Lava flows melt holes in caldera ice; increased ash emission
The eruption was continuing in early July. Periods of poor weather frequently limited observations, but eruption plumes were sometimes visible above low clouds mantling the volcano's summit.
By the time of a USGS overflight 15 June, the eruption had built a new cinder cone, roughly 150 m high and 500 m in diameter, within the central crater of the pre-existing 300 m-high cone in the S part of the 10 km-diameter ice-filled caldera (figure 2). Every few seconds, rhythmic explosions ejected molten material from the central vent of the new cone. However, the lava flow that had been cascading down the S side of the cone onto the ice on 9 June (figure 3) was no longer active. This flow had formed a large pit in the ice, approximately 250-300 m in diameter and roughly 60 m deep. Steam rose from numerous point sources within the pit. In the ice just SE of the cone, a new pit roughly 60 m across had developed, along the trend of what appeared to be fractures on the cone. Vapor clouds from the pit seemed to be emerging from a cavern in the portion nearest the cone, suggesting that a flank eruption may have been occurring beneath the ice. From the central vent, voluminous steam emission fed billowing white clouds that rose to about 3.5 km altitude. Vigorous steaming had been observed after dark on 11 June but the activity was distinctly stronger on the 15th. Only minor ash emission was observed, although thin tephra deposits surrounded the volcano, perhaps reaching a thickness of a few centimeters SW of the cone.
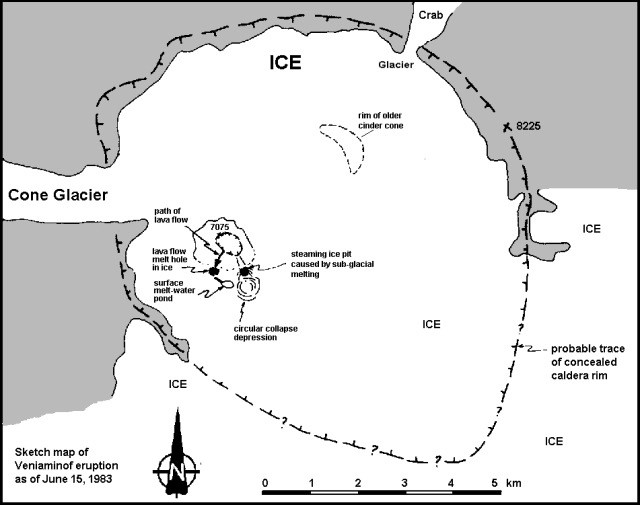 |
Figure 2. Sketch map by M. Elizabeth Yount showing Veniaminof's crater on 15 June 1983. |
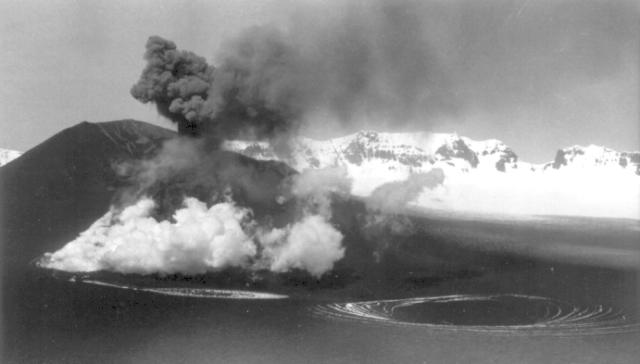 |
Figure 3. Photograph of Veniaminof from the SW, on 9 June 1983 between 1515 and 1600. The circular collapse depression is shown in right foreground, the meltwater pond to its left. Steam emerges from the hole melted by the lava flow in the ice at the base of the cone. Ash is being ejected from the active cone. The caldera ice is covered by a thin layer of ash. The snow-covered caldera rim is visible in the background, with the notch at right leading to Crab Glacier (figure 2). The steaming ice pit, shown on figure 2 and described above, formed after this photo was taken. Courtesy of USGS. |
A pilot who flew over the summit on 17 June at 1700 saw no lava fountaining and reported that lava was flowing down the SW side of the cone at a diminished rate. Beginning 21 June, pilots frequently observed ash plumes penetrating the layer of low clouds that usually obscured the crater. Around mid-morning on the 21st, a plume reached an estimated 2.5 km altitude (only about 300 m above the active cone). Early 25 June, ash was moving NE at 3.5-4 km altitude and several ash puffs were observed that afternoon. During a few hours of clear weather on the afternoon of 27 June, lava was fountaining to about 100 m above the cone and an active flow was observed.
A lake about 1.5 km long was seen on the ice filling the caldera. Early on 28 June, pilots reported dense ash clouds moving NW at altitudes as high as 6 km. At 1500, an ash burst reached 8 km altitude; ash was rising to 6 km at 1715 and ash and steam to 4.5 km at 2139. Late on 29 June, a pilot reported ash and larger tephra being ejected at a high rate, feeding a plume that moved NW and reached 5.5-6 km altitude. During the first week in July, plumes typically rose to a maximum of 3.5-4.5 km, but higher weather clouds often prevented pilots from seeing eruption plumes. Images from the NOAA 7 polar orbiting satellite showed the development of a plume that had started forming shortly before an image on 4 July at about 1130. At 1623, the plume extended about 150 km to the SSE and analysis of infrared data yielded a minimum plume temperature of -8°C. Radiosonde temperature/altitude profiles indicated that this temperature corresponded to an altitude of 3.8 km. By 2000, no plume could be seen.
Renewed lava flow activity was observed in early July, from a vent near the summit of the cone, and perhaps from a new vent on its SE flank. On 7 and 8 July, lava fountaining was continuing and bombs rose to about 100 m above the cone.
Last month, we reported that Veniaminof last erupted in 1944. However, a small cone shown in a 1954 airphoto had disappeared by 1973, when USGS personnel carried out field work at Veniaminof, and geologists presume that an eruption must have destroyed it at some time during this 19-year period. The cone was within the 300-m-high cone, active in the current eruption, in the S part of the caldera. Efforts to locate more photographs and narrow the 19-year time window are continuing.
Information Contacts: T. Miller and M.E. Yount, USGS, Anchorage; M. Matson and D. Haller, NOAA/NESDIS.
Lava flow melts large pit in caldera ice, then eruption weakens
The eruption remained vigorous through mid-July, but appeared to be declining in late July and early August. During an overflight on 13 July, the active cinder cone filled most of the summit crater of the pre-existing intra-caldera cone. From a breach in the S side of the cinder cone, molten material was ejected every 1-2 minutes to 150-300 m height. A blocky lava flow 15-20 m wide moved from the breach down the slope of the intra-caldera cone and ponded at the bottom of a vertically walled ice pit about 1,600 m long, 400-800 m wide and 60-100 m deep. The pit, elongate roughly E-W with a slight curvature to the N at its E end, appeared to result from coalescence of smaller ice pits observed in mid-June. It contained a water lake of unknown depth, and white vapor columns rose from the vicinity of the lava flow. The active cone also emitted a thin discontinuous brown-gray eruption column that rose to about 4.2 km altitude, feeding a long narrow plume that extended 30 km or more ENE. Additional tephra had been deposited inside and outside the caldera since the previous month's observations.
Although lava continued to flow down the S side of the cone on 26 July, activity appeared weaker. Yellow sublimates were observed around the vent. By the next overflight, on 3 August, no incandescent tephra was being ejected and the lava flow did not appear to be moving. A few bright reddish-brown patches were noted along the lower part of the flow, but it was not possible to determine whether these were incandescent areas or heavily oxidized zones. Yellow sublimates were visible on the N portion of the active cone and the upper part of the lava flow. The nose of the flow was steaming, especially where it was in contact with the ice pit's meltwater lake (figure 4). The flow had advanced farther into the ice pit and was within 50 m of dividing the meltwater lake into two parts. No ice was seen falling into the lake, but its S portion was ice-choked. Concentric fractures extended SW from the lake almost to the caldera rim. Ash covered the entire caldera, the slopes outside its rim, and mountains to the S. Glacier ice outside the caldera was colored light chocolate brown by ash. Three fissures, not visible on a 7 June airphoto, extended from an older cinder cone in the N-central part of the caldera about a quater of the way to the active cone 2.5 km to the SW.
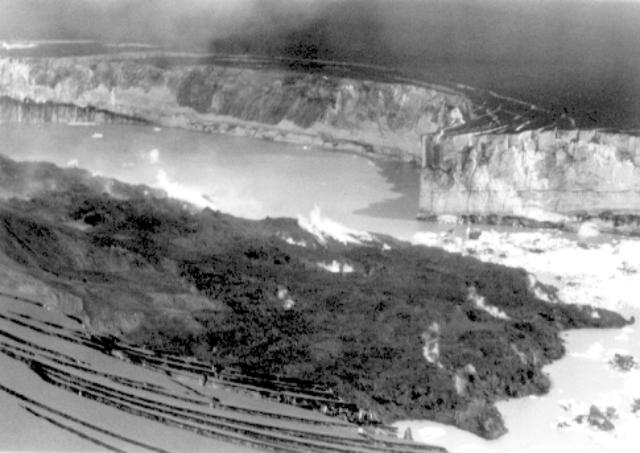 |
Figure 4. Photograph taken 3 August 1983 showing the nose of the lava flow in the ice pit. Note the concentric fractures in the ice near the edge of the pit. Dark ash covers the ice surface. Courtesy of Steven Nelson. |
Information Contacts: T. Miller, M.E. Yount, S. Nelson, and R. Emanuel, USGS, Anchorage.
Lava flow and ash emission stop; tremor summarized
During an overflight on 26 July, the active cone emitted small bursts of pink-gray ash, and a white vapor cloud rose from the summit area. Bursts of steam rose from the lava flow which was forming a "delta" in the meltwater lake. Gray ash covered the entire caldera floor. Concentric fractures around the older cinder cone NE of the active cone were also observed.
The eruption appeared to be declining in late July-August. No ash emission was observed on 17 August at 1930, although a white vapor cloud rose above the active vent. The lava flow did not appear to be moving; no incandescence or steaming was observed on the flow. The water level was lower in the meltwater lake than during the 3 August overflight.
Information Contacts: M.E. Yount and T. Miller, USGS, Anchorage; S. McNutt, LDGO.
Eruption resumes; Strombolian activity; lava flows
After declining in August and September, eruptive activity resumed on 3 October, when Perryville residents reported ashfall on the town and saw incandescence at the volcano.
During an overflight on 5 October, USGS personnel observed Strombolian bursts of lava from the previously active vent within the summit crater of the intra-caldera cone. An ash cloud rose 300-1,200 m above the vent and extended E. On 7 October, ash and bombs were ejected 60-90 m above the vent. Lava flowed SW from the vent on top of flows erupted June-July, adding a new lobe to the lava delta at the base of the intra-caldera cone. Steam rose from the active flow fronts. The meltwater lake formed during previous activity remained frozen and had apparently not increased in size.
During the next overflight, from 1345 to 1425 on 13 October, a thin wispy ash cloud rose about 60 m above the cone and drifted N, depositing ash on the caldera floor ice N and NE of the intra-caldera cone. Bursts of ash and incandescent bombs were ejected from the summit of the cinder cone at rhythmic intervals of a few seconds early in the overflight, but became more continuous later. Lava flowed from SW flank vents slightly below the summit of the cinder cone down the steep flank of the intra-caldera cone. They extended the lava delta to the SE, remelting the SE portion of the meltwater lake.
Information Contacts: T. Miller and M.E. Yount, USGS, Anchorage.
Lava fountains and flow; ash emission; increased tremor
Eruptive activity continued through early November. On the night of 23-24 October, Perryville residents observed lava fountains at the summit, and on 30 October they observed lava flowing down the SW flank of the intra-caldera cone. On 31 October and 1 November, an ash cloud rose 1 km above the vent.
Bad weather prevented overflights by USGS personnel during late October. During a 4 November overflight, a very light-colored vapor plume containing a little ash rose approximately 100 m and was blown S. Lava flowed down the SW side of the intra-caldera cone, extending the lava delta to the S. They did not observe any water in the large ice pits previously melted into the caldera ice by the lava flows, but their view was obscured by the eruption cloud.
Seismic records available through 8 October showed low-amplitude continuous volcanic tremor beginning 1 October at 1200. On 2 October the amplitude increased to slightly less than half that during the June eruption (8:5, 8). The tremor remained continuous and of about this amplitude through 8 October. Some slightly larger bursts of tremor were recorded 4-8 October. The eruptive activity reported on 3 October by Perryville residents was not distinguishable on the seismic record.
Information Contacts: M.E. Yount, USGS, Anchorage; S. McNutt, LDGO.
Vapor plume; incandescence
Eruptive activity continued through November. Perryville residents observed glow over the volcano at night through the week of 13-19 November. On 16 November and the few nights preceding, the glow was the brightest observed since Strombolian activity resumed in early October. They saw steam on 16 November and heard rumbling from the volcano. On 18 November they observed a large billowing vapor cloud with no ash and again heard rumbling. On 23 November, a small amount of ash and steam rose from the intra-caldera cone, but no incandescence was observed. On the evening of 30 November, they observed a very small steam cloud with no ash, but they saw no glow over the volcano. Bad weather has prevented any overflights by USGS personnel since 4 November.
Information Contacts: M.E. Yount and T. Miller, USGS, Anchorage.
Vapor plumes; incandescence; earthquakes
Eruptive activity was continuing in early January. Perryville residents saw glow over the volcano on the night of 9 December. On the 10th, a small vapor cloud rose from the summit area, and on the 11th a larger cloud rose to more than 4 km altitude. During the night of 26 December, they observed incandescent material being ejected from the summit area. Ash and vapor erupted from a vent on the intra-caldera cone and another to the SW. Earthquakes were felt in Perryville at 1045 on 26 December and 1415 on 27 December. On 8 January, Perryville residents saw an ashy vapor cloud rise from the intra-caldera cone, but they saw no glow over the volcano. Bad weather has prevented any overflights by USGS personnel since 4 November.
Further Reference. Yount, M.E., Miller, T.P., and others, 1985, Eruption in an ice-filled caldera, Mount Veniaminof, Alaska Peninsula: USGS Circular 945, p. 59-60.
Information Contacts: M.E. Yount, USGS, Anchorage.
Lava fountains and flow continue
Perryville residents observed glow over the summit of the volcano during the evenings of 31 December, and 3, 4, 11, and 13 January. Activity intensified on 17 January, when they observed lava fountains as high as 200 m. The fountains were active for 30-45-minute periods, waned for indefinite intervals, then resumed.
During an overflight by USGS personnel between 1345 and 1410 on 23 January, billowing white vapor clouds rose from the summit area of the intra-caldera cone to approximately 3-4 km altitude and were blown E (figures 5 and 6). There was no ash in the eruption plume or on the area surrounding the cone. Fountains rose 10-20 m and lava flowed from a vent about 100 m below the summit of the cinder cone that has grown during the eruption to nearly fill the crater of the intra-caldera cone. The lava flow, estimated at 10-20 m wide, was confined by steep levees and extended more than 200 m onto the lava delta formed by earlier flows that covered the entire floor of the ice pit. Although the surface of the lava delta was irregular, its average thickness was estimated at about 30 m. USGS personnel estimated that approximately 45 x 106 m3 of lava has filled the ice pit since June.
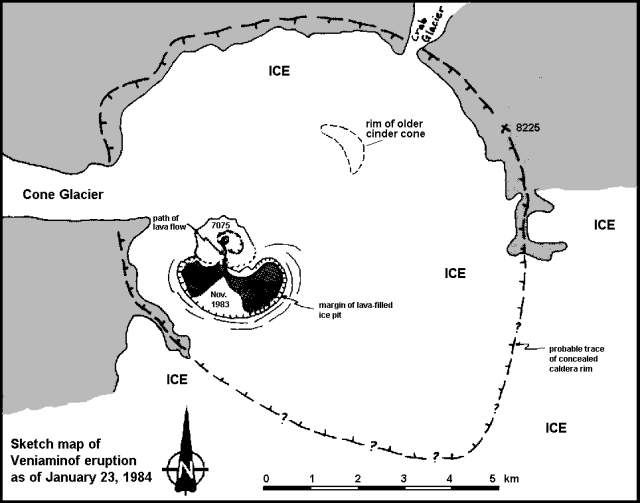 |
Figure 5. Sketch map by M. Elizabeth Yount of Veniaminof on 23 January 1984. The intra-caldera cone, lava-filled ice pit, and lava flows of November and January are shown. See figure 2 for comparison. |
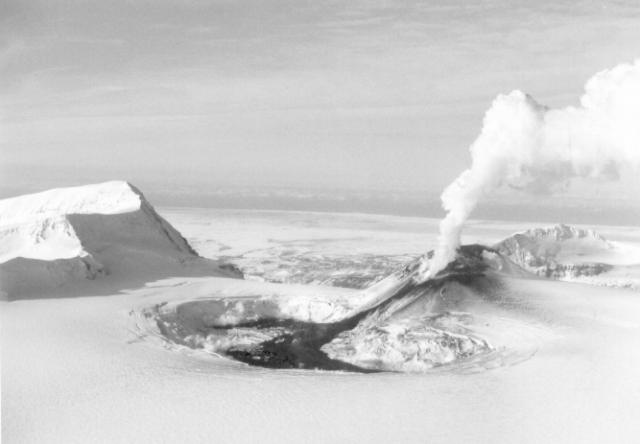 |
Figure 6. Photograph of Veniaminof from the SE taken 23 January 1984. A vapor plume rises from the new cinder cone built within the summit crater of the intra-caldera cone. Steam rises from the perimeter of the ice pit where lava contacts ice. Courtesy of M. Elizabeth Yount. |
The ice pit had increased in size since the last overflight on 4 November to more than 2 km by about 1 km (compare figures 5 and 2). Steam rose from numerous sites on the perimeter of the pit where lava contacted ice. Perryville residents observed a very large vapor cloud, but not much incandescent material, over the summit of the volcano 4-6 February. On the evening of the 6th, lava fountains rose to heights of several tens of meters for approximately half hour periods, separated by 45-minute intervals. On 7 February a small vapor cloud rose from the summit area, and that evening Perryville residents saw a faint glow but no lava fountains.
Information Contacts: M.E. Yount and T. Miller, USGS, Anchorage.
Eruption continues; lava fountains and flow
Eruptive activity continued through early March. Perryville residents observed incandescent lava flowing down the intra-caldera cone on clear evenings between 13 February and early March. During the day, they saw a small vapor cloud rise from the cone. On the morning of 27 February, a small dark ash cloud that dissipated after about 2 hours was visible from Perryville. On the evenings of 2 and 3 March, low lava fountains were active for about 1-hour periods, declined, then resumed. Bad weather has prevented any overflights by USGS personnel since 23 January.
Information Contacts: M.E. Yount, USGS, Anchorage.
Vapor plumes and incandescence
Eruptive activity continued through mid-March, but declined late March-early April. Weather clouds obscured the volcano for most of March; however, Perryville residents were able to make the following observations. On 7, 11, 14, and 16 March, a vapor plume rose above the intra-caldera cone. Glow was seen over the summit of the volcano on the evenings of the 7th and 16th. Between 1600 and 1700 on 22 March, an eruption cloud with a small amount of ash rose to approximately 4 km altitude, and an earthquake was felt in Perryville at 2345 that evening. A large vapor cloud was observed on the 23rd and a dark ash cloud was "glimpsed" on the 28th. Another vapor plume rose about 60 m above the intra-caldera cone on 30 March. Weather clouds continued to obscure the volcano through 8 April. Perryville residents observed a vapor cloud above the summit during the day 9-10 April but no incandescence during the evening. During an overflight by USGS personnel on 11 April, a vapor cloud containing little or no tephra rose about 90 m from the summit area of the intra-caldera cone. No incandescent ejecta was observed. The lava flow did not appear to be advancing and it was covered by a light dusting of snow. Vapor was emitted from the edges and top of the lava flow.
Information Contacts: M.E. Yount, USGS, Anchorage.
Vapor clouds; ash plume to 2 km altitude; no glow
After declining late March-early April, eruptive activity continued through late April. On 12-15 April, Perryville residents observed a small continuous vapor cloud of variable volume above the intra-caldera cone. On the 16th, a similar cloud, but of constant volume, was observed. Between 1230 and 1400 on 17 April, a very dark continuous ash plume rose to more than 2 km altitude from the intra-caldera cone. On the 18th, a small vapor cloud of variable volume rose from the cone. No observations were made on the 19th-21st, and weather clouds obscured the volcano on the 22nd. On 23-24 April, Perryville residents again observed a small steam cloud that varied in volume. No incandescence was observed over the summit between 11 and 26 April; glow was last observed on 16 March.
Information Contacts: M.E. Yount, USGS, Anchorage.
Vapor plumes but no ash or incandescence
Only weak activity at Veniaminof was observed by Perryville residents between late April and late May. No ash was seen in the plume after 17 April. Small white vapor plumes were visible 9 and 16 May and a larger white plume was noted on the 19th. During some periods of clear weather, no plume was seen. No glow was evident through the period.
Information Contacts: M.E. Yount, USGS, Anchorage.
Vapor plumes, roaring noise, and felt earthquakes
No ash or lava emission from Veniaminof was observed during the summer. USGS personnel saw a vapor cloud, which contained no visible ash, emerging from the intra-caldera cone during an overflight on 15 June. They saw vapor plumes rising above the volcano several times during June from observation points 20-60 km SE to SSW of the volcano.
During USGS fieldwork in the caldera 13-14 August, vapor clouds rose from the top and the base of the new cone in the summit crater of the intra-caldera cone. The lava delta in the ice pit was still quite warm and steam rose from it. A repetitive cycle of "vent clearing" was heard; about 15 minutes of a roaring noise like a jet engine was followed by about 20 minutes of quiet, then the roaring resumed. Vapor emission did not appear to increase during the roaring period, but the observers did not have a good view of the cloud. Felt earthquakes occurred during both the roaring and quiet periods. USGS personnel placed control points for aerial photography and sampled material extruded during the 1983-4 eruption.
Information Contacts: T. Miller and M. E. Yount, USGS, Anchorage.
Activity resumes; ash plumes to about 5 km altitude
Eruptive activity resumed on 29 November. At about 0400, Perryville residents were awakened by rumbling noises from the volcano. By 0800, a black ash cloud was rising to about 3.5-4 km altitude. At 1000, a second plume rose to about 4 km, followed by smaller bursts that were occurring at approximately 5-minute intervals as of about 1020. Pilots reported an ash plume to about 4.5 km altitude at 1045, very little activity at 1100, and another ash plume to about 5.4 km at 1115. No incandescent material was observed from Perryville or by the pilots.
A pilot who flew over the volcano on the morning of 5 December reported a white vapor plume, containing only a small amount of ash, rising from two small pits on the E side of the previously active cone. One of the pits was steaming more vigorously than the other, and a brownish haze drifted downwind from the volcano. He observed no incandescent material or recent lava extrusions. On 6 December, Perryville residents observed large vapor plumes of varying intensity that contained very minor amounts of ash. They saw no incandescent material, and had heard no rumbling noises during the previous several days. On 7-8 December the volcano was obscured by weather clouds; however, small intermittent vapor plumes with no ash were observed from Perryville on the 9th. No incandescent material was seen. On the 10th and 11th, the volcano was not visible from Perryville.
Before the eruption, on 25 November, a Lamont-Doherty seismic monitoring station about 30 km from the volcano recorded 3 events (either low frequency volcanic events or tremor). However, other stations of the Lamont-Doherty network are triggered by earthquakes greater than about magnitude 2.5-3, and no such events had been recorded as of 0200 on 29 November.
Information Contacts: M. E. Yount and T. Miller, USGS, Anchorage; J. Taber, LDGO.
Tremor accompanied November ash ejection; activity declines
Weather clouds obscured the volcano from mid-December through early January. A pilot who flew over the volcano on 2 January observed no activity.
The following is from John Taber and Ken Hudnut. "The most recent eruptive activity at Veniaminof had little associated seismicity as compared to the previous eruption. During the recent activity a Lamont-Doherty seismic monitoring station 30 km from the caldera recorded only small amounts of tremor, which lasted a total of about 20 minutes. Only 4 events of 1-2 minutes duration were recorded in the 5 days before the observed eruption. Seismic activity increased at 0420 on 29 November with 8 minutes of tremor roughly corresponding to first reports of rumbling noises by Perryville residents. Fourteen low-frequency events, possibly tremor, were recorded during the first 5 hours of the eruption, then recorded seismicity decreased. There is no notable correlation of timing of these seismic events with observations of eruptive activity."
Information Contacts: M. E. Yount, USGS, Anchorage; J. Taber and K. Hudnut, LDGO.
Steam and ash emission
At 1315 on 19 March Northern Air Cargo pilot Wallace Niles observed steam and ash emission from the summit. The plume rose 200 m and trailed SW for up to 40 km. Reeve Aleutian pilot Edward Livingston had observed minor steam emission but no ash at 0900 that day.
Information Contacts: J. Reeder, ADGGS.
Ash and steam eruption begins on 30 July; Strombolian activity
After 6 years of quiet, eruptive activity resumed on 30 July. Observers in Perryville . . . reported seeing black clouds ejected from the summit beginning at 1430 on 30 July and continuing into early August. A white steam cloud was present during the intervals between black emissions. A small eruption plume was observed on satellite imagery by the U.S. National Weather Service on 30 July, but none were seen in the following days. On the morning of 31 July, Perryville observers saw a gray cloud rising from the volcano and extending to the S. Commercial airline pilots on 2 August observed continued intermittent venting of black ash with a low ash cloud rising nearly 300 m.
Pilot reports on 3 August indicated that black ash was erupting from the summit vent of the intracaldera cone at 30-60 second intervals to a height of 2,400-3,000 m above sea level (840 m above the vent). Pilot reports also described a new steam vent that had formed in the icefield adjacent to the active cone, with the melting perhaps caused by a subglacial lava flow. At mid-day on 3 August, pilots of Reeve Aleutian Airways and personnel from the FWS (Alaska Peninsula/Becharof National Wildlife Refuge) observed the eruption site. They described intermittent ash emission and block ejection from the prominent cinder cone (summit elevation 2,160 m) located within the summit caldera. Material was being thrown an estimated 150-300 m above the cone. Steam was emanating from a depression 180-275 m wide in the glacial ice E of the cone's base. Residents of Port Heiden . . . reported a very light ash fall on the night of 3 August. Residents of Perryville, Chignik, and Chignik Lake, S and E of the volcano, also heard a "rumbling noise" accompanied by a slight tremor at about 2200 that night.
On the morning of 6 August, a resident of Port Heiden observed eruptions of ash and steam occurring at 3-4 minute intervals. These small plumes were reaching only several tens of meters above the summit. There were no reports of ashfall at other nearby villages. On 12 August, a pilot reported ash venting 600-900 m above the crater with the ash cloud carried ENE.
Observations indicate that the eruption is Strombolian (characterized by intermittent bursts of molten material several tens of meters above the vent), similar to previous historical eruptions at this volcano. As this activity continues, occasional ash falls are possible at Perryville and other nearby villages. AVO has no seismic monitoring equipment on Veniaminof and for this reason is not using the Level of Concern Color Code. A scientist from the Geophysical Institute at the Univ of Alaska installed a seismometer in Perryville on 4 August and an additional instrument will be installed closer to the volcano. These should aid efforts to identify future continuing activity.
Information Contacts: AVO.
Large pit forms in ice above a new lava flow on the E flank of the cone
The eruption . . . continued intermittently in October and early November. Heavy cloud cover prevented observations from 13 August to the end of September. During a few periods of good visibility on 31 August, an observer in Port Heiden . . . saw no eruptive activity at the summit. No ashfall has been reported since a very light dusting of fine ash in Port Heiden on 4 August.
On 1-2 October, residents of Port Heiden observed steam and ash emissions. An AVHRR image from the late morning of 2 October, the first clear satellite image in almost two months, showed a faint NE-directed plume and a hot area at the summit cinder cone. During the night of 7 October, residents of Perryville . . . observed bursts of incandescent material rising approximately 300 m above the summit. These bursts occurred about once every 10 minutes, were accompanied by loud rumbling sounds, and appeared to be similar in size to the eruptions in July and August. On 14 October residents of Perryville observed continued emission of a gray steam-and-ash plume to about 1 km above the summit. Though the summit was obscured by haze on 22 October, visual observations from Perryville indicated a decrease from earlier activity.
U.S. Coast Guard pilots filmed eruptive activity at the intracaldera cinder cone on 6 November. A new pit (2.0 x 0.75 km) that had formed in the ice adjacent to the cone on the E flank contained lava. Steam plumes rose from the outer margin of the lava where it contacted the ice walls of the pit. An ash-and-steam plume rose up to 2 km above the cinder cone (elevation 2,120 m), and a thin ash layer covered the ice-filled E floor of the caldera. The activity was similar to the 1983-84 eruption, which produced a lava-floored ice pit at the base of the cinder cone's S flank.
Information Contacts: AVO.
Vigorous steaming but no new ashfalls
On 4 August an eruption dropped a very light dusting of fine ash on Port Heiden . . . but no widespread ashfall has been reported since. During the week of 21-26 November residents 23 miles SE of Veniaminof reported vigorous steaming over the volcano. Poor weather for most of the interval from late November through mid-December prevented observers in Port Heiden from viewing Veniaminof; and during the same interval the NWS saw no evidence of volcanic activity at Veniaminof on satellite images.
Information Contacts: AVO.
Incandescent lava flow; low-level steam-and-ash plumes
A video tape recorded on 27 January showed eruptive activity at Veniaminof. The tape revealed small incandescent lava flows at the base of the intracaldera cone and within the melt pit that was observed in November 1993 (figure 7). Reports indicate that low-level steam-and-ash emissions have continued at Veniaminof during February and early March. Ground observers saw a dark plume and darkened snow at the vent during the first week of March. A large steam plume was observed during a period of clear weather on 11 March.
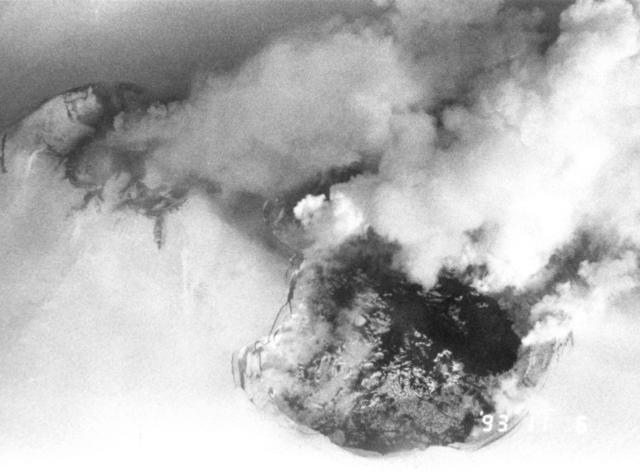 |
Figure 7. Photograph of the summit crater of Veniaminof and the adjacent E-flank pit melted in the ice, 6 November 1993. View is approximately to the NNW. The active cone rises ~300 m above the 2.0 x 0.75 km ice pit. A steam-and-ash plume can be seen rising from the summit cone; steam is also rising from the margins of the ice pit. Photograph by H.D. Stricklin, U.S. Coast Guard. |
Information Contacts: AVO.
Lava emissions from the active cone; short-lived ash bursts
Low-level steam-and-ash plume emissions continued during mid-March along with possible eruptions of lava. Ground observers saw glow near the summit and "sparks" at the vent during the week of 11-18 March. Satellite infrared images (AVHRR NOAA-11, 12; 1.1 km resolution) indicated hot spots on the ground near the vent. These probably represent fresh lava erupting from the volcano's active cone. Ground observers reported short-lived ash-bursts from the caldera's cone on 18-25 March. Poor weather obscured Veniaminof from satellite and ground observers during the last week of March. Although clear weather prevailed . . . in the first half of April, no steam or ash over the volcano was noted by residents of Port Heiden . . . .
Information Contacts: AVO.
Large steam plumes, lava emissions, and description of active cone and ice pit
The eruptive activity . . . continued through mid-May with steam plumes and lava emissions. Residents of Perryville . . . were able to see the top of Veniaminof on 21 April; a small steam plume was noted. During the week of 22-29 April, pilots and ground observers in Perryville reported occasional vigorous steam plumes emanating from near the intracaldera cinder cone. Perryville residents heard loud rumbling noises on 30 April and saw extensive glow over Veniaminof on the next evening (1 May). Large steam columns were reported by pilots and ground observers during that same period. Poor weather obscured the summit in late April and early May.
On 9 May 1994, AVO observers flew over the active cone for about 15-20 minutes around noon, and made 6-8 passes over the E flank of the active intracaldera cone. The summit of the main intracaldera cone was generally shrouded in steam and clouds (at about 2,400 m above sea level) but was obviously degassing vigorously, similar to 1983-84. Photos taken on 3 August 1993 indicated that the eruption began in the summit area.
The eruption has formed an oval-shaped NE-SW lava field about 1,000 m (N-S) x 800 m (E-W) on the SE flank of the main intracaldera cone between ~1,925 and 1,770 m elevation (preliminary measurements are based on guesses as to scale, similarity to 1983-84 features, etc.). The lava is assumed to be similar in composition to material erupted during 1983-84 and earlier eruptions, which was basaltic andesite with about 54% SiO2. Assuming an area of 0.8-1.0 km2 and an average thickness of 20 m, the volume of the lava field is 16-20 x 106 m3. The volume of magma erupted in 1983-84 was ~40 x 106 m3.
The new lava is black with some snow cover along the W margin and a few scattered snow fields low on the S and SE flanks. The lava field is composed of block lavas with well-developed levees and channels; most of the lavas appear to have moved in a general N to S direction. The N and upslope end of the lava field was apparently the source area for most, if not all, of the flows. A sharp-featured cone centered about 100 m from the edge of the ice rises 100-150 m above the surrounding ice-field and dominates this part of the field. Photographs indicate that this feature is the N half of a cinder cone; the S half apparently either collapsed or was blown away, resulting in an E-W trench and debris pile at the base of the cone. This cone, referred to hereafter as "Half Cone," was probably the locus of early activity. Except for part of its steep S slope, however, it was snow-covered, indicating a lack of recent activity. Fumes rose from the cone but no point-source fumaroles were apparent.
Three low mounds at the SW base of Half Cone were arranged in a dog-legged N-S direction with the middle mound slightly W of the others. Covered with yellow-green alteration encrustations typical of vent areas, the mounds were connected by a low fissure-like ridge covered with similar material. These mounds, and possibly the connecting ridge, have been the source of many lava flows. An incandescent bright orange-red fan-shaped lava flow was being extruded from the central mound and moving E into what looked like the E-W trench at the base of Half Cone. This W to E direction is in contrast to the general N to S movement of earlier flows. The incandescent part of the flow was an estimated 80 m long and the flow was perhaps 10 m wide at its point of issue. A line of blue gases (SO2?) extended for perhaps another 100 m to the E. Eruptive products appeared to be entirely lava; no fresh ash was seen on the surrounding ice field.
The ice pit melted by the lava field had vertical, jagged walls 30-50 m high, exposing numerous black ash layers from earlier eruptions. Fractures in the ice-field are sparsely developed parallel to the W (up-slope) wall and more extensively developed parallel to the E wall (extending perhaps 100-200 m from the wall). A series of crescent-shaped fractures in the ice field, which extended 500 m from the S end of the lava field, suggested that lava had reached the caldera floor and caused sub-glacial melting, local ice cap uplift, and subsequent collapse similar to the 1983-84 eruption. This collapse area partially overlapped the E end of the 1983-84 ice pit. No lake separated the lava flow from the ice, and there was no sign of the tunnels or ductile deformation in the ice so visible in 1983-84. Assuming a 1 km2 area and a 30-50 m thickness, 30-50 x 106 m3 of ice (<1% of the ice in the caldera) have been melted during the present eruption. An estimated 150 x 106 m3 of ice melted during the 1983-84 eruption.
Gas and steam was seen rising sparsely and discontinuously over the surface of the lava field. A vigorous fumarolic plume rose from the margin of the lava field E of the active flow. The second most active fumarole issued from the edge of the lava field N of Half Cone, and a third strong fumarole rose from the SE margin of the lava field. All three plumes were white in color and issued from the ice field at the lava-field contact. Whether each one represented an active lava flow or some combination of cooling lava, water, and ice field was unknown.
Information Contacts: AVO.
Occasional steam plumes seen during breaks in the weather
Residents in Perryville . . . reported a large steam plume rising from Veniaminof on the afternoon of 20 May. Inclement weather prevented observation of any other activity during the second half of May. Residents of Port Heiden . . . who were able to see the volcano on 2 June reported that no plume was present over the summit caldera. However, they did observe a steam plume on 9 June. AVO received no pilot reports of continuing eruptive activity in early June.
Information Contacts: AVO.
Steam-and-ash plume rises to 3,600 m altitude
On 29 June, several pilot reports received by the FAA indicated a steam-and-ash eruption from the active cone in the caldera. Reports stated that a plume was rising from the vent to an altitude of 3,600 m above sea level and extending 24-32 km downwind to the SW. The plume was described as dark-gray near the summit and becoming wispy at some distance away. A weak ash plume was detected on AVHRR satellite images. By the morning of 30 June, no further eruptive activity was observed by pilots. A "warm" spot, detected on AVHRR satellite images, persisted from 17 June through 1 July. On 7 July, observers in Perryville . . . reported a small steam plume. Ash deposits from activity during the previous week had darkened the snow along the caldera rim, but no ash fell on Perryville. Renewed activity since July 1993 has typically consisted of low-level ash eruptions and sporadic lava flows.
Information Contacts: AVO.
Intermittent steam-and-ash plumes
During mid-July, observers in Perryville . . . reported a small steam plume over the volcano. Satellite imagery recorded a hot spot at the volcano on 10 August, but no additional reports were received until 12 August, when observers in Perryville saw low-level steam-and-ash emission. Snow on the upper S flank was gray, indicating a light ash cover. Observers in Port Heiden . . . were able to view Veniaminof on several days during 12-19 August, but no steam or ash clouds were visible. On 16 August, a pilot reported a plume, possibly containing small amounts of ash, rising 300 m above the volcano. During 19-26 August, observers in Port Heiden and Perryville could see Veniaminof and reported that no steam or ash clouds were visible.
Observers in Perryville noted a small steam plume over the volcano in late August and occasionally during the first half of September when weather conditions were favorable. Poor weather prevented visual observation of Veniaminof during 16-23 September. Residents of Port Heiden observed steam and ash bursts reaching ~600 m over Veniaminof on 28 September. On that day, AVHRR satellite imagery showed a "hot" spot at the volcano. Residents of Port Heiden reported no activity on 6 October, the one day they could see the volcano. Also, AVHRR satellite imagery showed overcast conditions during 1-7 October.
Information Contacts: AVO.
Possible "hot spot" on satellite imagery, but no activity observed
Cloudy conditions throughout October and the first half of November prevented observations on most days. On 13 October AVHRR satellite imagery revealed a "hot spot" in the same location as during the past few months, but no eruption cloud was observed. By October 18, when clear skies allowed good views, no "hot spot" or eruption cloud was detected. Satellite imagery on 17 November again revealed a possible "hot spot" within the caldera, indicating probable continuing low-level activity. No activity was observed from Perryville . . . during clear conditions on 24 November.
Information Contacts: AVO.
Small plumes seen; warm spots identified from satellite images
During the first quarter of 1995, thermal anomalies were detected on satellite images of Veniaminof intermittently through 13 March. However, because neither ground observers nor pilots reported eruptive activity, these anomalies were thought to be related to the cooling lava flow in the summit caldera. On 17 April an observer in Port Heiden (97 km NE) saw small, dark plumes from Veniaminof. Observers from Perryville (32 km S) reported on 21 April that there had been a small steam plume during the preceding several days. This activity coincided with warm spots near the active vent seen on satellite images from 14, 21, and 22 April.
Information Contacts: Alaska Volcano Observatory (AVO), a cooperative program of a) U.S. Geological Survey, 4200 University Drive, Anchorage, AK 99508-4667, USA, b) Geophysical Institute, University of Alaska, PO Box 757320, Fairbanks, AK 99775-7320, USA, and c) Alaska Division of Geological & Geophysical Surveys, 794 University Ave., Suite 200, Fairbanks, AK 99709, USA.
Small steam plume and hot spot on satellite imagery
During 9-23 June, residents of Perryville, ~30 km S of Veniaminof, reported steam rising a few hundred meters over the summit. A hot spot was detected on AVHRR satellite images throughout this period. Poor weather prevented observation in late June.
Information Contacts: Alaska Volcano Observatory (AVO), a cooperative program of a) U.S. Geological Survey, 4200 University Drive, Anchorage, AK 99508-4667 USA, b) Geophysical Institute, University of Alaska, PO Box 757320, Fairbanks, AK 99775-7320, USA, and c) Alaska Division of Geological & Geophysical Surveys, 794 University Ave., Suite 200, Fairbanks, AK 99709, USA.
Small steam plumes and hot spots on satellite images
Clouds frequently obscured the volcano in July and August, preventing ground and satellite observations. Observers in Perryville (~30 km S of Veniaminof) got good views on 13 and 27 July, and reported light steaming on both days. On 28 July a weak hot spot centered on Veniaminof was noted on an AVHRR image. Perryville residents reported clear skies but no evidence of activity on the morning of 4 August, and AVHRR satellite images on 4 and 5 August showed no hot spot. Perryville residents saw a small steam plume on 9 August, a small steam plume and "smoke" during the week of 12-18 August, and a small steam plume again during 19-25 August. AVHRR satellite images on 14 and 21 August showed no hot spots. Another AVHRR image from late on 31 August showed a possible steam plume ~50 km long blowing NW of Veniaminof. The hot spot was ~15°C warmer than the surrounding features (probably ice and snow near the summit).
Information Contacts: Alaska Volcano Observatory (AVO), a cooperative program of a) U.S. Geological Survey, 4200 University Drive, Anchorage, AK 99508-4667 USA, b) Geophysical Institute, University of Alaska, PO Box 757320, Fairbanks, AK 99775-7320, USA, and c) Alaska Division of Geological & Geophysical Surveys, 794 University Ave., Suite 200, Fairbanks, AK 99709, USA.
Minor steam and ash emissions in November
On 15 November, residents of Perryville, ~30 km S, heard rumblings and booms through the early evening. They also observed minor ash emission, as well as increased steaming. Minor steam and ash emission was again observed on 30 November. Veniaminof was obscured by clouds on satellite imagery of 15 November, and no hot spot was visible during the last week of the month. Low-level eruptive activity has been intermittent since July 1993 (BGVN 18:07).
Information Contacts: Alaska Volcano Observatory (AVO), a cooperative program of a) U.S. Geological Survey, 4200 University Drive, Anchorage, AK 99508-4667, USA, b) Geophysical Institute, University of Alaska, PO Box 757320, Fairbanks, AK 99775-7320, USA, and c) Alaska Division of Geological & Geophysical Surveys, 794 University Ave., Suite 200, Fairbanks, AK 99709, USA.
Volcanic unrest, uncertain low-level eruptive activity in September 2002
On 10 September 2002 the Alaska Volcano Observatory (AVO) detected 1-minute-long pulses of low-frequency tremor arriving every 2-5 minutes on several seismic stations at Veniaminof. This type of seismicity is indicative of volcanic unrest. Retrospective analysis of seismic data suggested that tremor began as early as 8 September. The overall level of seismicity decreased through late September, but remained above the background level established during the summer of 2002.
On 24 September, residents of Perryville, 35 km S of the volcano, reported and photographed small bursts of steam, possibly containing minor amounts of ash, rising just above the historically active intracaldera cinder cone. Without additional observations, AVO could not determine if this indicated very low-level eruptive activity or vigorous steaming from the cone. On several occasions of relatively clear weather conditions, AVO observed no signs of elevated temperature or ash emission on satellite imagery.
A satellite image recorded on 2 October suggested an apparent gray, diffuse deposit extending across the caldera from the historically active intracaldera cinder cone. This could reflect a small explosion, vigorous steam emission, or redistribution of material on the cone by strong winds. No thermal anomalies were observed on satellite imagery. AVO considered the activity at Veniaminof to be minor, but the exact nature of the unrest remained unknown. Due to the continuing seismicity and reports of unusual steaming, the Concern Color Code remained at Yellow.
Information Contacts: Alaska Volcano Observatory (AVO), a cooperative program of a) U.S. Geological Survey, 4200 University Drive, Anchorage, AK 99508-4667, USA, b) Geophysical Institute, University of Alaska, PO Box 757320, Fairbanks, AK 99775-7320, USA, and c) Alaska Division of Geological & Geophysical Surveys, 794 University Ave., Suite 200, Fairbanks, AK 99709, USA.
Minor ash emissions in early October 2002; increased seismicity in December
Uncertain low-level eruptive activity occurred at Veniaminof in September 2002 (BGVN 27:10). During October 2002, seismicity was lower than when it was first noted in early September, although it was still above background levels. Visual observations were intermittent and inconclusive. The Alaska Volcano Observatory (AVO) received reports ranging from minor-steam and possible ash emissions, to no signs of activity. Satellite imagery on 2 October suggested an apparent gray, diffuse deposit extending across the caldera from the historically active intracaldera cinder cone. This could reflect a small explosion, vigorous steam emission, or redistribution of material by strong winds; no thermal anomalies were observed on satellite imagery. Footage obtained later, but recorded in early October, showed minor ash emission from the intracaldera cone rising ~100-200 m above the cone and drifting a short distance before dispersing. A faint covering of ash was visible on the caldera ice field extending from the base of the cone.
On 18 November AVO lowered the Concern Color Code from Yellow to Green. Since early October they had received no pilot reports or other observations of activity at the volcano. Also, they had not detected thermal anomalies in any clear satellite images. Though seismicity remained above levels recorded during summer of 2002, it remained roughly constant during the previous month at a level notably lower than in September.
Seismicity began to increase in mid-December, and on 6 January AVO raised the Concern Color Code from Green to Yellow. No thermal anomalies were detected on satellite imagery. Elevated seismicity continued through February 2003, with discrete seismic events occurring at a rate of 1-2 per minute during 21-28 February. Nearly constant periods of seismicity were recorded during the report week. Discrete seismic events occurred at rates up to 1-2 events per minute, along with moderate levels of volcanic tremor. Satellite imagery did not reveal increased surface temperatures, ash emission, or ash deposits. Visual observations on 22 January from the village of Perryville, located 35 km SSW of the volcano, revealed that white steam was rising from the intracaldera cone. The steaming was similar to that observed over the previous several months. The Concern Color Code remained at Yellow.
Information Contacts: Alaska Volcano Observatory (AVO), a cooperative program of a) U.S. Geological Survey, 4200 University Drive, Anchorage, AK 99508-4667, USA, b) Geophysical Institute, University of Alaska, PO Box 757320, Fairbanks, AK 99775-7320, USA, and c) Alaska Division of Geological & Geophysical Surveys, 794 University Ave., Suite 200, Fairbanks, AK 99709, USA.
Seismicity elevated through February, but drops in late March
An increase in seismicity since mid-December was a constant trend through February 2003 (BGVN 28:01). During the week of 7 March, discrete seismic events occurred at a rate of about 1-2 events per minute. On 11 March, a 4-hour period of continuous seismic tremor was followed by 17 hours of discrete seismic events and 3-4-minute-long tremor bursts. This culminated with another 4-hour period of continuous tremor on 12 March. Seismic activity later that week was characterized by discrete small-amplitude events occurring every 1-2 minutes. Satellite images collected during clear periods on 4, 6, 7, and 12 March did not reveal any elevated surface temperatures, ash emissions, or ash deposits. Observers in Perryville, 35 km S of Veniaminof, reported no significant plume or other signs of volcanic activity on 12 March. Consistent elevated seismicity, with small-amplitude discrete events every 1-2 minutes continued during the week of 21 March.
Seismicity declined during the last week of March, characterized by very low-amplitude tremors. Satellite images collected during numerous clear periods that week did not reveal any elevated surface temperatures, ash emissions, or ash deposits. There was a dramatic decrease in volcanic activity during the week of 4 April. However, short periods of volcanic tremor and low frequency events were still recorded. This continued into the week of 11 April, prompting the lowering of the level of concern. The Alaska Volcano Observatory (AVO) announced a code color of green, under which the volcano is classified as dormant with normal seismicity and fumarolic activity occurring.
Information Contacts: Alaska Volcano Observatory (AVO), a cooperative program of a) U.S. Geological Survey, 4200 University Drive, Anchorage, AK 99508-4667, USA (URL: http://www.avo.alaska.edu/), b) Geophysical Institute, University of Alaska, PO Box 757320, Fairbanks, AK 99775-7320, USA, and c) Alaska Division of Geological & Geophysical Surveys, 794 University Ave., Suite 200, Fairbanks, AK 99709, USA.
Ash emissions and seismic activity from mid-February through June 2004
After many years of quiescence, Veniaminof began exhibiting increased seismicity during September 2002 along with some possible low-level eruptive activity (BGVN 27:10). Variable seismicity contined to be recorded from October 2002 through mid-April 2003 accompanied by steam emissions from the intracaldera cone (BGVN 28:01 and 28:03). No additional signs of activity were noted until mid-February 2004.
Activity during February 2004. During the week of 15 February 2004, the Alaska Volcano Observatory (AVO) received several reports of small ash clouds rising ~ 30-90 m above the intracaldera cinder and spatter cone of Veniaminof. Residents of Perryville (~ 30 km S) reported a "black puff" of ash on 16 February, followed by strong steam emissions.
A pilot reported a small black ash cloud on 19 February. Satellite imagery from 2310 UTC (1410 AST) on 19 February showed a small, dark trail on the snow leading away from the intracaldera cone, possibly an intra-caldera ash deposit. Aerial photographs on 21 February showed distinct ash deposits (figure 8). No significant seismic activity or thermal anomalies were recorded during the week. Due to the lack of significant seismic activity beneath the volcano, AVO concluded that these small ash clouds were the result of minor explosions caused by the heating of ground water below the intracaldera cone. The Concern Color Code remained at Green.
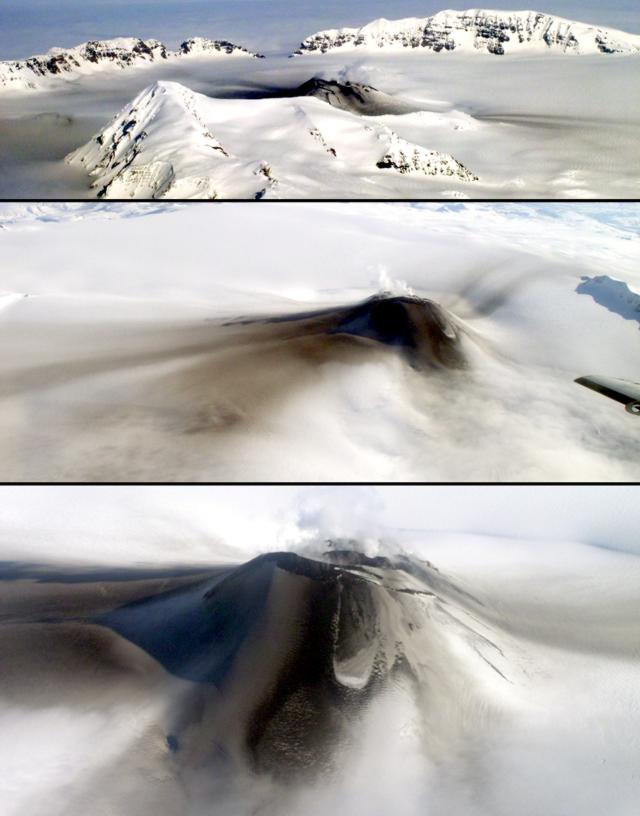 |
Figure 8. Photographs showing ash deposits in Mount Veniaminof's intracaldera zone taken on 21 February 2004. The top view is from the SW with the Cone Glacier and a caldera rim segment in the left foreground, the intracaldera cone in the center, and the NE caldera rim divided by the Crab Glacier in the background. The close-up photographs of the cone were taken while looking generally SE. Courtesy of Nathan Fratzke and Heidi Breon (Peninsula Airways). |
Satellite imagery on 22 February (figure 9) again showed very localized deposits within the ice-filled caldera. No additional signs of volcanic activity were visible on satellite imagery during 23-27 February, and there were no more reports of ash-plume sightings from observers. Seismicity remained at a low level, and the thermal signature of the intracaldera cone was unchanged from previous months.
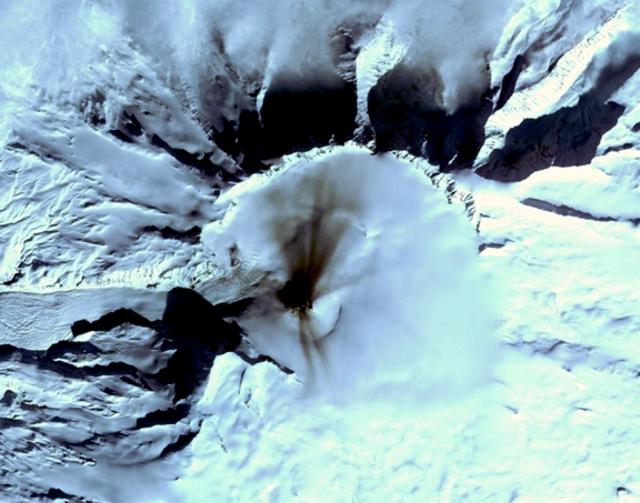 |
Figure 9. Image of Veniaminof from the Terra ASTER 15-m satellite (bands 3, 2, and 1) acquired on 22 February 2004 at 2158 UTC (1258 local time). This close-up view shows several ash bands in different directions suggesting multiple small ash eruptions with visible deposits largely confined within the 8- to 11-km-diameter caldera walls. Courtesy of AVO. |
Activity during April 2004. During the week of 11 April, several low-level episodes of volcanic tremor and small volcanic earthquakes were recorded. The tremor occurred in pulses lasting several minutes. This represented the strongest seismicity since early 2003 when the Concern Color Code was downgraded from Yellow to Green, although no significant changes in the thermal signature of the intracaldera cone were noted in satellite data.
Perryville residents reported that a steam emission, possibly containing a small amount of volcanic ash, was visible most of the day on 18 April. It became most vigorous at approximately 1730 ADT (0130 UTC on 19 April) when it rose to ~ 460-610 m above the intracaldera cone (~ 2,590-2,740 m altitude). Starting at approximately 1130 ADT on 19 April, tremor and earthquake levels increased, albeit to lower levels than those during the previous week. The Color Code was upgraded to Yellow. During subsequent days in the week of 19 April there was a marked decrease in the episodes of low-level volcanic tremor and small volcanic earthquakes. No emissions were reported.
On the afternoon and evening of 25 April, more than 25 small steam and ash emissions were seen during an 8-hour period, producing clouds that rose ~ 300-610 m above the active cone. During the week of 25 April activity was characterized by small, intermittent ash emissions, low-level volcanic tremor, and small volcanic earthquakes. Small ash emissions were observed during periods of clear weather on 28 April. Ash clouds rose ~ 0.3-1 km above the active cone, and at times were observed drifting for distances of ~ 16 km. Seismic activity fluctuated but remained above background levels.
Activity during May 2004. The week of 2 May was characterized by small, intermittent ash emissions, low-level volcanic tremor, and small volcanic earthquakes. Small ash emissions were observed during periods of clear weather on 1-3 May. Ash clouds rose ~ 300-610 m above the active cone. No systematic visual observations of ash plumes were made during 4-18 May due to the camera-monitoring system being repaired, though residents reported continued activity on 5 May. However, the observed seismicity was similar to that recorded in the previous week, suggesting that ash emissions continued. Satellite imagery showed ash deposits on the snow to distances of ~ 8 km from the vent, and a pilot reported ash as far as 33 km from the cone.
There were no observations of ash emissions during the week of 9 May, when cloudy conditions obscured the volcano. Seismic activity was more intermittent and lower in amplitude than in previous weeks; however, seismicity suggested that ash emissions occasionally occurred. Unrest during the week of 16 May was characterized by moderate levels of intermittent volcanic tremor, which was similar to the seismic signals recorded in association with the small ash emissions of 25 and 28 April and 1-3 May. On 18 May, a pilot reported an ash plume rising 300-900 m above the volcano's summit (2.8-3.4 km altitude) and extending ~32 km NE. Cloudy conditions obscured observation by satellite.
Bursts of volcanic tremor continued during the week of 24 May. Activity in general was lower than that of the previous week, but sequences of tremor accompanying ash emissions continued to be observed. Clear views of the volcano on 26 May showed weak steam and low ash emissions emanating from the intracaldera cone. Most of these emissions did not rise higher than the active cone (2,507 m elevation). Satellite data acquired on 26 May showed ash deposits in the N and SE portions of the caldera. The only significant ash emissions observed during the week of 31 May occurred the evening of 30 May into the morning of 31 May; none appeared to have exceeded 3,000 m altitude. Clear views earlier on 30 May showed steam emissions from near the base of the intracaldera cone, which rarely rose above the top of the cone. No activity was observed in satellite data as the volcano was largely obscured by clouds.
Activity during June 2004. Bursts of volcanic tremor continued throughout June, and were thought to be indicative of small, low-level ash emissions. Clouds obscured the volcano for most of the month, making observations difficult. The only ash emissions observed in the week of 7 June occurred the evening of 11 June. None appeared to have exceeded 3,000 m altitude. On 16 June at 2350, a pilot observed an ash cloud that rose ~ 2,650 m altitude. This ash cloud was also observed in satellite imagery. Low-level activity continued during the week of 28 June, with episodes of low-level tremor and small volcanic earthquakes occurring regularly on 30 June. Observations made by AVO during an aerial overflight of the active cone on 27 June indicated small amounts of dark ash on the surface of the snow within the ice-and-snow-filled caldera. The ash, although apparently thin, covered most of the snow surface inside the caldera.
Information Contacts: Alaska Volcano Observatory (AVO), a cooperative program of a) U.S. Geological Survey, 4200 University Drive, Anchorage, AK 99508-4667, USA (URL: http://www.avo.alaska.edu/), b) Geophysical Institute, University of Alaska, PO Box 757320, Fairbanks, AK 99775-7320, USA, and c) Alaska Division of Geological & Geophysical Surveys, 794 University Ave., Suite 200, Fairbanks, AK 99709, USA.
Ash emissions in January and Strombolian eruptions in February
After a long period of quiescence, Veniaminof began exhibiting increased seismicity and possible low-level eruptive activity from September 2002 through mid-April 2003. Between mid-April 2003 and February 2004 no signs of activity were observed. From February 2004 until the end of June 2004 steam and ash emissions were observed and volcanic tremor and earthquakes recorded (BGVN 29:06).
Activity during July 2004. Throughout July 2004 short intervals of volcanic tremor continued. Small amounts of dark ash were seen in the ice-filled caldera on 27 June. During the second week of July, the Alaska Volcano Observatory (AVO) reported that the tremor correlated well with ash-and-steam plumes as high as 1.5 km altitude; during the rest of the month, these plumes may have reached as high as 3.7 km altitude. On 22 July at 1229, an AVO field crew witnessed a small ash burst rise a few hundred meters above the summit of the intracaldera cone (figure 10). This type of activity had prevailed at Veniaminof during the previous three months. During the last week of July, the cone produced variable amounts of white steam from at least two separate craters near its top. The snow-and-ice field over much of the caldera was covered with a discontinuous, 1- to 2-mm thick ash blanket. No visual observations of ash emissions were made after 22 July, although the recorded seismicity was similar to that observed during ash emissions in the previous few months. Veniaminof remained at Concern Color Code Yellow throughout July.
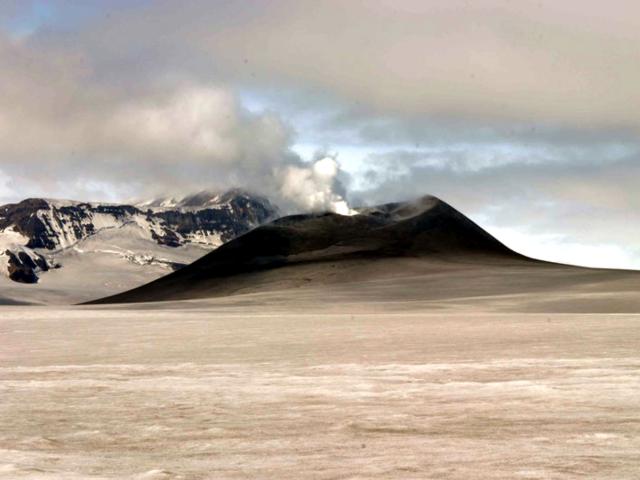 |
Figure 10. Veniaminof's intracaldera cone photographed on 22 July 2004 in a view to the SW. The ~330-m-high intracaldera cinder and spatter cone was the source of all known historical Veniaminof eruptions. The cone protrudes through glacial ice that fills the summit caldera. Although this photo was taken during an interval with occasional minor ash and steam emissions, at this moment only steam rises to a few hundred meters above the cone. A very faint dusting of ash has discolored the glacier's surface; however, some may be older, wind-blown ash rather than freshly erupted ash. Courtesy of K.L. Wallace, USGS. |
Activity during August 2004. Episodes of volcanic tremor continued throughout August. No visual observations of ash emissions were made from 22 July through the first week of August, although the recorded seismicity was similar to that observed during ash emissions in the previous weeks. Throughout the month, frequent small ash-and-steam emissions from Veniaminof were visible on the web camera in Perryville and confirmed by AVO geologists working in the area. Bursts of volcanic tremor recorded intermittently on 17 August were probably associated with low-level, short-term ash emissions. Veniaminof remained at Concern Color Code Yellow throughout August 2004.
Activity during September 2004. During the first three weeks of September both low-level tremor and intermittent bursts of tremor continued at Veniaminof. AVO scientists believed tremor episodes likely represented low-level ash-and-steam emissions similar to those observed during the previous two months. Minor emissions of ash and steam were occasionally seen on the web camera during clear weather. During the last week of September, low-level tremor and intermittent small tremor bursts may have occurred at Veniaminof, but high winds in the area caused considerable vibrational noise, masking the signal of interest, and making analysis of seismic records inconclusive. The winds were strong enough to hide evidence of low-level tremor. If the tremor episodes continued, they likely corresponded with low-level ash-and-steam emissions similar to those observed over the previous four months. Cloudy conditions obscured views of the volcano by web camera and satellite. Veniaminof remained at Concern Color Code Yellow throughout September.
Activity during October 2004. Low-level seismic tremor and intermittent small tremor bursts continued. These tremor episodes likely represented low-level ash and steam emissions similar to those observed over the past four months, although cloudy conditions obscured views of the volcano by web camera and satellite. Low-level tremor during 8-15 October correlated with weak steaming of the intracaldera cone as observed on the web camera. No ash emissions were observed, although cloudy conditions over the caldera restricted viewing for much of the week. AVO lowered the Concern Color Code at Veniaminof on 26 October from Yellow to Green. Seismicity, which had been associated with ash emissions during the summer of 2004, decreased to levels that indicated ash, ash-and-steam, or steam emissions were no longer occurring on a regular basis. Since early September, no ash emissions were seen on the web camera and no evidence of ash was visible on satellite imagery. Also, AVO had received no recent reports of ash from pilots or ground observers. AVO considered the intermittent, low-level seismic tremor that continued to be recorded at the volcano to be part of the background activity.
Activity during January 2005. AVO raised the Concern Color Code at Veniaminof from Green to Yellow on 4 January because around that time several small ash emissions from the volcano's intracaldera cone were observed on the web camera in Perryville. Ash emissions were visible starting around 0938, but may have been obscured by meteorological clouds in previous images. The discrete ash emissions were small, rose hundreds of meters above the cone, and dissipated as they drifted E. Minor ash fall was probably confined to the summit caldera. Very weak seismic tremor was recorded beginning on 1 January, and increased slightly over the next 2 days. These seismic signals were similar to those recorded during steam-and-ash emissions in April to October 2004. However, there were no indications from seismic data that events significantly larger than those observed around 4 January were imminent.
AVO raised the Concern Color Code at Veniaminof from Yellow to Orange on 10 January as ash emissions from the volcano's intracaldera cone reached heights of nearly 4 km during 8-10 January (figure 11). Seismicity remained at elevated levels and satellite images showed a persistent thermal anomaly at the intracaldera cone. On 11 January, the Anchorage VAAC again reported emission of a thin ash cloud to ~ 3 km altitude visible on the Perryville web camera. On 12 January the Anchorage VAAC reported emission of a thin ash cloud, visible on the Perryville web camera, that rose to 3-4 km altitude, extended ENE, and dissipated within ~ 55 km of the volcano. On 14 January, a satellite image showed a thermal anomaly in the vicinity of the Veniaminof summit. Although the anomaly appeared less intense than when first detected on 8 January and volcanism seemed to have declined significantly since 12 January, activity still remained significantly higher than normal with occasional bursts of volcanic tremor.
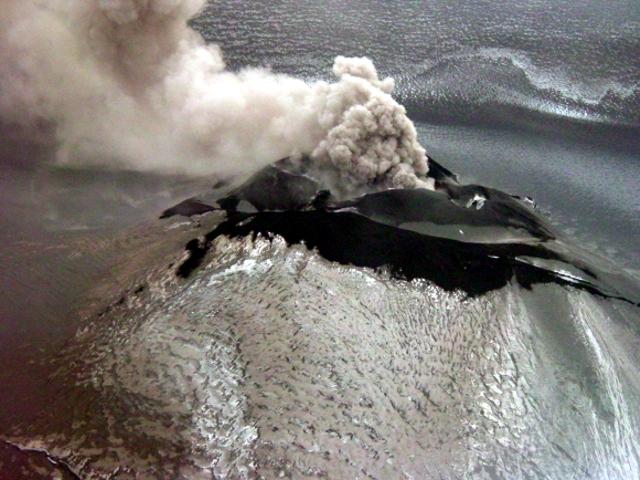 |
Figure 11. Veniaminof intracaldera cinder cone, 11 January 2005. The elevation of the cone is 2,156 m and the ash plume is drifting to NE. Photo taken during an observational overflight. Image courtesy of K.L. Wallace, USGS. |
During the rest of the month of January, seismic data, web camera views, and satellite images indicated that low-level ash emissions continued at Veniaminof. Seismicity was similar to levels observed during the previous week, consisting of low-amplitude volcanic tremor with occasional larger bursts. During clear weather, satellite imagery showed anomalous heat at the summit cone, consistent with hot blocks and ash being ejected from the active vent. In addition, the web camera showed intermittent ash plumes reaching as high as 3 km altitude. Occasional stronger bursts of seismic tremor during 20-21 January and around 28 January may have indicated plumes to higher levels, but not above 4 km altitude. Veniaminof remained at Concern Color Code Orange.
Activity during February 2005. On the evening of 3 February, Strombolian activity at Veniaminof was visible by residents of Perryville ~ 30 km from the volcano. Activity was also observed on web camera views and seen by satellite as an increase in radiated surface heat. An increase in seismicity suggested that Strombolian activity may have continued through 4 February while the volcano was obscured by clouds.
During 28 January to 4 February, seismicity at Veniaminof was similar to levels for the previous week, with low-amplitude tremor and occasional larger bursts. During clear weather, satellite imagery showed anomalous heat at the summit cone, consistent with hot blocks and ash being ejected from the active vent. The web camera showed intermittent ash plumes reaching as high as 3 km altitude. Veniaminof remained at Concern Color Code Orange.
Low-level Strombolian eruptive activity continued at Veniaminof during 4-11 February. On 9 February, an ash burst rose hundreds of meters above the intracaldera cone. Satellite images continued to show a thermal anomaly in the vicinity of the intracaldera cone, consistent with the presence of hot material at the vent. Seismicity remained above background levels at the volcano. On the morning of 10 February there was a distinct increase in the amplitude and frequency of earthquakes. The increase continued through 11 February. This activity was consistent with more energetic explosions from the active cone, but there were no indications that the bursts rose higher than 4 km altitude. Veniaminof remained at Concern Color Code Orange.
During 11-18 February, it was likely that low-level Strombolian eruptive activity continued at Veniaminof based on seismic data and satellite imagery. Cloudy conditions obscured web camera views of the volcano, and no ash emissions were observed above the cloud cover. Seismicity remained above background levels at Veniaminof. The character of the seismicity changed slightly during the report period, with frequent periods of continuous banded volcanic tremor occurring, but the amplitudes of earthquakes did not increase. This activity was consistent with explosions from the active cone; however, there was no indication that these bursts rose more than 4 km altitude. Veniaminof remained at Concern Color Code Orange.
Seismicity decreased substantially at Veniaminof during 18-25 February in comparison to previous weeks, leading AVO to decrease the Concern Color Code from Orange to Yellow. Periods of volcanic tremor diminished, and no discrete events associated with ash bursts had occurred for several days. Only minor steam emissions were seen. AVO received no reports of ash emissions from pilots or ground observers. AVO concluded that given the decline in seismicity, it appeared that the most recent episode of Strombolian eruptive activity at Veniaminof had ended.
Activity during March 2005. A further reduction in activity at Veniaminof during 25 February to 4 March led AVO to reduce the Concern Color Code from Yellow to Green, the lowest level. For more than a week seismic activity was at background levels, periods of volcanic tremor had ceased, and there were no discrete events associated with ash bursts. Only minor emissions of steam were observed on the web camera and satellite imagery. AVO received no reports of ash emissions from pilots or observers on the ground. They concluded that given the decline in seismicity it appeared that the most recent episode of eruptive activity had ended at Veniaminof.
Information Contacts: Alaska Volcano Observatory (AVO), a cooperative program of a) U.S. Geological Survey, 4200 University Drive, Anchorage, AK 99508-4667, USA (URL: http://www.avo.alaska.edu/), b) Geophysical Institute, University of Alaska, PO Box 757320, Fairbanks, AK 99775-7320, USA, and c) Alaska Division of Geological & Geophysical Surveys, 794 University Ave., Suite 200, Fairbanks, AK 99709, USA; Kristi L. Wallace, USGS/AVO, Alaska Tephra Laboratory and Data Center, 4230 University Drive, Suite 201, Anchorage, AK 99508, USA.
Modest ash emissions during September 2005-22 April 2006
On 7 September 2005, the Alaska Volcano Observatory (AVO) noted several minor bursts of ash from the volcano during the afternoon. Ash bursts continued to occur through at least 9 September, with ash rising less than 3 km altitude, and with the ash confined to the caldera. Over the following 2 weeks, minor ash emission continued at a rate of 1-5 events per day based on interpretations of seismic data. AVO reported that it was likely that diffuse ash plumes rose to heights less than ~ 3 km and were confined to the summit caldera. Cloudy weather during 16-23 September prohibited web-camera and satellite observations of Veniaminof, but seismic data indicated diminishing activity. On 28 September seismicity had remained at background levels for over a week, and there was no evidence to suggest that minor ash explosions were continuing.
On 4 November 2005, a low-level minor ash emission occurred from the intracaldera cone beginning at 0929. Ash rose a few hundred meters above the cone, drifted E, and dissipated rapidly. Minor ashfall was probably confined to the summit caldera. During the previous 2 weeks, occasional steaming from the intracaldera cone was observed. Very weak seismic tremor and a few small discrete seismic events were recorded at the station closest to the active cone. However, AVO reported that there were no indications from seismic data that a significantly larger eruption was imminent.
On the morning of 3 March 2006 ash again rose a few hundred meters above the intracaldera cone, drifted E, and dissipated rapidly. Ashfall was expected to be minor and confined to the summit caldera. Seismicity was again low and did not indicate that a significantly larger eruption was imminent. Over the week of 5-10 March, seismicity was low but slightly above background.
On the morning of 10 March, AVO received a report from a pilot of low-level ash emission from the intracaldera cone. Clear web-camera views on 9 March showed small diffuse plumes of ash extending a short distance from the intracaldera cone. The Anchorage Volcanic Ash Advisory Center (VAAC) reported a steam/ash plume noted on web-cam and satellite on 13 March 2006 at 0500Z (12 March 2006 at 2000 hours local), moving NNW at 9.2 km/hr and falling to the land surface. Web-cam images on 22 March showed a very diffuse steam-and-ash plume that was confined to the summit caldera, and on 24 March showed a steam-and-ash plume drifting from the summit cone at a height of less than 2.3 km. This level of activity was similar to that on 23 March, but higher than activity on 21 and 22 March, when a very diffuse steam-and-ash plume was confined to the summit caldera.
The flow of seismic data from Veniaminof stopped on the evening of 21 March 2006, and the problem was expected to continue until AVO staff could visit the site to repair the problem. Absent seismic data, the volcano could potentially still be monitored in other ways such as using web-camera and satellite images. Imagery was obscured by cloudy weather after 21 March. On 26 March 2006, a pilot reported a small ash plume rising above the volcano. Low-altitude ash emissions from Veniaminof were visible during 31 March to 7 April. On 6 April, a pilot reported an ash plume at a height of 3 km. AVO stated in its weekly report of 14 April 2006 that the seismicity at Veniaminof remained low but above background. Internet camera and satellite views had been obscured by cloudy weather, and AVO lacked new information about ash clouds or activity.
Information Contacts: Alaska Volcano Observatory (AVO), a cooperative program of the U.S. Geological Survey, 4200 University Drive, Anchorage, AK 99508-4667, Geophysical Institute, University of Alaska, PO Box 757320, Fairbanks, AK 99775-7320, and Alaska Division of Geological & Geophysical Surveys, 794 University Ave., Suite 200, Fairbanks, AK 99709, USA (URL: http://www.avo.alaska.edu/); Charles R. Holliday, Air Force Weather Agency (AFWA), Offutt Air Force Base, NE 68113.
Low seismicity with minor plumes through 15 September 2006; 13 June ash emission
Intermittent, very small-volume steam and ash bursts from the intra-caldera cone have been typical of this volcano intermittently over the past few years, and this pattern continued. The previous report mentions several minor bursts of ash, particularly on 13 June 2006 and 7 September, and minor white plumes through mid-September. This report discusses the interval 8 April through 15 September. Seismicity during this interval was nearly always low, although it often rose above background.
Clouds obstructed visibility during 7-14 April. For the duration of April and June, activity remained low with few steam plumes containing minor amounts of ash. On 30 May a weak daytime thermal anomaly was recorded, possibly due to solar heating inside the dark intra-caldera cone. Intermittent clear weather on the week ending 9 June indicated weak steam plumes.
On 13 June an ash emission rose to a height estimated at ~ 600 m above the summit area, as reported by a passing aircraft. Transient plumes were seen on satellite imagery during the week ending 21 July.
During the week ending 28 July, an AVO field party flew over the summit and observed typical steaming from the intra-caldera cone with no signs of recent ash emissions. Satellite and web camera views during occasional clear periods showed no other signs of activity. Occasional satellite views during clear weather failed to disclose new ash emissions during 28 July through 15 September.
AVO noted a slight increase in seismicity starting 2 August but in the subsequent weeks it again returned to low levels. Available satellite and camera views continued to reveal occasional small white plumes through 15 September.
Information Contacts: Alaska Volcano Observatory (AVO), a cooperative program of the U.S. Geological Survey, 4200 University Drive, Anchorage, AK 99508-4667, USA; Geophysical Institute, University of Alaska, PO Box 757320, Fairbanks, AK 99775-7320, USA; and Alaska Division of Geological & Geophysical Surveys, 794 University Ave., Suite 200, Fairbanks, AK 99709, USA (URL: http://www.avo.alaska.edu/).
Minor ash bursts during February 2008
Our previous report on Veniaminof (BGVN 31:08) noted the relative quiescence of the volcano through 15 September 2006, with the seismicity remaining low, but above earlier background levels. We received no subsequent reports of seismicity until 11 February 2008, when the Alaska Volcano Observatory (AVO) noted sporadic increases in seismic activity, including tremor episodes that lasted 1-2 minutes and occurred several times per hour.
On 22 February several minor ash bursts from Veniaminof were recorded by the seismic network and observed on web camera footage. The bursts rose to an altitude below 2.7 km; fallout was confined to the crater. Steam plumes emitted from the intra-caldera cone were seen on video footage during 23-25 February and seismic levels were elevated during 23-26 February.
On 27 February, web camera views showed steaming from the cone and occasional small ash bursts that rose to 200 m above the crater. The Aviation color code was raised to Yellow and the Alert Level was raised to Advisory. During 28 February-3 March, views were obscured by cloud cover. However, the elevated seismic activity continued to 4 March and low-level steaming was seen on 29 February during a break in the weather.
Subsequent to the February-March activity, the volcano returned to its quiescent state. AVO reported on 3 May that the Volcanic Alert Level for Veniaminof was lowered to Normal and the Aviation Color Code was lowered to Green due to the absence of ash emissions and elevated surface temperatures in satellite data and webcast imagery. Seismicity was still above past background levels, but the rate and intensity had declined over the previous several weeks.
Web camera imagery of Veniaminof volcano showed that occasional light steaming continued.
Information Contacts: Alaska Volcano Observatory (AVO), a cooperative program of the U.S. Geological Survey, 4200 University Drive, Anchorage, AK 99508-4667, USA; Geophysical Institute, University of Alaska, PO Box 757320, Fairbanks, AK 99775-7320, USA; and Alaska Division of Geological & Geophysical Surveys, 794 University Ave., Suite 200, Fairbanks, AK 99709, USA (URL: http://www.avo.alaska.edu/).
Ongoing sporadic eruptions as late as 6 October 2013
In our last report on Veniaminof (figure 12) (BGVN 33:05), we noted that on 22 February 2008 several minor ash bursts had occurred, a process common in ten's of Bulletin and predecessor Smithsonian reports going back to 1983 (SEAN 08:05). In this report we provide a brief summary of activity from 1 March 2008 into October 2013, an interval including several episodes with lava flows, ash bursts, elevated seismicity, and ash fall. During 4 May 2008-7 June 2013 the available data suggest comparative quite, although during part of that time the volcano lacked a seismic monitoring system. During the reporting interval, the Aviation Alert Level often shifted between Orange and Yellow (high to intermediate values on a scale from Green to Red). As discussed below, there was also an interval without seismic monitoring announced 17 November 2009 when the hazard status was termed 'unassigned' owing to a seismic instrument outage. This report omits detailed seismic data published by the USGS (eg. Dixon and Stilher, 2009; Dixon and others, 2012). On 30 August 2013 ash plumes rose to over 6 km altitude.
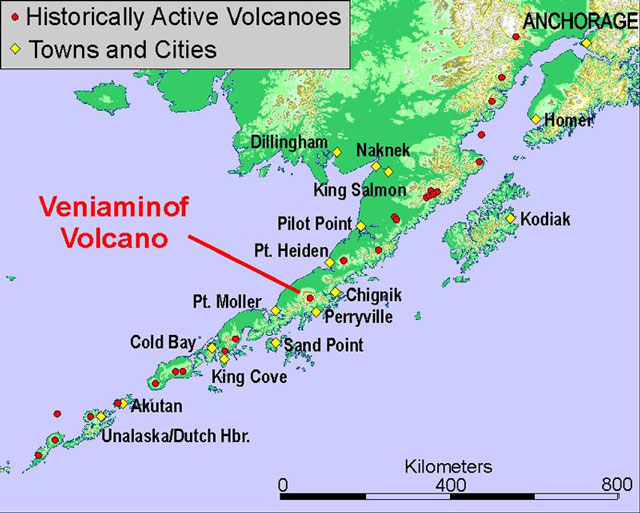 |
Figure 12. Location of Veniaminof on the Alaskan Peninsula. Map courtesy of AVO. |
Table 1 synthesizes available AVO reporting on Veniaminof behavior during February 2008 through 6 October 2013. See their reports for more details. During the interval 4 May 2008 to 7 June 2013 the volcano was often quietly steaming, although seismicity increased during part of May 2009. Several highlights follow. Weather permitting, satellite images showed some days with high elevated surface temperatures at the cinder cone inside the caldera consistent with lava effusion. For example, during 24 July-30 July 2013, a "river of lava" flowed down the cone. As discussed in a subsection below, several noteworthy images were acquired in mid-2013 showing ash and thermal signatures on the volcano. On 30 August 2013 the plume reached over 6 km altitude as an unusually vigorous eruptive event ensued. The last lava emissions of the reporting interval took place on 6 October 2013.
Table 1. Representative dates and noteworthy eruptive or non-eruptive intervals at Veniaminof during March 2008 through late August 2013. Courtesy of AVO.
| Date | Ash plume altitude and movement | Other comments |
| Late Feb through May 2008 | Below 2.7 km | Sporadic increases in seismic and eruptive activity were noted since 11 February, including tremor episodes that lasted 1-2 minutes and occurred several times per hour. Broadly during late February 2008, AVO noted both small ash bursts with local ashfall at the crater accompanied by seismicity, and occasional high thermal fluxes. |
| 4 May 2008-7 June 2013 | (Steaming) | 7-26 May 2009, often quiet steaming with generally low to occasional high seismicity and with absence of thermal anomalies. No reports during other portions of the interval 4 May 2008 to 7 June 2013. Seismic station outage announced 17 November 2009, with seismic reports returning 8 June 2013. |
| 19 June 2013 | 4.6 km NE | Cloudy weather sometimes prevented views of the caldera, although most days satellite images showed very high elevated surface temperatures at the cinder cone inside the caldera consistent with lava effusion. On 19 June, residents in Sandy River reported ash bursts. |
| 24-30 July 2013 | 4.5 km NW | Lava effusion, a "river of lava," flowing down the cone. |
| 14-20 August 2013 | 3.7 km W and then SSE | AVO reported that during 13-15 August seismic tremor at Veniaminof was high, and persistent elevated surface temperatures consistent with lava effusion were visible on satellite imagery. An 18 August webcamera image revealed minor ash emissions. On 19 August a helicopter overflight revealed two lava flows On 20 August, trace ash fall reported in Perryville ((32 km SSE); they also heard hearing explosions; infrasound equipment in Dillingham (322 km NE) also detected impulses. |
| 21 Aug-20 Oct 2013 | 4.6-6.7 km SE | 27-29 Aug, episodic tremor bursts interpreted as lava effusion and emissions; prominent satellite thermal anomalies. On 30 Aug, some of the strongest emissions since the eruption began in June 2013; ongoing into early Sept but diminishing in late Sept, and without evidence of eruption in satellite and webcamera data on and around 20 Sept. A lava effusion was recognized 6 October, then waning by mid-October. |
As noted above and in table 1, non-eruptive steaming prevailed at the volcano during much or all of the interval 4 May 2008-7 May 2009. On 17 November 2009 AVO announced that Veniaminof was one of four volcanoes in Alaska that they could no longer monitor because of seismic station outages. They then shifted both their Alert Level of Normal and the Aviation Color Code of Green to the category "unassigned." AVO stated that these volcanoes "will likely remain without real-time seismic monitoring until next summer, when necessary upgrades at these and other networks will occur. As at other volcanoes without real-time seismic networks, AVO will continue to use satellite data and reports from pilots and ground observers to detect signs of eruptive activity."
Following the announced station outage, the next update at Veniaminof was on 8 June 2013.
Pilots of aircraft PEN241 saw on 27 August 2013 intermittent ash discharges at 1720 UTC . "Occasional ash to [~3 km a.s.l.] moving NNE. Cloud height up to [~4 km a.s.l.] every 2-5 minutes." This reporting was transmitted to Air Traffic authorities and then to Bulletin editors via the Volcanic Activity Reporting Form (VAR; Appendix 2 of Federal Aviation Administration, 2012). Reports like these are valuable to engineers and scientists who benefit from the direct observations provided by pilots.
During 6-7 May 2009, seismic activity from Veniaminof increased, prompting AVO to raise the Volcanic Alert Level to Advisory and the Aviation Color Code to Yellow. Small magnitude earthquakes occurred at rates of 5-10 per hour during quieter periods and 1-3 per minute during periods of more intense activity. Visual observations indicated typical steaming from the summit caldera cone. Seismicity remained elevated during 8-12 May 2009. On 26 May 2009, AVO reported that seismicity from Veniaminof had decreased during the previous week. The Volcanic Alert Level was lowered to Normal and the Aviation Color Code was lowered to Green.
During 2010-12 the volcano was relatively quiet (table 1). There were no AVO weekly reports on Veniaminof during this interval.
On 13 June 2013, low-level emissions led the AVO to increase the aviation color code to orange. The Anchorage Volcanic Ash Advisory Center (VAAC) reported on 15 June 2013 that the eruptions had ended, but AVO still reported intermittent activity continuing through 8 July 2013. In addition, MODVOLC had detected 248 thermal alerts during 14 June-11 July 2013 (figure 13).
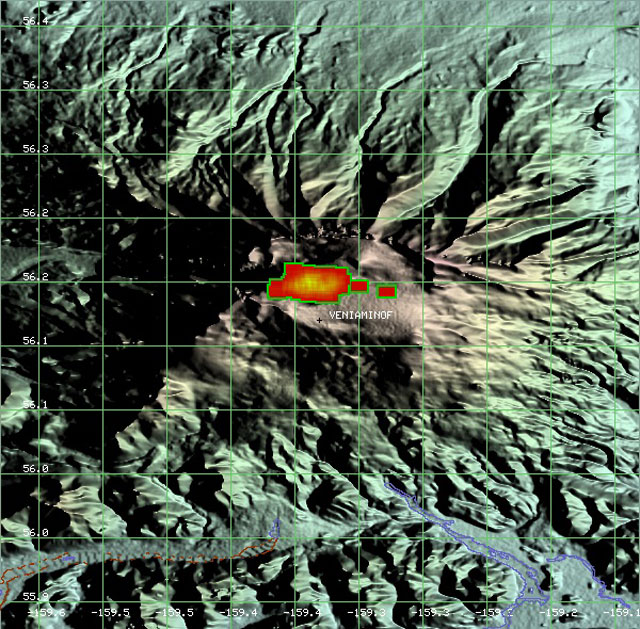 |
Figure 13. This image of Veniaminof displays MODVOLC thermal alerts from 14 June 2013 to 11 July 2013. Thermal alerts from MODVOLC are derived from data collected by the MODIS thermal sensors aboard the Aqua and Terra satellites and processed by the Hawaii Institute of Geophysics and Planetology using the MODVOLC algorithm. Note that the hotspots (red) are clustered in the immediate region of the summit and are not wildfires. |
July 2013 activity. Figure 14 shows a satellite image from 4 July 2013 portraying both ash desposits on the snow surface and the thermal signature of an ongoing lava flow. On 8 July 2013, AVO reported that nearly continuous, low-level volcanic tremor had occurred during the previous 24 hours. Cloudy satellite images detected thermal anomalies (figure 14). Web camera images from Perryville (32 m SSE) showed incandescence from the Veniaminof intracaldera cone.
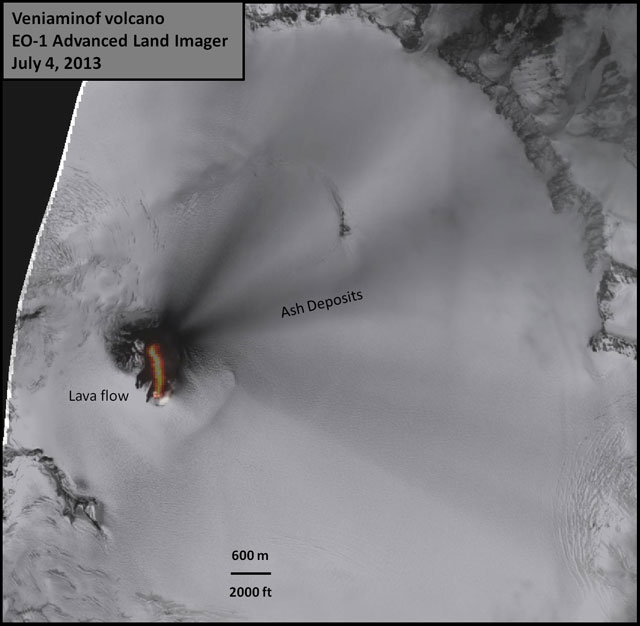 |
Figure 14. This satellite image from 4 July 2013 shows thermal emissions from an active lava flow as detected by shortwave infrared data, The image also shows ash deposits covering the snow fields that engulf the volcano. N is to the top. The ash appears as radial spokes due to deposition during changing wind directions. The lava flow was active at the time of this photo, extending southward from the vent. Image courtesy of Alaska Volcano Observatory. |
AVO reported that the ongoing low-level eruption of Veniaminof, characterized by lava effusion and emission of minor amounts of ash and steam, continued during 26 June-8 July 2013, indicated by nearly continuous volcanic tremor and occasional small explosions detected by the seismic network. Figure 15 shows a photo taken on 26 June. Satellite images showed elevated surface temperatures at the cinder cone inside the caldera consistent with lava effusion. During 26-30 June web camera images from Perryville showed a small light-colored plume rising above the cone to just above the rim of the caldera, and night time images showed persistent incandescence from the cone. The Volcano Alert Level remained at Watch and the Aviation Color code remained at Orange.
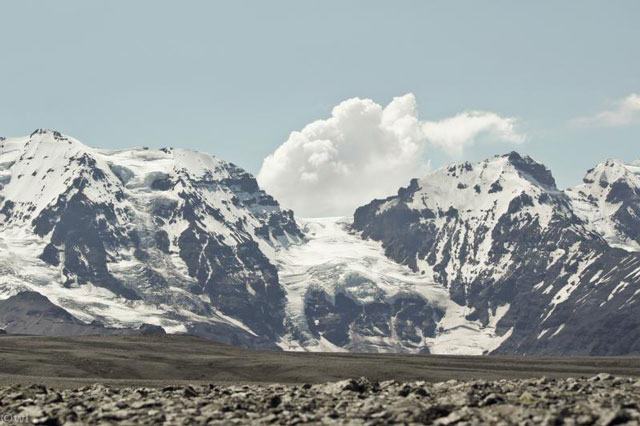 |
Figure 15. Steam rising from the active intracaldera cone of Veniaminof. The photo was taken from ~600 m elevation, looking SW toward the volcano on 26 June 2013. Photo courtesy of Will Lawrence. |
2008-2011 seismicity. According to Dixon and others (2009) and additional AVO reports, the monitoring network for Veniaminof included nine stations, at least through 2011. The network experienced intermittent outages (eg. figure 16 of broken solar panel.) The number of recorded earthquakes between 2008-2011 is presented in table 1.
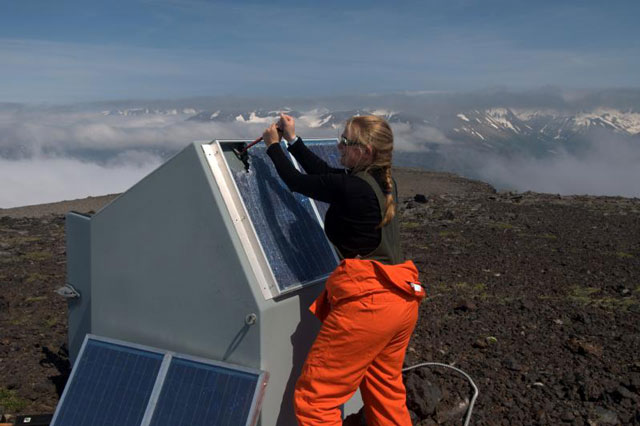 |
Figure 16. Helena Buurman works to remove smashed solar panels at station VNFG- one of the main repeaters in the Veniaminof network (17 July 2010). Photo courtesy of Cyrus Read. |
Table 2. Veniaminof VT and LF earthquakes detected during 2008-2011. Because of occasional equipment outages, values in the table may under-represent actual numbers. Values for 2012 were not yet available. Sources included Dixon and others (2008, 2009, 2010, 2011).
| Year | Earthquakes located | Volcano-tectonic (VT) | Low frequency (LF) |
| 2008 | 17 | 14 | 3 |
| 2009 | 4 | 3 | 1 |
| 2010 | 22 | 18 | 4 |
| 2011 | 7 | 6 | 1 |
2009 annual seismicity. The Aniakchak, Cerberus, Gareloi, Great Sitkin, Pavlof, Veniaminof, and Wrangell subnetworks had insufficient numbers of located earthquakes to calculate a Mc. The Mc ranged from -0.1 to 1.5 for the individual subnetworks.
2010 annual seismicity. The seismograph networks on Aniakchak, Korovin, and Veniaminof were repaired in 2010. There were many station outages in the previous two years.
Seismicity at Veniaminof and Westdahl were the only areas in which an increase over the seismicity in 2009 was noted. The increase in seismicity at Veniaminof was a result of a small swarm of activity northwest of the active cone in late July.
2011 annual seismicity. There were fewer station outages and more than four were operating during the year. Veniaminof had insufficient numbers of located earthquakes in 2011 to calculate a magnitude completeness.
References. Dixon, J.P., Stihler, S.D., Power, J.A., and Searcy, C.K., 2011, Catalog of earthquake hypocenters at Alaskan Volcanoes: January 1 through December 31, 2010: U.S. Geological Survey Data Series 645, 82 p.
Dixon, J.P., Stihler, S.D., Power, J.A., and Searcy, C.K., 2012, Catalog of earthquake hypocenters at Alaskan Volcanoes: January 1 through December 31, 2011: U.S. Geological Survey Data Series 730, 82 p.
Dixon, J.P., Stihler, S.D., Power, J.A., and Searcy, Cheryl, 2010, Catalog of earthquake hypocenters at Alaskan volcanoes: January 1 through December 31, 2009: U.S. Geological Survey Data Series 531, 84 p.
Dixon, J.P., and Stihler, S.D., 2009, Catalog of earthquake hypocenters at Alaskan volcanoes: January 1 through December 31, 2008: U.S. Geological Survey Data Series 467, 86 p.
Federal Aviation Administration, 2012, Aeronautical Information Manual, Official Guide to Basic Flight Information and ATC Procedures (issued 9 February 2012; with revisions as late as 22 Aug ust 2013) (URL: http://www.faa.gov/air_traffic/publications/atpubs/aim/index.htm).
Information Contacts: Alaska Volcano Observatory, a cooperative program of a)U.S. Geological Survey, 4200 University Drive, Anchorage, AK 99508-4667 USA URL: http://www.avo.alaska.edu/); b)Geophysical Institute, University of Alaska, PO Box 757320, Fairbanks, AK 99775-7320 USA and c)Alaska Division of Geological & Geophysical Surveys, 794 University Ave., Suite 200, Fairbanks, AK 99709, USA (URL: http://www.dggs.alaska.gov/); Anchorage Volcanic Ash Advisory Center (VAAC), 6930 Sand lake Road Anchorage, AK 99502-1845 USA (URL: http://vaac.arh.noaa.gov/); and Hawai'i Institute of Geophysics and Planetology (HIGP), MODVOLC Thermal Alert System, School of Ocean and Earth Science and Technology (SOEST), University of Hawai'i, 2525 Correa Road, Honolulu, HI 96822, USA (URL: http:hotspot.higp.hawaiii.edu/).
Lava flows, Strombolian activity, and ash plumes during 13 June-17 October 2013
Mount Veniaminof, located on the Alaska Peninsula, has a large glacier-filled summit caldera that formed around 3,700 years ago. A cone within the crater has been the source of at least 13 eruptions in the last 200 years that included intermittent steam and ash emissions, incandescent lava flows, and Strombolian activity. Prior to an eruptive episode that began in June 2013, lava had last erupted during Strombolian activity in February 2005; subsequent minor ash emissions occurred later in 2005, November 2006, and February 2008. Pilots reported ash plumes in January and June 2009, but the Alaska Volcano Observatory (AVO) concluded that the plumes were steam-only. Veniaminof is closely monitored by AVO and the Anchorage Volcanic Ash Advisory Center (VAAC). The Federal Aviation Administration (FAA) also has a web camera in Perryville, 35 km E of the volcano. This review draws heavily from a USGS report on the June through October 2013 eruption (Dixon et al., 2015).
Beginning on 7 June 2013, a several-day period of increasing levels of seismic tremor indicated the start of a largely effusive eruption from the intracaldera cinder cone (figure 17). The first ash plume was observed on 13 June. Over the next four months, numerous emissions rose to altitudes generally below 4.6 km and coated the flanks of the cone with ash, Strombolian explosions were visually observed several times, and lava flowed down the N and S flanks of the active cone and advanced onto the surrounding ice-filled caldera creating ice cauldrons. The eruption constructed a new spatter cone within the summit crater of the main active cone. Activity had ceased by 17 October 2013. A brief period of elevated seismicity occurred during October and November 2015, but no eruptive activity was recorded.
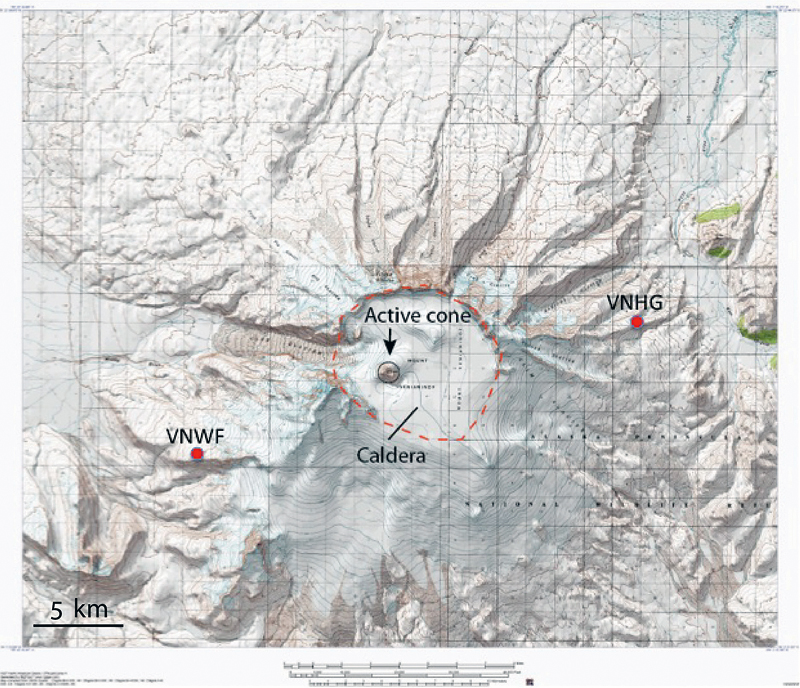 |
Figure 17. Topographic map of Mount Veniaminof showing the margin of the caldera (red dashed line) and the active cone within the caldera (black circle). Seismic stations VNWF and VNHG were the most fully operable of the network in June 2013. The caldera is 10 km in diameter. Courtesy of AVO/UAFGI, 19 June 2013 (AVO database image URL: http://www.avo.alaska.edu/images/image.php?id=50831). |
Gradually increasing low-frequency tremor was recorded on two seismograph stations at Veniaminof, along with elevated surface temperatures of the intracaldera cinder cone recorded via satellite images on 7 June 2013. This led AVO to increase the 4-level Aviation Color Code and the Volcano Alert Level from Green/Normal to Yellow/Advisory the next day. By 13 June, seismicity levels and elevated surface temperatures at the summit of the cinder cone (as measured by satellite images) indicated an eruption was likely underway, causing AVO to raise the Aviation Color Code and the Volcano Alert Level to Orange/Watch. Observation of an ash plume at an altitude of 3.7 km by a pilot that evening along with a lava flow effusing from the intra-caldera cinder cone confirmed the eruption.
Residents in Perryville (32 km SSE) and Port Moller (77 km WSW) also observed ash emissions at about 2330 local time that evening. The first VAAC report around the same time listed the ash plume at 4.3 km altitude, drifting NNE. Ash deposits on the snow-covered caldera floor, and lava on the cone, were visible in satellite images on 14 June. The first MODVOLC thermal anomaly pixels from MODIS satellite data also appeared on 14 June. On 18 June the web camera in Perryville captured short-lived ash plumes rising to less than 4.6 km, and residents in Sandy River (33 km W) reported visible plumes to similar altitudes the next day. The 100-m-wide lava flow extended 500 m down the SW flank of the cone onto the adjacent snow and ice field by 18 June. Interaction of the lava with the caldera snow-and-ice field generated water-rich ash plumes. Clear satellite views the following day showed active flow lobes advancing over the ice at the base of the cone.
In subsequent weeks, three flows descended the S flank, and minor amounts of ash accumulated on the caldera floor. Strombolian activity was captured by infrared satellite imagery, from the FAA web camera in Perryville, and from several local lodges and remote camps (figure 18).
 |
Figure 18. Telephoto view of erupting Mount Veniaminof, 9 July 2013. Photograph was taken from Sandy River about 32 km W of the volcano. Bright orange incandescence indicates lava fountaining from the vent hidden from view within the crater atop the cinder cone. At times, the eruption was characterized by closely spaced bursts that produced 'puffs' of ash. Courtesy of AVO/USGS. Photograph by William Jasper, used with permission (AVO database image URL: http://www.avo.alaska.edu/images/image.php?id=56303 ). |
On 16 July 2013 an AVO geologist visited the caldera by helicopter, making observations and taking the first close-up photographs documenting the lava flows and ice cauldron formation (figure 19). Images of the vent area showed a new cone of accumulated spatter nested within the summit crater of the main cone.
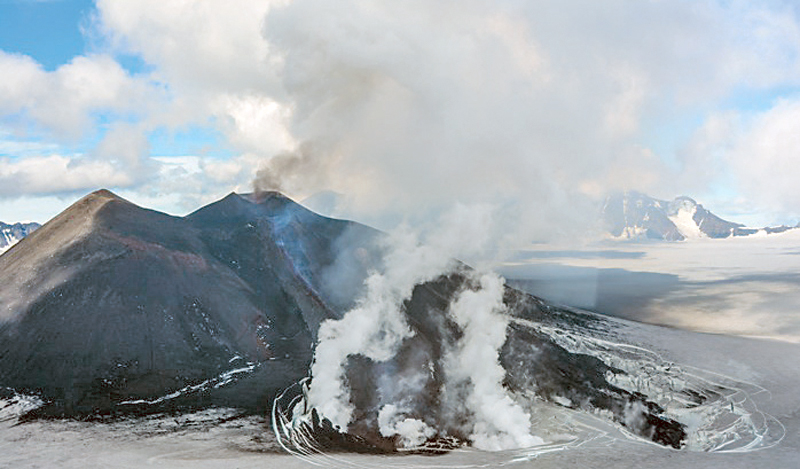 |
Figure 19. Southwestern flank of the intracaldera cone at Mount Veniaminof on 16 July 2013 showing lava flows emplaced during the eruptive activity occurring in June and July 2013, and a new cone formed from eruptive spatter. View is toward the east. The flows appear similar to those produced during the 1993 eruption. Courtesy of AVO/USGS. Photograph by Chris Waythomas, 16 July 2013 (AVO database image URL: http://www.avo.alaska.edu/images/image.php?id=51301 ). |
Strong MODVOLC thermal alert pixels, up to 12 per day, continued almost daily through the end of July. A pilot report from 0800 AKDT on 25 July described an ash plume to 100 m above the erupting cone dispersing 25 km to the S, and a "river of lava" flowing from the intracaldera cone. Numerous reports from the Anchorage VAAC between 27 and 31 July confirmed ash plumes rising as high as 4.6 km altitude and drifting up to 20 km NW.
After a brief period of quiet in early August 2013, activity resumed with lava flows and ash plumes on 11 August. On 12 August, satellite imagery confirmed incandescence from the cone and an ash plume was also observed from Perryville. A second overflight under clear skies by AVO geologists on 18 August revealed ash covering the immediate area of the glacier and the lava flows, and an active incandescent flow down the S flank into the ice cauldrons where the hottest parts of the flows were still in contact with ice and water. The S-flank lava flows had coalesced and largely melted into the surrounding ice (figures 20 and 21).
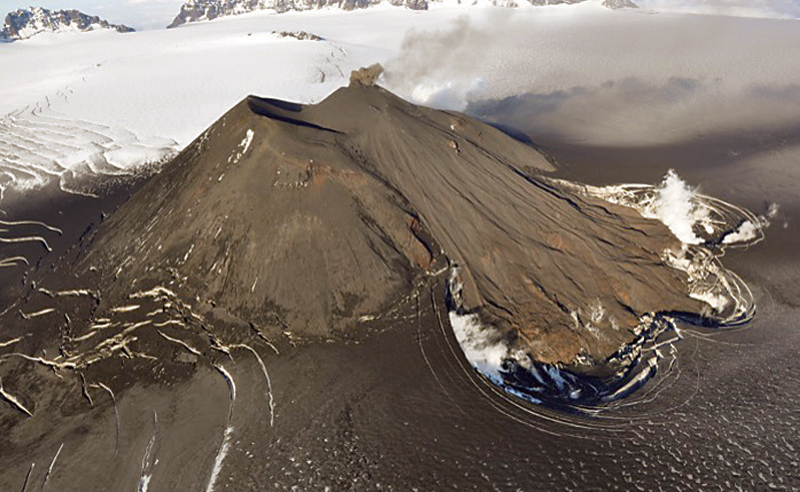 |
Figure 20. A small puff of ash emerges from the active cone inside the Veniaminof caldera on 18 August 2013. A fan of lava flows active earlier in the summer descends the southern flank of the cone onto glacial ice, producing white steam clouds and depressions where melting has occurred. The surrounding glacier is darkened by recent ashfall. Courtesy of USGS/AVO. Photograph by Game McGimsey (AVO database image URL: http://www.avo.alaska.edu/images/image.php?id=55761 ). |
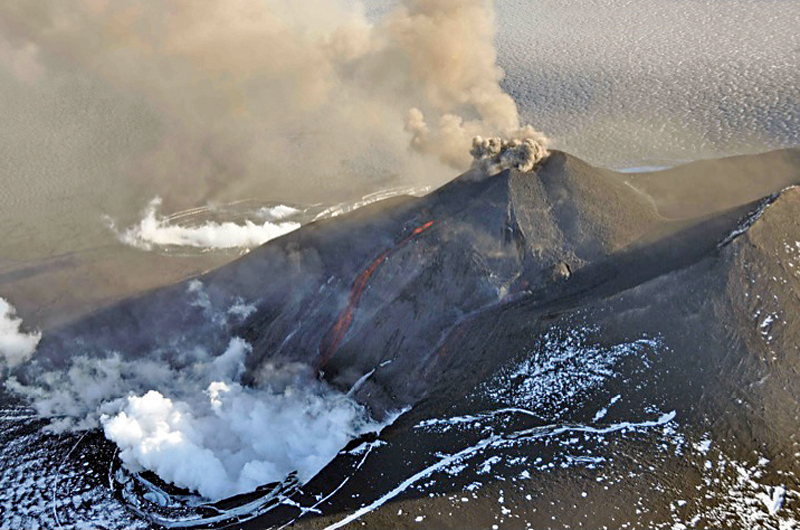 |
Figure 21. Aerial view of the eruption at Veniaminof's intracaldera cone on 18 August 2013, from an overflight co-sponsored by the National Geographic Society. The cone rises about 300 m above the surrounding icefield. An incandescent orange stream of lava is emerging from the active cone. Steam billows from the pit at the base of the cone where the lava encounters and melts ice and snow creating an ice cauldron. The small, ash-rich plume rising just above the vent produced a diffuse ash cloud that drifted downwind. Courtesy of AVO/USGS. Photograph by Game McGimsey, AVO/USGS (AVO database image at URL: http://www.avo.alaska.edu/images/image.php?id=56211 ). |
Strombolian explosions of incandescent lava and minor ash emissions were observed at the central active vent on 18 August during the flyover. Two new lava flows were also observed issuing from the NE flank of the new cone. Forward Looking Infrared Radiometer (FLIR) images delineated the lava flows and hot spatter on the cone (figure 22). As measured by the FLIR, maximum temperatures reached 700° to 800°C.
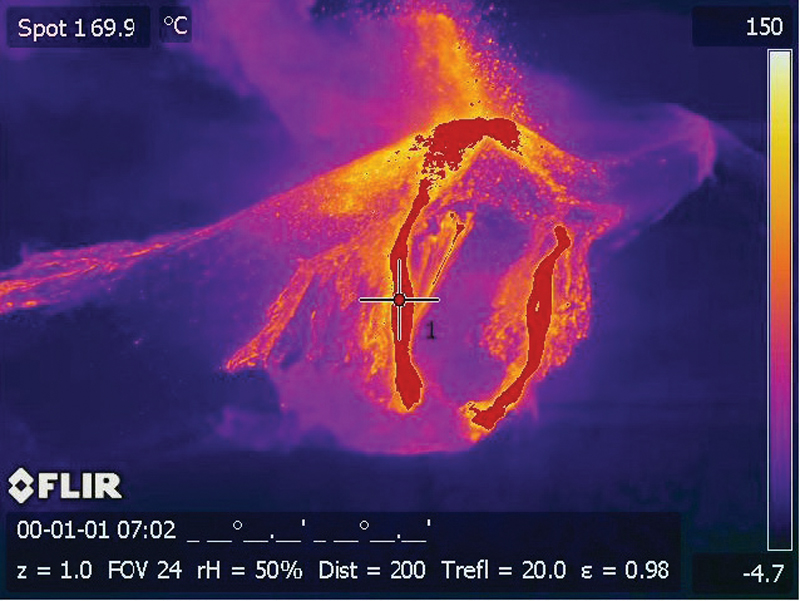 |
Figure 22. Forward Looking Infrared Radiometer (FLIR) image of the erupting intracaldera cone of Mount Veniaminof on 18 August 2013. In this oversaturated image (due to low thermal imagery setting), the active lava flows (hottest) are red and the lava fountaining at the summit is easily visible. These lava flows are on the NE flank of the cone. Maximum temperatures recorded were between 700° and 800° C. Courtesy of USGS/AVO. FLIR image by Game McGimsey (AVO database image URL: http://www.avo.alaska.edu/images/image.php?id=57831). |
The Anchorage VAAC reported ash plumes on 20 and 21 August 2013 rising to 3.7 km altitude moving SE within a few kilometers of the summit. Residents of Perryville reported rumbling noises, explosions, and trace ashfall on 20 August. Similar, low-level ash plumes and persistent thermal anomalies were detected during the remainder of August. A noted increase in activity on 30 August included elevated levels of continuous tremor, lava fountaining, and ash emissions as high as 6.1 km altitude; this was some of the strongest unrest detected since the eruption began in June. Trace amounts of ashfall were again reported in Perryville. Lava effusion, fountaining, and nearly continuous small ash plumes continued through the first week in September. Satellite and aerial images on 6 and 7 September indicated further development of the flows on the NE flank and expansion of the ice cauldron as well as a new lobe of lava advancing southward from the NE flank ice cauldron (figure 23).
 |
Figure 23. Aerial view of Mount Veniaminof erupting on 7 September 2013. Note the white water vapor clouds indicating that hot lava is interacting with snow and ice. A gray-brown ash column rises from the active vent. The advancing flows in foreground are on the southeastern flank of the cone and were the last flows emplaced in the 2013 eruption. The summit ice field is darkened with recent ash fall. Courtesy AVO/USGS. Photograph by Joyce Alto, used with permission (AVO database image URL: http://www.avo.alaska.edu/images/image.php?id=56424). |
MODVOLC thermal alert pixels ceased on 8 September 2013; the last September satellite imagery detection of volcanic ash emissions as reported by the Anchorage VAAC was on 9 September. By 19 September no evidence of active lava flows was observed in satellite images; seismicity had begun to decrease during the week, and the eruption appeared to be waning. This short-lived period of quiescence ended on 6 October when MODVOLC pixels reappeared through 11 October, suggesting active lava effusion. An ash plume reported by the Anchorage VAAC on 11 October rose to 6.1 km altitude (the highest of this eruption) and trace amounts of ash were reported in the communities of Chignik Lake and Chignik Lagoon, 40-55 km E of the active vent; it was the last VAAC report of an ash plume in 2013. On 17 October AVO noted that seismicity had decreased during the previous week and satellite observations during periods of clear weather showed no evidence of eruptive activity. The Aviation Color Code/Volcano Alert Level was lowered to Yellow/Advisory. Seismicity remained slightly above background levels through the following June, although no further activity was reported. The Alert Level was lowered to Green/Normal on 9 July 2014.
According to the USGS and AVO, the 2013 eruption produced about 5 X 10⁵ m3 of erupted lava, comparable in size to the 1983 eruption. A chart of eruptive events and the real-time seismic amplitude (RSAM) time series data between 13 June and 17 October 2013 prepared by USGS/AVO illustrates the significant eruptive events of this period (figure 24). Additional details of the eruption can be found in Dixon et al., 2015.
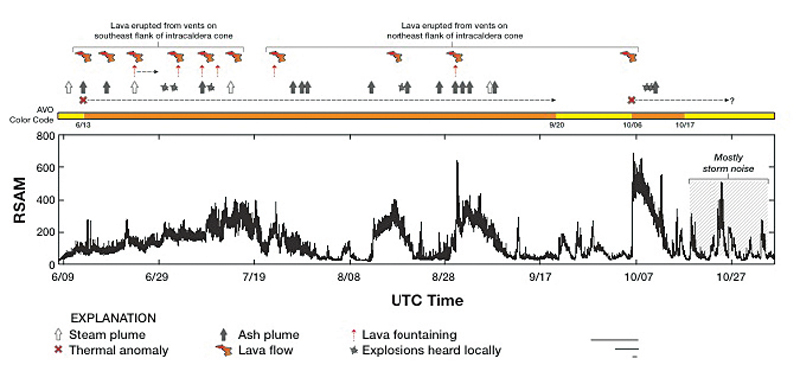 |
Figure 24. Real-time seismic amplitude (RSAM) time series from seismic station VNWF (located on the lower SW flank of Veniaminof), and significant eruptive events between 9 June and 1 November 2013. The AVO Aviation Color Code during the eruption also is shown. Courtesy of USGS/AVO (figure 25, Dixon et al., 2015). |
No further reports of activity from Veniaminof were issued until increased seismic activity began on 30 September 2015. This led AVO to increase the Color Code/Alert Level to Yellow/Advisory the next day. Occasional, clear web camera images from Perryville in the subsequent weeks showed small steam plumes rising from the intracaldera cone but no ash emissions or lava effusions. Slightly elevated levels of seismicity continued until the beginning of December. AVO downgraded the status from Yellow/Advisory to Green/Normal on 11 December 2015.
References: Dixon, J.P., Cameron, Cheryl, McGimsey, R.G., Neal, C.A., and Waythomas, Chris, 2015, 2013 Volcanic activity in Alaska - Summary of events and response of the Alaska Volcano Observatory: U.S. Geological Survey Scientific Investigations Report 2015-5110, 92 p., http://dx.doi.org/10.3133/sir20155110
Waythomas, C.F., 2013, Volcano-ice interactions during recent eruptions of Aleutian Arc volcanoes and implications for melt water generation: Eos Transactions, American Geophysical Union, Fall Meeting, abstract V34C-03.
Information Contacts: Alaska Volcano Observatory (AVO), a cooperative program of a) U.S. Geological Survey, 4200 University Drive, Anchorage, AK 99508-4667 USA (URL: http://www.avo.alaska.edu/), b) Geophysical Institute, University of Alaska, PO Box 757320, Fairbanks, AK 99775-7320, USA, and c) Alaska Division of Geological & Geophysical Surveys, 794 University Ave., Suite 200, Fairbanks, AK 99709, USA (URL: http://www.dggs.alaska.gov/); Anchorage Volcanic Ash Advisory Center (VAAC), Alaska Aviation Weather Unit, NWS NOAA US Dept. of Commerce, 6930 Sand Lake Road, Anchorage, AK 99502-1845(URL: http://www.ssd.noaa.gov/); Hawai'i Institute of Geophysics and Planetology (HIGP), MODVOLC Thermal Alerts System, School of Ocean and Earth Science and Technology (SOEST), Univ. of Hawai'i, 2525 Correa Road, Honolulu, HI 96822, USA (URL: http://modis.higp.hawaii.edu/).
Eruption with lava flows and ash plumes during September-December 2018
The most recent eruptive period at Veniaminof began in September 2018 with seismic activity followed by ash emissions and lava flows continuing through mid-December 2018, the end of this reporting period (figure 25). An intracaldera cone has been the source of historic volcanic activity in the last 200 years and more recent activity last reported in June 2013 (BGVN 42:02). Veniaminof is closely monitored by the Alaska Volcanic Observatory (AVO) and the Anchorage Volcanic Ash Advisory Center (VAAC), and is also monitored by a Federal Aviation Administration (FAA) web camera in the town of Perryville, 35 km E.
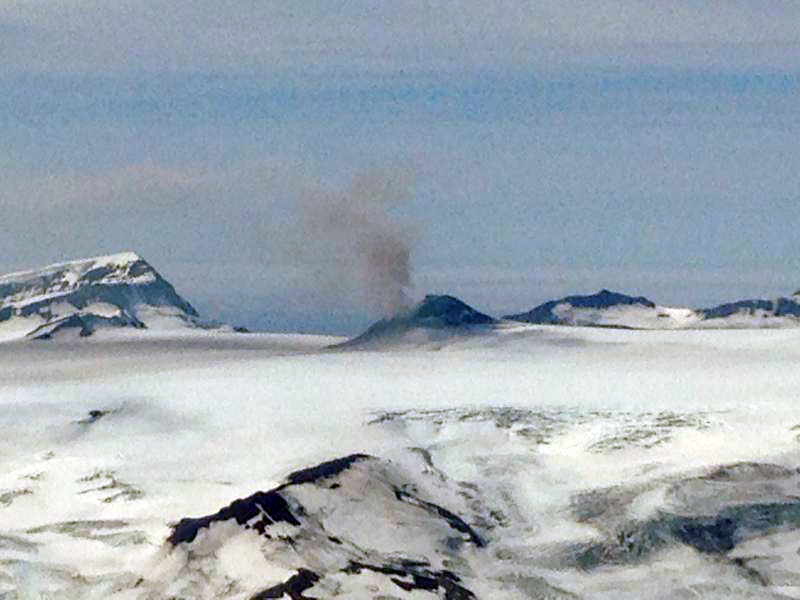 |
Figure 25. View of Veniaminof to the W with a diffuse ash plume at 1517 local time on 5 September 2018. Photo by Zachary Finley (color adjusted from original); courtesy of USGS/AVO. |
The most recent Strombolian-type eruptive cycle commenced with increased seismic activity on 2 September 2018. Low-level ash that rose 3 km and pulsatory low-altitude ash emissions were observed in FAA webcam images on 4-6 September. Ash deposits extended onto the snowfield at and below the summit to the SSW and SE, forming a "v" shape downslope from the summit. On 7 September a thermal feature was detected, suggesting lava fountaining at the summit, which was later confirmed by satellite data showing a S-flank lava flow about 800 m long on 9-11 September (figure 26). FAA webcam images on 26 September showed lava fountains issuing from a second vent 75 m N of the first, producing additional lava flows on the S flank (figures 27 and 28). Minor ash emissions associated with lava fountaining possibly rose as high as 4.5 km and quickly dispersed.
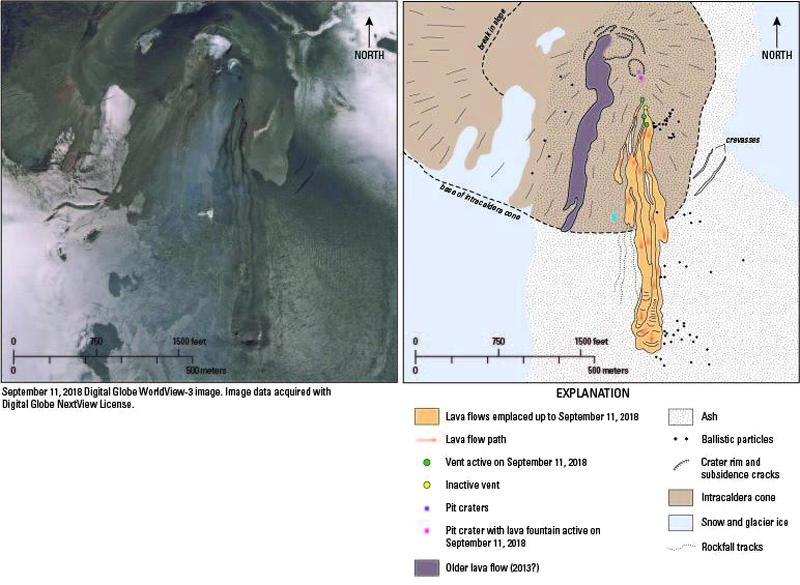 |
Figure 26. Geologic sketch map of lava flows and features on the intracaldera cone of Veniaminof as of 11 September 2018. DigitalGlobe WorldView-3 image (left) acquired with Digital Globe NextView License. Image by Chris Waythomas; courtesy of USGS/AVO. |
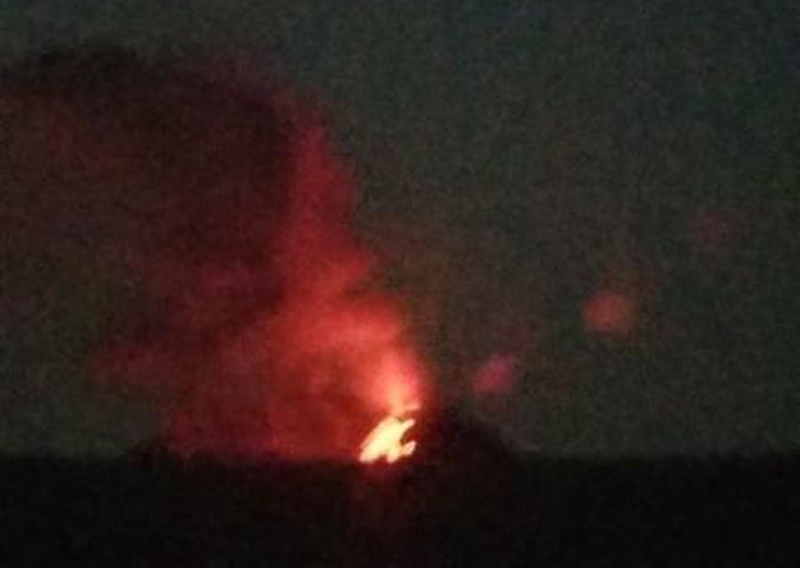 |
Figure 27. Veniaminof eruption on the evening of 18 September 2018. Photo by Pearl Gransbury; courtesy USGS/AVO. |
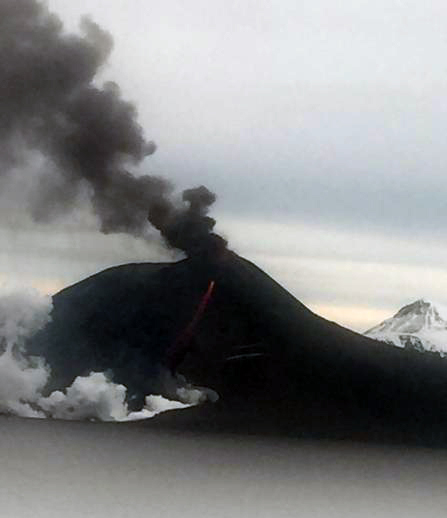 |
Figure 28. Veniaminof in eruption on 26 September 2018. A lava flow is visible on the S flank of the volcano with steaming at the base. Photo by Jesse Lopez (color adjusted from original); courtesy of USGS/AVO. |
The lava flow had traveled 1 km down the S flank of the summit cone by 1 October. Satellite imagery from 6 October showed three lobes of lava flows and a plume over a thin tephra deposit. By 25 October the lava flow had traveled as far as 1.2 km (figures 29 and 30). Fractures in the ice sheet adjacent to the lava flow field continued to grow due to meltwater flowing beneath. Additionally, a persistent and robust steam plume which contained sulfur dioxide was visible from the FAA webcam on 18 October.
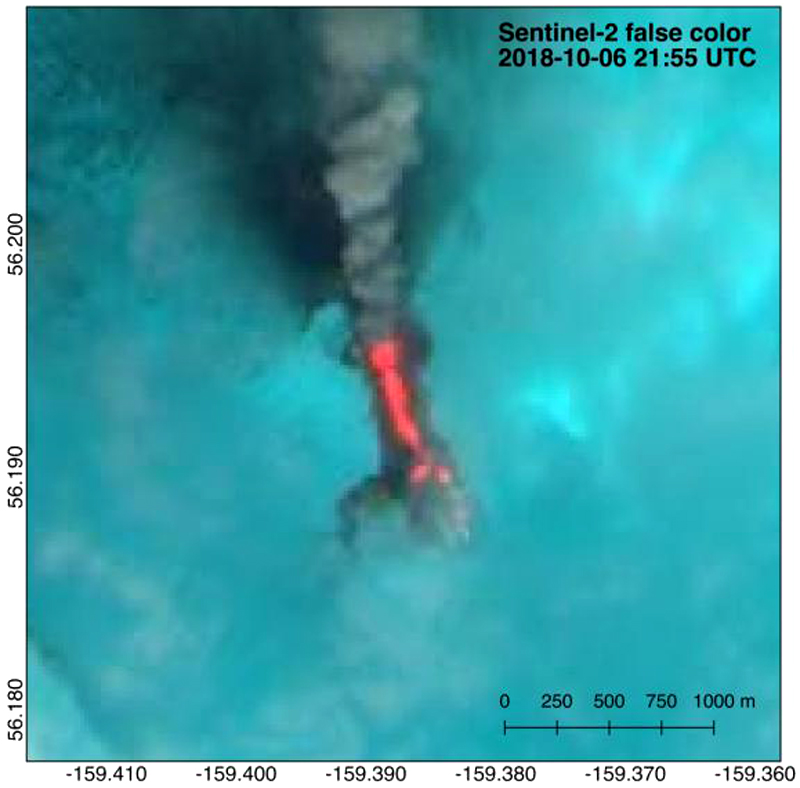 |
Figure 29. False color ESA Sentinel-2 image of Veniaminof on 6 October 2018 showing lava effusion and a plume with a thin tephra deposit beneath to the N. The flow is ~1 km in length with the most active front on the E, which has a SWIR (short wave infrared) anomaly extending to the flow front. A branch in the channel feeding the western lobes appears to be active as well, but without any SWIR anomaly near the flow front, suggesting that this western branch is less active. The eastern flow front is producing the strongest steam plume. Prepared by Hannah Dietterich with ESA Sentinel-2 imagery; courtesy of USGS/AVO. |
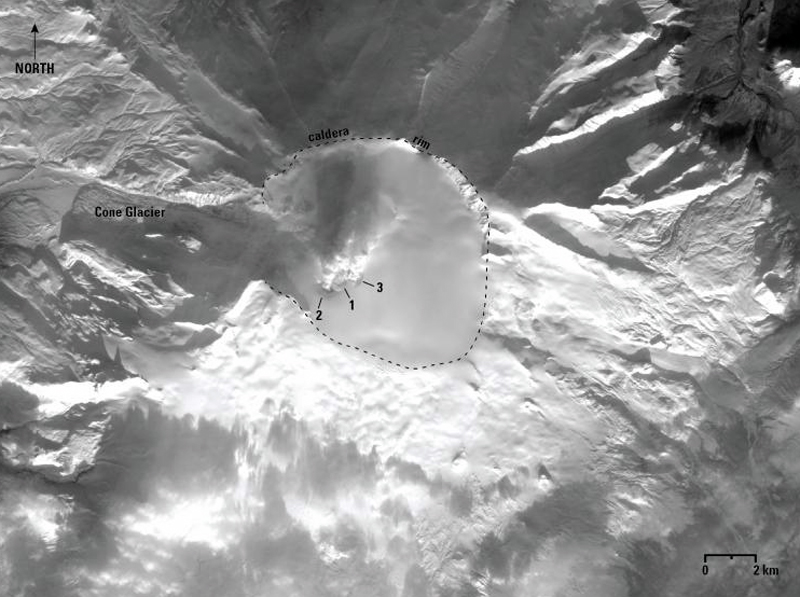 |
Figure 30. Sentinel-2 satellite image of Veniaminof acquired 5 December 2018. Image shows three lava lobes with relative ages from oldest (1) to youngest (3). AVO became aware of flow 3 on 29 November 2018. It is uncertain when this flow first formed because the volcano had been obscured by clouds earlier. Prepared by Chris Waythomas; courtesy of USGS/AVO. |
Ash emissions significantly increased overnight on 20-21 November, prompting AVO to raise the Aviation Color Code (ACC) to Red and the Alert Level to "Warning" (the highest levels on a four-level scale). The ash emissions rose to below 4.6 km and drifted more than 240 km SE. On 21 November observations and FAA webcam images indicated continuous ash emissions through most of the day as ash plumes drifted SE, extending as far as 400 km (figure 31). A short eruptive pulse was recorded during 1526-1726, and subsequent ash plumes rose to below 3 km with low-altitude ash emissions drifting 100 km S on 22 November (figure 32). Decreased ash emissions prompted AVO to lower the ACC and Alert Level to Orange and "Watch", respectively. However, lava effusion was persistent through 27 November.
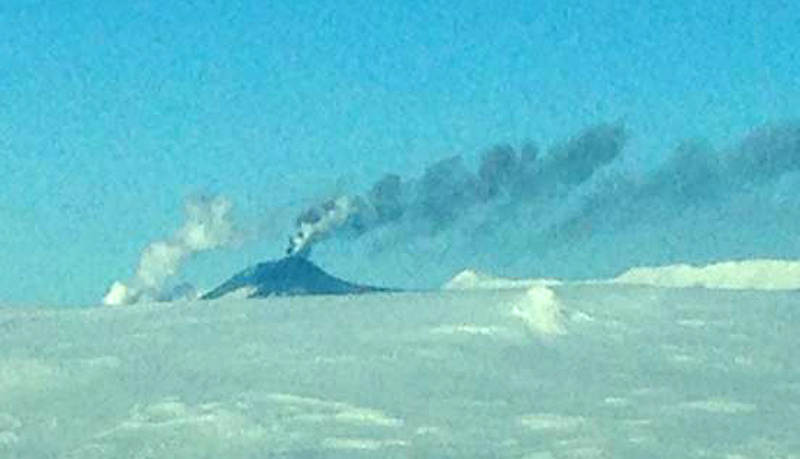 |
Figure 31. Plume rising from Veniaminof on 9 November 2018. View is to the west. Ash is visible at the summit and steam is rising from the S-flank lava flow. Photo by Zachary Finley (color adjusted from original); courtesy of USGS/AVO. |
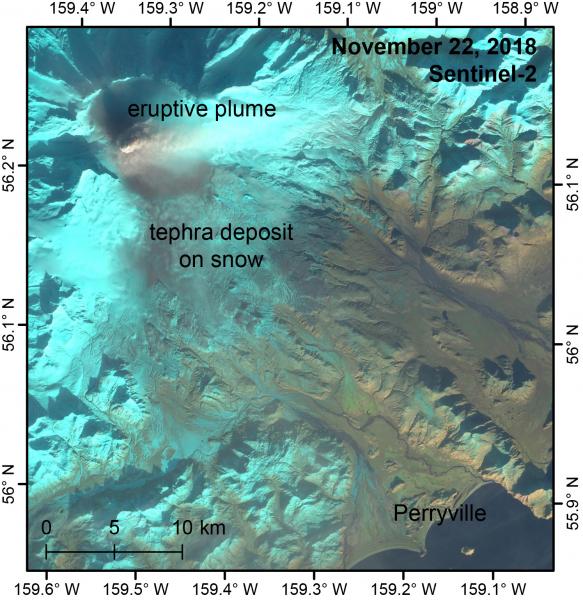 |
Figure 32. Annotated satellite image of the Veniaminof eruption taken by Sentinel-2 on 22 November 2018. The image shows an eruptive plume above the active cone within the caldera, as well as a broad tephra deposit to the SE on snow extending to Perryville. Image courtesy of USGS/AVO (ESA/Copernicus; Sentinel-2 image visualized in EOS LandViewer). |
During 27-28 November acoustic waves were recorded by regional infrasound sensors. A continuous low-amplitude tremor was recorded until the network went offline following a M 7 earthquake in Anchorage on 30 November. On 6 December seismicity changed from nearly continuous low-level volcanic tremor to intermittent small low-frequency events and short bursts of tremors, possibly indicating that lava effusion had slowed or stopped. Variable seismicity continued through 12 December, though there was no visual confirmation of lava effusion.
Minor ashfall was recorded in Perryville (35 km E) on 25 October and 22 November 2018. Elevated surface temperatures and thermal anomalies were identified in satellite data on 7, 12-26 September, 2-9 and 24-30 October, 7-22 November, and 4-5 December. Nighttime incandescence was visible from the FAA webcam at various times during this reporting period (figure 27). Following 22 November, the ACC remained at Orange and the Volcano Alert Level remained at "Watch."
The MIROVA thermal anomalies detected during this period were reported as having moderate to high radiative power (figure 33). Numerous thermal anomalies identified using the MODVOLC algorithm were also detected during this period, and showed the S-flank lava flows (figure 34).
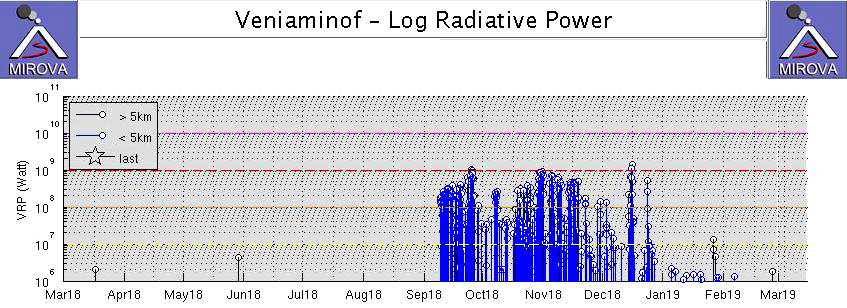 |
Figure 33. Plot showing the log radiative power of thermal anomalies at Veniaminof identified using MODIS data by the MIROVA system for the year ending on 28 February 2019. Courtesy of MIROVA. |
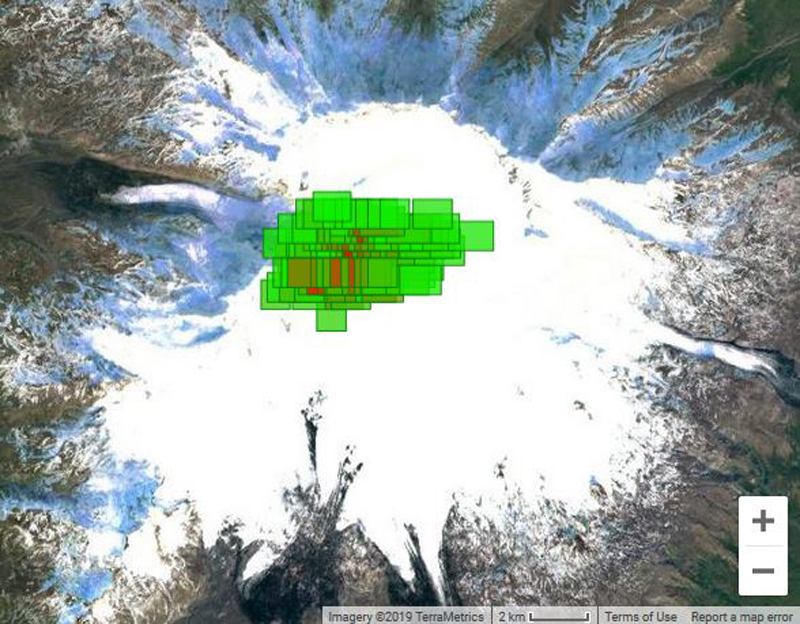 |
Figure 34. Map of thermal alert pixels at Veniaminof from the MODVOLC Thermal Alert System during 7 September-24 December 2018 (UTC). Courtesy of HIGP - MODVOLC Thermal Alert System. |
Information Contacts: Alaska Volcano Observatory (AVO), a cooperative program of a) U.S. Geological Survey, 4200 University Drive, Anchorage, AK 99508-4667 USA (URL: https://avo.alaska.edu/), b) Geophysical Institute, University of Alaska, PO Box 757320, Fairbanks, AK 99775-7320, USA, and c) Alaska Division of Geological & Geophysical Surveys, 794 University Ave., Suite 200, Fairbanks, AK 99709, USA (URL: http://dggs.alaska.gov/); Anchorage Volcanic Ash Advisory Center (VAAC), Alaska Aviation Weather Unit, NWS NOAA US Dept of Commerce, 6930 Sand Lake Road, Anchorage, AK 99502-1845 USA (URL: http://vaac.arh.noaa.gov/); Hawai'i Institute of Geophysics and Planetology (HIGP) - MODVOLC Thermal Alerts System, School of Ocean and Earth Science and Technology (SOEST), Univ. of Hawai'i, 2525 Correa Road, Honolulu, HI 96822, USA (URL: http://modis.higp.hawaii.edu/); MIROVA (Middle InfraRed Observation of Volcanic Activity), a collaborative project between the Universities of Turin and Florence (Italy) supported by the Centre for Volcanic Risk of the Italian Civil Protection Department (URL: http://www.mirovaweb.it/); Sentinel Hub Playground (URL: https://www.sentinel-hub.com/explore/sentinel-playground).
New eruption during February-April 2021 with ash plumes from summit and flank vents
Veniaminof, located on the Alaskan Peninsula, is truncated by a steep-walled, 8 x 11 km, glacier-filled caldera that formed around 3,700 years ago. There have been 14 eruptions over the past 38 years. It is monitored by the Alaska Volcanic Observatory (AVO) and the Anchorage Volcanic Ash Advisory Center (VAAC). A new eruption began in late February 2021 after more than a year of inactivity following an eruption during September-December 2018 which included Strombolian activity, an 800-m-long lava flow, and minor ash emissions (BGVN 44:01). This latest eruption that began in late February 2021 included thermal activity from two vents and ended in early April 2021.
Observations during 2019-2020. According to AVO, eruptive activity had significantly declined by the end of December 2018, but unrest characterized by seismic events continued into January 2019. During 1-3 January seismic tremor was at a low level and surface temperatures were slightly elevated, indicative of cooling lava. On 4 January AVO reduced the Aviation Color Code (ACC) to Yellow (the third highest level on a four-color scale) and the Volcanic Alert Level (VAL) to Advisory after satellite images showed that the extent of the lava flow in the summit caldera had not changed since late December 2018 and thermal images showed greatly reduced intensity.
Seismic tremor and occasional weak gas-and-steam emissions continued through April 2019, along with weakly elevated surface temperatures. On 30 April AVO lowered the ACC to Green and the VAL to Normal following four months of decreasing unrest, though low-level tremor, slightly elevated surface temperatures, and weak gas-and-steam emissions continued. Pilot reports of gas-and-steam emissions on 1 August coincided with low-level tremor, but by 25 August activity had returned to background levels.
AVO did not report further indications of unrest until 18 June 2020, when there was an increase in seismicity. Periods of low-amplitude seismic tremor decreased in frequency during 19-20 June and were not detected by the 21st. Minimal activity continued through early August.
Activity during January-April 2021. Analysis of satellite, webcam, and regional infrasound data by AVO suggested that new eruptive activity occurred on 28 February 2021, initially characterized by increased sulfur dioxide emissions, followed by elevated surface temperatures. A small melt pit was forming in the glacier above the flank vent. At 0513 on 4 March infrasound sensors recorded a small explosion and subsequent continuous low-level ash emissions, prompting AVO to raise the ACC to Orange and the VAL to Watch. A low-level ash plume rose to an altitude less than 3 km and drifted SSE was visible in satellite and webcam images; minor ash deposits were visible at the summit. Weak emissions continued at least through 1048 that day. On 5 March sulfur dioxide emissions were visible in a webcam image.
Numerous small explosions were recorded during 6-7 March, some of which were heard and felt by residents in Perryville (35 km SE). Elevated surface temperatures were identified in satellite images, suggesting lava was at or near the surface. During clear weather days, low-level gas-and-ash plumes were visible in satellite and webcam data and observed by pilots. The plumes mainly stayed below an altitude of 3 km, but at times rose as high as 4.6 km and drifted 150 km NE. On 7 March satellite images showed that the emissions originated from a small cone in the summit caldera (figure 35). Additionally, lava was likely effusing under the intra-caldera glacier in an area on the flank about 1 km E of the summit. This area produced incandescence and strongly elevated surface temperatures, as well as a small gas-and-steam plume. During 8-9 March satellite images showed that a small gas-rich plume rose to 4.6 km altitude that extended about 10 km NE.
|
Figure 35. High-resolution satellite image of Veniaminof taken on 7 March 2021, showing an ash plume from the erupting vent near the summit and a steam plume from the lava-heated meltwater lake about 1 km E. Tephra was deposited at least 22 km SE and 14 km NE. Image by Hannah Dietterich; courtesy of AVO. |
Explosions during 9-10 March, as detected on geophysical networks, produced ash emissions that rose to an altitude of 2.1-3 km and drifted 200 km NE and SE (figure 36). Ash deposits on the snow were observed up to 20 km from the vent, and gas-and-steam plumes from both vents were visible from the air on 11 March (figure 37). Explosions and ash emissions declined to lower levels after these events, though new ash deposits within the caldera extending as far as 10 km SE were sometimes identified in satellite images. Lava continued to effuse under the intra-caldera glacier in an area on the flank about 1 km E of the cone’s summit. Elevated surface temperatures over this area were identified in infrared satellite data during most days, along with gas-and-steam plumes and a broadening collapse pit in the ice. Data from local seismic stations were back online by 12 March and showed elevated seismicity and tremor through 15 March. During 15-16 March gas-and-steam and-ash plumes were again identified in satellite images.
|
Figure 36. White gas-and-steam and ash emissions from Veniaminof, as viewed from Perryville (35 km SE) on 9 March 2021. Photo by Austin Shangin; courtesy of AVO. |
|
Figure 37. Photo of Veniaminof from an ACE Air flight taken on 11 March 2021 at 1330. Ash deposits (dark gray) and white gas-and-steam emissions were visible. Photo by Ben David Jacob; courtesy of AVO. |
Similar activity continued during 17-23 March. Low surface temperatures were visible in satellite images, along with gas-and-steam plumes; low-level tremor was recorded in local seismic data. During the morning of 21 March small explosions were identified using seismic data and infrasound sensors in Chignik Lagoon (55 km NE). A gas plume drifted SE at an altitude of 1.5 km. Weak explosions were detected again during 22-23 March (figure 38). Sulfur dioxide plumes were also identified in satellite data. Minor ash emissions rose hundreds of meters and rapidly dissipated, though on 23 March a pilot saw an ash plume rise to an altitude of 3 km. Satellite data during 22-23 March showed highly elevated surface temperatures and subsidence of the glacial ice over the flank vent where lava was discharging. Highly elevated surface temperatures were detected by the MODVOLC Thermal Alert System and in infrared satellite images, along with ash deposits on 23 March that were primarily confined to the summit and upper flanks; low-level tremor was also recorded.
|
Figure 38. Ash emissions from Veniaminof as viewed from Perryville on 23 March 2021. Photo by Austin Shangin; courtesy of AVO. |
During 24 March explosions were recorded in local seismic data and with infrasound sensors; frequent explosive booming sounds (several per minute) were reported by residents in Perryville and Chignik Lagoon. Cloud cover prevented visual confirmation during this period of increased seismicity. On 25 March fresh ash deposits extending 10 km SE were observed on the summit caldera in satellite images. Satellite data also showed highly elevated surface temperatures at the summit and flank vent during clear weather days on 25, 28, and 29 March. Discrete, short-lived ash emissions were detected during the afternoon and evening of 27 March in images from the FAA webcam in Perryville. The intermittent events lasted several minutes and produced small ash clouds that rose less than 300 m above the vent and drifted SE. On 5 April low-level ash emissions were recorded by the webcam, resulting in tephra deposits to the SE. Eruptive and seismic activity declined after 5 April with no further reports through the end of the month.
Hotspots in March were observed on 10, 13, 15, 17, 22, 23, and 28 March, and were especially prominent on 23 March. No MODIS thermal anomalies were recorded by MODVOLC after 24 December 2018 until 10 March 2021, and none were recorded in April 2021. MIROVA (Middle InfraRed Observation of Volcanic Activity) analysis of MODIS satellite data showed a cluster of weak-to-moderate thermal anomalies during March 2021; three anomalies were detected during December 2020 and two during late January 2021 (figure 39). Sentinel-2 infrared satellite imagery showed a strong gray ash plume drifting NE on 9 March, accompanied by a weak thermal anomaly; thermal anomalies associated with both vents were clearly visible on 21 and 24 March (figure 40). AVO reported on 29 March that elevated surface temperatures were observed in overnight satellite images, which suggested that lava effusion was occurring from a flank vent into the caldera ice sheet. This activity continued to be reported through 3 April, though it was not reported that lava breached the surface. A weak thermal anomaly was visible on 30 April.
|
Figure 39. Plot showing a cluster of weak-to-moderate thermal anomalies at Veniaminof identified using MODIS data by the MIROVA system (Log Radiative Power) during 8 July 2020 through April 2021. Hotspots were concentrated in March 2021, many reaching a moderate to high range of thermal activity. Three weak anomalies were detected during December 2020 and two during late January 2021. Courtesy of MIROVA. |
|
Figure 40. Sentinel-2 infrared satellite imagery showed a strong ash plume drifting NE from Veniaminof on 9 March 2021 (top left). Thermal anomalies were also visible in the summit crater on 21 and 24 March (top right and bottom left), which had decreased visibly by 30 April (bottom right). Sentinel-2 satellite images with “Atmospheric penetration” (bands 12, 11, 8A) rendering. Courtesy of Sentinel Hub Playground. |
Information Contacts: Alaska Volcano Observatory (AVO), a cooperative program of a) U.S. Geological Survey, 4200 University Drive, Anchorage, AK 99508-4667 USA (URL: https://avo.alaska.edu/), b) Geophysical Institute, University of Alaska, PO Box 757320, Fairbanks, AK 99775-7320, USA, and c) Alaska Division of Geological & Geophysical Surveys, 3354 College Rd., Fairbanks, AK 99709, USA (URL: http://dggs.alaska.gov/); Hawai'i Institute of Geophysics and Planetology (HIGP) - MODVOLC Thermal Alerts System, School of Ocean and Earth Science and Technology (SOEST), Univ. of Hawai'i, 2525 Correa Road, Honolulu, HI 96822, USA (URL: http://modis.higp.hawaii.edu/); MIROVA (Middle InfraRed Observation of Volcanic Activity), a collaborative project between the Universities of Turin and Florence (Italy) supported by the Centre for Volcanic Risk of the Italian Civil Protection Department (URL: http://www.mirovaweb.it/); Sentinel Hub Playground (URL: https://www.sentinel-hub.com/explore/sentinel-playground).
|
|
||||||||||||||||||||||||||
There is data available for 24 confirmed eruptive periods.
2021 Feb 28 - 2021 Apr 5 Confirmed Eruption (Explosive / Effusive) VEI: 1
| Episode 1 | Eruption (Explosive / Effusive) | ||||||||||||||||||||||||||||||||||
|---|---|---|---|---|---|---|---|---|---|---|---|---|---|---|---|---|---|---|---|---|---|---|---|---|---|---|---|---|---|---|---|---|---|---|
| 2021 Feb 28 - 2021 Apr 5 | Evidence from Observations: Reported | |||||||||||||||||||||||||||||||||
|
List of 5 Events for Episode 1
|
||||||||||||||||||||||||||||||||||
2018 Sep 4 - 2018 Dec 23 Confirmed Eruption (Explosive / Effusive) VEI: 2
| Episode 1 | Eruption (Explosive / Effusive) | Intracaldera summit cone and its S flank | ||||||||||||||||||||||||||||||||||||||||||||||||||||||||||||||||||||||||||||||||||||||||||||||||||||||||||||||||||||||||||||||||||||||||||||||||||||||||||||||||||||||||||||||||||||||||||||||||||||||||||||||||||||||||||||||||||||||||||||||||||||||||||||||||||
|---|---|---|---|---|---|---|---|---|---|---|---|---|---|---|---|---|---|---|---|---|---|---|---|---|---|---|---|---|---|---|---|---|---|---|---|---|---|---|---|---|---|---|---|---|---|---|---|---|---|---|---|---|---|---|---|---|---|---|---|---|---|---|---|---|---|---|---|---|---|---|---|---|---|---|---|---|---|---|---|---|---|---|---|---|---|---|---|---|---|---|---|---|---|---|---|---|---|---|---|---|---|---|---|---|---|---|---|---|---|---|---|---|---|---|---|---|---|---|---|---|---|---|---|---|---|---|---|---|---|---|---|---|---|---|---|---|---|---|---|---|---|---|---|---|---|---|---|---|---|---|---|---|---|---|---|---|---|---|---|---|---|---|---|---|---|---|---|---|---|---|---|---|---|---|---|---|---|---|---|---|---|---|---|---|---|---|---|---|---|---|---|---|---|---|---|---|---|---|---|---|---|---|---|---|---|---|---|---|---|---|---|---|---|---|---|---|---|---|---|---|---|---|---|---|---|---|---|---|---|---|---|---|---|---|---|---|---|---|---|---|---|---|---|---|---|---|---|---|---|---|---|---|---|---|---|---|---|---|---|
| 2018 Sep 4 - 2018 Dec 23 | Evidence from Observations: Reported | ||||||||||||||||||||||||||||||||||||||||||||||||||||||||||||||||||||||||||||||||||||||||||||||||||||||||||||||||||||||||||||||||||||||||||||||||||||||||||||||||||||||||||||||||||||||||||||||||||||||||||||||||||||||||||||||||||||||||||||||||||||||||||||||||||
|
List of 50 Events for Episode 1 at Intracaldera summit cone and its S flank
|
|||||||||||||||||||||||||||||||||||||||||||||||||||||||||||||||||||||||||||||||||||||||||||||||||||||||||||||||||||||||||||||||||||||||||||||||||||||||||||||||||||||||||||||||||||||||||||||||||||||||||||||||||||||||||||||||||||||||||||||||||||||||||||||||||||
2013 Jun 13 - 2013 Oct 12 ± 1 days Confirmed Eruption (Explosive / Effusive) VEI: 3
| Episode 1 | Eruption (Explosive / Effusive) | Western intracaldera cone and SE flank | |||||||||||||||||||||||||||||||||||||||||||||||||||||||||||||||||||||||||||||||||||||||||||||||||||||||||||||||||||||||||||||||||||||||||||||||||||||||||||||||||||||||||||||||||||||||||||||||||||||||||||||||||||||||||||||||||||||||||||||||||||||||||||||
|---|---|---|---|---|---|---|---|---|---|---|---|---|---|---|---|---|---|---|---|---|---|---|---|---|---|---|---|---|---|---|---|---|---|---|---|---|---|---|---|---|---|---|---|---|---|---|---|---|---|---|---|---|---|---|---|---|---|---|---|---|---|---|---|---|---|---|---|---|---|---|---|---|---|---|---|---|---|---|---|---|---|---|---|---|---|---|---|---|---|---|---|---|---|---|---|---|---|---|---|---|---|---|---|---|---|---|---|---|---|---|---|---|---|---|---|---|---|---|---|---|---|---|---|---|---|---|---|---|---|---|---|---|---|---|---|---|---|---|---|---|---|---|---|---|---|---|---|---|---|---|---|---|---|---|---|---|---|---|---|---|---|---|---|---|---|---|---|---|---|---|---|---|---|---|---|---|---|---|---|---|---|---|---|---|---|---|---|---|---|---|---|---|---|---|---|---|---|---|---|---|---|---|---|---|---|---|---|---|---|---|---|---|---|---|---|---|---|---|---|---|---|---|---|---|---|---|---|---|---|---|---|---|---|---|---|---|---|---|---|---|---|---|---|---|---|---|---|---|---|---|---|---|---|---|
| 2013 Jun 13 - 2013 Oct 12 ± 1 days | Evidence from Observations: Reported | |||||||||||||||||||||||||||||||||||||||||||||||||||||||||||||||||||||||||||||||||||||||||||||||||||||||||||||||||||||||||||||||||||||||||||||||||||||||||||||||||||||||||||||||||||||||||||||||||||||||||||||||||||||||||||||||||||||||||||||||||||||||||||||
|
List of 49 Events for Episode 1 at Western intracaldera cone and SE flank
|
||||||||||||||||||||||||||||||||||||||||||||||||||||||||||||||||||||||||||||||||||||||||||||||||||||||||||||||||||||||||||||||||||||||||||||||||||||||||||||||||||||||||||||||||||||||||||||||||||||||||||||||||||||||||||||||||||||||||||||||||||||||||||||||
2008 Feb 22 - 2008 Mar 1 Confirmed Eruption (Explosive / Effusive) VEI: 1
| Episode 1 | Eruption (Explosive / Effusive) | Western intracaldera cone | |||||||||||||||||||||||
|---|---|---|---|---|---|---|---|---|---|---|---|---|---|---|---|---|---|---|---|---|---|---|---|---|
| 2008 Feb 22 - 2008 Mar 1 | Evidence from Observations: Reported | |||||||||||||||||||||||
|
List of 3 Events for Episode 1 at Western intracaldera cone
|
||||||||||||||||||||||||
2006 Mar 3 - 2006 Sep 7 Confirmed Eruption (Explosive / Effusive) VEI: 1
| Episode 1 | Eruption (Explosive / Effusive) | Western intracaldera cone | ||||||||||||||||||||||||||||
|---|---|---|---|---|---|---|---|---|---|---|---|---|---|---|---|---|---|---|---|---|---|---|---|---|---|---|---|---|---|
| 2006 Mar 3 - 2006 Sep 7 | Evidence from Observations: Reported | ||||||||||||||||||||||||||||
|
List of 4 Events for Episode 1 at Western intracaldera cone
|
|||||||||||||||||||||||||||||
2005 Sep 7 - 2005 Nov 4 (?) Confirmed Eruption (Explosive / Effusive) VEI: 1
| Episode 1 | Eruption (Explosive / Effusive) | Western intracaldera cone | |||||||||||||||||||||||||||||||||
|---|---|---|---|---|---|---|---|---|---|---|---|---|---|---|---|---|---|---|---|---|---|---|---|---|---|---|---|---|---|---|---|---|---|---|
| 2005 Sep 7 - 2005 Nov 4 (?) | Evidence from Observations: Reported | |||||||||||||||||||||||||||||||||
|
List of 5 Events for Episode 1 at Western intracaldera cone
|
||||||||||||||||||||||||||||||||||
2005 Jan 4 - 2005 Feb 14 ± 3 days Confirmed Eruption (Explosive / Effusive) VEI: 2
| Episode 1 | Eruption (Explosive / Effusive) | Western intracaldera cone | ||||||||||||||||||||||||||||||||||||||
|---|---|---|---|---|---|---|---|---|---|---|---|---|---|---|---|---|---|---|---|---|---|---|---|---|---|---|---|---|---|---|---|---|---|---|---|---|---|---|---|
| 2005 Jan 4 - 2005 Feb 14 ± 3 days | Evidence from Observations: Reported | ||||||||||||||||||||||||||||||||||||||
|
List of 6 Events for Episode 1 at Western intracaldera cone
|
|||||||||||||||||||||||||||||||||||||||
2004 Feb 16 - 2004 Sep 5 ± 4 days Confirmed Eruption (Explosive / Effusive) VEI: 2
| Episode 1 | Eruption (Explosive / Effusive) | Western intracaldera cone | ||||||||||||||||||||||||||||||||||||||
|---|---|---|---|---|---|---|---|---|---|---|---|---|---|---|---|---|---|---|---|---|---|---|---|---|---|---|---|---|---|---|---|---|---|---|---|---|---|---|---|
| 2004 Feb 16 - 2004 Sep 5 ± 4 days | Evidence from Observations: Reported | ||||||||||||||||||||||||||||||||||||||
|
List of 6 Events for Episode 1 at Western intracaldera cone
|
|||||||||||||||||||||||||||||||||||||||
2002 Sep 24 - 2003 Mar 23 Confirmed Eruption (Explosive / Effusive) VEI: 1
| Episode 1 | Eruption (Explosive / Effusive) | Western intracaldera cone | ||||||||||||||||||||||||||||
|---|---|---|---|---|---|---|---|---|---|---|---|---|---|---|---|---|---|---|---|---|---|---|---|---|---|---|---|---|---|
| 2002 Sep 24 - 2003 Mar 23 | Evidence from Observations: Reported | ||||||||||||||||||||||||||||
|
List of 4 Events for Episode 1 at Western intracaldera cone
|
|||||||||||||||||||||||||||||
1995 Nov 15 - 1995 Nov 30 (?) Confirmed Eruption (Explosive / Effusive) VEI: 1
| Episode 1 | Eruption (Explosive / Effusive) | Western intracaldera cone | |||||||||||||||||||||||
|---|---|---|---|---|---|---|---|---|---|---|---|---|---|---|---|---|---|---|---|---|---|---|---|---|
| 1995 Nov 15 - 1995 Nov 30 (?) | Evidence from Observations: Reported | |||||||||||||||||||||||
|
List of 3 Events for Episode 1 at Western intracaldera cone
|
||||||||||||||||||||||||
1995 Apr 17 - 1995 Apr 17 Confirmed Eruption (Explosive / Effusive) VEI: 1
| Episode 1 | Eruption (Explosive / Effusive) | Western intracaldera cone | |||||||||||||||||||||||
|---|---|---|---|---|---|---|---|---|---|---|---|---|---|---|---|---|---|---|---|---|---|---|---|---|
| 1995 Apr 17 - 1995 Apr 17 | Evidence from Observations: Reported | |||||||||||||||||||||||
|
List of 3 Events for Episode 1 at Western intracaldera cone
|
||||||||||||||||||||||||
1993 Jul 30 - 1994 Sep 28 (?) Confirmed Eruption (Explosive / Effusive) VEI: 2
| Episode 1 | Eruption (Explosive / Effusive) | Western cone and Half Cone | |||||||||||||||||||||||||||||||||||||||||||
|---|---|---|---|---|---|---|---|---|---|---|---|---|---|---|---|---|---|---|---|---|---|---|---|---|---|---|---|---|---|---|---|---|---|---|---|---|---|---|---|---|---|---|---|---|
| 1993 Jul 30 - 1994 Sep 28 (?) | Evidence from Observations: Reported | |||||||||||||||||||||||||||||||||||||||||||
|
List of 7 Events for Episode 1 at Western cone and Half Cone
|
||||||||||||||||||||||||||||||||||||||||||||
1987 Mar 19 - 1987 Mar 19 Confirmed Eruption (Explosive / Effusive) VEI: 1
| Episode 1 | Eruption (Explosive / Effusive) | Western intracaldera cone | |||||||||||||||||||||||
|---|---|---|---|---|---|---|---|---|---|---|---|---|---|---|---|---|---|---|---|---|---|---|---|---|
| 1987 Mar 19 - 1987 Mar 19 | Evidence from Observations: Reported | |||||||||||||||||||||||
|
List of 3 Events for Episode 1 at Western intracaldera cone
|
||||||||||||||||||||||||
1984 Nov 29 - 1984 Dec 6 (?) Confirmed Eruption (Explosive / Effusive) VEI: 2
| Episode 1 | Eruption (Explosive / Effusive) | Western intracaldera cone | ||||||||||||||||||||||||||||||||||||||
|---|---|---|---|---|---|---|---|---|---|---|---|---|---|---|---|---|---|---|---|---|---|---|---|---|---|---|---|---|---|---|---|---|---|---|---|---|---|---|---|
| 1984 Nov 29 - 1984 Dec 6 (?) | Evidence from Observations: Reported | ||||||||||||||||||||||||||||||||||||||
|
List of 6 Events for Episode 1 at Western intracaldera cone
|
|||||||||||||||||||||||||||||||||||||||
1983 Jun 2 - 1984 Apr 17 Confirmed Eruption (Explosive / Effusive) VEI: 3
| Episode 1 | Eruption (Explosive / Effusive) | Western intracaldera cone | ||||||||||||||||||||||||||||||||||||||||||||||||
|---|---|---|---|---|---|---|---|---|---|---|---|---|---|---|---|---|---|---|---|---|---|---|---|---|---|---|---|---|---|---|---|---|---|---|---|---|---|---|---|---|---|---|---|---|---|---|---|---|---|
| 1983 Jun 2 - 1984 Apr 17 | Evidence from Observations: Reported | ||||||||||||||||||||||||||||||||||||||||||||||||
|
List of 8 Events for Episode 1 at Western intracaldera cone
|
|||||||||||||||||||||||||||||||||||||||||||||||||
1956 Mar 16 ± 15 days - 1956 May 23 Confirmed Eruption (Explosive / Effusive) VEI: 3
| Episode 1 | Eruption (Explosive / Effusive) | Western intracaldera cone | |||||||||||||||||||||||||||||||||
|---|---|---|---|---|---|---|---|---|---|---|---|---|---|---|---|---|---|---|---|---|---|---|---|---|---|---|---|---|---|---|---|---|---|---|
| 1956 Mar 16 ± 15 days - 1956 May 23 | Evidence from Observations: Reported | |||||||||||||||||||||||||||||||||
|
List of 5 Events for Episode 1 at Western intracaldera cone
|
||||||||||||||||||||||||||||||||||
1944 Mar 28 Confirmed Eruption (Explosive / Effusive) VEI: 2
| Episode 1 | Eruption (Explosive / Effusive) | Western intracaldera cone | |||||||||||||||||||||||
|---|---|---|---|---|---|---|---|---|---|---|---|---|---|---|---|---|---|---|---|---|---|---|---|---|
| 1944 Mar 28 - Unknown | Evidence from Observations: Reported | |||||||||||||||||||||||
|
List of 3 Events for Episode 1 at Western intracaldera cone
|
||||||||||||||||||||||||
1939 Nov Confirmed Eruption (Explosive / Effusive) VEI: 2
| Episode 1 | Eruption (Explosive / Effusive) | Western intracaldera cone | ||||||||||||||||||
|---|---|---|---|---|---|---|---|---|---|---|---|---|---|---|---|---|---|---|---|
| 1939 Nov - Unknown | Evidence from Observations: Reported | ||||||||||||||||||
|
List of 2 Events for Episode 1 at Western intracaldera cone
|
|||||||||||||||||||
1939 May 23 - 1939 Jun 26 (?) Confirmed Eruption (Explosive / Effusive) VEI: 3
| Episode 1 | Eruption (Explosive / Effusive) | Western intracaldera cone | |||||||||||||||||||||||||||||||||
|---|---|---|---|---|---|---|---|---|---|---|---|---|---|---|---|---|---|---|---|---|---|---|---|---|---|---|---|---|---|---|---|---|---|---|
| 1939 May 23 - 1939 Jun 26 (?) | Evidence from Observations: Reported | |||||||||||||||||||||||||||||||||
|
List of 5 Events for Episode 1 at Western intracaldera cone
|
||||||||||||||||||||||||||||||||||
1930 Jun Confirmed Eruption (Explosive / Effusive) VEI: 2
| Episode 1 | Eruption (Explosive / Effusive) | Western intracaldera cone | |||||||||||||||||||||||
|---|---|---|---|---|---|---|---|---|---|---|---|---|---|---|---|---|---|---|---|---|---|---|---|---|
| 1930 Jun - Unknown | Evidence from Observations: Reported | |||||||||||||||||||||||
|
List of 3 Events for Episode 1 at Western intracaldera cone
|
||||||||||||||||||||||||
1892 Aug 28 - 1892 Aug 30 Confirmed Eruption (Explosive / Effusive) VEI: 3
| Episode 1 | Eruption (Explosive / Effusive) | Western intracaldera cone | ||||||||||||||||||||||||||||||||||||||
|---|---|---|---|---|---|---|---|---|---|---|---|---|---|---|---|---|---|---|---|---|---|---|---|---|---|---|---|---|---|---|---|---|---|---|---|---|---|---|---|
| 1892 Aug 28 - 1892 Aug 30 | Evidence from Observations: Reported | ||||||||||||||||||||||||||||||||||||||
|
List of 6 Events for Episode 1 at Western intracaldera cone
|
|||||||||||||||||||||||||||||||||||||||
1874 Jul 15 ± 45 days Confirmed Eruption (Explosive / Effusive) VEI: 2 (?)
| Episode 1 | Eruption (Explosive / Effusive) | Western intracaldera cone | ||||||||||||||||||
|---|---|---|---|---|---|---|---|---|---|---|---|---|---|---|---|---|---|---|---|
| 1874 Jul 15 ± 45 days - Unknown | Evidence from Observations: Reported | ||||||||||||||||||
|
List of 2 Events for Episode 1 at Western intracaldera cone
|
|||||||||||||||||||
[ 1852 ] Uncertain Eruption
| Episode 1 | Eruption (Explosive / Effusive) | Western intracaldera cone | ||||||||||||||||||
|---|---|---|---|---|---|---|---|---|---|---|---|---|---|---|---|---|---|---|---|
| 1852 - Unknown | Evidence from Unknown | ||||||||||||||||||
|
List of 2 Events for Episode 1 at Western intracaldera cone
|
|||||||||||||||||||
1838 Aug 4 - 1839 Apr Confirmed Eruption (Explosive / Effusive) VEI: 3
| Episode 1 | Eruption (Explosive / Effusive) | Western intracaldera cone | |||||||||||||||||||||||||||||||||
|---|---|---|---|---|---|---|---|---|---|---|---|---|---|---|---|---|---|---|---|---|---|---|---|---|---|---|---|---|---|---|---|---|---|---|
| 1838 Aug 4 - 1839 Apr | Evidence from Observations: Reported | |||||||||||||||||||||||||||||||||
|
List of 5 Events for Episode 1 at Western intracaldera cone
|
||||||||||||||||||||||||||||||||||
[ 1830 - 1838 ] Uncertain Eruption
| Episode 1 | Eruption (Explosive / Effusive) | |||||||||||||||||||
|---|---|---|---|---|---|---|---|---|---|---|---|---|---|---|---|---|---|---|---|
| 1830 - 1838 | Evidence from Unknown | ||||||||||||||||||
|
List of 2 Events for Episode 1
|
|||||||||||||||||||
1750 BCE (?) Confirmed Eruption (Explosive / Effusive) VEI: 6
| Episode 1 | Eruption (Explosive / Effusive) | |||||||||||||||||||||||||||||||||||||||
|---|---|---|---|---|---|---|---|---|---|---|---|---|---|---|---|---|---|---|---|---|---|---|---|---|---|---|---|---|---|---|---|---|---|---|---|---|---|---|---|
| 1750 BCE (?) - Unknown | Evidence from Isotopic: 14C (uncalibrated) | ||||||||||||||||||||||||||||||||||||||
|
List of 6 Events for Episode 1
|
|||||||||||||||||||||||||||||||||||||||
This compilation of synonyms and subsidiary features may not be comprehensive. Features are organized into four major categories: Cones, Craters, Domes, and Thermal Features. Synonyms of features appear indented below the primary name. In some cases additional feature type, elevation, or location details are provided.
Synonyms |
| Black Peak | Igek | Eek | Wenjaminow |
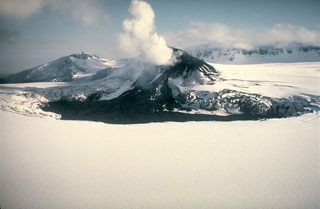 A scoria cone on the Veniaminof western summit caldera floor was the source of the dark lava flow that melted through glacial ice. This photo was taken from the SE on 15 June 1984, two months after the eruption ended, and shows the rim of the 8 x 11 km wide caldera in the background. The caldera rim contains Cone Glacier on the west side (to the far left) and is overtopped by glaciers on the south and SE sides.
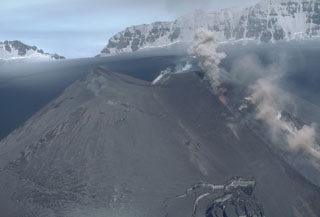 Ash and incandescent lava fragments rise above a fissure on a scoria cone at the summit of Veniaminof on 13 July 1983. The eruptions began on 2 June and covered the cone and much of the caldera floor with ash. Note the ash-covered glacial crevasses on the flanks of the cone to the lower right. The rim of the 8 x 11 km caldera appears in the distance to the NE.
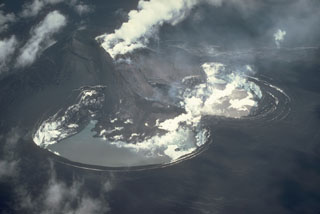 Strombolian eruptions from a scoria cone (upper left) produced heavy ashfall that darkens the entire Veniaminof caldera floor in this 26 July 1983 view from the SW. A plume rises above a vent near the top of the cone that is producing a lava flow down the flank and melting a large pit in the glacial ice Two meltwater lakes have formed in the depressions and steam rises from the margins of the lava flow. Concentric fractures are visible around the margin of the pit due to exposed glacial ice from the collapse.
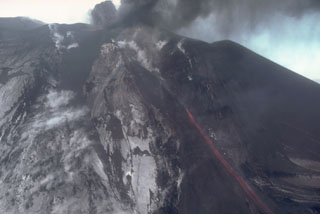 Incandescent lava flows down the side of a scoria cone in Veniaminof caldera on 7 October 1983 as ash plumes rise above the vent. This view from the SW shows the upper flanks of the cone, which is located on the west side of the glacier-covered caldera.
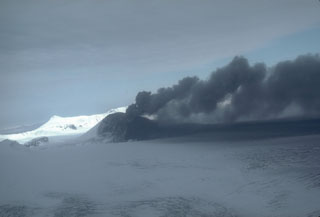 This weak, pulsating ash plume at Veniaminof, Alaska, on 7 October 1983 is being directed to the east by local winds. Dark ash deposits are visible on the cone and glacier, and a lava flow was traveling down the flank.
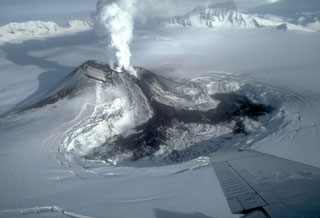 On 23 January 1984 this black lava flow erupted from a scoria cone in the west side of Veniaminof caldera, traveled down the south flank, and diverged into two lobes as it melted through glacial ice on the caldera floor. Strombolian eruptions began on 2 June 1983 and continued until the end of the eruption on 17 April 1984. By the time of this photo the lava flow had melted a depression about 1 x 2 km wide and 120 m deep. The NE caldera wall rises 500 m above the icecap in the distance.
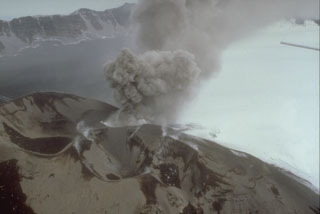 In this 3 August 1993 photo a small ash plume rises from a scoria cone within the Veniaminof caldera. Intermittent explosive eruptions began on 30 July and continued for more than a year. The eruptions also formed a new cone SE of the main western cone. As during the 1983-84 eruption, lava flows erupted onto the ice-covered caldera floor. Ash darkens the left side of the caldera floor in this view, with the caldera wall in the background.
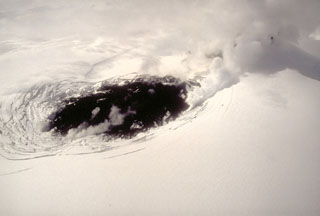 On 9 May 1994, a fresh black lava flow is erupted onto the glacier-covered caldera floor of Veniaminof volcano on the Alaska Peninsula. The source of the lava flow is a cinder cone that is obscured by steam to the upper right. Concentric fractures on the glacier surface are created as the lava flow melts through the glacial ice.
 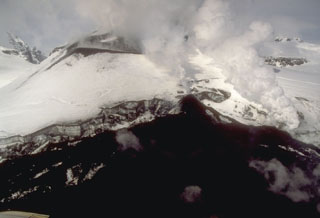 A new lava flow accumulates at the base of a scoria cone in Veniaminof caldera. This 9 May 1994 view from the west shows the snow-covered cone and the lava flow, which has melted through the glacial icecap on the caldera floor.
The following 5 samples associated with this volcano can be found in the Smithsonian's NMNH Department of Mineral Sciences collections, and may be availble for research (contact the Rock and Ore Collections Manager). Catalog number links will open a window with more information.
| Catalog Number | Sample Description | Lava Source | Collection Date |
|---|---|---|---|
| NMNH 117233-162 | Volcanic Bomb | -- | -- |
| NMNH 117233-163 | Pumice | -- | -- |
| NMNH 117233-164 | Basaltic Tuff | -- | -- |
| NMNH 117233-165 | Basalt | -- | -- |
| NMNH 117233-166 | Basalt | -- | -- |
| Alaska Volcano Observatory (Link to Veniaminof) | The Alaska Volcano Observatory (AVO) is a joint program of the U.S. Geological Survey (USGS), the Geophysical Institute of the University of Alaska Fairbanks (UAFGI), and the State of Alaska Division of Geological and Geophysical Surveys (ADGGS). AVO was formed in 1988, and uses federal, state, and university resources to monitor and study Alaska's hazardous volcanoes, to predict and record eruptive activity, and to mitigate volcanic hazards to life and property. |
| Copernicus Browser | The Copernicus Browser replaced the Sentinel Hub Playground browser in 2023, to provide access to Earth observation archives from the Copernicus Data Space Ecosystem, the main distribution platform for data from the EU Copernicus missions. |
| MIROVA | Middle InfraRed Observation of Volcanic Activity (MIROVA) is a near real time volcanic hot-spot detection system based on the analysis of MODIS (Moderate Resolution Imaging Spectroradiometer) data. In particular, MIROVA uses the Middle InfraRed Radiation (MIR), measured over target volcanoes, in order to detect, locate and measure the heat radiation sourced from volcanic activity. |
| MODVOLC Thermal Alerts | Using infrared satellite Moderate Resolution Imaging Spectroradiometer (MODIS) data, scientists at the Hawai'i Institute of Geophysics and Planetology, University of Hawai'i, developed an automated system called MODVOLC to map thermal hot-spots in near real time. For each MODIS image, the algorithm automatically scans each 1 km pixel within it to check for high-temperature hot-spots. When one is found the date, time, location, and intensity are recorded. MODIS looks at every square km of the Earth every 48 hours, once during the day and once during the night, and the presence of two MODIS sensors in space allows at least four hot-spot observations every two days. Each day updated global maps are compiled to display the locations of all hot spots detected in the previous 24 hours. There is a drop-down list with volcano names which allow users to 'zoom-in' and examine the distribution of hot-spots at a variety of spatial scales. |
|
WOVOdat
Single Volcano View Temporal Evolution of Unrest Side by Side Volcanoes |
WOVOdat is a database of volcanic unrest; instrumentally and visually recorded changes in seismicity, ground deformation, gas emission, and other parameters from their normal baselines. It is sponsored by the World Organization of Volcano Observatories (WOVO) and presently hosted at the Earth Observatory of Singapore.
GVMID Data on Volcano Monitoring Infrastructure The Global Volcano Monitoring Infrastructure Database GVMID, is aimed at documenting and improving capabilities of volcano monitoring from the ground and space. GVMID should provide a snapshot and baseline view of the techniques and instrumentation that are in place at various volcanoes, which can be use by volcano observatories as reference to setup new monitoring system or improving networks at a specific volcano. These data will allow identification of what monitoring gaps exist, which can be then targeted by remote sensing infrastructure and future instrument deployments. |
| Volcanic Hazard Maps | The IAVCEI Commission on Volcanic Hazards and Risk has a Volcanic Hazard Maps database designed to serve as a resource for hazard mappers (or other interested parties) to explore how common issues in hazard map development have been addressed at different volcanoes, in different countries, for different hazards, and for different intended audiences. In addition to the comprehensive, searchable Volcanic Hazard Maps Database, this website contains information about diversity of volcanic hazard maps, illustrated using examples from the database. This site is for educational purposes related to volcanic hazard maps. Hazard maps found on this website should not be used for emergency purposes. For the most recent, official hazard map for a particular volcano, please seek out the proper institutional authorities on the matter. |
| IRIS seismic stations/networks | Incorporated Research Institutions for Seismology (IRIS) Data Services map showing the location of seismic stations from all available networks (permanent or temporary) within a radius of 0.18° (about 20 km at mid-latitudes) from the given location of Veniaminof. Users can customize a variety of filters and options in the left panel. Note that if there are no stations are known the map will default to show the entire world with a "No data matched request" error notice. |
| UNAVCO GPS/GNSS stations | Geodetic Data Services map from UNAVCO showing the location of GPS/GNSS stations from all available networks (permanent or temporary) within a radius of 20 km from the given location of Veniaminof. Users can customize the data search based on station or network names, location, and time window. Requires Adobe Flash Player. |
| DECADE Data | The DECADE portal, still in the developmental stage, serves as an example of the proposed interoperability between The Smithsonian Institution's Global Volcanism Program, the Mapping Gas Emissions (MaGa) Database, and the EarthChem Geochemical Portal. The Deep Earth Carbon Degassing (DECADE) initiative seeks to use new and established technologies to determine accurate global fluxes of volcanic CO2 to the atmosphere, but installing CO2 monitoring networks on 20 of the world's 150 most actively degassing volcanoes. The group uses related laboratory-based studies (direct gas sampling and analysis, melt inclusions) to provide new data for direct degassing of deep earth carbon to the atmosphere. |
| Large Eruptions of Veniaminof | Information about large Quaternary eruptions (VEI >= 4) is cataloged in the Large Magnitude Explosive Volcanic Eruptions (LaMEVE) database of the Volcano Global Risk Identification and Analysis Project (VOGRIPA). |
| EarthChem | EarthChem develops and maintains databases, software, and services that support the preservation, discovery, access and analysis of geochemical data, and facilitate their integration with the broad array of other available earth science parameters. EarthChem is operated by a joint team of disciplinary scientists, data scientists, data managers and information technology developers who are part of the NSF-funded data facility Integrated Earth Data Applications (IEDA). IEDA is a collaborative effort of EarthChem and the Marine Geoscience Data System (MGDS). |