
SERNAGEOMIN reported increased seismicity at Lonquimay during the first half of March, characterized by hybrid (HB) signals accompanied by long-period (LP) events, and fewer volcano-tectonic (VT) events. Only some of the HB and VT events could be located where the epicenters were within 2-7 km of the volcano with hypocenters at depths of 4-11 km. The number of HB and VT events increased on 9 March. Deformation was not detected and no abnormal gas emissions were recorded. During 18-21 March two additional earthquakes were recorded, a VT and an HB, both with magnitudes below 1.3. Although the events were low magnitude, the seismicity was anomalous in the data going back to 2010 when monitoring stations were installed. The Alert Level was raised to Yellow, the second lowest level on a four-color scale.
Source: Servicio Nacional de Geología y Minería (SERNAGEOMIN)
1988-89 lava flows continue emitting steam
A late-March overflight made after a prolonged dry season enabled observations with relatively low snow levels. The volcano lacked signs of fumarolic or other activity. However, during fieldwork S of La Holandesa crater, the 1988-89 lava flows to the NE of the main cone within the Las Paramelas valley continued to emit steam.
Information Contacts: Jose Antonio Naranjo, Servicio Nacional de Geología e Minería (SERNAGEOMIN), Av. Santa María 0104, Casilla 10465, Santiago, Chile; Hugo Moreno Roa, Observatorío Volcanogía de los Andes del Sur (OVDAS), Manantial 1710-Carmino del Alba, Temuco, Chile; Simon R. Young, British Geological Survey (BGS), Murchison House, West Mains Road, Edinburgh EH9 3LA, United Kingdom.
2022: March
SERNAGEOMIN reported increased seismicity at Lonquimay during the first half of March, characterized by hybrid (HB) signals accompanied by long-period (LP) events, and fewer volcano-tectonic (VT) events. Only some of the HB and VT events could be located where the epicenters were within 2-7 km of the volcano with hypocenters at depths of 4-11 km. The number of HB and VT events increased on 9 March. Deformation was not detected and no abnormal gas emissions were recorded. During 18-21 March two additional earthquakes were recorded, a VT and an HB, both with magnitudes below 1.3. Although the events were low magnitude, the seismicity was anomalous in the data going back to 2010 when monitoring stations were installed. The Alert Level was raised to Yellow, the second lowest level on a four-color scale.
Source: Servicio Nacional de Geología y Minería (SERNAGEOMIN)
Reports are organized chronologically and indexed below by Month/Year (Publication Volume:Number), and include a one-line summary. Click on the index link or scroll down to read the reports.
Fissure eruption produces tephra clouds and lava flow
On Christmas Day, after more than 2 weeks of increasing seismicity, an eruption began at the NE foot of the volcano. Vigorous tephra emission fed a large eruption column that produced substantial ashfalls E of the volcano, and a lava flow advanced ~4.5 km.
Felt earthquakes and subterranean noises began 7 December. Several of the shocks reached intensities between IV and V, with magnitudes of 4.2-4.6. Some were registered at Santiago, 800 km away. About 200 earthquakes were felt during the 3 days prior to the start of the eruption, some of intensity VI. One was felt at Temuco, 110 km from the volcano, on 24 December.
The eruption began at 1615 the next day, with a strong ejection of gas and water vapor. Early in the eruption, about eight small vents were active along a fissure ~800 m long, 3.5 km from the summit. Its N60°E trend was similar to the orientation of previous Holocene and historic monogenetic eruptive centers that had produced lava domes and andesitic/dacitic block lava flows. Within a few hours, activity was concentrated at two principal vents. The eruption was dominated by gas emission during its first 36 hours. Moderate Strombolian activity from several vents was reported on 26 December. The next day, gas and tephra rose several thousand meters from the two main vents, feeding a plume that was blown E by mid-level winds. The plume was first detected on NOAA weather satellite images at 1100, when it extended 70 km E at roughly 5.5 km altitude, and remained evident in clear weather during the following weeks (table 1). Viscous lava began to flow N and NE from the fissure on 27 December at about noon.
Table 1. Observations of plumes from Lonquimay on NOAA weather satellite imagery, 27 December 1988-17 January 1989.
| Date | Time | Direction / Length | Weather and/or Height |
| 27 Dec 1988 | 1100-1200 | 70 km E, diffuse | about 5.5 km |
| 27 Dec 1988 | up to 1700 | dense to 50-80 km diffuse to 350 km | cirrus developing |
| 28 Dec 1988 | a.m. | dense ~70 km ENE diffuse to 160 km very diffuse to 68°W periodic pulses | freezing temp, 500-250 mbars |
| 28 Dec 1988 | 1430 | dense 50-80 km, S of E | cloudy |
| 29 Dec 1988 | 0900 | two plumes (v-shaped and diffuse) | -- |
| 29 Dec 1988 | 1200 | denser plume to 175 km E 100 km wide at 125 km very diffuse to 500 km | -- |
| 30 Dec 1988 | a.m. | dense to 150 km (10 km wide) diffuse to 425 km 65 km at widest point | weather front approaching |
| 30 Dec 1988 | p.m. | 100 km, more diffuse | -- |
| 31 Dec 1988 | 1400 | dense to 95 km E, 15-60 km wide; apparently weakening | -- |
| 31 Dec 1988 | 1900 | plume length increased by 2x; 250 km E, 50 km wide | -- |
| 02 Jan 1989 | 1430 | dense to 250 km, very diffuse to 500 km; 25 km wide at 250 km, due E, 40 km/hr wind speed | -- |
| 03 Jan 1989 | -- | 120 km long, 12 km wide; thin as far as 400 km; across continent | at least 5.5 km; -10°C |
| 04 Jan 1989 | 1300 | new eruption pulse (more dense) | -- |
| 04 Jan 1989 | 1500 | starting to separate from volcano | -34°C, about 9 km |
| 04 Jan 1989 | 1600 | weakened (more diffuse); fully separated from volcano; dense to 95 km, 35 km wide; 25 km thick, 120 km SE | -- |
| 05 Jan 1989 | 1400-1600 | still erupting; not as strong; 100-120 km SE | cloudy |
| 06 Jan 1989 | through 1750 | moderate density, 150 km E or N of E; diffuse to 400 km | -- |
| 08 Jan 1989 | 0500 | new eruption pulse | -- |
| 08 Jan 1989 | 1000 | dense, 20-30 km wide, 135 km NE | -- |
| 10 Jan 1989 | a.m. | dense to 200 km SE; diffuse to 500-600 km | -- |
| 10 Jan 1989 | 0630-0700 | eruption pulse | -- |
| 10 Jan 1989 | 0700-0800 | -- | -5°C, 5.5-6 km |
| 10 Jan 1989 | 1430-1730 | dense to 105 km ESE, 45 km wide; diffuse to 200-290 km | -- |
| 12 Jan 1989 | -- | -- | cloudy |
| 13 Jan 1989 | -- | no eruption evident | clear |
| 14-15 Jan 1989 | 2300-0300 | little or no plume evident (on IR) | clear |
| 15 Jan 1989 | 0330-0400 | possible weak eruption | -- |
| 15 Jan 1989 | 0420 | plume on visible image; dense to 150 km NE, diffuse to 350 E | -- |
| 16 Jan 1989 | 0900 | dense to 100-130 km ENE-NE; diffuse to 150-180 km; 20-30 km wide (visible image) | -- |
| 17 Jan 1989 | 0931 | very diffuse ENE to 300-360 km | clear |
A second phase, characterized by strongly explosive phreatomagmatic activity, began on 27 December at 1820 with the violent ejection of a column of gas and tephra, primarily andesite-dacite ash, that reached 9 km altitude in 5 minutes. The activity was concentrated in the upper vent, at 1,680 m elevation, which became the principal eruptive center. Two similar explosions followed, separated by intervals of approximately an hour. Oscar González-Ferrán estimated that the velocity of ejection reached between 250 and 350 km/hour. The next day, activity was nearly continuous, with alternating 15-20-minute periods of higher and lower explosivity ejecting spatter, bombs, lapilli, scoria, and ash. The cone over the main vent had reached 50 m height and 80 m in diameter (table 2). As the crater grew, it developed a horseshoe shape, open to the NE (downslope).
Table 2. Growth of Lonquimay's new Navidad cone, 28 December 1988-4 January 1989. Courtesy of Hugo Moreno Roa.
| Date | Height (m) | Diameter (m) |
| 28 Dec 1988 | 50 | 80 |
| 30 Dec 1988 | 60 | 150 |
| 31 Dec 1988 | 100 | 250 |
| 01 Jan 1989 | 110 | 250 |
| 02 Jan 1989 | 180 | 250 |
| 04 Jan 1989 | above 200 | 300 |
Some 60 hours after the large explosion on 27 December, the third phase began, characterized by substantial lava production (table 3) accompanied by strong magmatic degassing. Vigorous explosions produced shock waves and a large amount of ash, while an andesitic block lava flow crept very slowly NNE. Two lobes were active, the longer to the E. The rate of lava effusion was estimated at ~4 x 10⁵ m3/day through 4 January, with the flow front advancing 20-25 m/hour.
Table 3. Dimensions of the lava flow from Lonquimay, 28 December 1988-4 January 1989. Courtesy of Hugo Moreno Roa.
| Date | Length (km) | Thickness (m) | Surface Area (km2) | Volume (x 106 m3) |
| 28 Dec 1988 | 1.8 | 10 | 1.0 | 10 |
| 30 Dec 1988 | 3.0 | 10 | 1.5 | 15 |
| 31 Dec 1988 | 3.3 | 10 | 2.2 | 22 |
| 02 Jan 1989 | 4.0 | 10 | 2.5 | 25 |
| 04 Jan 1989 | 4.5 | 10 | 3.0 | 30 |
Three seismographs from the Univ of Chile were installed by Sergio Barrientos, Hector Masone, and Oscar González-Ferrán ~27 hours after the onset of the eruption (between 2100 on 26 December and 0400 on the 27th): LON1, on the flank of Cerro Cautín, 4 km from the eruptive center; LON2, in Pinitos Malalcahuello, 11 km away; and LON3 in Quebrada Guamachuco, 12 km from the vent (figure 1). When seismic recording began, activity was very intense, with ~50 events every 3 hours (figure 2). However, seismic activity declined rapidly between 40 and 120 hours after the start of the eruption. Initial analysis of the seismograms showed that the epicenters were concentrated in the immediate eruption area. Geologists therefore believed that eruptive activity was unlikely to propagate SE toward the main crater of Lonquimay or to another point on the eruptive fissure.
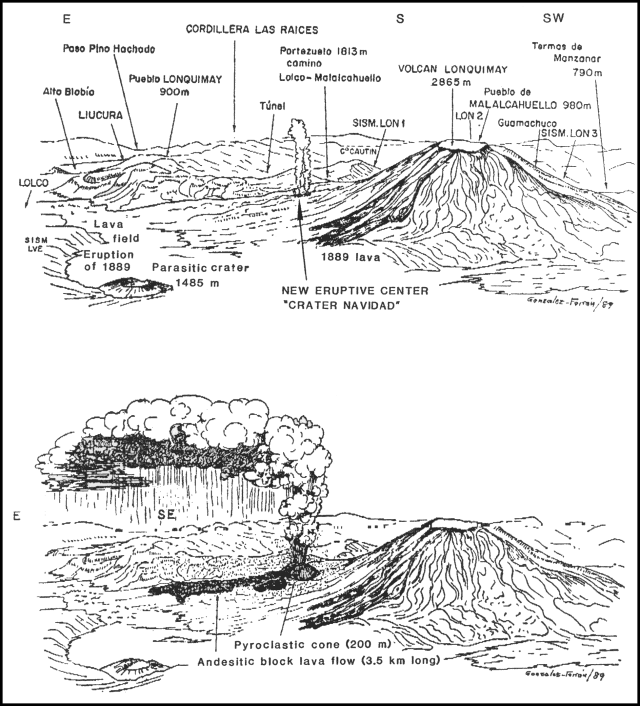 |
Figure 1. Sketches of Lonquimay showing activity during the initial phase during 25-26 December 1988 (top) and in early January 1989 (bottom). In December the new eruptive fissure emitted water vapor, blocks, and fragments of older lava. Positions of newly installed seismic stations LON1, LON2, and LON3 are also indicated. The January sketch depicts the plume rising several thousand meters above the 200-m-high pyroclastic cone and extending tens of kilometers downwind; the lava flow has reached 3.5 km length. Courtesy of O. González-Ferrán. |
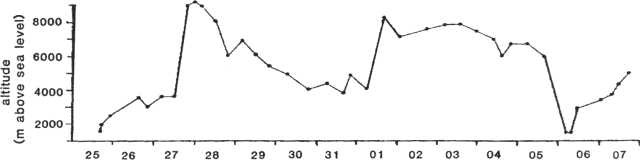 |
Figure 2. Number of seismic events recorded in 3-hour periods, 27 December 1988-7 January 1989, by Univ of Chile seismic station LON3, 12 km from the vent. Arrows label changes in eruptive activity. Courtesy of O. González-Ferrán. |
The effusive phase continued during the following week, with strong magmatic degassing. Explosive activity was intense and nearly continuous with vigorous emission of gas and ash, generating a column that usually remained between 5,000 and 7,000 m altitude (figure 3). The plume was generally very consistent in both altitude and direction, toward the SE.
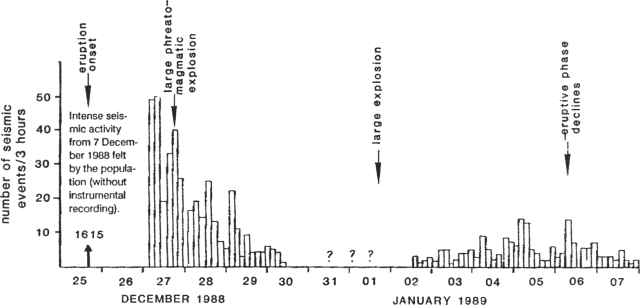 |
Figure 3. Daily altitude of the gas-tephra column from Lonquimay, in meters above sea level, 25 December 1988-7 January 1989. Courtesy of O. González-Ferrán. |
Satellite imagery showed dense plumes extending as much as 250 km and more diffuse material was occasionally evident to 500 km from the volcano (figure 4). The plumes generally were of insufficient density to yield precise blackbody temperatures (and thus infer plume height from satellite data). However, correlations of estimated plume temperatures and directions of drift with data from nearby radiosondes agreed well with altitude estimates by field geologists. Winds caused sporadic rotation and shearing of the eruption column at 2,000-3,000 m altitude, producing ashfall to the SW and NE (figure 5). On 4 January at 1500, during a period of increased atmospheric humidity, geologists observed that the plume became cauliflower-shaped and a thunderstorm developed within it. An acidic rain began to fall, probably of pH 3-4. The estimated volume of the mixture of gas and pyroclastics, principally ash, was on the order of 8 x 10¹¹ m3 as of mid-January. Lava emission was slow and not very voluminous, with the block flow reaching a length of around 3.5 km by 8 January.
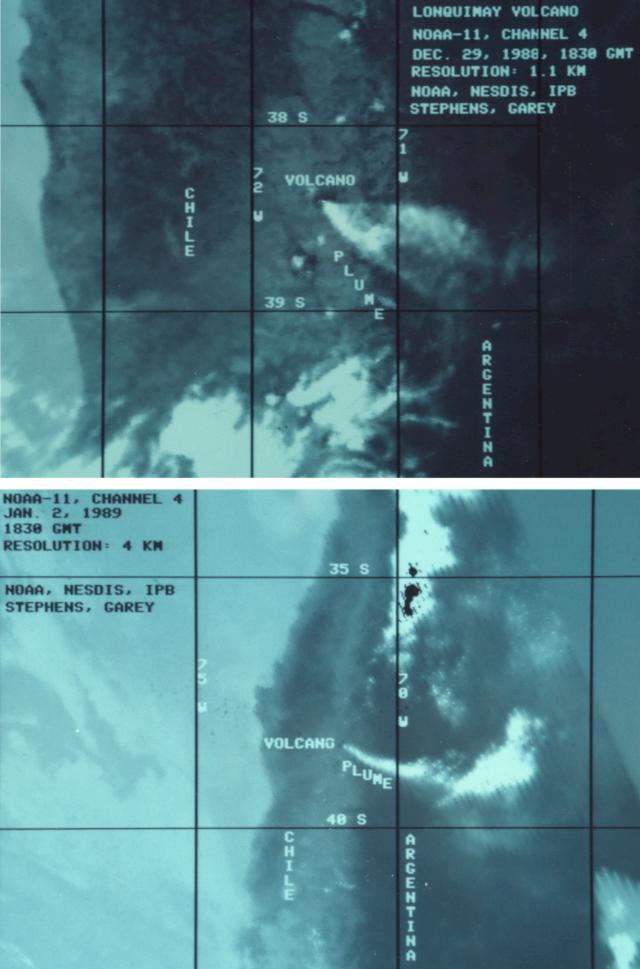 |
Figure 4. Images from data collected by the AVHRR on the NOAA-11 polar orbiting satellite, 29 December 1988 at 1530, 1.1 km resolution (top) and 2 January 1989 at 1530, 4 km resolution (bottom). One of the five spectral channels on the AVHRR (channel 4) senses thermal radiation, and was used to determine plume temperatures of around 0°C on both images. Correlation of this temperature and the direction of plume movement with radiosonde data indicate that the plume is at an altitude of about 5 km on both images. Courtesy of G. Stephens. |
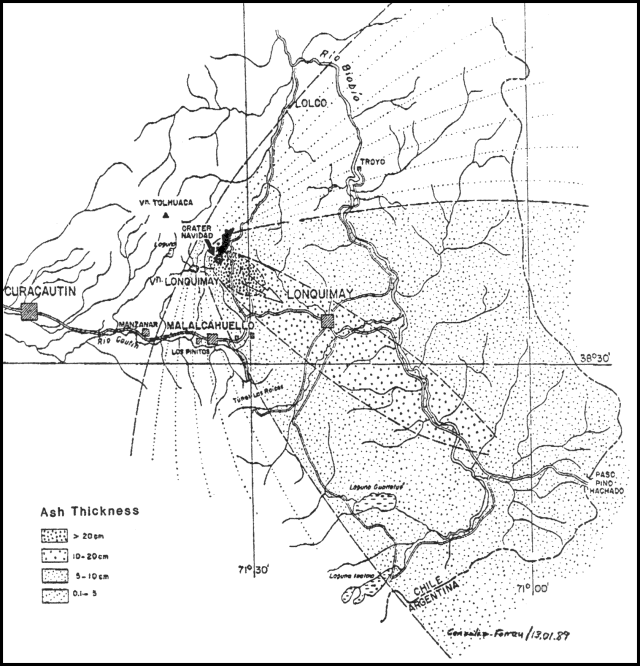 |
Figure 5. Cumulative ash deposition from the Lonquimay eruption as of 13 January 1989. Courtesy of O. González-Ferrán. |
Explosive activity declined noticeably on 6 January at a little before 0400, and had practically ended by 0500. The column of gas and pyroclastics disappeared, with ejection limited to some incandescent blocks. Resumption of activity began with small emissions of gas and pyroclastics every 15 minutes until 0730, to heights that did not exceed 200 m. A new vent-clearing phase then began, consisting of strong emission of ash and soot-like material, without magmatic degassing or ejection of incandescent blocks. Satellite images had shown decreased activity on 5 January, but moderate plumes were evident with diffuse material to 400 km from the volcano on the 6th. Explosive activity continued during the following 24 hours, to altitudes that increased to some 3,000-4,000 m, accompanied by strong explosions. During this phase the plume continued to drift primarily ENE. The lava flow remained stationary.
The number of seismic events had noticeably decreased from the first week of the eruption. During the more effusive activity of 2-8 January, only 210 shocks were registered. No changes or migrations of the epicentral area were observed, with the sole exception of a brief shift toward the SW sector of the volcano (Quebrada de Guamachuco area). This ended quickly and was not repeated. The seismic net was temporarily reinforced by another four seismographs, one with three components, contributed by the Instituto Nacional de Prevención Sísmico de San Juan, Argentina (INPRES) and brought to the region by geologist Nestor Weidmann. This equipment operated 4-9 January before it was returned to its base in San Juan.
Associated with the decline in activity on 6 January was a sequence of strong shocks, some with maximum intensities of IV-V. These were interpreted to be related to the collapse of the roof of the magma chamber as magma column pressure diminished, coinciding with the observed vent-clearing phase. Between 8 and 14 January, a strong increase in seismicity was recorded, while eruptive activity remained at a medium-low level. On 12 January at 0011, a M 4.6 shock reached an estimated intensity of V-VII in the epicentral area, causing landslides, slumping of roads, and broken windows in houses. A shock registered 24 hours later reached M 5.0, larger than the events on 25 December.
On 8 January, the activity continued to increase and was entering a magmatic degassing phase, with an increase in lava block and spatter emission accompanied by strong explosions that caused expansive air waves. González-Ferrán noted that the compositional characteristics of the ejecta had changed from the more viscous and silicic (andesite-dacite) initial phase to a more fluid andesite. Satellite imagery showed continued plume production through 10 January. Clouds then obscured the area until 13 January, when no plume was evident throughout the day despite clear weather. A distinct plume was next detected on 15 January at 0420, with dense material extending 150 km from the volcano. Plume emission was continuing as of 17 January.
Moyra Gardeweg and Jorge Muñoz (SERNAGEOMIN) reported that bombs were of andesite to basaltic andesite composition with plagioclase, pyroxene, and olivine phenocrysts in a pale brown glassy groundmass. L. López-Escobar and J. Martínez (Univ of Chile) noted that ash collected at the town of Lonquimay (20 km from the vent) had an SiO2 content of 57.78% and a bomb collected near the cone, 59.21%, similar to the 59.49% in a sample from the lava flow extruded 100 years ago.
The principal risk for the population continues to be ashfall and gases that have particularly affected the region SE of the vent (Pueblo de Lonquimay, areas around the Cordillera de las Raices and upper Bio-Bio, to the Troyo zone; ashfall also extends into Argentina). The ashfall caused by low-altitude wind shearing occurred to the SSW, affecting the Malalcahuello region and the upper part of the Cautín river toward Guamachuco. The total population affected in Chile was ~10,000, of which ~2,000 were evacuated. The National Emergency Office, The Regional Intendancy, and the National Health Service conveyed immediate medical assistance, distributed protective masks, and issued emergency instructions. The agricultural and livestock authorities have provided information to help protect farm animals, which include ~100,000 cattle and sheep.
Participants in fieldwork included Sergio Barrientos, Hector Masone, Carlos Droguett, and O. González-Ferrán (Univ de Chile), Maurice and Katia Krafft (Equipe Vulcain, Cernay, France), Patricio Acevedo (Dept de Física, Univ de la Frontera, Temuco), Jaime Abarzua (Administrador, Reserva Malalcahuello, CONAF), and E. Casanova (Jefe, Oficina Emergencia, Victoria).
Information Contacts: O. González-Ferrán and H. Moreno, Univ de Chile; S. Kusselson, O. Karst, G. Swanson, M. Ruminsky, and A. Powell, SAB; G. Stephens, NOAA/NESDIS.
Tephra ejection and lava extrusion continue
The eruption was continuing in mid-March 1989. Eruptive activity and seismicity had declined substantially on 6 January. Eruption intensity increased slightly the next day, continuing with alternating pulses of greater and lesser explosivity; eruption columns rose a maximum of 2,500 m above the crater. Seismicity remained at relatively low levels through 11 January, then began a strong increase with a M 4.6 event on 12 January at 0011. The number of events reached 25/hour on the 12th, with 156 shocks recorded that day. A M 5.0 earthquake was one of 115 recorded the next day. Vigorous ejection of dense ash/gas columns was accompanied by an increase in the output rate of the block lava flow. On 14 January, the flow was advancing at ~10 m/hour, had an average width of 300-400 m, and was ~10 m thick. The approximate length of its E lobe was 6 km, and its W lobe 3 km.
Navidad cone, built to a height of more than 200 m by early January, collapsed on 12 January, reducing its height. By 21 January, however, Carlos Varela (Univ de la Frontera) measured its dimensions at 185 m high, with a crater 295 m across and a 750-m basal diameter. Most of the ash produced by the eruption fell E and SE of the volcano (figure 6). Lonquimay village (roughly 20 km SE of the cone) recorded 1 cm of ash on 21 January, and tephra collected at the village had an andesitic composition (table 4). Seismicity remained centered in the NE flank of the volcano, without any apparent focal migration.
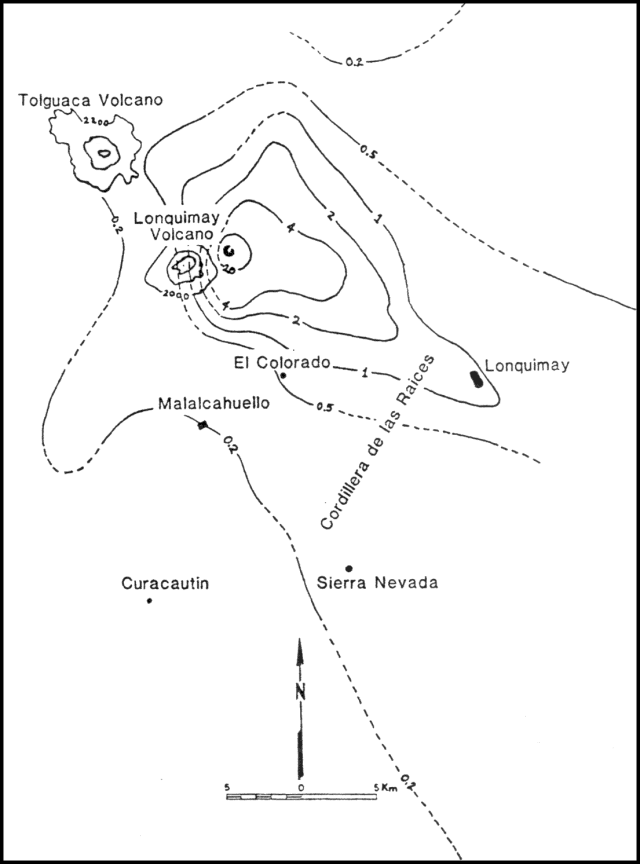 |
Figure 6. Preliminary cumulative ashfall isopach map (in centimeters), based on 67 data points, as of 3 February 1989. A few contours are sketched to indicate the positions of Lonquimay and Tolguaca volcanoes. Courtesy of H. Moreno. |
Table 4. Analysis by J. Martínez of ash (Lonquimay village) and bomb samples from the Lonquimay eruption. Courtesy of H. Moreno and P. Riffo.
| Component | Ash Sample | Bomb Sample |
| SiO2 | 57.48 | 58.65 |
| Al2O3 | 16.24 | 15.90 |
| TiO2 | 1.51 | 1.51 |
| Fe2O3 | 3.39 | 1.52 |
| FeO | 6.08 | 7.72 |
| MgO | 2.38 | 2.25 |
| CaO | 5.57 | 5.57 |
| Na2O | 5.04 | 4.95 |
| K2O | 0.99 | 0.95 |
| MnO | 0.23 | 0.22 |
| P2O5 | 0.43 | 0.42 |
| LOI | 0.65 | 0.57 |
| Total | 99.99 | 100.23 |
Explosive activity of varying intensity continued in late January and early February. The ash column rose 1,000-2,000 m above the crater, and was blown E to SE through 1 February, then NNW to SW 2-8 February (table 5). The rate of lava discharge had declined from ~5.0 x 10⁶ m3/day 27 December-2 January to 1.4 x 10⁶ m3/day 2-31 January and 0.75 x 10⁶ m3/day 31 January-8 February. The rate of advance at the flow fronts had also declined, measuring 1-1.5 m/hour on 8 February. The flow covered an area of ~6.5 km2 with an average thickness of 12 m, yielding a volume of 78 x 106 m3. The longer eastern lobe had reached 7.3 km down the Lolco river valley from the crater (figure 7). Activity increased again on 14 February, with more vigorous ejection of a column of pyroclastics and gases, plus a slight increase in the emission rate of the block lava flow. Stronger seismicity was associated with the more vigorous eruption; events were felt at MM III or IV 50 km from the vent at about 0500, 0830, 0919, and 1040. Tephra ejection continued on 10 March, and the flow front in the Lolco river valley was >9 km from the crater (figure 8).
Table 5. Ashfall locations and directions from Lonquimay, 27 January-8 February and 2-9 March 1989. Courtesy of H. Moreno, P. Riffo, and G. Fuentealba.
| Date | Time Period | Direction | Ashfall |
| 27 Jan 1989 | -- | ESE | Las Raices (20 km SE), Lonquimay village (20 km ESE) |
| 28 Jan 1989 | -- | E | Las Raices |
| 29 Jan 1989 | -- | ESE | Las Raices, Lonquimay village |
| 30 Jan 1989 | -- | ESE | Las Raices, Lonquimay village |
| 31 Jan 1989 | morning | ESE | Las Raices, Lonquimay village |
| 31 Jan 1989 | afternoon | SE-S | Sierra Nevada, Malalcahuello (12 km S) |
| 01 Feb 1989 | -- | SE | El Colorado (10 km SE) |
| 02 Feb 1989 | morning | NNW | -- |
| 02 Feb 1989 | noon | NW | Tolguaca Volcano (10 km NW) |
| 02 Feb 1989 | afternoon | W-SW | Curacautin town (28 km SW) |
| 03 Feb 1989 | -- | W-SW | Curacautin town |
| 08 Feb 1989 | -- | NNW | Very well-defined over 120 km(Angol city) |
| 02 Mar 1989 | -- | SE-S | Sierra Nevada, Malacahuello |
| 06 Mar 1989 | -- | SE | El Colorado |
| 08 Mar 1989 | -- | N-NE | Lolco River valley |
| 09 Mar 1989 | -- | ESE-NE | Las Raices, Naranjo, Lonquimay village |
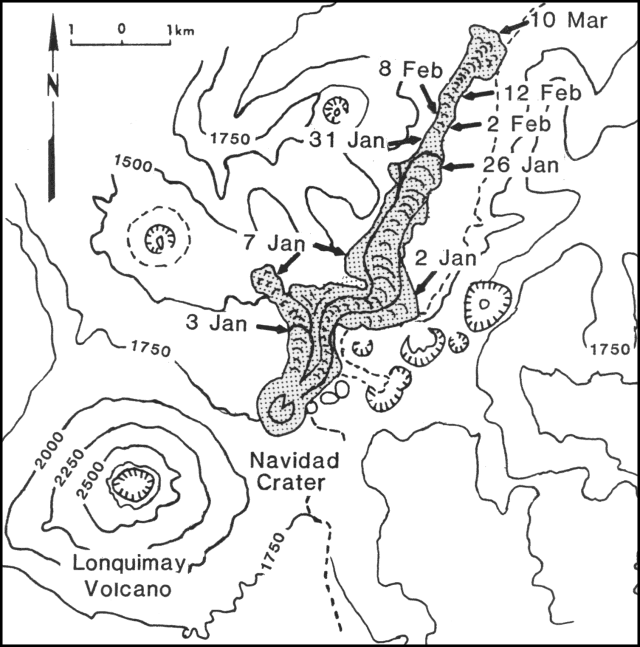 |
Figure 7. Sketch map showing the advance of the lava flows during December 1988-10 March 1989. Courtesy of O. González-Ferrán, H. Moreno R., and P. Riffo A. |
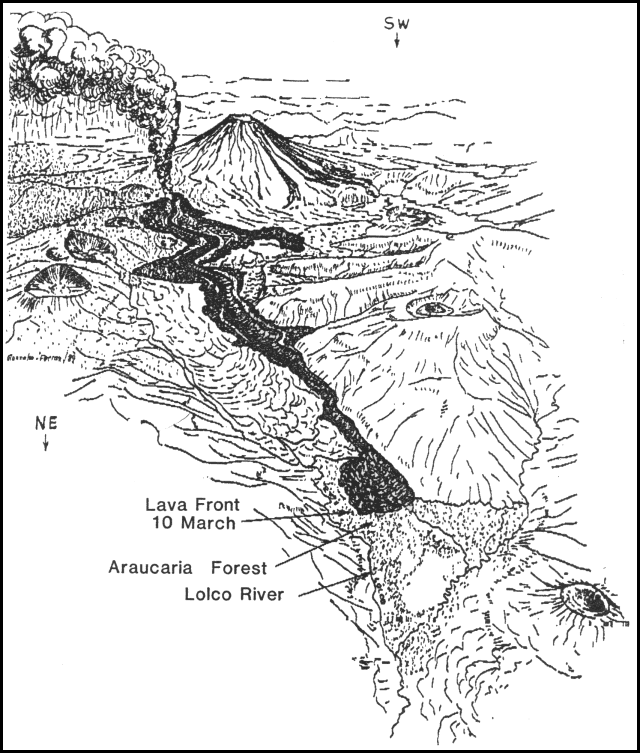 |
Figure 8. Panoramic view of the Lonquimay eruption from the NE on 10 March 1989 showing the block lava flow along the Lolco river valley and tephra emission from Navidad cone. Courtesy of O. González-Ferrán. |
Small forest fires caused by the flow in January and February were controlled by the National Forest Service (CONAF). Water around the E side of the volcano has a high chloride and sulfide content. Some cattle, ducks, and chickens died after ashfall on grass; exact cause of death was not specified.
Information Contacts: H. Moreno, Univ de Chile; O. González-Ferrán, Univ de Chile; P. Riffo and G. Fuentealba, Univ de la Frontera.
Lava production exceeds 108 m3; tephra emission continues
Moderate ash emission and lava production were continuing in mid-April from Navidad cone. Increased seismicity had preceded the onset of more vigorous tephra emission on 24 February and activity remained strong into early March (figure 9). As of early April, ash clouds were rising to 3-4 km altitude. Most ash fell E of the volcano. The rate of lava production peaked 2-7 January at an estimated 75 m3/s, then declined, but was increasing slightly in late March (table 6). By 25 March, after 90 days of activity, the lava flow volume was estimated at 1.03 x 10⁸ m3, and it had advanced 10 km down the Lolco river valley (figure 10).
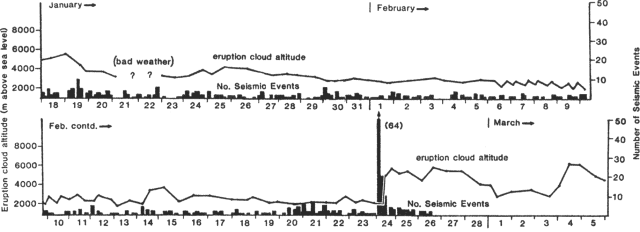 |
Figure 9. Altitudes reached by tephra clouds from Navidad cone (curve) and number of seismic events in 4-hour periods (bars), 18 January-5 March 1989. Courtesy of O. González-Ferrán. |
Table 6. Estimated dimensions, volume, extrusion rate, and flow front velocity of the andesitic block lava from Navidad crater, 25 December 1988-25 March 1989. Courtesy of O. González-Ferrán.
| Date | Days | Length (m) | Width (m) | Volume (x 106 m3) | Rate (m3/s) | Velocity (m/hour) |
| 25 Dec-27 Dec 1988 | 2 | 500 | 200 | 0.5 | 3 | 11 |
| 27 Dec-02 Jan 1989 | 6 | 3000 | 500 | 15 | 30 | 21 |
| 02 Jan-03 Jan 1989 | 1 | 1300 | 500 | 6.5 | 75 | 54 |
| 03 Jan-07 Jan 1989 | 4 | -- | -- | 25.8 | 75 | -- |
| - Flow 1 | -- | 1400 | 400 | 5.6 | -- | 15 |
| - Flow 2 | -- | 900 | 1500 | 4.8 | -- | 9 |
| - Flow 3 | -- | 1000 | 1100 | 15.4 | -- | 10 |
| 07 Jan-26 Jan 1989 | 19 | 2000 | 800 | 24 | 15 | 4 |
| 26 Jan-02 Feb 1989 | 7 | 800 | 320 | 5.12 | 8 | 5 |
| 02 Feb-12 Feb 1989 | 10 | 800 | 250 | 5 | 6 | 3 |
| 12 Feb-10 Mar 1989 | 26 | 800 | 300 | 7.2 | 3 | 1 |
| 10 Mar-25 Mar 1989 | 15 | 900 | 600 | 13.5 | 11 | 3 |
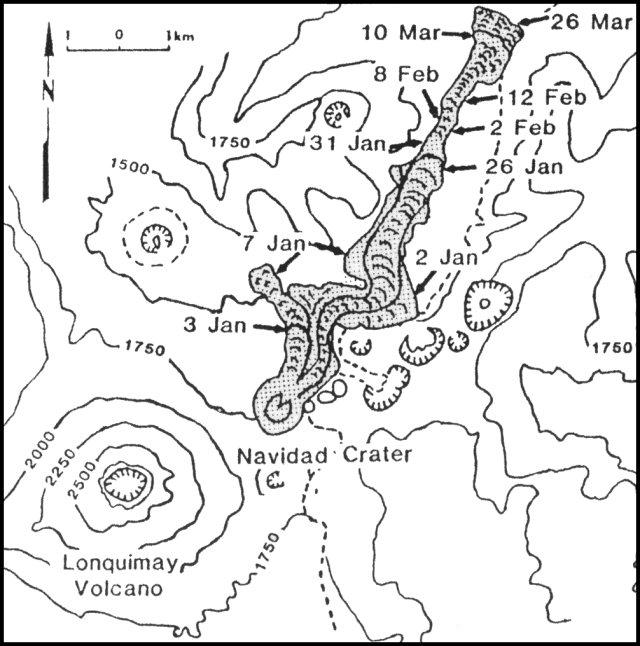 |
Figure 10. Sketch map showing the advance of the lava flow, 25 December 1988-26 March 1989. Courtesy of O. González-Ferrán, H. Moreno, and P. Riffo. |
Navidad cone, an asymmetric pyroclastic cone composed of black scoria with a minor amount of spatter-like bombs, was 210 m high and 700 m in E-W basal diameter in early April. It remained horseshoe-shaped, breached to the N. The crater was funnel-shaped and elongated NNE, with a minimum diameter of 250 m NW-SE. At its eastern base were 3-4 vents, one of which was continuously active. As viewed from the S, the cone changed in shape from uniform slopes with a higher W rim, to an irregular E slope with a bulge close to the top and a higher E rim.
During early April, the eruption column varied between 500 and 1,500 m above the crater. Strong WNW winds dispersed the plume eastward to the Lonquimay District. Geologists estimated that the VEI has decreased to 1-2, from 2-3 in early January. Two conspicuous eruptive phases were observed in alternate periods of 10 to 90 minutes; a phreatic, strongly explosive one accompanied by a white to pale-brownish small ash/steam column, and a noiseless, voluminous, dark gray-brownish, tephra-rich column associated with deeper degassing and fragmentation.
Black scoria and dark gray ash have been deposited mainly E of the cone. Bombs of various shapes and sizes have been observed as far as 1 km NE of the vent, where they occasionally reached 2.5 m across. S and E of the cone the bombs fell closer, <200 m from its base. Ribbon, spindle, spatter, and minor cow-dung bombs were also observed.
By 5 April, the lava flow had two well-defined lobes. The longer was advancing along the Lolco river valley. The shorter, quite active, lobe was a new one moving NW on top of a flow from early in the eruption (Laguna Verde). The Lolco front reached 35 m height, and had a temperature of 1,040°C. It was advancing over a swampy area, causing soil deformation, squeezing the soft sediments, and contaminating the water of the Lolco river. Nearly 0.8 km2 of wild Araucaria forest have been destroyed along this valley. By early April, the lava flow covered an area of ~9.5 km2. Locally, the rough lava surface shows yellowish iron chlorides due to the high HCl content of the volcanic gases. SO2 has also been detected.
Information Contacts: O. González-Ferrán, Univ de Chile; H. Moreno, Univ de Chile; M. Gardeweg and J. Naranjo, SERNAGEOMIN, Santiago.
Continued tephra emission; cattle sickened by ash
The eruption . . . was continuing in early May. Eruption clouds in April and early May, composed mainly of dark brown ash and water vapor, rose 500-1,500 m from Navidad Crater. The number of recorded seismic events had declined to 2-3/day.
Estimates of the volume of the lava flow vary, and are made difficult by the flow's very irregular thickness, which has been increasing faster than the area covered by lava. Hugo Moreno estimated that through March ~150 x 106 m3 of lava had been extruded. The lava flow's W lobe essentially stopped advancing in mid-February, but the E front continued to move down the Lolco River valley. Little additional advance of the lava flow was noted in April and early May. The position of the flow as of 5 April is shown in figure 11.
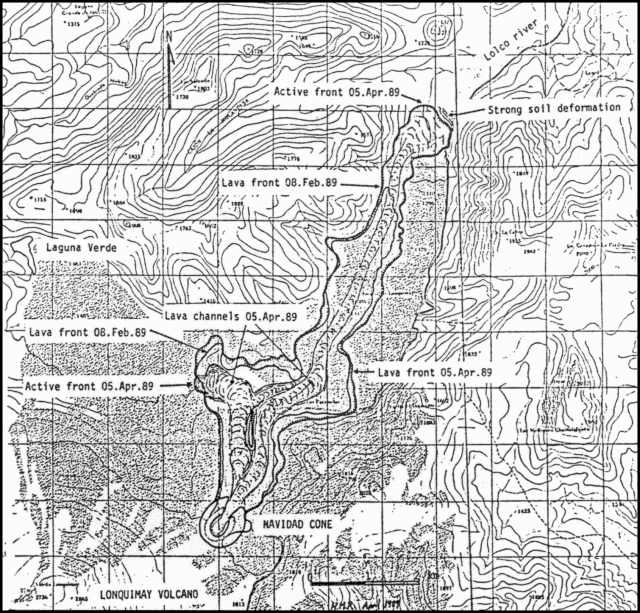 |
Figure 11. Map showing the lava flows as of 5 April 1989. Courtesy of Hugo Moreno Roa. |
About 10,000 cattle have been suffering the effects of ashfall since December. Many have lost >100 kg in weight and are dying. Analyses by specialists at the Univ Austral determined that the animals are being affected by overdoses of fluorine from the ash. Ash has fallen in various directions (see table 5). The localities most affected are Maillin del Treile, El Naranjo (both roughly 20 km ESE of the active crater), and Comunidad Bernardo Nanco, home to about 80 families, the majority of which depend for their livelihoods on animal raising. Losses are estimated at about $2,000,000 (US). Local authorities and the Ministries of Agriculture and Health are taking emergency measures. Forest fires have burned valuable native trees, including coigüe (Nothfogus dombeyi) and araucaria (Araucaria araucana).
Information Contacts: O. González-Ferrán, Univ de Chile; G. Fuentealba and P. Riffo, Univ de la Frontera; H. Moreno, Univ de Chile.
Strong fluorine emission; one person and many animals killed
The eruption was continuing as of late June. Explosive activity remained relatively weak (VEI 1) through much of May, with occasional more violent pulses (VEI 2) as on 1-3 and 16-25 May. Hugo Moreno flew over the area on 30 May. Strong WNW winds carried the plume directly over Lonquimay village (~20 km ESE of Navidad Crater; figure 12). The lava flow continued to advance very slowly at the front in the Lolco River valley (~9.5 km from the crater) and more vigorously at the Laguna Verde front (~4 km from the crater). Lava volume was estimated at 160 x 106 m3.
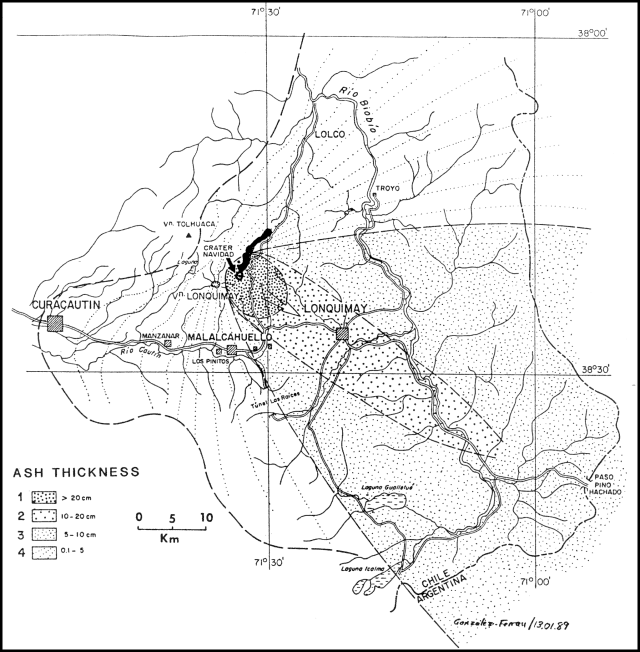 |
Figure 12. Approximate ashfall thicknesses in the Lonquimay area, as of mid-May 1989, courtesy of O. González-Ferrán. The lava flow is shown in black. |
As of mid-June, hundreds of cattle and horses had died of osteofluorosis caused by 300-400 ppm fluorine on grass in an 80,000 hectare (800 km2) area. Some dogs have also recently died after suffering from nervous, renal, digestive, and breathing problems. Concentration of very fine ash has at times been at levels 10 times those considered safe for breathing. Mid-June medical checks of 260 people revealed neurological damage with associated reflex loss in 45 adults and children.
A report (quoted in the 24 June El Mercurio) from Maximino Beltrán, Regional Secretary of Health, to the national Subsecretary of Health, detailed numerous neurological and blood chemistry abnormalities discovered in varying proportions of area residents. An autopsy on a 64-year-old woodcutter, exposed to ashfall for more than 8 hours daily, revealed evidence of acute hemorrhagic colitis and massive bilateral lung hemorrhaging, plus central nervous system lesions. Similar lesions (plus lung, liver, and heart problems) were seen in seven dogs (one sick and six outwardly healthy) studied in the eruption area. The report recommended prompt evacuation of the most affected people, the 800 inhabitants of the Bernardo Nanco area, and the evacuation or relocation of ~3,800 persons judged moderately affected, in the town of Lonquimay. Evacuations had apparently begun by early July.
Information Contacts: H. Moreno, Univ de Chile; O. González-Ferrán, Univ de Chile; Pedro Riffo, Univ de la Frontera; El Mercurio, Santiago.
Strombolian activity and lava effusion; gas chemistry
Weak Strombolian activity continued in July, and the rate of ashfall increased in the Lonquimay valley. As the eruption persisted and concerns remained about health effects of the volcanic gases, particularly fluorine, residents continued to leave the area. Around 8 July, a small gravitational collapse occurred at the tephra cone in the NE part of Navidad Crater. Peter Baker has analyzed 4 February lava and 28 December ash for fluorine, yielding values of 1,638 and 3,401 ppm, respectively. Oscar González-Ferrán notes that no other high-fluorine eruption has been reported from a volcano in the Andes.
A team of geologists (Marino Martini, Luciano Gianinni, Philip Kyle, Werner Giggenbach, Jon Bjornvinsson, Oscar González-Ferrán, Hugo Moreno, José Naranjo, and Rodolfo Figueroa) carried out fieldwork at Lonquimay 7-17 July, using several techniques to measure gases. Transportation was provided by the Chilean Air Force. The following is from J. Naranjo and W. Giggenbach.
Eruptive activity, 9 July 1989. Navidad Cone continued to produce small ash emissions and lava. Since early April, its eruptive activity has clearly decreased to a VEI of 1 or less. On 9 July, ash clouds were rising to 500-700 m above the crater, and after unusually strong explosions to 1,000 m. A heavy snowfall on 30 June was covered by an ash deposit that indicated a main plume direction to the SSE, between the towns of Malalcahuello and Lonquimay. Average ash accumulation rates at El Mirador, 1.5 km SSE of Navidad, were about 2.2 mm/day in early July, considerably lower than the 6 mm/day estimated for the first 3 months of the eruption. The rate of lava effusion, estimated 400 m from the source, was about 50,000 m3/hour, similar to the 60,000 m3/hour reported for the eruption's first 100 days (Moreno and Gardeweg, 1989). The lava was traveling NE down the Lolco valley, while advance of the N lobe (toward Laguna Verde) appeared to have stopped.
"Navidad's black scoria cone has grown to 300 m high, with a basal diameter of ~800 m. On 9 July at about 1100, the crater, breached to the N, contained a small lava lake halfway up the southern crater wall. Strombolian eruptions, emanating from there every few minutes, splashed lava over the inner crater walls. Bombs occasionally reached the outer slopes. A light gray steam and ash column was emitted from a vent next to the lava lake. At about 1200, another vent opened abruptly some 80 m below the active lava pool, extruding an initially dome-shaped batch of new lava accompanied by spectacular lava fountaining for about 5 minutes. The new batch of lava quickly spread downhill to join the existing lava tongue. This process appeared to have drained the lava conduit, as Strombolian eruptions from the now-empty lava lake had ceased, producing instead an almost constant stream of ash-charged gas. Strombolian explosions resumed at around 1330, the conduit having obviously refilled. Direct observation ended at 1430.
Gas chemistry. "Following reports of extensive livestock losses (cattle, sheep, and poultry) and of detrimental health effects or even deaths of inhabitants of areas affected by the volcanic plume, an effort was made to measure the possibly harmful components of gases emitted by the volcano. However, the activity made it impossible to directly approach the degassing vents and recent snowfall prevented access to the advancing, actively degassing lava fronts. The only available samples were ashes deposited since the last snowfall on 30 June. Nine samples were collected on 9 July, from the immediate vicinity of the cone (1, 2), the Mirador area (3-6), the Refugio (7, 8), and about 10 km from the vent (9). The samples are fresh, well-sorted, vesiculated scoriaceous fragments, with grain sizes decreasing from 0.3-3 mm for sample 1 to 0.1-0.3 mm for sample 9. Samples were leached with distilled water and analyzed for Li, K, Mg, Ca, Al, Si, NO3, SO4, F, Cl, Br, and trace constituents. Figure 13 compares relative SO4, Cl, and F contents in the leachates with those from other volcanic ashes.
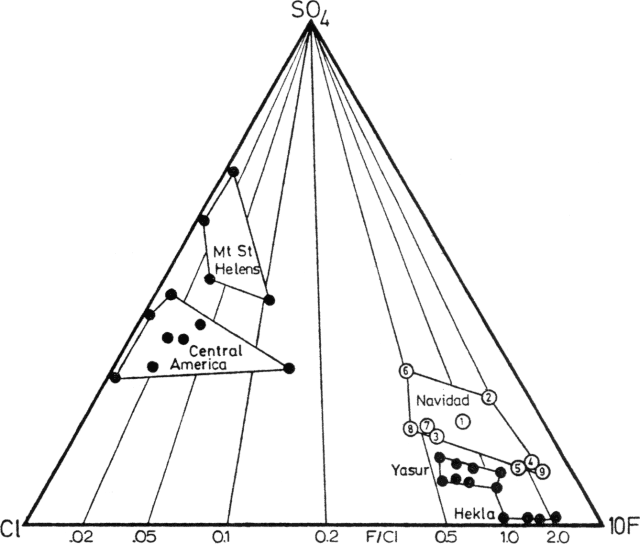 |
Figure 13. Relative SO4, Cl, and F contents (by weight) leached from volcanic ash near Navidad Cone (open circles; see text for numbered sample locations), compared to data from Mt. St. Helens (Nehring and Johnston, 1981); Central America (Santiaguito, Pacaya, San Miguel, Cerro Negro, and Arenal; Taylor and Stoiber, 1973); Hekla (Oskarsson, 1980); and Yasur (Giggenbach in 13:12). Courtesy of W. Giggenbach. |
"Although absolute amounts of salts leached from the ash samples may vary by several orders of magnitude, relative contents are remarkably similar and fall into distinct groups. The quite narrow scatter for a given area suggests that the leachate compositions reflect actual variations in compositions of gases released from a volcanic system rather than secondary processes. The Navidad samples fall within the group represented by Hekla and Yasur, having F/Cl atomic ratios up to 100 times those of the low fluoride group (Mt. St. Helens, Central America). The detrimental effect of high F contents in volcanic ash on grazing animals is well documented for Hekla (Thorarinsson and Sigvaldason, 1972). There, leachable F reached 2,000 mg/kg ash, compared to up to 100 mg/kg at Lonquimay.
"The samples were deposited during a period of dry weather and after the eruption had subsided considerably. During the early, more active period, and under more humid conditions, leachable F contents of the Navidad ash may have been considerably higher. At the state of activity and atmospheric conditions encountered at the beginning of July, however, it is unlikely that the Navidad gases cause any harm to people or animals. It appears highly advisable, though, to monitor F contents in drinking water and animal feed, especially during the thaw of F-charged snow in spring."
SO2 data. Philip Kyle made a series of COSPEC V measurements on 13 July between 1339 and 1513. SO2 flux ranged from 83 to 302 t/d, with an average of 169 ± 48 t/d (161 data points). An increase in the emission rate was evident beginning at 1353, continuing through the final measurements at 1513. A stronger increase between 1412 and 1427 was superimposed on the general trend. Video tapes of the activity during this period show no visible changes that could be correlated with the increased SO2 emission.
The following is a report from Marino Martini. "The chemical composition of water collected in the Lonquimay area does not signal important contamination from the effects of ash or acid rain (table 7). The fluorine content, in particular, does not seem to constitute a reason for alarm, and water on the slope that supplies the city does not have negative chemical characteristics. Concentrations of acid species can also be observed in snow samples (table 7), but without important effects on potable water.
Table 7. Partial chemical compositions (in ppm) of water and snow near Lonquimay. Courtesy of M. Martini.
| Location | Source | HCO3 | Cl | SO4 | NO3 | F | NH4 |
| Malalcahuello | Water | 46.3 | 0.89 | 3.4 | 1.9 | 0.05 | 0.31 |
| Lonquimay (reserve) | Water | 23.2 | 11.4 | 6.1 | 1.2 | 0.31 | 0.27 |
| Rio Naranjo | Water | 23.2 | 19.2 | 3.0 | 3.5 | 0.31 | 0.45 |
| Lonquimay (vert.) | Water | 62.2 | 1.60 | 17.9 | 1.4 | 0.04 | 0.68 |
| Rocapacheco (well) | Water | 45.7 | 11.4 | 11.1 | 23.4 | 0.04 | 1.00 |
| Laguna S. Pedro | Water | -- | 3.5 | 0.4 | -- | 0.45 | 0.18 |
| Hill 9 (toward Lonquimay) | Snow | -- | 2.4 | 0.20 | 0.03 | 0.22 | -- |
| Hill 9 (toward the volcano) | Snow | -- | 3.4 | 0.93 | 0.15 | 0.38 | -- |
| Hill 9 (toward the volcano) | Snow | -- | 4.2 | 2.23 | 0.36 | 0.47 | -- |
| 2 km from volcano (helicopter) | Snow | -- | 8.1 | 1.20 | 0.03 | 1.27 | -- |
"The Strombolian activity did not permit a direct approach to crater fumaroles, so only indirect observations were possible. Nevertheless, given previous experience, the information that could be obtained has substantial validity. The natural gas condensates, collected near the lava flow that emerges from the active crater, are impoverished in the most volatile constituents (CO2, SO2), but it is possible to gather sufficient general information. A comparison with natural condensates from Vulcano (Italy) indicates that in spite of the different type of volcano and the absence of a lava flow, we can ascertain relations of the same order between Cl, F, and S (the higher concentrations of B and Br at Vulcano are related to the influence of the marine atmosphere). If we consider the F/SO2 ratio of the gases emitted by fumaroles at Vulcano with reference to the value measured for the natural condensate, we can then estimate an approximate F/SO2 of 0.012 for the Lonquimay gases (table 8)."
Table 8. Natural condensates of fumarolic gases (in ppm) at Lonquimay and Vulcano. Courtesy of M. Martini.
| Volcano | Cl | F | S | B | Br | F/S | F/SO2 (estimated) |
| Lonquimay | 258,000 | 1030 | 110 | 88 | 43 | 9.3 | 0.012 |
| Vulcano | 100,560 | 620 | 50 | 345 | 260 | 12.4 | 0.0151 |
References. Moreno, H., and Gardeweg, M., 1989, La erupción reciente en el Complejo Volcánico Lonquimay (Diciembre 1988-), Andes del Sur: Revista Geológica de Chile, v. 16, p. 93-117.
Nehring, N.L., and Johnston, D.A., 1981, Use of ash leachates to monitor gas emissions, in Lipman, P.W. and Mullineaux, D.R. (eds.), The 1980 eruptions of Mt. St. Helens, Washington: USGS Professional Paper 1250, p. 251-256.
Oskarsson, N., 1980, The interaction between volcanic gases and tephra: fluorine adhering to tephra of the 1970 Hekla eruption: JVGR, v. 8, p. 251-266.
Taylor, P.S., and Stoiber, R.E., 1973, Soluble material on ash from active Central American volcanoes: GSA Bulletin, v. 84, p. 1031-1042.
Thorarinsson, S., and Sigvaldason, G.E., 1972, The Hekla eruption of 1970: BV, v. 36, p. 269-288.
Information Contacts: O. González-Ferrán, Univ de Chile; J. Naranjo, SERNAGEOMIN, Santiago; W. Giggenbach, Chemistry Division, DSIR, New Zealand; M. Martini, Univ of Firenze, Italy; P. Kyle, New Mexico Institute of Mining and Technology, Socorro; P. Baker, Univ of Nottingham, UK.
Moderate explosive activity and lava production continue
The eruption was continuing from Navidad Cone on 10 August. Some crumbling of the cone had recently occurred. At the cone's E base were 2-3 active vents, with the central vent continuously active. The eruption column varied in height from 1,500 to 1,800 m above the crater, feeding a lead-colored plume that was carried E over the Lonquimay district by the wind. The lava flow's longer lobe, which extends ~10 km NE down the Lolco River valley, was continuing to advance, but the shorter Laguna Verde lobe that extends N from the cone had stopped moving.
Information Contacts: G. Fuentealba and P. Riffo, Univ de la Frontera.
Continued tephra emission and lava flow; fluorine data
A public statement issued by geologists on 4 August noted that the plume then being emitted was unlikely to have any direct noxious effects on people or animals. However, they recommended that livestock not be fed forage cut during the more vigorous activity of January-March. Continued sampling of ash, water, and pasture vegetation were also recommended, particularly stream and well water during melting of the snow cover with its load of ash and fluorine.
Inward slumping of part of the wall of Navidad Crater occurred on 10 August [but see 14:11]. There was no immediate change in the relatively low rate of ash emission, but an increase occurred several days later, with winds blowing the plume SE toward Lonquimay village. Ash emission again increased substantially on 10 September, feeding an ash-rich column >3,000 m high. Because of the stronger activity, authorities halted the return of >1,000 students that had begun in July; only 100 had come back to the area.
During a 17 September overflight, Sergio Barrientos and Hugo Moreno (Univ de Chile) and Pedro Riffo, Gustavo Fuentealba, and Mario Villouta (Univ de la Frontera) observed a 1,000-1,200-m-high eruption column feeding a thin but continuous plume that extended >200 km N. Two small vents were active on Navidad Crater. The upper vent emitted a steam jet, volcanic gases, and fine ash, while lava poured from the lower vent, accompanied by spattering up to 50 m high. The lava flow in the Lolco River valley was still advancing; its front was ~10.5 km from the vent and its maximum width was 1.2 km. Damming of streams by the lava flow had formed five small new lakes, the largest in the Holandesa valley, a tributary that enters the Río Lolco ~9.5 km from Navidad Crater. About 200 x 106 m3 of lava have been erupted since activity began and the effusion rate has been around 300,000 m3/day during the last 5 months.
On 19 September at 0025, a M 4.3 earthquake affected the Malalcahuello area, 12 km S of Navidad Crater, (at MM VI-VII) and numerous smaller events (up to MM IV) were felt in the following days. The seismicity broke 92 windows at the Malalcahuello school and caused other structural damage there and in Manzanar, ~10 km to the W. After the main shock, the eruptive activity increased and the ash column rose to 3,500 m height, but the increased eruptive activity lasted for only 3 days, ending shortly after a felt shock at 2115 on 22 September. Three seismographs were installed on 23 September (at Guamachuco, roughly 7 km SW of Navidad Crater; Malalcahuello; and the Cautín River, a few km SE of Navidad) on the first of 4 days of field work by the geologists from the Univ de Chile and the Univ de la Frontera. Between 23 and 26 September, only three small earthquakes were registered. S. Barrientos interpreted the seismic activity as a "roof collapse" in the magma chamber.
Ash thicknesses at six sites previously sampled on 3 February had increased 3- to 4-fold when measured again on 25 September (table 9). Most ash continued to fall roughly to the SE in the Lonquimay valley, but winds occasionally changed, sending the plume to the S, W, or N for a few hours. Fluorine concentration in grass had also increased from 16 July values at the same sites (table 10). Geologists noted that although the plume was weaker in September than in December-March, it was also at a lower altitude that may locally increase fluorine deposition. The snow cap that covered the grass during May-July could have first isolated the grass from fluorine deposition, then concentrated flourine as the snow melted. Previous fluorine analyses by Villa show considerable variations between fluorine contents of different types of vegetation in the same area (table 11). Carlos Ducom (a Lonquimay veterinarian) reported that 4,158 animals have died because of ash and fluorine: 2,040 goats, 1,479 sheep, 371 cattle, and 268 horses.
Table 9. Comparisons of ash thicknesses (in millimeters) at six sites on 3 February and 25 September 1989. Courtesy of H. Moreno.
| Location | 3 Feb 1989 | 25 Sep 1989 |
| Cautin River | 20 mm | 58 mm |
| Cautin River (bridge) | 8 mm | 33 mm |
| Lonquimay ski hut | 15 mm | 43 mm |
| Los Condores | 10 mm | 30 mm |
| La Plancha (6 km SE) | 4 mm | 25 mm |
| La Paloma (14 km SSE) | 3.5 mm | 12 mm |
Table 10. Fluorine concentrations (in ppm) found in grass at several locations, January-September 1989, analyzed by Alberto Villa, INTA, Univ de Chile. Courtesy of H. Moreno.
| Location | Jan/Mar | Jul | Sep |
| Rucamanque (25 km ESE) | 105 | 31 | 107 |
| Bernardo Nanco | 205 | 30 | 290 |
| Laguna Jara (25 km ESE) | -- | 63 | 143 |
| Lonquimay (20 km ESE) | -- | 47 | 179 |
| Sierra Nevada | -- | 23 | 65 |
Table 11. Fluorine concentrations of vegetation (weight/dry weight) from duplicate analyses by Alberto Villa, with coefficients of variation of 3-5%. The Pichipehuenco samples are from different farms. Ranquil is 25 km NE, Mitranquen Bajo is 35 km ESE, Caracoles is 25 km E, and Pichipehuenco is 40 km SE. Courtesy of O. González-Ferrán.
| Location | Month | Vegetation | Fluorine (ppm) |
| Ranquil | Feb 1989 | Hay | 65 |
| Ranquil | May 1989 | Grass | 52 |
| Mitranquen Bajo | Feb 1989 | Hay | 416 |
| Mitranquen Bajo | May 1989 | Grass | 228 |
| Caracoles | Feb 1989 | Hay | 340 |
| Caracoles | Feb 1989 | Meadow | 162 |
| Caracoles | Feb 1989 | Bamboo | 141 |
| Caracoles | Feb 1989 | Broom sedge | 37 |
| Pichipehuenco | Feb 1989 | Apples | 2 |
| Pichipehuenco | May 1989 | Grass | 121 |
Information Contacts: H. Moreno and S. Barrientos, Univ de Chile; P. Riffo, Univ de la Frontera; O. González-Ferrán, Univ de Chile.
Brief tephra emission increase; cone morphology changes
The following, from J. Naranjo, is based on 2 November observations.
"Since September, Navidad cone's activity has dramatically decreased. On 2 November between 1300 and 1600, a white eruptive column reached 200 m above the crater. A light-gray ash and volcanic gas ejection appeared after weak explosions deep in the uppermost vent.
"The decreasing activity has caused a progressive and conspicuous transformation of the cone structure. The N opening of the formerly horseshoe-shaped cinder cone has been closed by the construction of a 200-m-high northern wall (figure 14). This wall has been built by the closure of the inner W and E 'terraces' nested in the original cone, through bomb and spatter fallback into the inner crater walls. The decreasing explosivity has inhibited the ballistic projection of bombs outside the crater, but has allowed the formation of the nested structure. On 9 July, W. Giggenbach and J.A. Naranjo observed what probably were the initial stages of the present structure; a small upper lava lake and another vent that abruptly opened 80 m below, from which a lava flow was extruded, draining the lake conduit. Thus, a constructive process is invoked, rather than a slumping or collapse of part of any Navidad cone wall for the present cone structure.
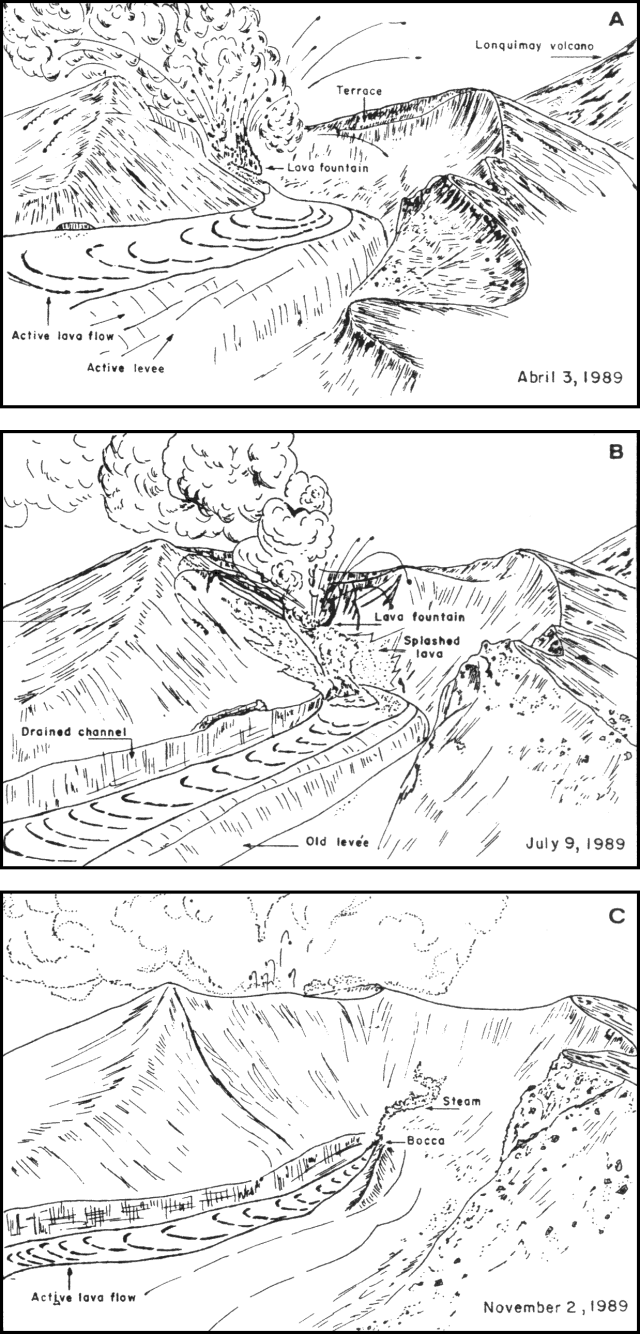 |
Figure 14. Lonquimay's Navidad scoria cone viewed from ~500 m to the N. 3 April 1989 (A): strong explosions and lava fountaining developed in the source vent, launching spatter and ballistically projected bombs, some of which fell outside the crater's N breach. 9 July 1989 (B): Strombolian eruptions splashed lava over the inner crater walls, where most bombs fell. Lava emerged from a new vent that opened 80 m below the lava fountain. 2 November 1989 (C): a 200-m wall, built since August, closed the N breach. Lava was extruded from a vent near the base, while explosions projected bombs that rose <200 m above the crater and fell within it. Courtesy of J. Naranjo. |
"Observation of the ~5-m-diameter vent from <10 m distance allowed the effusion rate to be estimated at between 400 and 1,200 m3/hour, illustrating the great decrease in the eruptive cycle, also shown by the successive drainage of the former deep lava channels. A 5-m-high orange-yellowish halo was deposited above the vent, due to chlorine and sulfur gases."
Hugo Moreno reported that on 27 November at 0900, the eruption increased notably, ejecting a cauliflower-shaped dark gray-brown ash column to 4-4.5 km asl (2-2.5 km above the crater). Vigorous activity continued the next day until at least 2000, with a well-defined brownish plume extending SE. Tephra were fine- to coarse-grained angular lithic ash, suggesting more Vulcanian-type activity.
Information Contacts: J. Naranjo, SERNAGEOMIN, Santiago; H. Moreno, Univ de Chile.
Continued ash emission and lava production; strong SO2
Ash emission and lava production, generally relatively weak, continued at Lonquimay. Stronger activity occurred on 27 and 28 November, when a dense cauliflower-shaped ash column rose 2,000-2,500 m above the vent and was carried SE (Lonquimay district). The press reported renewed stronger activity about 24 December, on the eve of the eruption's first anniversary, when gas and tephra were ejected to ~2,000 m height, and debris fell ~500 m away. Strong felt earthquakes and underground noise were associated with the activity.
For the first time since the eruption began almost 11 months earlier, geologists were able to reach the summit of Navidad cone during several days of fieldwork that began 19 November. Direct measurements indicated that the S, W, and E flanks were 150, 100, and 190 m high respectively. The inner walls of the main cone showed annular fractures denoting small (<5 m) partial collapses of the nested airfall deposits. Fumarolic activity occurred through the fractures; a temperature of 264°C was measured on the inner W wall. The air was saturated with acid gases 15 m below the main crater rim. Nested within the formerly horseshoe-shaped main crater, 400-450 m in diameter, was a funnel-shaped crater 50 m across. The more intense explosions (including bomb ejection) and steam jets emerged from vents in the wall and deeper parts of this crater. Tephra in the 500-m-high column consisted primarily of bombs and ash. Lapilli were very scarce, and most tephra were dense, fine, angular lithics, indicating Vulcanian-type behavior. Winds carried the plume SE.
William Rose reports that "COSPEC measurements 19 and 21 November under the plume at Portezuelo, 1.3 km SE of Navidad cone, revealed highly variable SO2 fluxes ranging from 300 to > 14,000 t/d. These are much higher than the 80-300 t/d measured by Kyle on 13 July. The November SO2 emission rates are in the lower part of the range of other measurements at actively erupting volcanoes. When compared with estimates of the lava effusion rate, the November SO2 fluxes suggest that Lonquimay lavas contain a high sulfur content and/or intrusive (unerupted) magma may be contributing sulfur to the Navidad plume."
Lava continued to emerge from a 3-m-wide vent at the NE foot of the cone. The lava surface had a black aa-like crust and moved at ~50-55 m/hour. On 21 November, the level of the top of the flow dropped substantially between observations at the vent at 1200 and 1830, leaving former hot levees perched as much as 3 m above the flow surface, although flow velocity seemed unchanged. These fluctuations precluded an accurate effusion rate estimate, but it probably exceeded 15 x 103 m3/day. Lava temperature measured by thermocouple 500 m from the vent was 934°C. The flow front was ~10.7 km from Navidad cone along the Lolco river (figure 15). Front thickness varied between 45 and 50 m. Since 17 September, the lava had covered an additional area of ~0.16 km2, representing lava production of ~7.2 x 10⁶ m3 in 60 days, for a mean of 120 x 103 m3/day.
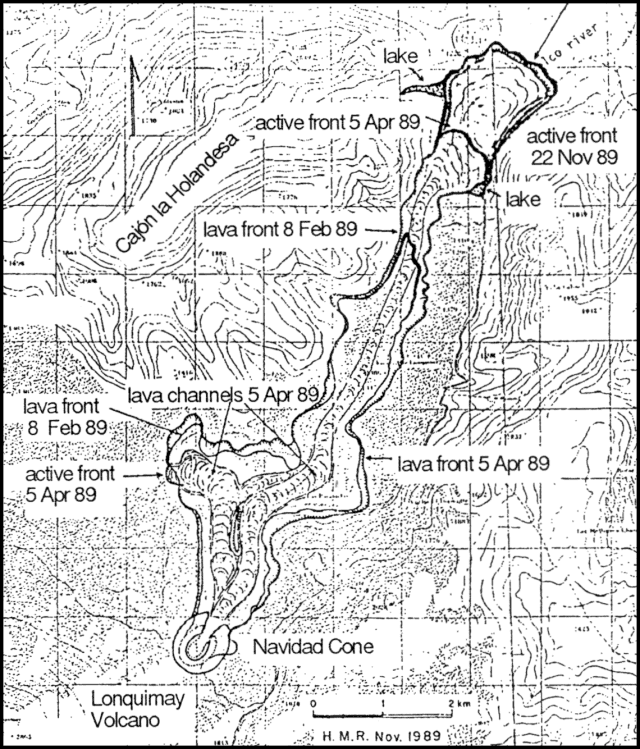 |
Figure 15. Map showing the lava flow front and two lava-impounded lakes as of 22 November. Courtesy of H. Moreno. |
Two small lakes were impounded behind the lava flow, near the former channel of the Lolco river and in the La Holandesa valley, but the other three lakes observed on 17 September (14:9) had disappeared. Lolco river water emerged from under the flow front at 70°C, with a pH of 6.5.
In early August, a small flow of blocky lava had emerged from a vent midway down the cone's NE flank, aligned with the NE end of the fissure that has controlled the eruption. The flow, cold by November, was ~50 m long, 20 m wide, and 6 m thick.
Information Contacts: J. Naranjo, SERNAGEOMIN, Santiago; H. Moreno, Univ de Chile; W. Rose and R. Andres, Michigan Technological Univ; Santiago Domestic Service, Chile.
Lava emission slows from base of Navidad Cone; slumping follows partial collapse of lava drainage channel
During observations on 10 January from 1200 to 1530, lava emission continued from the vent at the NE foot of Navidad Cone. The black aa lava had a surface velocity of 70 m/hour as it moved through a pre-existing channel, which widened progressively from 7 to 12 m over a distance of 50 m from the source. The vent was triangle-shaped, 7 m wide and 4-5 m high, elongating within to a glowing tunnel that had not been exposed during 20 November fieldwork. Activity in the main crater was limited to fumarolic emission that varied gradually from white-yellowish to blue. A vapor cloud was distinctly visible 300-500 m above the cone.
Geologists climbed to the cone's summit on 20 January between 1145 and 1630. Blue fumarolic emissions were continuous from the central crater, nested within the eastern part of the formerly horseshoe-shaped main crater. Annular fractures surrounding the central crater had been emitting vapor on 20 November, but vapor emission had ceased by 20 January after a period of relatively dry weather. Collapse had occurred along some of the fractures, widening the funnel-shaped crater to 60-70 m. A hole 3-4 m in diameter, formerly the main steam jet vent, was clearly visible in the N inner wall, without gas emission.
Between 10 and 20 January, the rate of lava production had clearly decreased, and the 14-m-high wall of the drainage channel had partially collapsed. This process triggered discontinuous slumping of flank material directly above the vent, producing dense dust clouds. The slumped debris was transported on the lava surface, aligned in arched transverse ridges representing different slumping episodes. By the end of field observations at 1630 on 20 January, these materials had been carried as much as 500 m from the vent. An overflight the same day at about 1730 showed that advance had ceased along the entire flow front, including the lobe in the Lolco River valley, which remained 10.7 km from the vent as on 20 November.
Major and trace element analyses of lava and bombs sampled in July and November show no significant variation, being very similar to samples from early in the eruption (Moreno and Gardeweg, 1989).
Information Contacts: J. Naranjo, SERNAGEOMIN, Santiago; H. Moreno, Univ de Chile.
Eruption ends after 13 months; continued fumarolic activity and small-scale collapse
The following is a report from José A. Naranjo and Hugo Moreno R. Most field observations were made in collaboration with R.S.J. Sparks and Mark Stasiuk, Bristol Univ, and Clive Oppenheimer, Open Univ.
"Field evidence suggests that the eruption from Navidad Cone ended between 22 and 25 January 1990, after 13 months of activity. Explosions with pyroclastic ejections stopped between 29 December and 10 January. José Córdoba, a teacher from Malalcahuello, observed and photographed one of the last explosions, on 27 December at 1930-2000. Strong explosions ejected bombs, and white clouds consisting mainly of water vapor rose as much as 600 m above the crater. He also observed two small landslides that originated from the cone's flank (above the vent), followed by white steam clouds that rose along the scar left on the N flank (see below). These collapses may represent the early stages of the slumping observed on 20 January.
"Chlorine gases and minor water vapor fumaroles remained along concentric fractures within the main crater 3-17 March. Compared with previous observations on 21 November and 20 January, the innermost annular fractures exhibited clear evidence of collapse, leaving scarps 1.5-2 m high (figure 16). Fumes from the outermost fractures near the crater rim yielded temperatures of 86°C.
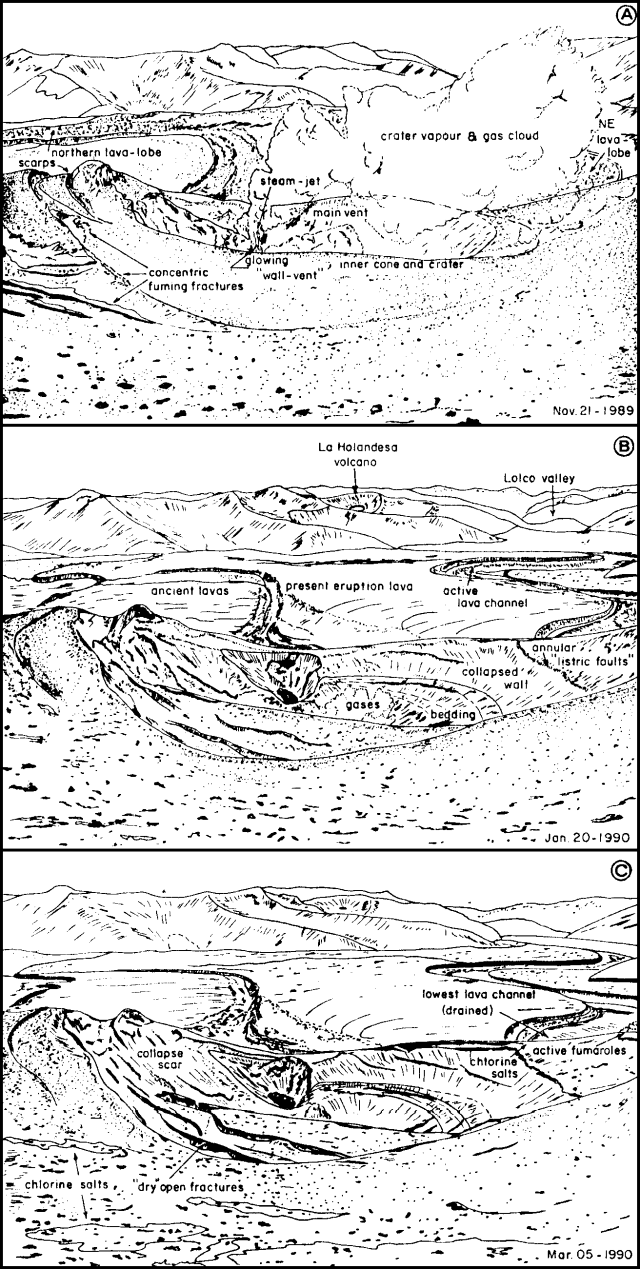 |
Figure 16. View N across the crater of Navidad scoria cone, Lonquimay volcano, from the highest (S) part of the rim. 21 November 1989 (top): Concentric fractures had formed on the W side of the innermost nested crater; intense water vapor fumaroles aligned with them, and a strong steam jet was emitted from a glowing vent on the inner wall. 20 January 1990 (middle): Vapor emission had ceased and collapse had occurred along the eastern inner wall, the southern fractures, and around the N wall-vent. A funnel-shaped crater about 120 m in diameter had clearly widened by collapse since November. 5 March 1990 (bottom): Only dry gases were emitted along the annular fractures, while no fumes were visible at the main crater vents. Fractures had widened on the S part of the cone, and collapse scars appeared on the E part. Sketched from photographs by J.A. Naranjo. |
"By March, the source vent was completely covered by talus from the unstable flank material above it. Discontinuous slumping of this debris left a funnel-shaped scar about 90 m high and 30 m deep, with walls that project upward through the crater's inner concentric fractures. The channel was enlarged by successive collapses that were up to 30 m deep and 25 m wide near the vent.
"The lava surface remained almost completely covered by a 1-3-m-thick mantle of debris transported on it. Former arched transverse debris ridges were disturbed and a gash of fresher lava was formed along the debris mantle's front axis. The top parts of most ridges showed higher temperatures (up to 390°C at 30 cm depth) than the almost cool gullies between them. After 20 January, the debris-covered lava advanced 120 m before it stopped flowing. This smooth surface texture conspicuously contrasted with the spiny, jagged surface presented by the blocky/aa lava immediately downstream.
"The fumaroles aligned with the central vent and the flow to the ENE showed decreased activity when compared to April 1989, although their temperatures remained at 190° and 250-300°C, 600 and 300 m from Navidad Cone respectively.
"On 17 March, a 948°C thermocouple measurement was obtained ~7 m below the lava surface, 1.5-2 km downstream from the source vent. The main lobe in the Lolco River valley had not advanced since 20 November 1989, although it showed a front thickness that had increased slightly, from 45-50 m in November to 55-60 m in March."
Information Contacts: J. Naranjo, SERNAGEOMIN, Santiago; H. Moreno, Univ de Chile.
Isopach maps of December 1988-January 1990 eruption
"A final cumulative ashfall isopach map was made after the Navidad cone eruption, which ended by 23-25 January 1990. The 3 February 1989 preliminary map (see figure 6) was based on 67 data points. After the eruption ended, 40 were checked, but only 19 sites were considered valid. All were located in open spaces within the forest, on flat surfaces and with some grass; therefore, wind or water action has been minimized, although some variation could have been caused by minor ash removal from leaves through wind action. Values increased by 3-19 times the 3 February 1989 measurements.
"Ash thicknesses at six sites previously sampled in February had increased 3- to 4-fold when measured again by 25 September 1989. Consequently rejected were all new measurements <3x those of February, and those that were meaningless in the context of the 19 chosen values. Among them, nine had <70% of the February value x 3, and were located in open windy areas (in the Colorado and Lonquimay valleys). The other 12 sites had more than the February value x 3 and were located in the Naranjo River valley and the E slope of the Cordillera Las Raíces (figure 17). Undoubtedly, the main ash removal agent has been the wind. Water action was observed on slopes less than 20°, and big volumes of ash had been carried down the Cautín and Naranjo headwaters, burying trees, bushes, and wire fences."
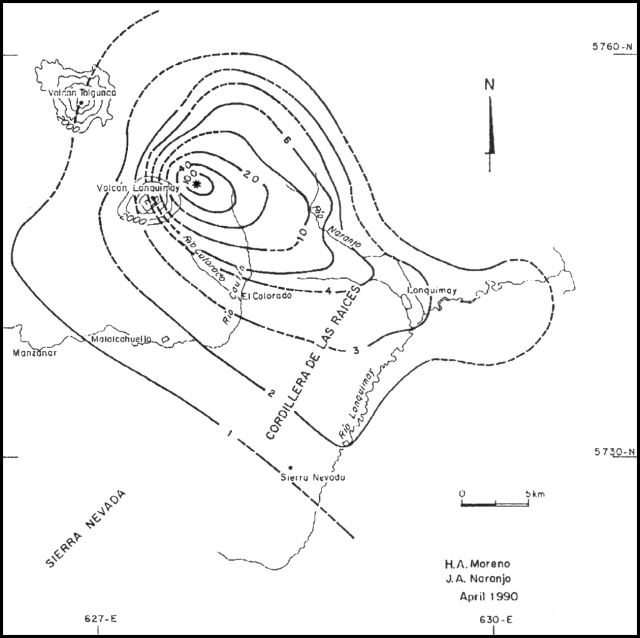 |
Figure 17. Final ash isopach map (in centimeters) after the full 13 months of the Lonquimay eruption. Courtesy of H. Moreno and J. Naranjo. |
Information Contacts: H. Moreno, Univ de Chile; J. Naranjo, SERNAGEOMIN, Santiago.
1988-89 lava flows continue emitting steam
A late-March overflight made after a prolonged dry season enabled observations with relatively low snow levels. The volcano lacked signs of fumarolic or other activity. However, during fieldwork S of La Holandesa crater, the 1988-89 lava flows to the NE of the main cone within the Las Paramelas valley continued to emit steam.
Information Contacts: Jose Antonio Naranjo, Servicio Nacional de Geología e Minería (SERNAGEOMIN), Av. Santa María 0104, Casilla 10465, Santiago, Chile; Hugo Moreno Roa, Observatorío Volcanogía de los Andes del Sur (OVDAS), Manantial 1710-Carmino del Alba, Temuco, Chile; Simon R. Young, British Geological Survey (BGS), Murchison House, West Mains Road, Edinburgh EH9 3LA, United Kingdom.
|
|
||||||||||||||||||||||||||
There is data available for 4 confirmed eruptive periods.
1988 Dec 25 - 1990 Jan 24 ± 1 days Confirmed Eruption (Explosive / Effusive) VEI: 3
| Episode 1 | Eruption (Explosive / Effusive) | NE flank (Navidad Crater) | ||||||||||||||||||||||||||||||||||||||||||||||||||||||||||||||||||||||||||||||
|---|---|---|---|---|---|---|---|---|---|---|---|---|---|---|---|---|---|---|---|---|---|---|---|---|---|---|---|---|---|---|---|---|---|---|---|---|---|---|---|---|---|---|---|---|---|---|---|---|---|---|---|---|---|---|---|---|---|---|---|---|---|---|---|---|---|---|---|---|---|---|---|---|---|---|---|---|---|---|---|
| 1988 Dec 25 - 1990 Jan 24 ± 1 days | Evidence from Observations: Reported | ||||||||||||||||||||||||||||||||||||||||||||||||||||||||||||||||||||||||||||||
|
List of 14 Events for Episode 1 at NE flank (Navidad Crater)
|
|||||||||||||||||||||||||||||||||||||||||||||||||||||||||||||||||||||||||||||||
[ 1940 Feb ] Uncertain Eruption
| Episode 1 | Eruption (Explosive / Effusive) | |||||||||||||||||||
|---|---|---|---|---|---|---|---|---|---|---|---|---|---|---|---|---|---|---|---|
| 1940 Feb - Unknown | Evidence from Unknown | ||||||||||||||||||
|
List of 2 Events for Episode 1
|
|||||||||||||||||||
1933 Jan 4 Confirmed Eruption (Explosive / Effusive) VEI: 2
| Episode 1 | Eruption (Explosive / Effusive) | |||||||||||||||||||||||||||||
|---|---|---|---|---|---|---|---|---|---|---|---|---|---|---|---|---|---|---|---|---|---|---|---|---|---|---|---|---|---|
| 1933 Jan 4 - Unknown | Evidence from Observations: Reported | ||||||||||||||||||||||||||||
|
List of 4 Events for Episode 1
|
|||||||||||||||||||||||||||||
1887 Jun 2 - 1890 Jan Confirmed Eruption (Explosive / Effusive) VEI: 3
| Episode 1 | Eruption (Explosive / Effusive) | NE flank | |||||||||||||||||||||||||||||||||
|---|---|---|---|---|---|---|---|---|---|---|---|---|---|---|---|---|---|---|---|---|---|---|---|---|---|---|---|---|---|---|---|---|---|---|
| 1887 Jun 2 - 1890 Jan | Evidence from Observations: Reported | |||||||||||||||||||||||||||||||||
|
List of 5 Events for Episode 1 at NE flank
|
||||||||||||||||||||||||||||||||||
1853 Feb Confirmed Eruption (Explosive / Effusive) VEI: 3
| Episode 1 | Eruption (Explosive / Effusive) | |||||||||||||||||||||||||||||
|---|---|---|---|---|---|---|---|---|---|---|---|---|---|---|---|---|---|---|---|---|---|---|---|---|---|---|---|---|---|
| 1853 Feb - Unknown | Evidence from Observations: Reported | ||||||||||||||||||||||||||||
|
List of 4 Events for Episode 1
|
|||||||||||||||||||||||||||||
This compilation of synonyms and subsidiary features may not be comprehensive. Features are organized into four major categories: Cones, Craters, Domes, and Thermal Features. Synonyms of features appear indented below the primary name. In some cases additional feature type, elevation, or location details are provided.
Synonyms |
||||
| Lonpuimay | Lanquimay | Ketredeguin | ||||
Cones |
||||
| Feature Name | Feature Type | Elevation | Latitude | Longitude |
| Holandesa, Volcán la | Pyroclastic cone | 1615 m | 38° 18' 51.00" S | 71° 32' 27.00" W |
| Lolco, Volcán | Pyroclastic cone | 1325 m | 38° 17' 24.00" S | 71° 30' 18.00" W |
| Navidad | Pyroclastic cone | 1860 m | 38° 22' 11.00" S | 71° 33' 8.00" W |
| Verde, Volcán Laguna | Cone | 1737 m | 38° 19' 58.00" S | 71° 36' 12.00" W |
Craters |
||||
| Feature Name | Feature Type | Elevation | Latitude | Longitude |
| Canasto | Crater | 1960 m | 38° 20' 3.00" S | 71° 28' 53.00" W |
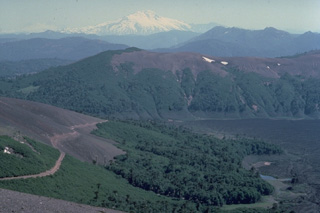 Snow-capped Callaqui volcano rises in the distance north of the foreground slopes of Lonquimay volcano. The dark area at the right in this January 1989 view is a new lava flow from a NE-flank eruption of Lonquimay that began on December 25, 1988. The lava flow split into two lobes, the Laguna Verde lobe (seen here) and the Río Lolco lobe, which eventually traveled 10 km to the NE. Callaqui volcano in the background is another historically active volcano of the central Chilean Andes.
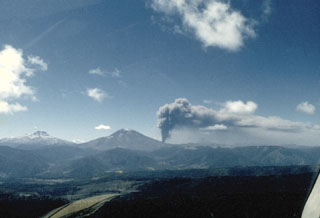 An eruption plume rises above Navidad (Christmas) cone on the NE flank of Lonquimay volcano (left center) on January 15, 1989. The eruption began on Christmas day, 1988, and lasted over a year. A 200-m-high cinder cone was formed and a lava flow that originated from Navidad cone traveled 10 km down the NE flank. Neighboring Tolguaca volcano appears at the left in this view from the WSW.
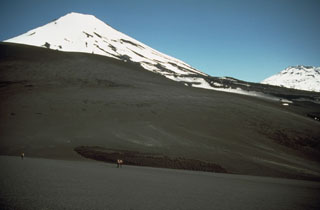 Lonquimay (left) is a small, flat-topped, symmetrical stratovolcano of late-Pleistocene to dominantly Holocene age located immediately SE of the largely Pleistocene Tolguaca volcano (extreme right). The Cordón Fissural Oriental fissure zone extends 10 km NE of Lonquimay and has produced a series of vents and cinder cones that have been the source of voluminous lava flows in historical time. Major lava flows erupted during 1887-90 and 1988-90 traveled up to 10 km from their NE-flank vents.
 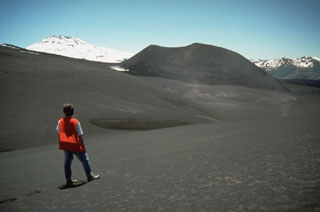 Tolguaca volcano, the snow-capped peak at the left, is a late-Pleistocene to Holocene stratovolcano located immediately NW of Lonquimay volcano. The cinder cone at the right in this view from the SE is the Navidad cone on the NE flank of Lonquimay, which formed during an eruption in 1989. The 2806-m-high Tolguaca is older than its neighbor Lonquimay. It is dissected by glaciers and only fumarolic activity has occurred during historical time. Flank vents are oriented NW-SE, in line with Lonquimay, and SW-NE-trending vents occur on the south flank.
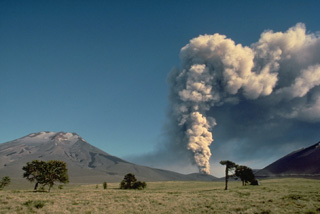 An eruption plume towers above Navidad cinder cone on the NE flank of Lonquimay volcano (left) in January 1989. The eruption began on December 25, 1988 along a NE-trending rift zone about 3.5 km from the summit. On December 27, the eruption plume reached 9-km altitude and lava effusion began, producing a flow that traveled 4.5 km by January 4. Advance of the terminus of the flow slowed after April 1989, but lava effusion and moderate explosive activity continued for more than a year before ending in January 1990.
 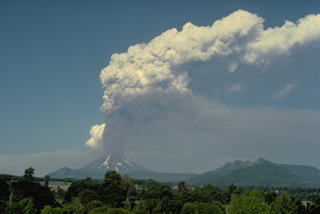 An eruption plume towers above Lonquimay volcano in January 1989. In this view from the SW, the plume appears to originate from the summit crater of Lonquimay, but the eruptive vent actually is located on the NE flank, 3.5 km from the summit. During this eruption, which began on Christmas day, 1988, and lasted until January 1990, a new cinder cone (Navidad) was formed and a lava flow traveled 10 km down the NE flank.
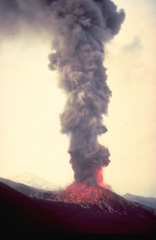 An ash-rich eruption column, incandescent at its base, rises above Navidad cinder cone on the NE flank of Lonquimay volcano in January 1989. Still-glowing volcanic bombs litter the flanks of the cone. Tolguaca volcano appears at the left in this view from the SE. Soon after the start of the eruption on December 25, 1988, lava effusion began, producing a lava flow that by the time the eruption ended in January 1990 had traveled 10 km down the NE flank.
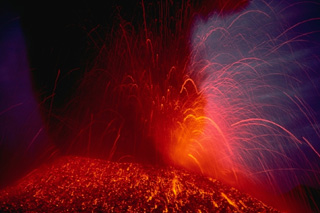 Strombolian eruptions eject incandescent fragments above a cinder cone on the NE flank of Lonquimay volcano in the central Chilean Andes in January 1989. The parabolic arcs of individual volcanic bombs can be seen at the right in this time-exposure photograph. The flanks of the cone are colored by still-cooling ejected blocks. The cinder cone, which began forming on Christmas day 1988, was named Navidad.
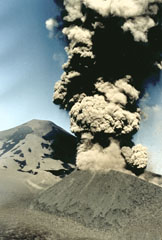 A billowing dark, ash-rich eruption column rises above a cinder cone on the NE flank of Chile's Lonquimay volcano in January 1989. During the course of an eruption that lasted from December 1988 until January 1990, heavy ashfall blanketed the countryside, causing severe disruption to agricultural areas near the volcano. The ash was high in fluorine, unusual for Andean volcanoes. Fluorine poisoning from ash on ingested grass caused the deaths of hundreds of cattle and horses, producing severe economic hardship.
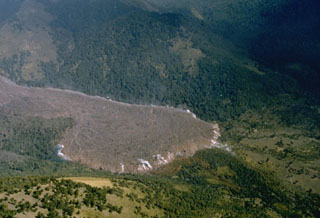 A steaming lava flow, 30-35 m thick and 1-km-wide, originating from Navidad cinder cone on the NE flank of Chile's Lonquimay volcano advances down the Río Lolco valley. By the time of this 25 March 1989 photograph, the flow had traveled about 7 km. Lava effusion began on 27 December 1988, two days after the beginning of an eruption that lasted until January 1990. The velocity of the slow-moving flow front decreased exponentially with distance from the vent. By the end of the eruption the lava flow reached 10 km from the vent and had a volume of 0.23 km3.
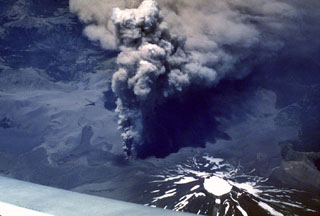 Four days into an eruption of Lonquimay volcano that began on 25 December 1988 an ash plume rises above a vent on the NE flank. Winds distribute the ash to the SE. Heavy ashfall lasted over a year, causing severe economic disruption. This east-looking view shows the ice-filled summit crater of Lonquimay at the bottom right.
 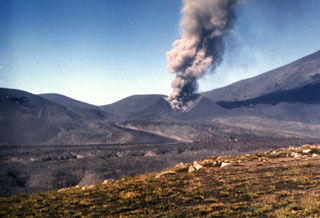 A lava flow in the foreground issues from the breached Navidad cinder cone on February 8, 1989, while an ash plume rises above the crater. The lava flow originated on December 27, 1988, two days after the start of the eruption from a vent on the NE flank of Lonquimay volcano, whose slope is visible at the right. The flow advanced rapidly during the first few days of the eruption, reaching 4 km by Janaury 2. It then slowed, and by the time the eruption ended, in January 1990, the blocky lava flow reached 10 km down the Río Lolco valley.
There are no samples for Lonquimay in the Smithsonian's NMNH Department of Mineral Sciences Rock and Ore collection.
| Copernicus Browser | The Copernicus Browser replaced the Sentinel Hub Playground browser in 2023, to provide access to Earth observation archives from the Copernicus Data Space Ecosystem, the main distribution platform for data from the EU Copernicus missions. |
| MIROVA | Middle InfraRed Observation of Volcanic Activity (MIROVA) is a near real time volcanic hot-spot detection system based on the analysis of MODIS (Moderate Resolution Imaging Spectroradiometer) data. In particular, MIROVA uses the Middle InfraRed Radiation (MIR), measured over target volcanoes, in order to detect, locate and measure the heat radiation sourced from volcanic activity. |
| MODVOLC Thermal Alerts | Using infrared satellite Moderate Resolution Imaging Spectroradiometer (MODIS) data, scientists at the Hawai'i Institute of Geophysics and Planetology, University of Hawai'i, developed an automated system called MODVOLC to map thermal hot-spots in near real time. For each MODIS image, the algorithm automatically scans each 1 km pixel within it to check for high-temperature hot-spots. When one is found the date, time, location, and intensity are recorded. MODIS looks at every square km of the Earth every 48 hours, once during the day and once during the night, and the presence of two MODIS sensors in space allows at least four hot-spot observations every two days. Each day updated global maps are compiled to display the locations of all hot spots detected in the previous 24 hours. There is a drop-down list with volcano names which allow users to 'zoom-in' and examine the distribution of hot-spots at a variety of spatial scales. |
|
WOVOdat
Single Volcano View Temporal Evolution of Unrest Side by Side Volcanoes |
WOVOdat is a database of volcanic unrest; instrumentally and visually recorded changes in seismicity, ground deformation, gas emission, and other parameters from their normal baselines. It is sponsored by the World Organization of Volcano Observatories (WOVO) and presently hosted at the Earth Observatory of Singapore.
GVMID Data on Volcano Monitoring Infrastructure The Global Volcano Monitoring Infrastructure Database GVMID, is aimed at documenting and improving capabilities of volcano monitoring from the ground and space. GVMID should provide a snapshot and baseline view of the techniques and instrumentation that are in place at various volcanoes, which can be use by volcano observatories as reference to setup new monitoring system or improving networks at a specific volcano. These data will allow identification of what monitoring gaps exist, which can be then targeted by remote sensing infrastructure and future instrument deployments. |
| Volcanic Hazard Maps | The IAVCEI Commission on Volcanic Hazards and Risk has a Volcanic Hazard Maps database designed to serve as a resource for hazard mappers (or other interested parties) to explore how common issues in hazard map development have been addressed at different volcanoes, in different countries, for different hazards, and for different intended audiences. In addition to the comprehensive, searchable Volcanic Hazard Maps Database, this website contains information about diversity of volcanic hazard maps, illustrated using examples from the database. This site is for educational purposes related to volcanic hazard maps. Hazard maps found on this website should not be used for emergency purposes. For the most recent, official hazard map for a particular volcano, please seek out the proper institutional authorities on the matter. |
| IRIS seismic stations/networks | Incorporated Research Institutions for Seismology (IRIS) Data Services map showing the location of seismic stations from all available networks (permanent or temporary) within a radius of 0.18° (about 20 km at mid-latitudes) from the given location of Lonquimay. Users can customize a variety of filters and options in the left panel. Note that if there are no stations are known the map will default to show the entire world with a "No data matched request" error notice. |
| UNAVCO GPS/GNSS stations | Geodetic Data Services map from UNAVCO showing the location of GPS/GNSS stations from all available networks (permanent or temporary) within a radius of 20 km from the given location of Lonquimay. Users can customize the data search based on station or network names, location, and time window. Requires Adobe Flash Player. |
| DECADE Data | The DECADE portal, still in the developmental stage, serves as an example of the proposed interoperability between The Smithsonian Institution's Global Volcanism Program, the Mapping Gas Emissions (MaGa) Database, and the EarthChem Geochemical Portal. The Deep Earth Carbon Degassing (DECADE) initiative seeks to use new and established technologies to determine accurate global fluxes of volcanic CO2 to the atmosphere, but installing CO2 monitoring networks on 20 of the world's 150 most actively degassing volcanoes. The group uses related laboratory-based studies (direct gas sampling and analysis, melt inclusions) to provide new data for direct degassing of deep earth carbon to the atmosphere. |
| Large Eruptions of Lonquimay | Information about large Quaternary eruptions (VEI >= 4) is cataloged in the Large Magnitude Explosive Volcanic Eruptions (LaMEVE) database of the Volcano Global Risk Identification and Analysis Project (VOGRIPA). |
| EarthChem | EarthChem develops and maintains databases, software, and services that support the preservation, discovery, access and analysis of geochemical data, and facilitate their integration with the broad array of other available earth science parameters. EarthChem is operated by a joint team of disciplinary scientists, data scientists, data managers and information technology developers who are part of the NSF-funded data facility Integrated Earth Data Applications (IEDA). IEDA is a collaborative effort of EarthChem and the Marine Geoscience Data System (MGDS). |

