
The Vanuatu Meteorology and Geohazards Department (VMGD) reported that seismic data confirmed continuing unrest at Lopevi during September. Low-level thermal anomalies were identified in satellite images during 12-13 and 17 September. Small fumarolic steam plumes were continuously emitted from the summit crater on 22 September based on webcam images. The Alert Level remained at 2 (on a scale of 0-4).
Source: Vanuatu Meteorology and Geohazards Department (VMGD)
Episodes of unrest in January and September 2017; gas-and-steam plumes
Since an eruptive episode in May 2007, Loopevi has been quiet except for a thick gray plume on 24 February 2008 and a short-lived increase in activity in December 2014 (BGVN 32:05, 34:08, 40:05). This report covers activity during January 2015-December 2017. Data were primarily drawn from reports issued by the Vanuatu Geohazards Observatory (VGO) and the Wellington Volcanic Ash Advisory Center (VAAC).
Based on a pilot observation and webcam views, the Wellington VAAC reported that a short-lived steam-and-gas plume beginning at 0500 on 13 January 2017 produced a that rose no higher than 3 km in altitude and drifted SE. That same day VGO reported that the Volcanic Alert Level (VAL) was raised to 3 (on a scale of 0-5); it was lowered to Level 2 on 17 January and then to Level 1 on 20 February.
Steam plumes were again observed on 23 September by the web camera, prompting VGO to raise the VAL to 2, indicating major unrest (danger around the crater rim and specific area, considerable possibility of eruption, chance of flank eruption). Observation flights on 30 September and the first week of October showed that the activity was occurring only in the active craters below the summit crater (figure 24). Photographs and thermal infrared images taken during the flights confirmed that activity consisted of hot volcanic gas and steam. VGO reported that photos and satellite images acquired at the end of November confirmed that gas-and-steam emissions were continuing.
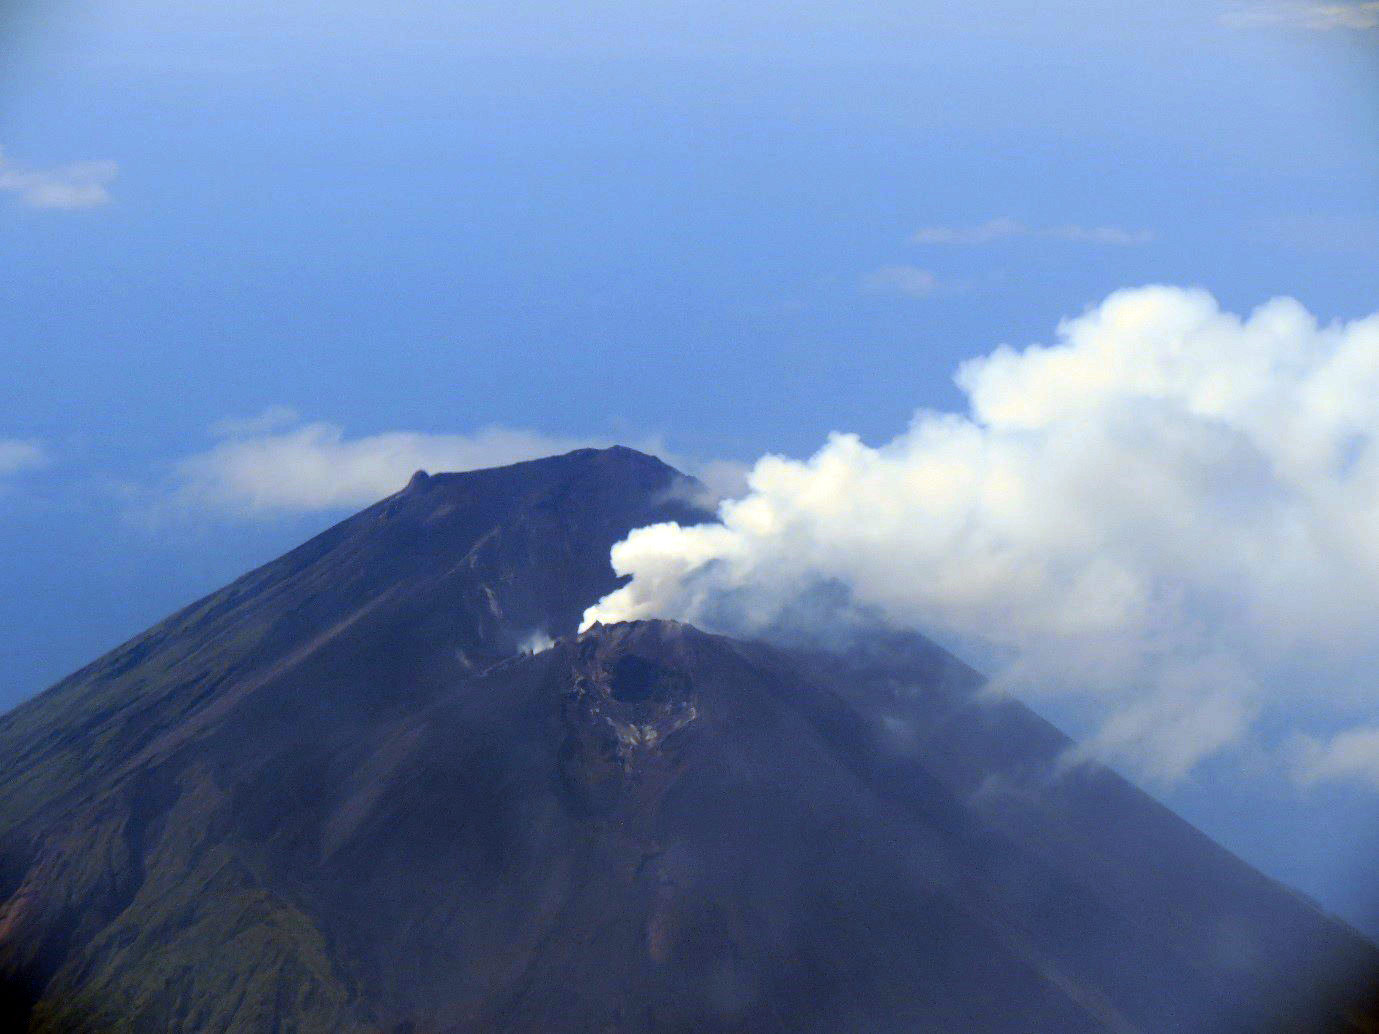 |
Figure 24.Aerial view of the active cone at Lopevi on 3 October 2017. Courtesy of VGO. |
The unrest continued through at least December 2017, and the VAL remained at 2. The Wellington VAAC noted that on 20 December a low-level plume was visible in satellite and webcam images drifting NW at an altitude of 1.5 km.
Information Contacts: Vanuatu Geohazards Observatory (VGO), Department of Geology, Mines and Water Resources of Vanuatu (URL: http://www.geohazards.gov.vu/, http://www.vmgd.gov.vu/vmgd/index.php/geohazards/volcano); Wellington Volcanic Ash Advisory Centre (VAAC), Meteorological Service of New Zealand Ltd (MetService), PO Box 722, Wellington, New Zealand (URL: http://www.metservice.com/vaac/, http://www.ssd.noaa.gov/VAAC/OTH/NZ/messages.html).
2025: March
| April
| May
| June
| August
| September
2017: January
| September
| December
2014: December
2008: February
2007: April
| May
2006: January
| May
| July
2003: June
2001: June
The Vanuatu Meteorology and Geohazards Department (VMGD) reported that seismic data confirmed continuing unrest at Lopevi during September. Low-level thermal anomalies were identified in satellite images during 12-13 and 17 September. Small fumarolic steam plumes were continuously emitted from the summit crater on 22 September based on webcam images. The Alert Level remained at 2 (on a scale of 0-4).
Source: Vanuatu Meteorology and Geohazards Department (VMGD)
The Vanuatu Meteorology and Geohazards Department (VMGD) reported that seismic data confirmed continuing unrest at Lopevi during August. Low-level thermal anomalies identified in satellite images during 3, 6-7, and 15 August. Small fumarolic steam plumes were continuously emitted from the summit crater during 6-7, 9, and 11 August based on a webcam images and observation photos. The Alert Level remained at 2 (on a scale of 0-4).
Source: Vanuatu Meteorology and Geohazards Department (VMGD)
On 27 June the Vanuatu Meteorology and Geohazards Department (VMGD) reported that seismic data confirmed continuing unrest at Lopevi throughout June. Small fumarolic steam plumes were continuously emitted from the summit crater during 6 and 10-11 June based on a webcam images. Low-level thermal anomalies were identified in satellite images on 2 June, indicative of increased surface temperatures, and sulfur dioxide emissions were detected on 10 June. The Alert Level remained at 2 (on a scale of 0-4).
Source: Vanuatu Meteorology and Geohazards Department (VMGD)
On 28 May the Vanuatu Meteorology and Geohazards Department (VMGD) reported that during the month seismic data confirmed continuing unrest at Lopevi. Small fumarolic steam plumes were continuously emitted from the summit crater based on a webcam image from 1 May. Low-level thermal anomalies were identified in satellite images on 1 and 20 May, indicative of increased surface temperatures. The Alert Level remained at 2 (on a scale of 0-4).
Source: Vanuatu Meteorology and Geohazards Department (VMGD)
On 24 April the Vanuatu Meteorology and Geohazards Department (VMGD) reported that during the previous month seismic data confirmed continuing unrest at Lopevi. Small fumarolic steam plumes were continuously emitted at the summit crater based on webcam images from 1, 19, and 20 April. Low-level thermal anomalies were identified in satellite images on 6 and 20 April, indicative of increased surface temperatures. The Alert Level remained at 2 (on a scale of 0-4).
Source: Vanuatu Meteorology and Geohazards Department (VMGD)
On 27 March the Vanuatu Meteorology and Geohazards Department (VMGD) reported that during the previous month small fumarolic steam plumes were continuously emitted at Lopevi’s summit crater based on recent photos and webcam images. Low-level thermal anomalies were identified in satellite images on 19 and 24 March. Seismic data confirmed continuing unrest. The Alert Level remained at 2 (on a scale of 0-4).
Source: Vanuatu Meteorology and Geohazards Department (VMGD)
The Wellington VAAC noted that on 20 December a low-level eruption plume from Lopevi was visible in satellite and webcam images drifting NW at an altitude of 1.5 km (5,000 ft) a.s.l.
Source: Wellington Volcanic Ash Advisory Center (VAAC)
On 7 December Vanuatu Geohazards Observatory noted that unrest continued at Lopevi, and the Alert Level remained at 2 (on a scale of 0-4). Photos and satellite images acquired at the end of November confirmed ongoing activity from the vents in the summit crater characterized by gas-and-steam emissions.
Source: Vanuatu Meteorology and Geohazards Department (VMGD)
Increased activity at Lopevi prompted the Vanuatu Geohazards Observatory to increase the Alert Level to 2 (on a scale of 0-4). The report noted that all visitors should not approach the crater area.
Source: Vanuatu Meteorology and Geohazards Department (VMGD)
Based on a pilot observation and webcam views, the Wellington VAAC reported that an eruption at Lopevi began at 0500 on 13 January, and produced a plume that rose no higher that 3 km (10,000 ft) a.s.l. and drifted SE. That same day the Vanuatu Geohazards Observatory reported that the Alert Level was raised to 3 (on a scale of 0-5), indicating that a minor eruption was in progress.
Sources: Vanuatu Meteorology and Geohazards Department (VMGD); Wellington Volcanic Ash Advisory Center (VAAC)
On 15 December the Vanuatu Geohazards Observatory reported that, based on observations and analyses in early December, activity at Lopevi had increased dramatically over a short time period. The Alert Level was raised to 1 (on a scale of 0-4), and access to the island was prohibited.
Source: Vanuatu Meteorology and Geohazards Department (VMGD)
Based on a pilot report, the Wellington VAAC reported that an ash plume from Lopevi rose to an altitude of below 3 km (10,000 ft) a.s.l. on 24 February. [Correction: The Wellington VAAC described a gray plume, not an ash plume.]
Source: Wellington Volcanic Ash Advisory Center (VAAC)
Based on a pilot report, the Wellington VAAC reported that an ash plume from Lopevi rose to an altitude of 2.1 km (7,000 ft) a.s.l. on 3 May.
Source: Wellington Volcanic Ash Advisory Center (VAAC)
Based on a pilot report, the Wellington VAAC reported that an ash plume from Lopevi covered the vent on 25 April. The altitude of the plume was not reported.
Source: Wellington Volcanic Ash Advisory Center (VAAC)
Based on pilot reports and satellite imagery, the Wellington VAAC reported that ash plumes from Lopevi rose to altitudes of 2.4-4.6 km (8,000-15,000 ft) a.s.l. during 21-24 April. Plumes drifted E on 21 April.
Source: Wellington Volcanic Ash Advisory Center (VAAC)
Based on pilot reports, the Wellington VAAC reported that an eruption plume from Lopevi on 5 July reached an unknown altitude and smoke-and-ash plumes on 8 and 9 July reached altitudes of 3.7 km (12,000 ft) a.s.l. and drifted E and SE, respectively.
Source: Wellington Volcanic Ash Advisory Center (VAAC)
According to Vanuatu's National Disaster Management Office, Lopevi volcano remains at Alert Level 2. An official spokesperson reported no new ashfall during 17-22 May. The last report of an ash plume was on 15 May.
Source: Shanghai Daily
The Wellington VAAC reported that a slow moving plume from Lopevi reached a height of 3 km (10,000 ft) a.s.l. on 10 May. On 11 May, a plume rose to 4.6 km (15,000 ft) a.s.l. and trended SE. During 12-13 May, the plume height lessened to 3 km (10,000 ft) a.s.l. as the eruption vigor reportedly decreased. According to Vanuatu's National Disaster Office, a news article reported that on 15 May an eruption at Lopevi produced heavy ashfall extending to the neighboring islands of Ambrym and Paama.
Source: Wellington Volcanic Ash Advisory Center (VAAC)
Based on information from a pilot report, the Wellington VAAC reported that on 7 May a small ash plume from Lopevi was visible below a height of ~3 km (10,000 ft) a.s.l. and an active lava flow was observed at the volcano.
Source: Wellington Volcanic Ash Advisory Center (VAAC)
Following reports of plumes from Lopevi reaching heights of ~2.7 km (9,000 ft) a.s.l. on 24 and 25 January, the Wellington VAAC reported that plumes of "smoke" rose to ~2.1 km (7,000 ft) a.s.l. on 26 January and drifted S. They also reported that lava flowed down the S flank of the volcano on the 26th.
Source: Wellington Volcanic Ash Advisory Center (VAAC)
Pilots reported a vertical plume rising from Lopevi on 24 January 2006 to an altitude of 2.1-2.4 km (7,000-8,000 feet) a.s.l. The plume extended S and SE, and was reportedly at 2.7 km (9,000 feet) a.s.l. about 24 hours later.
Source: Wellington Volcanic Ash Advisory Center (VAAC)
The eruption that began at Lopevi on 9 June continued through at least 14 June. An airport in Vanuatu reported to the Wellington VAAC that a thick plume rose to ~7.5 km a.s.l. on 11 June. The plume drifted SE and was ~9 km in diameter. They reported that on 13 June a ~9-km-diameter plume rose to ~2.5 km a.s.l. Also, on 14 June an ash cloud was at a height of ~2.5 km a.s.l. and a thin lava flow was visible on the volcano's W flank. A news article stated that the eruption of Lopevi was causing acid rain to fall on island villages in Vanuatu that are close to the volcano. Local disaster management personnel warned residents of the islands of Paama, Epi, and villages in SE Ambryn to secure their rain-based water supplies.
Sources: Wellington Volcanic Ash Advisory Center (VAAC); ABC News - Australian Broadcasting Corporation
Based on information from an airport in Vanuatu, the Wellington VAAC reported that a thick ash cloud emitted from Lopevi was observed on 8 June at 1155 rising higher than 12 km a.s.l. and drifting SE. The plume was not visible on satellite imagery. A report from an aircraft revealed that on 9 June at 1011 there was no indication of an ash cloud near Lopevi. That day at 1430 the airport reported that a ~18.5-km-wide, thick black ash cloud was visible rising to ~2.7 km a.s.l. and drifting SE.
Source: Wellington Volcanic Ash Advisory Center (VAAC)
Based on a pilot report, the Wellington VAAC issued an ash advisory stating that at 0302 on 14 June a small eruption produced an ash cloud that rose up to ~1.8 km a.s.l. The cloud expanded towards the N over the islands of Paama and Ambrym.
Source: Wellington Volcanic Ash Advisory Center (VAAC)
According to the Wellington VAAC an eruption at Lopevi that began on 8 June at 1250 produced an ash cloud that rose at least 6 km a.s.l. and drifted to the WNW. The ash cloud was clearly visible on enhanced satellite imagery for many hours. According to news reports, more than 0.9 m of ash was deposited on the uninhabited island of Lopevi and several inches covered the neighboring island of Paama. As a result, on Paama the ~1,600 resident's water supply was contaminated (open water sources tested around 12 June showed a PH value of 3) and the crops were severely damaged by ash and gas from the eruptions. There were no reports of injuries, but the National Disaster Management Office project officer, Barton Bisiwei, stated that hundreds of people on Paama suffered from throat, chest, and lung problems as a result of breathing ash and gas. Smaller amounts of ash also fell on the islands of Ambrym, Malekula, and Epi. The UN Office for the Coordination of Humanitarian Affairs (OCHA) reported that the heavy ash fall in Paama had almost ceased by 12 June, but strong Southeasterly Trade Winds (10-15 knots) continued to spread the ash. A government spokesperson stated that as of 13 June no evacuations had been ordered.
Sources: Société Volcanologique Européenne; Associated Press; Wellington Volcanic Ash Advisory Center (VAAC); Reuters; UN Office for the Coordination of Humanitarian Affairs (OCHA)
Reports are organized chronologically and indexed below by Month/Year (Publication Volume:Number), and include a one-line summary. Click on the index link or scroll down to read the reports.
Ash emission
A. Macfarlane reported that Lopevi ejected a black ash cloud on 24 October that rose to an altitude of about 6 km and drifted NW. Weather clouds prevented satellite observations until late that day, when no plume was visible. On 25 October, the area's first daylight image (at 0645) from the GOES West geostationary weather satellite showed a relatively diffuse plume extending about 250 km S from the volcano. By 0900, the far end of the cloud was roughly 500 km S of Lopevi and feeding appeared to be ending. The cloud had clearly begun to dissipate on the next image, an hour later. As of early November, no additional activity had been reported either in Vanuatu or by Solair pilots (who fly near Lopevi three days a week). Macfarlane notes that such activity at Lopevi is not unusual. Lopevi was last reported active on 12 September 1979, when small amounts of ash were emitted from cones on the SW flank.
Information Contacts: A. Macfarlane, Geological Survey, Vanuatu; F. Coulson, Ministry of Natural Resources, Solomon Islands; D. Haller, NOAA/NESS; R. Shaw, IATA.
Active fumaroles on cone; vapor plume from crater
Richard Stoiber overflew Lopevi on 8 March. "A small white vapor plume was being emitted from the crater on 8 March. The most active fumaroles were high on the cone."
Information Contacts: R. Stoiber, Dartmouth College.
No fumarolic activity
"The volcano was totally quiet during overflights (VANAIR) on 4 September 1990, and 13 and 24 July 1991. . . . As with Gaua, the scarcity of information from 1977 to 1989 prevents a precise description of its activity. Nevertheless, it seems that no major event occurred during this period."
[The Bulletin of Volcanic Eruptions (BVE) reports lava flows in November 1978, ash eruptions and lava flows February-March 1979, a black eruption column on 2 July 1979, minor ash emissions on 12 September 1979, vigorous ash eruptions in April and July 1980, and an eruption cloud and lava flow on 18-20 August 1980.]
Information Contacts: C. Robin and M. Monzier, ORSTOM, New Caledonia; M. Lardy and C. Douglas, ORSTOM,Vanuatu; C. Mortimer, Dept of Geology, Mines, and Rural Water Supply,Vanuatu; J. Eissen, ORSTOM, France.
Fumarolic emissions and sulfur deposits seen during overflight
An overflight on 21 and 22 July allowed observation of the summit for a few minutes. Activity at the two summit craters consisted of fumarolic emissions from the S interior wall of the principal crater, which is also the highest. A few yellow sulfur deposits carpet the interior walls of the cone, principally on the S and SW.
Information Contacts: Henry Gaudru, C. Pittet, C. Bopp, and G. Borel, Société Volcanologique Européenne, C.P. 1, 1211 Genève 17, Switzerland (URL: http://www.sveurop.org/); Michel Lardy, Centre ORSTOM, B.P. 76, Port Vila, Vanuatu.
Strombolian explosions beginning November 1998
During 1963-82 ash emissions, lava flows, lava fountains, and Strombolian explosions occurred intermittently at Lopevi. In 1968-69 activity mainly affected the SE flank (figure 1), where two lava flows from the summit reached the sea. The twenty-year pattern of activity ended with emission of a major plume that rose to 6,000 m on 24 October 1982 (SEAN 07:010).
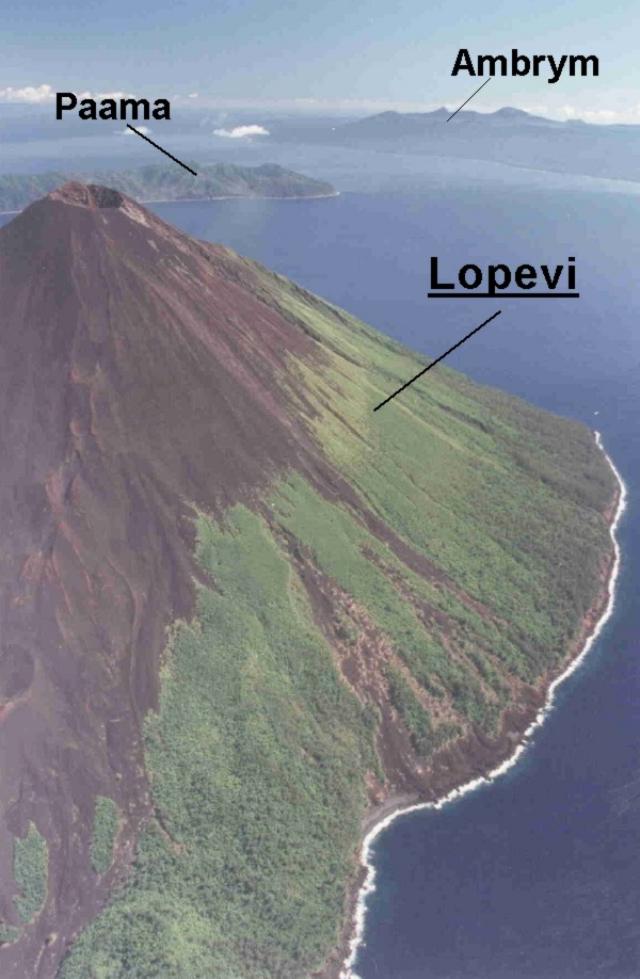 |
Figure 1. View of the SE flank of Lopevi volcano, looking toward the NW in May 1995. Paama Island, from which recent observations were made, and Ambrym Island, a currently active volcano, are in the background (to the N). Courtesy IRD; photo by P. Evin, IRD. |
Since then, activity had been generally fumarolic. Eruptive activity resumed in July 1998. A series of Strombolian explosions in the main 1963 crater (just NW of the central crater) was observed during November 1998. On 29, 30, and 31 December 1998, Strombolian explosions and Vulcanian emissions were observed from the island of Paama every 4-5 minutes.
Sporadic eruptive activity observed between the end of December 1998 and March 1999 was confined to the 1963 crater on the NW flank (figure 2). The appearance of this large crater, at ~900 m elevation, ruined the perfect conic profile of Lopevi, a rare volcano of the archipelago without a caldera.
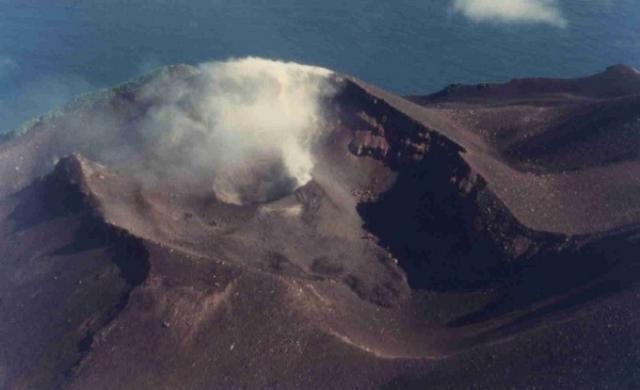 |
Figure 2. View of the active crater on Lopevi's NW flank as seen in January 1999. Courtesy IRD; photo by J-M. Bore, IRD. |
Lopevi, an island ~6 km in diameter, 1,450 m high, and 3,500 m above the seafloor, is one of the most active of the Vanuatu archipelago. The first written description came from Captain Cook, who in 1774 entered in his ship's log that the volcano was "seemingly without activity." Volcanic crises reported since 1863 appear to have occurred in cycles of ~15-20 years. In 1960, following a significant Plinian eruption from the NW flank, a series of pyroclastic flows, lava flows, Strombolian activity, and fumarolic emissions were observed during one month. In 1963, over a period of several months, large quantities of flowing lava and ash spread through ~ 1,000 ha in the NW part of the island.
Information Contacts: Michel Lardy, Institut de recherche pour le développement (IRD), B.P. 76, Port Vila, Vanuatu; Douglas Charley and Roland Priam, Department of Geology, Mines and Water Resources, PMB 01, Port Vila, Vanuatu.
Intracrater vent emits December 1998 lava flow; 1999 ash emissions
Sporadic eruptive activity at Lopevi volcano occurring since July 1998 has consisted of intermittent Strombolian explosions confined to a NW-flank crater at ~1,000 m altitude. Lava extrusion in December 1998 produced a small intracrater flow (figure 3). The flow originated from a ~20-m-high cone ("A" on figure 3) at the NW end of the main 1963 crater. The cone itself contained a small but prominent steep-walled crater (figures 4 and 5).
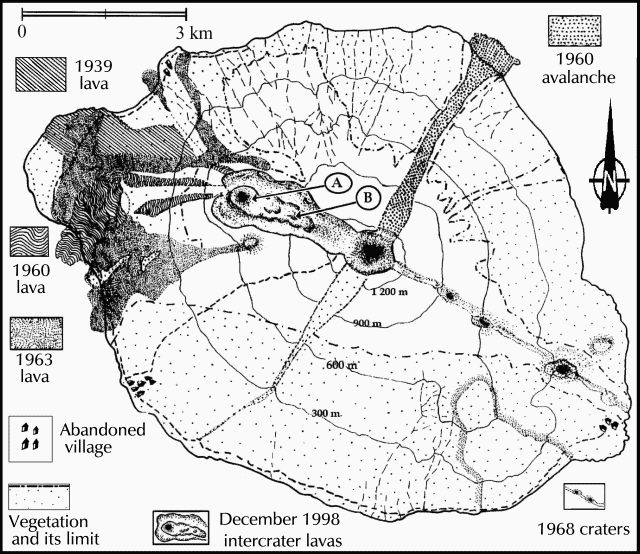 |
Figure 3. Sketch map of Lopevi showing lavas of 1939-1998. Areas "A" and "B" refer to photos shown as figures 3 and 4. Produced from an original map by A-J. Warden including observations by A-J. Warden and R. Priam (Archive Service de Mines); revised and updated by D. Charley and M. Lardy and drafted by A. Mabonlala, IRD. |
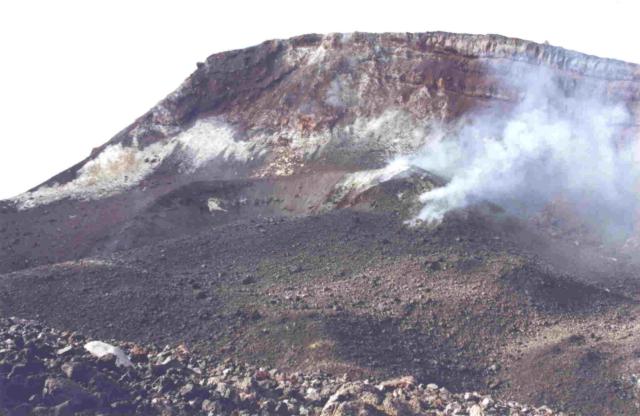 |
Figure 4. The intracrater cone of Lopevi (labeled "A" on the sketch map, figure 3) is seen looking NNW on 19 March 1999 with the fresh 1998 aa lava flow in the center and right foreground. The wall of the 1963 crater appears in the background. Photo courtesy of IRD and M. Lardy. |
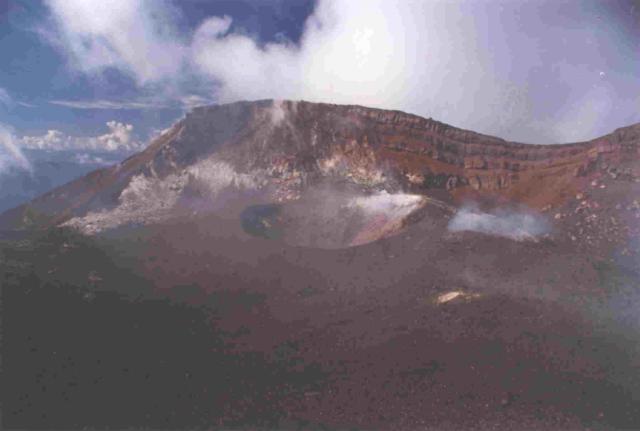 |
Figure 5. The intracrater cone of Lopevi (labeled "A" on the sketch map, figure 3) is seen looking NNW on 19 March 1999. The wall of the 1963 crater appears in the background. Photo courtesy of IRD and M. Lardy. |
During a March 1999 visit scientists examined the intracrater flow (figure 6), which had a volume of ~6,000 m3. The lower (eastern end) of the flow is labeled "B" on the map (figure 3). The intracrater flow contained abundant lava blocks with aa texture and a cover of explosion debris. Meter-sized blocks originating from a relatively viscous magma had been rafted to the flow front.
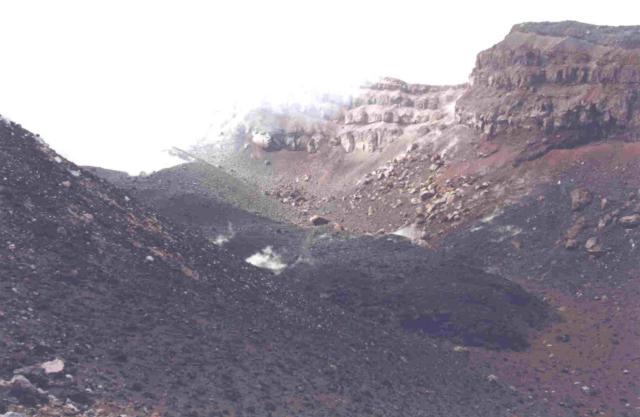 |
Figure 6. The 1998 Lopevi intracrater lava flow (looking NW from point "B" on figure 3) forms the dark-colored area extending diagonally across the 1963 crater floor. The ejecta-covered flow, ~100 m long and 10 m wide, traveled from left to right from the small cone seen steaming at the upper left. Photo courtesy of IRD and M. Lardy. |
Following initially more rapid movement, the lava slowed to advance at daily rates of a few to a dozen meters. Minor Vulcanian eruptions accompanied the flow. Constant fumarolic activity along with periodic small explosion plumes continued since January 1999. From 2 August 1999 scientists observed eruption plumes that rose to about 1 km altitude associated with the ejection of bombs from the crater.
Information Contacts: Sandrine Wallez and Michel Lardy, Institut de Recherche pour la Développment (IRD), BP 76, Port Vila, Vanuatu; Claude Robin, OPGC, 5 rue Kessler, 63000 Clermont-Ferrand, France; Charley Douglas, Vanuatu Department of Geology, Mines and Water Resources, PMB 01, Port Vila, Vanuatu.
Intermittent ash eruptions October 1999-April 2000; pyroclastic flow in February
Intermittent activity in October and December 1999 and February-March 2000 was reported by pilots flying near the island. Reports sent to the Wellington Volcanic Ash Advisory Center and the Port Vila control tower resulted in aviation advisories that formed the basis for this summary. Additional information about February activity was provided by John Seach, who visited the volcano (figure 7) during 23-24 February and talked to local residents.
 |
Figure 7. Photograph of Lopevi volcano with Epi Island in the distance, February 2000. Courtesy of John Seach. |
During 1963-82, ash emissions, lava flows, lava fountains, and Strombolian explosions occurred intermittently. This twenty-year pattern ended on 24 October 1982. Eruptive activity resumed in July 1998. A series of Strombolian explosions in the main 1963 crater (just NW of the central crater) was observed during November-December 1998 (BGVN 24:02). Lava extrusion in December 1998 produced a small intracrater flow from a cone at the NW end of the 1963 crater (BGVN 24:07). Sporadic eruptive activity observed between the end of December 1998 and March 1999 was confined to the 1963 crater at ~1,000 m elevation on the NW flank.
Ground observers reported on 15 October 1999 that a minor eruption approximately one week earlier consisted of a continuous ash plume rising to an altitude of 300-600 m. An ash cloud up to 2,700 m altitude was reported by pilots on 9-10 December.
Activity during February 2000. At 1422 on 3 February an ash cloud was reported up to 4,500 m over the island. Between 0507 and 0520 on 18 February a Vanair pilot reported an ash cloud initially as high as 9 km and then around 4.8 km altitude. A plume was identified on infrared and early morning visible satellite imagery, but there was considerable cloudiness in the area. Activity was continuing as of 0602 on 19 February, with an ash plume to ~5.5 km altitude. Convective activity through the day rapidly obscured any traces of the ash plume on satellite imagery. Analyses indicated that the plume may have contained significant ash that was expected to move ESE-SE and extend to 370 km. Due to the convective activity pilots were advised to respond as though the plume was rising to ~9 km altitude. However, another pilot report at 0621 indicated that activity had ceased.
According to John Seach, around midday on 19 February villagers on the neighboring island of Paama heard two loud explosions from the volcano; the second was the loudest heard in two years. This was followed by a brown ash cloud rising to ~4.5 km altitude visible from an aircraft en route from Sydney to Hawaii. Ashfalls occurred on Paama. A pyroclastic flow from the NW-flank crater (figure 8) traveled 2.5 km SW and reached the sea along a 300-m-wide front, where it created a delta. Blocks of 4 m in diameter were carried down to sea level. A 3-m-diameter block 50 m from the sea had a surface temperature of 170°C.
 |
Figure 8. View of the 19 February pyroclastic flow path from summit of Lopevi to the sea, 23 February 2000. Courtesy of John Seach. |
Trees buried in the ash were only visible as circular, black smoking areas when observed on 23 February. On the edge of the pyroclastic-flow deposit trees 0.5 m in diameter were snapped off 2 m from the ground (figure 9); some were upturned and redeposited in the ash. Standing devastated trees were burnt to a height of 18 m and debris was lodged in the canopy. Some fallen trees were still burning. Within 20 m of the edge of the pyroclastic-flow deposit were fallen devastated trees, and standing burnt trees were present for another 10 m beyond that. Observers were forced back when ground temperatures (over 200°C) melted boots. The air was filled with the smell of burnt trees and sulfur. Coconuts superheated and exploded. Sap in smaller branches boiled and formed bubbles on the outside of the branch.
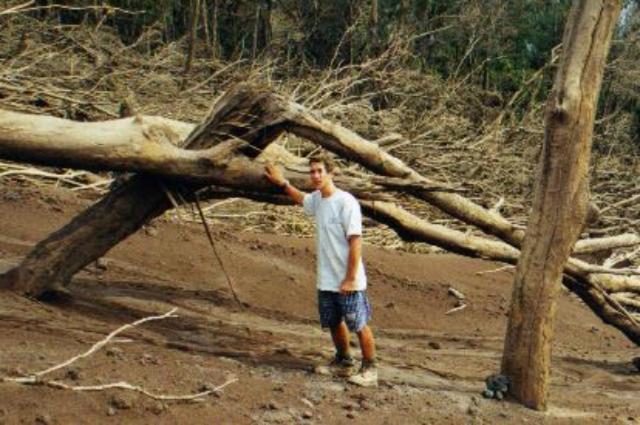 |
Figure 9. Devastated trees at the edge of a pyroclastic flow from Lopevi, 23 February 2000. Courtesy of John Seach. |
The active NW crater (figure 10) was climbed by Seach and Geoff Mackley on 23 and 24 February 2000. A lava dome was present on the SW crater rim from where the pyroclastic flow had originated along a 100-m-wide front. Lighter colored deposits marked its track down the volcano. On the N edge of the pyroclastic-flow deposit and 200 m below the NW crater was the source of a debris avalanche. A debris volume on the order of a million cubic meters had moved, exposing a large hole and producing two branching flows that moved ~250 m SW towards the sea. A new 150-m-high cinder cone formed inside the old crater was smoking with blue and white vapor being emitted. Ground temperature was 81°C at the base of the cinder cone. A two-week-old flank lava flow was observed to have traveled 1.5 km WNW to an elevation 250 m below the NW crater, burning trees and vegetation.
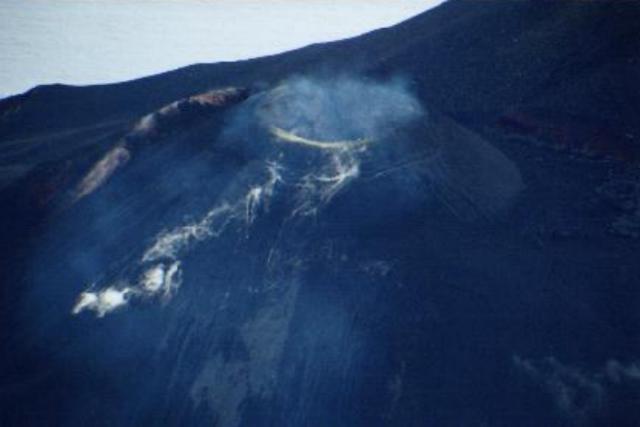 |
Figure 10. Aerial view of the active NW crater at Lopevi, February 2000. Courtesy of John Seach. |
Additional eruptions during March and April 2000. Another minor eruption on 15 March sent ash to 1,500 m, where it mixed with meteorological clouds. A stronger eruption began on 21 March with ash reported to 2,700 m altitude along with steam to 450 m. Activity increased the next day, when the plume was reported to be at levels of 4,200-4,500 m. The eruption continued during 23-24 March with plumes rising to altitudes of about 2,400 m.
A pilot report around 1100 on 24 April indicated a very dark-brown ash cloud rising from the volcano to an altitude of ~4,800 m and drifting NW. The report also noted that a new vent on the W side was emitting lava. A notice to aviators stated that they should expect ash to 5,400 m altitude within 550 km in the NW quadrant of the volcano. Ash warnings to aviators in the late morning and night of 25 April indicated that ash and lava continued to be emitted from the W vent. Pilot reports indicated that the height of the ash cloud was difficult to determine due to cloud cover, but was at least to 600 m altitude. The ash appeared to be thinning out beyond 18 km W of the volcano, but the extent of the plume could not be determined from satellite imagery. A notice at 2155 on 26 April stated that no further visual activity reports had been received since 25 April.
Information Contacts: Wellington Volcanic Ash Advisory Center (VAAC), MetService, PO Box 722, Wellington, New Zealand (URL: http://www.metservice.co.nz/); John Seach, PO Box 16, Chatsworth Island, N.S.W. 2469, Australia.
2000 activity documented in visit reports and sketch map
From 1963 to 1982 ash emissions, lava flows, lava fountains, and Strombolian explosions were intermittent. Eruptive activity resumed in July 1998. In December 1998, lava extruded but remained confined to the W-flank craters (BGVN 24:07). Sporadic eruptive activity again took place in March and October 1999. Ash clouds were noted through the end of April 2000 (BGVN 25:04).
This report focuses on field observations of activity during 2000. In mid-February 2000 a pyroclastic flow from the NW-flank crater traveled towards the W and was followed by a smaller debris avalanche that only extended ~250 m in length (BGVN 24:07).
July 2000 visit. A group visited Lopevi on 18-21 July 2000. The following was derived from reports provided by Sandrine Wallez, Douglas Charley, Roberto Carniel, Marco Fulle, and student Esline Garaebiti. Wallez and Charley's sketch map summarizes year 2000 activity (figure 11).
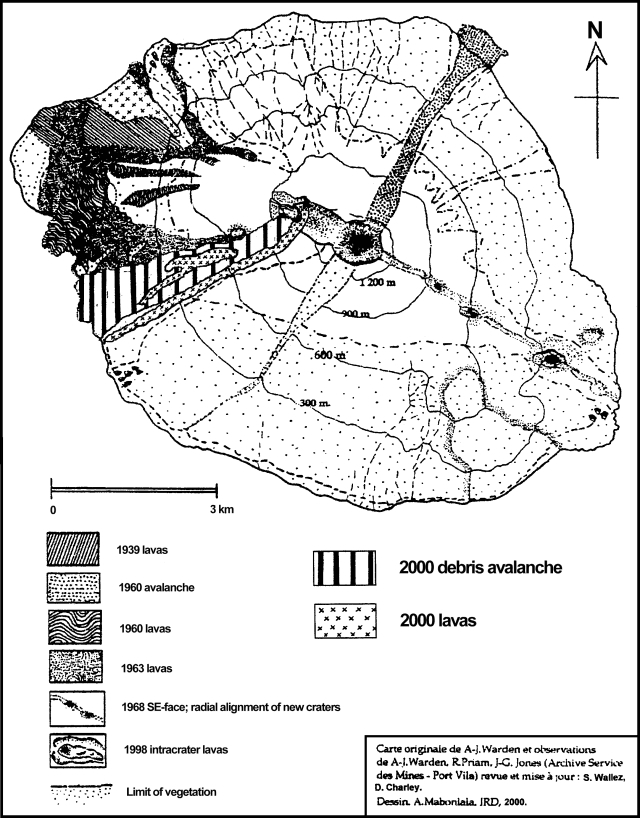 |
Figure 11. A sketch map of Lopevi emphasizing deposits during 1939-2000. Produced from an original map by A-J. Warden including observations by A-J. Warden and R. Priam (Archive Service de Mines); revised and updated by S. Wallez and D. Charley; drafted by A. Mabonlala. Courtesy of IRD. |
The July visitors observed significant deposits on the WSW flank (heavy slash pattern, figure 6) from the February 2000 activity. These visitors found few clear remnants of the pyroclastic-flow deposit. Instead the entire swath was overlain by a debris avalanche and possibly other mass-wasting deposits (figure 6).
Two lava flows came down the W-flank zone impacted by the pyroclastic flow and the debris avalanche. The area lies constrained by a near-vertical topographic discontinuity that reaches 800 m elevation.
The longer lava flow (N2) vented at the SE boundary of a 1963 crater. Overlying one of these lavas, the group found a field overlain by large bombs. The flow accumulated over the intracrater flow of December 1998, and moved in a westerly direction. Another smaller lava flow erupted nearer to the sea on the NW flank. Judging from the map, it reached the sea along a front ~1 km wide.
Information Contacts: Sandrine Wallez and Douglas Charley, Département de la Géologie, des Mines et des Resources en eau (IRD), Vanuatu; Roberto Carniel, Dipartmento di Georisorse e Territorio, Università di Udine, Via Cotonificio 114, 33100 Udine, Italy; Marco Fulle, Osservatorio Astronomico, Vai Tiepolo 11, 34131 Trieste, Italy.
June 2001 lavas, debris avalanches, <= 1.5 m ashfall, and 7.5-km-high plume
Lopevi erupted explosively on 8 June 2001, with additional eruptions at least through the 19th. The current eruptive period, which started in July 1998, continued during 1999 and 2000 (BGVN 24:02, 24:07, 25:04, and 26:06). This report covers June and July 2001.
The explosive eruption that began around 1100 on 8 June generated an eruptive plume, a lava flow on the NW flank, and two debris avalanches on the W flank (figure 12). During the explosive activity, a crater opened at ~200 m elevation on the NW flank along the SE-NW crack. The ash plume rose to ~7,500 m (as determined by NOAA satellite data analysis). The ash blew NW, carried by ~35-45 km/hour winds; tephra-fall deposits on Lopevi reached ~0.5-1.5 m thick. As much as 7 cm of ash fell on the E coast and middle of Paama Island, 5 km WNW with ~1,700 residents, reaching a thickness of 7 cm.
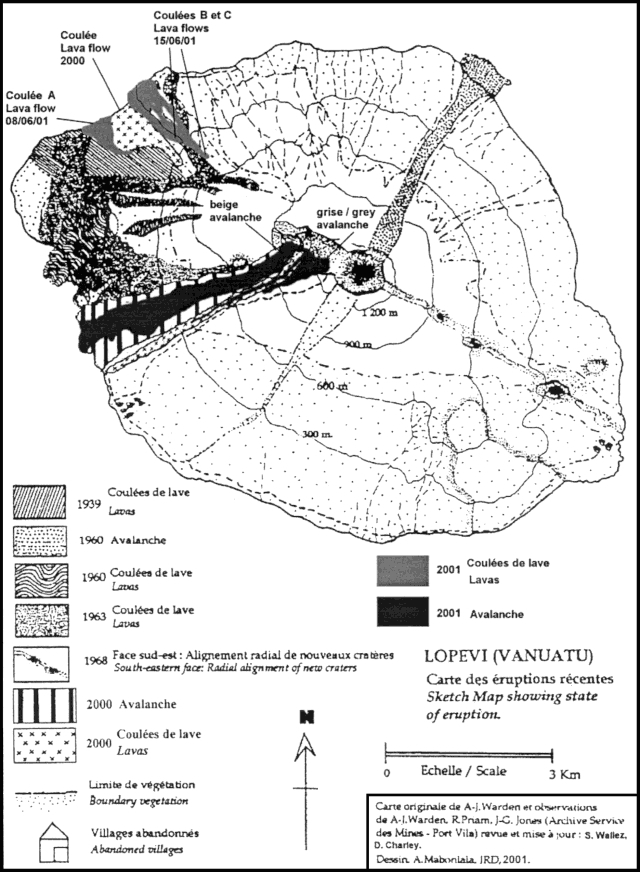 |
Figure 12. Sketch map of Lopevi showing the location of June 2001 deposits on the NW and NNW flanks. One lava flow and two debris avalanche deposits date from the 8 June 2001 eruption. Farther N, two lava flows date from the 15 June 2001 eruption. Produced from an original map by A-J. Warden including observations by A-J. Warden and R. Priam (Archive Service de Mines); revised and updated by S. Wallez and D. Charley; drafted by A. Mabonlala. Courtesy of IRD. |
About 11 hours after the eruption the Along-Track Scanning Radiometer (ATSR-2) research instrument on the European Remote-Sensing Satellite (ERS-2) obtained data from which an image of the plume could be derived (figure 13). The instrument has infrared detection channels at ~11 and ~12 µm, which are used to discriminate ash from meteorological clouds. The image shows the temperature difference between the 11 and 12 µm channels. The greater this negative difference, the greater the likelihood that there is ash; larger negative differences usually mean more ash. A possible explanation of the complex plume structure shown on figure 13 is the presence of atmospheric water vapor, which would mask the ash signal over some parts of the plume. Water vapor has the opposite effect of ash on the image: a positive difference is created because water vapor tends to make the 11µm temperature larger than the 12 µm temperature.
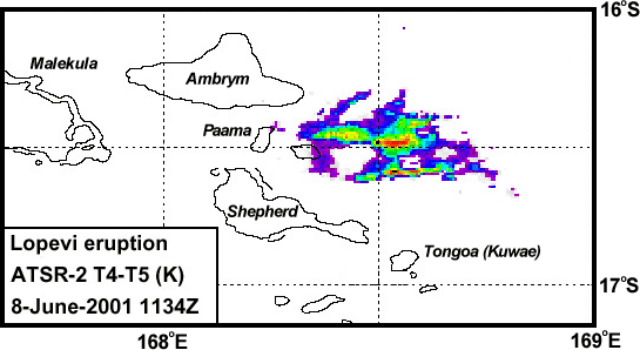 |
Figure 13. Lopevi ash plume as imaged by the ATSR-2 instrument on 8 June 2001 at 1134Z. The unlabeled island SW of the plume is Lopevi. The areas with the most ash are in the center of the shaded plume area. Courtesy of Fred Prata, CSIRO. |
The 8 June explosion caused instability on the W flank that produced two debris avalanches-unsorted deposits composed of older material (figures 14 and 15). The smaller of the two avalanches was composed of fine gray debris. It occurred next to the lava flow from the NW-flank crater. The larger avalanche, which reached the sea, was beige in color and included basaltic lava fragments, unburned vegetation, and red and black scoria of the sort commonly found on the steep (45°) upper slopes. The scoria and other observations were consistent with this debris avalanche resulting from a partial collapse of the active cone. Aa lava from the NW-flank crater spread out along the coastline (figure 14) on the SW side of the 2000 lava flows (figure 16). This flow had cooled by the time of a field visit on 11 June.
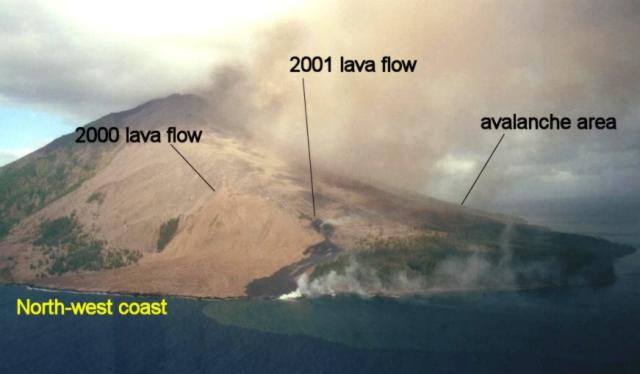 |
Figure 14. Lopevi's NW coastline showing the 8 June aa lavas and debris avalanches (barely visible); older lavas from 2000 also appear. The photograph was taken on 9 June 2001. Courtesy of S. Wallez. |
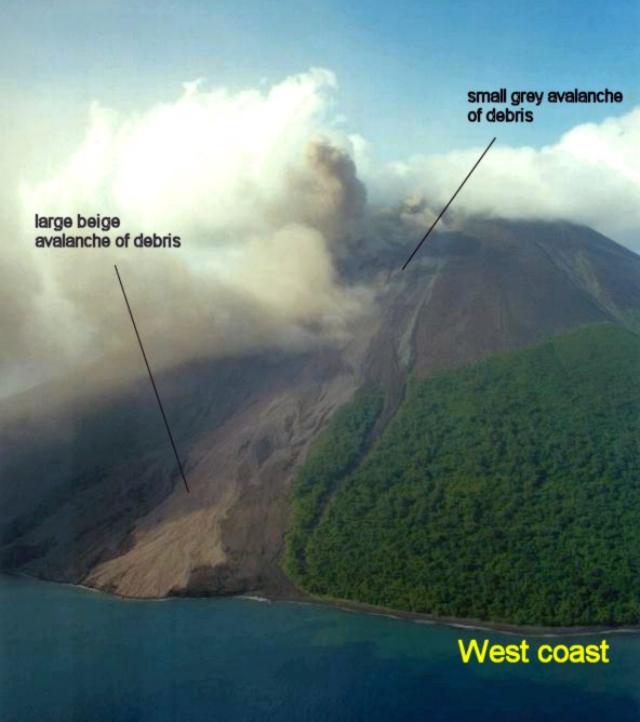 |
Figure 15. Lopevi's two W-flank debris avalanches produced during the 8 June 2001 eruption (photographed 9 June 2001). Courtesy of S. Wallez. |
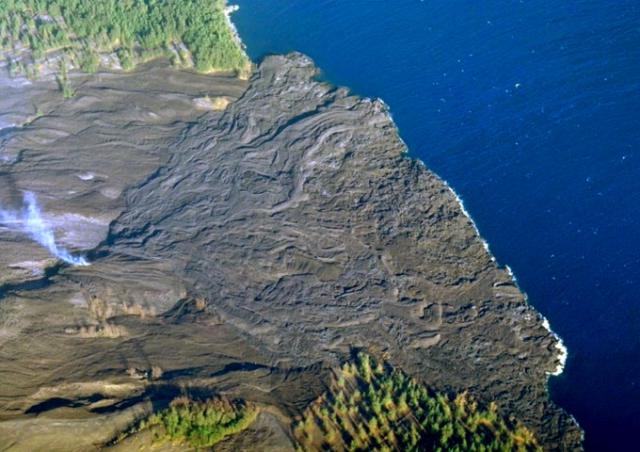 |
Figure 16. Sub-vertical aerial photograph showing lava flows that reached the NNW coast of Lopevi during 2000. Additional lava flows from the June 2001 eruptions covered parts of the SW and NE areas of this delta. N is to the right. Courtesy of S. Wallez. |
On a second visit during 14-17 June, geologists saw two new NW-flank flows, which they mapped and photographed (figures 12 and 17). Their guide said the lava flows were emplaced on 15 June 2001. These flows began at a height of ~400 m and added to a delta with a width of ~350 m at the coast.
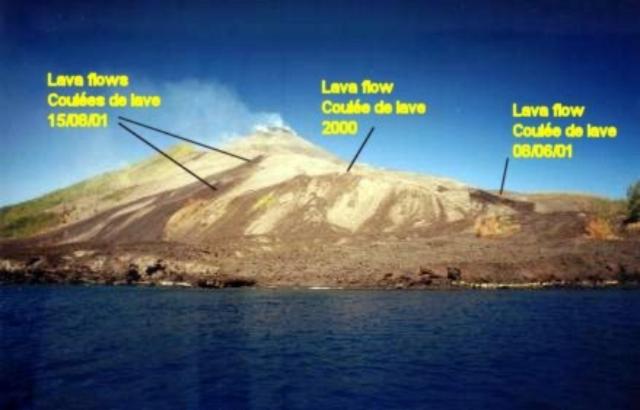 |
Figure 17. View of Lopevi from the ocean looking towards the NW coast towards the lava flows from 2000 and both 8 and 15 June 2001. Courtesy of S. Wallez. |
According to United Nations reports, the strong SE trade winds had deposited ~18 cm of ash on Paama Island as of 20 June, and lesser ashfall on Ambrym and Malekula islands. The worst affected villages were Luli, Lulep, and Liro on Paama. Overall, it was estimated that 4,000-5,000 people were directly affected by the ashfall on Paama and SE Ambrym. The ashfall on Paama polluted open water-supplies, bringing the pH to 3-4, and caused darkness for a few hours beginning at about 1500 on 8 June. The 12 June report noted that the government of Vanuatu had approached the Australian High Commission in Port Vila and in response an Australian ship in the area, HMAS Kanimbla, was deployed to deliver drinking water from Red Cross stocks. The Vanuatu Red Cross Society provided water, blankets, and soap, as well as participating in assessment activities with government officials and scientists. The National Disaster Management Office reported to the UN that more ashfall occurred on the night of 19 June. As of 20 June sources of potable water had been identified, but there remained a shortage of cooking and wash water. As a precaution, 105 students and five teachers from Paama were evacuated to schools on other islands, but most residents remained and were occupied with clearing ash from roofs, water tanks, and gardens.
Information Contacts: Sandrine Wallez and Douglas Charley, Department of Geology, Mines & Water Resources (DGMWR), PMB 01, Port-Vila, Vanuatu; Michel Lardy, Institut de Recherche pour le Développement (IRD), Bondy, Paris, France; Fred Prata, Senior Principal Research Scientist, Commonwealth Scientific and Industrial Research Organization (CSIRO), Atmospheric Research, PB 1 Aspendale, Victoria 3195, Australia; United Nations Office for the Coordination of Humanitarian Affairs (OCHA), New York, NY 10017 USA (URL: https://reliefweb.int/).
Anomalous SO2 emissions detected by satellite in December 2002 and January 2003
Satellite data interpreted by Simon Carn indicate that anomalous degassing may have begun from a volcano in Vanuatu in mid-December 2002. SO2 signals were noted in data from both the Global Ozone Monitoring Experiment (GOME) on the ERS-2 satellite and the Earth Probe Total Ozone Mapping Spectrometer (TOMS). Although GOME is more sensitive to SO2 than TOMS, its spatial resolution is very poor, so distinguishing the source of emissions between Ambrym and Lopevi is impossible using the available imagery.
However, on 14 December John Seach noted a strong sulfurous smell on the W side of Ambrym caldera. The wind was blowing from the direction of Lopevi at the time, and white emissions were noticed on Lopevi's active crater on the NW flank of the volcano. Seach did not note unusual emissions from Ambrym during his 11-15 December 2002 visit, so the editors are attributing this activity to Lopevi unless other data are found that identify Ambrym as the source.
GOME data indicate SO2 emissions over Vanuatu on 13, 19, 22, and 25 December 2002, then again during 4, 7, 11, 14, 17, and 20 January 2003. Data are only collected every third day, so degassing could be continuous, with a possible lull in late December. After 11 January GOME signals became very weak. TOMS data also indicated SO2 originating from the region on 19, 21, and 25 December, and again during 4, 5, 6, 8, 9, 10, 11, and 12 January, with nothing really evident since then. On a couple of days, particularly 4 January, the anomaly seen in TOMS imagery seemed to be originating from Ambrym.
The SO2 mass detected by TOMS immediately E of Lopevi and Ambrym on 8 January was estimated at less than 5,000 tons, a low value. Combining the two datasets indicates that the most significant SO2 emissions occurred around 25 December 2002 and 4-11 January 2003. After mid-January the activity seemed to be tapering off.
Information Contacts: Simon A. Carn, TOMS Volcanic Emissions Group, Joint Center for Earth Systems Technology (NASA/UMBC), University of Maryland Baltimore County, 1000 Hilltop Circle, Baltimore, MD 21250, USA (URL: https://jcet.umbc.edu/); John Seach, PO Box 16, Chatsworth Island, NSW 2469, Australia (URL: http://www.volcanolive.com/).
Infrared data corroborate and refine timing of known activity
During 2001-2002, MODIS alerts occurred only in June 2001 (figure 18). The first anomaly was detected on 9 June at 2210. This consisted of three alert-pixels with a maximum alert ratio of -0.299, and can be attributed to lava flows from a new vent 200 m above sea level on the NW side of the cone, which appeared in association with a plume-forming eruption on 8 June at around 1100 (BGVN 26:08). The only other MODIS alert was 14 June at 2225 local time, and consisted of two pixels closer to the summit (figure 6). According to a local guide (BGVN 26:08), a new flow was erupted in roughly this location on 15 June. MODIS alert data provide evidence that emplacement of this flow actually began during the previous night.
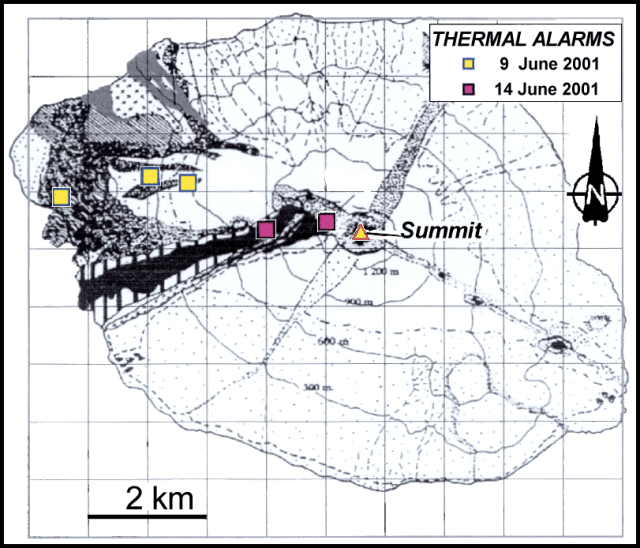 |
Figure 18. Locations of alert-pixels on Lopevi during 2001-2002. Courtesy of Diego Coppola and David Rothery, The Open University. Base map is from BGVN 26:08; courtesy of Institut de recherche pour le développement (IRD), Vanuatu. |
Information Contacts: Diego Coppola and David A. Rothery, Department of Earth Sciences, The Open University, Milton Keynes, MK7 6AA, United Kingdom.
June ash plumes to altitudes of 2.5-12 km; small lava flow
On 8-9 June 2003, a volcanic ash advisory was issued for Lopevi. The Port Vila tower in Vanuatu reported that at 0055 on 8 June, an ash cloud with a thick plume rose to above 12 km altitude and drifted SE. The plume was not visible on satellite images. Later reports from pilots at 2311 indicated that the activity had subsided, with no further signs of an ash cloud. At 0330 on 9 June, the Port Vila tower reported another thick black ash cloud rising to 2.7 km, with a diameter of ~18 km, drifting SE. Observations of volcanic activity were not possible after that time.
The eruption continued through at least 14 June. An airport in Vanuatu reported to the Wellington VAAC that a thick plume rose to ~7.5 km altitude on 11 June. The plume drifted SE and was ~9 km in diameter. They reported that on 13 June a ~9-km-diameter plume rose to ~2.5 km altitude. Also, on 14 June an ash cloud was at a height of ~2.5 km altitude and a thin lava flow was visible on the volcano's W flank.
A news article from the Australian Broadcasting Corporation stated that the eruption was causing acid rain to fall on island villages in Vanuatu that are close to the volcano. Local disaster management personnel warned residents of the islands of Paama, Epi, and villages in SE Ambrym to secure their rain-based water supplies.
Information Contacts: Wellington Volcanic Ash Advisory Center (VAAC), MetService, PO Box 722, Wellington, New Zealand (URL: http://vaac.metservice.com/); Australian Broadcasting Company, ABC Ultimo Centre, 700 Harris Street, GPO Box 9994, Sydney, NSW 2001, Australia (URL: http://www.abc.net.au/).
MODVOLC thermal alerts of 4-6 pixels during 9-16 June 2003
Subsequent to the events of June 2001 (BGVN 28:01) only one further period of activity, between 9 and 16 June 2003, was indicated by MODVOLC. MODIS detected activity on 9 June 2003 first with Terra at 1135 UTC with six alert pixels, followed by Aqua at 1435 UTC, when the alert pixels had reduced in number to four. The highest alert ratio, +0.432 (unusually high ) was detected by the Aqua satellite on 13 June 2003. There were three days when the number of alert pixels reached six (on 9, 13, and 16 June 2003). These data suggested that a lava flow, previously noted as occurring on 14 June 2003 (BGVN 28:06), probably began effusion at least as early as 9 June.
Data acquisition and analysis. Reports from Diego Coppola and David A. Rothery provided analyses of MODIS thermal alerts during 2001 and 2002 (using the MODVOLC alert-detection algorithm) extracted from the MODIS Thermal Alerts website (http://modis.hgip.hawaii.edu/) maintained by the University of Hawaii HIGP MODIS Thermal Alerts team (BGVN 28:01). Rothery and Charlotte Saunders provided updates to 31 May 2004. MODVOLC data are now routinely available from the Aqua satellite (equator crossing times 0230 and 1430 local time) in addition to the original Terra satellite (equator crossing times 1030 and 2230 local time).
Information Contacts: David A. Rothery and Charlotte Saunders, Department of Earth Sciences, The Open University, Milton Keynes, MK7 6AA, United Kingdom.
Several lines of data confirm ongoing eruptions at this frequently erupting volcano
Previously, Bulletin reports for 2003 chiefly discussed either aviation-related reports about ash plumes or satellite data, such as the spectroscopic sensing of SO2 or infrared data in the form of MODVOLC thermal alerts (BGVN 27:12; v. 28, nos. 1 and 6; v. 29, no. 6). Since those reports more first-hand observations of conditions on the ground have emerged regarding Lopevi during 2003. Numerous thermal anomalies were detected by the MODIS satellite at Lopevi during July 2003 to March 2005 [table with incorrect data deleted]. Other observations also indicate activity continuing in 2005. Lopevi erupts nearly continuously, but, because it is an uninhabited island, activity often goes unreported.
Lopevi remains a danger for the region, and particularly for Paama Island, the closest inhabited island (6 km away). The explosive eruption of 2001 turned day into night for several hours, and the ashfall polluted the islanders' water supply to the point where the Australian Navy had to send a ship to bring residents drinking water. Since then, wells equipped with hand-operated pumps have been installed on Paama's N side, the flank threatened most directly. Lardy suggested that evacuating 1,633 inhabitants (the number cited in a 1999 census) is not realistic, but that the population could be supplied with dust-filtering face masks prior to the next eruption. The majority of Paama Island residents live on the W coast and even for the closest residents on Paama's N coast, the view of Lopevi is often limited.
Observations during 2003. Michel Lardy summarized the activity during 2003. The major volcanic events of June 2001 (BGVN 26:08) and of June 2003 (BGVN 28:06) appear to have originated at the adventive crater and through fractures in the island's N and W sides (figures 19 and 20). In particular, vents on the N, NW, and W opened in 2001 and 2003. Vent opening in 2001 occurred at 16° 31.879'S, 168° 19.846'E. A 2001 lava flow was prominent on the N flank. Radar interferometry depicted lava in 2001 on the volcano's N side, in the crater, and at several places on the N and W flanks.
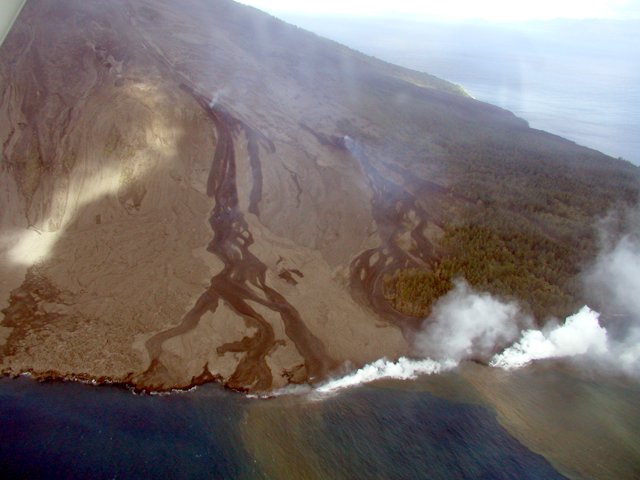 |
Figure 19. Lava flows down Lopevi's N flank and entering the sea during June(?) 2003. Note multiple lava flows, distinct vent areas, and the presence of at least two active points of entry into the ocean at the time of the photo. Photo credit, Shane Cronin (Massey University). |
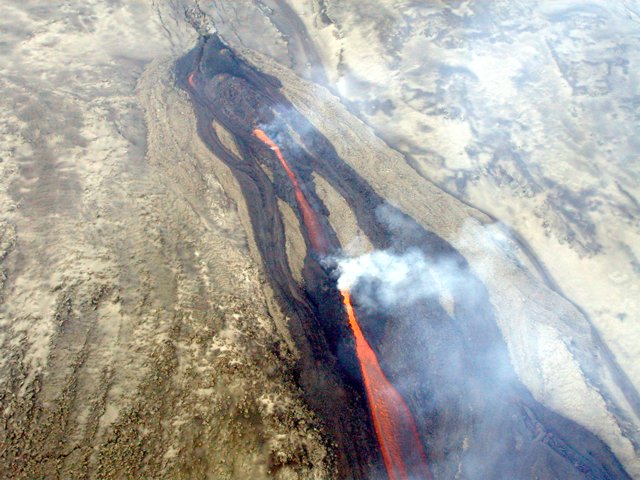 |
Figure 20. A closer look at the vents feeding lava flows down Lopevi's N flank during June(?) 2003. The vents formed along radial fractures. Photo credit, Shane Cronin (Massey University). |
Observations during 2004. During September 2004 thermal anomalies were detected four times, as many times as any month during the interval shown on table 2. However, none of the 28 September anomalies were unusually strong (~ 1 W m-2 sr-1 mm-1) and the spectral radiance of some other observations were several-fold larger (up to ~ 3.8 W m-2 sr-1 mm-1).
Volcano tour guide John Seach visited SE Ambrym volcano in November 2004. At that time he received reports from residents about previously unreported eruptions of Lopevi that occurred during 2004. Specifically, during September 2004, five large booming noises were heard coming from Lopevi by villagers in S Ambrym. Explosions were separated by 2 minutes. The next day there was ashfall on N and W Ambrym.
Observations during 2005. According to Seach, local observers in Vanuatu indicated ongoing eruptive activity at Lopevi beginning at the end of January 2005 and continuing into February.The Wellington VAAC is the key group providing aviators with reports on Lopevi eruptions and ash plumes. Their website posted all Volcanic Activity Advisories during 90 days prior to 28 March, but there were no reports for Lopevi during that interval. This absence of reports could be for a variety of reasons, such as relatively few if any plumes during that interval. Other reasons might also include extensive weather clouds screening satellite and pilot observations, or an absence of reports from pilots or people in the field to pass observations to the VAAC.
On 21 March 2005 IRD staff members observed Lopevi in usually clear weather conditions (figures 21 and 22). These two photos highlight Lopevi's summit crater and its off-axis NW-flank (adventive) crater. The adventive crater has been a feature of the edifice since the early 1960s (BGVN 24:02 and 24:07; the latter issue contains a map showing the then-recent crater).
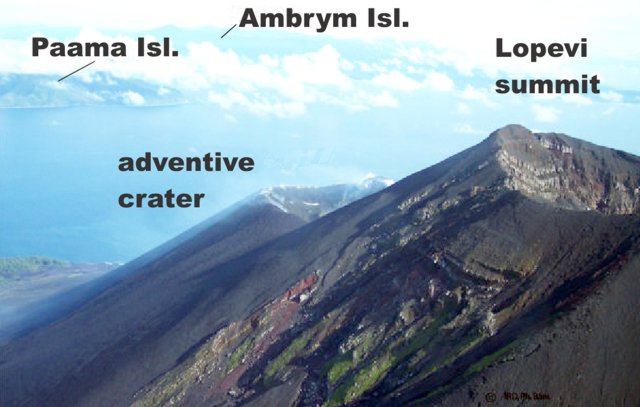 |
Figure 21. Annotated, N-looking view of Lopevi showing summit crater and adventive crater, and two other islands in the background. Copyrighted photo taken 21 March 2005 by P. Bani, IRD. |
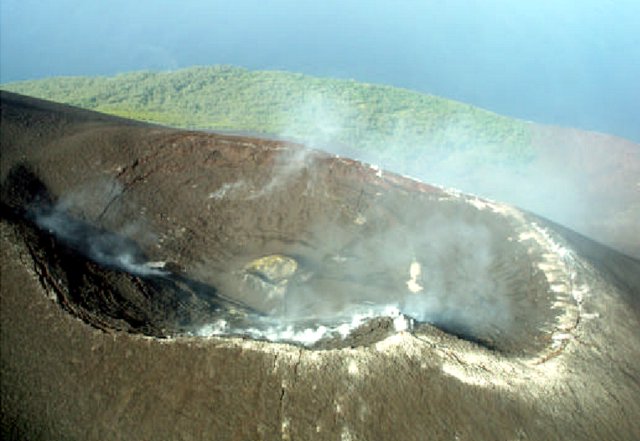 |
Figure 22. A photo of Lopevi's adventive NW-flank crater taken looking S from an altitude of ~ 1 km. White deposits occur along considerable portions of the larger crater's rim. The color version of this photo indicates a yellow region lies on the internal crater (the crater inside the larger crater and in the middle of the photo). Other areas of yellow color were also visible farther to the right, although in this shot it was masked by a hazy plume. The yellow color was attributed to sulfur deposits. Copyrighted photo taken 21 March 2005; provided courtesy of M. Lardy, IRD. |
The close-up photo (figure 22) shows a circular fracture along the crater's rim and circumferential fractures along its walls, probably the result of subsidence caused by the constant release of gas from the magma reservoir. White hydrothermal deposits were thought to have been associated with this gas release. The observers also saw yellow sulfur deposits near the internal crater and between it and the northern rim (to the right on the photo).
The perpendicular fractures visible just outside the crater (bottom center on the photo) were also judged most likely related to this subsidence associated with gas release. The small inner crater was a zone of active deposition (building up that crater). This pattern, apparently cyclical, has been visible since 1998, when Lopevi resumed an active phase following a quiet period of about fifteen years during which only fumaroles were observed. The summit crater (1,367 m elevation, figure 22) appears little changed when compared with the same crater 1995 photos taken in 1995. The major volcanic events of June 2001 (BGVN 26:08) and of June 2003 (BGVN 28:06) originated in the adventive crater and through fractures in the island's N and W sides.
Lardy also commented that "observations made since the 19th century suggest an activity cycle of 15 to 20 years, yet it remains difficult to forecast the occurrence of major eruptive phases within the cycle. Although there appears to be a recurrence of events in the month of June, it would be rash to attempt to predict the next eruption given the current state of our knowledge. Since November 2004, a micro-barometer has been set up on Paama Island. It is connected to the SSI network (which monitors compliance with the international ban on nuclear explosions) and has been recording the explosive volcanic events occurring on Lopevi and Ambrym Islands. Real time measurements should complement this monitoring system."
Reference. Le Pichon, A., and Drob, D., 2005, Probing high-altitude winds using infrasound from volcanoes: Jour. of Geophys. Res. (in press)
Information Contacts: Michel Lardy and Philipson Bani, Institut de Recherche pour le développement (IRD), CRV, BP A 5 Nouméa, New Caledonia; Morris Harrison, Department of Geology, Mines, and Water Resources, PMB 01, Port-Vila, Vanuatu (URL: http://www.suds-en-ligne.ird.fr/fr/volcan/vanuatu/lopevi1.htm); Shane Cronin, Soil and Earth Sciences Group, Institute of Natural Resources, Massey University, Private Bag 11 222, Palmerston North, New Zealand; John Seach, PO Box 16, Chatsworth Island, NSW 2469, Australia (URL: http://www.volcanolive.com/); Hawai'i Institute of Geophysics and Planetology, University of Hawaii and Manoa, 168 East-West Road, Post 602, Honolulu, HI 96822 (URL: http://modis.higp.hawaii.edu); Wellington Volcanic Ash Advisory Center (VAAC), MetService, PO Box 722, Wellington, New Zealand (URL: http://www.metservice.co.nz/).
Minor discharges on 24-25 January 2006
As noted by the Wellington Volcanic Ash Advisory Center (24 and 25 January 2006), pilots reported a vertical plume rising from Lopevi at 0845 hours on 24 January 2006 to an altitude of 2.1-2.4 km and drifting to the S. At 0845 the next day, 25 January, the plume extended SE and was reportedly at 2.7 km.
MODIS satellite data also detected thermal anomalies around this time (0055 and 1020 hours on 24 January), preceded by an absence of measured anomalies for ~ 9 days (since 2240 hours on 15 January). Satellite thermal anomalies are often detected over this volcano.
Information Contacts: Rob Wright, Luke Flynn, and Eric Pilger, Hawai'i Institute of Geophysics and Planetology, University of Hawaii and Manoa, 168 East-West Road, Post 602, Honolulu, HI 96822 (URL: http://modis.higp.hawaii.edu/); Wellington Volcanic Ash Advisory Center (VAAC), MetService, PO Box 722, Wellington, New Zealand (URL: http://www.metservice.co.nz/).
Correction to previously published MODIS hotspot data
An error occurred in the March 2005 issue of BGVN (30:03). The table [now deleted online] had listed MODVOLC thermal anomalies, but it mistakenly included those for both Lopevi and Ambrym. The corrected table for Lopevi thermal anomalies only is provided here (table 1).
Table 1. MODVOLC thermal anomalies as observed from the MODIS satellite for Lopevi volcano for the period July 2003 to March 2005. The fourth column shows radiance in watts per square meter, per steradian, per micron (W m-2 sr-1 µm-1) in MODIS band 21 (central wavelength of 3.959 µm). Courtesy of the Hawai'i Institute of Geophysics and Planetology.
| Date | Time (UTC) | Sensor | Spectral radiance |
| 28 Sep 2004 | 1410 | Aqua | 0.937 |
| 28 Sep 2004 | 1410 | Aqua | 1.052 |
| 30 Jan 2005 | 1130 | Terra | 0.710 |
| 05 Feb 2005 | 1355 | Aqua | 0.983 |
| 05 Feb 2005 | 1355 | Aqua | 1.426 |
Information Contacts: MODVOLC Alerts Team, Hawai'i Institute of Geophysics and Planetology (HIGP), University of Hawaii and Manoa, 168 East-West Road, Post 602, Honolulu, HI 96822, USA (URL: http://modis.higp.hawaii.edu/).
Three eruptive episodes between October 2005 and August 2006
Volcanic activity from Lopevi has continued intermittently since November 1998 (BGVN 24:02). Though there are no permanent residents on the island, which is known as Vanei Vollohulu in the local language, the nearby islands of Epi (~ 17 km SW) and Paama (~ 10 km WNW) are heavily populated. Ambrym, another active volcanic island 18 km NNW, is also at risk of ashfall from Lopevi. Ash plumes during active periods are often reported by aviators, and thermal anomalies are frequently detected by the MODIS instrument on the Terra and Aqua satellites. Ash plumes and lava flows have most recently been reported in January, May, and July 2006.
Activity during 2006. Vertical plumes were observed by aviators reaching altitudes of 2.1-2.4 km on the morning of 24 January, and ~ 2.7 km the next morning. Further advisories issued by the Wellington VAAC reported that "smoke" plumes with a "steady rate of growth" rose to ~ 2.1 km on the morning of 26 January and drifted S. Lava flowing down the S flank was also reported on the 26th.
Based on information from a pilot report, the Wellington VAAC reported that on 7 May 2006 a small ash plume was visible below an altitude of ~ 3 km and an active lava flow was observed. On 10 May, a slow moving plume reached 3 km altitude. The next day a plume rose to 4.6 km and trended SE. During 12-13 May, the plume heights lessened to 3 km as the eruption vigor reportedly decreased. News media also reported heavy ashfall on Ambrym and Paama from an eruption on 15 May. An official spokesperson for Vanuatu's National Disaster Management Office reported no new ashfall during 17-22 May.
A situation report from the UN Office for the Coordination of Humanitarian Affairs (OCHA) noted that the May eruptive episode caused heavy ashfall on Paama and SE Ambrym, affecting water supplies and crops. The total population of Paama is 1,572, comprised of 23 villages and 511 households. On the island of Paama, the two main cash crops of vanilla and pepper were damaged badly. On both islands, staple foods such as wild yams, kumala, taros, bananas, and coconut trees were either damaged or destroyed. Residents experienced health problems caused by the consumption of contaminated food and water as well as the inhalation of ash. Head pain, skin infections, diarrhea, vomiting and respiratory difficulties were reported.
The Wellington VAAC received pilot reports of an eruption plume on 5 July that reached an unknown altitude. Another pilot report indicated that the eruption may have started on 27 June. The eruption continued over the next few days, with dark ash plumes reaching altitudes of 3.7 km and drifting E and SE. No plumes were reported after the morning of 10 July.
MODIS thermal anomalies during 2005-2006. Thermal anomalies were detected by MODIS during 26-31 March 2005, though no corresponding explosive activity was reported. No hot spots were identified at Lopevi again until 27 October 2005, after which anomalies were present on most days through 26 January 2006; ash plumes were not reported until the end of this period, 24-26 January.
Later in 2006, thermal anomalies were detected by MODIS on most days during 25-28 April, 2-16 May, 25-28 May, 26 June-9 July, and 18 July-1 August 2006. The largest number of alert pixels (24) during this time occurred at 2225 on 2 May. These data indicated two significant episodes of activity that included both explosive activity and probably lava emission during 25 April-28 May and 26 June-1 August. Two periods of plumes observations discussed previously, during 7-15 May and 27 June-10 July, fall within these longer episodes defined by the thermal data. No MODIS thermal anomalies were detected between 2 August 2006 and mid-March 2007.
Information Contacts: Wellington Volcanic Ash Advisory Centre (VAAC), Meteorological Service of New Zealand Ltd (MetService), PO Box 722, Wellington, New Zealand (URL: http://www.metservice.com/vaac/, http://vaac.metservice.com/); MODVOLC Alerts Team, Hawai'i Institute of Geophysics and Planetology (HIGP), SOEST, University of Hawaii and Manoa, 168 East-West Road, Post 602, Honolulu, HI 96822, USA (URL: http://modis.higp.hawaii.edu/); Department of Geology, Mines, and Water Resources, PMB 01, Port-Vila, Vanuatu (URL: http://www.suds-en-ligne.ird.fr/fr/volcan/vanu_eng/lopevi1.htm); Port Vila Presse, PO Box 637, Port Vila, Efate, Vanuatu (URL: http://www.news.vu/en/); ReliefWeb, Office for the Coordination of Humanitarian Affairs, United Nations, New York, NY 10017, USA (URL: https://reliefweb.int/).
New eruptive episode with ash plumes and thermal anomalies during April-May
No eruptive activity was evident from Lopevi following the June-July 2006 episode (BGVN 32:02) until 21 April 2007. Between 21 April and 14 May 2007 thermal anomalies detected by satellites again became an almost daily event. This was the fourth eruptive episode since October 2005 (table 2). No anomalies were observed after 14 May through 26 June 2007.
Table 2. Summary of MODIS thermal anomaly measurements at Lopevi from 27 October 2005 to 26 June 2007. "Nearly daily anomalies" indicate gaps in measurements of no more than 3-4 days, unless otherwise noted; these may be due to obscuring cloud cover. Courtesy of Hawai'i Institute of Geophysics and Planetology (HIGP) Thermal Alert System.
| Period | Observations |
| 27 Oct 2005-25 Jan 2006 | Nearly daily anomalies except for two 8-day and two 7-day periods; 1-4 pixels per satellite measurement (8 pixels on 21 December). |
| 26 Jan 2006-24 Apr 2006 | No thermal anomalies measured for about 90 days. |
| 25 Apr 2006-28 May 2006 | Nearly daily anomalies except for one 7-day period; 1-5 pixels per satellite measurement (12 pixels on 13 May, 23 pixels on 2 May). |
| 29 May 2006-25 Jun 2006 | No thermal anomalies measured for about 28 days. |
| 26 Jun 2006-31 Jul 2006 | Nearly daily anomalies except for one 7-day period; 1-7 pixels per satellite measurement (11 pixels on 28 June, 10 pixels on 7 July). |
| 01 Aug 2006-20 Apr 2007 | No thermal anomalies measured for about 260 days. |
| 21 Apr 2007-14 May 2007 | Nearly daily anomalies; 1-7 pixels per satellite measurement (9 pixels on 22 April, 11 pixels on 23 April, 10 pixels on 24 April, 11 Pixels on 26 April, 10 pixels on 28 April, and 9 pixels on 31 April). |
| 15 May 2007-26 Jun 2007 | No thermal anomalies measured for about 40 days. |
Based on pilot reports and satellite imagery, the Wellington VAAC reported that ash plumes rose to altitudes of 2.4-4.6 km during 21-24 April 2007. The plume on the 22nd was described as being a very dense dark gray ash plume with a steady growth rate. On 25 April a pilot reported that an ash plume covered the vent. A light brown eruption cloud over the island that drifted E from Lopevi on 3-4 May was detected by the Moderate Resolution Imaging Spectroradiometer (MODIS) on NASA's Aqua satellite (figure 23). The gray-brown plume became more diffuse downwind, with a pale gray plume spreading SE and N. Aviation notices from the Wellington VAAC noted that wind models indicated light easterly winds below 3 km, tending northerly above 1.8 km altitude. A pilot reported that the plume rose to 2.1 km altitude. The U.S. Air Force Weather Agency reported an extensive area of vog (volcanic smog) resulting from the eruption.
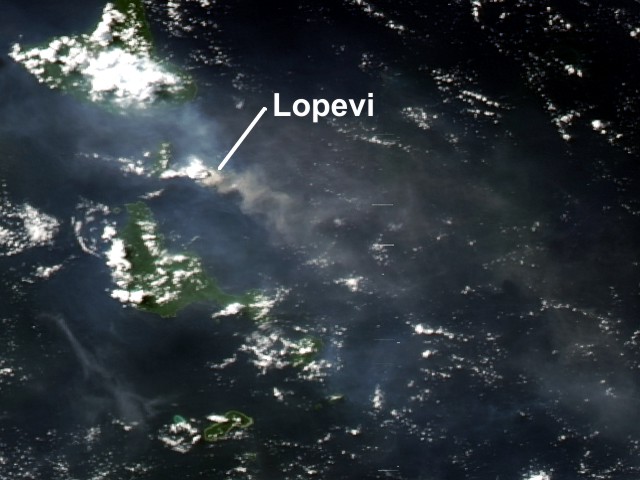 |
Figure 23. Satellite image of an ash plume from Lopevi, 3 May 2007. The plume appears as a small, mostly opaque gray-beige puff. The area of vog, which appears as a more transparent, dingy-gray haze, dwarfs the diminutive plume. Courtesy of NASA Earth Observatory. |
Information Contacts: NASA Earth Observatory (URL: http://earthobservatory.nasa.gov/); Hawai'i Institute of Geophysics and Planetology (HIGP) Thermal Alerts System, School of Ocean and Earth Science and Technology (SOEST), Univ. of Hawai'i, 2525 Correa Road, Honolulu, HI 96822, USA (URL: http://modis.higp.hawaii.edu/); Wellington Volcanic Ash Advisory Centre (VAAC), Meteorological Service of New Zealand Ltd (MetService), PO Box 722, Wellington, New Zealand (URL: http://vaac.metservice.com/).
Gray plume seen by pilot on 24 February 2008
Our previous report on Lopevi (BGVN 32:05) noted eruptions and thermal anomalies in April and May 2007. No additional thermal anomalies were observed by MODVOLC's satellite system from 14 May 2007 through 25 September 2009.
Based on a pilot report, the Wellington Volcanic Ash Advisory Centre reported that at 1404 on 24 February 2008, a thick grayish plume from Lopevi rose to an altitude below 3 km and drifted 9 km E. Volcanic ash was not visible on satellite imagery. By 1650 activity was subsiding, and the plume was lower. At 0732 on 25 February the pilot did not detect any significant activity.
Information Contacts: NASA Earth Observatory (URL: http://earthobservatory.nasa.gov/); Hawai'i Institute of Geophysics and Planetology (HIGP) Thermal Alerts System, School of Ocean and Earth Science and Technology (SOEST), Univ. of Hawai'i, 2525 Correa Road, Honolulu, HI 96822, USA (URL: http://modis.higp.hawaii.edu/); Wellington Volcanic Ash Advisory Centre (VAAC), Meteorological Service of New Zealand Ltd (MetService), PO Box 722, Wellington, New Zealand (URL: http://www.metservice.com/vaac/, http://vaac.metservice.com/).
Increased volcanic unrest in December 2014
Following the eruptive activity in April-May 2007, Lopevi remained quiet through May 2015 except for the sighting of a gray plume on 24 February 2008 (BGVN 34:08) and an increase in volcanic activity in December 2014. No thermal anomalies, based on MODIS satellites data, have bene observed since the 2007 eruption.
On 15 December 2014, the Vanuatu Geohazards Observatory (VGO) reported that, based on observations and analyses in early December, volcanic activity had increased dramatically over a short time period. No additional details about the type of activity were available. The Alert Level was raised to 1 (on a scale of 0-4), and access to the island was prohibited.
Information Contacts: Vanuatu Geohazards Observatory (URL: http://www.vmgd.gov.vu/vmgd/); Hawai'i Institute of Geophysics and Planetology (HIGP) Thermal Alerts System, School of Ocean and Earth Science and Technology (SOEST), Univ. of Hawai'i, 2525 Correa Road, Honolulu, HI 96822, USA (URL: http://modis.higp.hawaii.edu/).
Episodes of unrest in January and September 2017; gas-and-steam plumes
Since an eruptive episode in May 2007, Loopevi has been quiet except for a thick gray plume on 24 February 2008 and a short-lived increase in activity in December 2014 (BGVN 32:05, 34:08, 40:05). This report covers activity during January 2015-December 2017. Data were primarily drawn from reports issued by the Vanuatu Geohazards Observatory (VGO) and the Wellington Volcanic Ash Advisory Center (VAAC).
Based on a pilot observation and webcam views, the Wellington VAAC reported that a short-lived steam-and-gas plume beginning at 0500 on 13 January 2017 produced a that rose no higher than 3 km in altitude and drifted SE. That same day VGO reported that the Volcanic Alert Level (VAL) was raised to 3 (on a scale of 0-5); it was lowered to Level 2 on 17 January and then to Level 1 on 20 February.
Steam plumes were again observed on 23 September by the web camera, prompting VGO to raise the VAL to 2, indicating major unrest (danger around the crater rim and specific area, considerable possibility of eruption, chance of flank eruption). Observation flights on 30 September and the first week of October showed that the activity was occurring only in the active craters below the summit crater (figure 24). Photographs and thermal infrared images taken during the flights confirmed that activity consisted of hot volcanic gas and steam. VGO reported that photos and satellite images acquired at the end of November confirmed that gas-and-steam emissions were continuing.
|
Figure 24.Aerial view of the active cone at Lopevi on 3 October 2017. Courtesy of VGO. |
The unrest continued through at least December 2017, and the VAL remained at 2. The Wellington VAAC noted that on 20 December a low-level plume was visible in satellite and webcam images drifting NW at an altitude of 1.5 km.
Information Contacts: Vanuatu Geohazards Observatory (VGO), Department of Geology, Mines and Water Resources of Vanuatu (URL: http://www.geohazards.gov.vu/, http://www.vmgd.gov.vu/vmgd/index.php/geohazards/volcano); Wellington Volcanic Ash Advisory Centre (VAAC), Meteorological Service of New Zealand Ltd (MetService), PO Box 722, Wellington, New Zealand (URL: http://www.metservice.com/vaac/, http://www.ssd.noaa.gov/VAAC/OTH/NZ/messages.html).
|
|
||||||||||||||||||||||||||
There is data available for 30 confirmed eruptive periods.
[ 2014 Dec 1 - 2014 Dec 15 ] Uncertain Eruption
| Episode 1 | Uncertain | ||||
|---|---|---|---|---|
| 2014 Dec 1 - 2014 Dec 15 | Evidence from Observations: Reported | |||
[ 2008 Feb 24 - 2008 Feb 24 (?) ] Uncertain Eruption
| Episode 1 | Eruption (Explosive / Effusive) | |||||||||||||||||||
|---|---|---|---|---|---|---|---|---|---|---|---|---|---|---|---|---|---|---|---|
| 2008 Feb 24 - 2008 Feb 24 (?) | Evidence from Unknown | ||||||||||||||||||
|
List of 2 Events for Episode 1
|
|||||||||||||||||||
2007 Apr 21 - 2007 May 14 (?) Confirmed Eruption (Explosive / Effusive) VEI: 2
| Episode 1 | Eruption (Explosive / Effusive) | |||||||||||||||||||||||||||||
|---|---|---|---|---|---|---|---|---|---|---|---|---|---|---|---|---|---|---|---|---|---|---|---|---|---|---|---|---|---|
| 2007 Apr 21 - 2007 May 14 (?) | Evidence from Observations: Reported | ||||||||||||||||||||||||||||
|
List of 4 Events for Episode 1
|
|||||||||||||||||||||||||||||
2005 Oct 27 (?) - 2006 Aug 1 (?) Confirmed Eruption (Explosive / Effusive) VEI: 2
| Episode 1 | Eruption (Explosive / Effusive) | |||||||||||||||||||||||||||||
|---|---|---|---|---|---|---|---|---|---|---|---|---|---|---|---|---|---|---|---|---|---|---|---|---|---|---|---|---|---|
| 2005 Oct 27 (?) - 2006 Aug 1 (?) | Evidence from Observations: Reported | ||||||||||||||||||||||||||||
|
List of 4 Events for Episode 1
|
|||||||||||||||||||||||||||||
2005 Jan 30 - 2005 Mar 31 (?) Confirmed Eruption (Explosive / Effusive) VEI: 2
| Episode 1 | Eruption (Explosive / Effusive) | ||||||||||||||||||||||||
|---|---|---|---|---|---|---|---|---|---|---|---|---|---|---|---|---|---|---|---|---|---|---|---|---|
| 2005 Jan 30 - 2005 Mar 31 (?) | Evidence from Observations: Reported | |||||||||||||||||||||||
|
List of 3 Events for Episode 1
|
||||||||||||||||||||||||
2004 Sep 16 ± 15 days - 2004 Sep 16 ± 15 days Confirmed Eruption (Explosive / Effusive) VEI: 2
| Episode 1 | Eruption (Explosive / Effusive) | ||||||||||||||||||||||||
|---|---|---|---|---|---|---|---|---|---|---|---|---|---|---|---|---|---|---|---|---|---|---|---|---|
| 2004 Sep 16 ± 15 days - 2004 Sep 16 ± 15 days | Evidence from Observations: Reported | |||||||||||||||||||||||
|
List of 3 Events for Episode 1
|
||||||||||||||||||||||||
2003 Jun 8 - 2003 Jun 16 (?) Confirmed Eruption (Explosive / Effusive) VEI: 3
| Episode 1 | Eruption (Explosive / Effusive) | |||||||||||||||||||||||||||||
|---|---|---|---|---|---|---|---|---|---|---|---|---|---|---|---|---|---|---|---|---|---|---|---|---|---|---|---|---|---|
| 2003 Jun 8 - 2003 Jun 16 (?) | Evidence from Observations: Reported | ||||||||||||||||||||||||||||
|
List of 4 Events for Episode 1
|
|||||||||||||||||||||||||||||
2001 Jun 8 - 2001 Jun 19 (on or after) Confirmed Eruption (Explosive / Effusive) VEI: 3
| Episode 1 | Eruption (Explosive / Effusive) | NW flank (200-400 m) | ||||||||||||||||||||||||||||||||||||||||||||||||
|---|---|---|---|---|---|---|---|---|---|---|---|---|---|---|---|---|---|---|---|---|---|---|---|---|---|---|---|---|---|---|---|---|---|---|---|---|---|---|---|---|---|---|---|---|---|---|---|---|---|
| 2001 Jun 8 - 2001 Jun 19 (on or after) | Evidence from Observations: Reported | ||||||||||||||||||||||||||||||||||||||||||||||||
|
List of 8 Events for Episode 1 at NW flank (200-400 m)
|
|||||||||||||||||||||||||||||||||||||||||||||||||
1998 Jul 16 ± 15 days - 2000 Apr 25 (?) Confirmed Eruption (Explosive / Effusive) VEI: 3
| Episode 1 | Eruption (Explosive / Effusive) | 1963 crater (NW flank 1000 m) | ||||||||||||||||||||||||||||||||||||||
|---|---|---|---|---|---|---|---|---|---|---|---|---|---|---|---|---|---|---|---|---|---|---|---|---|---|---|---|---|---|---|---|---|---|---|---|---|---|---|---|
| 1998 Jul 16 ± 15 days - 2000 Apr 25 (?) | Evidence from Observations: Reported | ||||||||||||||||||||||||||||||||||||||
|
List of 6 Events for Episode 1 at 1963 crater (NW flank 1000 m)
|
|||||||||||||||||||||||||||||||||||||||
1982 Oct 24 - 1982 Oct 25 Confirmed Eruption (Explosive / Effusive) VEI: 2
| Episode 1 | Eruption (Explosive / Effusive) | |||||||||||||||||||||||||||||
|---|---|---|---|---|---|---|---|---|---|---|---|---|---|---|---|---|---|---|---|---|---|---|---|---|---|---|---|---|---|
| 1982 Oct 24 - 1982 Oct 25 | Evidence from Observations: Reported | ||||||||||||||||||||||||||||
|
List of 4 Events for Episode 1
|
|||||||||||||||||||||||||||||
1980 Apr 15 - 1980 Aug 20 Confirmed Eruption (Explosive / Effusive) VEI: 3
| Episode 1 | Eruption (Explosive / Effusive) | Summit, NW and SE flanks | ||||||||||||||||||||||||||||
|---|---|---|---|---|---|---|---|---|---|---|---|---|---|---|---|---|---|---|---|---|---|---|---|---|---|---|---|---|---|
| 1980 Apr 15 - 1980 Aug 20 | Evidence from Observations: Reported | ||||||||||||||||||||||||||||
|
List of 4 Events for Episode 1 at Summit, NW and SE flanks
|
|||||||||||||||||||||||||||||
1979 Jul 2 - 1979 Sep 12 Confirmed Eruption (Explosive / Effusive) VEI: 2
| Episode 1 | Eruption (Explosive / Effusive) | NW flank | |||||||||||||||||||||||
|---|---|---|---|---|---|---|---|---|---|---|---|---|---|---|---|---|---|---|---|---|---|---|---|---|
| 1979 Jul 2 - 1979 Sep 12 | Evidence from Observations: Reported | |||||||||||||||||||||||
|
List of 3 Events for Episode 1 at NW flank
|
||||||||||||||||||||||||
1978 Nov 22 - 1979 Mar 16 ± 15 days Confirmed Eruption (Explosive / Effusive) VEI: 2
| Episode 1 | Eruption (Explosive / Effusive) | Summit and NW flank | ||||||||||||||||||||||||||||||||||||||
|---|---|---|---|---|---|---|---|---|---|---|---|---|---|---|---|---|---|---|---|---|---|---|---|---|---|---|---|---|---|---|---|---|---|---|---|---|---|---|---|
| 1978 Nov 22 - 1979 Mar 16 ± 15 days | Evidence from Observations: Reported | ||||||||||||||||||||||||||||||||||||||
|
List of 6 Events for Episode 1 at Summit and NW flank
|
|||||||||||||||||||||||||||||||||||||||
1976 May 1 - 1976 Sep 5 Confirmed Eruption (Explosive / Effusive) VEI: 1
| Episode 1 | Eruption (Explosive / Effusive) | ||||||||||||||||||||||||
|---|---|---|---|---|---|---|---|---|---|---|---|---|---|---|---|---|---|---|---|---|---|---|---|---|
| 1976 May 1 - 1976 Sep 5 | Evidence from Observations: Reported | |||||||||||||||||||||||
|
List of 3 Events for Episode 1
|
||||||||||||||||||||||||
1975 Mar 6 ± 3 days - 1975 Jun 23 Confirmed Eruption (Explosive / Effusive) VEI: 2
| Episode 1 | Eruption (Explosive / Effusive) | Summit and NW flank | |||||||||||||||||||||||
|---|---|---|---|---|---|---|---|---|---|---|---|---|---|---|---|---|---|---|---|---|---|---|---|---|
| 1975 Mar 6 ± 3 days - 1975 Jun 23 | Evidence from Observations: Reported | |||||||||||||||||||||||
|
List of 3 Events for Episode 1 at Summit and NW flank
|
||||||||||||||||||||||||
1974 Jan 16 ± 15 days - 1974 Oct 7 Confirmed Eruption (Explosive / Effusive) VEI: 2
| Episode 1 | Eruption (Explosive / Effusive) | Summit and NW flank | |||||||||||||||||||||||
|---|---|---|---|---|---|---|---|---|---|---|---|---|---|---|---|---|---|---|---|---|---|---|---|---|
| 1974 Jan 16 ± 15 days - 1974 Oct 7 | Evidence from Observations: Reported | |||||||||||||||||||||||
|
List of 3 Events for Episode 1 at Summit and NW flank
|
||||||||||||||||||||||||
1970 May 9 - 1972 Aug 7 Confirmed Eruption (Explosive / Effusive) VEI: 2
| Episode 1 | Eruption (Explosive / Effusive) | Summit, NW and east flanks | ||||||||||||||||||||||||||||||||||||||||||||||||
|---|---|---|---|---|---|---|---|---|---|---|---|---|---|---|---|---|---|---|---|---|---|---|---|---|---|---|---|---|---|---|---|---|---|---|---|---|---|---|---|---|---|---|---|---|---|---|---|---|---|
| 1970 May 9 - 1972 Aug 7 | Evidence from Observations: Reported | ||||||||||||||||||||||||||||||||||||||||||||||||
|
List of 8 Events for Episode 1 at Summit, NW and east flanks
|
|||||||||||||||||||||||||||||||||||||||||||||||||
1967 Jan 27 - 1969 Mar 31 Confirmed Eruption (Explosive / Effusive) VEI: 3
| Episode 1 | Eruption (Explosive / Effusive) | Summit and NW flank | ||||||||||||||||||||||||||||||||||||||||||||||||
|---|---|---|---|---|---|---|---|---|---|---|---|---|---|---|---|---|---|---|---|---|---|---|---|---|---|---|---|---|---|---|---|---|---|---|---|---|---|---|---|---|---|---|---|---|---|---|---|---|---|
| 1967 Jan 27 - 1969 Mar 31 | Evidence from Observations: Reported | ||||||||||||||||||||||||||||||||||||||||||||||||
|
List of 8 Events for Episode 1 at Summit and NW flank
|
|||||||||||||||||||||||||||||||||||||||||||||||||
1963 Jul 7 - 1965 Jul 2 ± 182 days Confirmed Eruption (Explosive / Effusive) VEI: 3
| Episode 1 | Eruption (Explosive / Effusive) | Summit, NW, north, east and SE flanks | ||||||||||||||||||||||||||||||||||||||||||||||||||||||||||||||||||||||||||||||
|---|---|---|---|---|---|---|---|---|---|---|---|---|---|---|---|---|---|---|---|---|---|---|---|---|---|---|---|---|---|---|---|---|---|---|---|---|---|---|---|---|---|---|---|---|---|---|---|---|---|---|---|---|---|---|---|---|---|---|---|---|---|---|---|---|---|---|---|---|---|---|---|---|---|---|---|---|---|---|---|
| 1963 Jul 7 - 1965 Jul 2 ± 182 days | Evidence from Observations: Reported | ||||||||||||||||||||||||||||||||||||||||||||||||||||||||||||||||||||||||||||||
|
List of 14 Events for Episode 1 at Summit, NW, north, east and SE flanks
|
|||||||||||||||||||||||||||||||||||||||||||||||||||||||||||||||||||||||||||||||
1962 Jul 16 ± 15 days - 1962 Jul 16 (?) ± 15 days Confirmed Eruption (Explosive / Effusive) VEI: 0
| Episode 1 | Eruption (Explosive / Effusive) | NW flank | ||||||||||||||||||
|---|---|---|---|---|---|---|---|---|---|---|---|---|---|---|---|---|---|---|---|
| 1962 Jul 16 ± 15 days - 1962 Jul 16 (?) ± 15 days | Evidence from Observations: Reported | ||||||||||||||||||
|
List of 2 Events for Episode 1 at NW flank
|
|||||||||||||||||||
1960 Jul 10 - 1960 Sep 16 ± 15 days Confirmed Eruption (Explosive / Effusive) VEI: 3
| Episode 1 | Eruption (Explosive / Effusive) | NW flank (640 m) | |||||||||||||||||||||||||||||||||||||||||||||||||||||||||||||||||||||||||
|---|---|---|---|---|---|---|---|---|---|---|---|---|---|---|---|---|---|---|---|---|---|---|---|---|---|---|---|---|---|---|---|---|---|---|---|---|---|---|---|---|---|---|---|---|---|---|---|---|---|---|---|---|---|---|---|---|---|---|---|---|---|---|---|---|---|---|---|---|---|---|---|---|---|---|
| 1960 Jul 10 - 1960 Sep 16 ± 15 days | Evidence from Observations: Reported | |||||||||||||||||||||||||||||||||||||||||||||||||||||||||||||||||||||||||
|
List of 13 Events for Episode 1 at NW flank (640 m)
|
||||||||||||||||||||||||||||||||||||||||||||||||||||||||||||||||||||||||||
1939 Nov 1 Confirmed Eruption (Explosive / Effusive) VEI: 2
| Episode 1 | Eruption (Explosive / Effusive) | NW and/or SW flanks | ||||||||||||||||||||||||||||||||||||||||||||||||
|---|---|---|---|---|---|---|---|---|---|---|---|---|---|---|---|---|---|---|---|---|---|---|---|---|---|---|---|---|---|---|---|---|---|---|---|---|---|---|---|---|---|---|---|---|---|---|---|---|---|
| 1939 Nov 1 - Unknown | Evidence from Observations: Reported | ||||||||||||||||||||||||||||||||||||||||||||||||
|
List of 8 Events for Episode 1 at NW and/or SW flanks
|
|||||||||||||||||||||||||||||||||||||||||||||||||
1939 Feb 2 Confirmed Eruption (Explosive / Effusive) VEI: 2
| Episode 1 | Eruption (Explosive / Effusive) | NW and SE flanks | ||||||||||||||||||||||||||||||||||||||
|---|---|---|---|---|---|---|---|---|---|---|---|---|---|---|---|---|---|---|---|---|---|---|---|---|---|---|---|---|---|---|---|---|---|---|---|---|---|---|---|
| 1939 Feb 2 - Unknown | Evidence from Observations: Reported | ||||||||||||||||||||||||||||||||||||||
|
List of 6 Events for Episode 1 at NW and SE flanks
|
|||||||||||||||||||||||||||||||||||||||
1933 Confirmed Eruption (Explosive / Effusive)
| Episode 1 | Eruption (Explosive / Effusive) | ||||
|---|---|---|---|---|
| 1933 - Unknown | Evidence from Observations: Reported | |||
1922 Jun 28 - 1922 Jul 1 Confirmed Eruption (Explosive / Effusive) VEI: 2
| Episode 1 | Eruption (Explosive / Effusive) | ||||||||||||||||||||||||
|---|---|---|---|---|---|---|---|---|---|---|---|---|---|---|---|---|---|---|---|---|---|---|---|---|
| 1922 Jun 28 - 1922 Jul 1 | Evidence from Observations: Reported | |||||||||||||||||||||||
|
List of 3 Events for Episode 1
|
||||||||||||||||||||||||
1908 Confirmed Eruption (Explosive / Effusive) VEI: 2
| Episode 1 | Eruption (Explosive / Effusive) | ||||||||||||||||||||||||
|---|---|---|---|---|---|---|---|---|---|---|---|---|---|---|---|---|---|---|---|---|---|---|---|---|
| 1908 - Unknown | Evidence from Observations: Reported | |||||||||||||||||||||||
|
List of 3 Events for Episode 1
|
||||||||||||||||||||||||
1898 Jun 3 - 1898 Jul 24 (?) Confirmed Eruption (Explosive / Effusive) VEI: 2 (?)
| Episode 1 | Eruption (Explosive / Effusive) | |||||||||||||||||||||||||||||||||||||||||||||||||||||||||||
|---|---|---|---|---|---|---|---|---|---|---|---|---|---|---|---|---|---|---|---|---|---|---|---|---|---|---|---|---|---|---|---|---|---|---|---|---|---|---|---|---|---|---|---|---|---|---|---|---|---|---|---|---|---|---|---|---|---|---|---|
| 1898 Jun 3 - 1898 Jul 24 (?) | Evidence from Observations: Reported | ||||||||||||||||||||||||||||||||||||||||||||||||||||||||||
|
List of 10 Events for Episode 1
|
|||||||||||||||||||||||||||||||||||||||||||||||||||||||||||
1892 Oct - 1893 Confirmed Eruption (Explosive / Effusive) VEI: 2 (?)
| Episode 1 | Eruption (Explosive / Effusive) | ||||||||||||||||||||||||
|---|---|---|---|---|---|---|---|---|---|---|---|---|---|---|---|---|---|---|---|---|---|---|---|---|
| 1892 Oct - 1893 | Evidence from Observations: Reported | |||||||||||||||||||||||
|
List of 3 Events for Episode 1
|
||||||||||||||||||||||||
1883 - 1884 Confirmed Eruption (Explosive / Effusive)
| Episode 1 | Eruption (Explosive / Effusive) | ||||
|---|---|---|---|---|
| 1883 - 1884 | Evidence from Observations: Reported | |||
1874 Confirmed Eruption (Explosive / Effusive) VEI: 2
| Episode 1 | Eruption (Explosive / Effusive) | ||||||||||||||
|---|---|---|---|---|---|---|---|---|---|---|---|---|---|---|
| 1874 - Unknown | Evidence from Observations: Reported | |||||||||||||
|
List of 1 Events for Episode 1
|
||||||||||||||
1864 Jun 9 Confirmed Eruption (Explosive / Effusive) VEI: 3
| Episode 1 | Eruption (Explosive / Effusive) | ||||||||||||||||||||||||
|---|---|---|---|---|---|---|---|---|---|---|---|---|---|---|---|---|---|---|---|---|---|---|---|---|
| 1864 Jun 9 - Unknown | Evidence from Observations: Reported | |||||||||||||||||||||||
|
List of 3 Events for Episode 1
|
||||||||||||||||||||||||
1863 Confirmed Eruption (Explosive / Effusive) VEI: 2
| Episode 1 | Eruption (Explosive / Effusive) | ||||||||||||||||||||||||
|---|---|---|---|---|---|---|---|---|---|---|---|---|---|---|---|---|---|---|---|---|---|---|---|---|
| 1863 - Unknown | Evidence from Observations: Reported | |||||||||||||||||||||||
|
List of 3 Events for Episode 1
|
||||||||||||||||||||||||
This compilation of synonyms and subsidiary features may not be comprehensive. Features are organized into four major categories: Cones, Craters, Domes, and Thermal Features. Synonyms of features appear indented below the primary name. In some cases additional feature type, elevation, or location details are provided.
Synonyms |
| Vanei Vollohulu |
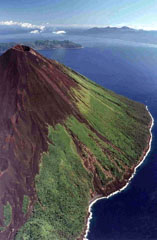 The Lopevi SE-flank eruptive fissure in May 1995 is visible in this photo. The small 7-km-wide island is frequently active with both summit and flank vents, primarily on the NW and SE sides, producing moderate explosive eruptions and lava flows that reach the coast. Historical eruptions date back to the mid-19th century. Paama Island (left) and Ambrym Island (right) are in the background to the north.
 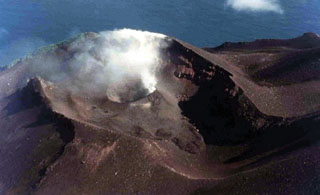 A plume is emitted from the active crater on the NW flank of Lopevi volcano in January 1999, six months after eruptive activity resumed in July 1998. The eruption took place within the elongated 1963 crater on the upper NW flank. A small lava flow erupted in December 1998 from the smaller cone onto the crater floor to the SE.
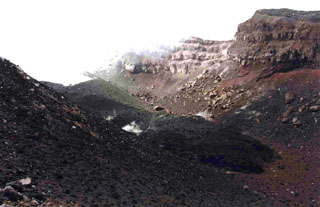 The dark lava flow lobe extending diagonally across the 1963 crater floor from the upper left is the December 1998 Lopevi intracrater lava flow (seen from the SE) after eruptive activity had resumed. The flow, ~100 m long and 10 m wide, originated from the small cone seen steaming at the upper left.
 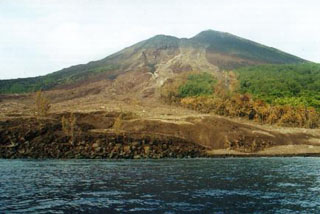 Charred vegetation marks the path of a pyroclastic flow on the SW flank of Lopevi on 19 February 2000. This view, taken 4 days later, shows part of the new 300-m-wide delta where the pyroclastic flow reached the sea. This was part of an ongoing eruption that began in July 1998. Intermittent explosive eruptions took place from the main 1963 crater (just NW of the central crater) and a small lava flow traveled 100 m within the crater.
 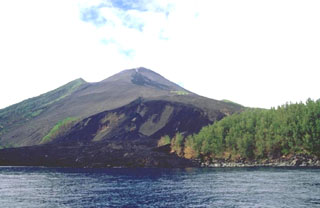 Lava flows erupted in 2000 from vents on the lower NW flank of Lopevi volcano and flowed into the sea. Many historical eruptions have occurred along the same NW-SE-trending fissure that cuts across the island, and the lava flows along this fissure near the summit also erupted in 2000.
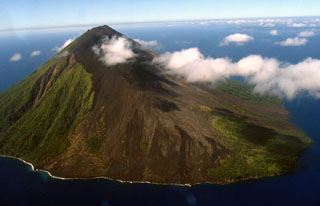 Lopevi is seen here in an aerial view from the NW, with lava flows that erupted from NW-SE-trending fissures forming the barren slopes in the foreground. The small 7-km-wide island is known locally as Vanei Vollohulu. Historical eruptions date back to the mid-19th century. The island was evacuated following major eruptions in 1939 and 1960.
 There are no samples for Lopevi in the Smithsonian's NMNH Department of Mineral Sciences Rock and Ore collection.
| Copernicus Browser | The Copernicus Browser replaced the Sentinel Hub Playground browser in 2023, to provide access to Earth observation archives from the Copernicus Data Space Ecosystem, the main distribution platform for data from the EU Copernicus missions. |
| MIROVA | Middle InfraRed Observation of Volcanic Activity (MIROVA) is a near real time volcanic hot-spot detection system based on the analysis of MODIS (Moderate Resolution Imaging Spectroradiometer) data. In particular, MIROVA uses the Middle InfraRed Radiation (MIR), measured over target volcanoes, in order to detect, locate and measure the heat radiation sourced from volcanic activity. |
| MODVOLC Thermal Alerts | Using infrared satellite Moderate Resolution Imaging Spectroradiometer (MODIS) data, scientists at the Hawai'i Institute of Geophysics and Planetology, University of Hawai'i, developed an automated system called MODVOLC to map thermal hot-spots in near real time. For each MODIS image, the algorithm automatically scans each 1 km pixel within it to check for high-temperature hot-spots. When one is found the date, time, location, and intensity are recorded. MODIS looks at every square km of the Earth every 48 hours, once during the day and once during the night, and the presence of two MODIS sensors in space allows at least four hot-spot observations every two days. Each day updated global maps are compiled to display the locations of all hot spots detected in the previous 24 hours. There is a drop-down list with volcano names which allow users to 'zoom-in' and examine the distribution of hot-spots at a variety of spatial scales. |
|
WOVOdat
Single Volcano View Temporal Evolution of Unrest Side by Side Volcanoes |
WOVOdat is a database of volcanic unrest; instrumentally and visually recorded changes in seismicity, ground deformation, gas emission, and other parameters from their normal baselines. It is sponsored by the World Organization of Volcano Observatories (WOVO) and presently hosted at the Earth Observatory of Singapore.
GVMID Data on Volcano Monitoring Infrastructure The Global Volcano Monitoring Infrastructure Database GVMID, is aimed at documenting and improving capabilities of volcano monitoring from the ground and space. GVMID should provide a snapshot and baseline view of the techniques and instrumentation that are in place at various volcanoes, which can be use by volcano observatories as reference to setup new monitoring system or improving networks at a specific volcano. These data will allow identification of what monitoring gaps exist, which can be then targeted by remote sensing infrastructure and future instrument deployments. |
| Volcanic Hazard Maps | The IAVCEI Commission on Volcanic Hazards and Risk has a Volcanic Hazard Maps database designed to serve as a resource for hazard mappers (or other interested parties) to explore how common issues in hazard map development have been addressed at different volcanoes, in different countries, for different hazards, and for different intended audiences. In addition to the comprehensive, searchable Volcanic Hazard Maps Database, this website contains information about diversity of volcanic hazard maps, illustrated using examples from the database. This site is for educational purposes related to volcanic hazard maps. Hazard maps found on this website should not be used for emergency purposes. For the most recent, official hazard map for a particular volcano, please seek out the proper institutional authorities on the matter. |
| IRIS seismic stations/networks | Incorporated Research Institutions for Seismology (IRIS) Data Services map showing the location of seismic stations from all available networks (permanent or temporary) within a radius of 0.18° (about 20 km at mid-latitudes) from the given location of Lopevi. Users can customize a variety of filters and options in the left panel. Note that if there are no stations are known the map will default to show the entire world with a "No data matched request" error notice. |
| UNAVCO GPS/GNSS stations | Geodetic Data Services map from UNAVCO showing the location of GPS/GNSS stations from all available networks (permanent or temporary) within a radius of 20 km from the given location of Lopevi. Users can customize the data search based on station or network names, location, and time window. Requires Adobe Flash Player. |
| DECADE Data | The DECADE portal, still in the developmental stage, serves as an example of the proposed interoperability between The Smithsonian Institution's Global Volcanism Program, the Mapping Gas Emissions (MaGa) Database, and the EarthChem Geochemical Portal. The Deep Earth Carbon Degassing (DECADE) initiative seeks to use new and established technologies to determine accurate global fluxes of volcanic CO2 to the atmosphere, but installing CO2 monitoring networks on 20 of the world's 150 most actively degassing volcanoes. The group uses related laboratory-based studies (direct gas sampling and analysis, melt inclusions) to provide new data for direct degassing of deep earth carbon to the atmosphere. |
| Large Eruptions of Lopevi | Information about large Quaternary eruptions (VEI >= 4) is cataloged in the Large Magnitude Explosive Volcanic Eruptions (LaMEVE) database of the Volcano Global Risk Identification and Analysis Project (VOGRIPA). |
| EarthChem | EarthChem develops and maintains databases, software, and services that support the preservation, discovery, access and analysis of geochemical data, and facilitate their integration with the broad array of other available earth science parameters. EarthChem is operated by a joint team of disciplinary scientists, data scientists, data managers and information technology developers who are part of the NSF-funded data facility Integrated Earth Data Applications (IEDA). IEDA is a collaborative effort of EarthChem and the Marine Geoscience Data System (MGDS). |

