


The Alaska Volcano Observatory (AVO) reported that over the past several months Spurr had exhibited decreasing signs of volcanic unrest, including small earthquakes, gas emissions, melting ice, and surface changes. Ground deformation had not been detected since March 2025. The data suggested that movement of magma toward the surface, which began in early 2024, had stopped. At 1007 on 20 August the Volcano Alert Level was lowered to Normal (the lowest level on a four-level scale) and the Aviation Color Code was lowered to Green (the lowest level on a four-color scale).
Source: US Geological Survey Alaska Volcano Observatory (AVO)
Summit ice cauldron, debris flows through 2006; fumarolic activity continues
The 2004 unrest at Mount Spurr (BGVN 29:10) continued for nearly two years before the Alaska Volcano Observatory (AVO) lowered the Level of Concern Color Code from Yellow to Green (on a scale from Green to Yellow to Orange to Red) on 21 February 2006. During those two years, hydrothermal and fumarolic activity within the ice-filled summit crater resulted in the formation of a summit ice cauldron and emplacement of debris-flow deposits on the upper slopes of Spurr. The summit crater and cauldron remained active after most other signs of unrest had declined. This report discusses observations of the development of the unrest following November 2004 (activity prior to that time covered in BGVN 29:10).
A depression in the summit ice was observed in its early stages in June 2004 (figures 12 and 13). The subsidence became more pronounced, and was recognized as an ice cauldron on 2 August, following debris flows emplaced in late July (figure 14). The cauldron housed a lake, whose water was described by Neal and others (2005) and McGimsey and others (2008) as "dark battleship gray" and turquoise in color, respectively, likely due to dissolved sulfur compounds (figure 15).
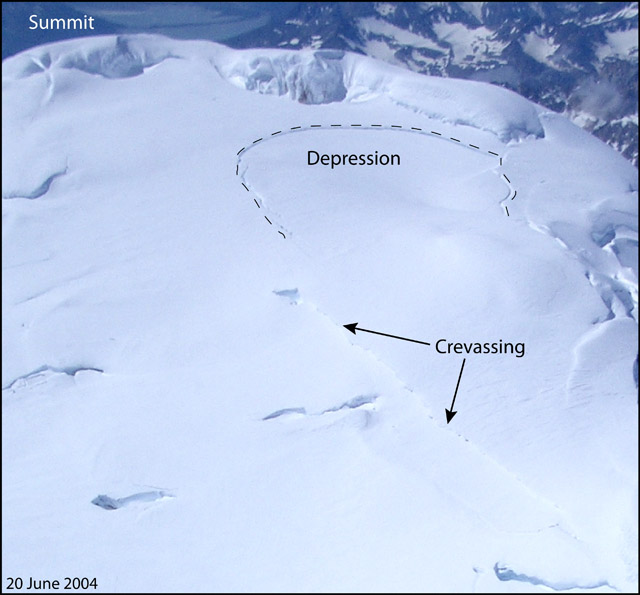 |
Figure 12. Photograph of Mount Spurr's summit (viewing SSW) on 20 June 2004, showing the initial development of a depression (dashed outline) in the ice and snow covering the summit. Crevassing of the snow and ice downslope is indicated by arrows. This is the earliest image of the 2004 development of the summit ice cauldron. Photograph courtesy of Bruce Hopper, Alaska Volcano Observatory (AVO). |
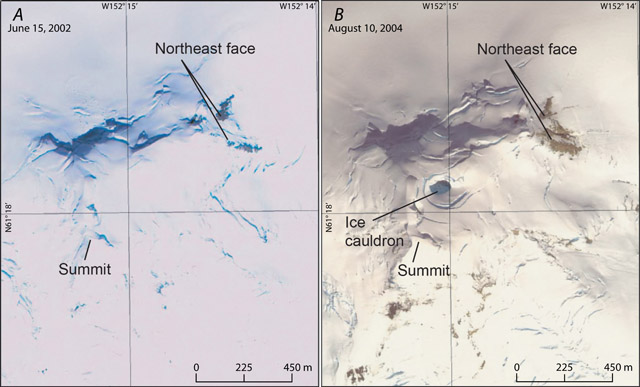 |
Figure 13. Satellite photography highlighting the 2004 development of Mount Spurr's summit ice cauldron, acquired on (A) 15 June 2002 and (B) 10 August 2004. Modified from Coombs and others (2005). |
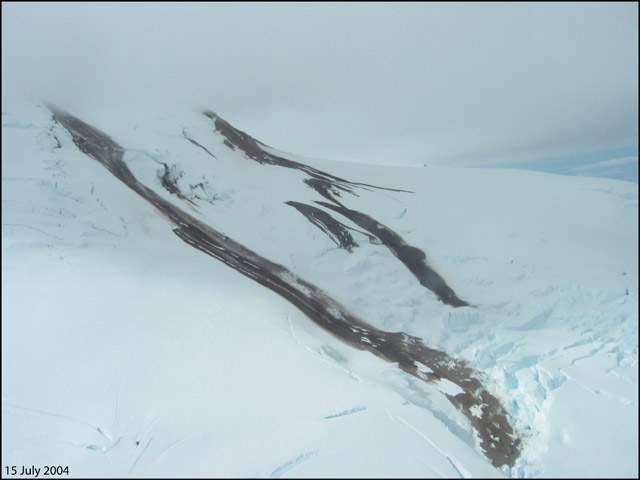 |
Figure 14. Debris flow deposits on the upper slopes of Mount Spurr, photographed on 15 July 2004, viewing NNW. The debris flow deposits prompted an observation flight, which resulted in the observation of the summit ice cauldron on 2 August. Courtesy of Christina Neal, Alaska Volcano Observatory (AVO). |
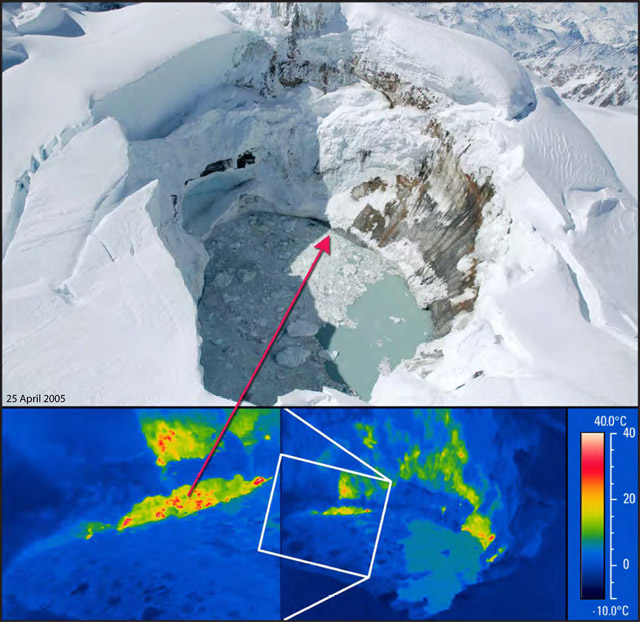 |
Figure 15. Aerial photograph and Forward Looking Infrared Radiometer (FLIR) images of Mount Spurr's summit ice cauldron and lake, taken on 25 April 2005. Hottest parts of the FLIR image correspond to the exposed bedrock on the shore of the lake (see temperature scale at right). The light blue gray color of the lake is likely due to dissolved sulfur compounds (Neal and others, 2005). Courtesy of McGimsey and others (2008). |
Ice cauldron widens. Neal and others (2005) reported that measurements made on 10 August and 30 October 2004 revealed enlargement of the ice cauldron from ~65 m x 95 m to ~130 m x 130 m in two and a half months' time. Gas measurements during the same time revealed that CO2 emissions had more than doubled (figure 16).
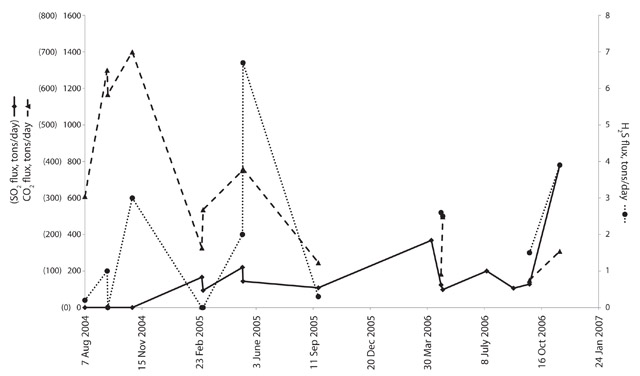 |
Figure 16. Measured gas emissions (tons/day) at Mount Spurr during the 2004-2006 active period. SO2 (in parentheses) and CO2 fluxes plotted on left axis; H2S flux plotted on right axis. Data courtesy of Doukas and McGee (2007). |
Forward Looking Infrared Radiometer (FLIR) measurements on 24 September showed that the crater lake was ~0 °C (substantially warmer than the surrounding ice and snow), and the surrounding exposed bedrock (and main fumarolic emission area) was as hot as ~39 °C (figure 15).
By the end of 2004, seismicity remained elevated, and most located earthquakes were within 0-5 km depth below sea level (figure 17; Neal and others 2005).
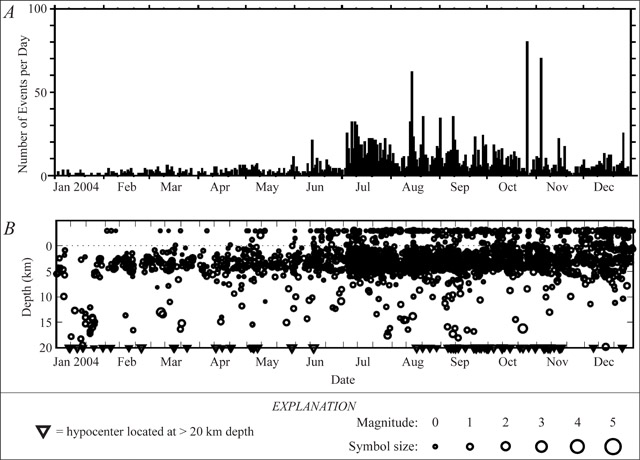 |
Figure 17. Earthquakes located beneath Mount Spurr during 2004 showed increased seismicity correlating to increased gas emissions and hydrothermal activity responsible for the formation of the summit ice cauldron. Plots show (A) number of earthquakes per day and (B) hypocenter depths below sea level. Symbol size indicates the relative magnitude of the earthquakes; triangles indicate located hypocenters at depths greater than 20 km. Courtesy of Neal and others (2005). |
During 2005, growth of the summit ice cauldron continued (figures 18 and 19), and areas of exposed bedrock increased along the N and NW walls of the crater. According to McGimsey and others (2008), FLIR measurements on 25 April 2005 showed similar temperatures to those measured in September 2004 (figure 15).
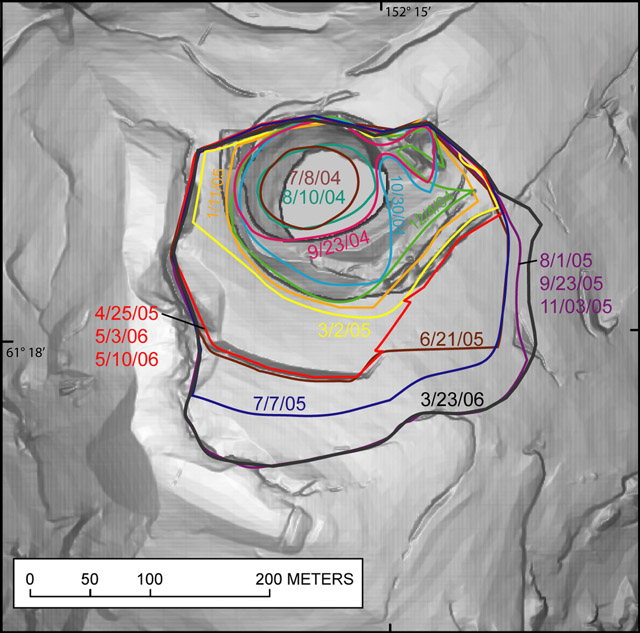 |
Figure 18. Mount Spurr's summit ice cauldron extent as it expanded during 2004-2006. Colored lines indicate the rim of the cauldron as measured on the dates indicated. Courtesy of Coombs and others (2006). |
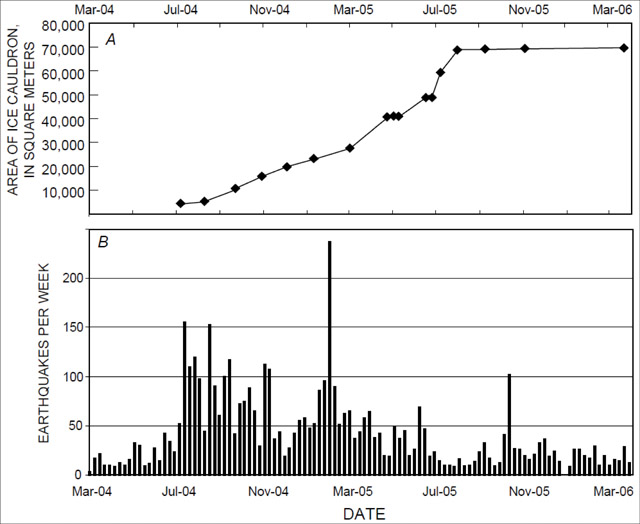 |
Figure 19. Two plots showing (A) the area of Mount Spurr's ice cauldron and (B) the number of earthquakes per week during March 2004-March 2006. Courtesy of Coombs and others (2006). |
May 2005 debris flow. A small debris flow was captured on webcam views of the summit on 2 May 2005 (figure 20). Observations a week later revealed that the cauldron lake level had dropped by ~15 m, and fumaroles on the N shore of the lake had been exposed (McGimsey and others, 2008). The fumaroles were described as vigorous by McGimsey and others (2008). FLIR measurements during an observation flight on 21 June indicated increasing temperatures of exposed bedrock within the crater (up to 60 °C; orange areas within the ice cauldron outline, figure 20) and observers noted strong upwelling within the N half of the cauldron lake.
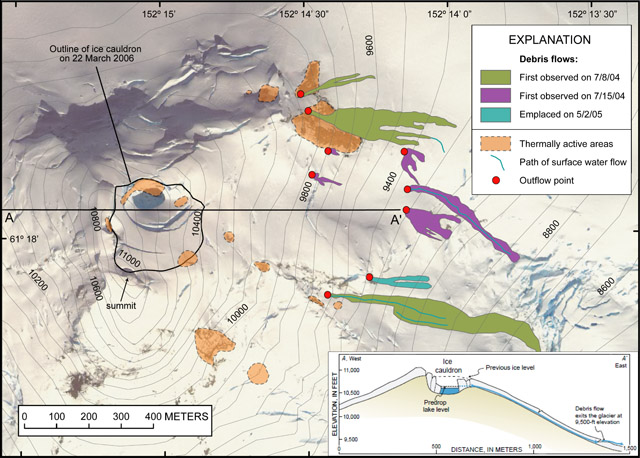 |
Figure 20. Map and interpretive cross-section highlighting the locations of debris flows emplaced onto the summit cone of Mount Spurr during 2004-2005. Dates of observation or emplacement of debris flows are provided in the explanation; associated outflow points are indicated by red dots. Orange areas indicate zones of elevated thermal activity and/or exposed bedrock. Schematic cross-section (bottom right) is along the line A-A', and indicates the probable pathway of debris-laden water from the cauldron lake to the outflow points of the debris flows. Base image from QuickBird satellite image, acquired 10 August 2004. Modified from Coombs and others (2006). |
The likely (or at least nearly) contemporaneous lake level drop and debris flow on 2 May were not associated with any significant ice collapse into the cauldron lake; Coombs and others (2006) thus concluded that the debris flows were the result of widening of englacial or subglacial pathways by erosion, heating, or glacial flow (cross-section, figure 20). They also interpreted the main source of the debris carried in the debris flows to be melted glacial ice containing layers of tephra and ash. The primary source of the tephra and ash layers was likely the 1992 eruptions of Crater Peak (Spurr's satellite cone and youngest vent) and possibly the 1989-90 eruptions of Mount Redoubt (Coombs and others, 2006). Some component of the debris was also likely sourced from the summit crater floor and wall rocks.
Snow/ice melts from summit crater. By 1 August 2005, the ice cauldron had reached its largest size (i.e. the snow/ice had melted from within the perimeter of the summit crater; figures 18 and 19), and was thus no longer termed the "ice cauldron", but simply the summit crater (McGimsey, personal communication, 2012). In September, the crater lake was observed to be completely ice-free, and most likely remained as such through mid January 2006. McGimsey and others (2008) reported that, as of 3 November 2005, ~5.4 x 10⁶ m3 of ice and snow had been melted and consumed by the summit lake.
Decreasing seismicity prompted the AVO to lower the Level of Concern Color Code from Yellow to Green on 21 February 2006. With the exception of an earthquake swarm during 11-12 April, seismicity continued to decrease, and reached background levels by May 2006. During the earthquake swarm, Neal and others (2009) reported 157 volcano-tectonic earthquakes (reaching M ~2.3) that occurred at less than 5 km depth below sea level and ~1-3 km W of the summit. FLIR measurements two days after the earthquake swarm revealed that fumaroles within the summit crater were as hot as 150 °C (Neal and others, 2009). By mid July, however, snow and ice had started accumulating on the lake's surface, and by 17 November 2006, a rise in the level of the lake was observed. As fumarolic activity continued, yellow, sulfur stained ice and snow, as well as a strong sulfur smell, was often reported by pilots passing the summit.
Since 2006, most of the sides and bottom of the summit crater have been covered by snow, with the exception of the fumarole field in the N part of the crater floor. As of the last observation flight, the fumarole field maintained a small patch of snow/ice free bedrock on the summit crater's floor, an area still active as of 28 August 2011 (figure 21). Later satellite imagery suggested that the fumarole field had been covered as the summit crater filled with snow and ice during the first part of the 2011-2012 winter (figure 22), but there have been no observation flights to confirm this as of 24 February 2012.
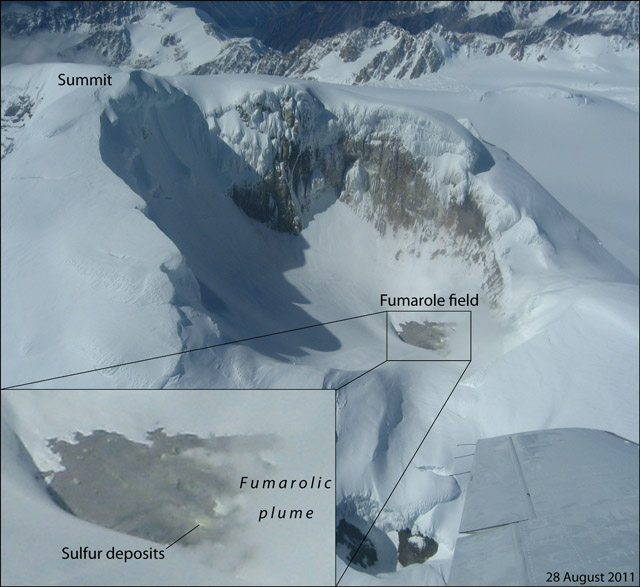 |
Figure 21. Aerial observation photograph of Mount Spurr's summit on 28 August 2011. Although the crater had begun refilling with snow, the fumarole field on the crater floor remained in a clear patch of bedrock. Photograph courtesy of Game McGimsey, Alaska Volcano Observatory (AVO). |
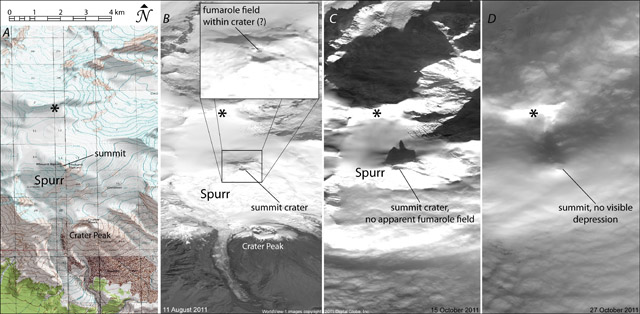 |
Figure 22. WorldView-1 daytime optical panchromatic imagery detailing the apparent filling of Mount Spurr's summit crater with snow and ice during the early 2011-2012 winter. (B) shows Spurr on 11 August 2011, with the fumarole field and area of exposed bedrock in the N of the summit crater (enlarged, inset). Snow appears white, and vegetation at the bottom of the image appears dark. (C) shows the same area on 15 October, with the fumarole field and exposed bedrock areas apparently covered by snow at the bottom of the summit crater. Vegetation is no longer visible at the bottom of the image. (D) shows the same area on 27 October, but the summit crater appears to be completely filled with snow, no longer exhibiting a depression. Topographic map of the same area is shown for reference (A). '*' symbol indicates a prominent topographic ridge to the N of Spurr that is visible in each image. Scale is approximate for the satellite imagery (B-D). Courtesy of Alaska Volcano Observatory (AVO) and Digital Globe, Inc. (B-D). |
Coombs and others (2006) stated that the overall effect of the hydrothermal activity (including water/debris flow releases from the summit) on the glacial system of Spurr were likely minimal, pointing out that the volume of water released was relatively small and probably easily accommodated "without significant modification of the icemass."
References. Coombs, M.L., Neal, C.A., Wessels, R.L., and McGimsey, R.G., 2006, Geothermal disruption of summit glaciers at Mount Spurr Volcano, 2004-6: An unusual manifestation of volcanic unrest: U.S. Geological Survey Professional Paper 1732-B, 33 p.
Doukas, M.P., and McGee, K.A., 2007, A compilation of gas emission-rate data from volcanoes of Cook Inlet (Spurr, Crater Peak, Redoubt, Iliamna, and Augustine) and Alaska Peninsula (Douglas, Fourpeaked, Griggs, Mageik, Martin, Peulik, Ukinrek, and Veniaminof), Alaska, from 1995-2006: U.S. Geological Survey Open-File Report 2007-1400, 16 p.
McGimsey, R.G., Neal, C.A., Dixon, J.P., and Ushakov, S., 2008, 2005 Volcanic activity in Alaska, Kamchatka, and the Kurile Islands: Summary of events and response of the Alaska Volcano Observatory: U.S. Geological Survey Scientific Investigations Report 2007-5269, 94 p.
Neal, C.A., McGimsey, R.G., Dixon, J.P., Manevich, A., and Rybin, A., 2009, 2006 Volcanic activity in Alaska, Kamchatka, and the Kurile Islands: Summary of events and response of the Alaska Volcano Observatory: U.S. Geological Survey Scientific Investigations Report 2008-5214, 102 p.
Neal, C.A., McGimsey, R.G., Dixon, J., and Melnikov, D., 2005, 2004 Volcanic activity in Alaska and Kamchatka: Summary of events and response of the Alaska Volcano Observatory: U.S. Geological Survey Open-File Report 2005-1308, 71 p.
Information Contacts: Bruce Hopper, Game McGimsey, and Christina Neal, Alaska Volcano Observatory (AVO), a cooperative program of a) U.S. Geological Survey (USGS), 4200 University Drive, Anchorage, AK 99508-4667 USA (URL: http://www.avo.alaska.edu/), b) Geophysical Institute, University of Alaska, PO Box 757320, Fairbanks, AK 99775-7320, USA, and c) Alaska Division of Geological & Geophysical Surveys (ADGGS), 794 University Ave., Suite 200, Fairbanks, AK 99709, USA (URL: http://www.dggs.alaska.gov/); Digital Globe, Inc. (URL: http://www.digitalglobe.com/).
2025: February
| March
| August
2024: May
| October
2012: June
2006: January
2005: January
| March
| April
| May
| August
| September
2004: July
| August
| September
| October
| November
| December
The Alaska Volcano Observatory (AVO) reported that over the past several months Spurr had exhibited decreasing signs of volcanic unrest, including small earthquakes, gas emissions, melting ice, and surface changes. Ground deformation had not been detected since March 2025. The data suggested that movement of magma toward the surface, which began in early 2024, had stopped. At 1007 on 20 August the Volcano Alert Level was lowered to Normal (the lowest level on a four-level scale) and the Aviation Color Code was lowered to Green (the lowest level on a four-color scale).
Source: US Geological Survey Alaska Volcano Observatory (AVO)
The Alaska Volcano Observatory (AVO) reported increasing unrest at Spurr in a special information statement issued on 12 March. Collapses of snow and ice into the summit crater lake that formed during the current period of unrest continued to occur along with steam emissions from fumaroles within and around the summit crater. New diffuse steam plumes from small snow-free spots within Crater Peak, a vent 3.5 km S of the summit, were first observed on 6 March. These locations have been sporadically snow-free for years, but steaming had not been observed since 2008. Significantly elevated volcanic gas emissions were measured during overflights on 7 and 11 March, when newly reactivated fumaroles at Crater Peak were also observed. About 450 tons per day (t/d) of sulfur dioxide at the summit crater was measured on 7 March, an increase from less than 50 t/d measured in December 2024. Notably high concentrations of carbon dioxide detected at Crater Peak are similar to values measured before other eruptions such as Redoubt in 2009. An average of 100 earthquakes per week were located during the past month; most were shallow, around 4 km below sea level, with the largest being M 2.7. Over 3,400 earthquakes had been located since April 2024. Ground deformation continued to be detected with a total of about 6.5 cm of inflation recorded at the closest Global Navigation Satellite System (GNSS) station. Modeling of the data suggested that the source was located 3-5 km below sea level and 3-4 km W of the summit. Seismicity remained elevated during 13-18 March with numerous small, shallow volcanic earthquakes detected beneath the volcano. Weather clouds often obscured views, though the crater lake and a gas plume were visible on 15 March, and a small steam plume rising from the summit was observed in clear webcam and satellite images during 17-18 March.
The interpretation from AVO is that a magmatic intrusion has been underway for months, and the recent gas data suggests that a new pathway towards the Crater Peak vent has opened; Crater Peak erupted in 1953 and 1992 and the summit last erupted several thousand years ago. The Volcano Alert Level remained at Advisory (the second lowest level on a four-level scale) and the Aviation Color Code remained at Yellow (the second lowest level on a four-color scale).
Source: US Geological Survey Alaska Volcano Observatory (AVO)
On 28 February the Alaska Volcano Observatory (AVO) reported that ongoing unrest at Spurr was characterized by elevated seismicity and continuing deformation. Seismicity remained elevated, though had slightly decreased during the past few days. The seismic network recorded over 70 earthquakes with most located beneath the summit and some located beneath Crater Peak. Inflation continued at a similar rate that has been occurring since early 2024. Minor steam emissions were sometimes observed in webcam images. Weather clouds mostly obscured satellite and webcam views during 1-3 March. The Volcano Alert Level remained at Advisory (the second lowest level on a four-level scale) and the Aviation Color Code remained at Yellow (the second lowest level on a four-color scale).
Source: US Geological Survey Alaska Volcano Observatory (AVO)
In a special information statement on 6 February, the Alaska Volcano Observatory (AVO) reported that unrest at Spurr continued and was likely caused by new magma beneath the volcano. The nature of the unrest and the 10-month duration suggested that an eruption remained a possibility. The most likely vent location would be at Crater Peak, which erupted in 1953 and 1992; less likely would be the summit vent, which erupted several thousand years ago. The rate of earthquakes increased from an average of 30 per week during April into early October to a rate of 125 per week from early October to 6 February. More than 2,700 earthquakes were located during the unrest episode thus far and the largest was a M 2.9 that occurred on 2 January 2, 2025. Earthquakes were clustered at two depth ranges, 0-10 km and 12-22 km, beneath both the summit and Crater Peak, though there was a recent increase in the number of earthquakes under Crater Peak.
Increased seismicity was accompanied by around 6 cm of inflation detected by the Global Navigation Satellite System (GNSS) stations on the flanks and satellite data. Modeling indicated that the inflation source was located 3-5 km below sea level and 3-4 km W of the summit. A small lake appeared in the summer crater in the early part of the summer in 2024. The lake had grown to an area of about 5 acres. Active steaming from summit area fumaroles has not changed over the current period of unrest and is similar to observations from recent years. There were no significant surface changes at Crater Peak. Instruments aboard gas measurement flights on 23 June and 18 December 2024, and 7 February 2025, detected low levels of sulfur dioxide and carbon dioxide, similar to background levels measured in previous years. The Volcano Alert Level remained at Advisory (the second lowest level on a four-level scale) and the Aviation Color Code remained at Yellow (the second lowest level on a four-color scale).
Source: US Geological Survey Alaska Volcano Observatory (AVO)
The Alaska Volcano Observatory (AVO) reported that low-level unrest at Spurr was ongoing during 23-29 October. Several daily small earthquakes were recorded by the seismic network. No unusual activity was observed in mostly clear satellite or web camera data. Scientists visited Spurr on 24 October to perform pre-winter work including hardening the network and ensuring all systems were operational. During an overflight they observed vigorous steaming from the fumaroles in the summit crater and snow covering the vent at Crater Peak, a vent 3.5 km S of the summit. The Volcano Alert Level remained at Advisory (the second lowest level on a four-level scale) and the Aviation Color Code remained at Yellow (the second lowest level on a four-color scale).
Source: US Geological Survey Alaska Volcano Observatory (AVO)
The Alaska Volcano Observatory (AVO) reported that low-level unrest at Spurr was ongoing, characterized by elevated seismicity and deformation, and minor gas-and-steam emissions were visible in webcams. A small lake was present in the summit crater during 15 May to 15 June. The Volcano Alert Level was raised to Advisory (the second lowest level on a four-level scale) and the Aviation Color Code was raised to Yellow (the second lowest level on a four-color scale) at 1237 on 16 October.
Source: US Geological Survey Alaska Volcano Observatory (AVO)
The Alaska Volcano Observatory (AVO) reported that low-level unrest at Spurr was ongoing. An extended outage of the seismic network occurred during February-April; elevated seismicity was already occurring when the network returned on 3 April. The rate of about 20 earthquakes per week and their magnitudes did not significantly change through mid-October . Over 900 located earthquakes were clustered in two areas; the earthquakes in one cluster were located at depths of 0-10 km beneath the volcano and those in the second cluster were located at depths of 20-35 km beneath an area SE of Crater Peak vent. The largest earthquake, a M 2.4, was recorded on 6 October. Inflation began to be detected in March by Global Navigation Satellite System (GNSS) stations on the flanks and has continued at a steady rate. A total of 4 cm of uplift was recorded by the stations closest to the source of deformation. The deformation was also confirmed in satellite radar data. A small lake formed in the summit crater sometime between 15 May and 15 June. During a 23 June overflight scientists observed the lake and estimated that it was approximately 3,800 square meters in area. Gas measurements detected low levels of sulfur dioxide and carbon dioxide at levels similar to the background levels measured in previous years. The summit crater lake grew to around 5,670 square meters by 18 September, was blue-green in color, and partially covered by ice. Active steaming was visible from vents along and above the NE lake shore and crater wall, and from a pit in the ice on the NE crater rim and had not changed in vigor during the current period of unrest.
The observations suggested that a new batch of magma had been emplaced beneath the volcano, with preliminary models indicating an area of pressurization at 3-5 km depth and about 3-4 km W of Spur. AVO noted that the current increase in earthquake activity has some similarities to past episodes of increased earthquake activity at Spurr. These periods include August 1991 to June 1992 that preceded the 1992 eruptions and 2004 to 2006 when increased earthquake activity accompanied an episode of heating at the summit that melted a substantial portion of the ice cap. The Volcano Alert Level remained at Normal (the lowest level on a four-level scale) and the Aviation Color Code remained at Green (the lowest color on a four-color scale).
Source: US Geological Survey Alaska Volcano Observatory (AVO)
On 15 May AVO reported that elevated seismicity at Spurr was consistent with an intrusion of magma deep beneath the volcano. An extended outage of the seismic network occurred during February-April; elevated seismicity was already occurring when the network returned on 3 April. An average of four earthquakes per day were located after that time, with a maximum of 33 earthquakes detected on 26 April. They were typically smaller than M 1 and were located near the summit and as deep as 30 km below sea level. This activity represents an increase in earthquake rate and occurrence of deeper (>20 km) low-frequency earthquakes compared to recent years. Minor uplift of the ground surface at the volcano of about 1 cm was detected in local GPS data beginning in November 2023, which was a deviation from the long-term trend and may be related to the seismicity. Minor steaming from fumaroles in the summit crater area was sometimes visible; no notable changes to the ice-and-snow cover or gas-and-steam emissions were observed in association with these geophysical observations. A short observational flight was conducted on 14 May. The Volcano Alert Level remained at Normal (the lowest level on a four-level scale) and the Aviation Color Code remained at Green (the lowest color on a four-color scale).
Source: US Geological Survey Alaska Volcano Observatory (AVO)
AVO reported that a minor increase in seismicity at Spurr was detected at about 0500 on 25 June, lasted about 45 minutes, and was characterized by several discrete M1earthquakes. The signals recorded were consistent with seismic energy generated by an energetic flow of water, possibly indicating a glacial outburst flood on the lower S flank. The next day seismic levels had declined to near background and no additional flowage signals were observed.
Source: US Geological Survey Alaska Volcano Observatory (AVO)
Seismicity remained above background levels at Spurr during 30 December to 6 January. Clear satellite and web camera views of the volcano showed no unusual activity. Spurr remained at Concern Color Code Yellow.
Source: US Geological Survey Alaska Volcano Observatory (AVO)
Seismicity at Spurr during 16-23 September remained above background levels, but the overall rate continued to gradually decline. Preliminary data from a gas-sensing flight earlier in the week showed a substantial reduction in gas emissions compared to previous measurements taken in May 2005. The declining seismicity, reduced gas emission, and the changing summit-lake color (thought to reflect lower levels of acidity), all suggested a reduced level of volcanic activity. Minor steaming continued from the summit "melt pit" and occasionally from Crater Peak. Spurr remained at Concern Color Code Yellow.
Source: US Geological Survey Alaska Volcano Observatory (AVO)
During 9-16 September, seismicity at Spurr remained above background levels, but there were several indications that the level of unrest was declining. AVO reported that recent observations of the summit lake showed a change in the water color from slate gray to blue-green, which could be indicative of decreasing sulfur-dioxide gas emissions. In addition, there were no observations of the vigorous upwelling of gases that had been seen in the lake earlier this summer. The overall rate of seismicity gradually declined during the previous several months, further suggesting a reduced level of activity. Minor steaming continued from the summit "melt pit" and occasionally from Crater Peak. Spurr remained at Concern Color Code Yellow.
Source: US Geological Survey Alaska Volcano Observatory (AVO)
The level of seismic activity at Mt. Spurr decreased during the previous month, but remained above background levels during 5-12 August. Gas and heat emissions remained at elevated levels, and minor steaming continued from the summit "melt/collapse pit." Satellite imagery showed no indications that an eruption was imminent. Spurr remained at Concern Color Code Yellow.
Source: US Geological Survey Alaska Volcano Observatory (AVO)
Elevated levels of seismicity continue to be recorded during 6-13 May. The AVO webcam images showed small steam plumes during the early part of this week. A pilot report received on 9 May described a small steam plume reaching 60-100 m (200-300 feet) above the summit crater. The crater lake level continues to drop, exposing more areas of steaming rock in the crater walls. Continued heat flux is indicated by vigorously upwelling water in the melt pit lake, rapid melting of ice and snow that has fallen into the lake, and minor steaming from rock surfaces and smaller melt pits in the vicinity of the summit crater. Spurr remained at Concern Color Code Yellow.
Source: US Geological Survey Alaska Volcano Observatory (AVO)
An approximately 500-m-long debris flow emanating from the ice and snow ESE of the summit melt pit was seen from Anchorage and confirmed by an overflight on 2 May. This debris flow is similar in size and location to those observed in July 2004, just prior to first recognition of the summit melt pit. Clear views of the melt pit showed increased steam emanating from recently exposed rock around the lake, which coalesced to form a weak steam plume that rose above the rim of the melt pit. The lake level had decreased since 25 April, indicating outflow of water from the lake which may have coincided with emplacement of the recent debris flow. Spurr remained at Concern Color Code Yellow.
Source: US Geological Survey Alaska Volcano Observatory (AVO)
During 22-29 April, elevated levels of seismicity continued to be recorded at Spurr. Thermal imagery taken on 25 April revealed that temperatures in the summit melt-pit region were similar to those recorded in September 2004, with values as high as 40 degrees Celsius in scattered patches of exposed rock. The lake in the summit crater continued to be discolored, and there was a strong scent of sulfur in the area, indicating continued gas emission. The summit melt pit was estimated to be approximately 250 m in diameter, and it continued to widen as the summit snow pack collapsed into the lake. No unusual activity was observed in satellite or web camera images during the report week. Mt. Spurr remained at Concern Color Code Yellow.
Source: US Geological Survey Alaska Volcano Observatory (AVO)
Elevated levels of seismicity continued to be recorded at Mt. Spurr during 25 February to 4 March. No activity was observed in satellite and web-camera images. AVO staff observed that the "ice cauldron" at the volcano (a collapse feature in the ice possibly caused by increased volcanic heat) had continued to grow since its first sighting in August 2004. Continued heat flux was indicated by vigorously upwelling water in the "melt pit lake" (the nearly ice free lake at the bottom of the "ice cauldron"), rapid melting of ice and snow that had fallen into the melt pit lake, and minor steaming from rock surfaces and small melt pits in the vicinity of the summit dome and Crater Peak cone, 3 km S of Spurr's summit. According to AVO, both Spurr and Crater Peak were emitting volcanic gases, including carbon dioxide, sulfur dioxide, and hydrogen sulfide, which may be hazardous to recreational visitors. Mt. Spurr remained at Concern Color Code Yellow.
Source: US Geological Survey Alaska Volcano Observatory (AVO)
Elevated levels of seismicity continued to be recorded at Spurr during 8-14 January. Seismic event rates averaged six located earthquakes per day. No activity was observed in satellite and web camera images during 8-14 January.
Source: US Geological Survey Alaska Volcano Observatory (AVO)
Seismic unrest continued at Spurr during 1-7 January, with an average of 7 earthquakes recorded per day. No activity was observed in satellite or web camera images during 1-7 January. Spurr remained at Concern Color Code Yellow.
Source: US Geological Survey Alaska Volcano Observatory (AVO)
Seismic unrest continued at Spurr during 26-31 December, with an average of 5-6 earthquakes recorded per day. A distinct increase in seismicity occurred on 26 December when 25 earthquakes were recorded. Spurr remained at Concern Color Code Yellow.
Source: US Geological Survey Alaska Volcano Observatory (AVO)
Elevated levels of seismicity continued to be recorded at Mount Spurr. Seismicity rates have been relatively constant in the last week at roughly 5 locatable earthquakes per day. No unusual activity was observed in satellite or web camera images. Spurr remained at Concern Color Code Yellow.
Source: US Geological Survey Alaska Volcano Observatory (AVO)
Elevated levels of seismicity continued to be recorded at Spurr during 5-12 November. A period of slightly increased seismicity occurred between 6-8 November when as many as three shallow earthquakes per hour were recorded. Since then, the level of seismicity had declined to an average of six earthquakes per day. No unusual activity was observed in satellite or web camera images. Spurr remained at Concern Color Code Yellow.
Source: US Geological Survey Alaska Volcano Observatory (AVO)
Elevated levels of seismicity continued to be recorded at Spurr during 29 October to 2 November. An earthquake swarm on 4 November consisted of as many as 10 shallow earthquakes per hour during a 6- to 7-hour period. After that, the level of seismicity declined to an average of 0-2 earthquakes per hour. Airborne measurements of volcanic gas from the volcano on 29 and 30 October indicated no significant change in the amount of carbon dioxide or sulfur-bearing gases compared to previous measurements in September. No unusual activity was observed on satellite or web-camera images. Spurr remained at Concern Color Code Yellow.
Source: US Geological Survey Alaska Volcano Observatory (AVO)
Elevated levels of seismicity continued to be recorded at Spurr during 8-15 October. About 60 earthquakes were recorded within 30 km of the summit, with an average of about nine earthquakes per day. Spurr remained at Concern Color Code Yellow.
Source: US Geological Survey Alaska Volcano Observatory (AVO)
Elevated seismicity continued at Spurr during 17-24 September, with an average of ten earthquakes occurring within 30 km of the summit daily. The combined output of carbon dioxide from one vent at Crater Peak and one at Spurr was approximately 2,300 tons on 15 September, an increase from the approximately 760 tons/day measured during 7-8 August. AVO reported that the gray color of the lake at the bottom of the ice cauldron is typical of crater lakes containing dissolved sulfur dioxide. These observations further suggest that magma resides beneath the volcano. However, there were no indications that an eruption is imminent, and this type of activity does not always lead to an eruption. Spurr remained at Concern Color Code Yellow.
Source: US Geological Survey Alaska Volcano Observatory (AVO)
Elevated levels of seismicity continue to be recorded, but have not changed significantly from that observed in the past few weeks. During the week ending on 17 September there were about 85 earthquakes located within 30 km of the summit with an average of approximately 12 per day. Observations of the summit during AVO overflights showed no major changes. Spurr remained at Concern Color Code Yellow.
Source: US Geological Survey Alaska Volcano Observatory (AVO)
During 3-10 September, elevated levels of seismicity continued to be recorded at Spurr as has been the case for several weeks. About 90 earthquakes were recorded during the report period within 30 km of the summit, with about 13 occurring per day. Observations and photography during the week revealed that the ice pit located near the summit had enlarged substantially (currently about 150 m x 170 m), presumably as the roof of the meltwater basin continued to subside and collapse. Spurr remained at Concern Color Code Yellow.
Source: US Geological Survey Alaska Volcano Observatory (AVO)
Elevated levels of seismicity continued at Spurr during 27 August to 3 September and did not change significantly in comparison to the previous few weeks. During the report week, 101 earthquakes were recorded within 30 km of the summit, averaging ~14 per day. Although seismicity was greater than typical background levels, there were no signs that an eruption was imminent. Spurr remained at Concern Color Code Yellow.
Source: US Geological Survey Alaska Volcano Observatory (AVO)
Elevated levels of seismicity continued to be recorded at Spurr during 13-20 August. Seismicity reached a maximum of 70 earthquakes on 14 August, then declined to about 15 earthquakes per day the rest of the week. This was slightly higher than the level recorded during the previous weeks. Spurr remained at Concern Color Code Yellow.
Source: US Geological Survey Alaska Volcano Observatory (AVO)
Elevated levels of seismicity continued at Spurr during 6-17 August, as it has for several weeks. On 12 August a pilot reported ash in the Hayes River valley N of Spurr. However, AVO found no evidence of an eruption in seismic or satellite data, subsequent pilot reports, or from visual observations. Spurr remained at Concern Color Code Yellow.
Source: US Geological Survey Alaska Volcano Observatory (AVO)
Elevated levels of seismicity continued at Spurr during 30 July to 6 August, with about 10-20 earthquakes occurring daily beneath the summit. This level of activity had remained relatively constant for the last several weeks. AVO noted that although this represents a notable increase above background seismicity, there were no indications that an eruption was imminent.
Aerial observations of Spurr made by AVO staff during the report week indicated the presence of a circular collapse pit in the snow/ice cover, approximately 50 x 75 meters in diameter on the NE flank of the summit dome at an elevation of approximately 3,110 m a.s.l. The collapse pit appeared to contain standing water of indeterminable depth. Arc-shaped scarps and small translational slumps in the snow/ice cover around the summit dome also were observed. AVO noted that these features and the collapse pit may indicate an increase in heat flux through the summit dome that could be related to the intrusion of magma at depth. Photographs of Spurr's summit taken on 20 June 2004 did not show a collapse pit, but did indicate an arc-shaped scarp in the area where the present collapse pit has formed. Spurr remained at Concern Color Code Yellow.
Source: US Geological Survey Alaska Volcano Observatory (AVO)
According to AVO during 22-30 July elevated levels of seismicity continued to be recorded at Spurr, with approximately 10-20 earthquakes occurring daily beneath the summit. The level of activity had remained constant for the previous several weeks. Although this represented a notable increase over background seismicity levels, there was no indication that an eruption was imminent. AVO noted that this type of seismicity often will decline without producing an eruption. Spurr remained at Concern Color Code Yellow.
Sources: US Geological Survey Alaska Volcano Observatory (AVO); Reuters; Associated Press
AVO raised the Concern Color Code at Spurr from Green to Yellow on 26 July after an increase in seismicity was recorded beneath the volcano's summit. Some earthquakes were interpreted to reflect the beginning stages of volcanic unrest. AVO noted that there were no indications that an eruption was imminent and that this type of seismicity can decline without leading to an eruption.
Retrospective analysis suggested that the seismic increase began slowly, perhaps as early as February 2004. As of 26 July, the seismic network recorded 15-20 earthquakes daily. This rate was greater than any observed since the last eruptive period in 1992. All earthquakes were less than magnitude 1.5 and ranged in depth between 1 and 6 km below sea level. Relatively few earthquakes were located beneath the Crater Peak vent, the site of the 1953 and 1992 eruptions. On 11 July a pilot reported a strong sulfur smell from Spurr and a new area of steaming, but AVO scientists observed neither during an overflight on 15 July.
Source: US Geological Survey Alaska Volcano Observatory (AVO)
Reports are organized chronologically and indexed below by Month/Year (Publication Volume:Number), and include a one-line summary. Click on the index link or scroll down to read the reports.
Earthquake swarms but no indication of imminent eruption
In January-February 1992, seismic activity was at the highest levels since the start of monitoring in 1980, although there is no indication that an eruption is imminent. This activity followed a significant increase in August 1991, when earthquakes began to occur beneath Crater Peak, a region that had been almost quiescent since monitoring began (figures 1 and 2). During January-July 1991, within a 10-km radius of the volcano, an average of 2 earthquakes (M>0) were recorded every 10 days. This average increased to 7 earthquakes/10 days in August-November 1991, and again to 20 earthquakes/10 days in December 1991-February 1992. Most of the earthquakes had magnitudes <1 and depths <5 km. Since November 1991, the majority of the earthquakes have been centered beneath the main summit and Crater Peak, with a zone of lesser activity 5 km N of the main summit.
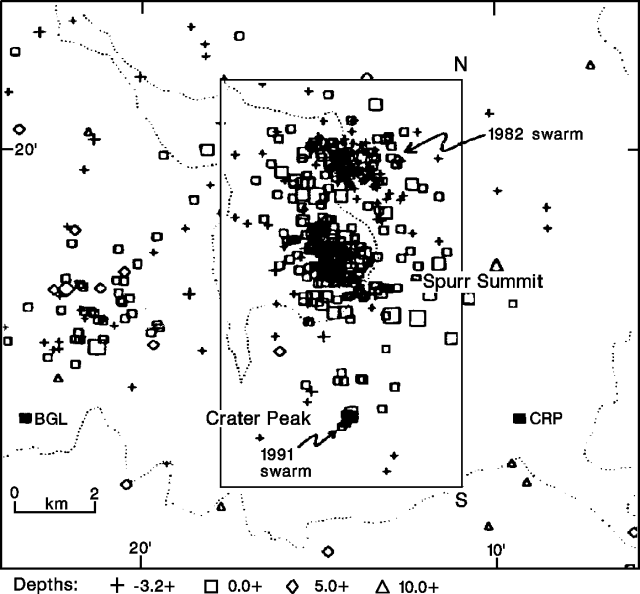 |
Figure 1. Map of earthquake epicenters near Spurr, 1981-August 1991. Filled rectangles labeled with 3-letter codes mark nearby seismic stations. Printed by permission of the Scientist-in-Charge, Alaska Volcano Observatory. |
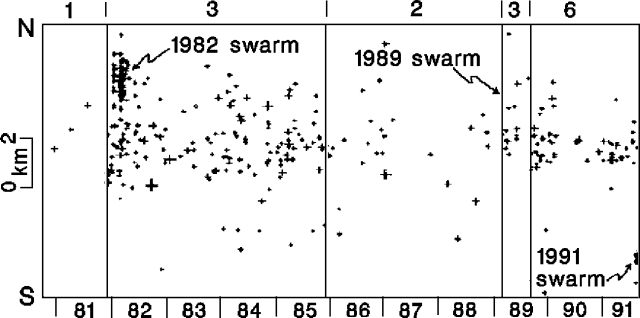 |
Figure 2. Time vs. distance plot of hypocenters at Spurr, 1981-August 1991. Distance is measured by projecting events on a N-S line in figure 1. The number of seismic stations operating in the Spurr area is shown along the top. Hypocenters for the 1989 swarm could not be determined as only two stations were operating at the time. Printed by permission of the Scientist-in-Charge, Alaska Volcano Observatory. |
Seismicity at Spurr has been characterized by large fluctuations in the number of events. Large earthquake swarms were recorded in early 1982 (>140 events recorded) and in early 1989 (not shown in figure 2), both centered 3 km N of the main summit. Normal seismicity has tended to concentrate beneath the main summit.
On 9 July 1953, a brief explosive eruption from Crater Peak produced a 21-km-high plume that dropped ash in Anchorage (120 km E). A mudflow blocked the Chakachatna River (S flank), forming a lake 8 km long.
Reference. Nye, C.J., and Turner, D.L., 1990, Petrology, geochemistry, and age of the Spurr Volcanic Complex, eastern Aleutian Arc: BV, v. 52, p. 205-226.
Information Contacts: AVO.
Ash eruption follows increased seismicity and thermal activity
Seismicity continued at abnormally high levels through early June. Much of the elevated seismicity since August 1991 has been concentrated beneath the main summit, and more recently beneath Crater Peak, 3 km S. The events occurred at 0-5 km depth. Most had magnitudes <1.0; maximum magnitude was 1.7. No long-period events have been recorded.
A localized increase in seismicity was recorded at about 0700 on 6 June, centered immediately beneath Crater Peak. The seismicity, different from previously recorded events, was characterized by bursts of 1-5-minute duration. These bursts of tremor-like activity were small, comparable to events that are often associated with hydrothermal activity at other volcanoes. Similar seismicity continued beneath Crater Peak in the succeeding weeks.
Geologists overflew Crater Peak on 8 June. Its small turquoise-colored crater lake (previously measured at 55°C), appeared darker than before and thermal upwelling was visible at the E end of the lake. Only a trace of SO2 was measured in the plume, similar to October 1991. During a visit on 11 June, the crater lake was dark gray, with a temperature of 50°C and a pH of 2.5. The large upwelling was still visible, as were a dozen smaller features, mostly near the E side of the lake. An increase in fumarolic activity was noted in the crater. One prominent fumarole in the talus cone N of the lake was gushing water, and periodically produced several 1-m-high geysers.
On 27 June, a series of explosive pulses produced a substantial ash plume. The eruption was preceded by increased seismicity, including a pair of tremor bursts lasting 2 1/2 hours each on 24 and 25 June, twice as long as any other episodes since they were first recorded on 6 June. An overflight on 26 June at about 1100 showed that the level of Crater Peak's lake had dropped, perhaps indicating increased heating. Continuous tremor began at 1204, and a swarm of volcano-tectonic earthquakes started at 0300 the next morning.
A moderate explosive eruption that began at 0704 on 27 June sent ash to about 8 km altitude. Additional seismic signals that may have indicated eruptive pulses were received at 0814 and 0904. Weather clouds obscured the volcano, limiting direct ground-based or satellite observations of the eruption, but the plume could be tracked as it spread N, away from populated areas. About 0.3 cm of sand-sized ash fell at Finger Lake, roughly 100 km N of the volcano. By late morning, satellite images showed that the plume extended 335 km at an azimuth of 005°, and had a maximum width of 75 km, about 200 km from the volcano. Pilot reports indicated that the top of the cloud was at about 9 km altitude. By midafternoon, the plume, heading 010°, was 670 km long and reached 200 km width 450 km from Spurr. Its base was reported at about 1500 m altitude from an aircraft roughly 400 km NNE of Spurr. After initially moving N, the plume turned toward the S and E, and had spread over western and central Canada by 29 June, when its narrow leading edge was over southern Lake Winnipeg, roughly 3500 km SE of the volcano. No new eruptions had been reported at press time, but a pilot saw a white cloud rising vertically from the volcano to 6-7.5 km altitude on 28 June at 0340. During an overflight early 29 June, the volcano was steaming, and debris and some incandescent material were present in and around the crater, but no major morphologic changes were evident. Mudflows and flooding associated with the eruption were apparently relatively minor.
Information Contacts: AVO; SAB, NOAA/NESDIS; AP.
Details of 27 June eruptive cloud
Increased seismicity preceded a brief eruption of Spurr that began on 27 June at 0704, producing an eruption cloud that was carried rapidly NNE. Seismic data suggested that the eruption ended at about 1100, after apparent eruptive pulses at 0814 and 0904. By 1049, shortly before feeding of the plume stopped, data from the Nimbus-7 satellite's TOMS showed its leading edge roughly 500 km from the volcano, near Fairbanks (figure 3), with an apparent SO2 content of 35 kilotons. The next day, the cloud was detached from the volcano but still clearly visible on weather satellite imagery, extending in a 2,000-km arc E and SE over NE Alaska and NW Canada (figures 3 and 4). As the plume elongated, SO2 detected by the TOMS instrument increased to a maximum of 185 kilotons on 28 June at 1125, then decreased slightly to 160 kilotons as it started to dissipate on 29 June. The cloud remained visible on both TOMS data and weather satellite imagery for several more days.
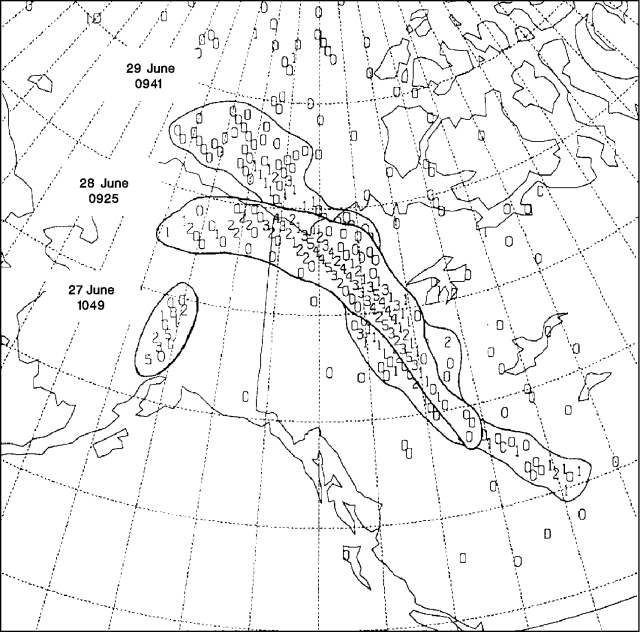 |
Figure 3. Three overlain images of the SO2 cloud from Spurr, as detected by the Total Ozone Mapping Spectrometer on the Nimbus-7 satellite. Values of SO2 in each 50 x 50-km pixel are shown on a relative scale of 0-9, then upward through alphabetic characters with increasing concentration. The cloud slowly dispersed until 3 July, when it could no longer be distinguished above background. Courtesy of Gregg Bluth. |
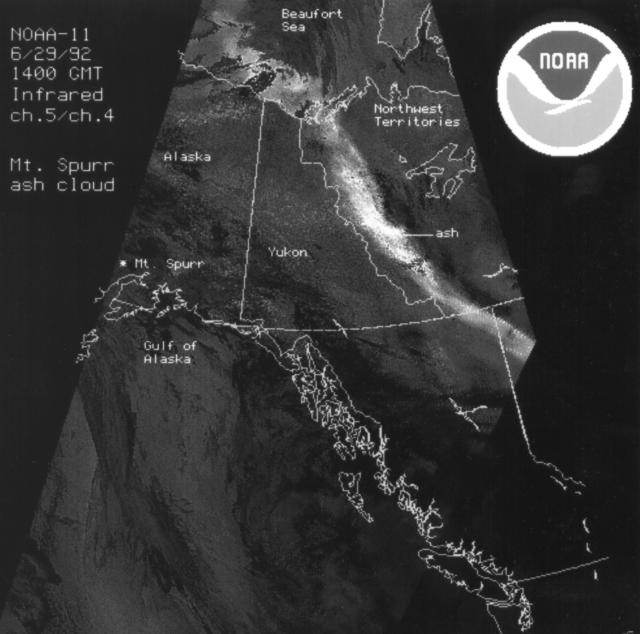 |
Figure 4. Image from the NOAA 11 polar-orbiting weather satellite on 29 June at about 0600, showing the plume from Spurr over the Beaufort Sea and western Canada. Courtesy of NOAA/NESDIS. |
The maximum eruption cloud altitude reported by pilots was about 12 km. However, radar installed on the Kenai Peninsula after the Redoubt eruption, to monitor nearby volcanic activity, measured higher altitudes. At 0803, radar detected a vertical cloud to about 9 km altitude; at 0840, strong returns to 9 km and some material to 14.5 km; at 0950 and 1004, columns to 16 km altitude; and at 1018, to 18 km (figure 5).
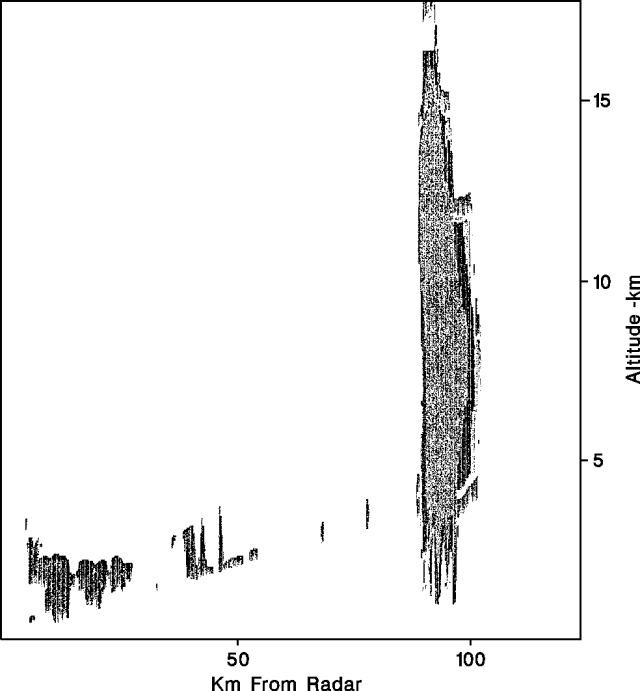 |
Figure 5. One of several radar images of the eruption column from Spurr on 27 June. This image, at 1018, shows echoes from the plume to about 18 km altitude. The instrument, an Enterprise Electronics WSR74C, 5-cm radar, is at Kenai, Alaska, about 80 km away. Vertical scans were used to maximize detection of the vertical cloud; the plume extending downwind is not visible. Courtesy of Joel Curtis and Dale Eubanks. |
Because the plume was carried northward, major air routes to Asia that extend along the Aleutian chain from Anchorage were not affected. A Notice to Airmen warned aircraft to avoid the immediate vicinity of the volcano. No routes were officially closed, but airlines avoided using routes N and NW of the volcano (J501, 111, 133, 120, and 122; and V319, 444, and 480) during the eruption. Flights arriving in Anchorage, 120 km E of Spurr, were routed along normal approaches from the south.
Information Contacts: AVO; G. Bluth, NASA GSFC; SAB, NOAA/NESDIS; Joel Curtis and Dale Eubanks, NWS Alaska Region, Anchorage; Darla Gerlach, Air Traffic Division, FAA, Anchorage.
Brief but vigorous explosive activity; large cloud causes widespread light ashfall
A brief explosive eruption of Spurr occurred on 18 August, with little or no apparent precursory seismicity. Preliminary data suggested that the 18 August activity was similar to somewhat stronger than the previous explosive episode, on 27 June. The 27 June ash had been carried N, away from nearby populated areas, but the 18 August ash fell on Anchorage, Alaska's largest city, 130 km E of Spurr, closing its international airport and forcing most of its residents indoors.
The eruption was first reported at 1548 by an airplane pilot who saw a dark cloud, probably an ash plume, breaking through weather clouds. About 8 minutes of seismicity at slightly above background preceded the pilot report. No lightning pulses, which often accompany ash eruptions, were detected, but there were additional pilot reports of ash during the next half-hour. Seismicity increased markedly at 1641, and by 1645, NOAA C-band radar had detected a plume to almost 11 km altitude. The National Weather Service released a SIGMET, warning pilots of the ash plume, at 1653.
AVO personnel overflew the volcano about an hour after strong activity began. Dark ash engulfed the entire S portion of the edifice, suggesting that the source of the tephra was in the general vicinity of Crater Peak, the S-flank vent at ~2,300 m elevation that was the source of the 27 June explosive episode. The summit area was clear, but AVO geologists filmed violently roiling, turbulent pulses of black ash ascending through the weather cloud deck at ~2,400 m altitude. Large ballistic fragments were being thrown to 300 m above the cloud deck, and white, lenticular shock-wave clouds ringed the vent area. S of Crater Peak, ash ascended from a light-colored pyroclastic avalanche that had descended to ~900 m elevation (above the Chakachatna river valley). No evidence of flooding was observed, but ash and weather clouds prevented low-altitude flights down the valley. Although lightning apparently was not triggered by the 27 June eruption, 171 lightning strikes were recorded by the AVO detection system in the 1-hour period beginning at 1841 on 18 August. Seismicity began to decline at about 2000, and seismic data suggested that the main phase of the eruption was over at 2020.
The axis of ashfall extended ESE (across Cook Inlet, along Turnagain Arm, and over Prince William Sound) (figure 6). Pilots reported ash to about 18 km altitude, but radar and satellite data suggested that it reached a maximum of about 13.5 km altitude. Ashfall began to diminish at the nearby Beluga Power Plant at 2100. About 0.15-0.3 cm of ash fell on Anchorage between 2000 and 2300; similar amounts were reported from Valdez (300 km E) and Cordova (350 km ESE), where ashfall started at about 0145 and was continuing 4 hours later. Anchorage International Airport was closed at about 2020 and remained closed for much of 19 August, as cleanup efforts were hampered by wind redistribution of the ash. Flights were also halted to and from Elmendorf Air Force Base and Merrill Field (both in the Anchorage area) and Kenai Municipal Airport. A Notice to Airmen announced temporary flight restrictions within 50 km of Spurr, and advised extreme caution downwind of the restricted area. No aircraft encounters with the ash cloud were reported. Health officials warned Anchorage residents, especially those with respiratory problems, to remain indoors during the ashfall.
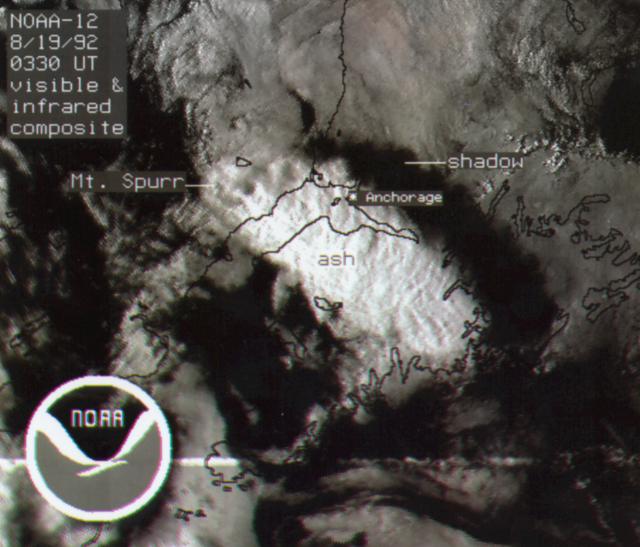 |
Figure 6. Visible/infrared composite image from the NOAA-12 polar-orbiting weather satellite on 18 August at 1930, less than 3 hours after the onset of Spurr's explosive eruption. The ash cloud is illuminated by the sun, and casts a shadow to the NE. Ashfall began at Anchorage about 30 minutes later. Courtesy of G. Stephens. |
Satellite images showed a large plume moving SE at roughly 70 km/hour after feeding from the volcano ended. By the early afternoon of 19 August, ash was observed at 9-10.5 km altitude from an aircraft near Juneau (about 1,000 km ESE of Spurr), and a diffuse ash layer was seen at 2-4.5 km. Very light ashfall was reported at Juneau. By 20 August, the plume had spread over Queen Charlotte Island and coastal British Columbia. Ash was seen at about 10 km altitude from an aircraft near the NW end of Vancouver Island, nearly 2000 km from Spurr. Early on 21 August, satellite imagery showed an arcuate NE-SW plume extending roughly 3500 km from about 55°N in central Saskatchewan across central Alberta, SW British Columbia, and into the Pacific Ocean, to about 38°N, 145°W, off the coast of N California.
Data from the Nimbus-7 satellite's Total Ozone Mapping Spectrometer showed a cloud about 2000 km long, covering an area of 370,000 km2 and containing about 240 kilotons of SO2, on 19 August at 0251 (figure 7). Maximum SO2 values from the 27 June eruption were 185 kilotons (BGVN 17:06).
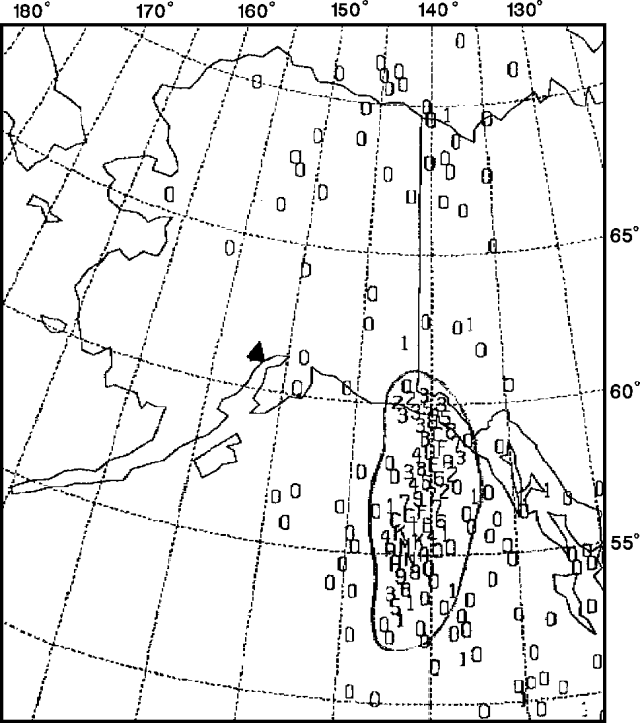 |
Figure 7. Image of the SO2 cloud from Spurr, as detected by the Nimbus-7 satellite's Total Ozone Mapping Spectrometer on 19 August at 0251, about 10 hours after the onset of strong activity. Values of SO2 in each 50 x 50-km pixel are shown on a relative scale of 0-9, then upward through alphabetic characters with increasing concentration. Spurr is marked with a solid triangle. Courtesy of Gregg Bluth. |
A steam plume containing a little ash rose about 2.5 km above the Crater Peak vent during an AVO overflight at 1145 on 19 August, and similar activity was observed by pilots during the afternoon. A swarm of about 12 volcanic earthquakes occurred between 1400 and 1415, and may have been associated with increased steaming. Seismic activity generally decreased slowly, but remained slightly above background during the night. The next day, AVO personnel observed a small steam plume rising less than 500 m above the Crater Peak vent, and minor steaming from the surface of a hot avalanche that had descended the SE flank. Seismicity continued to decline.
Information Contacts: AVO; G. Bluth, NASA GSFC; SAB, NOAA/NESDIS; G. Stephens, NOAA/NESDIS; N. Krull, FAA.
Third brief explosive episode ejects large cloud
An explosive eruption from the S flank's Crater Peak occurred during the night of 16-17 September. Significant deep seismicity followed by episodes of shallow tremor had prompted AVO to warn of renewed activity a week earlier. Little or no apparent precursory seismicity was associated with the most recent explosive episode on 18 August, but seismic activity began to increase 10 months before the initial explosion on 27 June.
AVO personnel visited Crater Peak vent on 16 September and detected no obvious increase in thermal activity or seismicity by late afternoon. Seismic activity began to build on stations near Spurr at about 1930, and another significant increase occurred at 2226. The eruption's first phase began at 2236, and one minute later, ash was seen at 4.5 km altitude from an aircraft. The initial activity lasted until 2252, when strong volcanic tremor declined. An hour of relative quiescence followed, although a pilot reported glow over the Crater Peak area and a dark plume moving NE at 2311. Another pilot report at 2345 indicated that the cloud had reached 10.5-12 km altitude, but it was not evident on National Weather Service (NWS) radar.
The second, more vigorous phase began suddenly at 0003. Seismicity continued to increase steadily, and between 0008 and 0018 the seismic station on the rim of Crater Peak was destroyed. NWS radar first detected the ash cloud at 0017, indicating a maximum altitude of 12 km by 0048 and 13.5-15 km by 0115 (figure 8). Eruption seismicity reached its maximum intensity at 0130, remaining constant until sporadic changes in amplitude began about 0215. At 0308, a M 2.0 earthquake occurred at 11 km depth and was followed by an abrupt decrease in tremor.
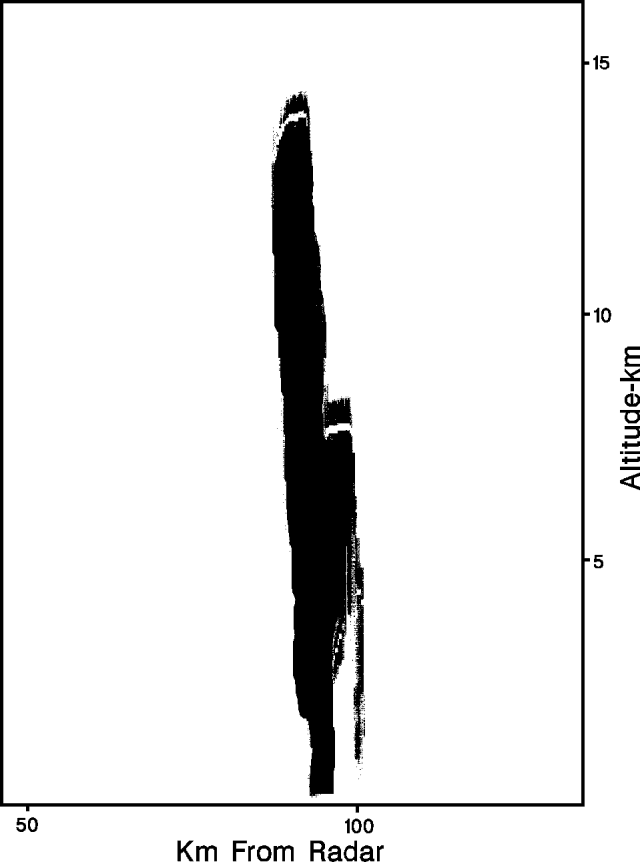 |
Figure 8. Radar image showing a vertical profile of the eruption column from Spurr on 17 September at 0226, 16 minutes after the map view in figure 9. The color version of the image shows varying radar reflectivities within the plume, densest at the core, lowest on the fringes. Declining reflectivity at the plume's center begins roughly 1 km from the top. Range-Height Indicator data are from the Enterprise Electronics WSR74C, 5-cm radar operated by the NWS at Kenai, Alaska, about 80 km from the volcano. Courtesy of Richard Hutcheon and Dale Eubanks. |
The plume moved ENE to NE of Spurr (figure 9) where ashfall was reported from communities out as far as Beaver Creek near the Canadian border, almost 600 km away. The ash was 3 mm thick in Willow (130 km NE) and formed two distinctly colored layers like those of the 18 August deposit. Effects in Anchorage were limited to a very fine dusting of ash and hazy conditions in parts of the city. Anchorage International Airport was not closed, but some flights were rerouted or cancelled during the night.
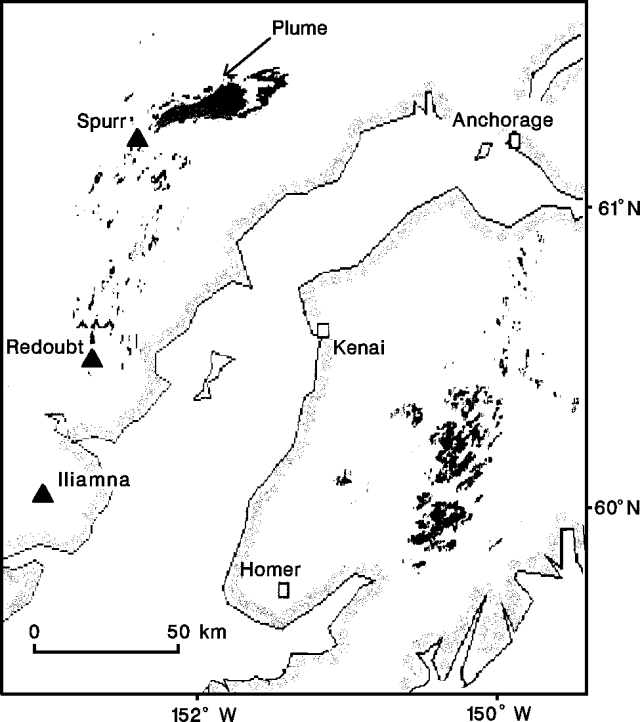 |
Figure 9. Radar image showing a map view of the Spurr plume on 17 September at 0210, about 15 minutes before the vertical profile in figure 8. Plan-Position Indicator data are from the Enterprise Electronics WSR74C, 5-cm radar operated by the NWS at Kenai, Alaska, about 80 km from the volcano. Courtesy of Richard Hutcheon and Dale Eubanks. |
An AVO helicopter overflight the next morning revealed that multiple, dark, lithic-rich mudflows had moved down the S flank of Crater Peak. The largest had reached the Chakachatna River 5 km from the vent. A temporary dam formed on the river, but was breached by 1000. Hot pyroclastic avalanches had traveled down the E side of the cone across the W arm of the Kidzageni Glacier, causing significant melting and erosion of the ice.
Vigorous steaming continued after the eruptive episode, producing a plume that reached 6 km altitude on the morning of 18 September. Volcanic tremor of variable amplitude persisted, declining more gradually than after the 27 June and 18 August episodes. Two earthquakes occurred at about 30 km depth during the night of 18-19 September. AVO noted that magma may remain at shallow depth, and a minor eruption could occur with little warning.
The TOMS on the Nimbus-7 satellite detected 190 kilotons of SO2 in a plume of about 290 km2 over the SW Yukon Territory, Canada, roughly 10.5 hours after the onset of strong activity (figure 10). Similar SO2 amounts were measured following the 27 June eruption. Revised maximum values for the 18 August cloud were about 50% larger, at roughly 300 kilotons. The leading edge of the S02 plume was about 1,400 km from the volcano on the initial TOMS image. A day later, the SO2 plume remained relatively compact and was centered over the Dakotas, roughly 3,500 km from Spurr. A more elongate plume was visible on satellite imagery. Airplane pilots reported ash NW of Regina, Saskatchewan (one layer about 600 m thick, centered at 9 km altitude, and a more intense layer to 11.5 km), near Calgary, Alberta (6.5-7.5 km), near Pierre, South Dakota (10-12.5 km), and later in the day near Mason City, Iowa (13 km), Chicago, and from Milwaukee to Windsor, Ontario (8 km). On 19 September, a 1500-km crescent-shaped zone of enhanced SO2 extended across eastern Canada from Lake Ontario to E of Hudson Bay, 4500-5000 km from Spurr. This zone corresponded very closely with the densest portion of the cloud on weather satellite imagery, which also showed a zone of more diffuse ash extending a few hundred kilometers beyond the densest material. Pilot reports indicated that the base of the cloud was at about 6 km altitude, and most aircraft were flying below that level to avoid it. Maximum reported elevations were about 10 km. The leading edge of the SO2 plume reached the W coast of Greenland 20 September, and a little SO2 was still evident over E Greenland on 21 September.
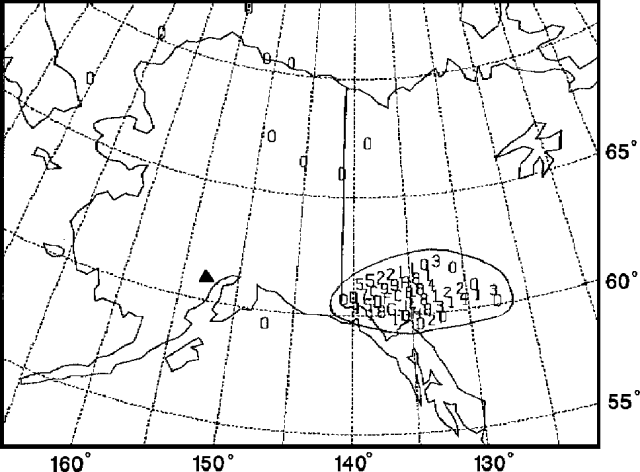 |
Figure 10. Image of the SO2 cloud from Spurr as detected by the Nimbus-7 satellite's Total Ozone Mapping Spectrometer on 17 September at 1047, about 10.5 hours after the onset of strong activity. Values of SO2 in each 50 x 50-km pixel are shown on a relative scale of 0-9, then upward through alphabetic characters with increasing concentration. Spurr is marked with a solid triangle. Courtesy of Gregg Bluth. |
Information Contacts: AVO; SAB, NOAA/NESDIS; G. Bluth, NASA GSFC; Richard Hutcheon and D. Eubanks, NWS, Anchorage.
Strong seismicity but no new eruptive episodes
No eruptive episodes have occurred from Spurr in the month following the explosive activity of 16-17 September. The cloud from that eruption was tracked by satellite as it moved across Canada and the northern United States (figure 11) and was frequently observed from aircraft. Vigorous seismicity was continuing in mid-October and geologists warned that another eruption could occur without additional seismic precursors.
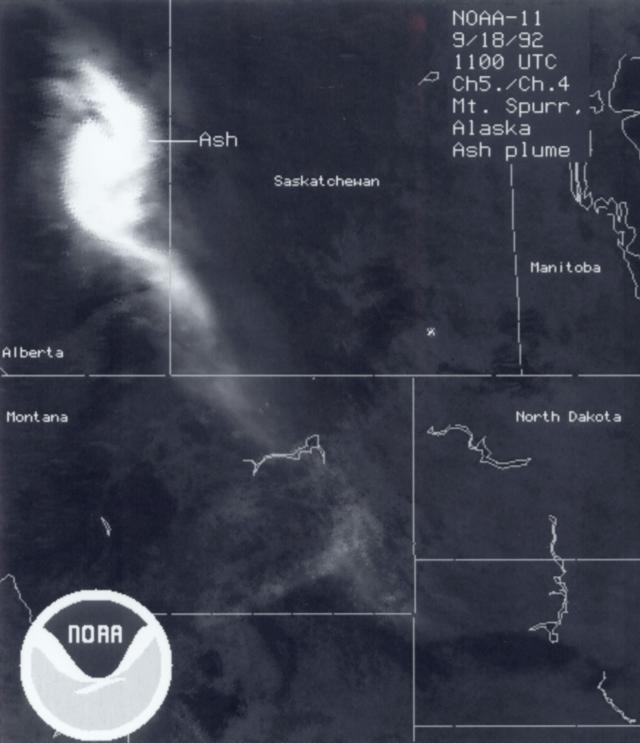 |
Figure 11. Image from the NOAA-11 polar-orbiting weather satellite on 18 November at 0300 Alaska Daylight Time, showing the 16-17 September ash cloud over E Alberta, SW Saskatchewan, and E Montana. A band 5/band 4 ratio was used to enhance the ash cloud. Courtesy of G. Stephens. |
Seismicity declined slowly after the September eruptive episode, but deep earthquakes continued to occur. SO2 flux measured by COSPEC rose from about 300 metric tons/day (t/d) on 25 September to 800 t/d on 29 September. Shallow seismicity began to increase again on 30 September, and weak volcanic tremor resumed on 1 October at 1900, the first tremor recorded since 25 September. Tremor amplitude increased on 2 October to levels comparable to those preceding the June and September eruptive episodes, but sustained tremor ended abruptly at 1830 that evening. Intermittent, banded tremor alternated with periods of sustained tremor during the next several days, while fieldwork revealed continued emission of a roughly 1-km white plume from the S flank's Crater Peak vent. CO2 flux had declined from nearly 10,000 t/d in late September to 2,900 t/d on 5 October, while the rate of SO2 emission had steadied at about 400 t/d. Tremor stopped before noon on 6 October but periodic low-amplitude tremor resumed on the 8th. Tremor stopped again on 10 October but resumed on the 15th, as a few shallow and deep earthquakes were recorded daily. Intermittent tremor continued as of 20 October.
Information Contacts: AVO; G. Stephens, NOAA/NESDIS.
Seismicity but no eruption
Seismicity has continued at Spurr following the explosive activity of 16-17 September. Minor low-amplitude tremor stopped 24 October, but several earthquakes were typically recorded daily, with depths ranging from shallow to nearly 50 km. A swarm of shallow seismic events began at about 0200 on 9 November and strengthened through the day. The alert level was raised (to orange, then red) by AVO, but the swarm subsided the next day without an eruption. An overflight on the 10th revealed no evidence of activity or morphologic changes in the vicinity of the crater. Earthquakes continued to occur beneath Spurr at rates of several per day through mid-November.
Gas emission rates remained low. The gas plume was particularly visible on 29 October because of clear, cool weather. A landslide occurred on the SE side of Crater Peak, sometime after a morning snowfall on 28 October but before the 29 October overflight. The landslide formed a 30-m-wide scar near 2,000 m altitude and carried debris to ~1,000 m elevation.
Information Contacts: AVO.
Continued seismicity and gas emission
Occasional seismicity has continued at Mt. Spurr since the eruptive episode of 16-17 September. Earthquakes were concentrated in the vicinity of Crater Peak, the S-flank vent that has been the source of the 1992 activity. Focal depths from early November through early December ranged from above sea level to 44 km. In addition to the few locatable events per day, many small earthquakes that could not be precisely located were detected by one or more stations in the area. No strong swarms have occurred since 9-10 November, when a series of shallow events raised alert levels but did not culminate in an eruption. A number of episodes of low-amplitude tremor were recorded at some stations near Crater Peak 26-27 November.
Gas emission continued from Crater Peak, feeding a plume that sometimes rises to 3,300 m. Even though the plume's SO2 content has been below COSPEC detection limits since mid-October, sulfur gases could still be smelled. CO2 content remained above background at near 1,000 metric tons/day (table 1).
Table 1. Emission rates, in metric tons/day, of SO2 and CO2 at Spurr, 8 June 1991-15 November 1992; other events are noted for context. SO2 values, measured by COSPEC, are averages of 2-5 daily aerial observations, taken looking up through the plume. Measured SO2 flux decreased during tremor episodes 3-5 October. CO2 data are from direct plume samples analyzed with a Miran infrared spectrometer. Courtesy of AVO.
| Date | SO2 | CO2 |
| 08 Jun 1991 | 21 | -- |
| 22 Jul 1991 | Very low | Very low |
| 21 Aug 1991 | 0 | -- |
| 29 Aug 1991 | 0 | -- |
| 03 Sep 1991 | 85 | -- |
| 22 Nov 1991 | 0 | -- |
| 14 May 1992 | 88 | -- |
| 27 Jun 1992 | Eruption | |
| 29 Jun 1992 | 5 | -- |
| 18 Aug 1992 | Eruption | |
| 10 Sep 1992 | 0 | -- |
| 16-17 Sep 1992 | Eruption | |
| 21 Sep 1992 | 23 | -- |
| 23 Sep 1992 | 24 | -- |
| 24 Sep 1992 | 79 | -- |
| 25 Sep 1992 | 300 | 11,000 |
| 28 Sep 1992 | 194 | 12,000 |
| 29 Sep 1992 | 749 | 8,700 |
| 02 Oct 1992 | 452 | -- |
| 03 Oct 1992 | 220 | 4,800 |
| 04 Oct 1992 | 212 | 3,500 |
| 05 Oct 1992 | 356 | 2,900 |
| 10 Oct 1992 | 243 | -- |
| 14 Oct 1992 | 47 | 2,400 |
| 15 Oct 1992 | 64 | -- |
| 16 Oct 1992 | Low | Low |
| 19 Oct 1992 | Background | Background |
| 23 Oct 1992 | 24 | 2,100 |
| 29 Oct 1992 | Background | Background |
| 09 Nov 1992 | Seismic swarm | |
| 10 Nov 1992 | Background | Background |
| 11 Nov 1992 | Background | Background |
| 12 Nov 1992 | Background | 1,100 |
| 13 Nov 1992 | Background | 1,000 |
| 15 Nov 1992 | Background | 1,000 |
Information Contacts: AVO.
Continued seismicity
No eruptive episodes have occurred at Spurr since 16-17 September (BGVN 17:08). Seismicity continued through early January beneath the S flank's Crater Peak, source of the 1992 eruptions.
A series of earthquakes was recorded during the night of 14 December, and a fresh landslide scar was seen on the NW side of the crater the next day. Two hours of tremor on 17 December may have been related to rockfall activity. A swarm of small earthquakes at 8-12 km depth 21-26 December was followed by a pair of hour-long shallow tremor-like episodes on 27 December. Activity then declined, but two more periods of low-amplitude tremor, each lasting more than an hour, were recorded by a station on the rim of Crater Peak on 30 December. Shallow seismic activity remained above background in mid-January.
Information Contacts: AVO.
Continued seismicity
Seismicity has continued at Spurr from mid-January through mid-February, but there have been no eruptive episodes since 16-17 September 1992. The number of locatable earthquakes beneath Crater Peak, to depths of 30 km, has remained at a level of 0-3/day during this period. Deeper seismicity (>15 km depth) and locatable events within 10 km of the volcano gradually declined in late 1992 and early 1993, consistent with the possibility that magma is no longer being supplied to the shallow system. Seismicity at 5-15 km and <5 km depths remained low, but above background levels, in mid-February. There were 0-4 locatable seismic events during the week of 5-12 February, all of which were shallow.
Information Contacts: AVO.
Low seismic activity; level of concern reduced from Yellow to Green
Because of continued low seismicity, on 5 March 1993 the Alaska Volcano Observatory downgraded its Level of Concern Color Code for Spurr from Yellow to Green. Seismicity has remained low since December 1992, longer than the quiet period between the 27 June and 18 August 1992 eruptions. Between 12 February and 12 March 1993 two or fewer events/day were recorded. Measurements on 18 February of CO2 (400 tons/day) and SO2 (none detected) were similar to those made in early January. Visual inspection of Crater Peak between 12 and 19 February showed no significant morphological changes to the crater area, although one large slab of glacial ice is detaching from the outer NE flank. It may produce a significant seismic signal if it fails suddenly.
Spurr was last at color code green from 8 July to 18 August 1992. Green indicates that the "volcano is in its normal 'dormant' state." The observatory did warn that "the possibility for steam and ash explosions still exists. Should such explosions occur, they are unlikely to pose a hazard to high-flying aircraft or to communities downwind."
Information Contacts: AVO.
Unusual plume observed from Anchorage
Beginning at about 0900 on 26 March, an unusual cloud or steam plume in the vicinity of Spurr volcano was observed from Anchorage (125 km E). However, seismicity remained at normal levels and nothing unusual was noted in satellite images of the area. The level of concern remained at green, indicating normal seismic and fumarolic activity.
Information Contacts: Alaska Volcano Observatory (AVO), a cooperative program of a) U.S. Geological Survey, 4200 University Drive, Anchorage, AK 99508-4667, USA (URL: http://www.avo.alaska.edu/), b) Geophysical Institute, University of Alaska, PO Box 757320, Fairbanks, AK 99775-7320, USA, and c) Alaska Division of Geological & Geophysical Surveys, 794 University Ave., Suite 200, Fairbanks, AK 99709, USA.
Elevated seismicity, increased carbon dioxide emissions, and melting of the ice cap
Spurr, ~ 125 km W of Anchorage across Cook Inlet, became restless in recent months. This activity consisted of increased seismicity beginning in February 2004, melting of the summit ice cap, and substantial emission rates of carbon dioxide (CO2) and sulfur dioxide (SO2). Scientists at the Alaska Volcano Observatory (AVO) recorded hundreds of small earthquakes centered 4.8-6.4 km beneath the summit. Elevated levels of seismicity continued through early November 2004 (table 2). Although the rate of seismicity is greater than typical background levels, AVO has found no indication that an eruption is imminent.
Table 2. Weekly seismicity within 30 km of the summit at Spurr, with magnitudes over 1.5 and depths of 1-6 km. Courtesy of AVO.
| Dates | Average earthquakes per day |
| 24 Jul-30 Jul 2004 | 10-20 |
| 31 Jul-06 Aug 2004 | 10-20 |
| 07 Aug-13 Aug 2004 | 10-20 |
| 14 Aug-20 Aug 2004 | 15 (70 events on 14 Aug) |
| 21 Aug-27 Aug 2004 | 12 |
| 28 Aug-03 Sep 2004 | 14 |
| 04 Sep-10 Sep 2004 | 13 |
| 11 Sep-17 Sep 2004 | 12 |
| 18 Sep-24 Sep 2004 | 10 |
| 25 Sep-01 Oct 2004 | 13 |
| 02 Oct-08 Oct 2004 | 8 |
| 09 Oct-15 Oct 2004 | 9 |
| 16 Oct-22 Oct 2004 | 2-14 |
| 23 Oct-29 Oct 2004 | 12-24 (3 per hour on 26 Oct) |
| 30 Oct-05 Nov 2004 | 0-24 (10 per hour on 4 Nov) |
Aerial reconnaissance in mid-July and early August documented recent small flows of mud and rock and a depression in the icecap (an "ice cauldron") just NE of the summit that was ~ 50 x 75 m in size and ~ 25 m deep. The floor of the depression contained an icy pond, with small areas of open water. No steam or volcanic emissions were observed. The ice cauldron is a collapse feature possibly caused by an increase in heat coming from deep beneath the summit. Using sensitive instruments, scientists flying around the volcano on 7 August detected small amounts of the volcanic gases in a plume from the summit.
Observations and photography during the week ending 10 September revealed that the ice cauldron had enlarged substantially (to ~ 150 x 170 m), presumably as the roof of the meltwater basin continued to subside and collapse. AVO scientists measured gases being emitted by the summit vent and Crater Peak, a flank vent, during a fixed-wing flight on 15 September 2004. The combined output of CO2 from the two vents was ~ 2,300 tons/day, an increase from the ~ 760 tons/day measured 7-8 August 2004. The gray color of the lake at the bottom of the ice cauldron is typical of crater lakes containing dissolved SO2.
AVO staff took an overflight of the volcano on 18 October and reported that the summit ice cauldron persisted without appreciable change of its geometry or of the surrounding crevasses. The ice cauldron continued to contain standing water, no steam or sulfur scent was observed from the summit, and steam issuing from Crater Peak had not changed from previous observations.
References. Power, J., 2004, Renewed unrest at Mount Spurr Volcano, Alaska: Eos (Transactions, American Geophysical Union), v. 85, no. 43, p. 2.
Waythomas, C.F., and Nye, C.J., 2002, Preliminary volcano-hazard assessment for Mount Spurr Volcano, Alaska: U.S. Geological Survey Open-File Report 01.482, Alaska Volcano Observatory, Anchorage, Alaska, 39 pp.
Information Contacts: U.S. Geological Survey Alaska Volcano Observatory (AVO), a cooperative program of the USGS, University of Alaska Fairbanks Geophysical Institute, and the Alaska Division of Geological and Geophysical Surveys (URL: http://www.avo.alaska.edu/).
Summit ice cauldron, debris flows through 2006; fumarolic activity continues
The 2004 unrest at Mount Spurr (BGVN 29:10) continued for nearly two years before the Alaska Volcano Observatory (AVO) lowered the Level of Concern Color Code from Yellow to Green (on a scale from Green to Yellow to Orange to Red) on 21 February 2006. During those two years, hydrothermal and fumarolic activity within the ice-filled summit crater resulted in the formation of a summit ice cauldron and emplacement of debris-flow deposits on the upper slopes of Spurr. The summit crater and cauldron remained active after most other signs of unrest had declined. This report discusses observations of the development of the unrest following November 2004 (activity prior to that time covered in BGVN 29:10).
A depression in the summit ice was observed in its early stages in June 2004 (figures 12 and 13). The subsidence became more pronounced, and was recognized as an ice cauldron on 2 August, following debris flows emplaced in late July (figure 14). The cauldron housed a lake, whose water was described by Neal and others (2005) and McGimsey and others (2008) as "dark battleship gray" and turquoise in color, respectively, likely due to dissolved sulfur compounds (figure 15).
|
Figure 12. Photograph of Mount Spurr's summit (viewing SSW) on 20 June 2004, showing the initial development of a depression (dashed outline) in the ice and snow covering the summit. Crevassing of the snow and ice downslope is indicated by arrows. This is the earliest image of the 2004 development of the summit ice cauldron. Photograph courtesy of Bruce Hopper, Alaska Volcano Observatory (AVO). |
|
Figure 13. Satellite photography highlighting the 2004 development of Mount Spurr's summit ice cauldron, acquired on (A) 15 June 2002 and (B) 10 August 2004. Modified from Coombs and others (2005). |
|
Figure 14. Debris flow deposits on the upper slopes of Mount Spurr, photographed on 15 July 2004, viewing NNW. The debris flow deposits prompted an observation flight, which resulted in the observation of the summit ice cauldron on 2 August. Courtesy of Christina Neal, Alaska Volcano Observatory (AVO). |
|
Figure 15. Aerial photograph and Forward Looking Infrared Radiometer (FLIR) images of Mount Spurr's summit ice cauldron and lake, taken on 25 April 2005. Hottest parts of the FLIR image correspond to the exposed bedrock on the shore of the lake (see temperature scale at right). The light blue gray color of the lake is likely due to dissolved sulfur compounds (Neal and others, 2005). Courtesy of McGimsey and others (2008). |
Ice cauldron widens. Neal and others (2005) reported that measurements made on 10 August and 30 October 2004 revealed enlargement of the ice cauldron from ~65 m x 95 m to ~130 m x 130 m in two and a half months' time. Gas measurements during the same time revealed that CO2 emissions had more than doubled (figure 16).
|
Figure 16. Measured gas emissions (tons/day) at Mount Spurr during the 2004-2006 active period. SO2 (in parentheses) and CO2 fluxes plotted on left axis; H2S flux plotted on right axis. Data courtesy of Doukas and McGee (2007). |
Forward Looking Infrared Radiometer (FLIR) measurements on 24 September showed that the crater lake was ~0 °C (substantially warmer than the surrounding ice and snow), and the surrounding exposed bedrock (and main fumarolic emission area) was as hot as ~39 °C (figure 15).
By the end of 2004, seismicity remained elevated, and most located earthquakes were within 0-5 km depth below sea level (figure 17; Neal and others 2005).
|
Figure 17. Earthquakes located beneath Mount Spurr during 2004 showed increased seismicity correlating to increased gas emissions and hydrothermal activity responsible for the formation of the summit ice cauldron. Plots show (A) number of earthquakes per day and (B) hypocenter depths below sea level. Symbol size indicates the relative magnitude of the earthquakes; triangles indicate located hypocenters at depths greater than 20 km. Courtesy of Neal and others (2005). |
During 2005, growth of the summit ice cauldron continued (figures 18 and 19), and areas of exposed bedrock increased along the N and NW walls of the crater. According to McGimsey and others (2008), FLIR measurements on 25 April 2005 showed similar temperatures to those measured in September 2004 (figure 15).
|
Figure 18. Mount Spurr's summit ice cauldron extent as it expanded during 2004-2006. Colored lines indicate the rim of the cauldron as measured on the dates indicated. Courtesy of Coombs and others (2006). |
|
Figure 19. Two plots showing (A) the area of Mount Spurr's ice cauldron and (B) the number of earthquakes per week during March 2004-March 2006. Courtesy of Coombs and others (2006). |
May 2005 debris flow. A small debris flow was captured on webcam views of the summit on 2 May 2005 (figure 20). Observations a week later revealed that the cauldron lake level had dropped by ~15 m, and fumaroles on the N shore of the lake had been exposed (McGimsey and others, 2008). The fumaroles were described as vigorous by McGimsey and others (2008). FLIR measurements during an observation flight on 21 June indicated increasing temperatures of exposed bedrock within the crater (up to 60 °C; orange areas within the ice cauldron outline, figure 20) and observers noted strong upwelling within the N half of the cauldron lake.
|
Figure 20. Map and interpretive cross-section highlighting the locations of debris flows emplaced onto the summit cone of Mount Spurr during 2004-2005. Dates of observation or emplacement of debris flows are provided in the explanation; associated outflow points are indicated by red dots. Orange areas indicate zones of elevated thermal activity and/or exposed bedrock. Schematic cross-section (bottom right) is along the line A-A', and indicates the probable pathway of debris-laden water from the cauldron lake to the outflow points of the debris flows. Base image from QuickBird satellite image, acquired 10 August 2004. Modified from Coombs and others (2006). |
The likely (or at least nearly) contemporaneous lake level drop and debris flow on 2 May were not associated with any significant ice collapse into the cauldron lake; Coombs and others (2006) thus concluded that the debris flows were the result of widening of englacial or subglacial pathways by erosion, heating, or glacial flow (cross-section, figure 20). They also interpreted the main source of the debris carried in the debris flows to be melted glacial ice containing layers of tephra and ash. The primary source of the tephra and ash layers was likely the 1992 eruptions of Crater Peak (Spurr's satellite cone and youngest vent) and possibly the 1989-90 eruptions of Mount Redoubt (Coombs and others, 2006). Some component of the debris was also likely sourced from the summit crater floor and wall rocks.
Snow/ice melts from summit crater. By 1 August 2005, the ice cauldron had reached its largest size (i.e. the snow/ice had melted from within the perimeter of the summit crater; figures 18 and 19), and was thus no longer termed the "ice cauldron", but simply the summit crater (McGimsey, personal communication, 2012). In September, the crater lake was observed to be completely ice-free, and most likely remained as such through mid January 2006. McGimsey and others (2008) reported that, as of 3 November 2005, ~5.4 x 10⁶ m3 of ice and snow had been melted and consumed by the summit lake.
Decreasing seismicity prompted the AVO to lower the Level of Concern Color Code from Yellow to Green on 21 February 2006. With the exception of an earthquake swarm during 11-12 April, seismicity continued to decrease, and reached background levels by May 2006. During the earthquake swarm, Neal and others (2009) reported 157 volcano-tectonic earthquakes (reaching M ~2.3) that occurred at less than 5 km depth below sea level and ~1-3 km W of the summit. FLIR measurements two days after the earthquake swarm revealed that fumaroles within the summit crater were as hot as 150 °C (Neal and others, 2009). By mid July, however, snow and ice had started accumulating on the lake's surface, and by 17 November 2006, a rise in the level of the lake was observed. As fumarolic activity continued, yellow, sulfur stained ice and snow, as well as a strong sulfur smell, was often reported by pilots passing the summit.
Since 2006, most of the sides and bottom of the summit crater have been covered by snow, with the exception of the fumarole field in the N part of the crater floor. As of the last observation flight, the fumarole field maintained a small patch of snow/ice free bedrock on the summit crater's floor, an area still active as of 28 August 2011 (figure 21). Later satellite imagery suggested that the fumarole field had been covered as the summit crater filled with snow and ice during the first part of the 2011-2012 winter (figure 22), but there have been no observation flights to confirm this as of 24 February 2012.
|
Figure 21. Aerial observation photograph of Mount Spurr's summit on 28 August 2011. Although the crater had begun refilling with snow, the fumarole field on the crater floor remained in a clear patch of bedrock. Photograph courtesy of Game McGimsey, Alaska Volcano Observatory (AVO). |
|
Figure 22. WorldView-1 daytime optical panchromatic imagery detailing the apparent filling of Mount Spurr's summit crater with snow and ice during the early 2011-2012 winter. (B) shows Spurr on 11 August 2011, with the fumarole field and area of exposed bedrock in the N of the summit crater (enlarged, inset). Snow appears white, and vegetation at the bottom of the image appears dark. (C) shows the same area on 15 October, with the fumarole field and exposed bedrock areas apparently covered by snow at the bottom of the summit crater. Vegetation is no longer visible at the bottom of the image. (D) shows the same area on 27 October, but the summit crater appears to be completely filled with snow, no longer exhibiting a depression. Topographic map of the same area is shown for reference (A). '*' symbol indicates a prominent topographic ridge to the N of Spurr that is visible in each image. Scale is approximate for the satellite imagery (B-D). Courtesy of Alaska Volcano Observatory (AVO) and Digital Globe, Inc. (B-D). |
Coombs and others (2006) stated that the overall effect of the hydrothermal activity (including water/debris flow releases from the summit) on the glacial system of Spurr were likely minimal, pointing out that the volume of water released was relatively small and probably easily accommodated "without significant modification of the icemass."
References. Coombs, M.L., Neal, C.A., Wessels, R.L., and McGimsey, R.G., 2006, Geothermal disruption of summit glaciers at Mount Spurr Volcano, 2004-6: An unusual manifestation of volcanic unrest: U.S. Geological Survey Professional Paper 1732-B, 33 p.
Doukas, M.P., and McGee, K.A., 2007, A compilation of gas emission-rate data from volcanoes of Cook Inlet (Spurr, Crater Peak, Redoubt, Iliamna, and Augustine) and Alaska Peninsula (Douglas, Fourpeaked, Griggs, Mageik, Martin, Peulik, Ukinrek, and Veniaminof), Alaska, from 1995-2006: U.S. Geological Survey Open-File Report 2007-1400, 16 p.
McGimsey, R.G., Neal, C.A., Dixon, J.P., and Ushakov, S., 2008, 2005 Volcanic activity in Alaska, Kamchatka, and the Kurile Islands: Summary of events and response of the Alaska Volcano Observatory: U.S. Geological Survey Scientific Investigations Report 2007-5269, 94 p.
Neal, C.A., McGimsey, R.G., Dixon, J.P., Manevich, A., and Rybin, A., 2009, 2006 Volcanic activity in Alaska, Kamchatka, and the Kurile Islands: Summary of events and response of the Alaska Volcano Observatory: U.S. Geological Survey Scientific Investigations Report 2008-5214, 102 p.
Neal, C.A., McGimsey, R.G., Dixon, J., and Melnikov, D., 2005, 2004 Volcanic activity in Alaska and Kamchatka: Summary of events and response of the Alaska Volcano Observatory: U.S. Geological Survey Open-File Report 2005-1308, 71 p.
Information Contacts: Bruce Hopper, Game McGimsey, and Christina Neal, Alaska Volcano Observatory (AVO), a cooperative program of a) U.S. Geological Survey (USGS), 4200 University Drive, Anchorage, AK 99508-4667 USA (URL: http://www.avo.alaska.edu/), b) Geophysical Institute, University of Alaska, PO Box 757320, Fairbanks, AK 99775-7320, USA, and c) Alaska Division of Geological & Geophysical Surveys (ADGGS), 794 University Ave., Suite 200, Fairbanks, AK 99709, USA (URL: http://www.dggs.alaska.gov/); Digital Globe, Inc. (URL: http://www.digitalglobe.com/).
|
|
||||||||||||||||||||||||||||
There is data available for 7 confirmed eruptive periods.
1992 Jun 27 - 1992 Sep 17 Confirmed Eruption (Explosive / Effusive) VEI: 4
| Episode 1 | Eruption (Explosive / Effusive) | South flank (Crater Peak) | |||||||||||||||||||||||||||||||||||||||||||||||||||||||||||||||||||||||||
|---|---|---|---|---|---|---|---|---|---|---|---|---|---|---|---|---|---|---|---|---|---|---|---|---|---|---|---|---|---|---|---|---|---|---|---|---|---|---|---|---|---|---|---|---|---|---|---|---|---|---|---|---|---|---|---|---|---|---|---|---|---|---|---|---|---|---|---|---|---|---|---|---|---|---|
| 1992 Jun 27 - 1992 Sep 17 | Evidence from Observations: Reported | |||||||||||||||||||||||||||||||||||||||||||||||||||||||||||||||||||||||||
|
List of 13 Events for Episode 1 at South flank (Crater Peak)
|
||||||||||||||||||||||||||||||||||||||||||||||||||||||||||||||||||||||||||
[ 1954 Jul 2 ± 182 days ] Discredited Eruption
1953 Jul 9 - 1953 Jul 16 Confirmed Eruption (Explosive / Effusive) VEI: 4
| Episode 1 | Eruption (Explosive / Effusive) | South flank (Crater Peak) | ||||||||||||||||||||||||||||||||||||||||||||||||||||||||||
|---|---|---|---|---|---|---|---|---|---|---|---|---|---|---|---|---|---|---|---|---|---|---|---|---|---|---|---|---|---|---|---|---|---|---|---|---|---|---|---|---|---|---|---|---|---|---|---|---|---|---|---|---|---|---|---|---|---|---|---|
| 1953 Jul 9 - 1953 Jul 16 | Evidence from Observations: Reported | ||||||||||||||||||||||||||||||||||||||||||||||||||||||||||
|
List of 10 Events for Episode 1 at South flank (Crater Peak)
|
|||||||||||||||||||||||||||||||||||||||||||||||||||||||||||
1650 ± 50 years Confirmed Eruption (Explosive / Effusive)
| Episode 1 | Eruption (Explosive / Effusive) | South flank (Crater Peak) | |||||||||||||
|---|---|---|---|---|---|---|---|---|---|---|---|---|---|---|
| 1650 ± 50 years - Unknown | Evidence from Correlation: Tephrochronology | |||||||||||||
|
List of 1 Events for Episode 1 at South flank (Crater Peak)
|
||||||||||||||
3250 BCE (?) Confirmed Eruption (Explosive / Effusive)
| Episode 1 | Eruption (Explosive / Effusive) | Mt. Spurr central lava/cone complex | ||||||||||||||||||
|---|---|---|---|---|---|---|---|---|---|---|---|---|---|---|---|---|---|---|---|
| 3250 BCE (?) - Unknown | Evidence from Isotopic: 14C (uncalibrated) | ||||||||||||||||||
|
List of 2 Events for Episode 1 at Mt. Spurr central lava/cone complex
|
|||||||||||||||||||
4050 BCE (?) Confirmed Eruption (Explosive / Effusive)
| Episode 1 | Eruption (Explosive / Effusive) | South flank (Crater Peak) | ||||||||||||||||||
|---|---|---|---|---|---|---|---|---|---|---|---|---|---|---|---|---|---|---|---|
| 4050 BCE (?) - Unknown | Evidence from Correlation: Tephrochronology | ||||||||||||||||||
|
List of 2 Events for Episode 1 at South flank (Crater Peak)
|
|||||||||||||||||||
5110 BCE ± 100 years Confirmed Eruption (Explosive / Effusive)
| Episode 1 | Eruption (Explosive / Effusive) | Mt. Spurr central dome/cone complex | ||||||||||||||||||
|---|---|---|---|---|---|---|---|---|---|---|---|---|---|---|---|---|---|---|---|
| 5110 BCE ± 100 years - Unknown | Evidence from Isotopic: 14C (uncalibrated) | ||||||||||||||||||
|
List of 2 Events for Episode 1 at Mt. Spurr central dome/cone complex
|
|||||||||||||||||||
6050 BCE (?) Confirmed Eruption (Explosive / Effusive)
| Episode 1 | Eruption (Explosive / Effusive) | Mt. Spurr central dome/cone complex | |||||||||||||
|---|---|---|---|---|---|---|---|---|---|---|---|---|---|---|
| 6050 BCE (?) - Unknown | Evidence from Isotopic: 14C (uncalibrated) | |||||||||||||
|
List of 1 Events for Episode 1 at Mt. Spurr central dome/cone complex
|
||||||||||||||
This compilation of synonyms and subsidiary features may not be comprehensive. Features are organized into four major categories: Cones, Craters, Domes, and Thermal Features. Synonyms of features appear indented below the primary name. In some cases additional feature type, elevation, or location details are provided.
Cones |
||||
| Feature Name | Feature Type | Elevation | Latitude | Longitude |
| Crater Peak | Stratovolcano | 2130 m | 61° 16' 0.00" N | 152° 14' 0.00" W |
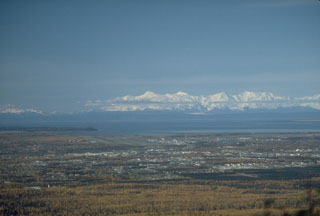 Mount Spurr is visible on the skyline 125 km W of Anchorage, Alaska. In 1992 three brief explosive eruptions from the Crater Peak vent deposited several millimeters of ash over south-central Alaska and on one occasion forced the closure of Anchorage International Airport for 20 hours.
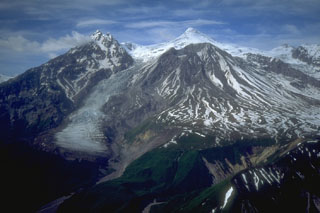 During the late Pleistocene or early Holocene Mount Spurr underwent flank collapse, resulting in the 5-6 km crater that opens to the south shown here in 1993. The collapse produced a debris avalanche that traveled at least 25 km from the summit. The snow-covered peak (center) is a post-collapse lava dome. Crater Peak, in front of it, has been the source of frequent Holocene eruptions.
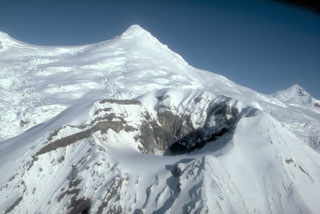 Crater Peak, a flank vent of Mount Spurr, is seen from the south with the snow-and-ice-covered summit lava dome complex in the background. Both the summit lava dome and Crater Peak were constructed within a 5-6 km wide scar formed by an earlier collapse. Crater Peak has been the source of about 40 Holocene tephra layers identified in the Cook Inlet basin.
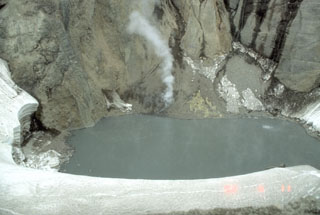 In early June 1992, this lake inside Crater Peak vent at Mount Spurr had a temperature of 49.7°C and a pH of 2.5. Note a circular upwelling zone about 5 m across to the upper right, and the plume rising from the talus pile on the far shore. This photo was taken on 11 June, a little more than two weeks prior to a major explosive eruption that ejected the crater lake.
 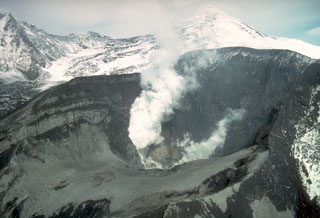 Crater Peak crater on Mount Spurr is seen here producing a plume on 18 June 1992, the day after a brief violent explosion. Fresh deposits are on the interior of the crater and the pre-eruption crater lake is gone. The summit is visible behind the plume to the upper right in this view from the south.
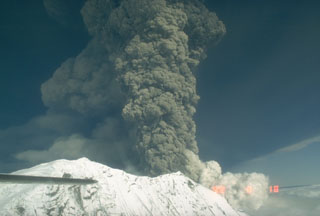 The second of three large explosive eruptions from Crater Peak, a satellite cone of Mount Spurr, 3.2 km south of the peak, occurred on 18 August 1992. This aerial view from the west shows the base of the vertical eruption plume that reached an altitude of about 13.5 km. This eruption lasted about 4.5 hours and resulted in ashfall in Anchorage, 125 km E, that resulted in closure of the international airport for 20 hours.
 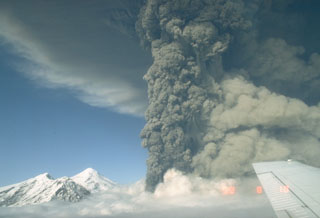 This photo shows an ash plume during the eruption of Spurr on 18 August 1992. A lighter plume rises above pyroclastic flows descending the SE flank to the right, and the summit lava dome complex is to the left. The 18 August event was the second of three brief powerful explosive eruptions in 1992.
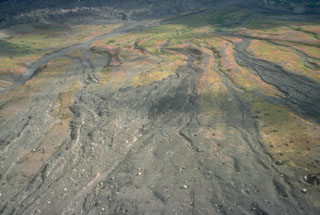 Pyroclastic flow deposits from the 18 August 1992 eruption of Crater Peak on Spurr formed overlapping lobes across the lower SE slopes. Bombs ejected during the eruption produced impact craters across the surface.
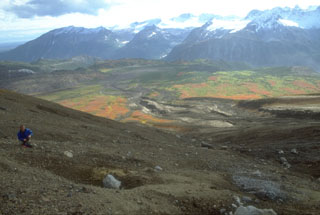 A volcanologist from the Alaska Volcano Observatory inspects an impact crater (left-foreground) formed by a dense block ejected during the 18 August 1992 eruption of the Crater Peak vent on Mount Spurr. Pyroclastic flow and lahar deposits from that eruption form the darker areas descending SE-flank valleys. This 1993 view looking away from Spurr shows glacier-covered plutonic and sedimentary rocks of the Alaska Range in the background.
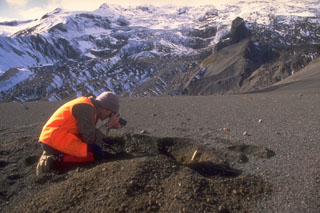 A scientist from the Alaska Volcano Observatory studies tephra from the 1992 eruptions of the Crater Peak vent of Mount Spurr volcano. Three brief explosive eruptions blanketed narrow swaths of the surrounding area with ash. Detailed investigations of deposits are necessary to understand eruption characteristics and magnitude. In this view, about 15 cm of coarse ash and lapilli is exposed in the pit and blocks from the 16-17 September 1992 eruption are scattered across the surface.
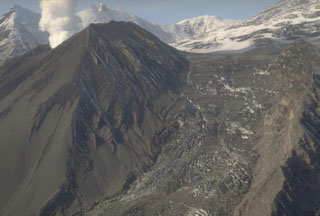 The last of three brief 1992 explosive eruptions at the Crater Peak vent of Mount Spurr showered hot debris onto the Kidazgeni Glacier immediately east of the cone. In this 23 September view, six days after the end of the eruption, a plume rises from Crater Peak and dark pyroclastic material covers the flanks of the cone and adjacent glacial ice.
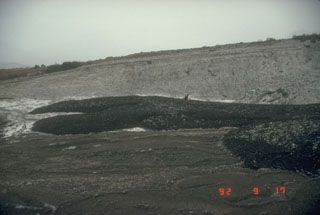 An Alaska Volcano Observatory scientist examines lahar deposits originating from the 1992 eruption of the Crater Peak vent at Mount Spurr. These deposits were emplaced the night of 16-17 September during the last of three short, but powerful, explosive eruptions from June to September.
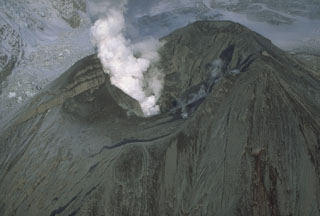 Following the three eruptions of 1992, the interior of the Crater Peak vent at Mount Spurr contained tens of meters of new eruption deposits. All traces of the former lake had disappeared. A plume of steam and volcanic gas continued from the vent for several years. This photo was taken on 26 September, nine days after the eruption ended.
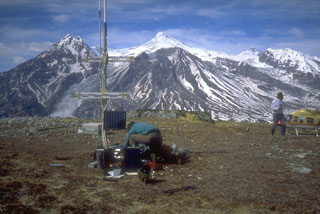 Seismometers such as this one installed near Mount Spurr volcano (on skyline in background) provide the Alaska Volcano Observatory with a continuous, telemetered record of volcanic earthquakes. Scientists use this data to monitor earthquake types, locations, and magnitudes to decipher different processes under and within a volcano.
 The following 3 samples associated with this volcano can be found in the Smithsonian's NMNH Department of Mineral Sciences collections, and may be availble for research (contact the Rock and Ore Collections Manager). Catalog number links will open a window with more information.
| Catalog Number | Sample Description | Lava Source | Collection Date |
|---|---|---|---|
| NMNH 108984 | Volcanic Dust | -- | -- |
| NMNH 116565 | Andesite Volcanic Ash | -- | -- |
| NMNH 117642-3 | Ash | -- | -- |
| Alaska Volcano Observatory (Link to Spurr) | The Alaska Volcano Observatory (AVO) is a joint program of the U.S. Geological Survey (USGS), the Geophysical Institute of the University of Alaska Fairbanks (UAFGI), and the State of Alaska Division of Geological and Geophysical Surveys (ADGGS). AVO was formed in 1988, and uses federal, state, and university resources to monitor and study Alaska's hazardous volcanoes, to predict and record eruptive activity, and to mitigate volcanic hazards to life and property. |
| Copernicus Browser | The Copernicus Browser replaced the Sentinel Hub Playground browser in 2023, to provide access to Earth observation archives from the Copernicus Data Space Ecosystem, the main distribution platform for data from the EU Copernicus missions. |
| MIROVA | Middle InfraRed Observation of Volcanic Activity (MIROVA) is a near real time volcanic hot-spot detection system based on the analysis of MODIS (Moderate Resolution Imaging Spectroradiometer) data. In particular, MIROVA uses the Middle InfraRed Radiation (MIR), measured over target volcanoes, in order to detect, locate and measure the heat radiation sourced from volcanic activity. |
| MODVOLC Thermal Alerts | Using infrared satellite Moderate Resolution Imaging Spectroradiometer (MODIS) data, scientists at the Hawai'i Institute of Geophysics and Planetology, University of Hawai'i, developed an automated system called MODVOLC to map thermal hot-spots in near real time. For each MODIS image, the algorithm automatically scans each 1 km pixel within it to check for high-temperature hot-spots. When one is found the date, time, location, and intensity are recorded. MODIS looks at every square km of the Earth every 48 hours, once during the day and once during the night, and the presence of two MODIS sensors in space allows at least four hot-spot observations every two days. Each day updated global maps are compiled to display the locations of all hot spots detected in the previous 24 hours. There is a drop-down list with volcano names which allow users to 'zoom-in' and examine the distribution of hot-spots at a variety of spatial scales. |
|
WOVOdat
Single Volcano View Temporal Evolution of Unrest Side by Side Volcanoes |
WOVOdat is a database of volcanic unrest; instrumentally and visually recorded changes in seismicity, ground deformation, gas emission, and other parameters from their normal baselines. It is sponsored by the World Organization of Volcano Observatories (WOVO) and presently hosted at the Earth Observatory of Singapore.
GVMID Data on Volcano Monitoring Infrastructure The Global Volcano Monitoring Infrastructure Database GVMID, is aimed at documenting and improving capabilities of volcano monitoring from the ground and space. GVMID should provide a snapshot and baseline view of the techniques and instrumentation that are in place at various volcanoes, which can be use by volcano observatories as reference to setup new monitoring system or improving networks at a specific volcano. These data will allow identification of what monitoring gaps exist, which can be then targeted by remote sensing infrastructure and future instrument deployments. |
| Volcanic Hazard Maps | The IAVCEI Commission on Volcanic Hazards and Risk has a Volcanic Hazard Maps database designed to serve as a resource for hazard mappers (or other interested parties) to explore how common issues in hazard map development have been addressed at different volcanoes, in different countries, for different hazards, and for different intended audiences. In addition to the comprehensive, searchable Volcanic Hazard Maps Database, this website contains information about diversity of volcanic hazard maps, illustrated using examples from the database. This site is for educational purposes related to volcanic hazard maps. Hazard maps found on this website should not be used for emergency purposes. For the most recent, official hazard map for a particular volcano, please seek out the proper institutional authorities on the matter. |
| IRIS seismic stations/networks | Incorporated Research Institutions for Seismology (IRIS) Data Services map showing the location of seismic stations from all available networks (permanent or temporary) within a radius of 0.18° (about 20 km at mid-latitudes) from the given location of Spurr. Users can customize a variety of filters and options in the left panel. Note that if there are no stations are known the map will default to show the entire world with a "No data matched request" error notice. |
| UNAVCO GPS/GNSS stations | Geodetic Data Services map from UNAVCO showing the location of GPS/GNSS stations from all available networks (permanent or temporary) within a radius of 20 km from the given location of Spurr. Users can customize the data search based on station or network names, location, and time window. Requires Adobe Flash Player. |
| DECADE Data | The DECADE portal, still in the developmental stage, serves as an example of the proposed interoperability between The Smithsonian Institution's Global Volcanism Program, the Mapping Gas Emissions (MaGa) Database, and the EarthChem Geochemical Portal. The Deep Earth Carbon Degassing (DECADE) initiative seeks to use new and established technologies to determine accurate global fluxes of volcanic CO2 to the atmosphere, but installing CO2 monitoring networks on 20 of the world's 150 most actively degassing volcanoes. The group uses related laboratory-based studies (direct gas sampling and analysis, melt inclusions) to provide new data for direct degassing of deep earth carbon to the atmosphere. |
| Large Eruptions of Spurr | Information about large Quaternary eruptions (VEI >= 4) is cataloged in the Large Magnitude Explosive Volcanic Eruptions (LaMEVE) database of the Volcano Global Risk Identification and Analysis Project (VOGRIPA). |
| EarthChem | EarthChem develops and maintains databases, software, and services that support the preservation, discovery, access and analysis of geochemical data, and facilitate their integration with the broad array of other available earth science parameters. EarthChem is operated by a joint team of disciplinary scientists, data scientists, data managers and information technology developers who are part of the NSF-funded data facility Integrated Earth Data Applications (IEDA). IEDA is a collaborative effort of EarthChem and the Marine Geoscience Data System (MGDS). |