
Satellite images captured Erta Ale and the surrounding region on 23 and 25 November, before and after the 23 November eruption at Hayli Gubbi. The 25 November image showed extensive ashfall across Erta Ale and a new collapsed area, in the northern caldera SE of the previously active pit craters, was about 685 m NNW-SSE and about 385 m ENE-WSW. White plumes rose from both the N and S pit craters in both images.
Source: Copernicus
Strong lava lake activity and lava overflows during June-November 2023
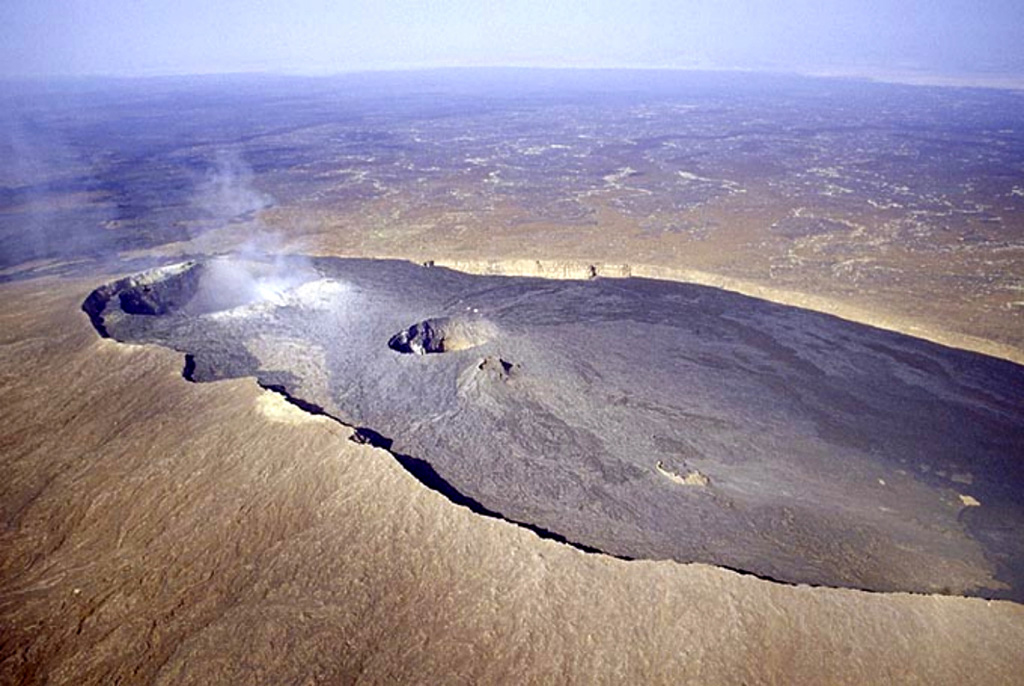
Erta Ale in Ethiopia has a 50-km-wide edifice that rises more than 600 m from below sea level in the Danakil depression. The summit caldera is 0.7 x 1.6 km and contains at least two pit craters (North and South). Another larger 1.8 x 3.1-km-wide depression is located SE of the summit and is bounded by curvilinear fault scarps on the SE side. Lava flows from fissures have traveled into the caldera and locally overflowed the crater rim. The current eruption has been ongoing since 1967, with at least one long-term active lava lake present in the summit caldera. Recent fissure eruptions from 2017 have occurred on the SE flank (BGVN 42:07). Recent activity has been characterized by minor thermal activity at the S crater and an active lava lake at the N crater (BGVN 48:06). This report covers strong lava lake activity primarily at the N pit crater during June through November 2023 using information from satellite infrared data.
Infrared satellite images generally showed an active lava lake as the N pit crater and variable thermal activity at the S pit crater during the reporting period. On 7 June two strong thermal anomalies were detected at the S pit crater and two weaker anomalies were visible at the N pit crater. Those anomalies persisted throughout the month, although the intensity at each declined. On 2 July a possible lava lake was identified at the S pit crater, filling much of the crater. On 7 July both pit craters contained active lava lakes (figure 120). By 12 July the thermal activity decreased; two smaller anomalies were visible through the rest of the month at the S pit crater while the N pit crater showed evidence of cooling.
Renewed lava lake activity was identified at the N pit crater, based on a satellite image from 11 August, with two smaller anomalies visible at the S pit crater. By 16 August the lava lake in the N pit had begun to cool and only a small thermal anomaly was identified. Activity restarted on 21 August, filling much of the E and SE part of the N pit crater. The thermal activity at the N pit crater intensified on 31 August, particularly in the NW part of the crater. On 5 September lava filled much of the N pit crater, overflowing to the W and SW. During at least 10-20 September thermal activity at both craters were relatively low.
According to a satellite image on 25 September, strong thermal activity resumed when lava overflowed the N pit crater to the S, SW, and NE (figure 120). A satellite image taken on 5 October showed lava flows from the N had spilled into the S and begun to cool, accompanied by two weak thermal anomalies at the S pit crater. On 15 October lava flows again traveled SE and appeared to originate from the S pit crater (figure 120). Following these events, smaller thermal anomalies were visible on the SE rim of the N pit crater and within the S pit crater.
Lava was visible in the NW part of the N pit crater according to a satellite image taken on 4 November. By 9 November the intensity had decreased, and the lava appeared to cool through the rest of the month; young lava flows were visible along the W side of the S pit crater on 24 and 29 November. Lava flows occurred at the N pit crater trending NE-SW and along the E side on 29 November (figure 120).
During the reporting period, the MIROVA (Middle InfraRed Observation of Volcanic Activity) thermal detection system recorded consistent activity during the first half of 2023 (figure 121). Beginning in June 2023, thermal activity increased and remained variable in intensity through the end of the year indicating the presence of an active lava lake and lava flows. The MODVOLC thermal detection system registered a total of 63 anomalies during 7, 8, and 23 July, 10 and 18 August, 3, 5, 16, 23, 24, and 25 September, 15 and 20 October, and 21, 24, 26, 28, and 30 November. Some of these stronger thermal anomalies were also detected in Sentinel-2 infrared satellite images that showed an active lava lake at the N pit crater and subsequent lava overflows from both pit craters (figure 120).
Information Contacts: MIROVA (Middle InfraRed Observation of Volcanic Activity), a collaborative project between the Universities of Turin and Florence (Italy) supported by the Centre for Volcanic Risk of the Italian Civil Protection Department (URL: http://www.mirovaweb.it/); Hawai'i Institute of Geophysics and Planetology (HIGP) - MODVOLC Thermal Alerts System, School of Ocean and Earth Science and Technology (SOEST), Univ. of Hawai'i, 2525 Correa Road, Honolulu, HI 96822, USA (URL: http://modis.higp.hawaii.edu/); Copernicus Browser, Copernicus Data Space Ecosystem, European Space Agency (URL: https://dataspace.copernicus.eu/browser/).
2025: January
| July
| November
2024: January
| June
| July
| September
| December
2023: January
| September
| October
2022: June
| August
2021: October
2020: June
| September
| November
2017: January
2010: November
2005: January
| September
| October
2004: December
2003: January
Satellite images captured Erta Ale and the surrounding region on 23 and 25 November, before and after the 23 November eruption at Hayli Gubbi. The 25 November image showed extensive ashfall across Erta Ale and a new collapsed area, in the northern caldera SE of the previously active pit craters, was about 685 m NNW-SSE and about 385 m ENE-WSW. White plumes rose from both the N and S pit craters in both images.
Source: Copernicus
Eruptive activity at Erta Ale continued during July based on satellite data and field observations. Small thermal anomalies at both the N and S pit craters were visible in periodic satellite image views on 1, 6, 8, and 11 July. On 15 July a dense black plume rising from an unstated area was filmed by a local observer and was thought to have originated from a collapse of a portion of crust covering a lava lake. A post on social media showed pictures of the plumes and stated that the plumes sank to the ground and spread out over an area of 15 km. Plumes were visible on 16 July.
Sources: Copernicus; Sputnik; Adal state
Satellite images of Erta Ale on 7, 17, and 22 January showed thermal anomalies over the N and S pit crater vent areas.
Source: Copernicus
Eruptive activity continued at Erta Ale during December based on satellite data and a field excursion. Satellite images on 8 and 13 December showed a small thermal anomaly over a vent in the S Pit Crater and a smaller one over a second vent 85 m to the NW. According to a news article a local tour guide visited the area on 16 December and described “glowing rivers flowing from the southern crater”. The two thermal anomalies and additional hot areas were present in an 18 December satellite image. The thermal anomaly pattern suggested that lava from one of the vents had flowed in between them and about 200 m SSW. A more pronounced flow, possibly from the NW vent, traveled about 100 m NW and then flowed about 300 m NE and 230 WNW, stopping at the W crater wall. By 23 December most of the lava had cooled, though the two vents still produced thermal anomalies. On 28 December a bright thermal anomaly suggested that a new lava flow had traveled about 180 m NW and curved to the SW, flowing more than 230 m and stopping at the W crater wall. A small anomaly in the northern pit crater was also visible.
Sources: Copernicus; Conciencia Radio Network
A 14 September satellite image of Erta Ale showed an oval-shaped thermal anomaly just N of the N pit crater, possibly indicative of an active lava flow. The anomaly was absent in a 19 September image. Small thermal anomalies were visible over both the N and S pit craters in 14, 19, and 24 September images.
Source: Copernicus
Thermal anomalies in satellite images of Erta Ale on 11, 16, and 21 July suggested that lava flows from the S pit crater traveled about 870 m SSE.
Source: Copernicus
Thermal anomalies in a 1 July satellite image of Erta Ale suggested activity at a vent in the N pit crater and a lava flow that traveled about 320 m SSW.
Source: Copernicus
During 13-23 January lava flows emerged from vents in Erta Ale’s S pit crater and traveled about 500 m S, 200 m NW, and 250 m SSW based on satellite images. Visitors to the volcano took photographs and video of low lava fountaining at a cone and advancing pahoehoe flows. Activity increased notably during the morning of 27 January.
Sources: Copernicus; Il Mondo dei Terremoti; Aventure et Volcans
Eruptive activity at Erta Ale continued during 20-25 October based on satellite data. The four thermal anomalies, located in the N and S pit craters and aligned in a NW-SE direction, were less bright on 25 October relative to the 20 October image.
Source: Sentinel Hub
An eruption at Erta Ale continued during 5-20 October based on satellite data. Four thermal anomalies were located in the N and S pit craters, aligned in a NW-SE direction, based on a 5 October image. The northernmost anomaly in the N pit crater, was relatively weak. The other three, one located at the SE rim of the N pit crater and two in the S pit crater, were brighter and likely represented spatter cones. These three anomalies were more intense in a 10 October image. An image on 15 October showed lava flows likely coming from the two cones in the S pit crater traveling SE, SSE, NE, and SW. Minor, linear anomalies to the N of the cone on the SE rim of the N pit crater likely represented lava flows. The flows had cooled by 20 October.
Source: Sentinel Hub
Two small thermal anomalies in Erta Ale’s S pit crater were identified in satellite images on 15 September. A 20 September image showed small anomalies in both the N and S pit craters, and a possible lava lake in the N pit crater that had mostly been crusted over. A large thermal anomaly in the SE part of the N pit crater was identified in a 25 September image. The anomaly suggested that lava had spilled over the SE rim of the crater and flowed short distances (possibly less than 400 m) E and SE.
Source: Sentinel Hub
Small thermal anomalies in both of Erta Ale’s N and S pit craters were identified in satellite images on 23 January. On 28 January the anomaly in the N pit crater was large and intense.
Source: Sentinel Hub
Thermal anomalies of variable intensities at Erta Ale’s N and S pit craters were periodically identified in satellite images during August. On 1 August there were two anomalies in the S pit crater and none in the N pit crater. Images were cloudy on 6 and 11 August. On 16 August two anomalies were again visible in the S pit crater while one large anomaly occupied the N crater. Translucent weather clouds obscured views on 21 August, though two anomalies were visible in the S pit crater. Dense weather clouds covered the N pit crater on 26 August and obscured the S pit crater, though one anomaly was visible.
Source: Sentinel Hub
On 2, 7, and 12 June infrared satellite data showed two thermal anomalies of variable intensities in Erta Ale’s S pit crater.
Source: Sentinel Hub
During 15 September-15 October satellite data showed thermal anomalies of variable intensities in Erta Ale’s S pit crater and occasional thermal anomalies at the N pit. An anomaly was detected in the N, NW, and W parts of the N pit crater on 15 October.
Source: Sentinel Hub
Satellite data periodically showed possible thermal anomalies in Erta Ale’s N pit crater during 5 September-10 October; the crater was sometimes obscured by fumes through 29 November. A weak thermal anomaly may have been present in the S pit crater during 5 September-24 November, but was notably larger on 29 November.
Source: Sentinel Hub
Satellite data showed thermal anomalies in both of Erta Ale’s S and N pit craters in mid-August, though by 5 September only the N pit had anomalous temperatures.
Source: Sentinel Hub
Satellite data showed a minor thermal anomaly in Erta Ale’s S pit crater on 12 June and a larger anomaly on 17 June at the site of the previous lava lake.
Source: Sentinel Hub
According to Volcano Discovery, visitors noted changes at Erta Ale’s lava lake during 16-20 January characterized by waves in the lava lake, intense spattering, fountaining, and rim overflows (mainly on 17 January) which traveled as far as 1 km. During the evening of 20 January explosions of very large gas bubbles ejected spatter 30 m high. Crater rim collapses affected the N crater where a new oval-shaped pit crater (150 x 30 m and 20 m depth) formed during a 24-hour period. A large collapse also occurred in the S part of the crater. The activity was accompanied by ash emissions that rose as high as 800 m. The report noted that on 21 January new fissures opened SSE from the summit caldera, producing large amounts of lava.
Satellite images acquired and processed by Planet Labs showed the new lava flows and gas-and-steam emissions from several vents (about 1.5 km SE from the overflow area at the SE caldera rim) on 23 January, and more new lava flows on 27 January. Both images showed lava flows advancing WSW, about 2.5 km S, and about 3 km NE. According to NASA's Earth Observatory, a satellite image acquired on 26 January showed two distinct infrared hotspots representing the SE lava flows. On 27 January Simon Carn stated that the eruption produced the largest SO2 emissions from Erta Ale ever measured from space.
Sources: NASA Earth Observatory; Volcano Discovery; Simon Carn; Planet Labs
Scientists from the Afar Consortium Project observed the lava lake at Erta Ale during 21-23 November. They noted Strombolian activity from the lava lake in the southern pit crater. The lava lake had filled the pit crater and breached the W rim, spilling two lava flows into the main crater. The lava lake was encompassed by a scoria ring that was about 4 m high on the S side. By 23 November, the lake was above the scientist's eye level when they stood W of the southern pit in the main crater.
Source: Afar Rift Consortium
According to a news report, after a M 4.3 earthquake on 4 October an eruption occurred at Erta Ale. The earthquake occurred in the remote region of Afar and was the 11th earthquake in the region since September.
The following activity was incorrectly reported as occurring at Erta Ale when it actually occurred at Dabbahu. See the 12-18 October 2005 Weekly Volcanic Activity Report for the full report. A team of scientists visited the Da'Ure locality of Erta Ale on 4 and 5 October after there were reports of volcanic activity there on 26 September. They determined that a minor explosive eruption occurred from two semi-circular vents, producing ashfall that was ~5 cm thick near the vent and extended more than 500 m from the vent. Boulders ejected during the eruption were as large as 3 m and were deposited as far as 20 m away. The scientists noted intense degassing from the vents, the scent of sulfur dioxide, and the sound of boiling water in the vents.
Sources: Agence France-Presse (AFP); Gezahegn Yirgu, Department of Earth Sciences, Addis Ababa University
A group of scientists assessed the visible changes at Erta Ale on 26 September after activity began around 24 September. In comparison to observations made in November 2004, they found that the southern main crater/pit had widened significantly, with portions of the previous crater walls having collapsed into the lava lake. A new cone-shaped construct had grown within the southern main crater where there had been a platform. A lava lake occupied the entire width of the inner crater/pit. In the northern crater/pit, there was a solidified lava bulge and abundant "smoking" along the crater walls. No incandescent lava was visible in the pit.
Based on descriptions by local residents of seeing "red and glowing light shooting and rising into the air above the volcano," the scientists believe that a Strombolian eruption probably occurred, emitting a significant volume of fresh magma within, and possibly out of, the pit. According to news reports, about 50,000 nomads in Ethiopia's Afar region were displaced after the eruption.
Sources: Agence France-Presse (AFP); Gezahegn Yirgu, Department of Earth Sciences, Addis Ababa University
According to unconfirmed reports from local authorities, Erta Ale began erupting on 24 September after a series of earthquakes occurred along the Afar western margin on the previous day. The earthquakes, with a maximum magnitude of 5.5, were recorded at the Geophysical Observatory of Addis Ababa University. A group of geologists and geophysicists were planning to travel to the field to make observations.
Source: Gezahegn Yirgu, Department of Earth Sciences, Addis Ababa University
An international team led by SVE, visited Erta Ale during 22-23 January. They observed no significant changes at the volcano since last observed in November 2004. Degassing continued from three of the four coalescent hornitos in the SW part of South Crater, but decreased slightly in comparison with observations made in December 2004. One hornito contained glowing molten lava. Degassing from North Crater also slightly decreased. Near the NW wall of the crater two small red glowing areas were visible at the summit of two hornitos in the crater.
Source: European Volcanological Society (SVE)
During a trip to Erta Ale on 4 December, a group of scientists from SVE-SVG observed no activity in the lava lake in the volcano's South Pit crater. A solidified lava crust covered the crater floor about 15 m below the crater rim. The group also saw that new activity within North crater had produced a solidified lava bulge filling about 4/5 of the crater floor. Degassing from several small hornitos occurred in the central part of the lava bulge. During the evening, ten small incandescent vents were visible at the periphery of the lava bulge. In the morning, two plumes rose above the volcano.
Source: European Volcanological Society (SVE)
A team of French scientists who visited the summit of Erta Ale on 4, and 13-14 January noted significant changes in morphology and activity at the volcano in comparison to several months previous. As has been the case for decades, a lava lake was present in the W part of the S pit crater. It was 120 x 80 m in size and its surface was ~100 m below the crater rim. Observers saw lava fountains spraying above the lake, as well as convection within it. The lava lake and resulting platform were higher than when observed in April 2002. Abundant SO2-rich gases were released that were not noted during earlier visits.
Source: Jacques-Marie Bardintzeff from Université Paris-Sud and Franck Pothé from Terra Incognita
Reports are organized chronologically and indexed below by Month/Year (Publication Volume:Number), and include a one-line summary. Click on the index link or scroll down to read the reports.
Incandescent lava lakes clearly visible in both craters
Card 1132-1133 (18 February 1971) Incandescent lava lakes clearly visible in both craters
"Recent observations from the air (26 December 1970 by M. Reinart, and 4 February 1971 by the team of the Dept. of Geology HS-Univ) revealed important increase of activity at Erta'Ale volcano. Incandescent lava-lakes are now clearly visible in both craters even in the sunlight, meaning their temperatures are above 1,020°C. Fountaining was quite active. The most important fact is the change in shape of the northern pit-crater which has been modified by the sinking of a new pit 80 m across, at its northern edge. The crater has now a somewhat irregular outline (figure 1). The lava-lake, which previously was about 200 m below the upper rim has been lifted about 30 m up. The activity is presently concentrated in the central part of the lake about 100 m across. The edge of the molten lava-lake is surrounded by an embryonic cone, built by fountaining activity.
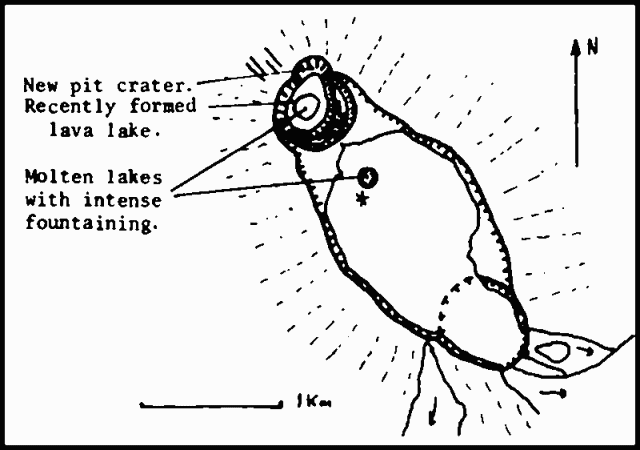 |
Figure 1. Sketch map of Erta 'Ale showing the active lava lakes and new pit crater within the summit caldera, February 1971. Courtesy of Jacques Varet. |
"Erta'Ale volcano, the most active centre of Ethiopia is known for its permanent lava-lake activity since 1967, and most probably since 1906. Annual observations since 1967 by the CNRS-CNR research team in the Danakil depression show a quiet lava-lake activity, with no modification of the shape of the crater, nor new lava flow, since 1963, the date of the aerophotographic survey of the area.
"Erta'Ale is a basaltic shield volcano, 500 m high, with a base 50 km across. On its top an ellipse-shaped sinkhole opens, elongated NNW-SSE, which is the main tectonic direction of the Danakil depression. Two pit-craters, one small, one big, both with a molten lava-lake each, are gaping in the sink's northern half. In 1968 and 1969, the incandescence of the lava was hardly discernable by daylight; it was very conspicuous by night."
Information Contacts: Jacques Varet, Geology Department, Haile Selassie I University, Addis Ababa, Ethiopia; Haroun Tazieff, Paris, France.
Fountaining seen from both active lava lakes
Card 1192-1193 (03 May 1971) Fountaining seen from both active lava lakes
"Erta'ale . . . was inspected by UNDP Geothermal Investigations Project Teams, D. Levitte and E.F. Lloyd on 27 March 1971, and Getahun Demisse and C. James on 30 March 1971. Both teams spent a night at the crater.
"Erta 'Ale crater, a NNW elongated subsidence of the shield's summit, contains two collapse pit craters in its northern half. The northern-most, and largest pit, is floored with pahoehoe lava, black by day but glowing red in some cracks by night. Displaced north of the pit centre is a 3-4 m high spatter cone encircling a lava lake 80 m in diameter. The lava surface fluctuates but is always above the surrounding lava field which may have flowed from the base of the cone or from fissures in the pit floor; one of us (C.J.) reported having observed such a fissure open and a small lava tongue flow from it, and E.F. Lloyd observed a temporary bright red glow SSW of the lava lake on 27 March 1971, probably due to the same cause. This suggests that magma underlies most of the floor of North Pit. High pressure gases escape from chimney-like spatter cones immediately south-east of the lake and on 27 March small lava clots were being erupted from one chimney. Fumaroles on the bench on the south side of the pit discharge gases of high SO2 content. The southern pit, approximately 70 m in diameter, has vertical to overhanging walls and contains a lava lake about 30 m below the lip. Pelee's hair has accumulated around the edge of the pit.
"Activity within both pits is similar. Rarely fountains erupt from the centre of the lakes, but almost continuously from their edge. Lava commonly fountains 10 m high and very occasionally 40 m. Violent fountains, marking the commencement of a cycle of activity, usually erupt at the lake edge when lake level is high and induce movement on the lake surface from the centre of the lake towards the locus of fountaining, and a 1-3 m drop of lake level. They slowly migrate around the lake edge anticlockwise; during 1.5 hours of continuous activity a fountain migrated through 120°. As the fountains decline lake level rises again accompanied by cracking of the cooled lake-crust, extrusion of lava tongues of the cracks and tilting and engulfment of large plates of the crust. Freshly extruded lava is bright orange suggesting temperatures approaching 1,050° C.
"Fountains are actively building, at a rate of tens of cms per day, the spatter cone surrounding North Pit lake and a bench edging South Pit lake. In spite of this, peak lake levels approach close to the lip of the cone and bench, suggesting that either the lava column is rising or that the cone and bench are sinking into the liquid lava as ejecta accumulates. It is probable that the lava column has continuedf to rise slowly since December 1970 when increased activity of Erta'ale was first noticed by Reinart."
Information Contacts: E.F. Lloyd, Addis Ababa, Ethiopia
Overflights during April-October reveal continued lava lake activity
Card 1308 (02 November 1971) Overflights during April-October reveal continued lava lake activity
"Since March 1971, activity has been continuous in both lakes of Erta 'Ale volcano, but no extra-crateric eruption occurred. The level of the lakes remained unchanged.
"Flights over the volcano and photographs taken on 23 April, 28 May, 15 June, 19 September, and 4 October show no change in activity since the last reports. Incandescent lava lakes and fountaining activity are still visible in daylight in both craters.
"The main surface of the northern lava lake formed in December 1970 is unchanged, and its solidification is certainly going on, while the northern lava pool is still very active and surrounded by a double spatter rampart. Detailed photographs provide the following data: Total dimensions of the sink (oval), 1,600 x 700 m; Central pit horizontal dimensions (oval), 65 x 78 m; Central pit depth (edges to molten surface), 15 ± 4 m; Northern pit dimensions of the December 1970 surface, 200 x 300 m; Northern pit height of the walls, 15 m (1st store) and 25 m (2nd store); Northern pit dimensions of the active pool, 48 x 52 m (internal diameter) and 75 m (external diameter)."
Information Contacts: Jacques Varet, Haile Sellassie I University, Addis Ababa, Ethiopia.
Increased activity seen; lava lakes higher
Card 1363 (06 March 1972) Increased activity seen; lava lakes higher
"Captain Lebouteiller reported that Erta 'Ale lava lakes rose substantially in the last few days. In the northern pit, a new fissure, 5 m long, opened in the western part of the recently solidified surface, and a lava stream issued from this fissure covering the whole surface of the pit on 21 February. The whole northern pit is therefore occupied by a molten lava lake, the level of which is still rising. Fissures affecting the northern flank opened to a width of 1.5 m, but no observation was made at the northern extremity of these fissures to check if any lateral emission was occurring. Increase of activity within the northern pit was noticed by other observers last week. The most spectacular activity is observed around the central pit. The lava overflowed this pit at least twice last week. A flow on the southeastern side was still hot on the 21st, while another flow appeared on the southern side of the pit on the 23rd. This is the first overflowing observed in Erta 'Ale. Lava level was very high in that pit (nearly 1 m below the rim), and a new circular open fissure in which red lava was observed suggests possible future enlargment of the pit. Fountaining activity was intense, and projections were thrown to a height of up to ten metres.
"Samples of pelees hair were collected near the central pit, and the flow was sampled. Scoriae from this emission have been petrographically examined. They are made of plagioclase porphyritic basalt. Phenocrysts of plagioclase (an 80-70), olivine, and colourless clinopyroxene float in a yellow glass groundmass. The rock is similar to the basalt recently sampled in the northern pit by H. Tazieff's team. Although lava of apparently similar composition is rising in both craters, the fact that the level of the lava in the central pit is much higher than in the northern one (at least 35 m) is significant. It indicates that no direct high-level communication exists between both lake-feeders."
Information Contacts: Jacques Varet, Haile Sellassie I University, Addis Ababa, Ethiopia.
Lava overflows from central pit
Card 1390 (10 May 1972) Lava overflows from central pit
Observations from the air of Erta 'Ale volcano, and study of numerous detailed photographs taken 13 April 1972 at 1000. lead to the following conclusions:
1. The central pit has overflowed with new lava since the last observation in February 1972 and three important new flows were observed, reaching 500 m long (figure 2).
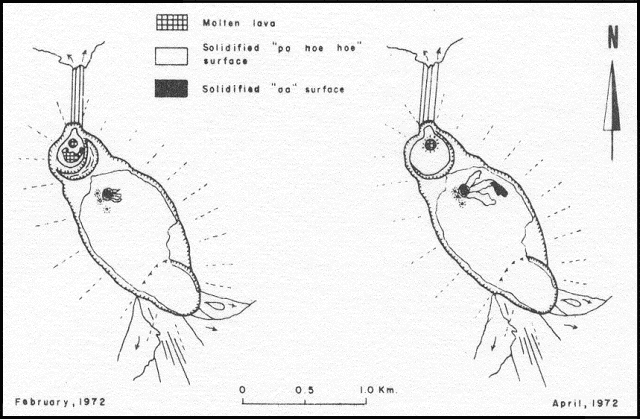 |
Figure 2. Sketch maps of the Erta 'Ale summit region showing lava flows and crater morphology in February and April 1972. Courtesy of Jacques Varet. |
2. Red molten lava in the central pit is still at the level of the rims, surrounded by a low double-rimmed spatter rampart under formation through fountain activity.
3. The lava level in the northern pit has risen since February 1972 and now coveres the upper platform. The active pool is slightly wider.
4. No lava flow has occurred outside the main sink and no change is observed along the open fissures affecting the northern flank of the volcano. This allows the following conclusions: (a) The lava has been continuously rising since February 1972. (b) The lava rose faster in the central pit than in the northern but both levels now appear equal (although no precise geodesy has been done). Both feeders are therefore probably connected at depth although lava is not rising at the same speed. The difference might be attributed to different degassing or different size or shape of the feeders. (c) A continuous process of overflowing is to be expected in the near future, if no lateral eruption or other sudden change happens as the lava has apparently been regularly rising up since 1968 (with 15 m uprising in one year, February 1971-February 1972, equal in both craters).
Information Contacts: Jacques Varet, Haile Sellassie I University, Addis Ababa, Ethiopia.
Both craters still contain active crater lakes; recent N-flank eruption
Card 1759 (20 December 1973) Both craters still contain active crater lakes; recent N-flank eruption
"We are presently observing Erta 'Ale from both air and land. A new track has been built by H.H. Ras Mengesha Seyoum, Governor Tigre Province, reaching the crater. I was personally at the crater for the last two nights, and both craters are still active with permanent lava-lake activity and fountaining. Eruptions are frequently observed from both craters, filling the main elliptic sink and even overflowing the sink towards the south. An eruption also recently occurred on the northern flank, some 100 m long, in a northerly direction. The center of eruption of this flow is located on the northern edge of the crater and is still active (fumaroles). I intend to return to Erta 'Ale within a few days and also during the first days of January."
Information Contacts: Jacques Varet, Laboratoire de Petrographie-Volcanologie, University Paris-Sud, France.
Review of 1973 activity
Card 1775 (14 January 1974) Review of 1973 activity
Erta 'Ale volcano was active throughout 1973, with continuous upwelling of the lava in continuation of the process noticed over the past two years. For two years now basaltic lava (plagioclase porphyritic transitional basalt) has been continuously overflowing the central pit, flowing in a southerly direction. Lava flows, several kilometres long, have completely filled Erta 'Ale sink during 1973 and have covered the southern flank of the shield volcano. This continuous activity built around the central pit a small shield partly covering the three hornitos. The lava lake surface is at the top of this shield, nearly 30 m higher than the 1972 level.
The northern pit is still active, but the level of the lava is estimated to be 35 m lower than in the northern pit. The lava level was, however, higher in the most recent months; lava flows emitted in 1973 have completely covered the surroundings of the northern pit, reaching the level of the main sink rim on the northern side where the lava did overflow. Three important red-glowing hornitos (one needle-shaped) surround the northern pit along a circular fissure. The main sink rim is now, particularly on the north side, intensely altered by fumaroles. It no longer represents a rampart to the lava, and merely constitutes an elongated graben with a NNW direction.
Information Contacts: Jacques Varet, Laboratoire de Petrographie-Volcanologie, University Paris-Sud, France.
Landsat data show two crusted lava lakes
The following is abstracted from Rothery and others (1988). Landsat TM data acquired 5 January 1986 show both lakes. The northern one had shrunk to no more than 60 m across and the S lake was ~150 m in diameter. Temperatures derived from the data suggest that the lakes were quiescent with cool (< 400°C) crust. Incandescent cracks at ~1,150°C occupied < 0.4% of the surface area.
Reference. Rothery, D.A., Francis, P.W., and Wood, C.A., 1988, Volcano monitoring using short wavelength infrared data from satellites: JGR, v. 93, no. B7, p. 7993-8008.
Information Contacts: D. Rothery, Open Univ.
S lava lake remains larger and hotter than N lake
Landsat TM (band 7) data acquired 9 February 1987 suggest that . . . the lava lakes remained similar to . . . January 1986. The S lake was larger and hotter than its N companion, but temperature could not be constrained since the 1987 observation was based only on photographic format data.
Information Contacts: D. Rothery, Open Univ.
Space Shuttle photograph of the Rift Valley in Ethiopia
Astronauts aboard the Space Shuttle in September 1988 photographed the Rift Valley of northern Ethiopia, including Erta Ale volcano.
Information Contacts: NASA JSC Digital Image Collection (URL: http://images.jsc.nasa.gov/).
Small lava fountains observed during overflight
A lava fountain estimated at 1-2 m high was observed in one vent during a 45-minute overflight on 21 September by the Geophysical Observatory's director, a volcanologist, and a geologist. Gas emission was seen at a second vent.
Information Contacts: L. Asfaw, Addis Abeba Univ, Ethiopia.
Lava lake in one of two summit-caldera craters; recent lava overflows of caldera rim
The [September] flight covered the Afar region from the Alebbagu and Hayli Gubbi volcanoes, to lakes Ba Kili and Karum. The N half of Erta Ale's elliptical caldera included two craters. The larger, ~300 m in diameter, was in the northernmost part of the caldera. Two strong fumaroles were active near its S rim, but no lava lake was evident. Two dark fresh-looking lava flows had originated from this crater; one had flowed over the caldera rim to the NNE, the other, to the SW, was confined by the caldera's W wall. A lava lake was observed in the second of the two craters, near the middle of the caldera. The crater was ~100 m in diameter and 80 m deep. The lava lake occupied ~1/3 of the crater's SW bottom. Fountaining and bright-red incandescence were clearly visible. Lava from the second crater had flowed over the S part of the caldera rim.
Information Contacts: P. Vetsch, SVG, Switzerland; L. Cantamessa, Géo-découverte, Switzerland; G. Assefa and L. Asfaw, Addis Abeba Univ.
Lava lake active in S crater during first fieldwork in many years
Geologists climbed to the summit . . . on 10-11 November, for the first time in many years. Members of the group made the first known descent into the active S crater . . . (figure 4). The active pit-crater was >100 m in diameter, with vertical walls and a lava lake at 100 m depth (figure 5). A winch and ropes were used to descend the E wall on the morning of 11 November for a 2-hour visit. The 40 x 70 m lava lake occupied the W part of the crater. Air temperature at the bottom of the crater was 35°C, ~5°C cooler than the ambient temperature at the rim. Wearing gas masks, geologists approached to within 2 m of the lava lake. The lake was continuously active with 4-5-m-high lava fountains in four locations and rapid motion of the lake surface outward from the center. The N crater was confirmed to be inactive, with the bottom full of fallen rock, although there were two strong fumaroles on the S rim.
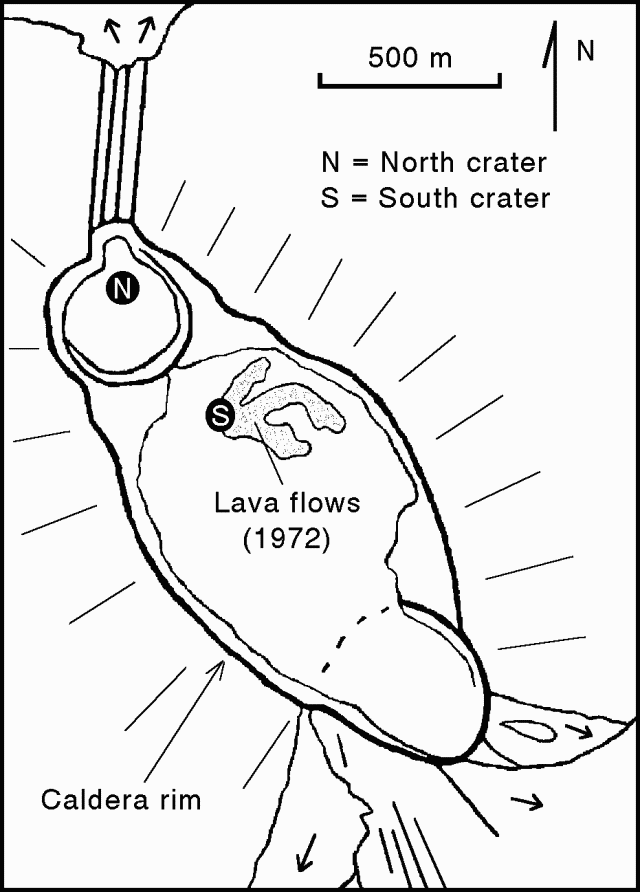 |
Figure 4. Summit caldera of Erta Ale, April 1972, showing the N and S craters. Lava spillways over the caldera rim are shown diagrammatically. Sketch by Jacques Varet. |
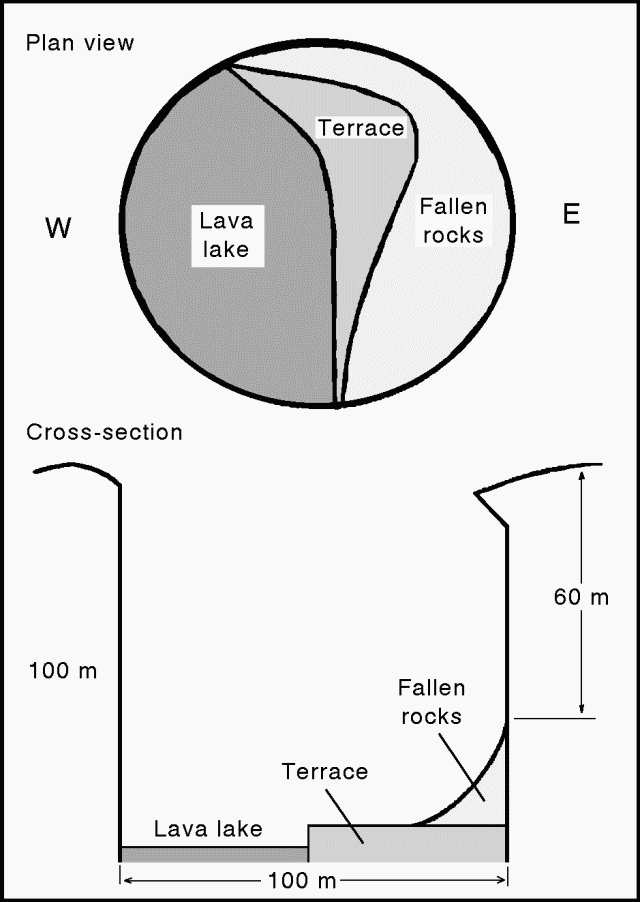 |
Figure 5. Diagrammatic plan view (top) and cross-section (bottom) of the active S crater at Erta Ale, November 1992. Courtesy of P. Vetsch. |
Information Contacts: P. Vetsch, M. Vigny, and A. Schussele, SVG, Switzerland; L. Cantamessa, Géo-découverte, Switzerland; G. Pareau, Assoc of Alpine Guides of Chamonix, France; P. Villemin and A. Curvelier, Gaumont Television, Paris, France.
Additions to previous report
The November expedition . . . was organized by Haroun Tazieff in connection with a film about his volcanological work, produced by Gaumont Television. Climbers who descended into the active crater were Luigi Cantamessa (Géo-découverte), Gilbert Pareau (Association of Alpine Guides of Chamonix) Marc Vigny (SVG), Pierre Villemin (cameraman), Alain Curvelier (sound engineer), and Andre Schussele (medical doctor).
Information Contacts: P. Vetsch, SVG, Switzerland; L. Cantamessa, Géo-découverte, Switzerland.
Review of satellite data reveals lava lake activity in June 1992
"The visit . . . on 10-11 November 1992 showed that since the last recorded observation, made using Landsat TM data from 9 February 1987, the lava lake in the N crater had disappeared (presumably frozen over and collapsed), but that the lava lake in the S crater . . . was still active. This interpretation is consistent with visual observations made during an aircraft overflight on 21 September 1992 (17:8-9).
"New satellite data further narrow the window of uncertainty about when the N lava lake became inactive, and provide evidence of the continuity of activity at the S lava lake. Data from the Japanese Earth Resources Satellite-1 (JERS-1, also known as Fuyo-1) recorded on 9 June 1992 show the S lava lake to be a strong source of short-wavelength infrared radiation, which is convincing evidence that it was active. However, there is no trace of any short-wavelength infrared thermal radiance from the N lava lake, indicating that the lake had already ceased to exist.
"JERS-1 was launched on 11 February 1992. Its optical sensors record images in three visible channels, and (more importantly for thermal remote sensing of volcanoes) in four short-wavelength infrared channels: 1.55-1.77, 2.01-2.12, 2.13-2.25, and 2.27-2.40 µm. The image pixels are 18 m across. This contrasts with Landsat TM which has 30 m pixels in two short-wavelength infrared channels (1.55-1.75 and 2.08-2.35 µm). This is believed to be the first demonstration that JERS-1 data can play a useful role in volcano monitoring. The thermal anomaly covers an approximately equidimensional area 4-5 pixels across in all four short-wavelength infrared channels, which is roughly consistent with the size of the lava lake seen during fieldwork five months later."
Information Contacts: D. Rothery, Open Univ.
Lava lake still active with fountains as high as 15 m
Lava lakes have been present since 1967, and possibly 1906, although the N lava lake became inactive between 1988 and 1992. Recent ground observations were reported in September and November 1992. Observations have also been made using satellite imagery. New observations were made during 6-11 December 1995 by a team from Spele-Film and the Societe de Volcanologie Geneve while working for a French television network.
Only fumarolic activity was observed from the large crater (~300 m diameter) in the N part of the caldera. Fumaroles were concentrated SW of the pit within the crater, with some emissions coming from the inside wall and the slope of talus covering the pit floor. Almost all of the visible fumes came from the main pit, and seemed more abundant than in November 1992. A secondary pit crater with a diameter of ~15 m was seen in the SE part of the main pit.
Within the central part of the caldera, the S lava lake is located at the top of a small lava shield. The N and E flanks of this shield are partially covered by abundant lava flows originating from the N crater. The S flank of the shield is dominated by a large inactive cone. No fumes were visible, but the air near the pit-crater rim was very hot, frequently making it difficult to breathe without a mask. The diameter of the S pit-crater was ~140 m (based on a measured circumference of 446 +- 2 m), and the lake was 90 m below the W rim. The lava lake was similar in size and location to one observed in 1992, covering an area of ~60 x 100 m in the WSW part of the pit (figure 6). However, the level of the lake was believed to have risen ~5-6 m. Two slope breaks on the generally flat pit floor, not present in 1992, suggest that the entire floor may have subsided.
 |
Figure 6. Sketch showing a cross-sectional view of the central pit-crater (S lava lake) at Erta Ale, December 1995. Courtesy of P. Vetsch. |
Lava lake activity was characterized by intermittent fountaining from as many as four locations at a time. No regular pattern was noted, but fountaining was more frequent near the SW border of the lake, and the more intense fountains (5-15 m high), started near the center of the lake and migrated to the border. During the stronger fountaining phases, a large raft of cooled surface lava moved towards the lake center. The lava lake was generally more active than in 1992. Pele's hair was frequently seen above the fountains, and some rose on the hot air out of the pit.
Information Contacts: P. Vetsch, Societe de Volcanologie Geneve, B.P. 298, CH-1225 Chene-bourg, Switzerland; L. Cantamessa, Geo-Decouverte, 65 rue de Lausanne, CH-1202 Geneva, Switzerland; G. Farve and C. Rufi, Spele-Film, Borex, Switzerland; C. Peter, 14 Haupstrasse, D-82547 Eurasburg, Germany.
Dynamic, molten lava lake in S crater during November 2000-February 2001
The Afar National Regional State has approved a program to grant access to Erta Ale volcano by either land or air transportation. The program, which will precede the formation of a "National Park of Volcanoes," enables visitation by natural science field workers. It also allows for traditional mining and salt transportation by caravans and seeks to protect the traditional life of the region's inhabitants.
Observations during 14 November 2000. Luigi Cantamessa (Géo-Découverte), accompanied by government representatives, visited the N part of the elliptical summit caldera (figure 7) on 14 November 2000. Little had changed since last described in December 1995 (BGVN 20:11/12), but continued collapse of the N crater wall was noted. Dense smoke came from the S rim of the crater, with a very strong smell of sulfur, as in the past. GPS measurements of elevation indicated that the E wall of the N crater was ~600 m high and the N rim, the highest point of the volcano, was ~15 m higher.
The S crater (figure 8), in the central part of the caldera, contained a molten lava lake and had undergone some changes since the 1995 visit. A portion (1-2 m thick) of the NE wall had collapsed. The level of the lava lake, still in the W part of the crater, showed significant variations. The terraces on the E side of the crater appear to have been swamped by lava, after which the lake level apparently receded. The present level appeared to be lower than in 1995. A terrace of 2-3 m width now surrounds the lake at the foot of the crater walls. Intense activity was observed at the lake's surface. There were rapid movements of the surface from S to N. Many lava fountains reached ~10-15 m high.
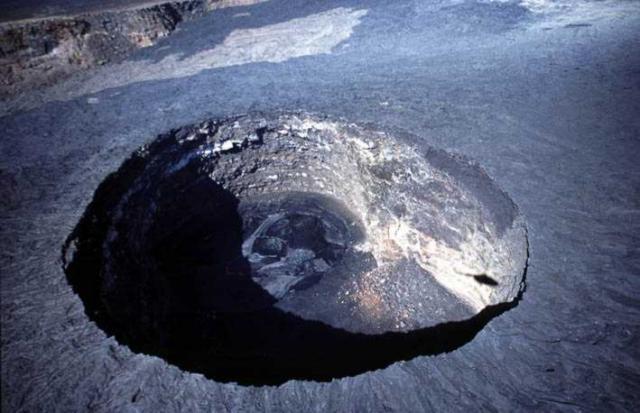 |
Figure 8. Aerial photograph looking down into the southern crater of Erta Ale. The crater is about 145 m in diameter, with an active lava lake. Courtesy of L. Cantamessa, Géo-Découverte. |
Observations during 29-30 January 2001. An expedition sponsored by Aventure et Volcansmade crater observations for 48 hours during 29-30 January 2001. Because of the extremely dry and hot climate that prevails in this region, smoke or vapor rarely obscured visual observations. The N crater exhibited only fumarolic activity, but due to thick fumes from its southern portion, gas masks were necessary for those who climbed into the crater.
The S crater was determined to be ~170 x 130 m, with the active lava lake (figure 9) on the W side having a diameter of ~121 m. The lava lake was located, based on GPS measurements, at 13° 36' 11" N, 40° 39' 49" E. Cyclic activity, approximately every 4 hours, consisted of the thin, dark crust on the lake surface splitting and causing a "fantastic" bubbling of the liquid lava across the entire ~12,000 m2 of the lake surface. Vigorous degassing created lava fountains 10-20 m high. Several times local collapses were seen which mainly affected the vertical walls in the SE part of the crater. The level of the lava lake remained stable.
Observations during 13-18 February 2001. Between 13 and 18 February 2001 two groups from the Société de Volcanologie (SVG), in an expedition organized by Géo-Découverte, reached the volcano by land and by helicopter (3 days later). The principal topographic elements in the N part of the caldera were the subject of GPS and telemetric measurements. The active S crater contained an elliptical lake (80 x 100 m) with a surface level 80 m below the rim and lava fountains rising 5-10 m high.
The relative absence of gas in the active crater allowed excellent observations. Over a period of 14 hours, Yves Bessard and Alain de Chambrier recorded details of the activity occurring at the lava lake, including lake movements and lava fountains. The surface of the lake was renewed approximately every 10 minutes. A continuous video recording over a period of 77 minutes was also taken from the edge of the lava lake at the bottom of the crater.
Systematic measurements of fumarole temperatures were made, primarily on the edge of the N crater and the external N edge of the caldera; values ranged from 60°C to more than 260°C at the strongly active N-crater fumaroles.
The last previous thermal measurements at Erta Ale were carried out in the 1970s by a team led by Haroun Tazieff; the most recent temperatures reported in the literature were obtained from infra-red satellite data (work mainly carried out by Oppenheimer, Francis, and Rothery). The thermal measurements collected by Marc Caillet, Steven Haefeli, and Pierre-Yves Burgi during 13-15 February 2001 are summarized below; more details on this fieldwork will be published in a journal paper.
The SVG team used a pyrometer, which works by remotely measuring the infrared radiations emitted by the lava, for the temperature measurements. Temperature calculations need an emissivity factor, the determination of which required an approach to the lava lake. For the temperature measurement of the crust, the only accessible part of the lake, the following protocol was followed. Using a steel wire, a steel sheet of 18 x 18 cm (8 mm thickness) containing a hole in which the thermocouple was inserted was deposited on the crust of the lake. Because of the distance separating the terrace from the lake (estimated at 15 m), this required the coordination of three people (Marc Caillet, Steven Haefeli, and Pierre-Yves Burgi). Caillet, standing where the ambient temperature reached 300°C, was equipped with a reflective cloth and used a large 8-m steel pole to move the thermocouple away from the wall.
Once the steel sheet was in contact with the lake's crust, temperature measurements were carried out every 30 seconds for 10 minutes, then each minute during the next 20 minutes, until the temperature stabilized. The temperature recorded at this time was 350°C. A pyrometric measurement in the same area of the thermocouple indicated a temperature of 342°C (with an emissivity index set to 0.9 on the pyrometer). By combining the temperatures obtained with the thermocouple and the pyrometer, and knowing the wavelength used by the pyrometer, an emissivity factor of 0.74 was determined. By collecting a sample of basalt, it was possible to confirm this value by the use of a furnace.
Acquisition of temperatures at various lake locations was carried out by pyrometry. Continuous pyrometric measurements were taken over periods of several tens of minutes (with a measurement each second) and were collected on a portable computer. The crust, many faults, and lava fountains were the three types of areas considered. These measurements were made from the edge of the pit and from the lower terrace. The measurements made near the lake were of primary importance because both the absorption of radiation by magmatic gases between the source and the observer and the enlarging of the pyrometer field of view with distance are two factors which tend to distort measurements. A difference of about 25°C was observed between the maxima measured from the edge and the bottom of the pit. In addition, the temperature measurements were taken at night in order to avoid any pollution due to the solar radiation (which can distort values up to 90%). The highest recorded temperature, 1,217°C, was found in a lava fountain. The temperature of the crust of the lake was very variable, 290°C near the cliffs to 520°C in the center of the lake, with an average of 474°C.
Information Contacts: Luigi Cantamessa, Geó-Découverte, 12-14 rue de Cendrier, CH-1201 Geneva, Switzerland (URL: http://geo-decouverte.ch/); Annie Buard, Christophe Toussaint, Jean Claude Boissonnet, Philippe Roy, and Guy de Saint-Cyr, Aventure et Volcans, 73 cours de la Liberté, 69003 Lyon, France; P. Vetsch, Marc Caillet, Steven Haefeli, and Pierre-Yves Burgi, Société de Volcanologie (SVG), PO Box 6423, CH-1211 Geneva 6, Switzerland (URL: http://www.volcan.ch/).
Frequent changes in the active crater morphology and lava lake level
Over the last few years the Afar National Regional State has allowed a program of visitation to Erta Ale volcano by natural science field workers. As a result, numerous expeditions have visited the volcano since November 2000 and January-February 2001 (BGVN 26:12). The following brief reports are a result of some of these visits during January, February, and April 2002, November-December 2002, and January 2003. Typical lava lake activity was commonly reported, but some changes, such as a significant changes of the lake level, were also noted.
Activity during January 2002. Members of the Société de Volcanologie Genève (SVG) visited Erta Ale at the end January 2002. The lava lake remained elliptical with a N-S axis of ~130-133 m and an E-W axis of ~104-111 m; the width had increased ~10 m as a result of crumbling of the terrace along the lake edge. The size of the pit-crater was the same, with an E-W diameter of ~170 m, while the height of the vertical E wall was 46 m. Attempts to measure CO2 and SO2 concentrations inside the crater on 27 January 2002 were unsuccessful because the gas concentrations were below the detection limits of the Dräger tubes (10 ppm SO2 and 0.5% CO2).
Activity during February 2002. During a 14-19 February 2002 stay on Erta Ale by a team that included Roberto Carniel and Jürg Alean (Stromboli Online), the lava lake was active and produced spectacular fountains of lava. The lake level oscillated by several meters during their observation period. Seismic measurements were conducted along with thermal and video recordings of the lake.
Activity during April 2002. During 12-21 April 2002 a group from SVG led by Franck Pothé and Evelyne Pradal visited the volcano and reported significant changes in the morphology and activity of the lava lake since January 2002. The level of the lake had risen ~15 m and its surface area had decreased by ~33%. Over a 36-hour period the level varied intermittently by 1-2 m, the variation sometimes occurring within several minutes. Activity on the lake was intense, with continuous degassing and small lava fountains ~15 m high.
Activity during November-December 2002. A German group from Volcano Expeditions International visited the volcano during November-December 2002. They reported that the S crater was ellipsoidal with dimensions of ~130 m N-S and ~160 m E-W (figure 10). The lava lake occupied about half of the crater, and the lake surface was ~90 m below the W rim of the S pit. The remaining area in the E was covered by basalt that had a terrace ~45 m below the crater rim (figure 10). Previous observations had located the terrace at ~70 m below the rim. It was widely covered with talus; hence, the lava lake must had risen up to the present terrace level between spring 2002 and this visit. Almost no talus was found on the terrace, indicating that the lava cover was not old. Lava fountaining up to 20 m high occurred mainly in the W, S, and center areas of the crater lake. GPS measurements were used to accurately map part of the caldera rim and locate some key points (figure 11).
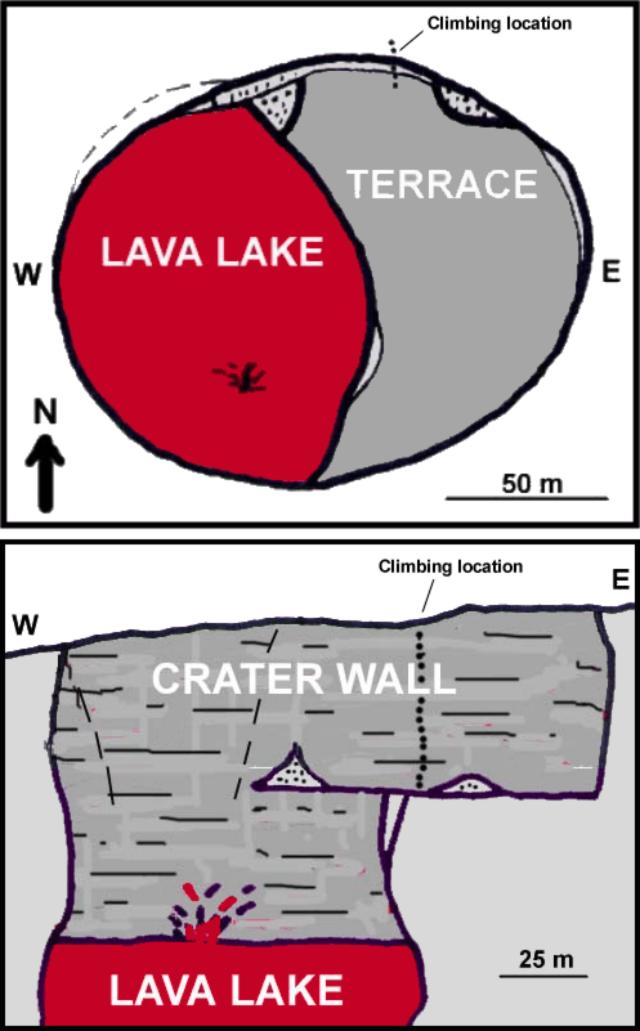 |
Figure 10. A sketch map (top) and E-W cross-section (bottom) of the active S crater at Erta Ale on 4 December 2002.Courtesy of C. Weber. |
Several earthquakes were felt during the visit. No seismic equipment was present, but five events were felt on 4 and 5 December 2002. No significant change in the lava lake was noticed during these events. Strong fumarolic activity was observed inside and outside the NW crater as well as on the outside of the caldera rim. The surface near the crater rim was broken by cracks in concentric circles, and the crater walls were formed of very unstable material. On 6 December three large rockfalls from crater wall collapses occurred along ~50 m of the crater wall circumference within a few minutes. About 40 m of the wall height collapsed with an estimated average thickness of 10 m, thus ~20,000 m3 of material slid into the lake, creating a large cloud of orange-brown dust that filled the pit and generated large amounts of Pélé's Hair.
Activity during January 2003. French teams from Terra Incognita visited the summit on 4 and 13-14 January 2003. The ~120 m long by 80 m wide lava lake was still in the W portion of the S pit crater; its surface was ~100 m below the crater rim (figure 12). The new platform, located ~50 m below the rim, was in the E part of the crater and covered ~25% of the crater floor. Gas emissions were abundant, and were assumed to be rich in SO2 based on their blue color and strong odor. The lava lake exhibited convection and lava fountains.
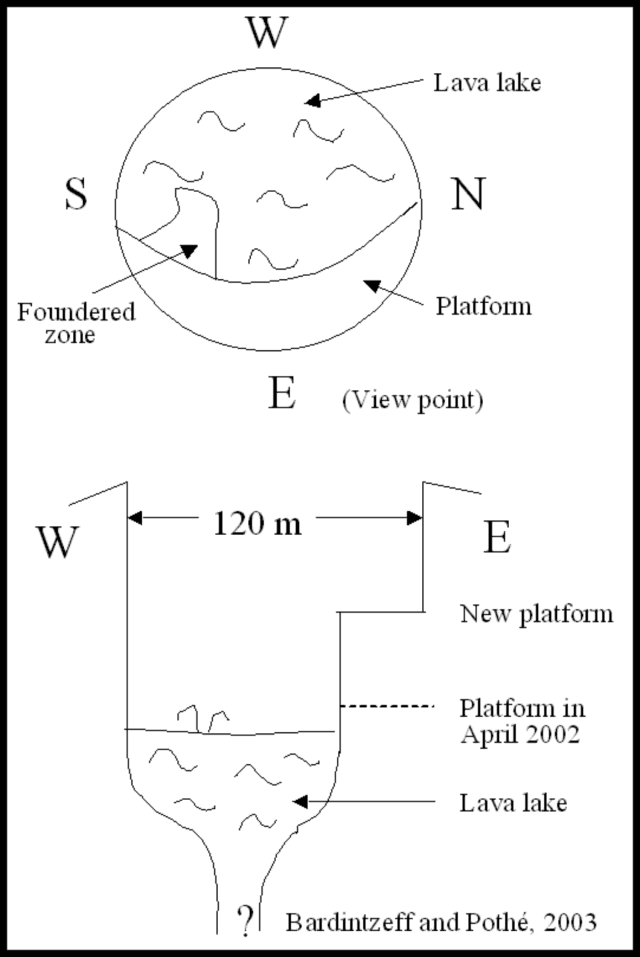 |
Figure 12. Sketch map and cross-section of the Erta Ale lava lake, January 2003. Courtesy of Jacques-Marie Bardintzeff and Franck Pothé. |
Information Contacts: P. Vetsch, Marc Caillet, Steven Haefeli, and Pierre-Yves Burgi, Société de Volcanologie Genève (SVG), PO Box 6423, CH-1211 Geneva 6, Switzerland (URL: http://www.volcan.ch/); Jürg Alean, Stromboli Online, Rheinstrasse 6, CH-8193 Eglisau, Switzerland (URL: http://www.swisseduc.ch/stromboli/); Christoph Weber and Lothar Fritsch, Volcano Expeditions International (VEI), Muehlweg 11, 74199 Untergruppenbach, Germany; Jacques-Marie Bardintzeff, Université Paris-Sud, F-91405 Orsay, France; Franck Pothé, Terra Incognita, CP 701, 36 quai Arloing 69256 Lyon Cédex, France.
February 2004 expedition finds molten-surfaced lava lake nearly gone
In February 2004 an expedition led by German scientists visited Erta Ale. Afterwards, an overflight completed the survey of volcanic activity. Of significance was the discovery that an earlier lava lake had largely disappeared. Information from their report follows.
German scientists were at Erta Ale during 9-13 February 2004. They explored areas around the S crater of the volcano, which for the past several years has contained an active lava lake (see BGVN 28:04 and 26:12). The S crater retained only a very small fraction of the former lava lake. When visited it stood ~ 15 m in diameter, located roughly in the center of the old lake. Around the small lake were many active gas vents, and there was a hornito, about 2 m tall, on the SE side. Behind its ~ 1.5-m-high walls, the lake's lava changed levels and occasional lava fountains rose to ~ 10 m high.
On 12 February the expedition team descended to the second terrace (~90 m below the rim) of the S crater, to the surface of the former lake, and approached the small elevated lake. Samples of newly ejected lava were collected, and some were given to Gezahegn Yirgu at the University of Addis Ababa for analysis. Samples retained by the expedition team showed white crystals, approximately 1-2 mm in size, embedded in black material. On the evening of 12 February the team witnessed an overflow of the little lake, flooding the NW half of the second terrace. Parts of the western lake wall eventually collapsed, causing a lava flood wave as well as more violent fountaining (up to 20 m). This event lasted approximately 2 hours.
The entire crater was fogged by fumaroles, which were mainly active in the SE corner of the first terrace (~ 50 m below the rim). Gas masks were necessary inside the crater. From the smell and (blueish) color, these gases contained a high quantity of SO2.
No earthquakes were felt during the visit.
On 21 February a low overflight was made across the volcano. There were no more signs of a lava lake, and only three hornitos were active. Although the flight was made during the day, the glow allowed the hornitos to be visible. Upon return, Chris Heinlein noted that he found photos on the web by Luigi Cantamessa showing that during 15-17 November 2003 the lava lake was also largely gone.
Information Contacts: Carsten Peter, Meilenbergerstr. 1, D-82057 Icking-Dorfen, Germany; Chris Heinlein, Kreuzelbergstr. 62, 76189 Karlsruhe, Germany; Arne Kaiser, Institute of Geophysics, University of Hamburg, Bundesstraβe 55, 20146 Hamburg, Germany; Luigi Cantamessa, Geó-Découverte, 12-14 rue de Cendrier, CH-1201 Geneva, Switzerland (URL: http://geo-decouverte.ch/); Gezahegn Yirgu, Department of Geology and Geophysics, Faculty of Science, Addis Ababa University, P.O. Box 1176, Addis Ababa, Ethiopia (URL: http://www.aau.edu.et/natural-sciences/geology/).
Declining thermal output from small lava lake since early 2003
Field expeditions during November 2003 and February 2004 found that the molten-surfaced lave lake at Erta Ale had almost disappeared (BGVN 29:02). HIGP MODIS Thermal Alerts satellite observations of infrared emissions from the volcano during January 2001-March 2004 confirmed the declining activity levels. MODIS acquires an image of subaerially active volcanoes such as Erta Ale an average of four times in each 48-hour period, twice by day and twice by night. Elevated levels of thermal emission (e.g. active lava flows) are detected by the MODVOLC algorithm, and collated (at http://modis.higp.hawaii.edu).
The level of radiative power output from the summit of Erta Ale (figure 13) averaged 75 MW during 2001 and 2002, dropped significantly during the first five months of 2003, and even further between June and November 2003 to a level beneath the detection limit of the algorithm (~ 10 MW). With the exception of one isolated thermal spike in December 2003, this decline in thermal output continued up to the time of the MODIS report (March 2004). Between December 2002 and March 2004, the average rate of power loss fell to approximately 30 MW. The field-expedition reports corroborated the MODIS observations that a substantial decline in the level of lava-lake activity at Erta Ale occurred since January 2003.
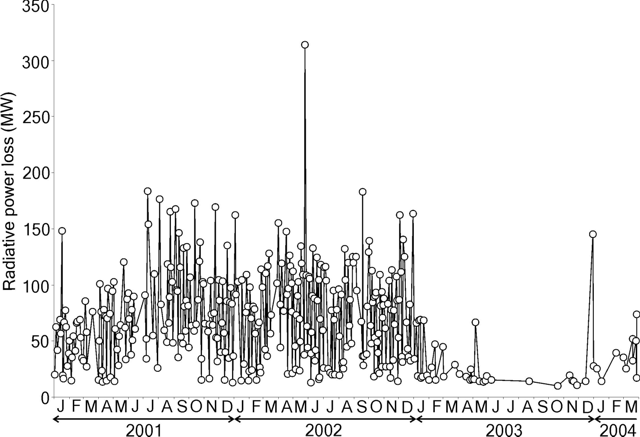 |
Figure 13. Level of radiative power output from the summit of Erta Ale, January 2001-March 2004. Data courtesy HIGP MODIS thermal alert system. |
Observations during November-December 2003. Between 22 November and 6 December 2003, Joshua Jones and Roberto Carniel recorded continuous seismic, thermal, and acoustic data during fieldwork at the volcano. During this time they took several digital photographs showing a small but active lava lake in the southern crater of the summit caldera, and overflows were observed into the southern crater floor. The lava lake was approximately 20 m across.
References. Wright, R., and Flynn, L.P., 2004, Space-based estimate of the volcanic heat flux into the atmosphere during 2001 and 2002: Geology, v. 32, p. 189-192.
Information Contacts: Rob Wright and the HIGP MODIS Thermal Alerts Team, Hawaii Institute of Geophysics and Planetology, University of Hawaii, 2525 Correa Road, Honolulu, HI 96822, USA (URL: http://modis.hgip.hawaii.edu/); Joshua Jones, Department of Earth & Space Sciences, Box 351310, Seattle, WA 98195-1310, USA; Roberto Carniel, Dipartimento di Georisorse e Territorio, University of Udine - via Cotonificio, 114 - 33100 Udine, Italy.
On 4-5 December 2004 visitors noted active hornitos but solidified lava lake
Two teams sent reports on Erta Ale's behavior in December 2004. On 1-5 December the visiting team included Jacques-Marie Bardintzeff and a group from Ushuaia Nature, and on 4-5 December the team consisted of the volcanology travel group SVE-SVG. Both groups submitted similar reports and commented on substantial changes they observed compared to conditions described in past reports (most recently, BGVN 29:08). Although Erta Ale frequently contains a lava lake with an open surface of molten lava, that was not the case this time.
The lava lake's surface had chilled within the small (~ 200-m-diameter) S pit crater (figure 14). A solidified lava crust covered the crater floor. The crust's surface sat ~ 15 m below the W crater rim, and ~ 30 m below the E crater rim. On top of this crust stood four coalesced hornitos in the SE part of the S crater (figure 10). They were ~ 10 m high and represented the only portion of the crust where molten material was in evidence. Two hornitos emitted high temperature (more than 500°C) SO2-rich gas. Another hornito contained glowing molten lava. During the night of 4 December the SVE-SVG group saw degassing and incandescent lava at the summit of two of these hornitos. Bardintzeff described sampling molten material from 12 m depth, in one of the hornitos using a cable and an iron mass (figure 15).
The SVE-SVG team noted recent activity within the North crater, where an uplifted area termed a 'lava bulge' had solidified. It covered ~80% of the crater floor and rose to about 20-25 m below the crater rim. In the lava bulge's central area, strong and noisy degassing of SO2 spouted from several small hornitos. At the bulge's periphery the observers saw ten small incandescent vents. Subsequently, two plumes rose above the volcano.
Information Contacts: Jacques-Marie Bardintzeff, Laboratoire de Pétrographie-Volcanologie, Bât. 504, Université Paris-Sud, F-91405, Orsay, France (URL: http://www.lave-volcans.com/bardintzeff.html); Henry Gaudru, Société Volcanologique Européenne (SVE), C.P.1-1211 Geneva 17- Switzerland (URL: http://www.sveurop.org/).
Hornitos on chilled lava lake surface in January 2005; December 2004 glass analyses
An expedition led by the volcanology travel group SVE-SVG visited Erta Ale during 22-23 January 2005. The observed eruptive activity was generally unchanged since November 2004 (BGVN 29:11). Degassing was still occurring from three of the four hornitos in the SW part of the South crater, but had decreased slightly in comparison with their December 2004 observations. The hornitos stood ~ 10 m high and represented the only portion of the lava crust covering the crater floor where gas emissions were seen. A window in the upper part of one of the hornitos permitted observation of glowing molten lava.
On 23 January 2005 members of the group descended into the crater and collected recent lava that had poured out from the hornitos during partial collapse. Degassing activity (mainly SO2) from the North crater had also slightly decreased in comparison with early December 2004 observations.
From a small terrace in the NW part of the crater it was possible to observe degassing from several hornitos (some several meters high in the central part of the 'lava bulge'). Near the NW wall of the crater two small, red glowing areas were visible at the summit of two other hornitos.
Chemical analyses. The following complements a previous Erta Ale report by Jacques-Marie Bardintzeff from November-December 2004 (BGVN 29:11). He sampled molten lava at 12 m depth in one of the hornitos of the crater on 5 December 2004 using a cable and an iron mass, and subsequently analyzed the chilled glass sample using an electron microprobe (table 1).
Table 1. Major-element chemistry of Erta Ale lava resulting from 18 representative glass analyses. Courtesy of Jacques-Marie Bardintzeff.
| Oxide | Weight percent |
| SiO2 | 48.61-49.64 |
| Al2O3 | 12.99-13.60 |
| TiO2 | 2.37-2.66 |
| MgO | 6.13-6.39 |
| FeO | 11.25-12.20 |
| Cr2O | 0-0.11 |
| MnO | 0.03-0.34 |
| CaO | 10.63-11.41 |
| Na2O | 2.81-3.08 |
| K2O | 0.54-0.69 |
| Total | 97.44-98.71 |
Analysis also revealed some plagioclase phenocrysts (An = 80.9-70.4) as well as scarce clinopyroxene microcrysts (Wo = 43.5-44.0, En = 45.8-45.9, Fs = 10.2-10.6). Compared to the matrix glasses shown in table 1, glass inclusions trapped in plagioclase were richer in SiO2 (50.07-50.41 wt%) and poorer in TiO2 (1.84-1.95 wt %).
Correction. French scientists led by Jacques-Marie Bardintzeff and Franck Pothé visited the summit of Erta Ale on 13-14 January 2003 (BGVN 28:04). At that time the lava lake in the S pit crater was 180 m long, not 120 m as previously reported.
Information Contacts: Jacques-Marie Bardintzeff, Laboratoire de Pétrographie-Volcanologie, Bât. 504, Université Paris-Sud, F-91405, Orsay, France (URL: http://www.lave-volcans.com/bardintzeff.html); Franck Pothé, Terra Incognita, CP 701, 36 quai Arloing 69256 Lyon Cédex, France; Henry Gaudru, Georges Kourounis, Derek Tessier, Brian Fletcher, Alexander Gerst, and Motomaro Shirao, Société Volcanologique Européenne (SVE)-Societe Volcanologique (SVG), Geneva, C.P.1, 1211 Geneva 17, Switzerland (URL: http://www.sveurop.org/).
Additional observations of the shrinking lava lake in January 2004
The most recent reported observations of Erta Ale made during 22-23 January 2005 (BGVN 30:01) described hornitos on a chilled lava lake surface. The following report is courtesy of Tony Waltham, who recently authored an article discussing the Afar Triangle (Waltham, 2005). These observations from January 2004 further illustrate the shrinking of the lava lake previously noted by a February 2004 expedition (BGVN 29:02).
A group of English geologists who visited on 15-16 January 2004 observed an active lava lake estimated at about 25 m across almost in the center of the lower lava floor within the S crater (figure 16) with a turbulent lava surface ~ 3 m below its rim. Crusting was minimal, and there was no development of substantial lava rafts. Modest fountaining occurred mainly over the zone of rising lava under the southern margin, and none was observed to rise more than 3 m to rim level. A hornito just a few meters high was active on the SE side (figure 17), a few meters from the lake, and night viewing revealed incandescence from a few other fissures across the old lava floor. Minimal fumarolic activity within the crater generated some periods of thin blue haze, though there were major emissions of sulphurous fumes from many fumaroles and fissures around the remains of the old northern crater.
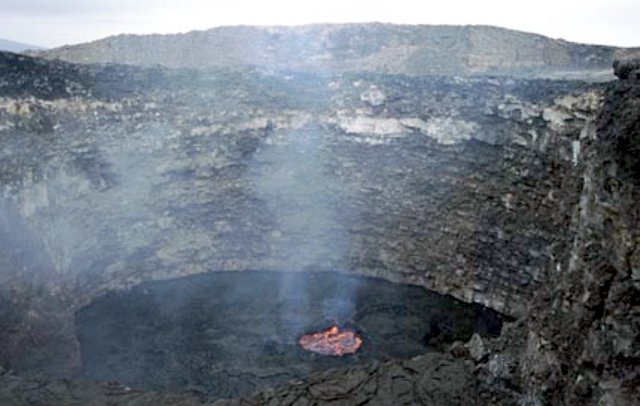 |
Figure 16. Erta Ale's remaining lava lake in the lower floor of the South crater, 15-16 January 2004. Courtesy of Tony Waltham. |
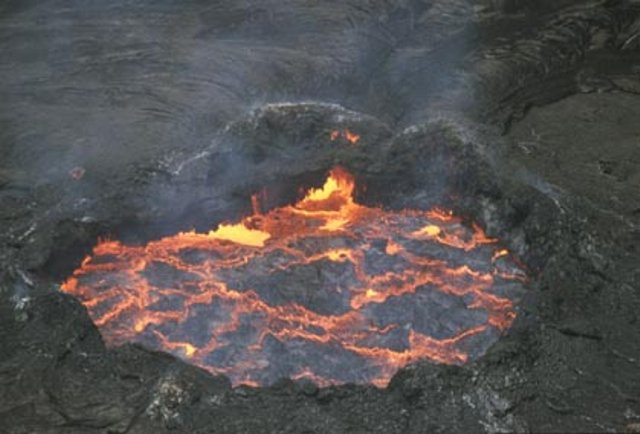 |
Figure 17. Telephoto view of Erta Ale's lava lake, with a hornito barely visible on the left side, 15-16 January 2004. Courtesy of Tony Waltham. |
Reference. Waltham, T., 2005, Extension tectonics in the Afar Triangle: Geology Today, v. 21, no. 3, p. 101-107.
Information Contacts: Tony Waltham, 11 Selby Road, Nottingham NG2 7BP, United Kingdom.
Agitated lava lake during time of September 2005 earthquake swarm ~ 100 km S
In conjunction with their investigation of eruptive activity related to a swarm of earthquakes at Dabbahu/Boina, a team of geologists from Addis Ababa University (AAU) also undertook field observations at Erta Ale, with the aid of a military helicopter (see map in this issue of BGVN, the report on Dabbahu/Boina). What follows is their report combined with other information they gathered.
Between 21 and 24 September 2005, the local people saw, from a distance, red and glowing light shooting and rising into the air above Erta Ale. This was an indication that a Strombolian eruption probably occurred, emitting a significant volume of fresh magma within and possibly out of the pit.
The AAU team surveyed Erta Ale's craters at about 0930 on 26 September from the helicopter, as landing was not possible. Within the small southern pit crater of the main crater, they observed a new cone-shaped construct and the presence of an actively convecting lava lake in the center of the new cone. The lava lake occupied the entire lower/inner pit with hot red lava visibly overturning at the edges of the pit. Molten lava was breaking through the lake's solidified black crust. In the northern pit crater, there was a conspicuous solidified lava bulge with dark emissions along the crater walls. No incandescent lava was visible in this pit.
In addition to their direct observations, the AAU team studied videos taken by Walta Information Center of the southern pit on November 2004 and 26 September 2005. The comparison revealed significant changes, particularly in the morphology and activity of the southern pit crater. In the later videos the main crater/pit had widened significantly, with portions of the earlier crater walls having collapsed into the lava lake. There was a new cone-shaped construct within the crater in place of the previous platform that existed between the rim of the outer crater/pit and the lower pit. The new cone was estimated to be some 20 to 30 m from the top of the crater rim. The new cone apparently contained layers of basaltic scoria covered by fresh lava flows. The combined thickness of tephra and lava was estimated to be 20 to 30 m. The lava lake occupied the entire width of the inner crater/pit and was then bounded by steep sides. The lake's surface stood 20 to 30 m below the cone's top.
Anthony Philpotts accompanied Gezahegn Yirgu and colleagues from Addis Ababa University faculty on a helicopter visit to Erta Ale on 15 October. They found the lava lake incredibly active, much more so than when filmed by earlier visitors in March 2005.
A brief review of satellite thermal anomaly data from MODIS/MODVOLC revealed an absence of thermal activity between 12 October 2004 and 31 March 2005, with a renewal beginning on 31 March 2005, increasing substantially in mid-2005 and continuing vigorously through at least 2 November 2005.
Information Contacts: Gezahegn Yirgu, Department of Earth Sciences, Addis Ababa University, P.O. Box: 1176, Addis Ababa, Ethiopia; Walta Information Centre, Woreda Kirkos, Kebele 05, House No. 095, PO Box 12918, Addis Ababa, Ethiopia (URL: http://www.waltainfo.com/); Anthony Philpotts, University of Connecticut, U-45, Beach Hall, Storrs, CT 06269, USA; MODIS/MODVOLC Thermal Alerts Team, Hawaii Institute of Geophysics and Planetology (HIGP), University of Hawaii, 2525 Correa Road, Honolulu, HI 96822, USA (URL: http://modis.higp.hawaii.edu/).
Molten lava lake observations as late as 3 January 2006
Viviane Grandjean wrote of her observations at Erta Ale during 24 December 2005-3 January 2006 in Bulletin No. 57 of the Société de Volcanologie Genève. On 26 December she saw the lava lake through clouds of gas; its surface was calm, with incandescent lava visible through the broken chilled surface. The S pit crater had an estimated diameter of 170 m and vertical walls, and the lava lake was about 80 m in diameter. It seemed to shrink during the next days, one part appearing hardened and forming almost a second terrace. The plates of cooled surface lava were seen moving and converging amidst degassing lava. Lava fountains were periodically visible and generally outlined the borders of the lava lake under the rim.
On 27 December, the walls of the crater were estimated at about 50 m high, with a crater diameter of about 300 m. Members of the group descended into the crater to inspect a series of active hornitos near the N vents. At one end of the line a vent lined with sulfur opened. In the interior cavity of a smaller vent temperatures of about 800°C were measured. Degassing occurred generally in the area. Lava fountaining continued.
The lava lake appeared lower and calmer to observers on 28 December, with a potential second terrace still forming. Some group members descended into the crater again and observed rockfall and continued lava fountaining.
Information Contacts: Viviane Grandjean, c/o Société Volcanologique Européenne (SVE)-Société Volcanologique de Genève (SVG), Geneva, C.P.1, 1211 Geneva 17, Switzerland (URL: http://www.sveurop.org/).
Active lava lake visited in February 2008
Around 2-3 February 2008, a Volcano Discovery tour visited Erta Ale (figures 18-21). Tom Pfeiffer reported that the northern pit crater contained a lake of molten lava ~ 75 m across. Strong spattering and bursting bubbles were seen. At times, the lava lake rose and flooded the lower terrace. During this phase the usual fountains ceased. Richard Roscoe, who also visited during February 2008, presents animations of the flooding on his Photovolcanica website. He also shows photos of strong fountaining associated with falling lava lake levels.
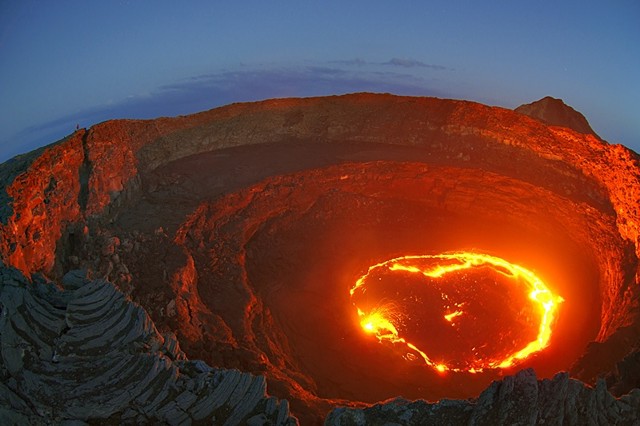 |
Figure 18. Wide-angle photo showing the lava lake at Erta Ale, February 2008. Taken with fisheye-lens and a digital reflex camera. Courtesy Marco Fulle. |
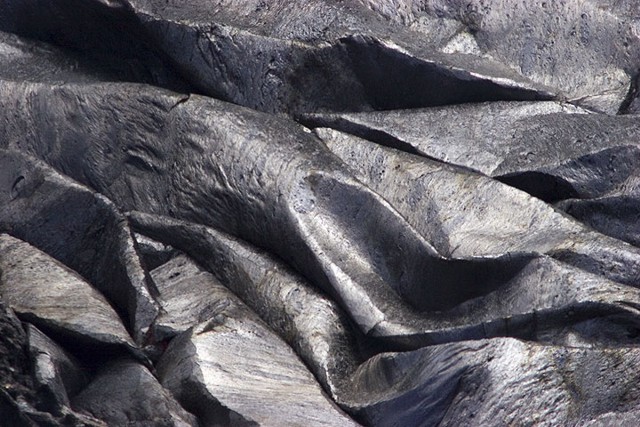 |
Figure 19. Folds developed in the crust of the lava lake at Erta Ale, February 2008. Courtesy of Tom Pfeiffer (Volcano Discovery). |
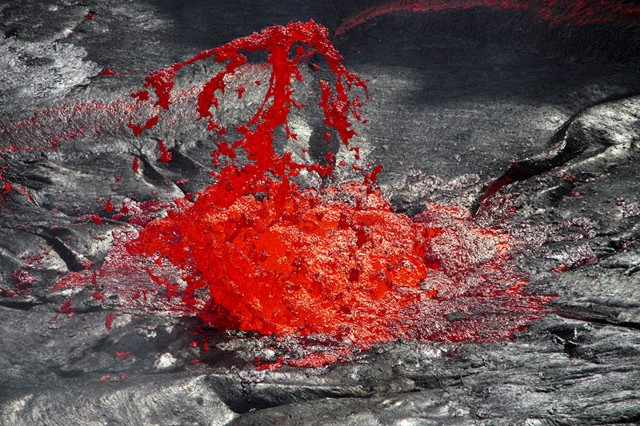 |
Figure 20. Rising magmatic gases drove fountains like this one emerging above the surface of the lava lake at Erta Ale, February 2008. Courtesy of Tom Pfeiffer (Volcano Discovery). |
Occasionally, magmatic gas released in the middle of the lake created a zone a few meters in diameter where fountains typically lasted ~ 1 minute (figure 20). Thin threads of lava (Pelee's hair) are visible in some lava-fountain photographs. Richard Roscoe also features similar photos. Marco Fulle noted strong spattering when lava was drawn down (subducted) into the lake.
A Volcanologique de Genève (SVG) trip on 8-9 February 2008 noted extensions of ropy lava in the N crater. The lake was little changed from the group's last visit in 2005. The group visited the N Crater, and, given its constant degassing, was able to take gas samples. They also measured the lake's surface temperature (700°C). The descent into this crater, seemingly easy, was made difficult by a mantle of very unstable lava scoria. An elevated level of the lava lake halted a subsequent descent.
References. Rivallin, P., and Mougin, D., 2008, Trip report of Pierrette Rivallin and Dédé Mougin: LAVE Bulletin, no. 79, May 2008.
Information Contacts: Tom Pfeiffer, Volcano Discovery (URL: http://www.VolcanoDiscovery.com/); Marco Fulle, Osservatorio Astronomico, Trieste, Italy; Richard Roscoe (URL: http://www.photovolcanica.com/).
Changes at NW and S pit craters between 2002 and 2009
From 7-10 February 2009, an expedition team with Chris Weber visited Erta Ale (figure 22) and observed the long-active lava lake in the S pit crater. Although there have been intervening visits and reports (most recently from February 2008, BGVN 33:06), a comparison of observations from 2002 with 2008-2009 gives a sense of the changes to the craters (table 2).
Table 2. Summary of observations made during 2002, 2008,and 2009 of Erta Ale S and NW pits and lava lakes. The numbered terraces (former lake surfaces that chilled sufficiently to leave a conspicuous ledge) are shown on the sketch maps (figure 23). The undated 2008 observations came from the local guide, Meles Matwose. Courtesy of C. Weber.
| Date | South Crater | South Lava Lake | NW Crater | NW Lava Flows |
| 04 Dec 2002 | Elliptical (terraces 1 and 2) ~160 m EW, ~130 m NS. Two levels (terraces 1 and 2). About half the area (terrace 1) covered by basalt on terrace ~45 m below pit rim. | About half the area (terrace 2) ~100 m EW. Lake surface ~90 m below W rim of pit. | One level (terrace 3). | -- |
| 2008 | -- | -- | Massive collapse early in year caused new, deeper level (terrace 4). | Lava flows covered part of terraces 3 and 4. Latest flow in Nov 2008. |
| 07-10 Feb 2009 | Elliptical shape (terraces 1, 2, and the lava lake) ~190 m EW, ~150 m NS. Three levels (terraces 1, 2, lava lake). Terrace (terrace 1) and 2002 lava lake edge (terrace 2) ~35 m below W side of pit rim. | Lava lake ~60 m wide in W half of pit. Lake surface higher than in 2002 and it oscillated ~5 m vertically and at times came close to overflowing terraces 1 and 2. | Three levels (terraces 3, 4, and 5). | -- |
South pit crater. The active S pit expanded due to crater collapse on its W side between 2002 and 2009 (figure 23). The shape of the ellipsoidal crater increased by ~ 30 m EW and ~ 20 m NS.
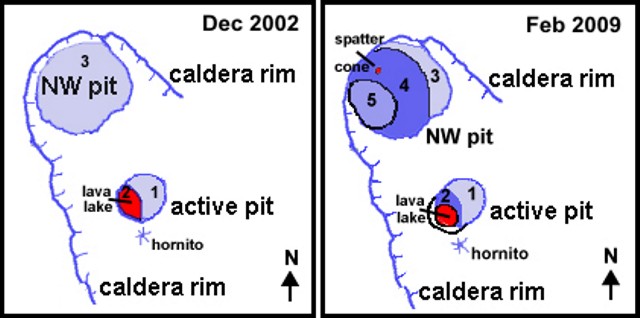 |
Figure 23. Sketch maps for part of Erta Ale comparing GPS surveys from December 2002 and February 2009. Data from 2002 courtesy of L. Fitsch (BGVN 28:04). Courtesy of C. Weber. |
The former lava-lake stand from 2002 left a remnant surface still visible in 2009 (terrace #2), an area marked as well by fractures and fumaroles. In both 2002 and 2009 terraces #1 and #2 still remained, separated by an elevation difference of ~ 40 m (BGVN 28:04).
During 2009, the W half of the S pit contained a 60 m wide active lava lake (figure 24). Fountaining there took place a few times per day, occasionally throwing spatter above the top of the crater walls. Some recent spatter was seen at the pit's W edge.
NW pit crater. In February 2009 the NW crater had preserved ledges at three levels (terraces #3, #4, and #5). This represented a substantive change in comparison to 2002 where only level #3 was observed (figure 11). According to Weber, a local guide (Meles Matwose) reported that the NW crater had a massive collapse in early 2008, establishing the deeper level #4. Lava flows covering the crater floor occurred at that time, as well as new lava flows at level #4. One of the latest lava flows, observed by Matwose in November 2008, covered a part of a new interior plateau at level #4. When the lava lake stood at the lowest level, #5, very little lava entered the NW crater.
During the February 2009 expedition, some hornitos on level #4 degassed vigorously inside the pit crater, and, on 9 February 2009, lava spattered ~ 15 m high associated with Strombolian emissions ejected at one hornito during 1800 to 2200 hours. Many photos taken inside the Erta Ale craters in January-February 2009 are shown on the Volcano Discovery website.
Films of Erta Ale. Marc Szeglat's Streaming Planet website provides some spectacular film taken December 2002 inside the S pit showing eruptive activity and researchers collecting data. Cameraman and author of the film was Szeglat, and the film narration is in German. Another short film by Szeglat taken in February 2008 is shown on his YouTube channel.
Recent research publication. Spampinato and others (2008) noted that active lava lakes represent the exposed, uppermost part of convecting magma systems and provide windows into the dynamics of magma transport and degassing. They reported on the main features of the lava lake surface in the S pit of Erta Ale based on observations from an infrared thermal camera made on 11 November 2006. Efficient magma circulation was reflected in the sustained transport of the surface, which was composed of pronounced incandescent cracks that separated wide plates of cooler crust. These crossed the lake from the upwelling to the down-welling margin with mean speeds ranging between 0.01 and 0.15 m/s. Hot spots eventually opened in the middle of crust plates and/or along cracks. These produced mild explosive activity lasting commonly between ~ 10 and 200 s. Apparent temperatures of cracks ranged between ~ 700 and 1070°C, and those of crust between ~ 300 and 500°C.
Reference. Spampinato, L., Oppenheimer, C., Calvari, S., Cannata, A., and Montalto, P., 2008, Lava lake surface characterization by thermal imaging: Erta 'Ale volcano (Ethiopia), Geochemistry Geophysics Geosystems, v. 9, issue Q12008, doi:10.1029/2008GC002164.
Information Contacts: Christoph Weber, Volcano Expeditions International (VEI), Muehlweg 11, 74199, Entergruppenbach, Germany (URL: http://www.volcanic-hazards.de/); Hawai'i Institute of Geophysics and Planetology (HIGP) Thermal Alerts System, School of Ocean and Earth Science and Technology (SOEST), Univ. of Hawai'i, 2525 Correa Road, Honolulu, HI 96822, USA (URL: http://modis.higp.hawaii.edu/); Streaming Planet (URL: http://www.streaming-planet.de/); Marc Szeglat (URL: http://www.youtube.com/marcszeglat and http://www.vulkane.net/); Volcano Discovery (URL: http://www.volcanodiscovery.com/); Jürg Alean, Kantonsschule Zürcher Unterland, Bülach, Switzerland.
February 2010 visit reveals little change in South pit crater's lava lake since 2002
Christoph Weber sent a report about his 8-11 February 2010 visit to Erta Ale. We last reported on Erta Ale after a visit by Weber in February 2009 (BGVN 34:07). The volcano is famous for molten lava lakes.
Activity at the S pit crater was comparable to that noted in December 2002 (figure 25, also see BGVN 28:04). The elliptical pit crater measured ~ 180 m E-W and ~ 140 m N-S. The upper platform (terrace T) inside the crater was, on 10 February 2010, covered by a lava flow, and the lava lake surface was ~ 20 m below the W rim (figure 26). On 9 February the 65-m-wide active lake in the W half of the crater rose and overflowed the lower ring terraces. Fountaining at the lava lake took place most of the time during the observations (figure 27), occasionally higher than the pit crater walls. Fresh lava spatters were found at the S pit crater's W edge. A sample was taken out of the lava lake.
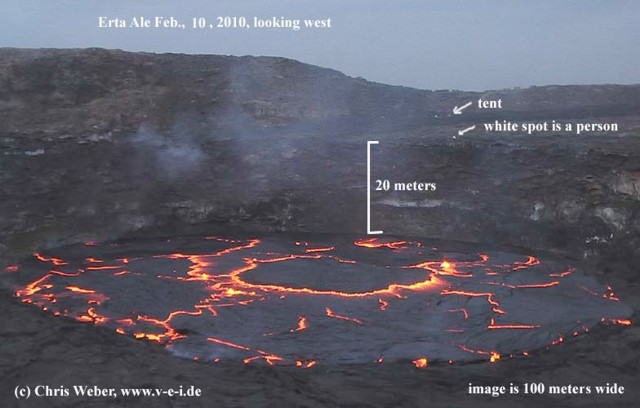 |
Figure 26. Photo looking W towards the southern Erta Ale pit crater taken 10 February 2010. Courtesy of C. Weber. |
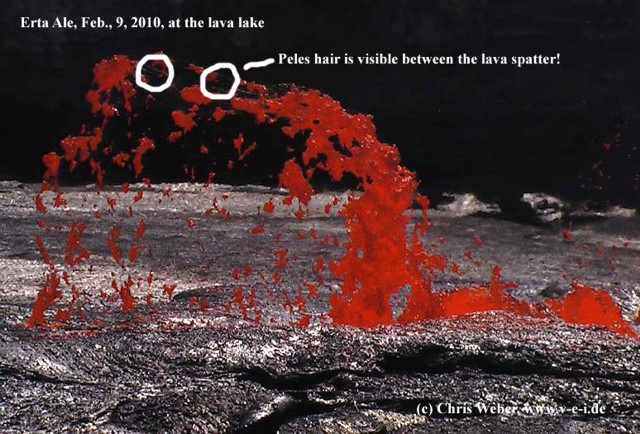 |
Figure 27. Fountaining of the Erte Ale lava lake in the southern pit crater on 9 February 2010. Courtesy of C. Weber. |
Information Contacts: Christoph Weber, Volcano Expeditions International (VEI), Muehlweg 11, 74199 Untergruppenbach, Germany (URL: http://www.v-e-i.de/).
Observers watch dynamic lava lake during November 2010
Erta Ale contains two lava lakes within its caldera. During the last three years, several expeditions have visited the volcano to examine changes (BGVN 33:06, 34:07, and 35:01). This report synthesizes the reports of two teams that visited Erta Ale during November 2010. Both teams noted that the lava lake within the southern crater has risen, nearly filling the entire crater and overflowing onto the caldera floor.
Southern Crater activity. Afar Rift Consortium (ARC) scientists visited Erta Ale during 21-23 November 2010 (figures 28 and 29). Tom Pfeiffer (Volcano Discovery) and Micheal Dalton-Smith visited Erta Ale during 25-28 November 2010. The lava lake had risen above previously formed terraces (see BGVN 35:01 for information on terraces). Both teams noted that the lava lake had risen ~40 m, nearly filling the S crater and breaching its W rim, spilling lava flows onto the larger caldera floor. The still-hot overflows traveled distances of 50-100 m on the caldera floor, and one recent long flow (estimated to be from November 24th given its temperature) had almost reached the W caldera walls.
The ARC team noted Strombolian activity from the lava lake in the southern pit crater (figure 30).Throughout their visit, the ARC team saw extensive amounts of Pele's Hair and clouds rich in hydrogen-sulfide gas. Fountaining was reported by Pfeiffer to reach heights of 30-70 m. Degassing fountains kept the whole lava-lake surface violently boiling for a large portion of the latter team's visit.
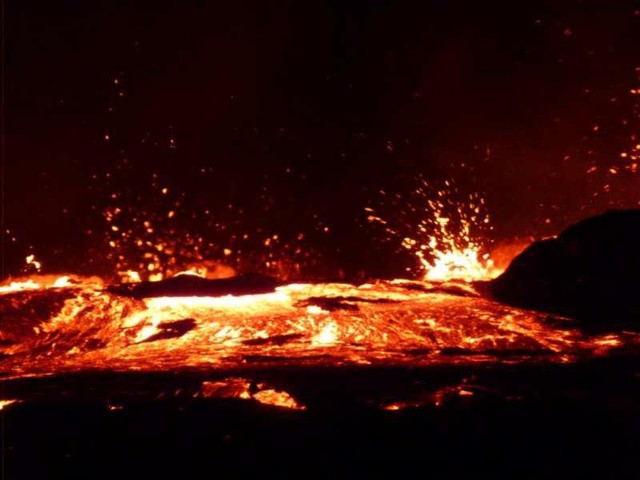 |
Figure 30. Photograph of the first lava to breach the rim of Erta Ale's S crater and then to enter the main caldera. Taken 21 November 2010 by L. Field (from Field and Keir, 2010). |
The still-active lake was circular, ~40 m in diameter (about half to two-thirds its size in 2008 and 2009). The lava lake was reported to be encompassed by a bounding ring of chilled material that was ~ 4 m high on the S side. The morphology of the ring wall constantly changed as more lava overflowed, with parts collapsing and rebuilding.
From the night of the 22 November 2010 until the ARC team left on 23 November, the team observed a periodic rise and decline of the lava lake level.
According to Pfeiffer the lava level rose and fell by about 2-4 m about every 30 minutes. During the 25-28 November observations intense eruptive phases were observed. Lava overflowed about 12 times and fed new flows that topped older flows. During 25-28 November, the overall average level of the lake's surface rose an estimated 3-5 m.
Northern Crater activity. The ARC noted that during 21-23 November the northern crater pit was relatively quiet. They observed a small amount of incandescence during the night of 21 November (figure 31). During the day, they noted a new cone about 1 m high and lava flows of limited extent.
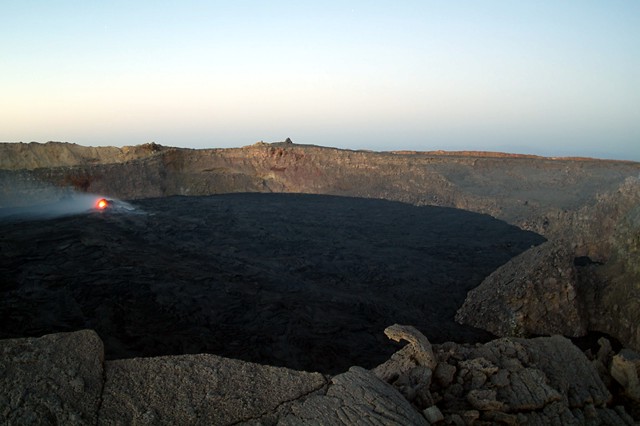 |
Figure 31. Photograph taken in January 2011 of an Erta Ale hornito with an incandescent vent in the N crater. Photo taken by M. Fulle. |
According to the Volcano Discovery team, the deeper N crater had not changed much since their previous visit in February 2008 (BGVN 33:06). During their 2010 visit they saw a 7-10 m high hornito, in the N crater's center, with a glowing vent that sometimes spattered lava. According to Dalton-Smith, flaming gas was seen during the day and on 25 November, an extremely bright glow was seen at night. Upon the team's arrival at the volcano, a large fresh flow had recently surged from the hornito and covered most of the N crater floor.
Location and tectonics. Erta Ale is located in the Afar rift, a region that shows signs of undergoing a continent to ocean transition. The Afar rift is located between the Nubian and the Somalian plates. There is reason to believe that the mantle below the Afar rift region has an above average temperature (Bastow and Keir, 2011). The Afar Rift Consortium also noted that recent fissure eruptions occurred on Erta Ale's N flank.
References. Field, L, and Keir, D. 2010, Observations from the Erta Ale eruption 21st Nov-23rd Nov 2010. Afar Rift Consortium (ARC) (URL: http://www.see.leeds.ac.uk/afar/new-afar/home-page-assets/Observations_from_Erta_Ale.pdf). Additional information about the work of the ARC can be found at URL: http://www.see.leeds.ac.uk/afar/.
Fulle, M, 2011, Stromboli Online (URL: http://www.swisseduc.ch/stromboli/perm/erta/lake-2011-en.html).
Bastow, ID, and Keir, D, 2011, The protracted development of the continent-ocean transition in Afar, Letters, Nature Geoscience, DOI: 10.1038/NGEO1095 published online on March 11, 2011.
Keir, D, Pagli, C, Bastow, ID, Ayele, A., 2011, The magma-assisted removal of Arabia in Afar: Evidence from dike injection in the Ethiopian rift captured using InSAR and seismicity, Tectonics, v. 30, TC2008, DOI: 10.1029/2010TC002785, published 22 March 2011.
Information Contacts: Afar Rift Consortium (URL: http://www.see.leeds.ac.uk/afar/); Tom Pfeiffer, Volcano Discovery (URL: http://www.VolcanoDiscovery.com/); Michael-Dalton-Smith, Digital Crossing Productions (URL: http://www.digitalcrossing.ca/); Marco Fulle, Osservatorio Astronomico, Trieste, Italy (URL: http://www.ts.astro.it/) and atStromboli Online (URL: http://www.swisseduc.ch/stromboli/perm/erta/lake-2011-en.html).
Persistent lava lake; crater rim overflows; new fissure eruption begins in January 2017
Ethiopia's Erta Ale basaltic shield volcano has had an active lava lake since the mid 1960s, and possibly much earlier. The first confirmed historical observations were in 1906. Two active craters (Northern and Southern) within a larger oval-shaped caldera exhibit periodic fountaining of lava causing lava lake overflows; this creates spectacular incandescence as the pahoehoe lava flows into the larger caldera around the craters and occasionally beyond. Lava flows in the South Pit crater overflowed its rim in November 2010 (BGVN 36:06). This report discusses activity from 2011 through June 2017, including the South Pit crater overflows in January and November 2016, and a new fissure eruption on the SE flank that began in January 2017 and was continuing in June 2017. Information comes from satellite thermal and visual data (NASA Earth Observatory, MODIS), and photographs from expeditions (primarily from Volcano Discovery) that regularly visit this remote site.
The lava lake at the South Pit crater in the summit caldera remained active, with the lake level falling and rising to within a few meters of the rim, during 2011-2015. Intermittent lava flows were reported from the North Pit Crater as well during this time. Activity increased late in 2015, and the first overflows of the South Pit crater rim since late 2010 occurred in mid-January 2016. It overflowed again in November 2016, and covered a significant area of the surrounding caldera floor with pahoehoe. By late December, effusive activity was reported from both craters. Flow intensity and volume increased dramatically for several days beginning on 17 January 2017, followed by ash emissions and crater collapses on 20-21 January. A new fissure eruption on the SE flank about 4 km from the caldera appeared on 21 January 2017, and sent lava flows several kilometers to the NE and the SW. Activity at the fissure vent increased during subsequent months, and by June 2017 a substantial new lava field that contained at least one new lava lake and flows more than 1,500 m long covered the area. Effusive activity had also resumed at both craters in the summit caldera.
Activity during November 2011-December 2016. Visitors in November 2011 confirmed the continued presence of the lava lake (figure 32) at the South Pit crater in the summit caldera. On 16 January 2012, an attack by Eritrean rebels on tourists camping at the S crater rim left at least five European tourists dead and seven others wounded; four Europeans and their Ethiopian guides were also abducted, according to Volcano Discovery reports. News reported through Volcano Discovery suggested that the abducted tourists were released in March 2012.
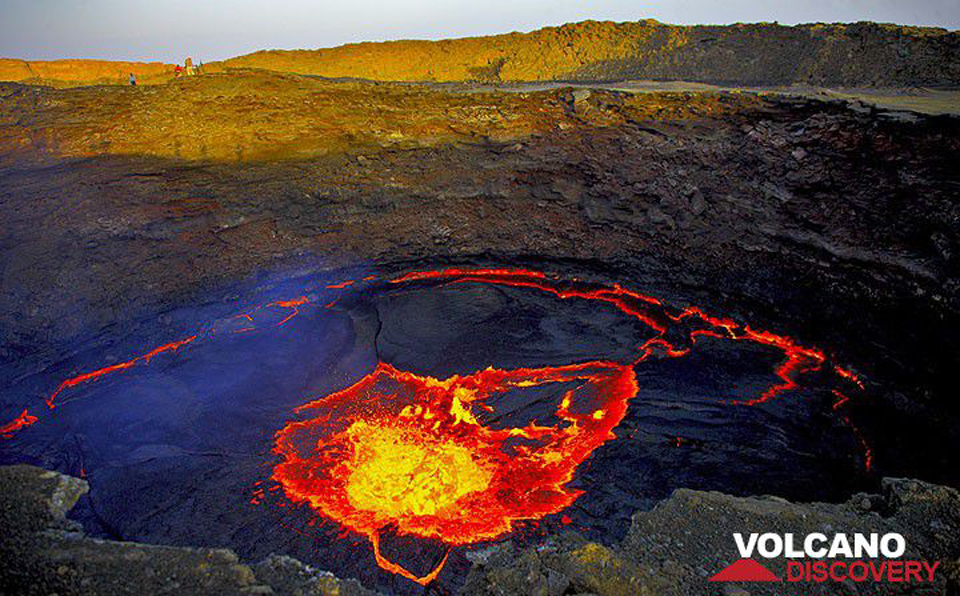 |
Figure 32. The active lava lake at Erta Ale's South Pit crater during November 2011. Photo by Reinhard Radke, courtesy of Volcano Discovery. |
Visitors in January 2013 reported that the lava lake in the North Pit crater was active and about 10 m below the rim. Intermittent lava flows were observed from a hornito in the South Pit crater and were continuing to fill the crater floor. Members of an expedition in December 2013 observed that the active lava lake at the South Pit crater had risen considerably during previous months (figure 33). An expedition in February 2015 also documented continued lava fountaining (figure 34) at the South Pit crater.
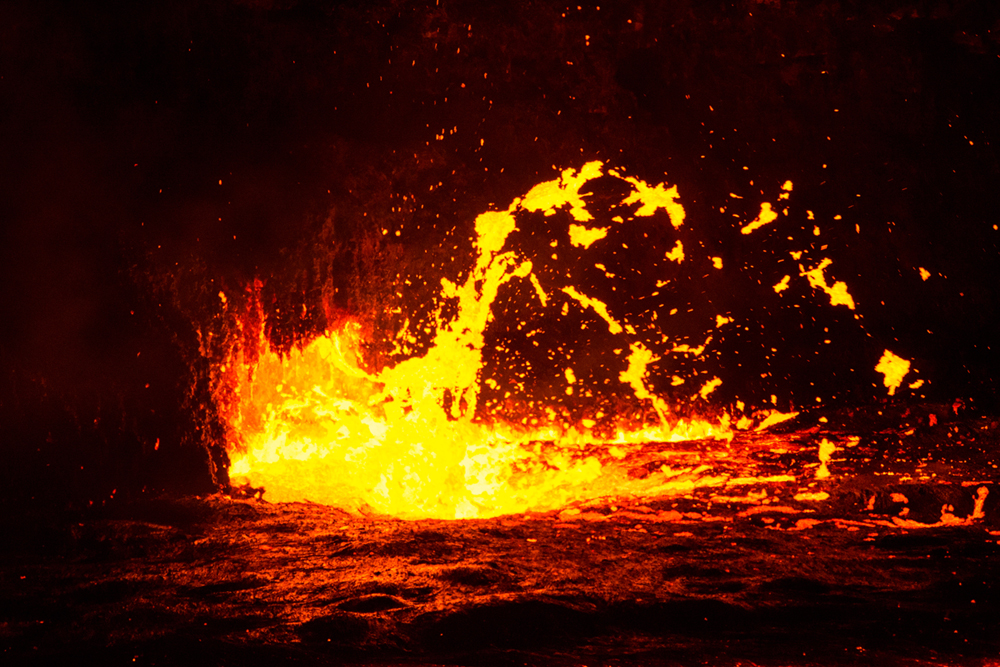 |
Figure 33. The active lava lake at the South Pit crater of Erta Ale in December 2013. Photo copyright by Dominique Voegtli, courtesy of Volcano Discovery, used by permission. |
During 19-21 November 2015, visitors on an expedition to Erta Ale observed significant changes in the lava lake level at the South Pit crater. On the morning of 19 November (figure 35) the lake surface was 2-3 m below the rim. A local guide reported that the lake had been very active during the previous weeks, rising to levels near overflowing similar to the event in late 2010. A second terrace of freshly cooled pahoehoe was visible less than 1 m below the rim, indicating the most recent maximum height of the lake. On 19 November, the lake rose to within 30 cm of the terrace rim, with occasional lava fountains splashing onto the terrace (figure 36), and Pele's hair forming continuously. The level had dropped several meters by the next morning. During 20 and 21 November, the activity was characterized by large, periodic "exploding bubbles" from the center of the lake creating waves across the surface; minor Strombolian activity and fountaining occurred around the edges. The lake level generally fluctuated between 0.5 and 1 m below the second terrace. On the evening of 21 November, the level rose rapidly from five to three meters below the second terrace; lava rapidly seeped out of the cracks in the cooling surface, overflowing onto the thin crust.
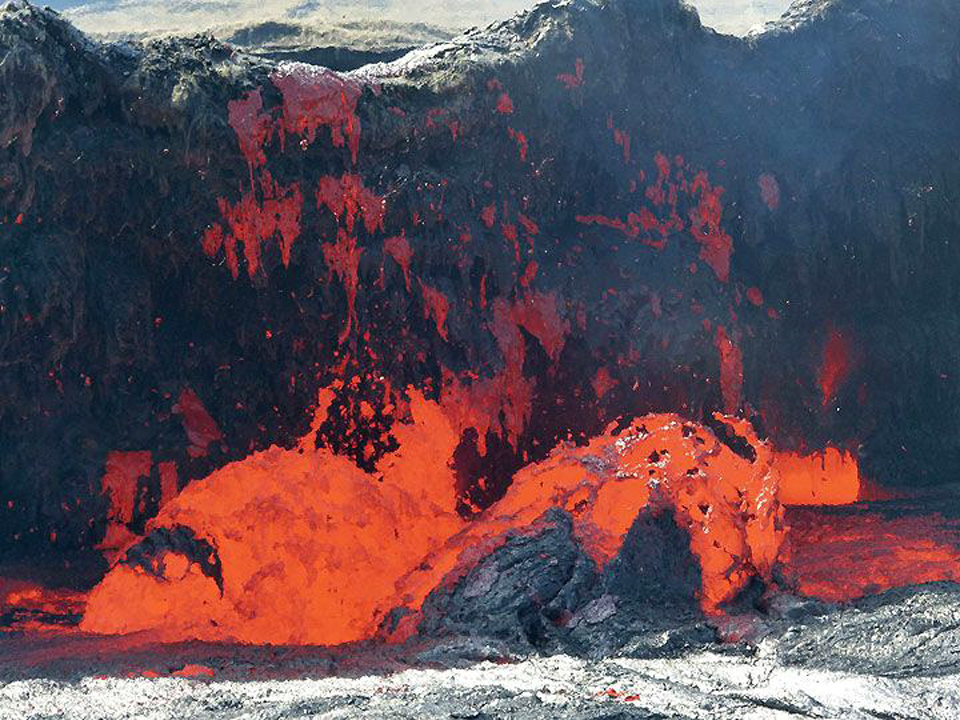 |
Figure 36. Fountains from the lake at the South Pit crater of Erta Ale splatter lava onto the crater rim on 19 November 2015. Photo by Ingrid Smet, courtesy of Volcano Discovery. |
Volcano Discovery reported that the lava overflowed the rim of the South Pit crater during the night of 15-16 January 2016, and covered the rim with a fresh crust of pahoehoe. An expedition leader reported that during 12-15 February 2016, the lake level had dropped 5-7 m. A visitor to the crater in April 2016 photographed the lake level several meters below the rim with active fountaining lava (figure 37).
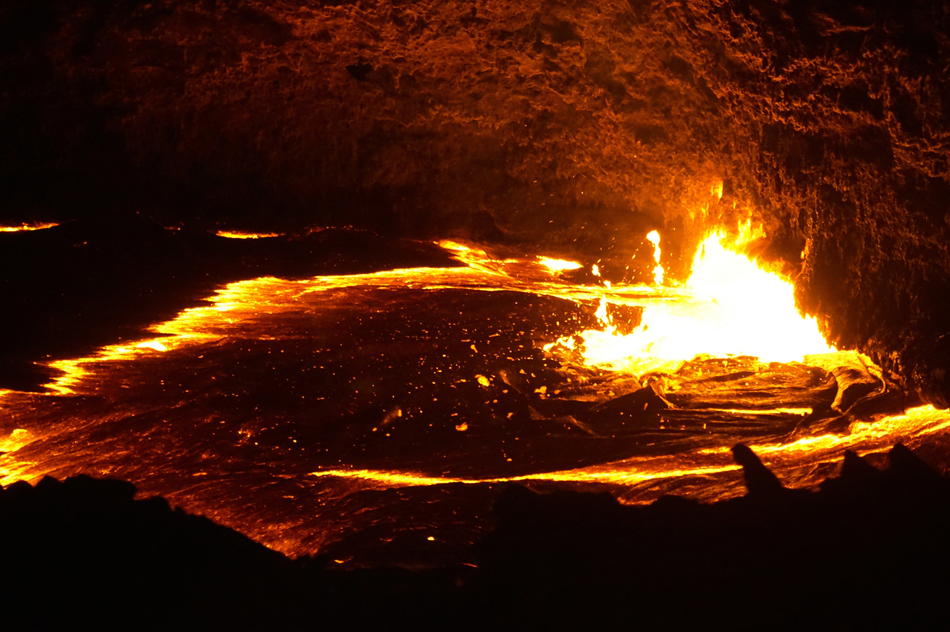 |
Figure 37. The boiling lava lake at the South Pit crater of Erta Ale on 3 April 2016. Photo by V, courtesy of Flickr. |
The southern pit crater began overflowing again at the beginning of November 2016, and covered significant parts of the surrounding caldera floor (figures 38 and 39). The overflow was observed at mid-day on 14 November by visitors from the Societe de Volcanologie Geneve (SVG).
By late December 2016, effusive activity was reported from both the North and South Pit craters, including activity at the South Pit crater overflowing beyond the surrounding summit caldera. An expedition during 29 December 2016-1 January 2017 observed changing activity from both craters inside the summit caldera (figure 40). During 29-31 December, the lake level at the South Pit crater fluctuated between 0.5 and 1 m below the rim. During this time lava fountains 2-3 m high were frequent along the South Pit crater rim, but it did not overflow. The caldera floor around the crater was covered with 2-3 m of fresh pahoehoe, over an area about 150 m in diameter. Activity at the North Pit crater had formed three hornitos, one of which was emitting lava.
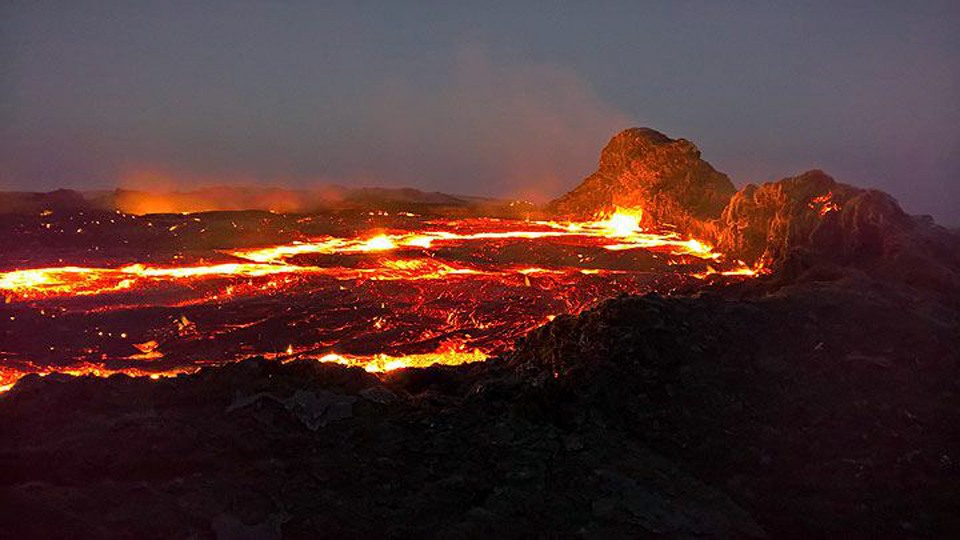 |
Figure 40. Erta Ale's lava lake at the South Pit crater on 29 December 2016. Photo by Jens Wolfram Erben, courtesy of Volcano Discovery. |
Activity during January-June 2017. Observations on 16 January 2017 at the North Pit crater showed remnants of two large hornitos surrounded by fresh lava flows (figure 41). During 16-20 January 2017, the lava lake at the South Pit crater underwent rapid and large variations, producing massive overflows and intense spattering. During the morning of 16 January the lake overflowed the W rim of the crater (figure 42); in the afternoon two lava rivers, reaching 500 m in length, appeared on the SW flank.
On 17 January around 1300, two overflows began on the South Pit crater rim. Two hours later, overflows appeared on the NE and N flank; lava was flowing over about 70% of the rim according to visitors (figure 43). They reported the speed of the lava flowing on the flank at 50-70 km per hour, covering about 1 km2 within the larger caldera. In the morning of 18 January, fresh, glowing lava covered the area around the South Pit crater 500-700 m in all directions (figure 44). Sporadic overflows occurred with lake levels fluctuating by 10-15 m for several days. During lower levels, Strombolian fountains reached 50-60 m above the lake.
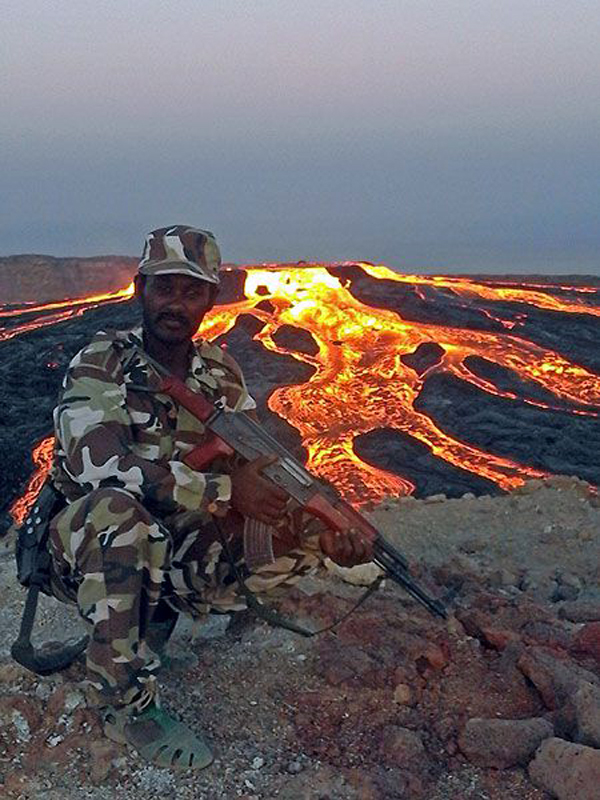 |
Figure 43. The lava lake at the South Pit crater of Erta Ale overflowing on all sides on 17 January 2017. Photo by Enku Mulugeta, courtesy of Volcano Discovery. |
On the evening of 20 January, explosions of very large gas bubbles were observed by Oliver Grunewald and reported by Culture Volcan, causing lava to spatter up to 30 m high. Parts of both of the craters in the Summit caldera began to collapse. At the North Pit crater, a new 20 m deep oval-shaped pit crater 150 x 30 m formed during the next 24 hours. A collapse at the South Pit crater doubled its size. This activity was accompanied by ash emissions that reached 700-800 m above the crater.
Volcano Discovery reported news from eyewitness reports of a fissure eruption beginning on 21 January 2017. Two fissure eruptions were visible on the SE flank, 3 and 4 km SE of the South Pit crater lava lake, in satellite imagery taken on 26 January 2017 (figure 45). The higher vent was located at about 650 m elevation, and the lower one around 400 m. The fissures created three distinct lava fields, one to the NE reaching about 3 km length, a smaller one to the W (about 1 km), and one to the SSE about 2 km long. The surface area covered by the first two (on either side on the northernmost fissures) was estimated to be about 1.5 km² (1,500,000 m²), while the southern flow covered about 0.35 km² (350,000 m²). As a result of the sudden draining of the magma into the new fissure zone, the lava lake in the South Pit crater was reported to have dropped by 80-100 m. Additional satellite imagery taken before and after the fissure eruptions began reveal the locations of the new flows on 23 and 27 January 2017 (figure 46).
After dropping about 100 m after the flank eruption began, the South Pit crater lake level rose again by mid-February to 40-50 m below its rim. By April 2017, activity still remained high; a new lava lake about 80 x 175 m in size had formed at the flank eruption site, and a growing lava field, about 1,500 m wide had reached 3.5 km NE of the original site. Geologists from Addis Abeba University who visited the site during 11-15 April 2017 noted two coalesced hornitos in the NE part of the South Pit crater, estimated to be 7 m high. The old lava lake was covered with cooled lava in a 200-m-diameter near-circular shape. Frequent surface collapse and lake-level changes occurred every 30 minutes, and lava fountains rose 25 m above the surface. The fresh lava surface around the crater rim had cooled enough to walk on it. The North Pit crater was still degassing, with several small hornitos growing in the center. The lake level at the new fissure (the SE Rift Zone) had dropped by about 10 m.
By early May 2017, the first lava lake at the SE Rift Zone had crusted over and a new lake was forming about 350 m E. A new breakout also started in early May, and was feeding a new flow field overlapping the previous one to the NE, more than 1,500 m long and over 500 m wide.
Satellite data. In addition to field observations of Erta Ale, valuable information is available from continuous satellite data. Thermal data from MODIS is processed by both the MIROVA and MODVOLC systems. The MIROVA thermal anomaly system recorded the high levels of heat flow and changes in location of the heat flow sources from late September 2015 through June 2017 (figure 47). The change in location and intensity of the heat flow in late January 2017 corresponds with the opening of the SE-flank fissure.
The MODVOLC thermal alert system managed by the University of Hawaii has captured persistent thermal alerts from Erta Ale for at least 10 years. When activity is moderate to high at the lava lakes in the pit craters, the signal is concentrated in those areas (figure 48). The reports of lava overflowing the south crater rim in January 2016 correspond to increased heat flow visible in the MODVOLC data. The dramatic changes in heat flow with the new fissure flows from the SE rift zone and subsequent new lava lake formation are apparent in MODVOLC images from January-May 2017 (figure 49).
Information Contacts: NASA Earth Observatory, EOS Project Science Office, NASA Goddard Space Flight Center, Goddard, Maryland, USA (URL: http://earthobservatory.nasa.gov/); Tom Pfeiffer, Volcano Discovery (URL: http://www.volcanodiscovery.com/); Robert Simon, Sr. Data Visualization Engineer, Planet Labs Inc. (URL: http://www.planet.com/); MIROVA (Middle InfraRed Observation of Volcanic Activity), a collaborative project between the Universities of Turin and Florence (Italy) supported by the Centre for Volcanic Risk of the Italian Civil Protection Department (URL: http://www.mirovaweb.it/); Hawai'i Institute of Geophysics and Planetology (HIGP), MODVOLC Thermal Alerts System, School of Ocean and Earth Science and Technology (SOEST), Univ. of Hawai'i, 2525 Correa Road, Honolulu, HI 96822, USA (URL: http://modis.higp.hawaii.edu/); Societe de Volcanologie Geneve (SVG), Bulletin 161, January 2017.
New eruptive event forms lava lake and multiple large flow fields 3 km S of South Pit Crater, January 2017-March 2018
Ethiopia's Erta Ale basaltic shield volcano has had at least one active lava lake since the mid-1960s, and possibly much earlier. Two active craters (North Pit and South Pit) within the larger oval-shaped Summit Caldera have exhibited periodic lava fountaining and lava lake overflows over the years. A new eruptive event located about 3 km SE of the Summit Crater appeared on 21 January 2017. Activity at the eruption site increased during subsequent months, sending lava flows several kilometers NE and SW from a newly formed lava lake. This report discusses activity from February 2017 through March 2018 as the flows traveled as far as 16 km from the main vent. Information comes from satellite thermal and visual imagery, and photographs and reports from ground-based expeditions that periodically visit the site.
Summary of activity, February 2017-March 2018. The 21 January 2017 activity at Erta Ale was the first time a vent outside of the Summit Caldera has been observed (figure 50). The initial vent or vents created multiple lava flows that traveled generally NE and SW from their sources, creating at least one lava lake that persisted for about a year (figure 51). The flows began inside an older caldera at a location about 3 km SE of the South Pit Crater, but eventually overflowed the caldera rim in multiple directions. As the flow fields enlarged, thermal imagery captured hot-spots along the flows that were likely produced by breakouts, skylights into lava tunnels, and hornitos, as well as multiple surges of flows across the growing fields (figure 52). The imagery also showed the locations of the advancing flow fronts which had reached over 5 km SW of the source by August 2017 and over 16 km NE of the source by March 2018, eventually reaching the alluvial plain NE of Erta Ale. Thermal anomaly data indicated that the maximum thermal energy output happened in April 2017, gradually decreasing through March 2018. The far NE front of the northeast flow field was still active at end of March 2018.
When the new eruptive episode began, the lava lake at the South Pit Crater drained rapidly to around 80-100 m below the rim, according to visitors to the site a few weeks later. The crater was emitting a strong thermal signal by early March 2017 as the lake level rose again. Visitors in April witnessed a fluctuating lake level rising and falling by up to 20 m every 30 minutes over several days. The thermal signal remained strong at the South Pit Crater through March 2018. Due to significant political instability in the area, ground visits are intermittent, but high-quality photographs were taken in February 2017, December 2017, and January 2018 that show the new lava lake and parts of the new flow fields.
Activity during late January-March 2017. The new eruptive event at Erta Ale began in late January 2017 at the northern end of the Southeast Caldera located; the first lava flows observed were locatedabout 3 km SE from the main Summit Caldera (figure 45 (BGVN 42:07) and figure 50). Two separate vent areas appeared active initially. The northern vent sent lava flows to the NE for several kilometers and to the SW a much shorter distance. The southern vent sent a stream of lava to the S. By the end of January 2017 the North and South Pit Craters at the Summit Caldera were still thermally active, but the signals were much stronger from the new vent areas in the Southeast Caldera (figure 53). A faint thermal signal from about 5 km E of the northern vent suggested the extent of the new flows in that direction.
A small group of travelers led by Ethiopian geologist Enku Mulugeta visited Erta Ale during the first half of February 2017. They reported that within the main Summit Caldera, the hornito in the North Pit Crater had collapsed and the lava lake in the South Pit Crater was about 80-100 m below the caldera floor level. The eruption in the Southeast Caldera was still very active, and they photographed the sizable new lava field which contained numerous pahoehoe flows, actively spattering hornitos, and a large lava lake (figures 51, 52, and 54). During the following months activity remained high both at the new eruption site and at the Summit Caldera where the lava lake in the South Pit Crater gradually rose back up to about 50 m below the caldera floor. Culture Volcan annotated a series of Sentinel-2 satellite thermal images which show the progression of the lava flows through the following year.
By 10 March 2017 only the southern vent area was active inside the Southeast Caldera. It continued to feed the lava field; lava was actively flowing S from the vent towards the W rim of the Southeast Crater, and NE, breaking out from lava tubes which blocked the thermal signal until about 2.6 km NE of the vent (figure 55). Thermal signals from both the North and South Pit Craters were distinct and stronger than in late January.
A site visit to the South Pit Crater on 20 March 2017 demonstrated that the lake level had risen significantly since its drop in early February, and was once again actively convecting (figure 56). By the end of March 2017, satellite thermal imagery made clear the increasing thermal signal at the South Pit Crater, and in the Southeast Caldera, the major increase in effusion to the NE from the main vent. The width of the flow field had increased to about 1,400 m, and the farthest front was about 3,400 m NE from the vent (figure 57). The lava at the source measured about 180 x 75 m in size, suggesting a lava lake; a smaller overflow to the SW appeared to have reached the W rim of the Southeast Caldera by 30 March 2017 near the area where a new flow had first appeared in a 23 January 2017 satellite image (see figure 46, BGVN 42:07).
Activity during April-May 2017. In the next Sentinel-2 satellite image from 9 April (figure 58), the distance to the farthest front of the lava flow had increased to about 4,600 m from the lava lake, and a new flow had appeared a few hundred meters east of the lake that extended about 1,100 m ENE from its source. Lava also flowed SW from the source to the SW rim of the Southeast Crater, appearing to pond against and flow slightly beyond the rim.
A group visited Erta Ale during 11-15 April 2017 in collaboration with Addis Ababa University geologist Enku Mulugeta. They noted that fluctuating lava lake levels at the South Pit Crater were cycling every 30 minutes or so between 40 and 50 m below the caldera floor (figures 59 and 60). Lava tubes from the walls of the crater would feed the lake with fresh lava after it drained. Two coalesced hornitos, about 7 m high, were present in the NE part of the crater, emitting SO2 gas and occasional lava. At the North Crater Pit, noisy degassing of SO2 from several hornitos at the center of the solidified crust was apparent. Observers at the Southeast Caldera could see the lava lake with the top about 10 m below its crater rim, and minor fountaining during the night, but they were not able to get closer than about 700 m due to the active flows.
By the end of April 2017 satellite thermal imagery indicated that the northeast flow field at the Southeast Caldera extended more than 7 km NE from the lake and was curving towards the E (figure 61). The lava lake was still thermally active, as was the South Pit Crater to the NW.
Eleven days later, activity was quite different in the Southeast Caldera. Satellite imagery from 9 May 2017 (figure 62) showed a new, relatively narrow but bright lava flow moving NE for 2-3 km originating in a location slightly NE of the original lava lake; activity farther NE had diminished from the previous image. A subsequent image on 18 May looked similar, but by 19 May the narrow flow had been replaced by a much broader area of thermal anomaly in the region immediately E of the source. By 29 May 2017, the source of the lava appeared to have shifted several hundred meters SE of the earlier location, and a strong thermal signal once again extended NE across the northeast flow field from the new source for about two kilometers (figure 63).
Activity during June-August 2017. The rapidly changing flow field was significantly different again less than two weeks later in satellite imagery captured on 8 June 2017. Lava was flowing N, SE, and S across the northeast lava field, extending beyond the rim of the Southeast Caldera to the N and E. Another very strong thermal signal emerged from the SW corner of the Southeast Caldera where lava was flowing W and S outside the caldera rim forming a new southwest lava field (figure 64).
During June 2017, the most aggressive flow activity contributed to significant growth of the southwest lava field. By 28 June, infrared imaging detected flow fronts 4,500 m SW of the vent; they had extended to about 5,100 m, nearing the base of the SW flank of Erta Ale, by 5 July (figure 65). Flow activity also persisted in the northeast flow field with activity concentrated about 1.5 km NE of the vent on 28 June. Movement increased at the northeast flow field beginning in late June and it had extended to about 3.5 km NE of the lava lake by 5 July 2017.
Significant movement to the NE in the northeast flow field was apparent in satellite images beginning on 21 July 2017; the head of the flow had reached about 9.5 km from the lava lake by 28 July 2017, mostly focused in a narrow channel (figure 66). Activity decreased in the southwest flow field during July; the lava front had advanced only a few hundred meters by the end of July from its position on 5 July.
During August 2017, lava continued to flow from the Southeast Caldera lava lake in two directions. The northeast flow front extended to 12 km from the vent by 17 August and had reached over 14 km by 7 September. The southwest flow field, while it remained in roughly the same area, had a decreased but still significant thermal signature in early September, suggesting continued but diminished activity throughout the period (figures 67).
Activity during September-December 2017. In a Sentinel-2 satellite image from 26 September 2017, it was clear that the South Crater Pit was still thermally active, and that the southwest flow field had largely cooled with only a small area on its NW edge still producing a thermal anomaly (figure 68). In contrast, the northeast flow field had advanced about 1 km in the previous three weeks and was less than a kilometer from the edge of the valley alluvium. It finally reached the edge of the older lava field and began to advance across the alluvium NE of the volcano, more than 16 km from the lava lake, on 16 October 2017 (figure 69). Based on satellite imagery, Cultur Volcan interpreted that activity slowed significantly during November 2017, and while the thermal signal remained strong near the head of the flow, it did not advance significantly across the alluvium.
Visitors to the South Pit Crater in mid-December 2017 reported that its lava lake continued to be active and its level was about 60 m below the rim. They were also able to visit the Southeast Caldera lava lake, 2.7 km SE of the South Pit Crater, and take photographs from its rim; it was about 200 m long and 100 m wide and filled with slowly convecting lava (figures 70, 71). Satellite imagery from 25 December 2017 showed the active lake at the South Pit Crater, the active lake at the Southeast Caldera, and numerous skylights and overflows along the 16-km-long northeast flow field (figure 72).
Activity during January-March 2018. By mid-January 2018 thermal activity was concentrated a few kilometers back from the front of the northeast flow, about 12 km from the lava lake (figure 73). A Volcano Discovery tour group visited during 13-26 January 2018 and was able to access and photograph both the North and South Pit Craters and the new lake and flow fields around the Southeast Caldera with ground-based and aerial drone photography (figures 74-84).
By late March 2018 no thermal signal appeared in satellite imagery at the site of the Southeast Caldera lava lake, although the South Pit Crater was still visible. A large increase in the area of fresh flows and multiple thermal anomalies were present at the flow front of the northeast lava field 14-16 km from the former lava lake (figure 85). During the second half of March, the flow progressed several hundred meters out into the alluvial plain.
MIROVA thermal anomaly data. The MIROVA thermal anomaly data captures information about the distance of the anomalies from the summit as well as the radiative power released from Erta Ale. Both sets of information agree well with observations from the Sentinel-2 and Landsat satellite data. The plot of distance from the summit (figure 86) shows that during August 2016-mid-January 2017 the thermal anomalies were located very close to the summit point, representing heat flow from both the South and North Pit Craters within the Summit Caldera. Beginning on 21 January 2017, the jump in location of the anomalies corresponded with the beginning of the eruption in the Southeast Caldera. The MIROVA thermal anomalies progressed farther from the summit point during March and April 2017, when the northeast flow field was lengthening to the NE. The thermal signal jumps back closer to the summit point in early May corresponding to when new breakouts were spotted near the Southeast Caldera lava lake; the flows again traveled away from the lake during June and July 2017. Active lava flows from mid-August 2017 through March 2018 were visible in satellite imagery 12-16 km from the lava lake, which is reflected in the MIROVA data (figure 86).
The MIROVA data for the radiative power released from Erta Ale during August 2016-March 2018 also corresponds well with satellite and ground observations (figure 87). The levels of radiative power were moderate and constant during August 2016 to mid-January 2017 when only the lava lake and hornitos at the South and North Pit Craters were active (see also figure 47, BGVN 42:07). A moderate spike in the radiative power corresponds to the overflow of the South Pit Crater during 16-20 January 2017, followed by a large spike in radiative power on 21 January when the eruption started in the Southeast Caldera. This was followed by an extended period of increased radiative power as extensive flow fields formed in the Southeast Caldera. The graph is also able to distinguish the movement of the flows from near the Southeast Caldera lava lake to farther away and then near again during March-June 2017. The radiative power graph from 10 March 2017-9 March 2018 clearly shows a gradual decrease in the amount of radiative power over the period, suggesting a decline in flow activity, which corresponds well to satellite observations.
Information Contacts: European Space Agency (ESA), Copernicus (URL: http://www.esa.int/Our_Activities/Observing_the_Earth/Copernicus; Robert Simon, Sr., Data Visualization Engineer, Planet Labs Inc. (URL: http://www.planet.com/) [Images used under https://creativecommons.org/licenses/by-sa/4.0/]; Cultur Volcan, Journal d'un volcanophile (URL: https://laculturevolcan.blogspot.com); Toucan Photo (URL: http://www.toucan.photo/); Tom Pfeiffer, Volcano Discovery (URL: http://www.volcanodiscovery.com/); MIROVA (Middle InfraRed Observation of Volcanic Activity), a collaborative project between the Universities of Turin and Florence (Italy) supported by the Centre for Volcanic Risk of the Italian Civil Protection Department (URL: http://www.mirovaweb.it/); Stefan Tommasini (URL: http://vulkane-und-natur.de/).
Continued summit activity and lava flow to the E during April 2018-March 2019
Erta Ale is the most active volcano in Ethiopia, containing multiple active pit craters within both the summit and southeast calderas. Multiple recent lava flows are visible as darker-colored areas on the broad flanks. A new fissure eruption began in January 2017, forming a lava lake and multiple large lava flow fields during January 2017-March 2018. This report summarizes activity during April 2018 through March 2019 and is based on satellite data.
During April 2018 through March 2019 minor activity continued in the calderas and along the active lava flow to the E. Several persistent thermal anomalies were present in both the summit and southeast calderas (figure 88). A small lava outbreak was detected in Sentinel-2 thermal data on 25 December 2018 located approximately 6 km from the vent. Numerous small outbreak flows at the distal end of the lava flow located around 10-15 km away from the vent (figure 89).
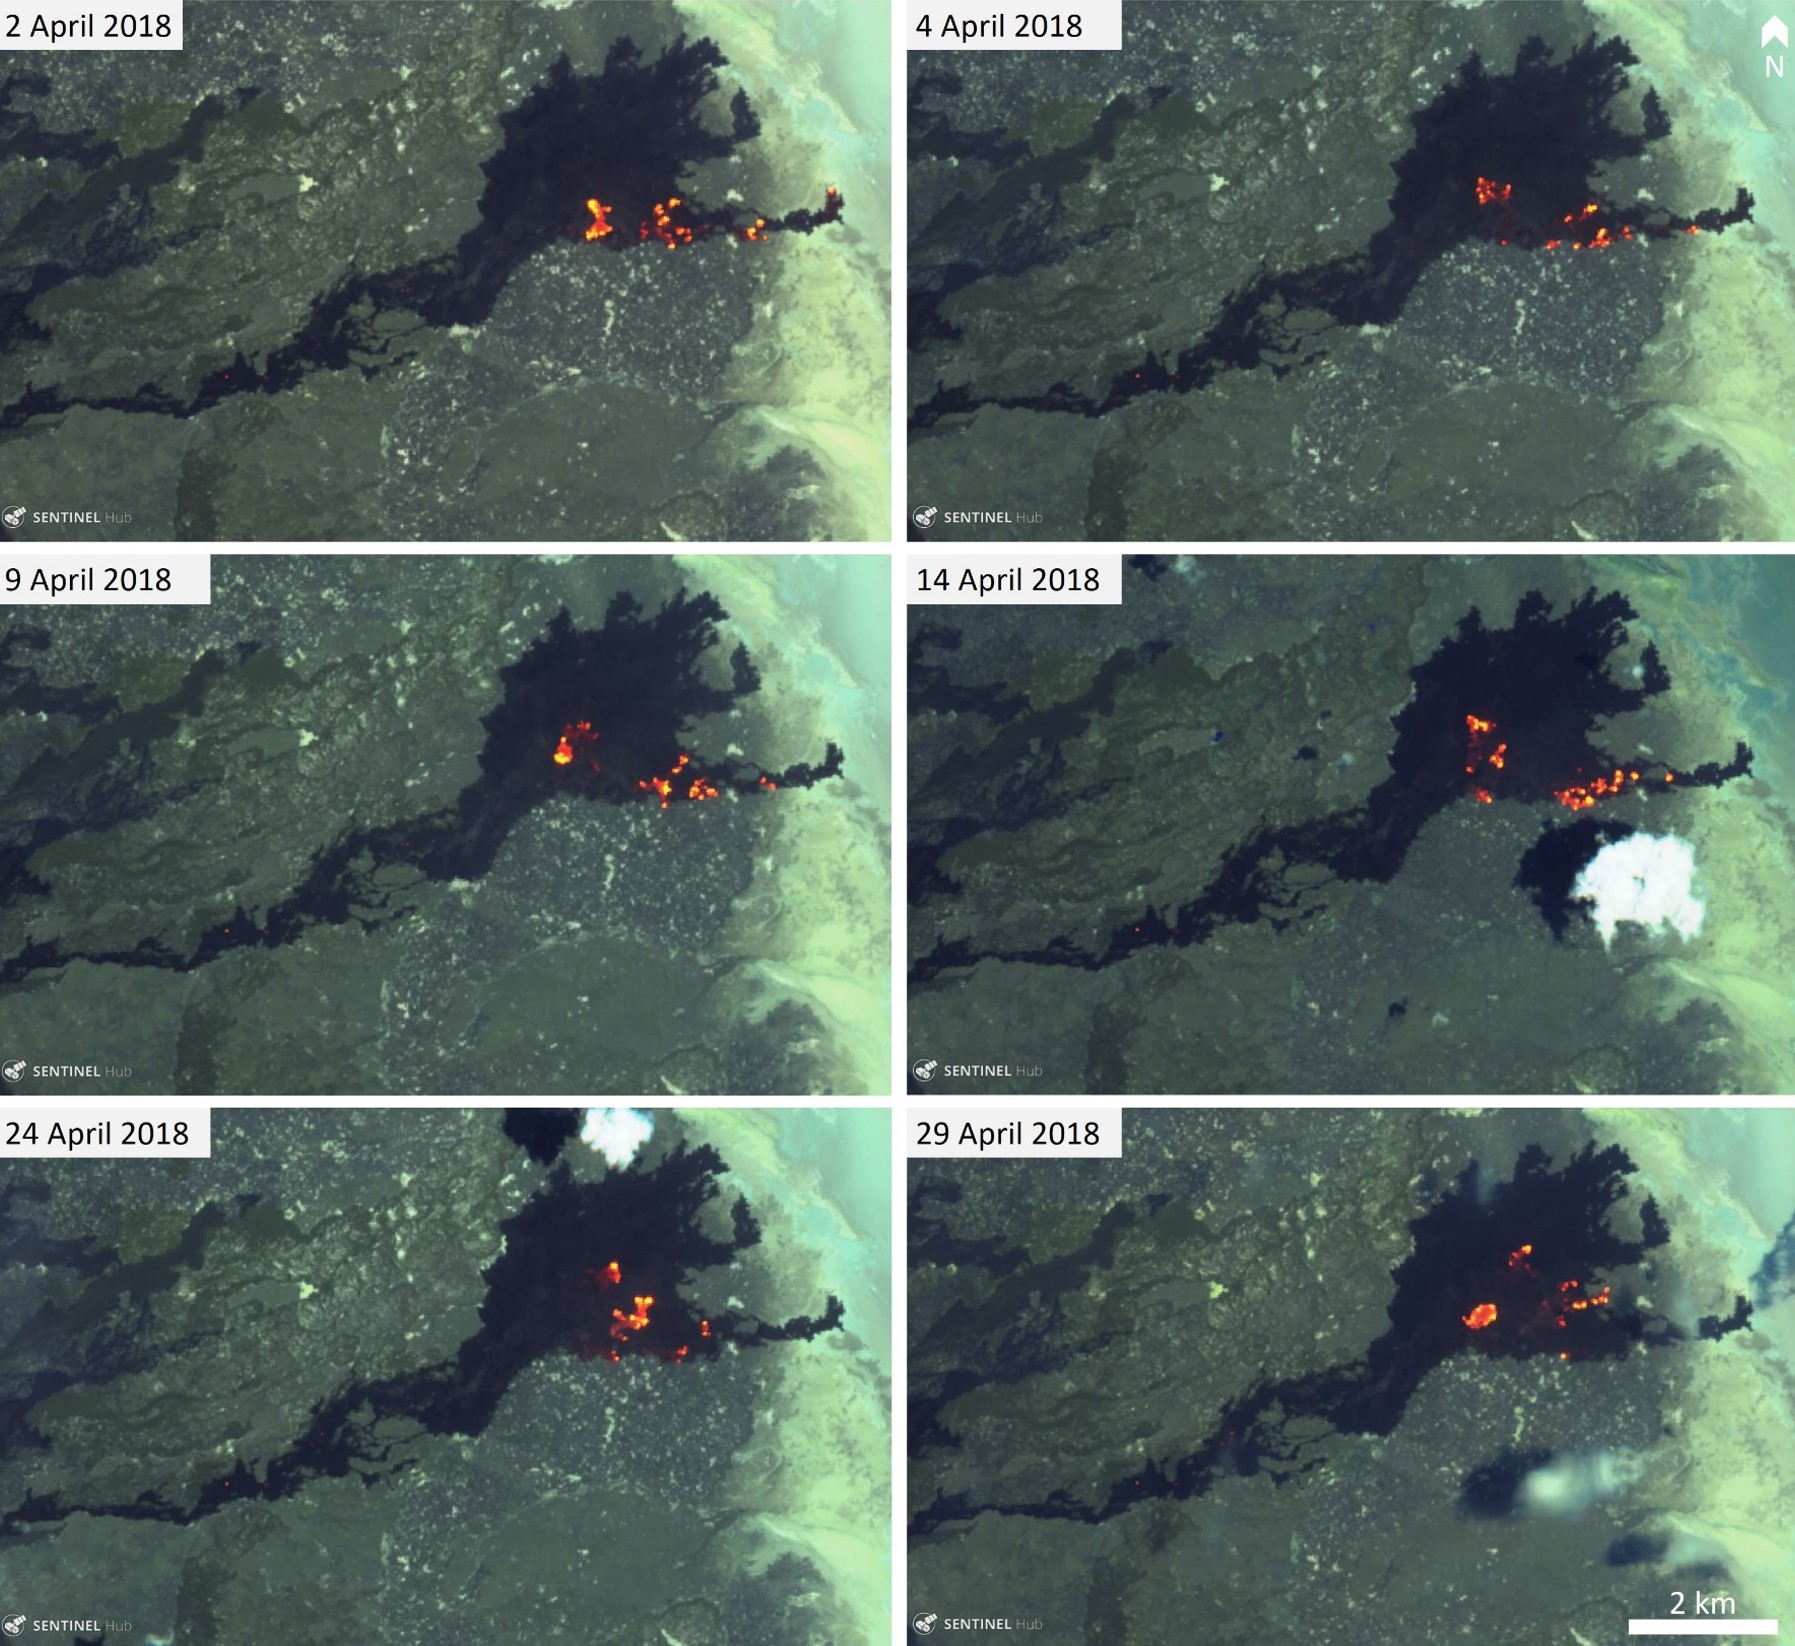 |
Figure 89. Sentinel-2 thermal images showing small lava flow outbreaks (bright orange) in the distal part of the latest Erta Ale flow. Courtesy of Sentinel Hub Playground. |
Thermal activity using MODIS detected by the MIROVA system has been stable with a slight decrease in energy since January 2019 (figure 90). The number of thermal alerts identified by the MODVOLC system was typically below 20/month (figure 91), but with notably lower numbers in April, August, September, and November 2018, and February-March 2019. There were 30 alerts noted in December 2018.
Sentinel-1 imagery analyzed by Christopher Moore, University of Leeds (Moore et al., in prep, 2019), show a lowering of the lava lake level down to 70-90 m below the rim in October 2018, consistent with broader recent trends. Lava lake activity since late 2014 can be broken down into four stages: the pre-eruption stage during October 2014-January 2017 when the level was stable at less than 20 m below the rim; the initial fissure eruption during 11-28 January 2017 when there was a rapid drop from a state of overflowing down to 80-100 m below the rim; the early stage of the eruption period during January 2017 through mid-2017 when there was a gradual rise up to 50-70 m below the rim; and the late eruption stage during mid-2017 through October 2018 when there was a gradual drop down to 70-90 m below the rim.
Reference: Moore, C., Wright, T., Hooper, A., and Biggs, J., In Prep. Insights into the Shallow Plumbing System of Erta 'Ale Volcano, Ethiopia, from the Long-Lived 2017 Eruption.
Information Contacts: MIROVA (Middle InfraRed Observation of Volcanic Activity), a collaborative project between the Universities of Turin and Florence (Italy) supported by the Centre for Volcanic Risk of the Italian Civil Protection Department (URL: http://www.mirovaweb.it/); Hawai'i Institute of Geophysics and Planetology (HIGP) - MODVOLC Thermal Alerts System, School of Ocean and Earth Science and Technology (SOEST), Univ. of Hawai'i, 2525 Correa Road, Honolulu, HI 96822, USA (URL: http://modis.higp.hawaii.edu/); Sentinel Hub Playground (URL: https://www.sentinel-hub.com/explore/sentinel-playground); Christopher Moore, Institute of Geophysics and Tectonics, School of Earth and Environment, University of Leeds, Woodhouse Lane, Leeds, LS2 9JT, United Kingdom (URL: https://environment.leeds.ac.uk/see/pgr/2207/chris-moore).
Continued summit activity and lava flow outbreaks during April-October 2019
Erta Ale, located in Ethiopia, contains multiple active pit craters both within the summit and the southeast calderas. On 17 January 2017 the active lava lake displayed intense spattering, fountaining, and rim overflows with lava flows that traveled as far as 1 km, forming a lava flow field. During April 2018 through March 2019 minor activity continued in both the summit and southeast calderas, and along the active lava flow to the E (BGVN 44:04). This report updates volcanism from April through October 2019. Information primarily comes from infrared satellite images and MODIS data.
Continued lava flow breakouts occurred from April through October 2019. On 4 May 2019 a lava flow outbreak was observed in satellite imagery NE of the summit caldera (figure 92). This outbreak continued to appear in clear-weather thermal satellite images through 13 June when it was seen south of its original location (figure 93). Faint incandescence is observed at the summit caldera between June and October 2019, though it is more pronounced in the months of August through October. On 28 June a second smaller lava flow outbreak occurred within 3.8 km of the summit location. The two lava flow outbreaks remained active at least through 18 June. The distal NE lava flow does not appear in very similar images from 17 August or 16 September 2019, but three proximal thermal anomalies are seen in the southeastern caldera within 4 km of the summit. The thermal anomalies remained within 5 km through October 2019.
MIROVA (Middle InfraRed Observation of Volcanic Activity) analysis of MODIS satellite data showed consistently high-power thermal anomalies during this reporting period (figure 94). Through July 2019 these thermal anomalies were detected at distances greater than 5 km from the summit. In early August 2019 there was an abrupt decrease in the distance that continued through late October 2019 (figure 94); this likely indicates when the distal NE outbreak ended and lava emissions from the closer SE locations increased (see satellite images in figure 93). The distance changes of MODIS thermal anomalies from the summit seen in MIROVA are corroborated by MODVOLC data, which show no distal NE thermal alert pixels after July 2019 (figure 95).
Information Contacts: Sentinel Hub Playground (URL: https://www.sentinel-hub.com/explore/sentinel-playground); MIROVA (Middle InfraRed Observation of Volcanic Activity), a collaborative project between the Universities of Turin and Florence (Italy) supported by the Centre for Volcanic Risk of the Italian Civil Protection Department (URL: http://www.mirovaweb.it/); Hawai'i Institute of Geophysics and Planetology (HIGP) - MODVOLC Thermal Alerts System, School of Ocean and Earth Science and Technology (SOEST), Univ. of Hawai'i, 2525 Correa Road, Honolulu, HI 96822, USA (URL: http://modis.higp.hawaii.edu/).
Continued lava flow outbreaks and thermal anomalies during November 2019 to early April 2020
Erta Ale is a shield volcano located in Ethiopia and contains multiple active pit craters in the summit and southeastern caldera. Volcanism has been characterized by lava flows and large lava flow fields since 2017. Surficial lava flow activity continued within the southeastern caldera during November 2019 until early April 2020; source information was primarily from various satellite data.
The number of days that thermal anomalies were detected using MODIS data in MODVOLC and NASA VIIRS satellite data was notably higher in November and December 2019 (figure 96); the number of thermal anomalies in the Sentinel-2 thermal imagery was substantially lower due to the presence of cloud cover. Across all satellite data, thermal anomalies were identified for 29 days in November, followed by 30 days in December. After December 2019, the number of days thermal anomalies were detected decreased; hotspots were detected for 17 days in January 2020 and 20 days in February. By March, these thermal anomalies became rare until activity ceased. Thermal anomalies were identified during 1-4 March, with weak anomalies seen again during 26 March-8 April 2020.
MIROVA (Middle Infrared Observation of Volcanic Activity) analysis of MODIS satellite data showed frequent strong thermal anomalies from 18 April through December 2019 (figure 97). Between early August 2019 and March 2020, these thermal signatures were detected at distances less than 5 km from the summit. In late December the thermal intensity dropped slightly before again increasing, while at the same time moving slightly closer to the summit. Thermal anomalies then became more intermittent and steadily decreased in power over the next two months.
Unlike the obvious distal breakouts to the NE seen previously (BGVN 44:04 and 44:11), infrared satellite imagery during November-December 2019 showed only a small area with a thermal anomaly near the NE edge of the Southeast Caldera (figure 98). A thermal alert was seen at that location using the MODVOLC system on 28 December, but the next day it had been replaced by an anomaly about 1.5 km WSW near the N edge of the Southeast Caldera where the recent flank eruption episode had been centered between January 2017 and January 2018 (BGVN 43:04). The thermal anomaly that was detected in the summit caldera was no longer visible after 9 January 2020, based on Sentinel-2 imagery. The exact location of lava flows shifted within the same general area during January and February 2020 and was last detected by Sentinel-2 on 4 March. After about two weeks without detectable thermal activity, weak unlocated anomalies were seen in VIIRS data on 26 March and in MODIS data on the MIROVA system four times between 26 March and 8 April. No further anomalies were noted through the rest of April 2020.
Information Contacts: MIROVA (Middle InfraRed Observation of Volcanic Activity), a collaborative project between the Universities of Turin and Florence (Italy) supported by the Centre for Volcanic Risk of the Italian Civil Protection Department (URL: http://www.mirovaweb.it/); Hawai'i Institute of Geophysics and Planetology (HIGP) - MODVOLC Thermal Alerts System, School of Ocean and Earth Science and Technology (SOEST), Univ. of Hawai'i, 2525 Correa Road, Honolulu, HI 96822, USA (URL: http://modis.higp.hawaii.edu/); Sentinel Hub Playground (URL: https://www.sentinel-hub.com/explore/sentinel-playground); NASA Worldview (URL: https://worldview.earthdata.nasa.gov/).
Thermal anomalies persist in the summit crater during May-September 2020
Erta Ale is an active basaltic volcano in Ethiopia, containing multiple active pit craters in the summit and southeastern caldera. Volcanism has been characterized by lava flows and large lava flow fields since 2017. This report describes continued thermal activity in the summit caldera during May through September 2020 using information from various satellite data.
Volcanism at Erta Ale was relatively low from May to early August 2020. Across all satellite data, thermal anomalies were identified for a total of 2 days in May, 7 days in June, 4 days in July, 11 days in August, and 15 days in September. Beginning in early June and into September 2020 the Sentinel-2 MODIS Thermal Volcanic Activity graph provided by the MIROVA system identified a small cluster of thermal anomalies in the summit area after a brief hiatus from early January 2020 (figure 99). By mid-August, a small pulse of thermal activity was detected by the MIROVA (Middle Infrared Observation of Volcanic Activity) system. Many of these thermal anomalies were seen in Sentinel-2 thermal satellite imagery on clear weather days from June to September.
On 12 June a minor thermal anomaly was observed in the S pit crater; a larger anomaly was detected on 17 June in the summit caldera where there had been a previous lava lake (figure 100). In mid-August, satellite data showed thermal anomalies in both the N and S pit craters, but by 5 September only the N crater showed elevated temperatures (figure 101). The thermal activity in the N summit caldera persisted through September, based on satellite data from NASA VIIRS and Sentinel Hub Playground.
Information Contacts: MIROVA (Middle InfraRed Observation of Volcanic Activity), a collaborative project between the Universities of Turin and Florence (Italy) supported by the Centre for Volcanic Risk of the Italian Civil Protection Department (URL: http://www.mirovaweb.it/); Hawai'i Institute of Geophysics and Planetology (HIGP) - MODVOLC Thermal Alerts System, School of Ocean and Earth Science and Technology (SOEST), Univ. of Hawai'i, 2525 Correa Road, Honolulu, HI 96822, USA (URL: http://modis.higp.hawaii.edu/); Sentinel Hub Playground (URL: https://www.sentinel-hub.com/explore/sentinel-playground); NASA Worldview (URL: https://worldview.earthdata.nasa.gov/).
Brief increase in strong thermal activity during late November-early December 2020
Erta Ale, located in Ethiopia, is a highly active volcano that contains a 0.7 x 1.6 km, elliptical summit caldera with multiple pit craters that frequently host active lava lakes. Another larger 1.8 x 3.1 km wide depression SE of the summit is bounded by curvilinear fault scarps on the SE side. Recent activity has been characterized by lava flow outbreaks (BGVN 45:05) and thermal anomalies detected from pit craters in the summit caldera (BGVN 45:05 and 45:10). This report covers activity from October 2020 through February 2021 and is characterized by a brief period of strong thermal anomalies in late November, which sharply declined in December. Information primarily comes from satellite data.
Activity at Erta Ale had gradually decreased compared to previous months; thermal activity during this reporting period remained primarily in the N summit caldera. MIROVA (Middle Infrared Observation of Volcanic Activity) analysis of MODIS satellite data shows a total of four low-power thermal anomalies from October through most of November. At the end of November, a brief surge of strong thermal activity was detected in the S pit crater of the summit caldera, followed by a sharp decrease the following days (figure 102). Similarly, the MODVOLC system detected a total of eight thermal alerts; two were detected on 29 November and six were detected on 30 November, primarily focused in the summit caldera. Only two thermal anomalies were recorded in the MIROVA graph after this surge of activity; one in mid-December and one in early January. Thermal data from NASA VIIRS detected hotspots on 28-30 November, 1-3 December, and 8 December.
According to Sentinel-2 thermal satellite images, a weak thermal anomaly was first visible on 20 October in the summit caldera. Intermittent, weak anomalies were also detected in the summit caldera on 25 and 30 October and 4, 9, 19, and 24 November. On 29 November the thermal activity increased significantly, detected as a strong hotspot in the S pit crater of the summit caldera (figure 103). This brief increase in power was also recorded in the MIROVA graph and by the MODVOLC thermal algorithm. By 4 December the size and power of this thermal activity decreased significantly, though it was still visible in the summit caldera. Thermal activity was no longer observed after 4 December until clear weather days on 2 and 12 February when a faint anomaly was detected.
Information Contacts: MIROVA (Middle InfraRed Observation of Volcanic Activity), a collaborative project between the Universities of Turin and Florence (Italy) supported by the Centre for Volcanic Risk of the Italian Civil Protection Department (URL: http://www.mirovaweb.it/); Hawai'i Institute of Geophysics and Planetology (HIGP) - MODVOLC Thermal Alerts System, School of Ocean and Earth Science and Technology (SOEST), Univ. of Hawai'i, 2525 Correa Road, Honolulu, HI 96822, USA (URL: http://modis.higp.hawaii.edu/); Sentinel Hub Playground (URL: https://www.sentinel-hub.com/explore/sentinel-playground); NASA Worldview (URL: https://worldview.earthdata.nasa.gov/).
Episodes of strong thermal signals from lava lakes during March and May 2021
Erta Ale, Ethiopia’s most active volcano in one of the most desolate regions on Earth contains two active craters with lava lakes (North Pit and South Pit) in the summit caldera. Since February 2020, volcanism has been relatively low, except for a brief surge of thermal activity at the end of November 2020 (BGVN 45:05, 45:10, 46:02). This report summarizes activity during March-August 2021 and is based on satellite data.
During the reporting period, thermal anomalies based on MODIS satellite instruments analyzed using the MODVOLC algorithm, recorded frequent thermal alerts during 19-31 March, including ten days of hotspots with up to 4 pixels (figure 104). The March hotspots were the first since 30 November 2020. The MIROVA (Middle InfraRed Observation of Volcanic Activity) volcano hotspot detection system recorded a heavy concentration of strong thermal anomalies during the second half of March and a smaller pulse (less radiative power and fewer anomalies) of activity during the second half of May, with a few scattered hotspots during other months (figure 105).
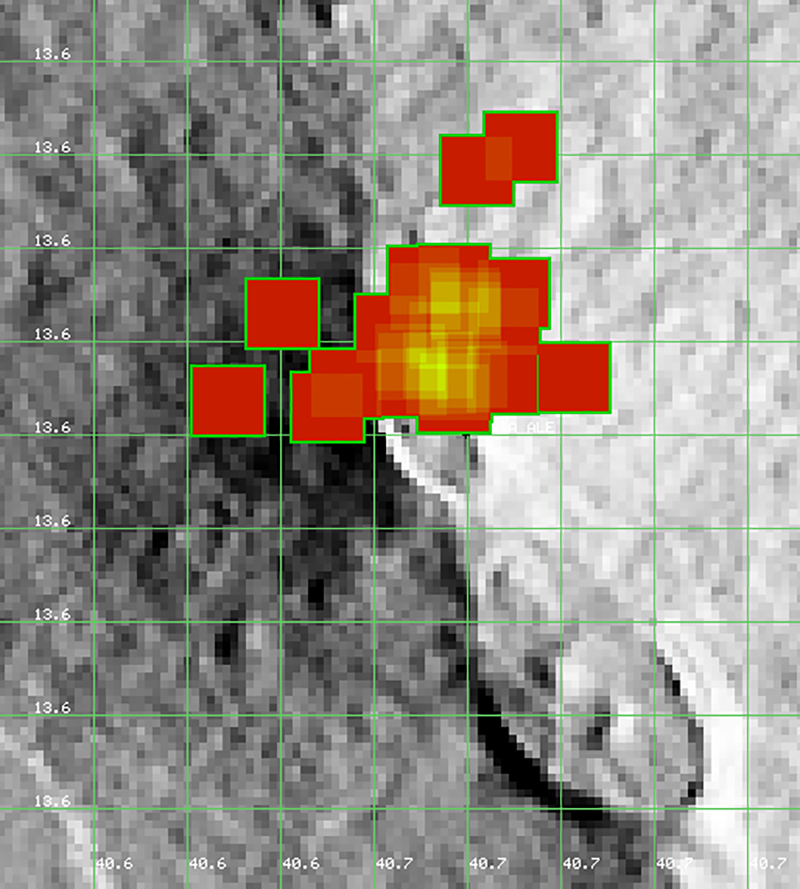 |
Figure 104. Location of thermal anomalies at Erta Ale in March 2021 detected by MODIS satellite instruments. Courtesy of HIGP MODVOLC Thermal Alerts System. |
Sentinel-2 infrared images also showed thermal anomalies suggestive of lava lakes present in both N and S crater pits during March through July 2021 (figure 106). A weak thermal signal can be seen on both 4 and 9 March from the S pit, which was much stronger on 19 March. Only five days later, on 24 March, a much strong thermal signal appeared in the N crater. Additional strong thermal anomalies at the N pit were detected on 29 March, 23 April, and 18 May. The S pit showed a strong thermal anomaly on 27 July. Small weaker anomalies were frequently present at one or both craters through August 2021.
Information Contacts: MIROVA (Middle InfraRed Observation of Volcanic Activity), a collaborative project between the Universities of Turin and Florence (Italy) supported by the Centre for Volcanic Risk of the Italian Civil Protection Department (URL: http://www.mirovaweb.it/); Hawai'i Institute of Geophysics and Planetology (HIGP) - MODVOLC Thermal Alerts System, School of Ocean and Earth Science and Technology (SOEST), Univ. of Hawai'i, 2525 Correa Road, Honolulu, HI 96822, USA (URL: http://modis.higp.hawaii.edu/); Sentinel Hub Playground (URL: https://www.sentinel-hub.com/explore/sentinel-playground); NASA Worldview (URL: https://worldview.earthdata.nasa.gov/).
Intermittent surges of activity at both caldera pit craters, September 2021-April 2022
Ethiopia's Erta Ale basaltic shield volcano has had at least one active lava lake since the mid-1960s, and possibly much earlier. Two active craters (north and south pits) within the larger oval-shaped summit caldera have exhibited periodic lava fountaining and lava lake overflows for many years. During January 2017-March 2020 a vent at the southeast caldera, a few kilometers SE of the summit caldera, produced lava flows that extended many kilometers from the main vents. Since March 2020 pulses of activity from both pit craters in the summit caldera have been recorded in numerous satellite thermal images. This report covers activity from September 2021-April 2022 when both the north and south pits were intermittently active. Information comes primarily from satellite imagery and thermal data, although reports and photographs from ground-based expeditions that periodically visit the site are occasionally available.
Multiple breakouts from persistent lava flows originating at the southeast caldera tapered off in March 2020; after this, intermittent low levels of thermal activity were focused at the N and S pit craters of the summit caldera, with occasional pulses of stronger activity in late November 2020 at the S pit crater and in late March and late May 2021 at the N pit crater (BGVN 46:02, 46:10). A return to more vigorous thermal activity in September 2021 was indicated by MODIS satellite data as an increased number of MODVOLC thermal alerts, increases in the MIROVA log radiative power frequency and intensity (figure 107), and numerous Sentinel-2 satellite images of thermal anomalies. Visitors to the site in December 2021, and January and February 2022, confirmed the active lava lake at the S pit crater.
Only a few of the Sentinel-2 satellite images of Erta Ale are cloudy, providing a consistent record of the changes in thermal activity in the summit caldera during the period. The S pit crater had thermal anomalies of varying intensity throughout, but the N pit crater was more intermittent. A very weak anomaly appeared at the N pit on 31 August 2021, but then not again until 10 October. It was larger on 15 October and bright on 30 October. At the S pit, the anomaly was present in all September and October images, and brightest on 20 September. Double anomalies appeared at the S pit for most of October (figure 108). MODVOLC thermal alerts were recorded on four days in September and nine days of October.
The thermal anomaly was weak at the N pit on 4 November 2021, brighter on 19 November, brightest on 24 November, and very weak or absent on 29 November. It was very bright on 14 December, but absent the other days of December. At the S pit, two anomalies were present in most images, one much brighter than the other, with a similar size and intensity throughout (figure 109). MODVOLC thermal alerts were issued on eleven days during November and six days during December.
No thermal anomaly was present at the N pit for all of January or February 2022. At the S pit, a single weak anomaly was present during January, and a brighter single or double anomaly was present throughout February and early March (figure 110). A single MODVOLC thermal alert was issued on 24 January, and alerts were reported on four days during February. A weak thermal anomaly was present at the N pit in the 29 March 2022 image and persisted in all of the April images. Consistent size and intensity double anomalies, one bright and one dim, were present at the S pit in all images for March and April (figure 111). MODVOLC thermal alerts were issued for five days during March and six days during April 2022.
Visitors to the S pit crater in late December 2021 and early January 2022 reported that the lake measured about 200 m in diameter and the level was about 30 m below the edge of the crater with fresh lava overhanging the crater rim (figure 112). Two collapses of the crater rim, widening the lake, were observed on 31 December-1 January 2022. In a second visit during 28-29 January 2022 the lake was still about 200 m in diameter with periodic small lava fountains (figure 113). On a 24 February 2022 visit the lava lake showed signs of constant activity with slabs of solidified crust moving around on the surface, bright orange lava in the cracks and spattering of lava a few tens of meters above the lake surface (figure 114).
 |
Figure 113. The lava lake at Erta Ale’s S pit crater was still about 200 m wide on 28 January 2022 and active with periodic lava fountains. Photo by Enku Mulugeta, courtesy of Volcano Discovery. |
Information Contacts: MIROVA (Middle InfraRed Observation of Volcanic Activity), a collaborative project between the Universities of Turin and Florence (Italy) supported by the Centre for Volcanic Risk of the Italian Civil Protection Department (URL: http://www.mirovaweb.it/); Sentinel Hub Playground (URL: https://www.sentinel-hub.com/explore/sentinel-playground); Tom Pfeiffer, Volcano Discovery (URL: http://www.volcanodiscovery.com/).
Persistent thermal activity at S crater, but intermittent at N crater, during May-November 2022
Ethiopia's Erta Ale is an active shield volcano with a large oval-shaped summit caldera containing two smaller pit craters (North and South) that have exhibited lava lake activity for many decades. During October 2021-May 2022, the S pit crater had almost persistent thermal anomalies of varying intensity, while activity in the N pit crater was more intermittent (BGVN 47:05). This status continued through November 2022, although thermal intensities diminished after mid-June 2022. The volcano is monitored by satellites and visiting tour groups occasionally share their observations and images online. This report covers activity from May through November 2022 and is based on satellite infrared data.
Sentinel-2 images show the variation in heat signal intensity from the N and S pit craters during May-November 2022 (figure 115). Hotspots in the N crater were visible during two brief periods, while they persisted in the S crater. On 3 May there was a strong hotspot in the S pit crater along with a weak hotspot in the SSE part of the N pit crater. The hotspot in the S crater persisted throughout the reporting period, although by the end of June it had faded. On 16 August, after two weeks of heavy clouds, a strong thermal signal in the N pit crater was recorded; by 31 August it had vanished while the S crater anomaly remained weak.
During the reporting period, the MIROVA thermal detection system recorded numerous low-to-moderate power thermal anomalies during May through mid-June 2022, but none thereafter, except for one in mid-August (figure 116). Similarly, the MODVOLC thermal detection system registered four anomalies during 7 May-1 June, but none thereafter. These data are consistent with the Sentinel-2 infrared imagery (figure 117) that showed that intermittent weak summit thermal anomalies continued after mid-June, then became more consistent again after mid-August.
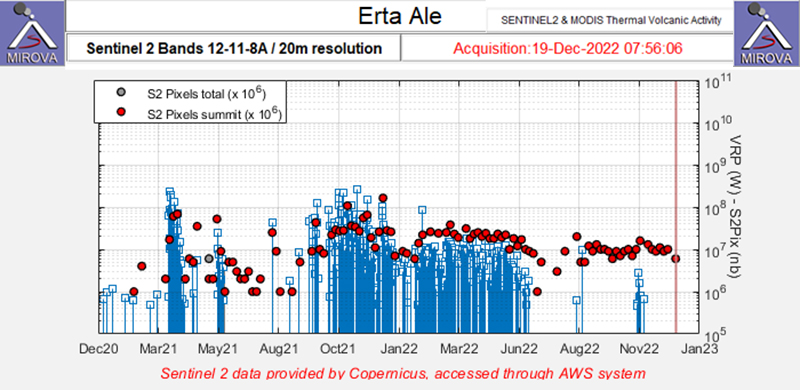 |
Figure 117. Graph of Sentinel-2 (red dots) and MODIS (blue bars) thermal anomalies at Erta Ale for the 2-year period ending 19 December 2022. Courtesy of MIROVA. |
Information Contacts: MIROVA (Middle InfraRed Observation of Volcanic Activity), a collaborative project between the Universities of Turin and Florence (Italy) supported by the Centre for Volcanic Risk of the Italian Civil Protection Department (URL: http://www.mirovaweb.it/); Sentinel Hub Playground (URL: https://www.sentinel-hub.com/explore/sentinel-playground); Hawai'i Institute of Geophysics and Planetology (HIGP) - MODVOLC Thermal Alerts System, School of Ocean and Earth Science and Technology (SOEST), Univ. of Hawai'i, 2525 Correa Road, Honolulu, HI 96822, USA (URL: http://modis.higp.hawaii.edu/).
Ongoing minor activity at S crater, and a renewed lava lake at the N crater in January 2023
Ethiopia's Erta Ale shield volcano, located in a desolate desert region with intense heat, has a caldera that consists of at least two pit craters (North and South), formed by the collapse of the surface lying above an empty space. Each pit crater harbors an active lava lake. During October 2021-November 2022, thermal anomalies at the S crater were almost persistent, while activity in the N crater was more intermittent (BGVN 47:12). This report covers December 2022-May 2023, during which time similar activity occurred. Information is based on satellite infrared data and several onsite visits.
Geologist and local guide Enku Mulugeta visited the volcano in late December 2022 and observed that vigorous lava spattering continued to build a steep-sided spatter cone (hornito), about 10 m high, within the S pit crater. Persistent glowing reflected off a steam plume accompanied this activity.
During a visit on 27 January 2023 Mulugeta reported that after 50 years of calm in the N crater, a new lava lake had begun to form. Slabs of dark, solidified crust on the lava lake surface continued to shift, accompanied by the typical bright orange lava glow between the slabs. He observed that the full-scale effusive eruption had covered an estimated 350 m in diameter to a depth of about 15 m. In addition, he observed that the hornito in the S crater continued to grow.
Mulugeta visited again on 29-31 March 2023 and noted that activity in the S crater continued, with a persistent lava lake whose surface level was about 5 m from the crater rim. Lava spattering continued to build the hornito, reaching “dozens of meters high”. He also observed that two large hornitos were building within the N crater.
Sentinel-2 images of Erta Ale during December 2022-May 2023 show that the heat signal from the N and S pit craters varied in intensity. Two bright hotspots in the S crater persisted throughout most of the reporting period, although they faded in mid-May. In the N pit, hotspots were either not visible or marginally visible during December through mid-January when one hotspot brightened and became intense and extensive on 28 January (figure 118). Thereafter, two hotspots were mostly visible with variable intensities.
Infrared data from both Sentinel-2 and MODIS, as shown graphically by the MIROVA system (figure 119), recorded ongoing crater heat following the stronger lava lake that ended in June 2022. Short pulses of stronger activity were detected in MODIS infrared data in late July-early August 2022, late October-early November 2022 (see BGVN 47:12), and late January-early February 2023.
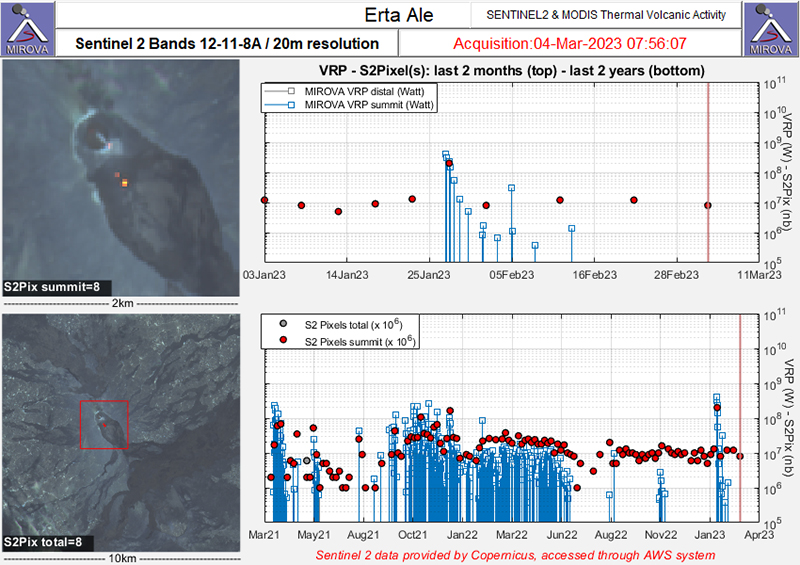 |
Figure 119. Graph of Sentinel-2 (red dots) and MODIS (blue bars) thermal anomalies at Erta Ale for the 2-year period ending 4 March 2023. Courtesy of MIROVA. |
Information Contacts: MIROVA (Middle InfraRed Observation of Volcanic Activity), a collaborative project between the Universities of Turin and Florence (Italy) supported by the Centre for Volcanic Risk of the Italian Civil Protection Department (URL: http://www.mirovaweb.it/); Copernicus Browser, Copernicus Data Space Ecosystem, European Space Agency (URL: https://dataspace.copernicus.eu/browser/); Enku Mulugeta (URL: https://www.facebook.com/enku.mulugeta).
Strong lava lake activity and lava overflows during June-November 2023
Erta Ale in Ethiopia has a 50-km-wide edifice that rises more than 600 m from below sea level in the Danakil depression. The summit caldera is 0.7 x 1.6 km and contains at least two pit craters (North and South). Another larger 1.8 x 3.1-km-wide depression is located SE of the summit and is bounded by curvilinear fault scarps on the SE side. Lava flows from fissures have traveled into the caldera and locally overflowed the crater rim. The current eruption has been ongoing since 1967, with at least one long-term active lava lake present in the summit caldera. Recent fissure eruptions from 2017 have occurred on the SE flank (BGVN 42:07). Recent activity has been characterized by minor thermal activity at the S crater and an active lava lake at the N crater (BGVN 48:06). This report covers strong lava lake activity primarily at the N pit crater during June through November 2023 using information from satellite infrared data.
Infrared satellite images generally showed an active lava lake as the N pit crater and variable thermal activity at the S pit crater during the reporting period. On 7 June two strong thermal anomalies were detected at the S pit crater and two weaker anomalies were visible at the N pit crater. Those anomalies persisted throughout the month, although the intensity at each declined. On 2 July a possible lava lake was identified at the S pit crater, filling much of the crater. On 7 July both pit craters contained active lava lakes (figure 120). By 12 July the thermal activity decreased; two smaller anomalies were visible through the rest of the month at the S pit crater while the N pit crater showed evidence of cooling.
Renewed lava lake activity was identified at the N pit crater, based on a satellite image from 11 August, with two smaller anomalies visible at the S pit crater. By 16 August the lava lake in the N pit had begun to cool and only a small thermal anomaly was identified. Activity restarted on 21 August, filling much of the E and SE part of the N pit crater. The thermal activity at the N pit crater intensified on 31 August, particularly in the NW part of the crater. On 5 September lava filled much of the N pit crater, overflowing to the W and SW. During at least 10-20 September thermal activity at both craters were relatively low.
According to a satellite image on 25 September, strong thermal activity resumed when lava overflowed the N pit crater to the S, SW, and NE (figure 120). A satellite image taken on 5 October showed lava flows from the N had spilled into the S and begun to cool, accompanied by two weak thermal anomalies at the S pit crater. On 15 October lava flows again traveled SE and appeared to originate from the S pit crater (figure 120). Following these events, smaller thermal anomalies were visible on the SE rim of the N pit crater and within the S pit crater.
Lava was visible in the NW part of the N pit crater according to a satellite image taken on 4 November. By 9 November the intensity had decreased, and the lava appeared to cool through the rest of the month; young lava flows were visible along the W side of the S pit crater on 24 and 29 November. Lava flows occurred at the N pit crater trending NE-SW and along the E side on 29 November (figure 120).
During the reporting period, the MIROVA (Middle InfraRed Observation of Volcanic Activity) thermal detection system recorded consistent activity during the first half of 2023 (figure 121). Beginning in June 2023, thermal activity increased and remained variable in intensity through the end of the year indicating the presence of an active lava lake and lava flows. The MODVOLC thermal detection system registered a total of 63 anomalies during 7, 8, and 23 July, 10 and 18 August, 3, 5, 16, 23, 24, and 25 September, 15 and 20 October, and 21, 24, 26, 28, and 30 November. Some of these stronger thermal anomalies were also detected in Sentinel-2 infrared satellite images that showed an active lava lake at the N pit crater and subsequent lava overflows from both pit craters (figure 120).
Information Contacts: MIROVA (Middle InfraRed Observation of Volcanic Activity), a collaborative project between the Universities of Turin and Florence (Italy) supported by the Centre for Volcanic Risk of the Italian Civil Protection Department (URL: http://www.mirovaweb.it/); Hawai'i Institute of Geophysics and Planetology (HIGP) - MODVOLC Thermal Alerts System, School of Ocean and Earth Science and Technology (SOEST), Univ. of Hawai'i, 2525 Correa Road, Honolulu, HI 96822, USA (URL: http://modis.higp.hawaii.edu/); Copernicus Browser, Copernicus Data Space Ecosystem, European Space Agency (URL: https://dataspace.copernicus.eu/browser/).
|
|
||||||||||||||||||||||||||
There is data available for 4 confirmed eruptive periods.
1967 Jul 2 (in or before) ± 182 days - 2025 Dec 17 (continuing) Confirmed Eruption (Explosive / Effusive) VEI: 0
| Episode 1 | Eruption (Explosive / Effusive) | |||||||||||||||||||||||||||||
|---|---|---|---|---|---|---|---|---|---|---|---|---|---|---|---|---|---|---|---|---|---|---|---|---|---|---|---|---|---|
| 1967 Jul 2 (in or before) ± 182 days - 2020 Apr 8 | Evidence from Observations: Reported | ||||||||||||||||||||||||||||
|
List of 4 Events for Episode 1
|
|||||||||||||||||||||||||||||
| Episode 2 | Eruption (Explosive / Effusive) | |||||||||||||||||||
|---|---|---|---|---|---|---|---|---|---|---|---|---|---|---|---|---|---|---|---|
| 2020 Jun 12 - 2020 Dec 4 | Evidence from Observations: Reported | ||||||||||||||||||
|
List of 2 Events for Episode 2
|
|||||||||||||||||||
| Episode 3 | Eruption (Explosive / Effusive) | Summit caldera | |||
|---|---|---|---|---|
| 2021 Feb 2 - 2025 Dec 17 (continuing) | Evidence from Observations: Reported | |||
1960 Jan 16 ± 15 days Confirmed Eruption (Explosive / Effusive) VEI: 0
| Episode 1 | Eruption (Explosive / Effusive) | |||||||||||||||||||
|---|---|---|---|---|---|---|---|---|---|---|---|---|---|---|---|---|---|---|---|
| 1960 Jan 16 ± 15 days - Unknown | Evidence from Observations: Reported | ||||||||||||||||||
|
List of 2 Events for Episode 1
|
|||||||||||||||||||
1940 Confirmed Eruption (Explosive / Effusive) VEI: 0
| Episode 1 | Eruption (Explosive / Effusive) | |||||||||||||||||||
|---|---|---|---|---|---|---|---|---|---|---|---|---|---|---|---|---|---|---|---|
| 1940 - Unknown | Evidence from Observations: Reported | ||||||||||||||||||
|
List of 2 Events for Episode 1
|
|||||||||||||||||||
1906 May Confirmed Eruption (Explosive / Effusive) VEI: 0
| Episode 1 | Eruption (Explosive / Effusive) | |||||||||||||||||||||||||||||
|---|---|---|---|---|---|---|---|---|---|---|---|---|---|---|---|---|---|---|---|---|---|---|---|---|---|---|---|---|---|
| 1906 May - Unknown | Evidence from Observations: Reported | ||||||||||||||||||||||||||||
|
List of 4 Events for Episode 1
|
|||||||||||||||||||||||||||||
[ 1904 Nov 1 ± 60 days ] Uncertain Eruption
| Episode 1 | Eruption (Explosive / Effusive) | |||||||||||||||||||
|---|---|---|---|---|---|---|---|---|---|---|---|---|---|---|---|---|---|---|---|
| 1904 Nov 1 ± 60 days - Unknown | Evidence from Unknown | ||||||||||||||||||
|
List of 2 Events for Episode 1
|
|||||||||||||||||||
[ 1903 ] Uncertain Eruption
| Episode 1 | Eruption (Explosive / Effusive) | |||||||||||||||||||
|---|---|---|---|---|---|---|---|---|---|---|---|---|---|---|---|---|---|---|---|
| 1903 - Unknown | Evidence from Unknown | ||||||||||||||||||
|
List of 2 Events for Episode 1
|
|||||||||||||||||||
[ 1873 ] Uncertain Eruption
| Episode 1 | Eruption (Explosive / Effusive) | |||||||||||||||||||
|---|---|---|---|---|---|---|---|---|---|---|---|---|---|---|---|---|---|---|---|
| 1873 - Unknown | Evidence from Unknown | ||||||||||||||||||
|
List of 2 Events for Episode 1
|
|||||||||||||||||||
This compilation of synonyms and subsidiary features may not be comprehensive. Features are organized into four major categories: Cones, Craters, Domes, and Thermal Features. Synonyms of features appear indented below the primary name. In some cases additional feature type, elevation, or location details are provided.
Synonyms |
||||
| Erta Ali | Artali | Oerteale | Hertale | Ginna Ale | Irta Ale | Sat Agomara | Ali Bogo | Erto Ale | Ertahale | ||||
Cones |
||||
| Feature Name | Feature Type | Elevation | Latitude | Longitude |
| Erta Ale | Shield volcano | |||
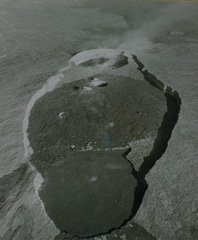 An aerial view looks NW across the axis of the elongated summit crater of Erta Ale volcano. The summit depression is formed by several coalescing craters. Several steep-walled pit craters cut the floor of the elliptical crater. At the time of this 1971 photo, steam rises from the northern of two active lava lakes. Lava overflows from the smaller southern pit crater (near the top of the area covered by dark lava flows) spread across much of the broad crater floor and spilled over its SE rim at the bottom of the photo.
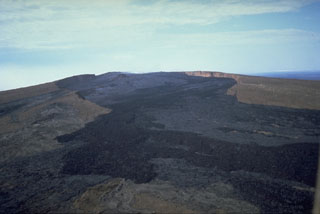 Erta Ale is a basaltic shield volcano that is the most active volcano in Ethiopia. The broad, 50-km-wide volcano rises 500 m from below sea level in the Danakil depression. It contains a 0.7 x 1.6 km elliptical summit crater, seen here from the SE. The crater contains steep-sided pit craters with one or more lava lakes that have been active since at least 1967. Fresh black lava flows from the southern pit crater fill much of the floor of the larger crater and spill over its rim down the S flank.
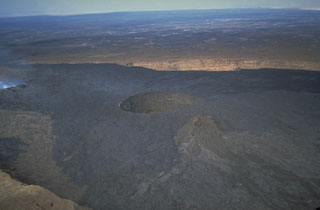 This 1992 view looks S over the summit crater of Erta Ale. A pit crater at the center contains an active lava lake, not visible from this view. Overflows of lava from this crater during 1971-73 diverged around an older cone and covered much of the broad crater floor.
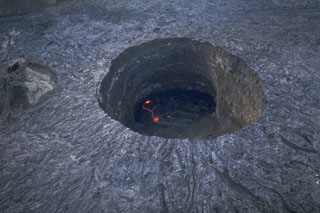 The 100-m deep southern pit crater cuts the floor of the summit crater of Ethiopia's Erta Ale volcano. This November 1992 photo shows an active lava lake at the base. Fresh lava flows radiate away from the crater rim. They were produced by lava overflows from the crater, particularly during 1971-73. The southern pit crater has had an active lava lake since at least 1967, and possibly since 1906. Few observations are made of this remote volcano, located in the extremely hot and arid Afar region.
 The summit of Erta Ale contains a 0.7 x 1.6 km elliptical caldera containing pit craters. A plume rises from the N pit at the left, and a lava lake was active in the center pit crater at the time of this February 2002 view from the S. It is an isolated basaltic shield volcano that is the most active volcano in Ethiopia. Recent basaltic lava flows fill much of the caldera and have overflowed its rim on the southern side. One, or sometimes two, long-term lava lakes have been active since at least 1967.
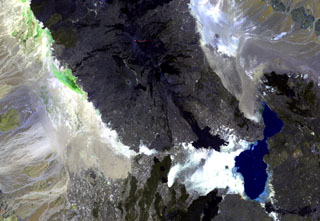 Ale Bagu, also known as Ummuna, is an elongate stratovolcano (left center) located SW of Erta Ale, the volcano at the top-center showing a small orange lava lake. In contrast to other volcanoes of the Erta Ale Range, Ale Bagu is mantled by basaltic pyroclastic rocks. The main crater is a steep-walled, 750 x 450 m depression. Trachytic lava flows occupy the crater floor and silicic lavas from the axial regional fissure extend to the NW and SE. Lake Giulietti (also known as Lake Afrera) is at the lower right.
The following 1 samples associated with this volcano can be found in the Smithsonian's NMNH Department of Mineral Sciences collections, and may be availble for research (contact the Rock and Ore Collections Manager). Catalog number links will open a window with more information.
| Catalog Number | Sample Description | Lava Source | Collection Date |
|---|---|---|---|
| NMNH 117283 | Lava | -- | -- |
| Copernicus Browser | The Copernicus Browser replaced the Sentinel Hub Playground browser in 2023, to provide access to Earth observation archives from the Copernicus Data Space Ecosystem, the main distribution platform for data from the EU Copernicus missions. |
| MIROVA | Middle InfraRed Observation of Volcanic Activity (MIROVA) is a near real time volcanic hot-spot detection system based on the analysis of MODIS (Moderate Resolution Imaging Spectroradiometer) data. In particular, MIROVA uses the Middle InfraRed Radiation (MIR), measured over target volcanoes, in order to detect, locate and measure the heat radiation sourced from volcanic activity. |
| MODVOLC Thermal Alerts | Using infrared satellite Moderate Resolution Imaging Spectroradiometer (MODIS) data, scientists at the Hawai'i Institute of Geophysics and Planetology, University of Hawai'i, developed an automated system called MODVOLC to map thermal hot-spots in near real time. For each MODIS image, the algorithm automatically scans each 1 km pixel within it to check for high-temperature hot-spots. When one is found the date, time, location, and intensity are recorded. MODIS looks at every square km of the Earth every 48 hours, once during the day and once during the night, and the presence of two MODIS sensors in space allows at least four hot-spot observations every two days. Each day updated global maps are compiled to display the locations of all hot spots detected in the previous 24 hours. There is a drop-down list with volcano names which allow users to 'zoom-in' and examine the distribution of hot-spots at a variety of spatial scales. |
|
WOVOdat
Single Volcano View Temporal Evolution of Unrest Side by Side Volcanoes |
WOVOdat is a database of volcanic unrest; instrumentally and visually recorded changes in seismicity, ground deformation, gas emission, and other parameters from their normal baselines. It is sponsored by the World Organization of Volcano Observatories (WOVO) and presently hosted at the Earth Observatory of Singapore.
GVMID Data on Volcano Monitoring Infrastructure The Global Volcano Monitoring Infrastructure Database GVMID, is aimed at documenting and improving capabilities of volcano monitoring from the ground and space. GVMID should provide a snapshot and baseline view of the techniques and instrumentation that are in place at various volcanoes, which can be use by volcano observatories as reference to setup new monitoring system or improving networks at a specific volcano. These data will allow identification of what monitoring gaps exist, which can be then targeted by remote sensing infrastructure and future instrument deployments. |
| Volcanic Hazard Maps | The IAVCEI Commission on Volcanic Hazards and Risk has a Volcanic Hazard Maps database designed to serve as a resource for hazard mappers (or other interested parties) to explore how common issues in hazard map development have been addressed at different volcanoes, in different countries, for different hazards, and for different intended audiences. In addition to the comprehensive, searchable Volcanic Hazard Maps Database, this website contains information about diversity of volcanic hazard maps, illustrated using examples from the database. This site is for educational purposes related to volcanic hazard maps. Hazard maps found on this website should not be used for emergency purposes. For the most recent, official hazard map for a particular volcano, please seek out the proper institutional authorities on the matter. |
| IRIS seismic stations/networks | Incorporated Research Institutions for Seismology (IRIS) Data Services map showing the location of seismic stations from all available networks (permanent or temporary) within a radius of 0.18° (about 20 km at mid-latitudes) from the given location of Erta Ale. Users can customize a variety of filters and options in the left panel. Note that if there are no stations are known the map will default to show the entire world with a "No data matched request" error notice. |
| UNAVCO GPS/GNSS stations | Geodetic Data Services map from UNAVCO showing the location of GPS/GNSS stations from all available networks (permanent or temporary) within a radius of 20 km from the given location of Erta Ale. Users can customize the data search based on station or network names, location, and time window. Requires Adobe Flash Player. |
| DECADE Data | The DECADE portal, still in the developmental stage, serves as an example of the proposed interoperability between The Smithsonian Institution's Global Volcanism Program, the Mapping Gas Emissions (MaGa) Database, and the EarthChem Geochemical Portal. The Deep Earth Carbon Degassing (DECADE) initiative seeks to use new and established technologies to determine accurate global fluxes of volcanic CO2 to the atmosphere, but installing CO2 monitoring networks on 20 of the world's 150 most actively degassing volcanoes. The group uses related laboratory-based studies (direct gas sampling and analysis, melt inclusions) to provide new data for direct degassing of deep earth carbon to the atmosphere. |
| Large Eruptions of Erta Ale | Information about large Quaternary eruptions (VEI >= 4) is cataloged in the Large Magnitude Explosive Volcanic Eruptions (LaMEVE) database of the Volcano Global Risk Identification and Analysis Project (VOGRIPA). |
| EarthChem | EarthChem develops and maintains databases, software, and services that support the preservation, discovery, access and analysis of geochemical data, and facilitate their integration with the broad array of other available earth science parameters. EarthChem is operated by a joint team of disciplinary scientists, data scientists, data managers and information technology developers who are part of the NSF-funded data facility Integrated Earth Data Applications (IEDA). IEDA is a collaborative effort of EarthChem and the Marine Geoscience Data System (MGDS). |