The Servicio Nacional de Geología y Minería (SERNAGEOMIN) reported declining seismicity, low sulfur dioxide emissions, and no deformation at Láscar in recent weeks. During 1-15 June sulfur dioxide emissions measured at a station 6 km ESE averaged 1,254 tonnes per day (t/d) with a maximum value of 2,572 t/d on 12 June. No anomalous emissions were detected in satellite data. White gas plumes visible in webcam views rose as high as 400 m above the crater rim and drifted ESE. Incandescence from the crater was visible during 6, 9-10, and 15 June, and periodically at night through the first half of June. Satellite data continued to show three zones of elevated temperatures on the crater floor. The seismic network recorded fewer and less intense signals indicative of volcanic processes. The Alert Level was lowered to Green (the lowest level on a four-color scale).
Source: Servicio Nacional de Geología y Minería (SERNAGEOMIN)
New effusive dome, ash plumes, and crater incandescence during December 2022-February 2023
Láscar, located in the northern Chilean Andes, contains six overlapping summit craters and two major edifices; activity began at the eastern volcano and then shifted to the western cone. Frequent small-to-moderate explosive eruptions have been recorded since the mid-19th century, in addition to periodic larger eruptions that produced ashfall hundreds of kilometers away. The previous eruption during October 2015-April 2017 was characterized by ash plumes, thermal activity, and gas-and-steam emissions. This report covers a new eruption that included an explosion, ash plumes, and thermal activity during December 2022 through February 2023 using information from Chile's Servicio Nacional de Geología y Minería, (SERNAGEOMIN).
Typical activity prior to December 2022 consisted of seismicity, sulfur dioxide emissions, and occasional thermal anomalies. Seismicity during December was characterized by 62 volcano-tectonic (VT)-type events associated with rock fracturing, 165 long period (LP)-type events, and 16 tremor (TR)-type events. Sulfur dioxide emissions data was obtained by the Differential Optical Absorption Spectroscopy (DOAS) equipment located 6 km ESE from the active crater. The average value was 285 ± 46 t/d during 1-15 December and 612 ± 67 t/d during 16-31 December, with a maximum daily value of 1,333 t/d on 26 December. On 10 December an explosion was detected on the N slope of the volcano at 1236 that produced an ash plume that rose 6 km above the crater and drifted SW (figure 47), based on GOES satellite images. Additionally, pyroclastic flows generated near the crater following this event traveled N and SE. Gas-and-steam emissions rose 20-880 m above the crater, accompanied by intermittent nighttime incandescence that was visible 640 m above the crater. A thin layer of ash was deposited to the S, SW, W, and NW. After this explosive event, seismicity gradually declined. On 18 December white gas-and-steam emissions were observed up to 980 m above the crater and nighttime crater incandescence was observed during 25-27 December. SERNAGEOMIN reported that after 19 December activity levels returned to baseline.
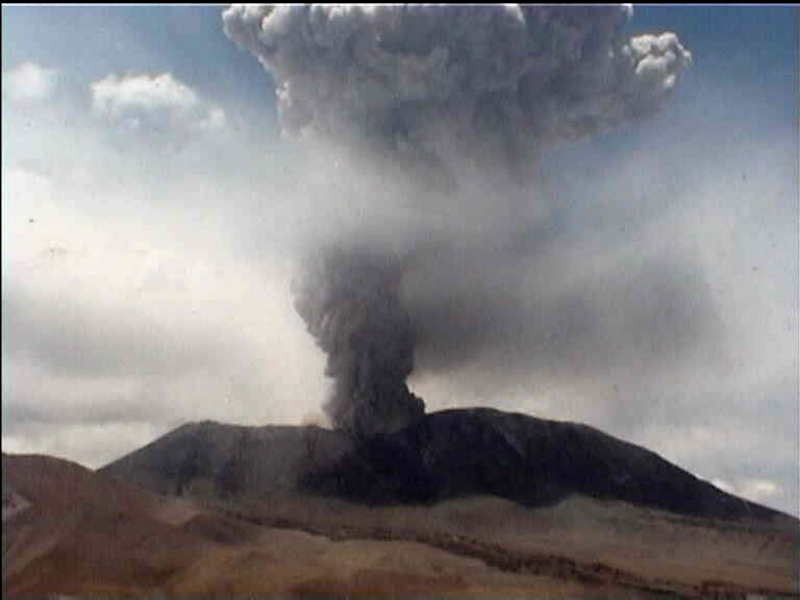 |
Figure 47. Webcam image showing an ash plume from Láscar on 10 December 2022 that rose to 6 km above the crater and drifted SW. Courtesy of SERNAGEOMIN (Reporte Especial de Actividad Volcanica (REAV), Region De La Araucania y Los Rios, Volcan Láscar, 10 de diciembre de 2022, 13:18 Hora local). |
Seismicity during January 2023 consisted of 22 VT-type events and 23 LP-type events. Sulfur dioxide emissions data obtained by the DOAS equipment had an average value of 483 ± 74 t/d, with a maximum daily value of 881 t/d on 13 January. Occasional low-level thermal anomalies were detected in satellite images, corresponding to passive degassing from the vents in the summit crater. More frequent and robust gas-and-steam emissions were reported during January compared to previous months, rising as high as 1.4 km above the crater. Starting on 11 January low intensity nighttime incandescence was occasionally observed. A total of 14 thermal anomalies were detected in satellite data during 13-28 January; the intensity of the anomalies increased on 17 January and peaked on 22 January. On 18 January sulfur dioxide emissions had a peak average value of 1,787 t/d. According to SERNAGEOMIN, a low-energy eruptive pulse was detected on 26 January at 2259, which corresponded to incandescent ejecta and an emission plume that likely contained tephra, rising almost 1.9 km above the crater and drifting NW. On 27 January at 2300 the intensity of LP events significantly increased, and crater incandescence was detected. A series of four LP events were recorded at 0015, 0032, 0043, and 0052 on 28 January, which corresponded with emissions that rose 380 m above the crater rim and drifted NW. Minor crater incandescence persisted and gas-and-steam plumes rose as high as 760 m above the crater. Elevated levels of seismicity continued during 28-30 January.
A Skysat image taken on 30 January showed a shallow, effusive, dome-like body that covered 5.3 m2 in the active crater (figure 48). On 31 January the effusive body was measured and had a diameter of 81 m along the minor axis and 93 m along the major axis. By 2 February the dome-like body had grown to cover an area of 6.2 m2 in the active crater, which suggested a growth rate of 308 m2 per day. A low-level reddish gas-and-steam emission rose 200-340 m above the crater rim and drifted SW at 2053 on 4 February. Mostly diffuse gas-and-steam emissions continued throughout the month, generally rising 400-500 m above the crater rim, though during 11-12 February emissions rose as high as 700 m above the crater rim. The average value of sulfur dioxide emissions was 443 t/d measured on 17 February using DOAS equipment and on 20 and 21 February the average value was 21 t/d and 460 t/d, respectively.
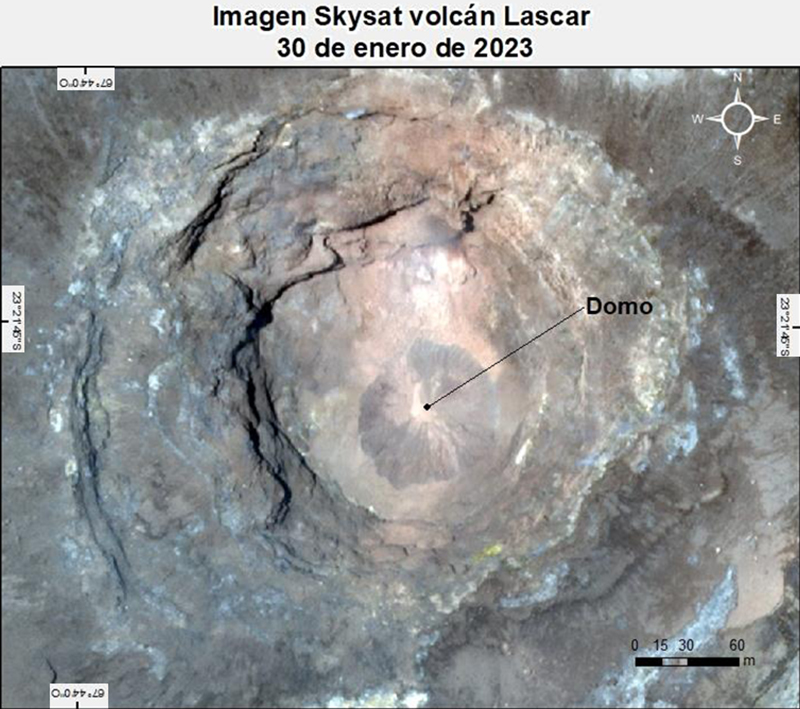 |
Figure 48. Satellite image showing the new, growing effusive dome growing in the active crater Láscar taken on 30 January 2023. According to measurements taken on 31 January, the dome had dimensions of 81 x 93 m, covering 5.3 m2. Courtesy of SERNAGEOMIN (Reporte Especial de Actividad Volcanica (REAV), Region De La Araucania y Los Rios, Volcan Láscar, 31 de enero de 2023, 15:00 Hora local). |
Information Contacts: Servicio Nacional de Geología y Minería, (SERNAGEOMIN), Observatorio Volcanológico de Los Andes del Sur (OVDAS), Avda Sta María No. 0104, Santiago, Chile (URL: http://www.sernageomin.cl/).
2025: February
| March
| June
2023: January
| February
| April
| October
2022: January
| December
2018: April
2015: October
2013: April
2012: January
2007: January
| March
| May
| July
2006: April
| August
2005: May
2003: December
The Servicio Nacional de Geología y Minería (SERNAGEOMIN) reported declining seismicity, low sulfur dioxide emissions, and no deformation at Láscar in recent weeks. During 1-15 June sulfur dioxide emissions measured at a station 6 km ESE averaged 1,254 tonnes per day (t/d) with a maximum value of 2,572 t/d on 12 June. No anomalous emissions were detected in satellite data. White gas plumes visible in webcam views rose as high as 400 m above the crater rim and drifted ESE. Incandescence from the crater was visible during 6, 9-10, and 15 June, and periodically at night through the first half of June. Satellite data continued to show three zones of elevated temperatures on the crater floor. The seismic network recorded fewer and less intense signals indicative of volcanic processes. The Alert Level was lowered to Green (the lowest level on a four-color scale).
Source: Servicio Nacional de Geología y Minería (SERNAGEOMIN)
The Servicio Nacional de Geología y Minería (SERNAGEOMIN) reported continuing unrest at Láscar. A thermal anomaly in the crater detected on 16 March was the most intense anomaly recorded in the previous month. Other satellite data continued to show three zones of elevated temperatures in the crater. Whitish gas emissions persisted. The seismic network recorded a decrease of long-period earthquakes beginning in early February. The Alert Level remained at Yellow (the second lowest level on a four-color scale) and the public was warned to stay at least 1 km away from the crater.
Source: Servicio Nacional de Geología y Minería (SERNAGEOMIN)
The Servicio Nacional de Geología y Minería (SERNAGEOMIN) reported increasing unrest at Láscar. Satellite images detected progressively increasing sulfur dioxide emissions since 6 February (188 tons per day) with an average of 1,191 tons per day (t/d) recorded on 20 February. Sulfur dioxide emissions measured with Differential Optical Absorption Spectroscopy (DOAS) instrumentation located at the Emú station, 6 km ESE, averaged 1,010 t/d on 22 February. Thermal anomalies occasionally detected in satellite data indicated increased temperatures on the crater floor during 6-23 February. Additionally, crater incandescence was visible in webcam images during 19 and 22-23 February. Seismicity during 19-24 February was characterized by a decrease in long-period earthquakes and an increase in signals indicating surficial activity such as landslides. The Alert Level remained at Yellow (the second lowest level on a four-color scale) and the public was warned to stay at least 1 km away from the crater.
Source: Servicio Nacional de Geología y Minería (SERNAGEOMIN)
On 6 February the Servicio Nacional de Geología y Minería (SERNAGEOMIN) issued a special report noting increased emissions at Láscar. A whitish-colored gas plume observed in webcam views rose almost 2 km above the summit. Sulfur dioxide emissions detected in satellite data were 188 tons per day which was characterized as atypical during the previous year. A thermal anomaly in the crater was identified in satellite data suggesting an increase in temperature within the crater. Seismicity did not clearly indicate variations that may be related to unrest, though two long-period earthquakes were recorded on 7 and 9 February. Sulfur dioxide emissions increased to 752 tons on 11 February. On 12 February the Alert Level was raised to Yellow (the second lowest level on a four-color scale) and the public was warned to stay at least 1 km away from the crater.
Source: Servicio Nacional de Geología y Minería (SERNAGEOMIN)
On 6 October SERNAGEOMIN reported that the Alert Level for Láscar had been lowered to Green (the lowest level on a four-color scale) because activity had returned to baseline levels. During 16-30 September sulfur dioxide gas emissions were low, averaging 565 tons per day (t/d) with a maximum of 1,109 t/d on 28 September. Passive, low-energy, whitish gas continued to be emitted, rising as high as 600 m above the crater rim on 28 September. Thermal anomalies continued to be absent in satellite data and deformation was not detected. The public was warned to stay at least 500 m away from the crater. SENAPRED declared a “preventative early warning” for San Pedro de Atacama (70 km NW) and maintained a safety perimeter of 3 km around the volcano.
Sources: Servicio Nacional de Geología y Minería (SERNAGEOMIN); Sistema y Servicio Nacional de Prevención y Repuesta Ante Desastres (SENAPRED)
SERNAGEOMIN reported that during the last two months activity at Láscar had declined to low levels, based on seismological, geodetic, geochemical, and remote sensing data, though remained above baseline. The volume of the lava dome remained unchanged, seismicity was low including small numbers of volcano-tectonic and tornillo-type events, sulfur dioxide gas emissions were low, and tephra was absent from emissions. On 6 April the Alert Level was lowered to Yellow (the second lowest level on a four-color scale) and the public was warned to stay at least 5 km away from the crater. SENAPRED updated the Alert Level Yellow (the middle level on a three-color scale) for San Pedro de Atacama (70 km NW) and maintained a security perimeter of 10 km around the volcano.
Sources: Servicio Nacional de Geología y Minería (SERNAGEOMIN); Sistema y Servicio Nacional de Prevención y Repuesta Ante Desastres (SENAPRED)
SERNAGEOMIN reported that during 15-21 February seismicity at Láscar continued to be dominated by volcano-tectonic signals with smaller numbers of both long-period and tornillo-type events. Daily whitish gas emissions were mostly diffuse, rose as high as 500 m above the crater rim, and drifted mainly E, SE, and W. Sulfur dioxide emissions were low, no notable deformation was detected, and no thermal anomalies were identified in satellite images. The Alert Level remained at Orange (the second highest level on a four-color scale) and SENAPRED warned the public to stay at least 10 km away from the crater. ONEMI maintained an Alert Level Yellow (the middle level on a three-color scale) for San Pedro de Atacama (70 km NW).
Sources: Servicio Nacional de Geología y Minería (SERNAGEOMIN); Oficina Nacional de Emergencia-Ministerio del Interior (ONEMI)
SERNAGEOMIN reported that seismicity at Láscar was dominated by volcano-tectonic signals with smaller numbers of both long-period and tornillo-type events during 7-14 February. Seismicity increased during the week, associated with continuing effusion of the dome-like structure that had emerged on the crater floor on 30 January. Daily whitish gas emissions were mostly diffuse and rose around 400 m above the crater rim, though emissions rose as high as 700 m during 11-12 February. Sulfur dioxide emissions were low, no deformation was detected, and no thermal anomalies were identified in satellite images. The Alert Level remained at Orange (the second highest level on a four-color scale) and SENAPRED warned the public to stay at least 10 km away from the crater. ONEMI maintained an Alert Level Yellow (the middle level on a three-color scale) for San Pedro de Atacama (70 km NW).
Sources: Servicio Nacional de Geología y Minería (SERNAGEOMIN); Oficina Nacional de Emergencia-Ministerio del Interior (ONEMI)
SERNAGEOMIN reported that a dome-like structure was first visible on the floor of Láscar’s summit crater in 30 January satellite images, after a period of increased seismicity recorded during the previous few days. The structure was 81 m by 93 m in dimension and covered an area of about 5,332 square meters. Seismicity was low during 1-7 February, though levels increased towards the end of the week. The dome was bigger in a 2 February satellite image and covered an area of 6,290 square meters, suggesting an estimated extrusion rate of 308 square meters per day during 30 January-2 February. At 2053 on 4 February a low-level, reddish-colored gas emission rose 200-340 m above the crater rim and drifted SW. The Alert Level remained at Orange (the second highest level on a four-color scale) and SENAPRED warned the public to stay at least 10 km away from the crater. ONEMI maintained an Alert Level Yellow (the middle level on a three-color scale) for San Pedro de Atacama (70 km NW).
Sources: Servicio Nacional de Geología y Minería (SERNAGEOMIN); Oficina Nacional de Emergencia-Ministerio del Interior (ONEMI)
SERNAGEOMIN reported increased seismicity at Láscar on 26 January with long-period (LP) events indicating fluid movement at shallower depths. The Alert Level was raised to Yellow (the second lowest level on a four-color scale) and SENAPRED warned the public to stay at least 3 km away from the crater. ONEMI declared an Alert Level Yellow (the middle level on a three-color scale) for San Pedro de Atacama (70 km NW). A seismic signal at 2259 corresponded to the ejection of incandescent material and the emission of a plume that likely contained tephra and rose almost 1.9 km and drifted NW.
The intensity of LP events significantly increased at 2300 on 27 January and remained at anomalous levels. A series of four LP events were recorded at 0015, 0032, 0043, and 0052 on 28 January and corresponding emissions rose 380 m above the crater rim and drifted NW. An M 3.2 volcano-tectonic earthquake was recorded at 0115 and felt by residents. LP earthquakes continued to be detected, along with tremor and volcano-tectonic events to a lesser extent. Minor crater incandescence was visible and gas plumes rose as high as 760 m. At 0430 the Alert Level was raised to Orange and the restricted zone was increased to 5 km. Elevated levels of seismicity continued to be detected during 28-30 January. Whitish-gray gas plumes possibly containing tephra rose to low heights and minor crater incandescence was occasionally observed. On 31 January SERNAGEOMIN stated that a satellite image from the day before showed a dome-like feature on the crater floor that was 81 m by 93 m in dimension and covered an area of about 5,332 square meters. The exclusion zone was increased to 10 km.
Sources: Servicio Nacional de Geología y Minería (SERNAGEOMIN); Oficina Nacional de Emergencia-Ministerio del Interior (ONEMI)
SERNAGEOMIN reported that after the 19 December 2022 eruption at Láscar, activity levels had returned to baseline. During 1-15 January sulfur dioxide emissions detected by a Differential Absorption Optical Spectroscopy (DOAS) instrument located 6 km ESE of the crater measured an average value of around 483 tonnes per day, with a maximum value of 881 tonnes per day on 13 January. These values were at normal levels. Occasional low-level thermal anomalies were identified in satellite images and corresponded to passive degassing from the vents in the summit crater. The maximum height of white gas plumes was 1.4 km above the crater rim, recorded on 11 January. On 19 January the Alert Level was lowered to Green (the lowest level on a four-color scale) and the public were warned to stay at least 700 m away from the crater. ONEMI reported that a “Preventive Early Warning” was declared for San Pedro de Atacama (70 km NW).
Sources: Servicio Nacional de Geología y Minería (SERNAGEOMIN); Oficina Nacional de Emergencia-Ministerio del Interior (ONEMI)
SERNAGEOMIN reported that seismic signals characterized as moderate were recorded on 19 December and located near Láscar’s main crater at shallow depths. The seismicity was the most notable recorded since the eruption on 10 December. The Alert Level remained at Yellow (the second lowest level on a four-color scale) and the public were warned to stay at least 5 km away from the crater. ONEMI maintained the Alert Level Yellow (the middle level on a three-color scale) for San Pedro de Atacama (70 km NW).
Source: Servicio Nacional de Geología y Minería (SERNAGEOMIN)
SERNAGEOMIN reported that an eruption at Láscar began at 1236 on 10 December with an explosive event that produced a dense ash plume and pyroclastic flows proximal to the crater. Hikers were near the crater and took video of the eruption. According to SEGEMAR the pyroclastic flows traveled short distances to the N and SE. The ash plume rose about 6 km above the crater rim and drifted SW. The event was coincident with a long-period earthquake detected by the seismic network. Later that day the Alert Level was raised to Yellow (the second lowest level on a four-color scale) and the public were warned to stay at least 5 km away from the crater. ONEMI declared an Alert Level Yellow (the middle level on a three-color scale) for San Pedro de Atacama (70 km NW). CKELAR noted that the thermal anomaly had intensified during the five days prior to the eruption along with increased sulfur dioxide gas emissions.
Sources: Servicio Nacional de Geología y Minería (SERNAGEOMIN); Servicio Geológico Minero Argentino (SEGEMAR); Instituto Milenio de Investigación en Riesgo Volcánico (CKELAR); Red Geocientífica de Chile
SERNAGEOMIN reported minor increases in surficial activity at Láscar. Nighttime incandescence from the crater began to be visible at least since 11 January. A total of 14 thermal anomalies were identified in satellite data during 13-28 January; the intensity of the anomalies increased on 17 January and peaked on 22 January. Emissions of gas and steam were more frequent and robust as compared to previous months, with the highest plume rising over 1 km above the crater rim on 22 January. Sulfur dioxide emissions were identified in satellite data on 8 and 17 January; instruments at EMU station, 6 km ESE, recorded increased emission rates during 17-19 January with a peak average of 1,787 tons per day on 18 January. Seismicity was at normal levels overall during 12-28 January. Low numbers and magnitudes of volcano-tectonic (VT) and long-period (LP) earthquakes were recorded by the seismic network, though 27 VT events that were low magnitude (M 1 or below) were recorded on 22 January. Satellite images acquired on 26 January showed no recent morphological changes at the crater nor deposits around the crater area. The Alert Level remained at Green (the lowest level on a four-color scale).
Source: Servicio Nacional de Geología y Minería (SERNAGEOMIN)
OVDAS-SERNAGEOMIN reported that, although seismicity at Láscar during March was low, characteristics of the signals were similar to patterns observed prior to previous minor phreatic explosions, particularly before events in 2013 and 2015. The Alert Level was raised to Yellow (second highest level on a four-color scale); SERNAGEOMIN recommended no entry into a restricted area within 5 km of the crater. ONEMI declared an Alert Level Yellow (the middle level on a three-color scale) for San Pedro de Atacama.
Sources: Servicio Nacional de Geología y Minería (SERNAGEOMIN); Oficina Nacional de Emergencia-Ministerio del Interior (ONEMI)
OVDAS-SERNAGEOMIN reported that at 0932 on 30 October the webcam recorded an ash plume rising 2.5 km above Láscar and drifting NE. A low-to-moderate-level seismic signal accompanied the emission. The Alert Level was raised to Yellow (the second lowest level on a four-color scale). ONEMI declared a Yellow Alert for the municipality of San Pedro de Atacama.
Source: Servicio Nacional de Geología y Minería (SERNAGEOMIN)
OVDAS-SERNAGEOMIN reported that during March a web camera monitoring Láscar recorded white gas plumes rising 600 m above the crater. At night during 2-4 April incandescence from the crater was observed. On 3 April increased emissions from the crater fluctuated from white to gray, indicating possible ash. Plumes rose 320 m and drifted SE. Seismicity remained at normal levels during the increased emissions. On 5 April the Alert Level was raised to Yellow.
Source: Servicio Nacional de Geología y Minería (SERNAGEOMIN)
OVDAS-SERNAGEOMIN reported increased seismicity at Láscar on 5 January and raised the Alert Level from Green to Yellow. On 8 January ONEMI authorities warned residents about the new Alert Level status and restricted residents from going within a 20-km radius of the volcano.
Sources: Servicio Nacional de Geología y Minería (SERNAGEOMIN); Oficina Nacional de Emergencia-Ministerio del Interior (ONEMI)
Based on pilot reports and satellite image observations, the Buenos Aires VAAC reported that an ash plume from Lascar rose to altitudes of 7.6-9.1 km (25,000-30,000 ft) a.s.l. on 18 July and drifted NE.
Source: Buenos Aires Volcanic Ash Advisory Center (VAAC)
Based on a Significant Meteorological Information (SIGMET) advisory and satellite image observations, the Buenos Aires VAAC reported that an ash plume from Lascar rose to an altitude of 9.1 km (30,000 ft) a.s.l. on 23 May and drifted SSE.
Source: Buenos Aires Volcanic Ash Advisory Center (VAAC)
The Buenos Aires VAAC reported that on 11 March an ash cloud from Lascar rose to 5.5-6.7 km (18,000-22,000 ft) a.s.l. and drifted E.
Source: Buenos Aires Volcanic Ash Advisory Center (VAAC)
Based on satellite imagery, the Buenos Aires VAAC reported continuous emissions from Lascar on 22 January. Ash plumes drifted NNE.
Source: Buenos Aires Volcanic Ash Advisory Center (VAAC)
Several small phreatic explosions occurred at Lascar during May, July, and August. The explosions were separated in time by up to several weeks. The last observed explosion, lasting for about five minutes on 14 August, produced a plume that reached a height of 450 m above the crater (19,800 ft a.s.l.) and dispersed ESE.
Source: Jorge Clavero-Chilean Geological Survey (Sernageomin) and Juan Cayupi-Chilean Emergency Office (ONEMI) via the Volcano Listserv
Based on information from a significant meteorological forecast (SIGMET), the Buenos Aires VAAC reported that on 28 April a W-drifting ash cloud was observed at a height around 6.1-7.6 km (20,000-25,000 ft) a.s.l. The Aviation Color Code was at Red. Later that day activity was no longer observed and the Aviation Color Code was reduced to Green.
Source: Buenos Aires Volcanic Ash Advisory Center (VAAC)
Several phreatic explosions occurred at Lascar daily during 18-21 April. The explosions produced plumes of gas and small amounts of ash, with the highest rising plumes reaching 3 km above the volcano (or 28,200 ft a.s.l.) on the 18th and the 21st. Ash was deposited on the volcano's flanks as far as 3 km from the summit. There was no evidence of new magma reaching the surface and recorded seismicity was inferred to be related to shallow degassing. The Buenos Aires VAAC released volcanic ash advisory statements during the report period.
Sources: Jorge Clavero-Chilean Geological Survey (Sernageomin) and Juan Cayupi-Chilean Emergency Office (ONEMI) via the Volcano Listserv; Buenos Aires Volcanic Ash Advisory Center (VAAC)
ONEMI reported that two explosive eruptions occurred at Lascar on 18 April. The first ash emission began at 1120 and the second began at 1315. According to the Buenos Aires VAAC, a significant meteorological forecast (SIGMET) was issued for Lascar on 18 April stating that a "smoke" column was at a height of 8 km (26,250 ft) a.s.l. and was drifting eastward towards Argentina. The Aviation Color Code was at Red, the highest level. Activity ended later that day, so the Aviation Color Code was reduced to Green. The Villarrica Volcano Visual Observation Project (POVI) website reported that a cloud rose to 3 km above the volcano (28,200 ft a.s.l.), no seismic activity was recorded in the area, and no evacuations occurred.
Sources: Villarrica Volcano Visual Surveillance Project; Oficina Nacional de Emergencia-Ministerio del Interior (ONEMI); Buenos Aires Volcanic Ash Advisory Center (VAAC)
The Buenos Aires VAAC reported an eruption from Lascar seen on satellite imagery early on 4 May that sent an ash plume into the 4.5-10.6 km a.s.l. range (15,000-35,000 feet), where it was moving to the SE.
Source: Buenos Aires Volcanic Ash Advisory Center (VAAC)
According the Oficina Nacional de Emergencia Ministerio del Interior (ONEMI), on 9 December small amounts of fine ash were emitted from fumaroles at Lascar. The following day activity was at "normal" levels, with only gas and steam emitted. No increased seismicity was recorded.
Source: Oficina Nacional de Emergencia-Ministerio del Interior (ONEMI)
Reports are organized chronologically and indexed below by Month/Year (Publication Volume:Number), and include a one-line summary. Click on the index link or scroll down to read the reports.
Hypersthene andesite ashfall 350 km to the SE
Lascar erupted during the morning of 16 September. Strong winds deposited hypersthene andesite ash on the city of Salta, Argentina, 350 km SE [see also 12:4-5].
Information Contacts: J. Viramonte, Univ Nacional de Salta, Argentina; Telam News Service, Buenos Aires.
Three explosions emitted ash clouds in September 1986
Eruptive activity [in September 1986] was observed by MINSAL Co. geologists in Toconao (32.5 km NW). Paul King, Sheila King, and John Heathcote reported that single explosive events occurred on 14, 15, and 16 September. Prior to the eruptions, a prominent steam plume, larger than the normal plume, had been present but no significant seismic activity had been recorded. No glow from the summit had been visible at night.
The 14 September eruption (at 1430) sent a brown, ash-laden cloud as much as several hundred meters above the crater rim. Ash pulses continued for ~30 minutes. After ~45 minutes all activity had ended. The 15 September eruption occurred at about the same time of day and appeared to be of similar magnitude, but visibility was poor. The explosive event of 16 September was powerful but brief, and ejected only a small amount of ash. It began with a loud, somewhat sustained, rumbling explosion at about 0730. A brown ash cloud rose vertically as a dense plug, expanded, took on a cauliflower texture, and finally broadened into a mushroom-shaped cloud extending SE. No pyroclastic flows were observed and the ash column dispersed rapidly. The first minutes of the eruption were photographed. Altitudes of ash clouds (measured from the photographs) reached at least 15 km altitude and the plume may have extended 20 km downwind. A GOES satellite image at 0800 showed a small plume stretching E from Lascar. By 0900 it had turned S but an hour later its distal end was obscured by clouds.
Field investigations on 1 April 1987 revealed no magmatic activity. Vapor from vents on the sides of a deep, steep-walled pit crater created a bluish haze but no white steam cloud was present. A strong SO2 smell was noted by geologists in an aircraft above the volcano. No incandescence was observed. An extremely thin layer of ash covered the SE flanks, concentrated along a very narrow axis of dispersion. At 0.5 km from the volcano the largest fresh tephra particles were 5-10-mm angular fragments of dense, dark, unvesiculated lava, very similar to the finer grained ash (0.01-0.02 mm diameter) that fell on Salta on 16 September.
Observations from aircraft showed a large number of impact craters and ejected blocks on the N flank. Most seemed to predate the 16 September eruption but a few appeared to geologists to be extremely fresh ('rays' of ejecta were well preserved). Fresh, dense, andesitic lava blocks in these craters were up to 40 cm in diameter.
The geologists found no evidence to suggest that juvenile material was erupted. Thermal studies with the Landsat T M during 1985 and 1986 had shown a thermal anomaly at Lascar that was much stronger than any other in the central Andes. Francis and Rothery (1987) interpreted the anomaly as indicating the presence of magma, or possibly a lava lake, in the summit crater complex.
Reference. Francis, P.W. and Rothery, D.A., 1987, Using the Landsat Thematic Mapper to Detect and Monitor Active Volcanoes: an Example from Northern Chile; Geology, v. 15, no. 7, p. 614-617.
Further Reference. Glaze, L.S., Francis, P.W., Self, S., and Rothery, D.A., 1989, The 16 September 1986 Eruption of Lascar Volcano, North Chile: Satellite Investigations; Bulletin of Volcanology, v. 51, p. 149-160.
Information Contacts: P. Francis, Lunar and Planetary Institute, Houston; C. Ramirez, SERNAGEOMIN; W. Gould, NOAA/NESDIS.
Ashfall in Argentina 16 September; ash chemistry
The following describes ashfall in Salta, Argentina [from the 16 September 1986 eruption (12:4)]. Chile time (GMT - 4 hours) is used instead of Argentina time (1 hour later) for consistency with observations from the volcano.
At 0830 on 16 September, an unusually high gray cloud was seen coming from the NW in an otherwise clear sky towards Salta, Argentina (350 km SE of the volcano). At 0900 fine ashfall began, continuing until about 1230. Officials from the Salta airport reported that winds at 9,000 m altitude were blowing from azimuth 300° at 145 km/hour between 1500 on 15 September and 1300 on 16 September. In Salar de Rincón (Argentina Puna) 65 km SE of Lascar, observers reported that the sky suddenly turned dark on the morning of 16 September but that no ash fell.
Ash accumulated 0.5 mm at Salta Univ and microscopic analysis showed a hypersthene andesite composition. Two ash samples were collected and leached, one with distilled water, the other with HCl (table 1).
Table 1. Leachates from samples of Lascar's ash collected at Salta, Argentina on 16 September 1987. Two ash samples were collected (0.5 kg) and leached, one with distilled water, the other with HCl (0.1 N). The ash/water ratio was 1:10 and the stirring time, 5 and 15 minutes respectively. Courtesy of J. Viramonte.
| Component | H2O (ppm) | HCl (0.1 N; ppm) |
| Cl | 890 | -- |
| SO4 | 6300 | 7000 |
| Mg | 70 | 240 |
| Ca | 500 | 1150 |
| Na | 370 | 520 |
| K | 135 | 240 |
Information Contacts: J. Viramonte, Univ Nacional de Salta, Argentina.
Continuing minor ash emission
During intermittent observations by geologists 11-30 March, ash emission was semi-continuous. Some periods of stronger activity were noted. On 11 March at about 0930, an ash-laden plume rose ~1,500 m above the active crater. Plumes reached 2,500-3,000 m above the volcano between 0700 and 1030 on 18 March; individual emissions lasting ~1 minute occurred every 3-5 minutes. The volcano generally appeared more active during the morning and low-level emissions were most noticeable before noon, a pattern assumed by the observers to be related to daily cycles of atmospheric conditions. No recent ash deposits were found. There were no signs of renewed magmatic activity, and the geologists suggested that the low-level explosions were probably due to slumping of crater walls into the conduit, with the resulting blockage being occasionally cleared after slight accumulation of gas pressure.
Geologists 32.5 km NW of Lascar (at the MINSAL Co. in Toconao) reported that similar activity had continued for several months. Between more active periods, steam and fume could usually be seen rising above the crater.
Information Contacts: M. Gardeweg and C. Ramirez, SERNAGEOMIN, Santiago; P. Francis and S. De Silva, Lunar and Planetary Institute, Houston; S. Self, Univ of Texas, Arlington, TX.
Three explosions send plumes to 3 km high
On 13 July, geologist Paul King (Minsal Corp., Toconao) saw two plumes emerge from Lascar. The first rose 2-3 km at 1330 and the second to 1-2 km at 1500. NOAA's geostationary weather satellite (GOES) imagery indicated that the plume blew SW ~20 km. Ash had fallen on Salta, Argentina (~300 km SE of the volcano) after the September 1986 eruption (12:4-5) but none fell there or on Argentina's high plateau after the July 1988 activity. Steam and ash emission during the morning of 15 July was followed by another ash eruption at 1400. Background activity, which has been minor steam and blue haze emission, preceded and followed the eruption. Hugo Moreno's initial inspection of photographs suggests that the 13 July explosion was phreatomagmatic, and the activity early on 15 July was phreatic with little or no ash.
Information Contacts: P. Francis, Lunar and Planetary Institute, Houston; H. Moreno, Univ de Chile, Santiago; J. Viramonte, Univ Nacional de Salta, Argentina.
Apparent new lava dome; gas and ash emission
. . . Paul King climbed the volcano in February 1989 and saw what appeared to be an active lava dome in the summit crater. Gas emission was vigorous, but no glow was visible from Toconao, ~30 km from the volcano.
During observations by M. Gardeweg and Adrian Jones 23 March-1 April 1989, irregular, dominantly steam emissions were continuously released from the N part of the E cone of this composite of two andesitic cones. Columns rose 400-600 m above the cone and plumes extended SE, with occasional fine-grained fallout. Observation from the SE flank on 26 March showed the steam to include sulfurous gas and light ash, which was being deposited on the E flank. A 1-m bomb in a fresh crater 4 m in diameter, 3 km S of the active summit, must have been erupted within recent months, although there are no reports of an eruption. The regular activity was interrupted for one day (29 March) by a change from emission of voluminous dense steam to light, translucent gas visible only near the summit.
Information Contacts: M. Gardeweg, SERNAGEOMIN, Santiago; A. Jones, Kingston Polytechnic, Surrey UK; P. King, Minsal Co., Toconao, Chile; P. Francis, Lunar & Planetary Institute, Houston.
Continued lava dome growth
A lava dome has been growing in the active summit crater, site of occasional tephra emission since 1986. Observations and pictures from Stephen Foot (MINSAL, Ltda.), who climbed the volcano on 18 April 1989, confirm Paul King's February 1989 report of a steaming lava dome (14:3). The photographs clearly show a dome growing in the W crater of the eastern of Lascar's two andesite cones (figure 1). Until early 1986, this crater was empty, with only solfataric and fumarolic activity. Foot's photographs show that by April 1989 the dome had reached an estimated 200 m in diameter and 50 m height. The dome had steep sides and a blocky, steamy, dark brown surface. Steam emissions of different intensities were still being continuously released in late June, and glow was visible from Toconao (~30 km away) on one occasion.
 |
Figure 1. Photograph of the growing lava dome in Lascar's summit crater, 18 April 1989, by Stephen Foot. Courtesy of M. Gardeweg. |
Information Contacts: M. Gardeweg, SERNAGEOMIN, Santiago; S. Foot, MINSAL Ltda., Santiago.
Lava dome deflates; strong SO2 emission
Lascar has been continuously active since the September 1986 explosive eruption. The lava dome that had been growing in the active crater in March and April 1989 had deflated by 19 October (figure 2) when an Argentine-Chilean geological team (José Viramonte, Carlos Peralta, Carlos Pérez, Luís Baeza, and Sergio Espinosa) climbed the volcano. Three ring faults were associated with the collapse, the outer with a 15-m scarp, the two others with scarps of only 0.5 and 1 m. Each was marked by a succession of fumaroles with intense steam-dominated emissions that had a strong HCl odor and had deposited sulfur sublimates. A recent phreatic crater 20 m in diameter cut the outer ring fault. Fumaroles on the ESE edge of the collapsed dome made a strong jet aircraft sound. Portable 2-component seismographs were installed at three sites on the cone 16-19 October. Only a few volcanic earthquakes accompanied significant regional-related earthquake activity, but significant tremor was recorded.
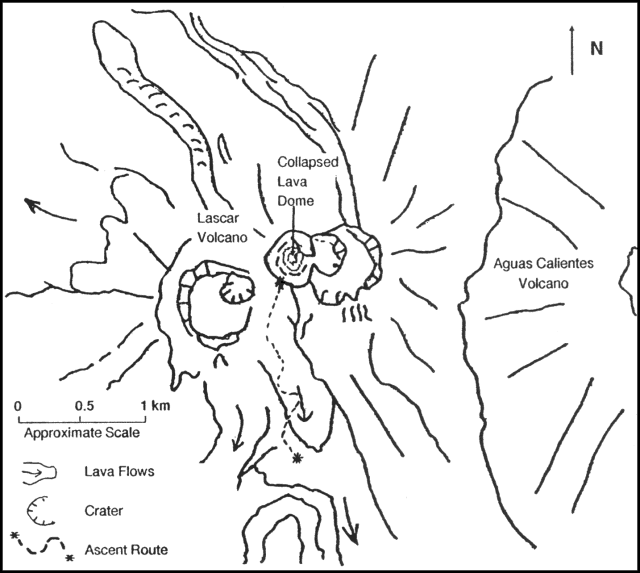 |
Figure 2. Sketch map showing the collapsed lava dome in the W crater of the eastern of Lascar's two andesite cones, and the ascent route of the Argentine-Chilean team. Courtesy of J. Viramonte. |
Geologists from several institutions, including the Servicio Nacional de Geología y Minería, observed Lascar's activity from the ground and aircraft 21 October-17 November. The following is from their report.
"The dome, ~200 m in diameter, had deflated from the previously reported minimum volume of 1.5 x 10⁶ m3 such that its top was at or below the crater floor (figure 3). We postulate that this may be due to magma withdrawal. We could find no evidence, either from local reports or from deposits near the crater, to suggest that any explosive activity has occurred since July 1988.
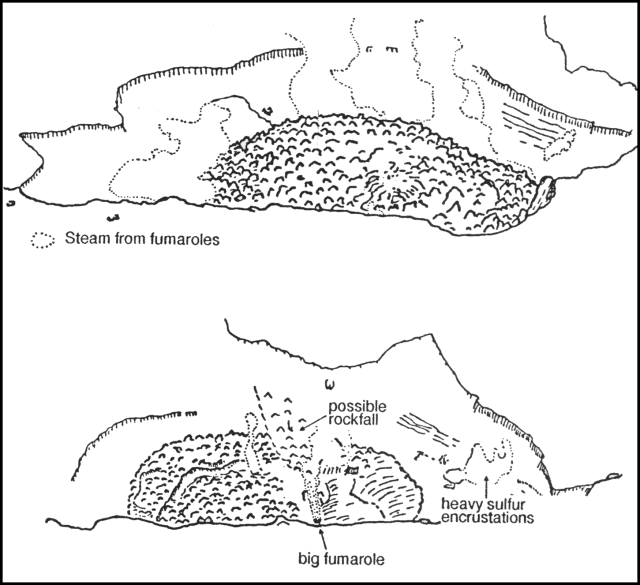 |
Figure 3. Sketches made by Stephen Self from photographs taken in April 1989 by Stephen Foot (top) and November 1989 by M. Gardeweg (bottom). Both look over the S wall of Lascar's active crater. Vantage points of the two photos are similar but not identical. The diameter of the lava dome in the April view is about 200 m. Note evidence of deflation of the dome in the November photo and the positions of fumaroles in each. |
"Since April, regular observations of Lascar's plume, and the times of rumbling (retumbos), local earthquakes, and night glow above the crater have been compiled by Eduardo Necul Tello, a schoolteacher in Talabre, ~20 km WNW of Lascar. His observations document higher plumes, crater glow, and more frequent rumbling during April, which may correlate with the main period of dome extrusion. Rumbling reported by Necul on 10 October at noon may have been associated with dome collapse.
"The dome had one major fumarole on the SE edge of the crater. It was venting gas at extremely high velocities, creating a jet engine-like noise similar to that reported for pre-dome fumaroles (Danny Osborne, personal communication, 1984). As in April, most of the fumaroles were around the edge of the dome, but there were a few in the interior of the dome area that did not exist in April. The jet-like fumarole released by far the largest volume of gas. The dome was crossed by NW-SE cracks that may have been extensional during its growth." Bombs, probably from the September 1986 explosive activity, were collected for chemical analysis; they appeared dacitic in hand specimen.
"More than 70 COSPEC measurements of SO2 flux were obtained from several ground-based stations on the S and SE sides of Lascar 16-17 November. Preliminary data suggest that Lascar's SO2 output is in the range of 1,100-1,500 t/d. Based on daily observations of the plume during the last eight months, these two days of measured output are typical. Moreover, this level of gas release has been semi-continuous for the last four years.
"At any particular time, fewer than 10 volcanoes have SO2 emission rates that exceed 1,000 t/d. Such high rates generally indicate an open vent condition. If the 16-17 November rates at Lascar are extrapolated over longer periods, the extruded magma volume could not account for the amount of SO2 emitted, assuming an average dacite composition. We postulate that this reflects a distillation of SO2 from a subsurface magma body.
"Significant changes in Lascar's extrusive activity over the last few months and the apparent continued degassing of a magma body at depth indicate that this volcano should be routinely monitored. Over the short term, since April 1989, the explosive hazard potential of Lascar has decreased. However, the situation could change rapidly in the future."
Information Contacts: M. Gardeweg, SERNAGEOMIN, Santiago; S. Foot, MINSAL Ltda., Santiago; R. Letelier, ONEMI, Santiago; L. Glaze, JPL; R. Andres and W. Rose, Michigan Technological Univ; P. Francis and S. de Silva, Lunar and Planetary Institute, Houston; S. Self, Univ of Texas; J. Viramonte, Univ Nacional de Salta, Argentina; S. Espinoza and L. Baeza, Univ del Norte, Antofagasta.
Strong steam plumes
Strong steam eruptions were observed by Stephen Foot on 17 December between 0915 and 0930, and on 21 December at 1130. In each instance, fumarolic activity changed from the normal emission of a small diffuse plume to ejection of a very dense white cloud that rose ~2 km above the crater for ~15 minutes. The clouds were opaque and produced a heavy shadow. The plumes then diminished in height, remaining near the volcano for about an hour, then moved N on the 17th and NE on the 21st. No recent precipitation had occurred in the area.
Information Contacts: S. Foot, MINSAL Ltda., Santiago; M. Gardeweg, SERNAGEOMIN, Santiago.
Landsat data show persistent thermal anomaly despite deflation of lava dome
Landsat TM data recorded on 28 November and 14 December show the continued presence of a short-wavelength infrared thermal anomaly in the center of the active crater, despite the deflation of the lava dome that had occurred by 19 October. A roughly circular area four 30 x 30 m pixels in diameter was radiant in TM bands 5 (1.55-1.75 mm in wavelength) and 7 (2.08-2.35 mm) on both images. Several pixels were saturated in both bands, but there was no thermal radiance for the next shorter wavelength (band 4, 0.76-0.09 mm). Temperatures and radiant flux have not yet been calculated, but the general appearance of the data is similar to that of November 1987. There had been no Landsat TM observations of Lascar since then, but it seemed likely that the radiant anomaly has persisted for 5 years, since the first TM image of the volcano was recorded in December 1984.
Information Contacts: D. Rothery, Open Univ.
Explosion produces large tephra cloud and ejects ballistic blocks to 5 km; lava dome activity increases
An explosive episode on 20 February at 1545 ejected an eruption column that contained large amounts of water vapor and some tephra. Gentle winds during the activity allowed a large plume to develop, reaching ~8 km above the crater (almost 14 km altitude; figure 4). The activity appeared to be phreatomagmatic (but see comment by González-Ferrán below), consisted of only a single pulse [but see 15:03], and lasted for ~5 minutes. Near-summit winds shifted the plume slightly southward, then high-altitude winds carried away the upper part of the plume to the south. The plume had completely dispersed 30 minutes after the eruption. No felt pre-eruption seismicity was reported. Sounds from the explosion were reported to ~150 km from the volcano. Eruption-related noises were heard 40 km SW of the volcano (by Stephen Foot) at 1547, and windows rattled at Toconao, 32 km NW. As of 16 March, no new major eruptions have been reported, and the volcano has continued to show its normal fumarolic activity.
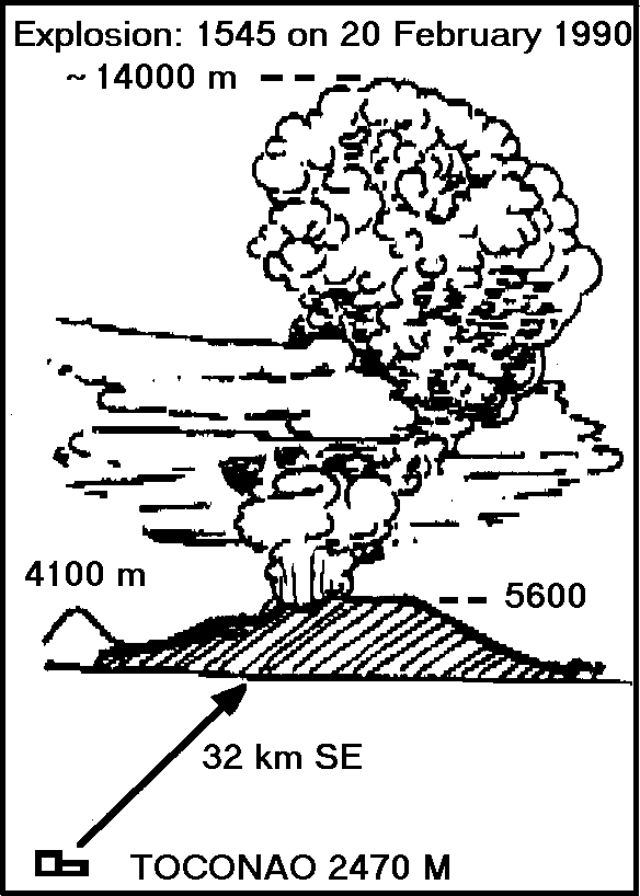 |
Figure 4. Sketch of Lascar and its 20 February 1990 eruption column by O. González-Ferrán, based on a photo taken by policeman Raul Orellana from Toconao (32 km NW of the volcano) 3 minutes after the onset of the explosion. |
With the support of the Chilean Air force, Oscar González-Ferrán carried out an aerial and ground investigation between 22 and 26 February. During aerial reconnaissance on 24 February between about 0800 and 0900, an active lava dome remained in the crater. Numerous incandescent radial and concentric fractures were visible on the dome, and strong gas emission was occurring. Fieldwork on 24 and 25 February between Tumbre (N of the volcano) and Laguna de la Legia to ~5,400 m altitude on the SE flank, revealed that numerous blocks from the dacitic lava dome had been ballistically ejected to distances of as much as 5 km (figure 5). The blocks ranged from 0.5 to 1.5 m3 and formed impact craters as much as 4 m across and 1 m deep. Sotero Armella, president of the Residents' Council of the town of Talabre (11 km NW of Lascar) noted that large ballistic tephra had not been ejected this far during the 1986 and 1988 activity.
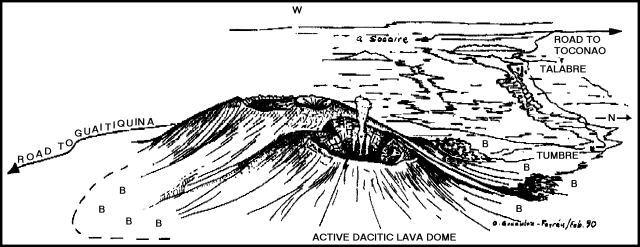 |
Figure 5. Oblique aerial view by O. González-Ferrán, looking W at the Lascar complex and the area to the N and W. Vapor rises from the active crater. Ballistic blocks from the dacitic lava dome were found at sites marked "B". |
Stephen Foot conducted additional fieldwork on 11 March. On the SSE flank, he found bombs within 4 km of the crater and lapilli at greater distances. Bombs had formed craters up to 4 m wide and 1.5 m deep. Three types of bombs were sampled: dark, dense, glassy, crystal-rich, possibly dacitic material; light gray pumiceous fragments; and less abundant white, dense, crystal-rich, mafic-poor, weakly aligned tephra that may not have been juvenile. The tephra were found both intact and shattered, showing breadcrust texture and cooling fractures. No evidence of new tephra was found on the W flank, 16 km from the crater.
González-Ferrán noted that analyses of vertical airphotos, video, and field reconnaissance suggest that: 1) the rate of extrusion of the dacitic lava dome has increased; 2) the weakest sector of the volcano is its NW wall, so the hazard from a possible lateral explosion is greatest in that direction; and 3) the 20 February explosion was primarily from magmatic degassing rather than phreatomagmatic activity, given the long drought that has affected the area. He added that the village of Talabre (population 76, 40 of whom are children), relocated at its present site on 25 April 1985, is in the direction of highest estimated risk.
Information Contacts: O. González-Ferrán, Univ de Chile; S. Foot, MINSAL Ltd., Santiago; J. Gerneck, Chile Hunt Oil, Toconao; M. Gardeweg, SERNAGEOMIN, Santiago.
20 February eruption ejected about 10-30% of the lava dome in crystal-rich fragments
After the 20 February eruption, Lascar returned to its normal fumarolic activity with the generation of mainly white plumes that rise 300-500 m above the rim of the active central crater. Between 20 and 24 March, geologists from the SERNAGEOMIN and several British universities observed the volcano from the ground and from the active crater's rim, reached on the 23rd from the N slope and on the 24th from the S slope. The following is from their report.
"Examination of photographs taken by J.R. Gerneck (Chile Hunt Oil) during the 20 February eruption revealed three discrete plumes. The first, white in color, consisted mainly of steam, and was overtaken by two smaller, grayish, higher velocity clouds. Geologists interpreted this sequence as an initial steam explosion related to the partial destruction of the dome that fills the bottom of the active crater, followed by phreatomagmatic eruptions. The eruption products, primarily fragments of the dome, occurred as shattered, dark, dense blocks of porphyritic pyroxene andesite, ranging to white, semi-vesicular, largely disaggregated blocks of similar composition, with thin, darker, quenched rims. The blocks were composed of plagioclase, clinopyroxene, and orthopyroxene phenocrysts, small amounts of magnetite, and scarce reacted olivine and hornblende crystals in a glassy groundmass. They are enriched in crystals compared to bombs from the 1986 eruption, with larger phenocrysts (up to 2 mm), and a larger proportion of pyroxene. No olivine or hornblende were found in the 1986 bombs, which included occasional xenoliths of partially molten granite. The 20 February blocks were distributed almost symmetrically in a radius of 4 km around the crater, associated with asymmetrical impact craters, elongate parallel to block trajectories. The number of blocks increased dramatically close to the vent where they covered 70-90% of the surface. No fresh ash was observed close to the volcano.
"Preliminary calculations, based on the volume of ejecta and the size of the plume, indicate that between 10 and 30% of the dome was erupted on 20 February. This estimate is supported by 5 March airphotos of the interior of the crater and by observations made from the crater rim, where a large part of the dome can still be observed in the bottom of the crater. The dome has apparently continued deflating since our last observation in November 1989 (14:11). A hole appeared to be present in its center, produced by collapse into the vent. Fumaroles were located around the dome, along ring fractures as observed in April 1989. Gas was still venting at extremely high velocity, creating the same jet-like noise reported in November. The strongest fumaroles were on the dome's NE and SW edges. A strong smell of HCl and SO2 was recorded from the N rim. Deposits of yellow sulfur are visible associated with the fumaroles. Temperatures were measured (by Clive Oppenheimer) using an infrared radiometer (after dark, to eliminate the effects of sunlight). The fumaroles were observed to be glowing red hot and bright spots were seen over the dome. Preliminary data show the largest fumarole to have a temperature of 700-800°C, while the surface of the dome had an average temperature of 100-200°."
Information Contacts: M. Gardeweg, SERNAGEOMIN, Santiago; S. Matthews, Univ College London; C. Oppenheimer, Open Univ; S. Sparks and M. Stasiuk, Univ of Bristol.
1989 dome continues to sag along arcuate fissures; small tephra emission; tremor but no discrete earthquakes
Field observations suggest that the dome extrusion . . . has stopped since at least November and that the dome has continued to collapse above a withdrawing, degassing, magma column, accompanied by small, mainly phreatomagmatic eruptions.
During a summit climb by C. Oppenheimer on 4 April, little activity was seen on the collapsed dome region during daylight. Almost all of the visibly fuming vents were located beyond its margins, particularly on the E side where several powerful fumaroles were active (figure 6). After dark, very few if any of those vents were seen to be incandescent. The collapsed dome, however, showed numerous glowing red patches, presumed to be high-temperature fumarolic vents concentrated along ring fractures (figure 7). Individual vents were probably <0.5-1 m across; the majority appeared to be only a few centimeters across but formed clusters along roughly arcuate trends close to the edge of the collapsed dome. A broad area in the dome's center had no incandescent sites. There were a few groups of incandescent fumarolic vents beyond the collapsed dome, at locations that seemed to correspond spatially to distinct hot pixels on Landsat TM images of October-December 1989 (processed at Open Univ).
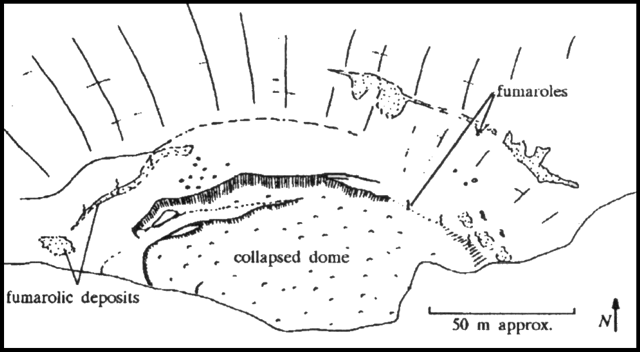 |
Figure 6. Lascar's active crater in daylight, 4 April 1990, showing locations of strong fumaroles. Sketch by C. Oppenheimer. |
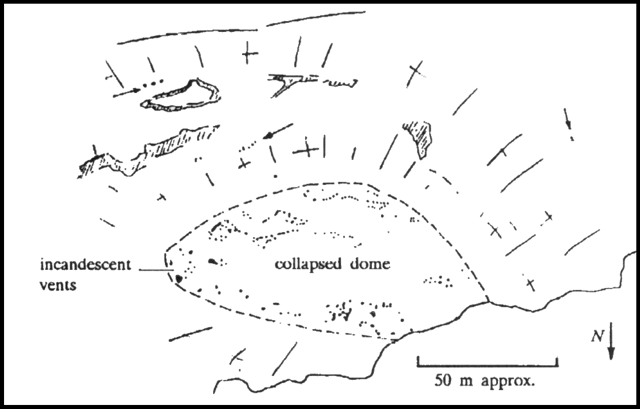 |
Figure 7. Lascar's active crater at night, 4 April 1990. Dark spots on the collapsed dome and crater walls represent incandescent areas. Note that north is down, the opposite orientation to figure 6. Sketch by C. Oppenheimer. |
The highest brightness temperature, measured over a vent close to the E margin of the collapsed dome (by an 0.8-1.1 mm infrared thermometer) was 787°C. The glowing region filled about 1/6 of the instrument's field of view; the temperature measured around the incandescent vent was ~540°C. Oppenheimer noted that use of the Planck function suggests an actual temperature of the glowing vent, and therefore the gas, of ~940°C.
A seismometer (Portable Kinemetrics MEQ-800) installed 17 km W of the volcano (in the village of Talabre) began recording local seismic activity on 4 April. The seismic station was established by Juan Thomas (Antofagasta Branch, Dept de Geofísica, Univ de Chile) who also trained the village teacher, Manuel Castillo, in its operation. A second seismometer, installed the next day 7.5 km from the volcano (at Tumbre), had to be retired 2 days later because of logistics and operation problems. Installation was supported by Nelson Allendes and data interpreted by Sergio Barrientos (both with the Dept de Geología y Geofísica, Univ de Chile, Santiago).
Seismograms 4-19 April indicated that Lascar's seismicity was limited to tremor every 2-3 minutes, interpreted as magma movements in a chamber of unknown depth. Geologists suggested that the absence of discrete earthquakes could indicate that there was no rupturing of material adjusting to pressure from ascending magma. Installation of the Talabre seismometer is scheduled to end in late May. However, strong recommendations were made to local authorities that permanent monitoring of Lascar be established with telemetrically controlled seismometers, given its distance from any research center or large city (270 km from Antofagasta and 1,200 km from Santiago).
A small eruptive episode was observed on 6 April at 0840 from Talabre and by MINSAL geologists in Toconao. A pale grayish cloud rose to ~1,000 m above the volcano in 1-2 minutes. No sounds were audible during the activity, which appeared to be phreatomagmatic. The seismometers at Talabre and Tumbre recorded no seismicity at the time of the eruptive episode. During the following 20 minutes, the plume was dispersed to the SE, rapidly turning white. Some ash could be seen falling from its base. By 0910, the plume was indistinguishable from weather clouds and the normal vapor plume had reappeared, rising to ~300 m above the crater rim. The vapor plume was weaker than normal 7-8 April, reaching <100 m above the rim, but had strengthened to the usual 900 m height by the 9th.
An ascent of the volcano's S side by Steve Matthews on 12 April showed the dome to be essentially unchanged, with continuing strong fumarolic activity. Fresh tension cracks just outside the N margin of the dome, produced by further collapse, were photographed. Geologists interpreted the eruptive episode as the result of a dome collapse event, given the tension cracking and lack of associated seismicity.
Information Contacts: M. Gardeweg, SERNAGEOMIN, Santiago; S. Barrientos, Univ de Chile, Santiago; J. Thomas, Proyecto Sismológico Antofagasta; S. Matthews, Univ College London; C. Oppenheimer, Open Univ.
Vapor plumes extend 60 km
"After the last small eruptive episode observed on 6 April 1990 and the continuing collapse of the summit dome formed in 1989 (15:3-4), Lascar has returned to its normal fumarolic activity with the generation of mainly white plumes that rise a few hundred meters above the rim of the active crater. During field observation on 24 November 1990, irregular, dominantly steam emissions were continuously released. In the morning, eruption columns rose to 1,500 m above the cone with cauliflower-shaped tops shifted slightly northward by near-summit winds. Gentle summer winds allowed the development of large plumes that extended N-NW for more than 60 km."
Information Contacts: M. Gardeweg, SERNAGEOMIN, Santiago.
High crater temperatures detected by satellite
On 8 January, radiant flux from the crater was near the highest levels since 1984, as demonstrated by Open Univ researchers using data from Landsat TM bands 5 and 7 (1.55-1.75 and 2.08-2.35 µm wavelength, respectively) (figure 8). The January images are the third in a set of three night images that have been used to provide improved estimates of radiated power output at Lascar. Previous estimates were based on daylight images (Glaze and others, 1989). No reflected sunlight is mingled with the thermal signal in night images, yielding more reliable thermal radiance values.
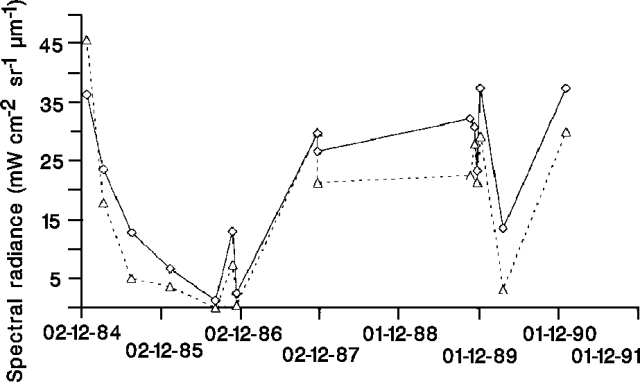 |
Figure 8. Spectral radiance from Lascar measured in 2 short-wavelength infrared bands, 2 December 1984-8 January 1991. Solid line, Landsat TM band 7 (2.08-2.35 µm); dashed line, Landsat TM band 5 (1.55-1.75 µm). Courtesy of D. Rothery and C. Oppenheimer. |
The following is from D. Rothery and C. Oppenheimer. "Two of the night images are shown in figure 9. The 12 November 1989 image shows a strong equidimensional radiant anomaly in a position that corresponds to the lava dome, with some isolated radiant pixels just beyond the edges that are probably sites of fumaroles. The 26 March 1990 image shows a much reduced radiant anomaly, following the 20 February 1990 explosive eruption.
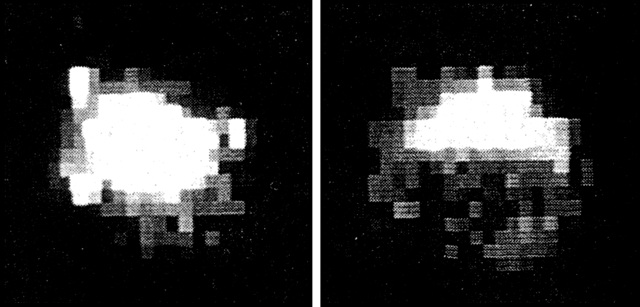 |
Figure 9. Night images of Lascar's active dome on 12 November 1989 (left) and 26 March 1990 (right), recorded at 2.08-2.35 µm wavelengths (Landsat TM band 7). N is toward the top. The individual pixels are ~30 m across. An image recorded on 8 January 1991 is almost identical to the 12 November 1989 image. Courtesy of D. Rothery and C. Oppenheimer. |
"Field observations at the summit of Lascar on 23-24 March and 4 April 1990 showed that there were sites of incandescence over regions of the collapsed dome, and that some fumaroles elsewhere were also incandescent. Temperatures of up to 940°C were estimated by the use of an infrared thermometer.
"The most recent image (8 January 1991, not shown here) is almost indistinguishable from the 12 November 1989 image, which suggests a return to earlier conditions."
Reference. Glaze, L.S., Francis, P.W., and Rothery, D.A., 1989, Measuring Thermal Budgets of Active Volcanoes; Nature, v. 338, p. 144-146.
Information Contacts: D. Rothery and C. Oppenheimer, Open Univ.
Renewed explosive activity
At 1620-1625 on 21 October, an explosion and a roughly 2,000-m-high dark gray column were observed by Santos Soza, a Minsal Ltda. employee based 35 km NW of the volcano (in Toconao). Wind carried the plume NE, and completely dispersed it within 20 minutes. The explosion was not audible, but it was accompanied by a small shock, with a duration of a few seconds, felt at Toconao. A second, smaller eruption column was observed the following day at about 1400 without accompanying felt seismicity or an audible explosion.
Information Contacts: J. Naranjo, SERNAGEOMIN, Santiago; V. Letelier, Minsal Ltda., Toconao.
New lava dome in central crater; fumarolic activity
Growth of a new dome and fumarolic activity were observed in the active central crater (800 m wide, 350 m deep) during 26 Feb-8 March observations. The new dome, at the base of the crater's S wall, had a fresh surface of black spines and an apparent diameter of <1/3 the size of the dome erupted in 1989 (~200 m). Estimation of its size and shape was difficult because of its position directly below the observation point. The dome was apparently in an early stage of extrusion, and local authorities were warned of the possibility of large explosions within the next few months, similar to those in September 1986 and February 1990.
Fumarolic activity and sulfur deposition occurred along ring fractures elsewhere in the crater, and a strong sulfur odor was noted on the volcano's N and S flanks. White steam emissions to 300-500 m above the rim were punctuated by sporadic vigorous pulses of alternating white and dark gray columns, which rose to 2,500 m. Gentle summer winds primarily carried the plumes SE, although plumes extending northward were commonly observed in the morning. Although activity was vigorous, the jet fumaroles seen in the crater during a previous dome-building episode in 1989 (14:11) were not evident in 1992. No night glow was observed nor was seismicity recorded during the February-March observation period. Although there is no current seismic monitoring in the area, visual observations continue from nearby villages.
Information Contacts: M. Gardeweg, SERNAGEOMIN, Santiago; S. Sparks and R. Thomas, Univ of Bristol; M. Murphy, Univ College, Dublin.
New dome fills base of crater; occasional explosions
On 4 March, a new lava dome was observed in the active crater . . . at the base of the S wall (17:3).
Following a request by local authorities (Intendencia and Oficina Regional de Emergencia, II Región), the Chilean Air Force overflew the volcano at 1245 on 20 March. The high-quality vertical photographs obtained of the summit area enabled an accurate estimation of the dome's size and volume. The dome appeared to fill the entire, nearly circular, base of the crater (180-190 m in diameter; figure 10), with a thickness of ~40 m, and an estimated volume of 1.1 x 10⁶ m3. It had steep walls and was devoid of a talus apron. The blocky, rugged surface of the dome appeared to have formed as a smaller, black central elongated plug (85 x 115 m) intruded a dark-brownish older external rim. Strong fumarolic activity occurred along the NE edge of the dome, which strongly resembled the one observed in March and April 1989.
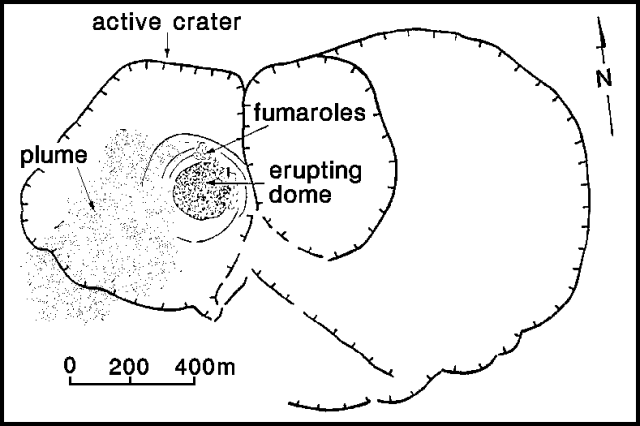 |
Figure 10. Sketch map of the summit area of Lascar, prepared from vertical airphotos taken during an overflight by the Chilean Air Force on 20 March, showing the new lava dome. Courtesy of M. Gardeweg. |
Observations from Talabre indicated that fumarolic activity had remained vigorous since late March, with eruption columns often 2-3 times larger than normal. The plume was usually yellowish to gray instead of its typical white until May, when a continuous dense gray plume was observed. Ashfall was reported on 15 May at 1050, accompanied by a gray eruption column estimated to be 1,500-2,000 m high (about 6x normal). On 21 May at 1130, an abrupt increase in the plume to a few kilometers height was observed by residents of nearby villages, and by people to 145 km W. The volcano "roared" for 10 minutes according to a witness (Luciano Sozo of Talabre) near the volcano. A second large explosion was reported that day at 1322 by Talabre residents. Following reports of night glow on 21-23 May, activity apparently returned to normal, with small pale-gray to white plumes and an absence of night glow. Although the May explosions were not as large as those in September 1986 and February 1990, scientists suggested that they might correspond to explosive destruction of part of the summit dome. Onset of winter and the partial covering of the cone by snow prevented visits to the summit, prompting a recommendation to the local authorities for new overflights and airphotos to monitor the development of the dome.
Several earthquakes recorded by the regional seismic network corresponded to large earthquakes centered away from the volcano, and were recorded by seismometers to the W. However, at least 4 small earthquakes were recorded between 24 April and late May only in villages closer to Lascar. The absence of seismometers near the volcano has prevented detailed monitoring of its seismicity.
Information Contacts: M. Gardeweg, SERNAGEOMIN, Santiago.
Satellite data show heat from lava dome
"A Landsat TM image recorded the night of 15 April 1992 shows the most intense thermal anomaly of a dataset extending back to December 1984. The thermal signature, in the short-wavelength infrared bands 5 (1.55-1.75 mm) and 7 (2.08-2.35 mm), represents the active lava dome in the central crater. Comparison with the previous image (night of 7 January 1991) shows a marked increase in the anomaly's area (figure 11). In the April 1992 scene, the core of the anomaly occupies an irregular area of ~7 x 6 pixels (equivalent to 210 x 180 m). These dimensions correspond closely with the 180-190 m dome diameter estimated from 20 March airphotos (17:5). The increase in area of the TM anomaly may be explained, at least in part, by the growth of a subsidiary lava dome first sighted on 4 March. The summed thermal radiance from the whole hot spot shows a corresponding increase in the April Landsat image (figure 12).
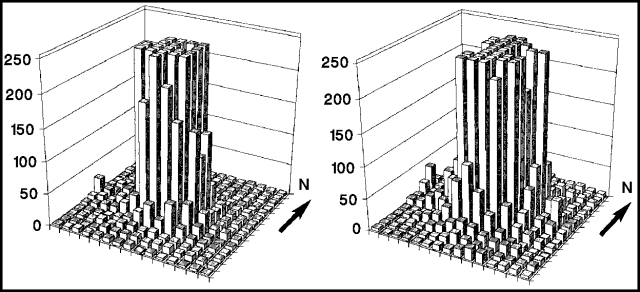 |
Figure 11. 15 x 15 pixel maps (equivalent to 450 x 450 m) of the signal recorded in band 7 of the Landsat TM over Lascar at night on 7 January 1991 (left) and 15 April 1992 (right). The vertical axis represents the number between 0 and 255 proportional to the spectral radiance. In each case, several pixels are saturated. Courtesy of C. Oppenheimer. |
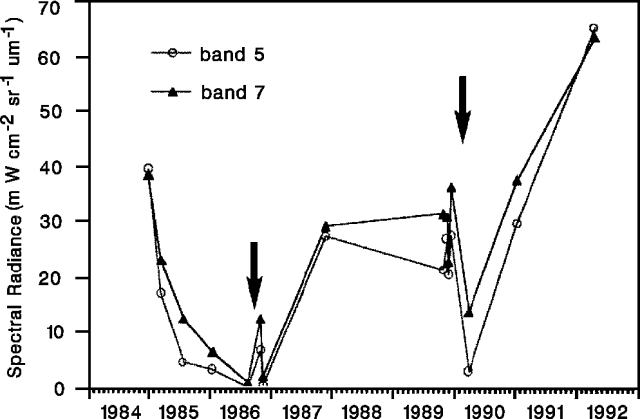 |
Figure 12. Summed spectral radiance in bands 5 and 7 for fifteen images acquired over Lascar since December 1984. The dataset includes several processing formats, and images acquired during the day and night. Only pixels with a thermal signal >=10 were included. The total was then converted to spectral radiance using calibration coefficients supplied with the digital data. Arrows mark the explosive eruptions of September 1986 and February 1990 (12:4-5 and 15:2-3). Courtesy of C. Oppenheimer. |
"An interesting feature of the two most recent TM acquisitions is the persistence of a discrete hot site ~200 m W of the centre of the main anomaly (figure 11). This is very likely the expression of incandescent fumarole vent(s) beyond the steep margin of the extruded lava."
Reference. Oppenheimer, C., Francis, P.W., Rothery, D.A., Carlton, R.W., and Glaze, L.S., Analysis of Volcanic Thermal Features in Infrared Images: Lascar Volcano, Chile, 1984-1992; Journal of Geophysical Research, in press.
Information Contacts: C. Oppenheimer, D. Rothery, P. Francis, and R. Carlton, Open Univ.
Eruption sends ash above 25 km altitude; pyroclastic flows travel 7.5 km
The largest historical eruption of Lascar began late on 18 April and sent ash 20-22 km above the . . . crater rim the following day. Pyroclastic flows traveled 7.5 km NW and light ashfall (<0.1 mm) was reported in Buenos Aires, Argentina, 1,500 km SE of the volcano.
A survey conducted from January to 14 March revealed that fumarolic activity persisted with columns sometimes absent but other times rising 500-1,000 m above the crater rim. A decrease in fumarolic activity 3-8 March preceded a small phreatomagmatic eruption on 10 March that produced a column 2,000 m high (Gardeweg and others, 1993). Similar activity had also been noted on 30 January when a higher eruption column followed a few days of low level activity. During 10-14 March, the column height remained at 500-1,000 m. Observations from 14 March to the evening of 20 April were made by Ibar Torrejón, a teacher in Talabre (17 km WNW) who maintains a log of Lascar's activity. From 8-17 April the column was also low: 100-200 m. The only other observed pre-eruption change was in the color of the column, from yellowish gray (8-11 April) to whitish pale-blue (12-17 April).
Eruptive activity. Activity on 18 April was primarily phreatic until 2200 when a large explosion threw incandescent material into the air. An explosion at 2300 produced a Plinian column. These initial explosions may have been related to the partial destruction of the dome that had filled the crater in March 1992 (17:3 and 5) and collapsed sometime between 12 November and 7 December.
At 0700 on 19 April, a low, dark, ash-laden Plinian column was observed, which slowly rose 5-10 km above the rim by 0900. (Initial reports of column heights were systematically high; corrected estimates are given here). Bombs were observed throughout the morning. At 1012 the column rose above 10 km, and the first pyroclastic flow down the N flank was seen: flows also descended the NE and SE flanks, but were not observed. Other large columns (10-15 km) accompanied by pyroclastic flows were recorded at 1030, 1205, and 1317. A witness in La Escondida mine (175 km SW) described these columns as much larger than those from the 1990 eruption (15:2). The explosion at 1317 produced a column that rose 20-22 km above the rim: it was accompanied by strong rumbling and ejection of bombs to heights > 2 km. The column dropped to 2 km height until an explosion at 1715 sent it back above 15 km. Nearly 30 minutes of continuous pyroclastic flow activity near the summit began at 1935. Large explosions at 2135-2148 and 2340-2350 preceded pyroclastic flows down the N and NW slopes. Ash was blown predominately ESE.
Activity declined until 0340 on 20 April when new Strombolian explosions began, ejecting incandescent spatter up to 1.5 km above the rim. Major explosive activity resumed at 0628, producing a column >10 km high and ejecting blocks to heights >1 km. The next large explosion, at 0920, was accompanied by strong rumbles and underground noises. It generated a column nearly 10 km high and its collapse produced the farthest-reaching pyroclastic flows (7.5 km NW). Seen from Sierra Gorda (165 km WNW), the column had a well-formed mushroom shape. It remained 2-4 km high until another large explosion at 1302, which sent the column to 8.5 km within 8 minutes before it began to drift NE. One observer reported two columns rising from the crater during this explosion, the W one a darker gray-brown. At 1500 the height of the yellow-gray column decreased to 3.5-4 km, and persisted at this height until 1915 when nightfall prevented further observations. During the night, no eruptions were recorded, and no incandescent material was seen above the crater or on the flanks of the volcano.
Observations at 0630 the following morning indicated that Lascar had returned to its normal fumarolic activity with weak columns that hardly rose above the crater rim. Small explosions on 22, 23, 26, and 29 April produced columns 1000 m above the rim, but the column otherwise remained low (100-300 m) and white with occasional ash explosions to 500-800 m high. This activity continued through 8 May. During this period 2 discrete fumarolic gas columns were again observed rising from the NE and W sides of the crater, suggesting changes in its morphology from March, when only one column was noted.
An overflight of the volcano on 26 April by the National Emergency Office of the Chilean Air Force provided aerial photography of the crater and surrounding area at scales of 1:33,000 and 1:3,500. From these photographs, a new lava dome was identified in the bottom of the crater, filling a much larger portion of the crater than either the 1989 or 1992 domes. The exposed base of the dome was ~60 m higher than the previous dome and 100 m above the known crater floor (5,145-m elev). A preliminary volume estimate of the new dome was 4.6 x 10⁶ m3. The dome appeared as a flat surface with concentric cooling ridges and steep walls devoid of a talus apron. Fumarolic activity was restricted to the margins of the dome, primarily on the SE edge. Fresh tephra partially covered the walls of the active crater, particularly in the benches, and filled the E craters (figure 13). The crater showed no other remarkable morphological changes.
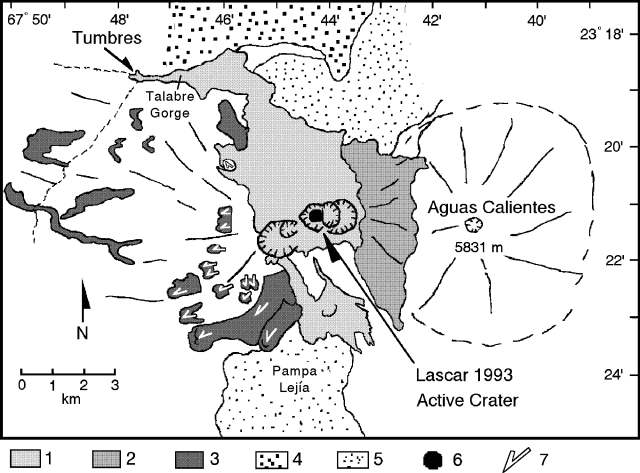 |
Figure 13. Sketch map of the distribution of pyroclastic flows from the 19-20 April eruption of Lascar, based on photos taken on 26 April. Featured are (1) 19-20 April pumiceous pyroclastic-flow deposits, (2) 19-20 April undifferentiated pyroclastic material, (3) Previous lava flows partially covered by pyroclastic-flow deposits, (4) Pliocene welded ignimbrites, (5) Miocene to Pliocene domes, (6) the new lava dome, and (7) arrows indicating lava flows. Courtesy of M. Gardeweg, SERNAGEOMIN. |
Five portable seismographs were installed around the volcano on the evening of 20 April. Preliminary analysis showed that the harmonic tremor recorded January-March 1993 was not initially present, but returned a couple of days after the eruption. A small number of high-frequency events occurred 21-25 April. A swarm of B-type events on 28 April may have been associated with the new dome formation, and an increase in activity on 30 April may have marked the injection of new magma.
Eruption products. M. Gardeweg characterized the eruption products as pyroclastic flows, co-ignimbrite fallout (pumice and ash) deposited mainly to the E, and projectiles (figure 13). The pyroclastic flows were small-volume ignimbrites composed of abundant rounded andesitic pumice in a gray ash matrix. Most flows traveled ~4 km from the crater, but some to the NW were channeled by the upper Talabre gorge and reached Tumbres, a swampy ground 7.5 km from the crater where springs supply water for the village of Talabre. The flow deposit was covered by a narrow, thin veneer of very fine-grained ash, which was constantly blown by the wind. Degassing pipes were observed in the Tumbres deposit. A day after the eruption, the flow front was still warm, but was cooling rapidly.
The water supply to Talabre was cut off by the pyroclastic flow, but a few hours after its emplacement, water eroded through the pyroclastic material, and developed a new creek in the gorge. Donkeys and small insects were back in Tumbres the day after the eruption. The water contained a large amount of ash, but its pH was 7.6-7.7, only slightly less than its normal 8.3. Grass samples from Tumbres that were covered by ash showed 33% more fluorine than samples of clean grass. Ash from Chilean volcanoes Hudson and Lonquimay also contained notable amounts of fluorine.
The lapilli varied from white and vesicular pumices to a denser scoriae. Banding evident in some lapilli mainly reflects different degrees of vesicularity. A few dense blocks (2(black scoriae) to 60.4% SiO2 (white pumices). The fine ash has a similar andesitic composition (60.3% SiO2) with slight K enrichment. Large blocks (>2 m) left 4-5 m diameter impact craters up to 7 km from the crater. In Lejía, 17 km SSE of the volcano, a thin cover of pumice fragments 6-9 cm in diameter was noted. Huaitiquina Pass, 65 km SE on the Chilean-Argentine border, received only a thin layer of fine ash (4-4.5 mm), largely blown by wind and concentrated below cliffs or in depressions. No fall-out was found in El Laco, 55 km SE (slightly S of Huaitiquina).
The eruption also affected Argentina and J. Viramonte provided the following information. The total volume of erupted material (excluding material injected into the stratosphere) was estimated to be 0.1 km3: 0.09 km3 proximal air fall, 0.0085 km3 distal air fall, and 0.0037 km3 pyroclastic flow.
Viramonte noted that pyroclastic-flow deposits W of the crater, 7.5 km long and 1.5-2 m thick, cut the road between Antofagasta, Chile, and Salta, Argentina. He described the deposits as 60% coarse juvenile andesitic pumice fragments (2-60 cm in diameter) mixed with a minor volume of dense andesitic blocks as large as 1 m in diameter (from the old summit lava dome), and 40% fine-grained andesitic material. A very fine-grained ash-cloud-surge deposit, 5-30 cm thick, that clearly burned vegetation, flanked the pyroclastic-flow deposits. On 23 April temperatures of the deposits were as high as 100°C. These units may have been emplaced during the continuous emission of pyroclastic flows that began at 1935 on 19 April.
Four superposed pyroclastic-flow units begin 3 km from the crater rim on the ESE flank of the volcano, and extend 3-4 km to the Pampa Lejía plain. They are 1.2-1.5 m thick and composed of mainly white juvenile pumice fragments and gray blocks from the lava dome (70-80%), and fine-grained material (20-30%). Many light-and-dark banded pumice fragments were present.
Three short pyroclastic-flow lobes on the E side of the volcano had been covered by air-fall pumice. Many fumaroles with white ammonium chloride crystals and red yellow iron chloride crystals were present on the flows. Fumarole temperatures were as high as 250°C. At the foot of the pyroclastic-flow deposits, a thin ground-surge deposit was identified 100-150 m up the side of Corona hill at the S end of Lascar.
Ejected bombs and blocks were abundant within a 3-3.5 km radius of the crater, becoming rare 4 km distant. The ballistic clasts were pumiceous black andesitic bombs and dense gray andesitic blocks from the lava dome. Rounded and strongly vesiculated bombs as large as 70 cm in diameter were found 3 km from the crater. The lava-dome blocks were irregular and often showed a bread-crust structure.
Tephra carried by strong high-altitude winds produced a large dispersion of airfall deposits to the ESE (figure 14). Wind speed and direction reported by the Servicio Metereorológico Nacional Argentina at different localities (table 2) are consistent with the evolution of the ash cloud as tracked by NOAA using weather satellites.
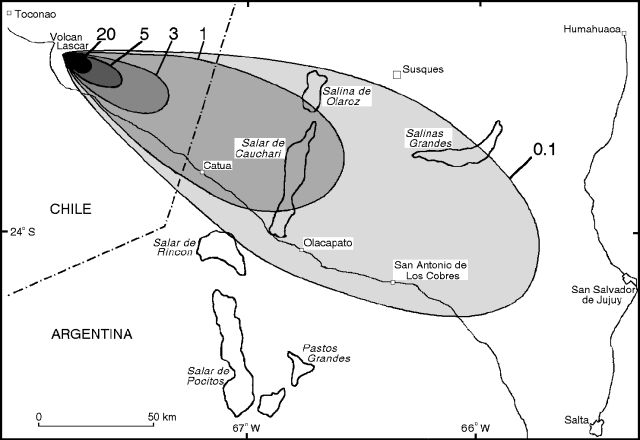 |
Figure 14. Isopach map of tephra fallout from April 19-20 eruption of Lascar. Depths are in cm. Closed fields indicate salars, saline playa lakes. Courtesy of J. Viramonte, Instituto Geonorte. |
Table 2. Wind speed and direction at selected cities (see figure 15) downwind of the 19-20 April eruption of Lascar. Data are from the Servicio Metereorológico Nacional Argentina. Courtesy of J. Viramonte, Instituto Geonorte.
| Date | Station | Altitude (km) | Direction (degrees) | Velocity (km/hour) |
| 19 Apr 1993 | Resistencia | 10.8 | 305 | 91 |
| 19 Apr 1993 | Resistencia | 12.3 | 270 | 41 |
| 19 Apr 1993 | Resistencia | 14.1 | 285 | 46 |
| 19 Apr 1993 | Resistencia | 16.5 | 275 | 41 |
| 19 Apr 1993 | Córdoba | 10.8 | 355 | 98 |
| 19 Apr 1993 | Córdoba | 12.3 | 345 | 59 |
| 19 Apr 1993 | Córdoba | 14.0 | 310 | 124 |
| 19 Apr 1993 | Córdoba | 16.4 | 300 | 56 |
| 19 Apr 1993 | Salta | 10.9 | 325 | 63 |
| 19 Apr 1993 | Salta | 12.3 | 310 | 91 |
| 19 Apr 1993 | Salta | 14.1 | 310 | 85 |
| 19 Apr 1993 | Salta | 16.5 | 295 | 91 |
| 20 Apr 1993 | Resistencia | 10.9 | 330 | 54 |
| 20 Apr 1993 | Resistencia | 12.4 | 320 | 72 |
| 20 Apr 1993 | Resistencia | 14.1 | 295 | 76 |
| 20 Apr 1993 | Resistencia | 16.6 | 290 | 65 |
| 20 Apr 1993 | Córdoba | 10.6 | 355 | 200 |
| 20 Apr 1993 | Córdoba | 12.1 | 355 | 202 |
| 20 Apr 1993 | Córdoba | 14.0 | 335 | 126 |
| 20 Apr 1993 | Córdoba | 16.4 | 300 | 115 |
| 20 Apr 1993 | Salta | 12.3 | 285 | 98 |
| 20 Apr 1993 | Salta | 14.1 | 285 | 83 |
| 20 Apr 1993 | Salta | 16.5 | 280 | 56 |
| 20 Apr 1993 | Salta | 18.6 | 260 | 44 |
The maximum diameter of air-fall clasts on the flanks of the volcano was 30-40 cm. The maximum tephra thickness was 0.6 m on the E side of Lascar where it intersects Aguas Calientes Volcano. Approximately 20,000 km2 received at least 1 mm of ash (figure 14), and over 850,000 km2, including parts of N-central Argentina, S Paraguay, Uruguay, and S Brazil, were covered by a thin (<0.1 mm) deposit of ash (figure 15).
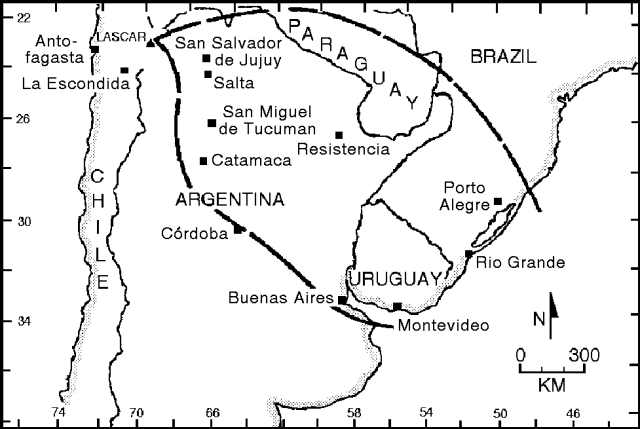 |
Figure 15. Approximate ash-fall distribution from the 18-20 April eruption of Lascar. The thick lines outline the area receiving ashfall according to news reports. Courtesy of M. Gardeweg, SERNAGEOMIN. |
Satellite monitoring. GOES-7 visible and infrared imagery detected five major eruption pulses starting at 2300 on 19 April (table 3). The plume was very dark in the visible imagery, similar to the appearance of the 14-15 June 1991 clouds from Mount Pinatubo. A subtropical jetstream moved the plume rapidly ESE (figure 16) at ~93 km/hour.
Table 3. Summary of explosive phases of Lascar detected on 20 April with visible and infrared satellite imagery from GOES-7 and NOAA-11. The tropopause was at 15.7-km altitude in the region at 1200 GMT. Courtesy of Jim Lynch, NOAA/NESDIS.
| Date | Approximate Eruption Start Time | Duration (hours) | Maximum Altitude (km) |
| 19 Apr 1993 | 2300 | 1.0 | 14-16 |
| 20 Apr 1993 | 0300 | 1.0 | 14-16 |
| 20 Apr 1993 | 0630 | 1.5 | 14-16 |
| 20 Apr 1993 | 0930 | 1.5 | 14-16 |
| 20 Apr 1993 | 1300 | 5.0 | 10-12 |
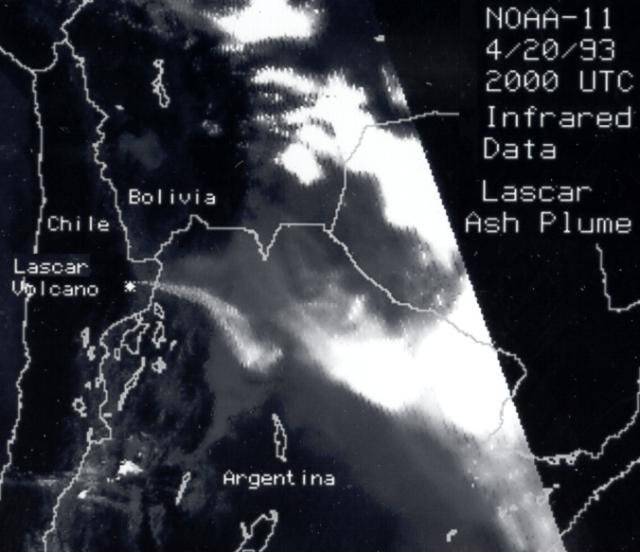 |
Figure 16. Image of the plume of Lascar, 1600 on 20 April. The image was processed from NOAA-11 Advanced Very High Resolution Radiometer (AVHRR) channel 4 (thermal infrared) data. Compare with figure 3. Courtesy of G. Stephens, NOAA. |
D. Rothery, C. Oppenheimer, and P. Francis noted the following changes in the active crater of Lascar using Landsat's TM. "We have been monitoring thermal events within Lascar's active crater for several years using the short wavelength infrared radiance of thermal origin. The latest image we have prior to the 20 April 1993 eruption was recorded by Landsat 5 on 24 February.
"Whereas our 1991 and 1992 data showed a strongly centered group of thermally radiant pixels that coincided with the lava dome (figure 17 bottom), there was a significant change visible on 24 February 1993 (figure 17 top). The central anomaly has decreased in size and magnitude, but there is a distinct subsidiary peak in thermal radiance to the E. This coincided with the position of a fumarole that had been more weakly radiant on previous images. This site lies about half-way down the wall of the active crater, which at this point is embedded in the floor of an old crater (see figure 13). We have no grounds for suggesting that this newly prominent site was the seat of the 19-20 April eruption. The nature of the central anomaly on 24 February, which had decreased to the approximate size and magnitude of the anomaly recorded from late 1987 until the end of 1989, suggests that the lava dome was still in existence on that date.
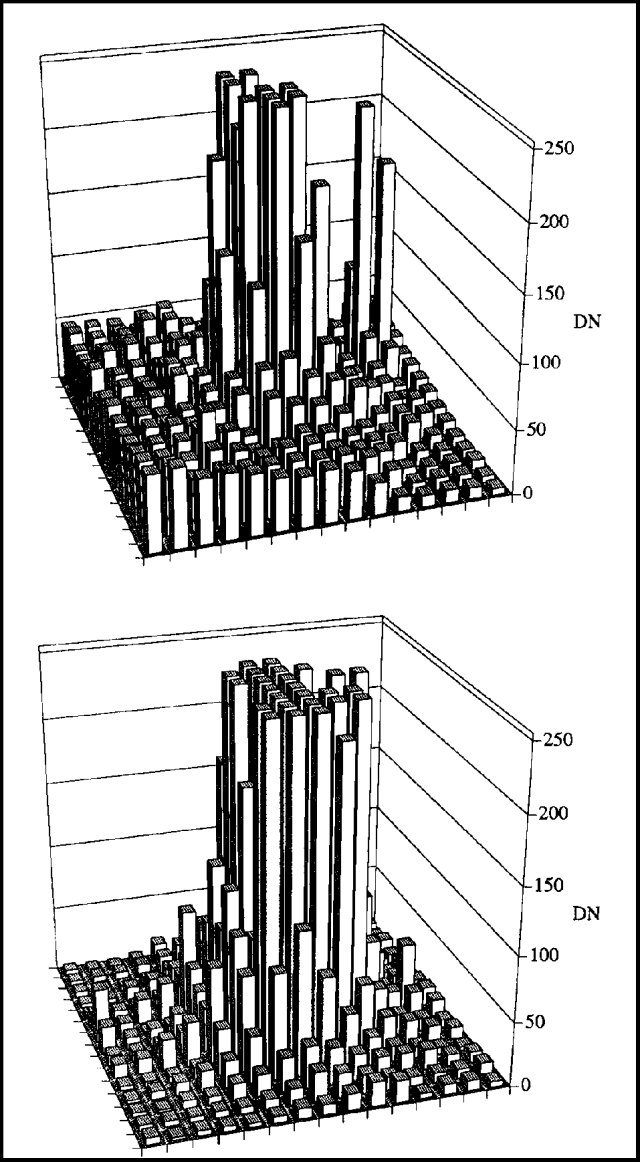 |
Figure 17. Radiance in Landsat TM band 7 (2.08-2.35 micron) for a 15x15 pixel area encompassing Lascar's active crater, looking N. Data are from 24 February 1993 during the day (top), and 15 April 1992 during the night (bottom) (from figure 21b in Oppenheimer and others, 1993). Each pixel represents a 30 x 30 m ground area. Radiance is shown as DN, which is the number recorded by the sensor. In this example, areas with DN of about 50 or less are not thermally radiant and the DN represents reflected sunlight. Where DN exceeds about 100, the surface is radiating thermally, and the DN represents the sum of reflected sunlight and thermal radiance. Courtesy of D. Rothery, Open Univ. |
"The summed spectral radiance of thermal origin in Landsat TM bands 5 and 7 showed a decline before the 1993 eruption similar to that before the September 1986 eruption (figure 18). There was no observed decline before the February 1990 eruption, though that could be the result of the lack of images before the eruption."
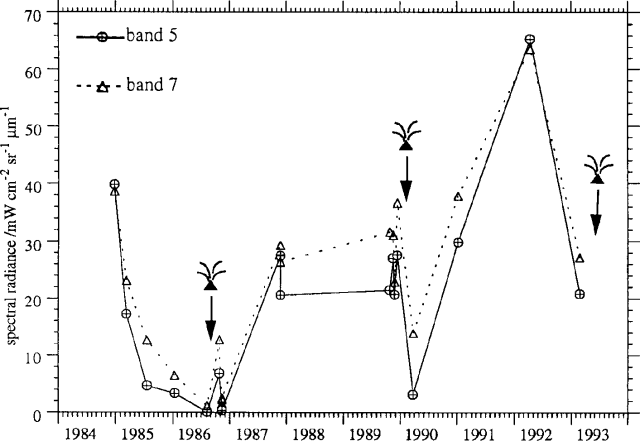 |
Figure 18. Summed spectral radiance of thermal origin in Landsat TM bands 5 and 7 for the active crater of Lascar (from figure 18 in Oppenheimer and others, 1993 with data for 24 February 1993 added). Eruptions are noted by arrows. The decline in summed radiance prior to the 1993 eruption is similar to that preceding the 1986 eruption. There was no observed decline before the February 1990 eruption, though that could be the result of the lack of images during 1988-89. Courtesy of D. Rothery, Open Univ. |
Effects and previous activity. The 70 [people] who live in Talabre and make their living as llama herders and weavers were evacuated [to the nearby village of Toconao for two nights] by authorities on 19 April. Initial reports indicated that there had been no injuries. However, many defied the order and returned to tend their homes and animals. As many as six people were listed as missing, having apparently gone searching for their animals on the SE side of the volcano. [The people listed as missing were forced to make a detour because their normal route was covered by pumice and ash, but they arrived safely 3 days after the eruption.]
References. Gardeweg, M.C., Sparks, S., Matthews, S., Fuentealba, G., Murillo, M, and Espinoza, A., 1993, V Informe sobre el comportamiento del Volcán Lascar (II Región): Enero Marzo 1993, Informe Inédito, Biblioteca Servicio Nacional de Geología y Minería, 14 p.
Oppenheimer, C., Francis, P.W., Rothery, D.A., Carlton, R.W.T., and Glaze, L.S., 1993, Infrared image analysis of volcanic thermal features: Lascar volcano, Chile, 1984-1992, Journal of Geophysical Research, v. 98, p. 4269-4286.
Information Contacts: M. Gardeweg and A. Espinoza, SERNAGEOMIN, Santiago; E. Medina, Univ Católica del Norte, Antofagasta; M. Murillo, Univ de la Frontera, Temuca, Chile; J. Viramonte, R. Marini, R. Bocchio, and R. Pereyra, Univ Nacional de Salta, Instituto Geonorte - CONICET, Argentina; R. Seggiaro, M. Bosso, N. Monegatti, and M. Bolli, Univ Nacional de Salta, Instituto Geonorte, Argentina; R. Ortiz Ramis, CSIC, J. Gutierrez Abascal, Spain; I. Torrejón, Esccuela Básica G-29, Talabre, Chile; D. Rothery, C. Oppenheimer, and P. Francis, Open Univ; J. Lynch, SAB; G. Stephens, NOAA; American Embassy, Santiago, Chile.
Lava dome emplaced following April eruption
Additional information indicates that within the active crater the eruption displaced an older dome, and emplaced a new larger dome. The following report by Oscar González-Ferrán is based chiefly on discussions with colleagues and a news correspondent. Sketches were made from stereo sets of aerial photos taken along a vertical axis by the Chilean Air Force on 20 March 1992 and 26 April 1993. The sketches document two domes: the old one on 20 March 1992 before the eruption (figure 19, top), and the new one on 26 April 1993 after the eruption (figure 19, center).
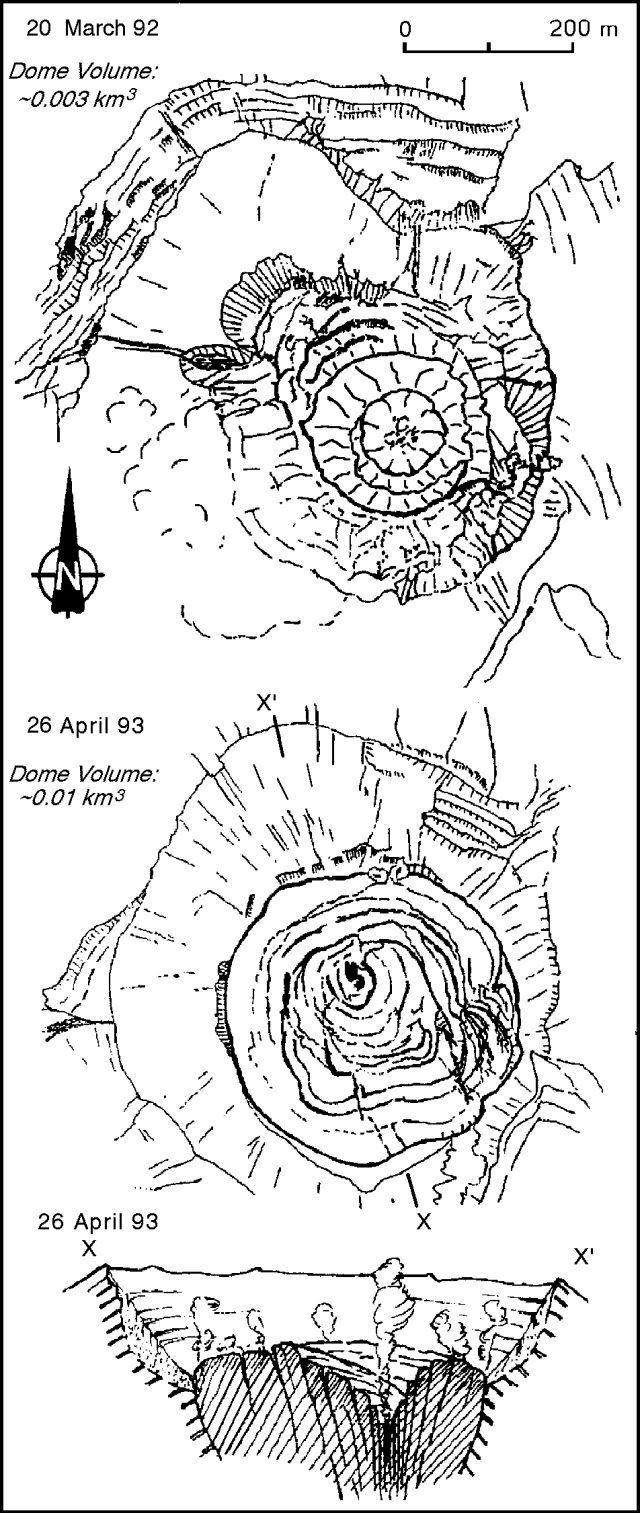 |
Figure 19. Sketches of the Lascar crater showing plan views of the old dome (top), the new dome (center), and a cross-section of the new dome along the line X-X'. Simplified from originals provided by O. González-Ferrán. |
The new dome grew in <40 hours from 24-26 April. On 26 April the dome may have decreased in size during a small explosion that sent ash 2 km above the crater. This event presumably produced the funnel-shaped indentation in the dome shown diagrammatically on figure 19 (bottom). Besides this indentation, the younger dome looks asymmetric, steeper to the N than to the S, and it appears ~3x larger in volume than the older dome. Figure 19 contrasts a radial fracture pattern seen in the old dome (top), and an annular pattern seen in the new dome (center).
Information Contacts: O. González-Ferrán, Univ de Chile; Don Rodrigo de la Peña, Diario El Mercurio, Antofagasta, Chile.
Description of new dome evolution
At 0840 on 17 December 1993 an eruption produced a column that rose ~8,000 m above the crater. At 0920 a small new eruptive column was seen, but by 1000 activity had returned to normal. An earthquake also occurred in the vicinity of the volcano the night before (about 2030 on 16 December). Volcanologists from the Instituto Geonorte (Argentina) were preparing to visit the volcano following the eruption.
A new lava dome grew in the bottom of the active crater following the largest historical eruption of Lascar, on 18-26 April 1993 (18:4). The new dome grew in <40 hours from 24-26 April (18:8). The dome filled the nearly circular base of the crater with an estimated volume of 4.6 x 10⁶ m3 (380 m in diameter, 120 m thick). This volume is almost 4x larger than the previous dome observed in March 1992, which was 180-190 m in diameter, 40 m thick, and had a volume of 1.1 x 10⁶ m3 (17:5). Sketches by O. González-Ferrán based on aerial photos document the differences between the old dome on 20 March 1992 and the new dome on 26 April 1993 (18:8).
The evolution of the new dome is relevant to predictions of future eruptive activity because growth and subsequent collapse of domes in the bottom of the crater preceded eruptions in February 1990 and April 1993 (Gardeweg and others, 1993; Gardeweg and Medina, 1993). As a precaution in case the volcano follows the pattern it has shown since 1985, local authorities were warned in November of the possibility of another eruption within the next several months. At the request of the SERNAGEOMIN, the Chilean Air Force overflew the volcano on 11 June and 5 November 1993.
On 26 April the dome showed a flat, rugged surface, with concentric cooling ridges and low steep walls without a talus apron. The blocky surface had a more rugged outer rim, paler in color, probably due to the deposition of salts (sulfates and iron chlorides) as observed on the surface of the pyroclastic flows a few days after the eruption (Gardeweg and Medina, 1993). The central part of the dome was darker, and apparently hotter. It had a small NNW-trending radial fissure with fumarolic activity at the N end near the outer rim. Nearly concentric ridges radiated from this point, interpreted as the vent site. Fumarolic activity was mainly restricted to the dome margins and concentrated on the SE edge.
Aerial observations by P. Francis on 19 May indicated that the dome had started to collapse, evidenced by slight subsidence on the N side; photographs taken by the Air Force on 11 June support this observation. At that time, the dome had a homogeneously rugged surface with an irregular whitish patina similar to the one observed on the outer rim on 26 April. The N side of the dome had subsided, developing a funnel-shaped depression from which there was strong fumarolic activity. Although the dome had partially caved in, there were no collapse scarps. Fumarolic activity was also observed at the edge of the dome, concentrated on the SE margin. Strong fumarolic activity in the caved-in funnel and weaker activity on the SE margin was observed again on 28 June. By 5 November the funnel-shaped depression had reached an estimated depth of 50-100 m below the surface of the dome. Surface features on the dome were similar to those seen in June. Strong degassing continued within the funnel and weakly on the SE edge.
Systematic observations from Talabre (17 km NNW) indicated that fumarolic activity returned to normal levels after the April eruption, with white to gray columns rising 200-400 m above the crater rim. Higher columns up to 1,200 m were observed in late June and mid-October, but there was no correlation with changes in the color of the plume or any other visible characteristics. The water supply to Talabre, cut off by pyroclastic flows on 20 April, was restored on 6 October. Cistern trucks provided by local authorities had supplied drinkable water until then.
Two portable seismographs were installed around the volcano 8-17 October. Seismicity during this period was much lower than 20-30 April, immediately after the eruption (18:4). In October there were two volcano-tectonic events recorded. The activity was characterized by sporadic long-period events and hybrid events that have been interpreted to be a result of deformation accompanied by the displacement of fluids. These hybrid events may be related to the slow subsidence of the dome observed since 19 May.
References. Gardeweg, M.C., Medina, E., Murillo, M., and Espinoza, A., 1993, La erupción del 19-20 de Abril de 1993: VI Informe sobre el comportamiento del Volcán Lascar (II Región): Informe Inédito, Biblioteca Servicio Nacional de Geología y Minería, 20 p.
Gardeweg, M.C., and Medina, E., 1993, 35 días después de la erupción del 19-20 de Abril de 1993: VII Informe sobre el comportamiento del Volcán Lascar (II Región): Informe Inédito, Biblioteca Servicio Nacional de Geología y Minería.
Information Contacts: M. Gardeweg and J. Cayupi, SERNAGEOMIN, Santiago; G. Fuentealba, Univ de la Frontera, Temuco; P. Francis, Open Univ; J. Viramonte, Univ Nacional de Salta, Argentina; Servicio Informativo del la Oficina Nacional de Emergencia, Santiago.
Short eruption in December 1993 sends plume 8-10 km high
"At 0835 on 17 December 1993, Lascar had a new short-lived explosive eruption. Ibar Torrejón, the teacher in Talabre (17 km WNW) who maintains a log of Lascar's activity, reported that a strong explosion was followed by the rise of a dark gray plume up to 8-10 km above rim of the active crater. The eruption was accompanied by seismic activity felt in Talabre with an intensity of MM 3. Another small explosion was recorded at 0930, with a dark plume rising 2 km. Although the dark coloration of the plume suggests significant ash content, no ashfall was recorded in the few populated areas E or SE of Lascar, where prevailing winds normally transport the plumes (El Laco, 60 km SSE; Catua, 80 km SE; and Salta, 285 km SE). There were no witnesses closer to the S or E flanks of the volcano at the moment of the eruption. Also, no ballistic blocks were observed, suggesting that it was a small, mainly phreatic, eruption. Since then Lascar has returned to normal fumarolic activity, with columns rising 200-400 m above the active crater rim.
"[The domes] progressive collapse since May 1993 suggested that it was following the pattern shown since 1985, so local authorities were warned in November of the possibility of a new eruption within the next months. Local authorities have again been warned that similar or larger eruptions can take place in the near future."
Information Contacts: M. Gardeweg, SERNAGEOMIN, Santiago.
Dome collapse almost complete; new fractures and fumaroles; small ash emissions
Normal fumarolic activity has continued since the small eruption on 17 December 1993. During fieldwork between 10 February and 5 March, the plume was unusually low (200-400 m above the crater), with occasional increases to normal levels (800-1,000 m). The yellowish plume sometimes contained small amounts of gray ash. A short-lived eruption on the [evening] of 27 February was witnessed by S. Matthews from 40 km W of the volcano. A high dark eruption column produced a plume extending W and WNW; the plume detached from the volcano 15 minutes later. On 28 February the Argentinian Civil Defense reported that ash had fallen in Jujuy, Argentina (~265 km SE). Fumarolic activity diminished the next day.
Crater observations, 19 February 1994. Gardeweg and Matthews reached the summit using a helicopter provided by the Fuerza Aerea de Chile. The April 1993 dome (18:4) had been almost completely replaced by a deep hole (bottom not visible) produced by continuous collapse into the vent (18:11). It occupied the central and N side of the previously flat surface of the dome. The S side of the dome was cut by deep annular collapse fractures (figure 20). Strong degassing was concentrated in the collapse crater. Weaker fumarolic activity was observed along the outer fractures and margin of the dome. These had persistent low-velocity emissions without the "jet engine" noise heard on previous visits. Yellow sulfur deposits associated with small fumaroles were also observed on the inner crater walls. Continuous rockfall into the active crater was observed coming from the overhanging W wall and the higher part of the S wall.
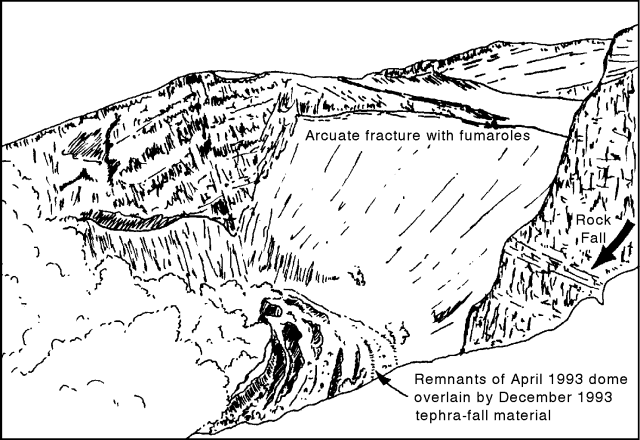 |
Figure 20. Sketch showing the inside of Lascar's active crater on 19 February 1994. Remnants of the April 1993 dome can be seen, cut by deep annular faults. New fumarolic activity along an arcuate fracture coincided with an older, previously inactive, crater rim. View is approximately to the NE from the S rim of the active crater. Diagram by S. Matthews. |
New fractures and fumaroles defined an elliptical zone centered on the active crater, but incorporating a larger part of the edifice (figure 21). An annular fracture with active fumaroles was observed along the rim of a previously inactive crater to the E. Small fumaroles were also present on the inside of the N wall and up to 50 m outside the S wall of the active crater. Two types of fumaroles occurred on the E side of the older W edifice, aligned on small (2, and H2SO4, and precipitating yellow and white sulfate minerals. The second type were hot (>=230°C) active fumaroles emitting steam and SO2, and depositing white sulfur.
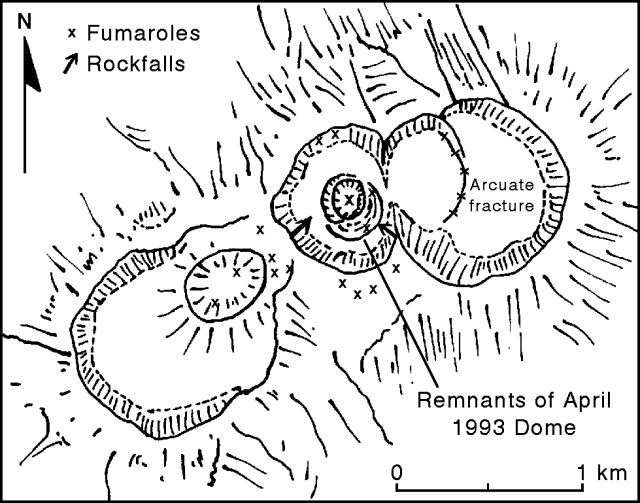 |
Figure 21. Sketch of the summit area of Lascar, with its five nested craters, on 19 February 1994. New fumarole fields and unstable sites with continuous rockfall are shown. Diagram by S. Matthews. |
Potential hazards. Subsidence of the crater floor as a result of conduit degassing since April 1993 has destabilized the inner part of the entire edifice. Collapse of the central part of the dome began in May 1993, coincident with the first observation of fumaroles on the S side of the active crater. An aerial photograph taken on 26 April 1993 shows a distinct fumarole on the inside rim of the N wall. Part of the subsidence occurred during the December 1993 eruption, as shown by aerial photographs taken by the Chilean Air Force on 28 December. As of early March, the apparent blockage of the degassing system due to dome collapse was similar to pre-eruptive conditions observed in previous cycles, and is likely to cause another eruption in the near future. If subsidence and widening of the collapse zone continues, the entire edifice may be destabilized. Another potential hazard involves slippage of the overhanging W wall of the active crater, which may also block the degassing system leading to "throat clearing" eruptions.
Additional information about past activity. Photographs taken on the morning of 17 December 1993 by Gonzalo Cabero (MINSAL) from Toconao (35 km NW) show a vertical column rising 8,000-9,000 m above the rim of the active crater. A small umbrella developed in the upper third of the column, but no plume extended laterally from the volcano. Partial column collapse generated weak ash clouds to the N and S, but no new pyroclastic deposits were recognized during fieldwork. No bomb ejections or ashfall were reported from this activity. However, fieldwork between 10 February and 5 March identified a large number of bombs within 3.5 km of the crater that had been erupted after April 1993. Blocks from the April 1993 eruption (18:4) exhibited a wide variety of density and textures. The more recent blocks are distinctly different, composed of dense, banded glassy andesite.
A previously unreported eruption, on an unknown day in August 1993, was observed from Soncor (~15 km W). A black ash cloud rose 1-2 km above the crater in ~ 10 minutes; no sound or seismicity was detected. This small eruption was probably a result of dome collapse.
Gregg Bluth provided the following satellite-based TOMS results for the 19 April 1993 eruption. Tonnage calculations did not require reflectivity corrections, but the scan bias was accounted for. An SO2 cloud was not visible on 19 April, but one was observed on 20-22 April. The SO2 cloud on 20 April was streaming from the volcano to ~1,800 km E and SE; tonnage was 355 kt. By 21 April the SO2 cloud had separated from the volcano by ~300 km and continued drifting SE. The leading edge was ~2,000 km SE of the volcano. The measured SO2 on this day was 340 kt. By 22 April some values were still above background, but there was no obvious cloud mass. On 23 April only a few pixels were above background; no days were checked after 23 April. The elongated cloud seen on 20 April indicates that earlier SO2 emissions may have been lost to TOMS observation. However, because the SO2 cloud showed only a slight decrease the next day, there is no justification for estimating a significantly higher original emission based on an SO2 loss rate. Estimated total SO2 yield for this eruption was 400 kt.
Information Contacts: M. Gardeweg, SERNAGEOMIN, Santiago; S. Matthews, S. Sparks, and P. McLeod, Univ of Bristol; G. Bluth, GSFC.
Moderate short-lived eruption sends plume over Argentina
Renewed Vulcanian activity during 20-26 July generated plumes up to ~9,000 m altitude, ~4,000 m above the summit . . . . On 20 July at 1630 a grayish column 400-500 m high was emitted from the crater. The next day at 1230 a brownish eruptive column rose 3,000-4,000 m and immediately drifted NE. Very fine ashfall was reported in Salar de Olaroz in the Argentine Puna, 120 km NE of the vent. At 1430 on 23 July another eruption plume to a height of 3,000-4,000 m was blown NNE. No ashfall was reported in the Argentine Puna following this activity.
A single short-lived Vulcanian explosion at about 1200 on 26 July generated a column and NNE-trending plume that soon detached from the volcano; prevailing high-level winds then shifted the plume toward the E. Witnesses from Toconao (35 km NW) and San Pedro de Atacama (70 km NW) reported a moderate explosion followed by a dark-colored mushroom-shaped column that slowly rose to 4,000 m height. Pilots from Aerolineas Argentinas, AeroMonterrey, and Lineas Aereas de Chile reported to the Argentina National Metereological Service that the plume, ~30 km wide and 200 km long, reached an altitude of 9,000 m. Ashfall was only reported in areas close to the volcano. No ashfall was reported in the small village of Catua along the Chilean-Argentine border, 80 km E of Lascar. Immediately after the eruption the volcano showed very diminished activity, with weak white fumarolic plumes that hardly rose above the crater rim. From 27 July to 4 August the volcano exhibited normal fumarolic activity.
Infrared images of the 26 July ash cloud were captured by Raúl Rodano and Luis Ganz from the Meteosat 3 satellite (figure 22). An image taken at 1346 on 26 July showed an ESE-directed plume 50 x 20 km in size, reaching an altitude between 3,600 and 5,400 m (figure 22, top). At 1523 another image showed a 130-km-long plume with the trailing edge located 60 km from Lascar (figure 22, middle). On the E side of the plume, a core (40 km in diameter) developed vertically and reached ~7,000 m altitude. The lower levels of the plume were oriented ESE, following the general atmospheric circulation. Because of wind-shear between 5,400 and 7,000 m, the plume was reoriented NNE by upper-level winds (200°- 70 km/hour). On the image taken at 1631, the plume is 180 km long and 100 km from the source (figure 22, bottom). Based on analysis of this imagery, the NNE-oriented E end of the plume reached an estimated maximum height of 7,500 m. Although the sky was cloudy by 1830, scattered parts of the NNE-oriented plume could be seen 80 km E of Jujuy, Argentina, drifting E at 80 km/hour at an estimated altitude of 4,500 m. With frame animation it was possible to discern the dispersed plume reaching Presidente Roque Saenz Pena city, 800 km E of Lascar, at 2009 on 26 July.
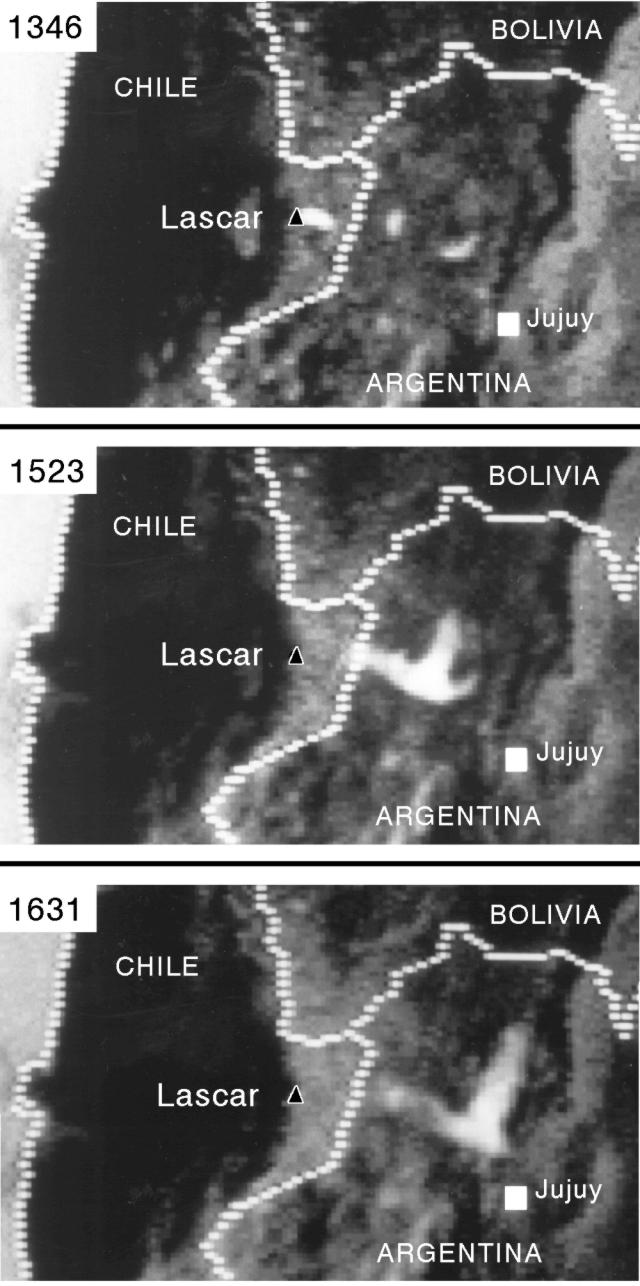 |
Figure 22. Infrared images of the 26 July 1994 plume from Lascar (white area) taken from the Meteosat 3 satellite. At 1346 (top) the small plume (50 x 20 km) was moving ESE. By 1523 (middle) the trailing edge of the 130-km-long detached plume was located 60 km from the volcano. On the image taken at 1631 (bottom), the plume was 100 km from the source, 180 km long, and the E end was oriented NNE. Approximate location of Lascar is shown by the black triangle; Jujuy, Argentina, is indicated by the white square. Courtesy of Raúl Rodano and Luis Ganz. |
These eruptions comprise the fourth period of Vulcanian activity following the large subplinian eruption of 19-20 April 1993. Eruptions were also reported in August and December 1993, and February 1994. All are thought to have been caused by blockage of the degassing magmatic system due to collapse of the dome formed in the late stages of the April 1993 eruption. The present morphology of the crater is unknown, although this renewed activity suggests further subsidence of the crater floor due to conduit degassing. Lascar, the most active volcano of the northern Chilean Andes, contains five overlapping summit craters along a NE trend. Prominent lava flows descend its NW flanks.
Reference. Gardeweg P., M.C., 1994, La Explosion del 26 de Julio, 1994, X Informe sobre el comportamiento del Volcan Lascar: Informe Inedito, Biblioteca Servicio Nacional de Geologia y Mineria, 4 p.
Information Contacts: M. Gardeweg, SERNAGEOMIN, Santiago; J. Viramonte, R. Becchio, I. Petrinovic, and R. Arganaraz, Instituto Geonorte Univ Nacional de Salta, Argentina; B. Coira and A. Perez, Instituto de Geologia Universidad de Jujuy, Argentina; R. Rodano and L. Ganz, Aerolineas Argentinas Weather Division, Buenos Aires, Argentina; H. Corbella, CONICET - Argentine Museum of Natural Sciences, Buenos Aires.
Small phreatic eruptions
Observations during 11-23 November revealed a plume of variable strength, indicating continuing instability, and the volcano was not climbed. The fumarole on the N rim was visible and appeared to be stronger than in February. A small phreatic eruption at 1720 on 13 November ejected a brownish column ~700 m above the crater which was then blown SE. This event was preceded by a weak, diffuse vapor plume which reached 300-500 m above the crater. Following the eruption, the plume gradually strengthened, reaching altitudes of 2-2.5 km above the summit . . . by 16 November (figure 23). The plume became more dense, yellowish to brownish in color, and pulsed, ejecting "ashy slugs" every 5-15 minutes. A second phreatic eruption observed at 1720 on 19 November emitted a dense white plume to 3 km above the crater. Although sheared by wind to the SE, it retained its form for ~20 minutes.
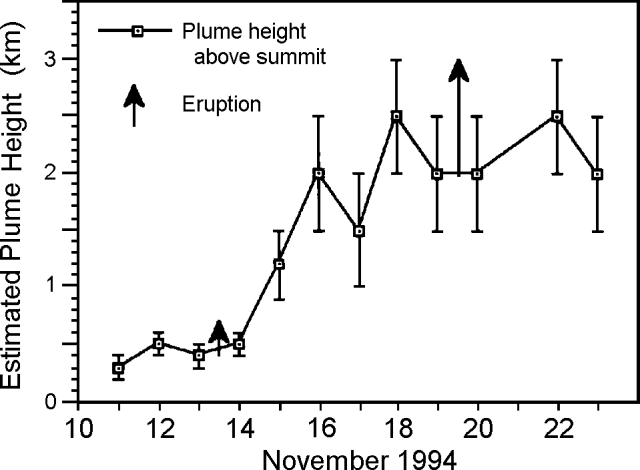 |
Figure 23. Plume altitudes and phreatic eruptions at Lascar, 11-23 November 1994. Courtesy of S. Matthews. |
Similar activity was observed by Matthews in February, and was related to continuing collapse of the crater floor. In this interpretation, blockage of the degassing system leads to a weak plume and buildup of pressure beneath the crater floor. Periodic phreatic eruptions clear the conduit and allow the gas to vent freely, causing the plume to strengthen; the reason for the strong pulsing is not clear.
Information Contacts: S. Matthews, Univ of Bristol.
Small ash eruptions and increased height of gas plume
Activity in February-March 1995. For the period 18 February to 10 March 1995 Lascar remained fairly active—frequently changing the altitude of its gas plume, producing small ash eruptions, and ejecting dense columns of water vapor (figure 24). The plume, which was typically pulsing, had a yellowish or brownish color. On 23 and 25 February underground booming noises ('retumbos') were heard 4 km from the volcano on both the N and NW flanks and at the village of Soncor, 25 km SW. On 24 February the plume's height above the crater suddenly increased from 200 m to 1,000 m (figure 24). This elevated "sustained" plume height marked the beginning of a series of small eruptions whose "transient" column heights are depicted by the arrow tips on figure 24. The sustained plume height initially remained comparatively high, reaching a maximum of 2 km above the volcano on 3 March; later, sustained plume height decreased gradually to ~500 m (figure 24).
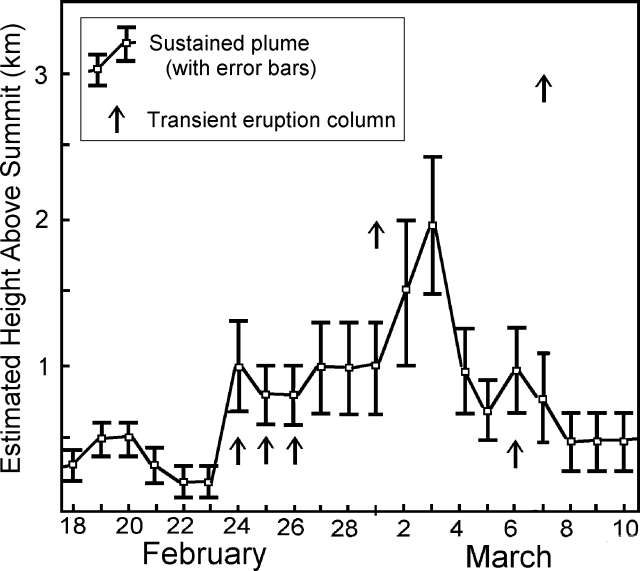 |
Figure 24. Estimated sustained plume and transient eruption-column heights above Lascar's crater for 18 February-10 March 1995. For the sustained plume heights, error bars increase in size with plume altitude due to problems of perspective. The transient eruption-column height is given by the arrow tips. Courtesy of S. Matthews and M. Gardeweg. |
At 0800 on 26 February a small ash-bearing eruption was reported by the Carabineros from 35 km NW of the volcano in Toconao. A black column rose at least 200 m (probably higher) above the crater. Retumbos associated with this eruption were audible at the offices of MINSAL in Toconao. Three larger eruptions were observed on 7 March, between 0000 and 0100, by Elcira Araya at the MINSAL offices. In each case a dark column rose an estimated 3 km above the crater. Plumes from these columns blew NW over Toconao and many residents reported a strong sulfur smell. The type of activity described (retumbos and small ash-rich eruptions) has in the past preceded larger Vulcanian eruptions. It is thought likely that such a Vulcanian eruption will occur in the near future.
Recent crater collapse and eruptive activity. At least two eruptive events took place in late 1994, both producing columns 4-km high. In November, Luis Aracena, a tour guide from San Pedro de Atacama, climbed Lascar and noted that a portion of the S rim had collapsed into the crater. Fractures on the S side of the crater had enlarged with an increase in fumarolic activity. He also found that the central hole in the crater floor had deepened substantially. One of his photos revealed large new arcuate fractures along the base of the talus slope at the foot of the NE crater wall.
Volcanologists concluded that the crater floor had continued to subside, destabilizing the walls and inducing them to collapse. The crater is thus becoming deeper and wider. In addition, blockage of the gas jets in the base of the crater due to subsidence on ring fractures and rockfalls from the walls has led to periodic 'throat clearing' eruptions. The edifice was expected to become increasingly unstable so long as this activity continues. Thus, the Carabineros in Toconao began advising tourists not to climb the volcano due to the high risk of both small explosive eruptions and of additional collapse along the S rim (along the favored ascent route).
Information Contacts: S. Matthews, Univ of Bristol; M. Gardeweg, SERNAGEOMIN, Santiago.
Small eruptions on 10 May and 20 July
At 1450 on 20 July 1995, an aircraft pilot passing 130 km W of Lascar reported eruptive activity from the volcano. The pilot saw a dispersed, SE-directed plume located in the 6-9 km altitude range. The plume's density was moderate and its color, light gray. At 1621, in conditions of clear visibility, a second pilot (Lloyd Boliviano) noticed the plume at the same distance from the volcano. The plume originated from Lascar's crater and at that time only rose about 700 m before dispersing SE where it remained visible for more than an estimated 90 km. At the crater the plume looked white to light gray and moderately dense. This second observation confirmed a sustained eruption.
Near the volcano, observers suggested that an eruption started between 1245 and 1315, accompanied by underground booming noises. Although in conflict with the pilot reports, officers located 67 km NW of Lascar (San Pedro de Atacama) stated that at 1445 the eruption ceased completely, maintaining only a small, diffuse column of gases.
Secondary information from San Pedro de Atacama (municipal administrator Juan Carlos Pereira) suggested that at 1320 there were underground booming sounds near the volcano and at 1330 a gray column rose to 2.5 km above the volcano. This column traveled towards the E and rained ash 6 km from the vent. The same behavior was repeated three times with less intensity.
In Toconao, 34 km NW of Lascar, Sara Moncada confirmed the eruption in the 1300-1400 time interval, although she heard no sounds at that locality. The next day, 21 July, the volcano returned to its more normal state with white fumarolic degassing.
According to a news broadcast, a previous episode occurred on 10 May consisted of three explosions, also accompanied by underground explosions. Columns then were <800-m high. The previous Lascar report (BGVN 20:03) discussed collapse of the crater's S rim and plumes that rose several kilometers and rained ash onto Toconao.
Information Contacts: Jose Antonio Naranjo, Programa Riesgo Volcanico, Servicio Nacional de Geologia y Mineria, Avda. Santa Maria 0104, Casilla 1347, Santiago, Chile.
Quiet emission of vapor
In July 1996, activity was observed during a two-week period. Vapor quietly puffed several times per minute. The white to bluish color and smell of the vapor suggested that it consisted mainly of H2O and SO2. No rumbling was perceptible 300 m below the S rim of the crater.
Information Contacts: J. Sesiano, Département de Minéralogie, Université de Genève, 13 rue des Maraîchers, 1121 Genève 4, Switzerland.
Ash eruption on 20-21 July
At about 1044 on 20 July 2000, an eruption began at Lascar volcano that lasted until 1509. The Washington VAAC reported an ash advisory at 1509 for an ash plume that extended 660 km to the E, stretching from N Chile across S Bolivia and N Argentina and into W central Paraguay. At that time, the plume was traveling at speeds of up to 130 km/hour, reached altitudes of 10.7-13.7 km, and was reported to be 103 km wide.
Residents of the village of Jama, located 60 km ENE of the volcano on the Argentina-Chile border, reported feeling an earthquake before seeing a white mushroom cloud that rose 4-5 km high and rapidly blew E, depositing 1-2 mm of ash over the village. Several explosions were felt and heard 160 km ESE in San Antonio de los Cobres, but there were no reports of any injuries or damage. Activity continued into 21 July with small explosions producing plumes 200-300 m above the summit. The volcano is in a sparsely populated area so no evacuations were necessary.
According to Matthews and others (1997) Lascar has undergone four recognized cycles between 1984 and 1993. In each of these cycles, a lava dome is extruded in the active crater accompanied by vigorous degassing through high-temperature, high-velocity fumaroles on and around the dome. The dome then subsides into the conduit while the velocity and gas output of the fumaroles decrease; the cycle ends with violent explosive activity. No new lava was immediately extruded after the dome collapsed in the explosive 1993 eruption, thus breaking the previous pattern.
Background. Lascar is the most active volcano of the northern Chilean Andes; it is characterized by its persistent fumarolic activity, steam eruptions, and occasional vulcanian eruptions. The andesitic-to-dacitic stratovolcano contains six overlapping summit craters along a NE-SW trend.
Matthews and others (1997) discussed Lascar's evolution in four phases starting at ~50 ka. During phase I, an edifice was established on the E side, and pyroxene andesite lavas erupted. Phase II saw the development of the W edifice with a subglacial andesitic eruption, and the destruction of a substantial dome, arguably the volcano's most explosive event. In Phase III, a stratocone was constructed and a major andesitic explosive eruption generated scoria flows, known as the Tumbres deposits, dated at 9.2 ka. Phase IV activity shifted back to the E, leaving pyroclastic deposits dated at 7.1 ka. Prominent Phase IV lava flows extended NW and were later truncated by the formation of three deep collapse craters that mark the W migration of the active center. The current active vent discharges in the deepest of these craters, which is 800 m in diameter and 300 m deep. Frequent explosive eruptions have been recorded since the mid-19th century.
Reference. Matthews, S.J., Gardeweg, M.C., and Sparks, R.S.J., 1997, The 1894 to 1996 cyclic activity of Lascar Volcano, northern Chile: cycles of dome growth, dome subsidence, degassing and explosive eruptions: Bulletin of Volcanology, v. 59, p. 72-82.
Information Contacts: José Viramonte, Universidad Nacional de Salta and CONICET, Buenos Aires 177 -4400 Salta, Argentina; George Stephens, NOAA Operational Significant Events Imagery Support Team, World Weather Bldg., 5200 Auth Road, Rm. 510, NOAA/NESDIS, Camp Springs, MD 20748 (URL: https://www.nnvl.noaa.gov/); Associated Press.
Small ash eruptions in October 2002; fumarole investigations
An international team of scientists conducted an interdisciplinary research project at Lascar from 13 October 2002 to15 January 2003. The group of scientists from Argentina, Chile, Italy, Puerto Rico, United Kingdom, and the United States, includes volcanologists who have directly observed the volcano from before the 1993 eruption (BGVN 18:04). During the first part of the project the team took the first ever direct measurements of fumarole temperatures and gas compositions within the crater, which are to be compared with measurements acquired through remote sensing techniques. The combination of direct and ground- and satellite-based measurements at very different spatial scales will hopefully corroborate results from the different techniques. A significant change in crater geometry over the last few years was identified through comparison with work carried out by Gardeweg and others (1993) and Matthews and others (1997).
Visual observations. On 26 October 2002 small explosive eruptive events (reaching heights of 300 m above the crater) were observed at 0905, 0910, and 0915 by both the remote-sensing team 7 km SE of the vent and the direct sampling team on the crater rim (figure 25). Winds from the NW rapidly dispersed the ash cloud. On 27 October at 0845, loud noises were heard, and an ash plume was observed by people 7 km NW of the volcano. At 1340 a much more vigorous explosion produced a plume that rose at least 1,500 m above the vent (figure 26), which was observed by the volcanologists from Pozo Tres, 60 km NW.
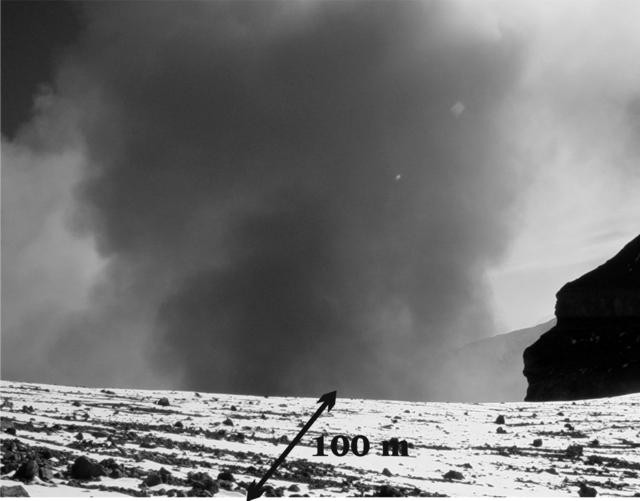 |
Figure 25. Photograph of an ash eruption at Lascar on 26 October 2002 seen from the crater rim. Courtesy of Franco Tassi. |
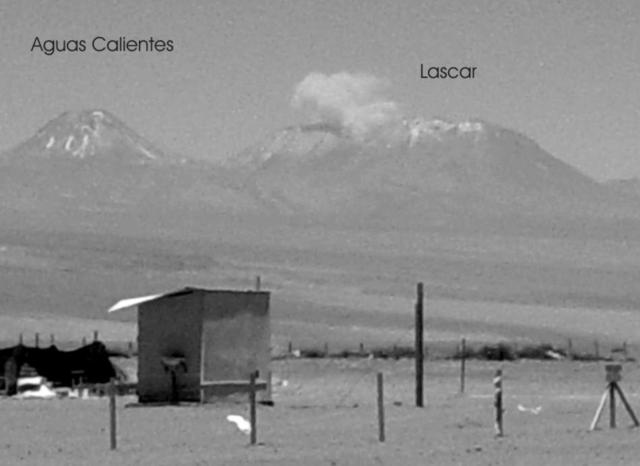 |
Figure 26. Photograph of an eruption at Lascar on 27 October 2002 seen from "Pozo Tres." Courtesy of J.G. Viramonte. |
On 1 November 2002 the direct-measurement team reached the crater for a second time to collect gas samples. Comparison with previous descriptions (Gardeweg and others, 1993; Matthews and others, 1997) and photographs taken by J.G. Viramonte at the beginning of the 1990's indicated that after the 2000 eruption (BGVN 25:06; http://www.unsa.edu.ar/varias/lascar; http://www. conae.gov.ar) several changes in crater morphology and locations of the high-flux fumaroles occurred. The dome had collapsed by several tens of meters, producing a deep, steep, hole ~200 m in diameter and 200 m deep, with a number of large fumaroles around the internal rim and at the base (figure 27). Observations suggest that Lascar is presently at or near the climax of the "dome subsidence phase," as described by Matthews and others (1997). There was no evidence of new dome emplacement after the July 2000 eruption.
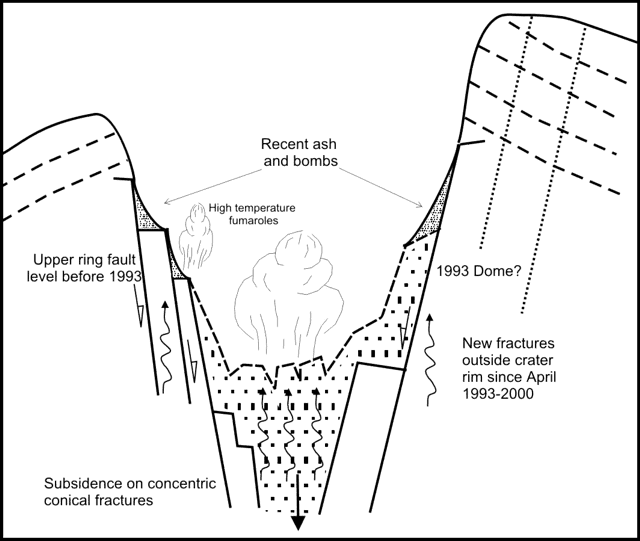 |
Figure 27. Cross-section sketch of the Lascar crater showing fractures, high-temperature fumaroles, and areas of recent ash and bombs. Courtesy of J.G. Viramonte. |
Direct techniques. Team members from Universita' degli Studi di Firenze (Italy), Universidad Nacional de Salta (Argentina), and Universidad Catolica del Norte (Chile) took, for the first time, direct temperature measurements of Lascar's fumaroles and collected gas samples using vacuum bottles filled with a 4N NaOH + 0.15N CdOH solution (Montegrossi and others, 2001). Sampled fumaroles were aligned along the upper collapse ring fault in the NW internal flank of the active crater (figure 28). A maximum temperature of 385°C was measured. Preliminary results indicate a very high concentration of acidic gases, with a paucity of water vapor. A more complete analysis, performed by gas chromatography and mass spectrometry, will be done in the Department of Earth Sciences at the Univ. Firenze.
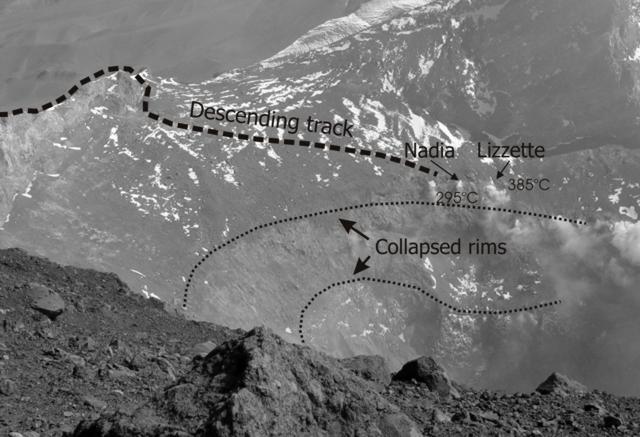 |
Figure 28. Photograph of the NW side of the Lascar crater, modified to show the collapsed rims and fumarole sampling locations in October 2002. Courtesy of Franco Tassi. |
Remote-sensing techniques. Team members from Michigan Technological University (MTU), Cambridge, and Universidad Nacional de Salta (UNSa) provided a suite of state-of-the-art ground-based instruments, including a miniature UV spectrometer that utilizes Differential Optical Absorption Spectroscopy (DOAS), a MICROTOPS II sun-photometer, and a Kestrel 4000 weather station. The instruments will help provide a more complete understanding of S-bearing species, and their fates in a high, dry atmosphere. The mini UV spectrometer provides an open path line-of-site burden of SO2 through spectral analysis (Galle and others, 2002; Edmonds and others, 2002), which can be used to derive SO2 emission rates (using the plume's speed and width). The sun-photometer will provide information about the plume's liquid- and solid-phase species, specifically sulfate aerosol. The aerosol's spectral signature can be used to derive the particle size distribution from the spectral optical depth (Watson and Oppenheimer, 2000). The weather station, in conjunction with the other instruments, will elucidate the effects of Lascar's high, dry, and extremely transmissive atmosphere upon SO2 conversion rates. The team will also derive SO2 burdens and emission rates using satellite imagery from NASA's ASTER (Advanced Spaceborne Thermal Emission and Reflection Radiometer) sensor.
Lascar provides an opportunity to study the effects of an end-member atmosphere upon volcanic plumes with the aim of better understanding the fates of volcanic species in the high troposphere (and hence the lower stratosphere). The DOAS is an exciting new instrument, first applied to volcanic studies by volcanologists from the Montserrat Volcano Observatory (MVO), Cambridge University (UK), and Chalmer's University of Technology (Sweden) that is now rapidly replacing the older, bulkier, and much more expensive correlation spectrometer (COSPEC). This experiment is a continuation of that work in a new and different environment.
Future work. The Cambridge team planned to begin a new round of remote studies in early 2003, using the DOAS system and sun-photometers, in particular to investigate evolution of the aerosol phase of the plume. The direct gas sampling by the Florence, Salta, and Del Norte team will be repeated, hopefully in 2003. The group, led by the MTU and UNSa contingent, plan to use recently acquired ASTER data to investigate SO2 emission. Hotspot activity will be studied using ASTER, MODIS, and GOES data. A study of the morphological evolution of the crater is planned for the near future, hopefully incorporating previous investigators' work on cyclic activity at Lascar.
References. Déruelle, B., Medina, E.T., Figueroa, O.A., Maragaño, M.C., and Viramonte, J.G., 1995, The recent eruption of Lascar volcano (Atacama-Chile, April 1993): petrological and volcanological relationships: C.R. Acad. Sci. Paris, 321, série II, p. 377-384.
Déruelle, B., Figueroa, O.A., Medina, E.T., Viramonte, J.G., and Maragaño, M.C., 1996, Petrology of pumices of April 1993 eruption of Lascar (Atacama, Chile): Blackwell Science Ltd, Terra Nova, v. 8, p. 191-199.
Edmonds, M., Herd, R.A., Galle, B., and Oppenheimer, C.M., 2002, Automated, high time resolution measurements of SO2 flux at Soufriere Hills Volcano, Montserrat: in review.
Galle, B., Oppenheimer, C., Geyer, A., McGonigle, A., Edmonds, M., and Horrocks, L.A., 2002, A miniaturised ultraviolet spectrometer for remote sensing of SO2 fluxes: a new tool for volcano surveillance: Journal of Volcanology and Geothermal Research, v. 119, p. 241-254.
Gardeweg, M.C., Sparks, S., Matthews, S., Fuentealba, C., Murillo, M., and Espinoza, A., 1993, V informe sobre el comportamiento del volcan Lascar (II región): Enero-Marzo 1993: SERNAGEOMIN, Chile, Marzo 1993.
Gardeweg, M.C., and Medina, E., 1994, La erupción subpliniana del 19-20 de Abril del volcan Lascar N de Chile: Congreso Geológico Chileno, Actas I, p. 299-304.
Matthews, S.J., Gardeweg, M.C., and Sparks, R.S.J., 1997, The 1984 to 1996 cyclic activity of Lascar Volcano, northern Chile: cycles of dome growth, dome subsidence, degassing and explosive eruptions: Bulletin of Volcanology, v. 59, p. 72-82.
Montegrossi, G., Tassi, F., Vaselli, O., Buccianti, A., and Garofalo, K., 2001, Sulphur species in volcanic gases: Anal. Chem., v. 73, p. 3,709-3,715.
Viramonte, J.G., Seggiaro, R.E., Becchio, R.A., and Petrinovic, I.A., 1994, Erupción del Volcán Lascar, Chile, Andes Centrales, Abril de 1993: 4ta Reunión Internacional del Volcán de Colima, Colima, México, Actas I, p. 149-151.
Watson, I.M., and Oppenheimer, C., 2000, Particle size distributions of Mt. Etna's aerosol plume constrained by sunphotometry: Journal of Geophysical Research, Atmospheres, v. 105, no. D8, p. 9,823-9,829.
Information Contacts: José G. Viramonte and Mariano Poodts, Instituto GEONORTE, Universidad Nacional de Salta, Buenos Aires 177, Salta 4400, Argentina (URL: http://www.unsa.edu.ar/); Matt Watson and Lizzette Rodríguez, Department of Geology, Michigan Technological University, Houghton, MI 49931, USA (URL: http://www.geo.mtu.edu/volcanoes/); Franco Tassi, Dipartimento di Scienze della Terra, Università degli studi di Firenze, Via La Pira 4, 50121 Firenze, Italy (URL: https://www.dst.unifi.it/); Eduardo Medina, Claudio Martinez, and Felipe Aguilera, Universidad Católica del Norte, Avenida Angamos 0610, Antofagasta, Chile (URL: http://www.ucn.cl/en/carrera/geology/).
On 9 December 2003 fine ash discharged from fumaroles
A report discussing Lascar from the Chilean Oficina Nacional de Emergencia, Ministerio del Interiorone (ONEMI) noted that on 9 December 2003 small amounts of fine ash discharged from fumaroles at Lascar. The following day activity was at normal levels, with only gas and steam emitted. On the morning of 10 December observers noted a 400-m-high, gray-colored, fumarolic plume. No increased seismicity was recorded. Eruptions were previously noted at Lascar during October 2002. At that time the volcano was the subject of several months of field studies (BGVN 28:03).
Information Contacts: National Office for Emergencies (Oficina Nacional de Emergencia, "ONEMI"), Ministry of the Interior, Beaucheff 1637, Santiago, Chile (URL: http://www.onemi.cl/).
4 May 2005 eruption sends ash over 1,000 km SE, ¾ of the way to Buenos Aires
Lascar, the most active volcano in northern Chile, erupted on 4 May 2005. Although the eruption was substantial, thus far there is an absence of reports from anyone who saw the eruption at close range. Preliminary assessments came mainly from satellite sensors and distant affects witnessed in Argentina. This report is based on one sent to us by Chilean Observatorio Volcanológico de los Andes del Sur (OVDAS) scientists José Antonio Naranjo and Hugo Moreno, discussing events around 4 May, with brief comments on some of Lascar's behavior in the past several years, and suggestions for future monitoring.
Lascar sits ~ 70 km SW of the intersection between Chile, Argentina, and Bolivia, ~ 300 km inland from the Chilean port city of Antofagasta. This part of the coast lies along the Atacama desert, and on flat terrain tens of kilometers W of Lascar resides a large salt pan, the Salar de Atacama (about 50 x 150 km). The settlement of Toconao is ~ 33 km NW of Lascar. Previous reports discussed field observations during 13 October 2002 to 15 January 2003, and fine ash discharged from fumaroles on 9 December 2003 (BGVN 28:03 and 29:01).
Naranjo and Moreno concluded that at roughly 0400 on 4 May an explosive eruption ejected an ash cloud to a tentative altitude on the order of 10 km that dispersed to the SE. About 2 hours later the cloud began dropping ash on Salta, Argentina. Satellite images portrayed the ash cloud's dispersal. An aviation 'red alert' was issued by the Buenos Aires Volcanic Ash Center; they saw the plume over Argentina at altitudes of 3-5 km.
Shortly after atmospheric impacts of the 4 May eruption became apparent, the Buenos Aires VAAC notified OVDAS that NW Argentine cities had reported falling ash. These cities, all SE of Lascar, included Jujuy, Salta, Santiago del Estero, and Santa Fe—locations with respective approximate distances from Lascar of 260, 275, 580, and 1,130 km. The Argentine province of Chaco, along the country's NE margin, was also noted as receiving ash. Buenos Aires (~ 1,530 km SE of Lascar) remained ~ 400 km beyond the point of the farthest detected ashfall.
Patricia Lobera, a professor in Talabre, Argentina, 17 km E of Lascar, said that eruption noises were not heard there on the morning of 4 May. When observers saw the plume from Talabre that morning they reportedly thought the plume looked similar to those on previous days.
Remotely sensed hot spots were detected on a GOES satellite image for 0339 (0639 UTC) on 4 May, showing the first evidence of an eruption. In a later image, at 0409, the thermal anomaly had increased, and the image suggested a growing, ash-bearing cloud then trending ~ 23 km to the SE. The thermal anomaly diminished in intensity by 0439, remaining diminished thereafter, but by that time the plume's leading margin extended over ~ 100 km SE and its tail had detached from the volcano. At 0509 the plume reached 170 km SE. According to a press report, at around 0600 ash fell in Salta (~ 275 km SE of Lascar).
Rosa Marquilla, a geologist at the University of Salta, reported that residents there noticed a mist attributed to the eruption, which hung over the city until at least to 1600, after which, the sky gradually cleared. Preliminary description of the petrography of the ash that fell in Salta came from Ricardo Pereyra (University of Salta) who saw crystal fragments (pyroxenes, feldspars, and magnetite) and fragments of volcanic glass containing plagioclase mircrolites. Lithic fragments were not observed.
The OVDAS authors concluded that, apparently since the year 2000, Lascar underwent constant degassing from an open vent within the ~ 780-m-diameter active central crater. Sporadic explosions as in July 2000 and October 2002, and in this case, 4 May 2005, could be due to diverse causes. For example, there may have been temporarily obstructed conduits at depth, local collapses blocking the vent at the crater floor, or fresh magma injection contacting groundwater. Extrusion of a viscous dome lava also might explain the sudden explosions. That circumstance would presumably lead to visibly increased fumarolic output.
Naranjo and Moreno had several suggestions for ongoing monitoring. First, they suggested developing closer long-term contacts, including people able to visually monitor the volcano directly, as well as continued systematic contact with the Buenos Aires VAAC and their satellite analysts. They recommended ongoing relations with the University of Hawaii (MODVOLC) program to remotely sense hot-spots. They went on to suggest a campaign of stereo aerial photography to detect changes in the active crater. They advocated notifying local inhabitants of the possibility of ash falls before another explosive episode. They pointed out that mountaineers should be made aware of elevated risks within 8 km of the active crater.
References. Gardeweg, M., 1989, Informe preliminar sobre la evolución de la erupción del volcán Láscar (II Región): noviembre 1989: Servicio Nacional de Geología y Minería, Informe Inédito (unpublished report), 27 p.
Gardeweg, M., and Lindsay, J., 2004, Lascar Volcano, La Pacana Caldera, and El Tatio Geothermal Field: IAVCEI General Assembly Pucón 2004, Field Trip Guide-A2, 32 p.
Gardeweg, M., Medina, E., Murillo, M., and Espinoza, A., 1993, La erupción del 19-20 de abril de 1993: VI informe sobre el comportamiento del volcán Láscar (II Región): Servicio Nacional de Geología y Minería, Informe Inédito (unpublished report), 20 p.
Information Contacts: José Antonio Naranjo and Hugo Moreno, Programa Riesgo Volcanico, Servicio Nacional de Geologia y Mineria, Avda. Santa Maria 0104, Casilla 1347, Santiago, Chile; Gustavo Alberto Flowers, Buenos Aires Volcanic Ash Advisory Center (Buenos Aires VAAC), Servicio Meteorológico Nacional-Fuerza Aérea Argentina, 25 de mayo 658, Buenos Aires, Argentina (URL: http://www.smn.gov.ar/vaac/buenosaires/productos.php).
Further analysis of 4 May 2005 event indicates a phreato-Vulcanian eruption
The 4 May 2005 early morning eruption of Lascar was described in BGVN 30:04. Note that the time conversion in that issue was in error by 1 hour. The following information is based on a report prepared for Bulletin staff by Jose Viramonte of the Universidad Nacional de Salta, and Lizzette Rodriguez of Michigan Technological University.
Viramonte and Rodriguez estimated that the 4 May 2005 eruption column rose to a height of ~ 10-11 km, based on numerical models of temperature and wind measurements from the Servicio Metereológico Nacional, Argentina at different altitudes at the time of the eruption. The column traveled rapidly to the SE under the influence of the strong tropospheric winds with predominant direction from the NW to the SE.
Residents of the towns of Talabre (located 15 km W of the volcano) and Jama (located 60 km ENE of the volcano) did not report earthquakes or explosions. The Instituto GEONORTE of the Universidad Nacional de Salta reported very fine ashfall at 0545 in the city of Salta, located ~ 285 km SSE of the volcano. Ash sample collection, carried out by GEONORTE personnel for 2.5 hours, measured a rate of 0.4 g/ (m2 h). Grain size analyses of the ash showed a strong mode at diameters of 4-8 phi (0.062-0.003 mm) (figure 29); the ash was composed predominantly of andesitic lithic fragments and broken crystals of two pyroxenes (hyperstene and augite) and plagioclase, with very scarce glass shards.
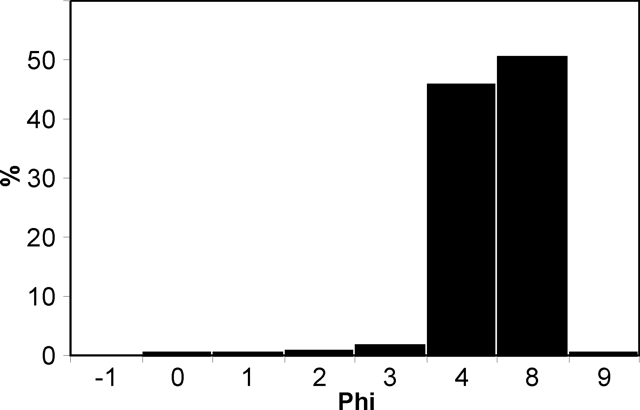 |
Figure 29. Histogram of the grain size of ash deposited at the city of Salta by the 4 May 2005 Lascar eruption. Courtesy of Jose Viramonte and Lizzette Rodriguez. |
The Buenos Aires VAAC and the Comisión Nacional de Actividades Espaciales (CONAE) processed different bands from MODIS data: b29-b32 for SO2, b31-b32 for ash, and b30-b32 for SO4. The first two band combinations showed the Lascar plume in coincidence with the b5-b4 band combination from NOAA-17 (figure 30).
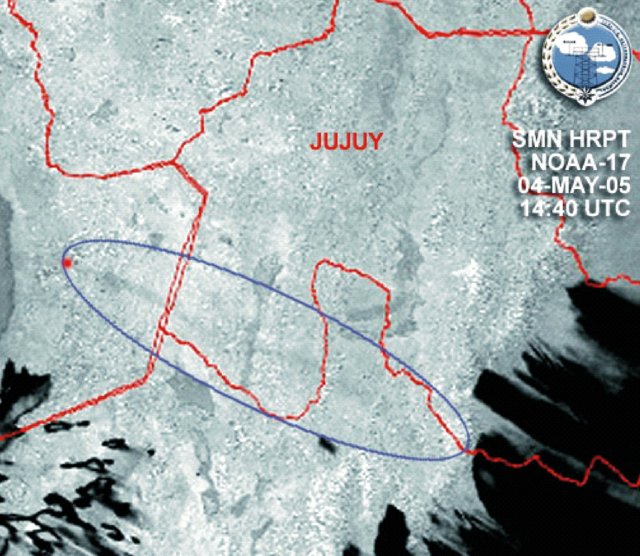 |
Figure 30. NOAA-17 image of a SE-directed plume from Lascar at 1440 UTC (1040 local time), obtained with the difference of channels 4 and 5 from the AVHRR sensor. The plume can be better identified withing the ellipse on higher resolution reproductions. Courtesy of Jose Viramonte and Lizzette Rodriguez. |
The grain size and shape of the ash, its composition, and the interpretation of the satellite data, suggest that Lascar volcano had a short phreato-vulcanian eruption.
On May 25, Felipe Aguilera of the Universidad Católica del Norte, Antofagasta, Chile, climbed up to the crater of Lascar volcano (figure 31). He reported three new strong fumaroles a few meters from the S border of the crater, and sampled the sulfur sublimates (figure 32). No new bombs or blocks were seen around the crater area.
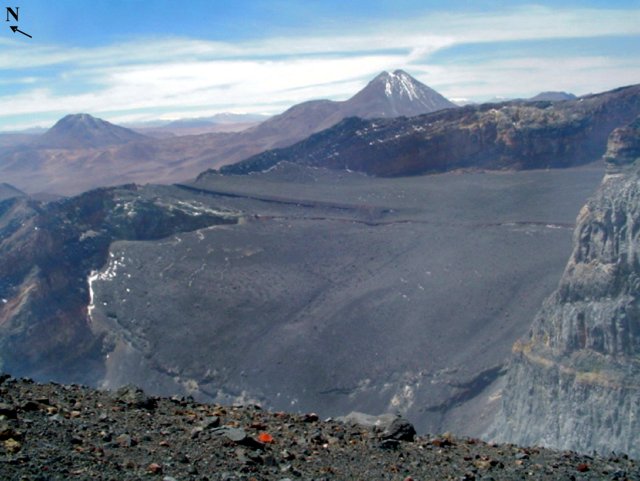 |
Figure 31. View of Lascar's NE crater, looking NE (see arrow, upper left) with fumaroles present along a number of fractures to the N and E sides. The active crater is just out of view in the image foreground. Picture taken by Felipe Aguilera on 25 May 2005. Courtesy of Jose Viramonte and Lizzette Rodriguez. |
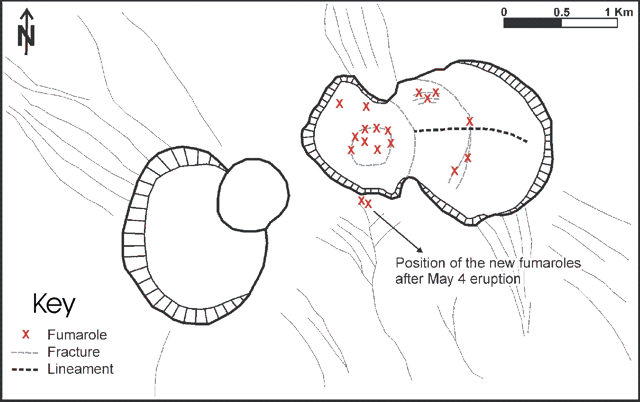 |
Figure 32. Schematic diagram showing the position of fumaroles on Lascar after the eruption on 4 May 2005. Also indicated are several new post-eruption fumaroles that developed on the S crater margin. Courtesy of Jose Viramonte and Lizzette Rodriguez. |
Recent and future work. A team of scientists from Michigan Technological University, the University of Hawaii, the Universidad Nacional de Salta, the Universidad de Chile, and the Universidad Nacional de Córdoba, conducted a field campaign at Lascar from 29 November to 8 December 2004. During this period, SO2 emissions were measured using two mini-UV spectrometers; aerosols were measured using two Microtops II sun photometers, and temperatures of the vent fumaroles were measured using a Forward Looking IR Radiometer (FLIR). Preliminary processing of the gas data showed a decrease since 2003 in the emissions, with SO2 fluxes around 500 tons/day (Rodríguez et al., 2005). This contrasts with the fluxes determined by Mather et al. (2004) on January 2003, which were on the order of 2,300 tons/day. Observations of the SO2 index, using ASTER TIR images, have shown a decrease in the size of the SO2 anomaly from 2000 to the first half of 2004 (Castro Godoy and Viramonte, 2004).
Temperature measurements made at the crater on 2 December 2004 by University of Hawaii scientists using a FLIR indicated low temperatures for the fumarole field, which represented a decrease when compared with the results of direct measurements conducted in October 2002 by Franco Tassi and others (Tassi et al., 2004; BGVN 28:03). Similar observations have been made using ASTER SWIR and TIR images (Silvia Castro, GEOSAR-AR program), which have shown a decrease in the absolute temperatures and the size of the thermal anomaly since October 2002 (Castro Godoy and Viramonte, 2004). Images during the month of April 2005 showed a slight increase in the area and maximum temperature of the anomaly at the beginning of the month, followed by a decrease at the end of April, prior to the eruption. Decreases in the thermal activity have been observed in previous eruptive cycles, prior to explosive events (Oppenheimer et al., 1993; Matthews et al., 1997).
The data collected during the 2004 field campaign will help in the understanding of the pre-eruptive conditions at Lascar. SO2 emission rates on 7 December 2004 will be used to ground truth the satellite data from an ASTER overpass at 1436 UTC (1036 local time), and recently acquired ASTER data will be used to investigate SO2 emissions during the period close to the 4 May 2005 eruption. Scientists from Università degli studi di Firenze (Italy), Universidad Católica del Norte (Chile), and Universidad Nacional de Salta (Argentina) are conducting a systematic gas sample campaign at Lascar and other active volcanoes on the Central Volcanic Zone. Finally, scientists from the Universidad Católica del Norte and the Universidad Nacional de Salta are processing data from Landsat TM and ETM+ images, with the objective of understanding the behavior of Lascar volcano during the 1998-2004 period.
References. Castro Godoy, S. and Viramonte, J.G., 2004, Micro FTIR field measurement for volcanic mapping, SO2 and temperature monitoring using ASTER images in Lascar Volcano, southern central Andes: IAVCEI General Assembly, Book of Abstracts, Pucón, Chile, 14-20 November.
Mather, T.A., Tsanev, V.I., Pyle, D.M., McGonigle, A.J.S., Oppenheimer, C., and Allen, A.G., 2004, Characterization and evolution of tropospheric plumes from Lascar and Villarrica volcanoes, Chile: Journal of Geophysical Research, v. 109.
Matthews, S.J., Gardeweg, M.C., and Sparks, R.S.J., 1997, The 1984 to 1996 cyclic activity of Lascar volcano, northern Chile: cycles of dome growth, dome subsidence, degassing and explosive eruptions: Bulletin of Volcanology, v. 59, p.72-82.
Oppenheimer, C., Francis, P., Rothery, D., Carlton, D., and Glaze, L., 1993, Interpretation and comparison of volcanic thermal anomalies in Landsat Thematic Mapper infrared data: Volcán Lascar, Chile, 1984-1991: Journal of Geophysical Research, 98, p. 4269-4286.
Rodríguez, L.A., Watson, I.M., Viramonte, J., Hards, V., Edmonds, M., Cabrera, A., Oppenheimer, C., Rose, W.I., and Bluth, G.J.S., 2005, SO2 conversion rates at Lascar and Soufriere Hills volcanoes: 9th Gas Workshop, Palermo, Italy, May 1-10.
Tassi, F., Viramonte, J., Vaselli, O., Poodts, M., Aguilera, F., Martínez, C., Rodríguez, L.A., and Watson, I.M., 2004, First geochemical data from fumarolic gases at Lascar volcano, Chile: 32nd International Geological Congress, Florence, August 20-28, 2004.
Information Contacts: Raúl Becchio and José G. Viramonte, Instituto GEONORTE and CONICET, Universidad Nacional de Salta, Buenos Aires 177, Salta 4400, Argentina (URL: http://www.unsa.edu.ar/); Lizzette A. Rodríguez and Matthew Watson, Michigan Technological University, Houghton, MI 49931, USA (URL: http://www.geo.mtu.edu/volcanoes/); Felipe Aguilera, Universidad Católica del Norte, Avenida Angamos 0610, Antofagasta, Chile (URL: http://www.ucn.cl/en/carrera/geology/); Silvia Castro Godoy, GEOSAT-AR Project, SEGEMAR, Buenos Aires, Argentina (URL: http://www.segemar.gov.ar/); Matt Patrick and Rob Wright, HIGP-University of Hawaii, Honolulu, HI 96822, USA (URL: http://www.higp.hawaii.edu/volcanology.html); Sergio Haspert and Ricardo Valenti, VAAC Buenos Aires - Div. VMSR, Servicio Meteorologico Nacional, Argentina (URL: http://www.smn.gov.ar/vaac/buenosaires/productos.php).
Five-day eruption sequence in April 2006; plume seen 220 km away
Lascar's eruption on 4 May 2005 (BGVN 30:05) was followed by a new eruptive cycle, which began on 18 April 2006 and lasted 5 days. Observers familiar with Lascar judged this eruptive episode unusual compared to those observed previously in terms of eruptive character, frequency, and duration time. The Volcanic Ash Advisory Center (VAAC) in Buenos Aires and Servicio Metererológico Nacional of Argentina detected the eruption from satellite images, and aircraft warnings were posted. All of the times cited are in UTC (local time = UTC - 4 hours).
Eruptions start, 18 April. Four explosions registered (at 1520, 1722, 1900, and 2100 hours UTC). The first explosion, the largest of four, was visible from El Abra cooper mine (220 km NW) and reached ~ 10 km above the summit crater (figure 33). The shape of the eruptive column suggested that it reached the tropopause (~ 15 km altitude in this region). The white to gray plume, containing little ash but a large amount of water, dispersed to the NNE.
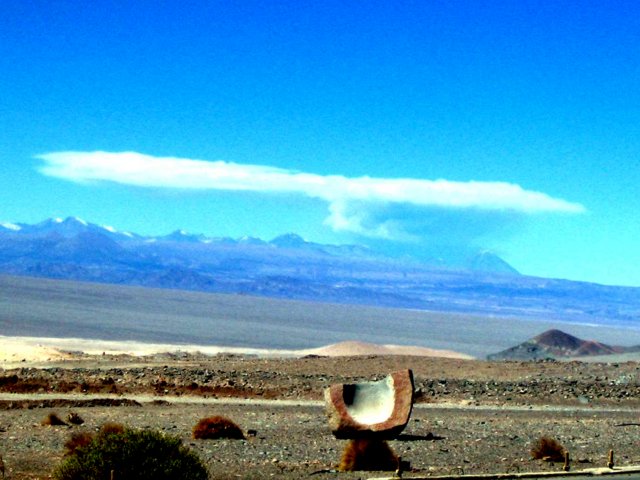 |
Figure 33. Lascar's first explosion of 18 April 2006 as photographed from El Abra copper mine, 220 km NW from volcano. Courtesy of personnel at the El Abra copper mine. |
The second explosion reached 3 km above the summit crater, while the third and fourth explosions reached 800 m. These latter eruptive plumes were gray colored, had higher contents of ash than the first explosion, and were dispersed NNE. Only slight ash fall was registered on the N side of the volcano. No seismic activity or eruption noises were registered. Analysis of GOES satellite images (figure 34) indicated that for the first and second eruptive plumes the mean horizontal velocities were 70 and 85 km/hour, respectively, while the maximum plume areas were ~ 8,240 and 1,074 km2, respectively. Minimum volumes erupted were ~ 4.1 x 10⁶ and ~ 0.54 x 10⁶ m3 assuming a hypothetical ash fall deposit of 0.5 mm over the stated areas. The third and fourth explosions were not detected by satellite.
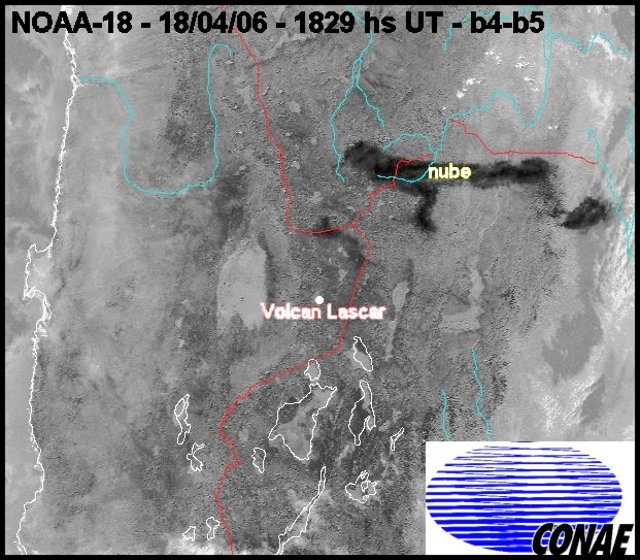 |
Figure 34. GOES satellite image capturing Lascar's first and second eruptive plumes. Rivers and international borders are also shown. Image is for 1829 UTC on the 18 April 2006. The first plume (oblong black area labeled 'cloud' in Spanish?'nube') stretched over N Argentina and S Bolivia. A second plume appears as a much smaller dark area between Lascar and the first plume. It lay over the NE Chilean border. Courtesy of Comisión Nacional de Asuntos Espaciales (CONAE), Argentina. |
19-22 April eruptions and comparative calm that followed. On 19 April 2006 at 1504 hours (UTC) an explosion generated a gray-colored eruptive column that reached 3 km above the summit crater and was dispersed NNE. Slight ash fall was noted on the N side of the volcano. Neither seismic activity nor eruption noises were reported. Two explosions were recorded 20 April at 1505 and 1739 hours (UTC). The first eruptive plume reached 2.5 km above the summit crater and contained a small amount of ash. The plume from the second explosion, the larger of the pair, reached 7 km above the crater. The eruption lasted 1 hour and 50 min. Both plumes were dispersed N and slight ash fall was registered on the N side of the volcano. No seismic activity or eruption noises were registered.
Analysis of satellite data from the sequence of GOES images (figure 35) indicated that the first and second eruptive plumes had mean horizontal velocities of 40 km/h, while the maximum areas were ~ 430 and ~ 800 km2, respectively. Minimal volumes erupted were ~ 0.4 x 10⁶ and ~ 0.2 x 10⁶ m3, again assuming a hypothetical 0.5 mm ash-fall deposit.
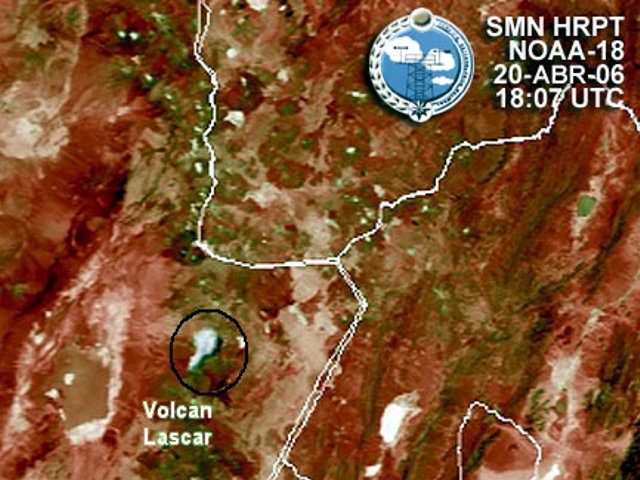 |
Figure 35. GOES satellite image of Lascar showing the second eruptive plume (black circle) at 1807 hours (UTC) of 20 April eruption dispersed to NE. Courtesy of Servicio Meteorológico Nacional and Comisión Nacional de Asuntos Espaciales (CONAE), Argentina. |
Two explosions were recorded on 21 April 2006 at 1248 and 1547 UTC, each lasting ~ 15 minutes. Their eruptive columns reached 3 km above the summit crater and rapidly dispersed ESE. Seismic activity and eruption noises were not noted.
On 22 April at 1518 UTC an explosion generated an eruptive column that reached 3 km above the summit crater; it was blown SE. Local inhabitants heard subterranean noises. On 23 April at 1600 UTC an explosion generated a gray-colored eruptive column that reached 2.5 km above the summit crater and dispersed NNW (figure 36). Seismic activity and eruption noises were not registered. During the following 2 days, the color of the plume was white and it's top remained ~ 1.5 km above the crater.
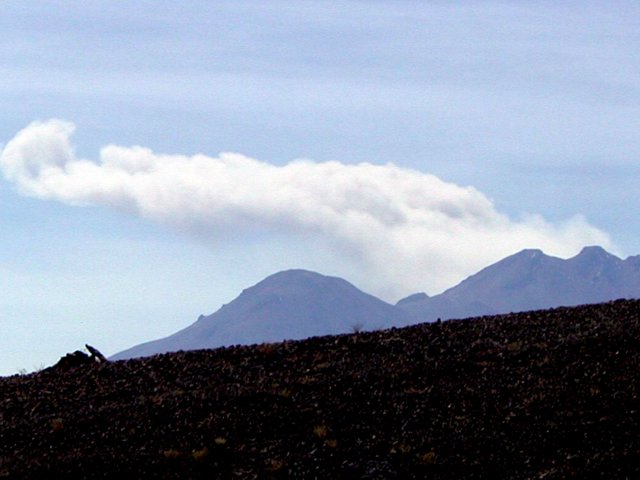 |
Figure 36. Photograph of Lascar taken 23 April 2006 from the SW border of the Atacama salar (salt pan), ~ 40 km SW of the volcano. Courtesy of Gabriel González. |
Other studies. After the 4 May 2005 eruption (BGVN 30:05), a team of scientists from Universidad Católica del Norte (UCN) carried out a gas sampling campaign on new fumaroles around the S edge of the central active crater. They used the direct sampling of fumaroles technique described by Giggenbach (1975) and Giggenbach and Goguel (1989). Gas data showed increasing amounts of H2O, H2S, and CH4 with respect to samples taken in 2002 from inside the active crater (Tassi et al., 2004). However, acid gases also displayed very high values. During December 2005 a team of scientists from UCN and Universidad Autónoma de México (UNAM) carried out field investigations to generate hazard maps.
Scientists from Università degli Studi di Firenze (Italy) and Universidad Católica del Norte (Chile) are conducting a systematic gas sample campaign at Lascar and other active volcanoes in the Central Volcanic Zone (e.g. Putana, Lastarria, and Isluga). Finally, scientists from the Universidad Católica del Norte, the Universidad Nacional de Salta and SEGEMAR (Argentina) are processing data from Landsat Thematic Mapper (TM) and Enhanced Thematic Mapper Plus (ETM+) and Advanced Spaceborne Thermal Emission and Reflection Radiometer (ASTER) images, with the objective of understanding the behavior of Lascar volcano during the 1998-2004 period.
References. Giggenbach, W., 1975, A simple method for the collection and analysis of volcanic gas sample: Bulletin of Volcanology, 39, 132?145.
Giggenbach, W., and Goguel, R., 1989, Collection and analysis of geothermal and volcanic water and gas discharges: DSIR Chemistry, Rept. No. 2401.
Matthews, S., Gardeweg, M., and Sparks, R., 1997, The 1984 to 1996 cyclic activity of Lascar volcano, northern Chile: cycles of dome growth, dome subsidence, degassing and explosive eruptions: Bulletin of Volcanology, v. 59, p. 72-82.
Tassi, F., Viramonte, J., Vaselli, O., Poodts, M., Aguilera, F., Martínez, C., Rodríguez, L., and Watson, I., 2004, First geochemical data from fumarolic gases at Lascar volcano, Chile: 32nd International Geological Congress, Florence, August 20-28, 2004.
Viramonte, J., Aguilera, F., Delgado, H., Rodríguez, L., Guzman, K., Jiménez, J., and Becchio, R., 2006, A new eruptive cycle of Lascar Volcano (Chile): The risk for the aeronavigation in northern Argentina. Garavolcan 2006, Tenerife, Spain.
Information Contacts: Felipe Aguilera, Eduardo Medina, and Karen Guzmán, Programa de Doctorado en Ciencias mención Geología and Departamento de Ciencias Geológicas, Universidad Católica del Norte, Avenida Angamos 0610, Antofagasta, Chile (URL: http://www.geodoctorado.cl, http://www.ucn.cl/); José G. Viramonte, Raúl Becchio, and Marcelo J. Arnosio, Instituto GEONORTE and CONICET, Universidad Nacional de Salta, Buenos Aires 177, Salta 4400, Argentina (URL: http://www.unsa.edu.ar/); Ricardo Valenti and Sergio Haspert, Servicio Metereológico Nacional, Argentina; Hugo G. Delgado, Instituto de Geofísica, Universidad Nacional Autónoma de México (UNAM), Coyoacán 04510, México, D.F.; Buenos Aires Volcanic Ash Advisory Center (VAAC), Servicio Meteorológico Nacional-Fuerza Aérea Argentina, Buenos Aires, Argentina (URL: http://www.smn.gov.ar/vaac/buenosaires/productos.php).
Crater changes after May; minor explosions during September and October 2006
This report covers the time interval September-October 2006 and was contributed by scientists from the Universidad Católica del Norte (Chile), University of Florence (Italy), Universidad Nacional de Salta (Argentina), and Universidad Nacional Autónoma de México (México). Changes seen in Láscar's central active crater after the May 2005 and April 2006 eruptions and after the gas fumaroles investigation carried out during September 2006. Our previous report covered activity into early May 2006 (BGVN 31:04).
Eruptive activity. Substantial ash emissions were noted on 18-21 and 28 April 2006. Several small phreatic explosions occurred starting 18April, continuing through May, July, and August 2006; the last in that time frame occurring on 14 August. After that, three minor explosions occurred between September and October 2006.
An explosion occurred at 0812 on 21 September. The eruptive plume reached 800 m above summit crater. A dark gray-colored plume, with moderate ash content dispersed NNE. The event failed to produce detectable ashfall, seismic activity, or eruption noises.
A minor explosion at 0830 on 20 October 2006 sent an eruptive plume up to 200 m above the summit crater. A dark gray-colored plume with moderate ash content dispersed E. At 1900 a larger eruption lasted 25 minutes. A dark gray-colored plume with moderate ash content reached 800 m above the summit crater and dispersed E. The October events also did not produce detected ashfall, seismic activity, or eruption noises.
Morphological changes in central active crater. Significant morphological changes, principally to the crater floor, occurred after the May 2005 Vulcanian eruption (Aguilera and others, 2006a; BGVN 30:04 and 30:05). Field and aerial observations between October 2002 and March 2005 showed a typical funnel shaped crater, with a depth of 450 m (Aguilera and others, 2003). This phenomena has been recognized as always occurring during the collapse-period of the lava dome growth-collapse cycle described by Matthews and others (1997). The observations during October 2002 and March 2005 show that the crater floor can be recognized from the S border of the central active crater (figure 37). However, observations during December 2005 (after the May 2005 Vulcanian eruption) and September 2006 (after the April 2006 eruptive cycle) show that the crater floor cannot be recognized from S border of central active crater (figure 38), probably indicating subsidence of the crater floor (Aguilera and others, 2006b; BGVN 31:04; and Clavero and others, 2006). Observations made in the central active crater indicate subsidence of crater floor.
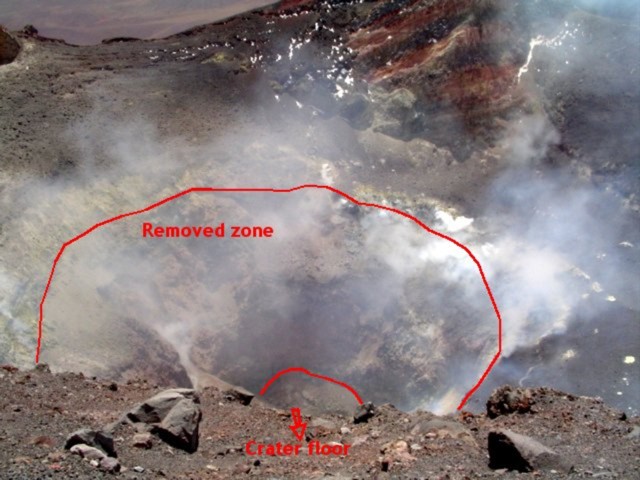 |
Figure 37. A March 2005 photo of the central active crater of Lascar seen from the S side. The May 2005 Vulcanian eruption removed portions of the crater floor and internal crater wall, leaving a circular crater with a "new rock wall" exposed. Photograph taken by Felipe Aguilera. |
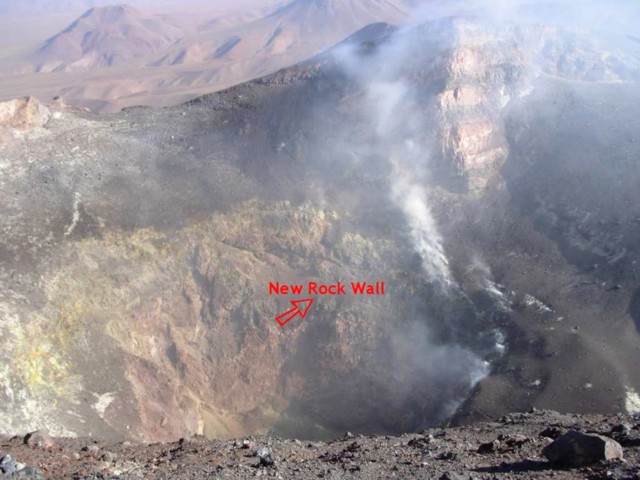 |
Figure 38. Central active crater of Lascar viewed from S side. Shown is the new rock wall of the inner crater after May 2005 Vulcanian eruption. Photograph taken by Felipe Aguilera, December 2005. |
The photograph from October 2002 (figure 39) shows the position of the crater floor inferred just before the May 2005 eruption, while the photograph from September 2006 (figure 40) shows the crater floor after the May 2005 and April 2006 eruptions. The position of the crater floor before the May 2005 eruption corresponded to a level associated with talus deposits, and the latest crater floor lay at the bottom of a new circular crater. A notable change in the morphology of the internal walls of the central active crater between the March and December 2005 photographs was the absence of a part of the crater wall (probably corresponding to parts of ancient lava domes, ballistic and ashfall deposits), exposing a new N wall of the crater.
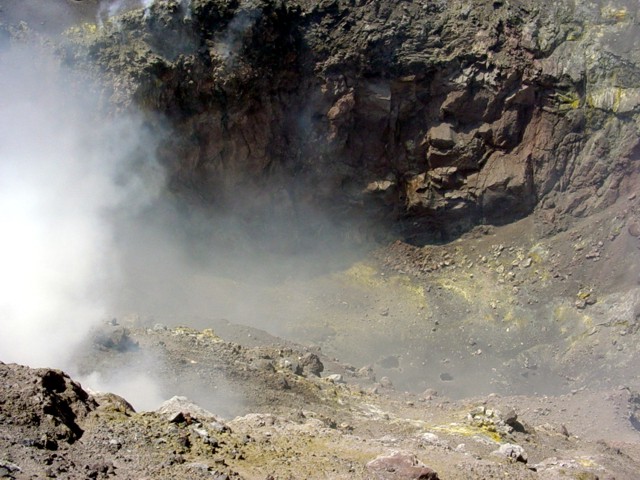 |
Figure 39. Central active crater of Lascar seen from the N internal wall, October 2002. Photograph taken by Franco Tassi. |
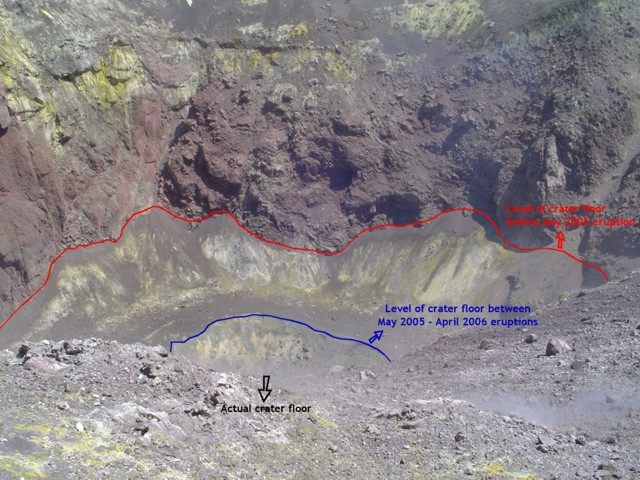 |
Figure 40. A September 2006 photo of the central active crater of Lascar seen from the NE. Shown are the level of the crater floor before the May 2005 Vulcanian eruption, the level of crater floor between May 2005 and April 206 eruptions, and the current crater floor. Photograph taken by Felipe Aguilera. |
Gas fumarole investigations. During 9-15 September 2006, gas sampling from fumaroles inside the central active crater was carried out by personnel of Universidad Católica del Norte (Chile). They noted a lowering of the temperature of fumaroles from 385°C to 250°C in October 2002 (Tassi and others, 2004). Scientists from Università degli studi di Firenze (Italy) and Universidad Católica del Norte (Chile) are conducting a systematic and permanent gas sampling campaign at Láscar and other active volcanoes of the Central Volcanic Zone (e.g. Putana, Lastarria, Isluga and others). Scientists from the Universidad Católica del Norte, the Universidad Nacional de Salta and SEGEMAR (Argentina) are processing data from Landsat TM and ETM+ and from ASTER images, with the objective of understanding the behavior of Lascar volcano during the 1998-2004 period.
References. Aguilera, F., Viramonte, J., Medina, E., Guzmán, K., Becchio, R., Delgado, H., and Arnosio, M., 2006a, Eruptive activity from Lascar volcano (2003-2005): XI Congreso Geológico Chileno, Antofagasta, 2006, p. 397-400.
Aguilera, F., Viramonte, J., Medina, E., Guzmán, K., Becchio, R., Delgado, H., and Arnosio, M., 2006b, Recent eruptive activity from Lascar volcano (2006): XI Congreso Geológico Chileno, Antofagasta, 2006, p. 393-396.
Clavero, J., Naranjo, J., and Cayupi, J., 2006, El ciclo eruptivo del 18 al 25 de Abril de 2006 del Volcán Lascar, Andes Centrales: XI Congreso Geológico Chileno, Antofagasta, 2006, p. 435-438.
Giggenbach, W., 1975, A simple method for the collection and analysis of volcanic gas samples: Bulletin of Volcanology, v. 39, p. 132-145.
Giggenbach, W., and Goguel, R., 1989, Collection and analysis of geothermal and volcanic water and gas discharges: DSIR Chemistry, Rept. No. 2401.
Matthews, S., Gardeweg, M., and Sparks, R., 1997, The 1984 to 1996 cyclic activity of Lascar volcano, northern Chile: cycles of dome growth, dome subsidence, degassing and explosive eruptions: Bulletin of Volcanology, v. 59, p. 72 - 82
Tassi, F., Viramonte, J., Vaselli, O., Poodts, M., Aguilera, F., Martínez, C., Rodríguez, L., and Watson, I., 2004, First geochemical data from fumarolic gases at Lascar volcano, Chile: 32nd International Geological Congress, Florence, August 20-28, 2004.
Viramonte, J., Aguilera, F., Delgado, H., Rodríguez, L., Guzman, K., Jiménez, J., and Becchio, R., 2006, A new eruptive cycle of Lascar volcano (Chile). The risk for the aeronavigation in northern Argentina: Garavolcan 2006, Tenerife, Spain.
Information Contacts: Felipe Aguilera, Eduardo Medina, Karen Guzmán, and Valeria Ortega, Programa de Doctorado en Ciencias mención Geología and Depto de Ciencias Geológicas, Univ Católica del Norte, Avenida Angamos 0610, Antofagasta, Chile; Franco Tassi and Orlando Vaselli, Dept of Earth Science, Univ of Florence, Via La Pira 4, 50110, Florence, Italy (URL: http://www.geo.unifi.it/); José G. Viramonte, Instituto GEONORTE and CONICET, Univ Nacional de Salta, Buenos Aires 177, Salta 4400, Argentina (URL: http://www.unsa.edu.ar/); Hugo Delgado G., Instituto de Geofísica, Univ Nacional Autónoma de México, Ciudad Universitaria, Del Coyoacán, México D.F., C.P. 04510, México (URL: http://www.igeofcu.unam.mx/).
Occasional aviation reports of ash plumes during November 2006-July 2007
Our last Bulletin report on Láscar (BGVN 31:11) discussed minor explosions and ash plumes during September-October 2006, morphological changes in the central active crater since the May 2005 eruption, and an ongoing investigation on fumarolic gases venting in the active crater.
Reports since November 2006 and into late 2007 indicated that Láscar continued to emit ash plumes. On 22 January 2007, based on satellite imagery, the Buenos Aires Volcanic Ash Advisory Center (VAAC) reported continuous emissions from the volcano that drifted NNE. Then, according to the VAAC, on11 March 2007 an ash cloud from Láscar rose to 5.5-6.7 km altitude and drifted E. The VAAC's next report on Láscar indicated that on 23 May, an ash plume from Láscar rose to an altitude of 9.1 km and drifted SSE, based upon a Significant Meteorological Information (SIGMET) advisory and satellite image observations. Finally, the VAAC reported that, based on pilot reports and satellite image observations, on 18 July 2007 an ash plume rose to altitudes of 7.6-9.1 km and drifted NE. We have not seen any activity reports on Láscar between this July report and 23 October 2007, perhaps suggesting an absence of unusually vigorous activity during that interval.
Information Contacts: Buenos Aires Volcanic Ash Advisory Center (VAAC), Servicio Meteorológico Nacional-Fuerza Aérea Argentina, 25 de mayo 658, Buenos Aires, Argentina (URL: http://www.smn.gov.ar/vaac/buenosaires/productos.php).
Seismicity, glow, gray plumes, and other anomalies suggest April 2013 eruption
Láscar volcano lies within the Andes mountains [of northern Chile (figure 41)]. The Servicio Nacional de Geología y Minería (SERNAGEOMIN) furnishes on line reports on Láscar. The Observatorio Volcanológico de los Andes del Sur (OVDAS) in Temuco monitors the volcano. OVDAS... monthly and special reports [from the SERGEOMIN website], unless otherwise noted, formed the basis of this report. OVDAS monitors Láscar with several webcams, with GPS, and with airborne and remote sensing surveillance (eg. Landast). Their tool kit also includes findings from images gathered by OMI (The Ozone Monitoring Instrument on the NASA Aura satellite). Observatory volcanologists reported plume and seismic activity during February-March 2012, and again during March-April 2013. Emissions during early April 2013 were interpreted by authorities as a weak eruption.
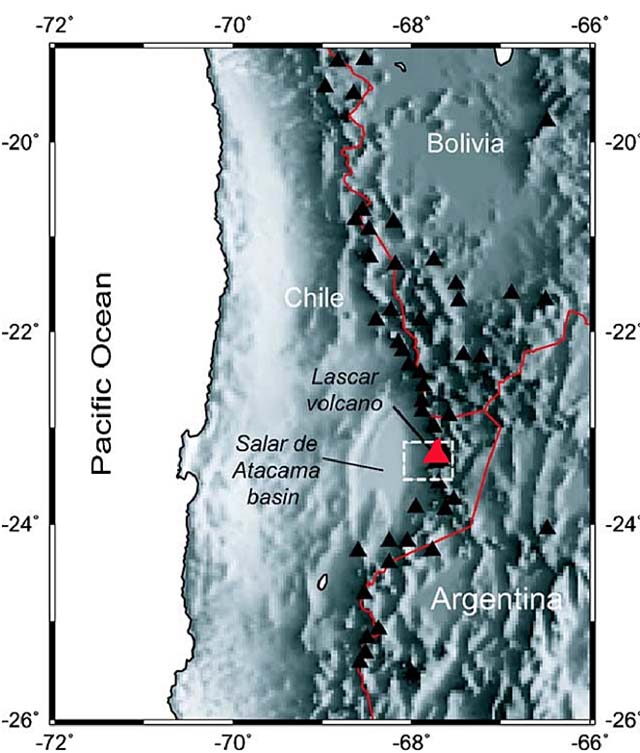 |
Figure 41. Láscar volcano, in the Andes region of Chile and adjacent to Bolivia and Argentina. The white box surrounding Láscar engulfs a high-altitude portion of the Atacama desert (Salar de Atacama in Spanish), as discussed further below. Courtesy of Visible Earth. NASA. (Retrieved 2011-01-02) |
In 2012, the volcano monitoring network recorded 1,679 seismic events; about 1,300 of these were hybrid earthquakes (HB) (table 4). Seismic activity increased sharply between 29 and 31 January 2012. A swarm with a total of 59 that were volcano-tectonic (VT); 491 that were long period (LP); and one that was hybrid (HB).During 1-15 February, a total of ~350 seismic events detected, averaging ~21 per day. This included 233 LP signals. Visible activity consisted of pulsating columns of gasses reaching 50-250 m height.
Table 4. A tabulation containing Láscar's 2012 Alert Level, seismic activity, and hazard status during 2012. Regarding hazard status, low risk corresponds to Green (G) and intermediate risk corresponds to Yellow (Y). Collated from OVDAS/SERNAGEOMIN reports.
| 2012 | Jan | Feb | Mar | Apr | May | Jun | Jul | Aug | Sep | Oct | Nov | Dec |
| Alert Level | Yellow | Yellow | Green | Green | Green | Green | Green | Green | Green | Green | Green | Green |
| Seismic events | 598 | 350 | 99 | 92 | 80 | 91 | 63 | 83 | 52 | 55 | 65 | 51 |
| VT events | 82 | 92 | 22 | 4 | 16 | 14 | 3 | 5 | -- | 55 | 65 | 5 |
| LP events, # | 507 | 233 | 77 | 88 | 64 | 76 | 70 | 78 | 52 | -- | -- | 45 |
| HB | 1 | 1 | -- | -- | -- | 1 | -- | -- | -- | -- | -- | -- |
In 2013, the volcano monitoring network recorded 506 seismic events. About 70% of these occurred during July (table 5). There were episodes of gas emissions, increased temperatures and seismic events starting in March and continuing through 10 April. This behavior prompted OVDAS to examine the likelyhood of an eruption. In March 2013, cameras detected mainly white gas columns reaching heights to 600 m above the crater.
Table 5. A tabulation containing Láscar's Alert Levels, seismic activity, hazard status, and plume color observations from February to October 2013. Collated from OVDAS/SERNAGEOMIN reports.
| 2013 | 01-28 Feb | 01 Mar-04 Apr | 05-15 Apr | 01-14 May | 15-31 May | 01-15 Jul | 16-30 Jul | 16-31 Aug | 01-15 Sep |
| Alert Level | Green | Yellow | Yellow | Yellow | Yellow | Yellow | Yellow | Yellow | Green |
| Seismic events | 43 | 57 | 18 | 5 | 8 | 116 | 245 | 7 | 2 |
| VT events | 3 | 2* | 3 | 3 | 4 | 92 | 226 | 6 | 1 |
| LP events | 40 | 55 | 15 | 2 | 4 | 24 | 19 | 1 | 1 |
| HB | -- | -- | -- | -- | -- | 8 out of 24 | 11 out of 19 | -- | -- |
| main plume color | -- | -- | white/gray | -- | -- | brown | brown | white | -- |
During the nights of 2-4 April incandescence appeared in the active crater. Also on 3 April gases emitted... fluctuated between white and gray, the latter taken as indicative of ash emissions. The resulting plume rose 320 m and drifted SE. No anomalous SO2 was seen in OMI satellite data. The OVDAS/SERNAGEOMIN geologists issued a special report on 10 April 2013 discussing a 9 April flyby at 1115 in a helicopter. The observers saw intense fumarolic activity along the inner walls of the crater; the emitted plume was steady, white to brown, and smelled of sulfur (figure 42). A thermal imager that day detected temperatures of ~600°C at the bottom of the crater (figure 43). Although gases often thwarted observations of the crater floor, some deformation seemingly took place there suggestive of a rise of magma.
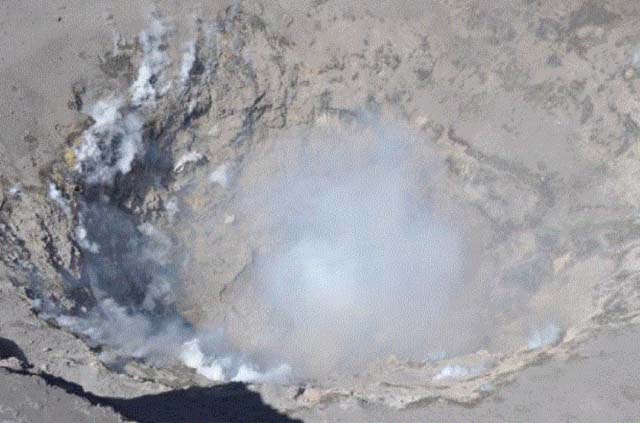 |
Figure 42. Visible light photo of the active crater at Láscar taken during an overflight on 9 April 2013. Courtesy of OVDAS/SERNAGEOMIN. |
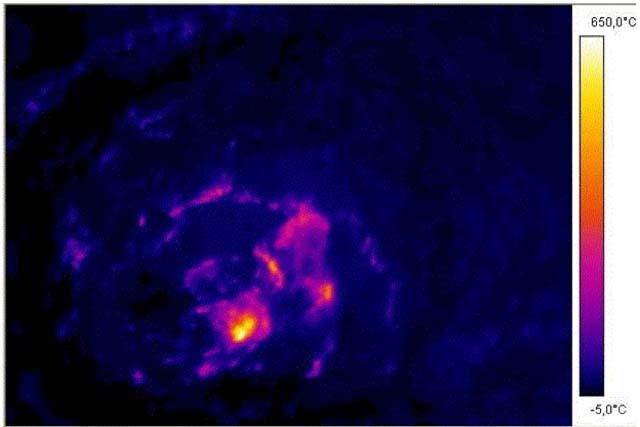 |
Figure 43. Thermal image of the active crater at Láscar showing computed temperatures at ~600°C (the scale maximum). Taken during the 9 April 2013 overflight. Courtesy of OVDAS/SERNAGEOMIN. |
During 1-17 July 2013, Láscar's cameras observed mainly brown-colored outgassing. The plumes reached a maximum heights of 500 and 1,000 m on 1 and 13 [July], respectively. Incandescence occurred on the nights of 1 and 2 July. After mid-July, the seismic activity tapered off to 10 or fewer events during the months of August and September. Láscar emitted white plumes on 4 November 2013 (figure 44).
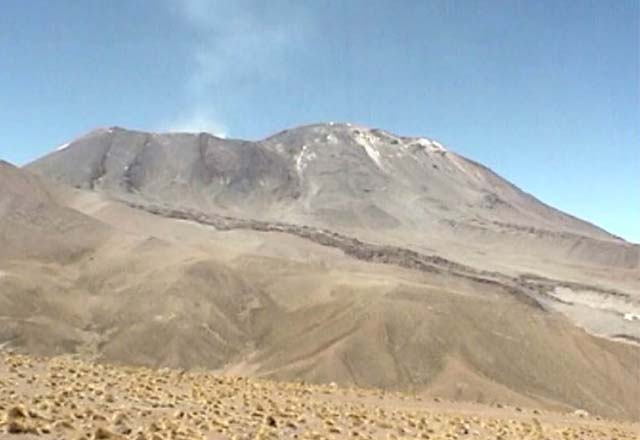 |
Figure 44. Webcam image of Láscar volcano, as seen amid calm conditions on 4 November 2013, capped by a faint white plume. Courtesy of OVDAS/SERNAGEOMIN. |
Information Contacts: Oficina Nacional de Emergencia Ministerio del Interior (ONEMI) (URL: http://www.onemi.cl/); Servicio Nacional de Geología y Minería (SERNAGEOMIN) (URL: http://www.sernageomin.cl/volcanes.php); Observatorio Volcanológico de los Andes del Sur (OVDAS), Temuco (URL: http://www.sernageomin.cl/volcan-observatorio.php); Jose G. Viramonte, Instituto Inenco-Geonorte, Universidad National De Salta-CONICET; Servicio Meteorológico Nacional-Fuerza Aérea Argentina, 25 de mayo 658, Buenos Aires, Argentina; and Buenos Aires Volcanic Ash Advisory Center (VAAC) (URL: http://www.smn.gov.ar/vaac/buenosaires/productos.php).
Intermittent incandescence seen in October and November 2013
An eruption at Láscar during 2 April-17 July 2013 included summit incandescence and some gray plumes (BGVN 38:07). Though no additional plumes were reported, incandescence was again observed during the first half of October and on 20 November 2013. The Observatorio Volcanológico de los Andes del Sur (OVDAS) in Temuco, part of the Servicio Nacional de Geología y Minería (SERNAGEOMIN) monitors the volcano and issues reports following periods of volcanism. Monitoring methods include several webcams, GPS, airborne and remote sensing surveillance (e.g., Landsat), and data gathered by OMI (Ozone Monitoring Instrument) on the NASA Aura satellite.
Following the minor eruptive activity during April-July 2013, seismicity returned to lower levels. The Alert Level remained at Green (the lowest of 4 levels) for the remainder of the year. Between 1 and 30 October, four volcano-tectonic (VT) seismic events occurred, with a magnitude of 1 localized in the immediate area of the crater at a depth of less than 2 km. On 1, 6, and 11-13 October incandescence was observed at the main crater.
During 1-30 November 2013 there were 10 seismic events recorded, nine of which were VT events. The largest event was located 15 km NE of the crater, at a depth of 9.5 km, and with a magnitude of 1.5. The final seismicity was a long-period (LP) event, related to the movement of fluids within the interior of the volcano and with a magnitude of 0.5. On 20 November incandescence was again observed at the crater.
Information Contacts: Observatorio Volcanológico de los Andes del Sur (OVDAS), Temuco, Chile (URL: http://www.sernageomin.cl/volcan-observatorio.php); Servicio Nacional de Geología y Minería (SERNAGEOMIN), Avda Sta María No. 0104, Santiago, Chile (URL: http://www.sernageomin.cl/)); Oficina Nacional de Emergencia Ministerio del Interior (ONEMI) (URL: http://www.onemi.cl/).
Ash plume on 30 October 2015 rises 2,500 m high; variable seismicity and persistent thermal anomaly afterwards
Lascar experienced one significant volcanic event between January 2014 and June 2016, a 2,500-m-high ash plume on 30 October 2015, according to reports issued by Chile's SERNAGEOMIN-OVDAS (Servicio Nacional de Geología y Minería, Observatorio Volcanológico de los Andes del Sur). Seismicity, deformation, SO2 emissions, and thermal anomalies were all monitored by the agency during this time. A thermal anomaly persisted following the 30 October explosion through at least 16 June 2016.
The volcano had a maximum of eight volcano-tectonic (VT) seismic events per month (in September 2014 and October 2015) recorded between January 2014 and June 2016, and usually only 2-4 events. The local magnitude ranged from 0.5 to 2.5. The distance from the crater was also variable, ranging from inside the crater (June and July 2014), to as far as 15 km NE (September 2014). Seismic events were located in many different directions from the central crater. The depth of the events ranged from 0.6 km (March 2014) to 9 km (February 2016).
The long-period (LP) seismic events showed a more consistent trend. From March through August 2014, there were fewer than 6 events recorded each month. In September, the number-of-events increased to 13, and then beginning in November 2014, over 100 LP events were recorded monthly through July 2015. The largest number was in May 2015 with 209 events. Numbers decreased to 54 in October 2015, and then dropped back into the single digits in November 2015 (after the ash event on 30 October). Eight or fewer LP events occurred monthly during the first half of 2016. All LP events had local magnitudes (ML) less than 1.3, most had values less than 1.0.
Outgassing was regularly observed, with the highest monthly plume heights reported ranging from 600 to 2,000 m between March 2014 and September 2015. At 0932 local time on 30 October 2015, the webcam captured an ash emission rising 2,500 m above the summit and drifting NE over the volcanic complex. Based on this activity, the Alert Level was raised to Yellow (the second on a four-color scale). The Chilean Oficina Nacional de Emergencia Ministerio del Interior (ONEMI) declared a Yellow Alert for the municipality of San Pedro de Atacama, located 70 km NW of the volcano. The Buenos Aires VAAC also identified a short plume near the summit in satellite imagery which dispersed quickly. The Alert Level was lowered back to Green on 16 November 2015. Water-vapor rich emissions to 2,000 m were reported from November 2015 through June 2016, with no additional ash emissions observed.
Incandescence at the summit was observed in March and April 2014, and November 2015. The only SO2 anomaly occurred on 30 October 2015 during the ash-plume event. It was recorded by the OMI instrument via satellite at 49 kilotons. Otherwise SO2 levels at the volcano were within the normal range, with minor fluctuations.
Small thermal anomalies were intermittent prior to late October 2015, at which time the MIROVA data shows infrared (IR) signatures at the summit consistently, continuing through at least 16 June 2016 (figure 45), with the intensity and frequency slowly decreasing. No MODVOLC anomalies were recorded during this period.
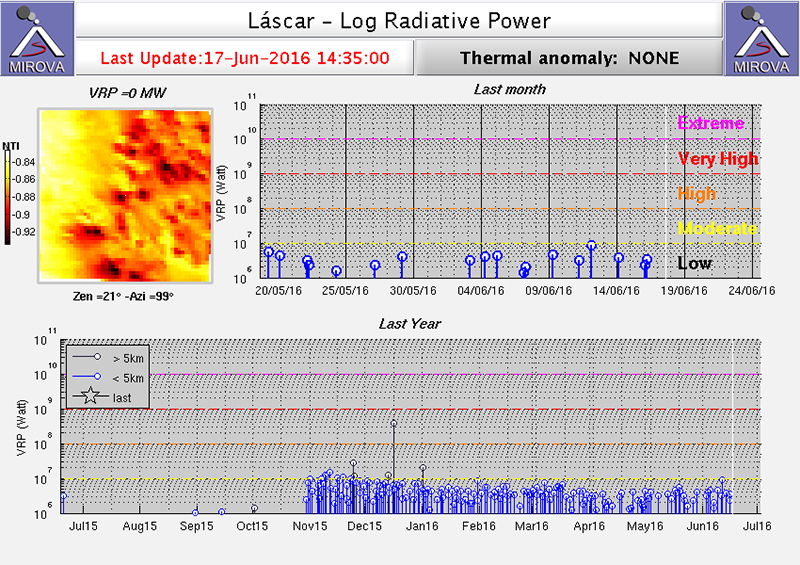 |
Figure 45. Thermal anomaly (Log Radiative Power) data for Lascar volcano showing abrupt appearance of a low thermal anomaly on 30 October 2015 during a 2,500-m-high, ash-plume emission. The anomalies continue, decreasing slightly in both intensity and frequency. Note that the white line indicates the day (17 June 2016) this graph was last updated. Courtesy of MIROVA. |
Information Contacts: Servicio Nacional de Geología y Minería (SERNAGEOMIN), Avda Sta María No. 0104, Santiago, Chile (URL: http://www.sernageomin.cl/volcanes.php); Observatorio Volcanológico de los Andes del Sur (OVDAS), Temuco (URL: http://www.sernageomin.cl/volcan-observatorio.php); Oficina Nacional de Emergencia Ministerio del Interior (ONEMI) (URL: http://www.onemi.cl/); Buenos Aires Volcanic Ash Advisory Center (VAAC), Servicio Meteorológico Nacional-Fuerza Aérea Argentina, 25 de mayo 658, Buenos Aires, Argentina (URL: http://www.smn.gov.ar/vaac/buenosaires/productos.php); MIROVA, a collaborative project between the Universities of Turin and Florence (Italy) supported by the Centre for Volcanic Risk of the Italian Civil Protection Department (URL: http://www.mirovaweb.it/)
Thermal anomaly persists until April 2017
The six overlapping summit craters of northern Chile's Lascar volcano have produced numerous lava flows down the NW flanks. Frequent small-to-moderate explosive eruptions since the mid-19th century, and infrequent larger eruptions, have produced ashfall hundreds of kilometers away. The largest historical eruption took place in 1993, producing pyroclastic flows to 8.5 km NW of the summit and ashfall in Buenos Aires. An explosion on 30 October 2015 produced an ash plume that rose 2.5 km above the 5.6 km high summit and drifted NE; this event also initiated a distinct thermal anomaly signal recorded by MIROVA that continued through June 2016 (BGVN 41:07). Continuous incandescence from the crater was seen for the next two months. The thermal anomaly did not begin to diminish until February 2017; details of activity through June 2017 are reported here with information primarily from Chile's Servicio Nacional de Geología y Minería, (SERNAGEOMIN), and the Italian MIROVA project.
After the 30 October 2015 explosion, a persistent thermal anomaly appeared in the MIROVA data that maintained a near-constant level of activity through June 2016 (figure 49, BGVN 41:07). The MIROVA VRP (Volcanic Radiative Power) values remained steady with multiple weekly anomalies through January 2017 when they began to taper off in both frequency and intensity (figure 46). They were intermittent during February, persistent but at a lower level during March and into the first few days of April. A few anomalies appeared later in April, and one during mid-May 2017; there is no evidence to determine exactly when eruptive activity ended or the cause of the anomalies.
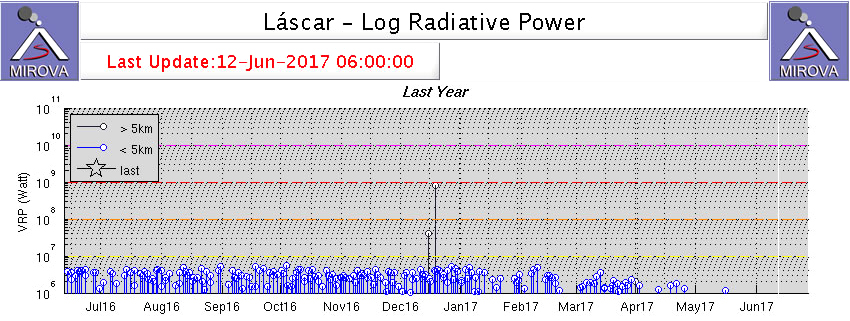 |
Figure 46. Thermal anomaly data from MIROVA (Log Radiative Power) at Lascar for the year ending on 12 June 2017. The thermal anomalies persisted at a steady rate and intensity from November 2015 (see figure 49, BGVN 41:07) through January 2017 when they began to decrease in both frequency and intensity, until they ceased in May 2017. Courtesy of MIROVA. |
Throughout July 2016-June 2017, the local webcam showed persistent degassing of mostly steam plumes from the main crater, with plume heights ranging from 500-1,500 m above the summit (table 6). Although there were three pilot reports of ash emissions from Lascar on 22 and 25 September and 29 December 2016, in each case the Buenos Aires VAAC noted that there was no indication of volcanic ash in satellite images under clear skies; the webcam did show continuous emissions of steam and gas dissipating rapidly near the summit. Seismicity during this period varied from a low of three events during October 2016 to a high of 122 events during June 2017. Although there was an increase in the number of seismic events during April 2017, the total energy released remained low. Continuous incandescence at the crater was observed during October-December 2016.
Table 6. Seismic events, degassing information, and incandescence observed at Lascar from July 2016-June 2017. Information provided by SERNAGEOMIN monthly reports. Maximum height is meters above the 5,592 m elevation summit.
| Month | No of Seismic Events | Degassing | Maximum Height (m) | Date of Maximum Height | Incandescence Observed |
| Jul 2016 | 11 | Steam | 700 | 4 Jul | -- |
| Aug 2016 | 12 | Steam | 850 | 25 Aug | -- |
| Sep 2016 | 24 | Steam | 1,100 | 21 Sep | -- |
| Oct 2016 | 3 | Steam | 1,000 | 28 Oct | Continuous |
| Nov 2016 | 7 | Steam | 1,500 | 4 Nov | Continuous |
| Dec 2016 | 6 | Steam | 1,400 | 20 Dec | Continuous |
| Jan 2017 | 13 | Constant | 800 | 6 Jan | -- |
| Feb 2017 | 36 | Constant | 650 | 19 Feb | -- |
| Mar 2017 | 19 | Constant | 600 | 5 Mar | -- |
| Apr 2017 | 112 | Constant | 600 | 29 Apr | -- |
| May 2017 | 97 | Constant | 560 | 8 May | -- |
| Jun 2017 | 122 | Constant | 500 | 1 Jun | -- |
Information Contacts: Servicio Nacional de Geología y Minería, (SERNAGEOMIN), Observatorio Volcanológico de Los Andes del Sur (OVDAS), Avda Sta María No. 0104, Santiago, Chile ( URL: http://www.sernageomin.cl/); MIROVA (Middle InfraRed Observation of Volcanic Activity), a collaborative project between the Universities of Turin and Florence (Italy) supported by the Centre for Volcanic Risk of the Italian Civil Protection Department (URL: http://www.mirovaweb.it/); Buenos Aires Volcanic Ash Advisory Center (VAAC), Servicio Meteorológico Nacional-Fuerza Aérea Argentina, 25 de mayo 658, Buenos Aires, Argentina (URL: http://www.smn.gov.ar/vaac/buenosaires/inicio.php?lang=es).
New effusive dome, ash plumes, and crater incandescence during December 2022-February 2023
Láscar, located in the northern Chilean Andes, contains six overlapping summit craters and two major edifices; activity began at the eastern volcano and then shifted to the western cone. Frequent small-to-moderate explosive eruptions have been recorded since the mid-19th century, in addition to periodic larger eruptions that produced ashfall hundreds of kilometers away. The previous eruption during October 2015-April 2017 was characterized by ash plumes, thermal activity, and gas-and-steam emissions. This report covers a new eruption that included an explosion, ash plumes, and thermal activity during December 2022 through February 2023 using information from Chile's Servicio Nacional de Geología y Minería, (SERNAGEOMIN).
Typical activity prior to December 2022 consisted of seismicity, sulfur dioxide emissions, and occasional thermal anomalies. Seismicity during December was characterized by 62 volcano-tectonic (VT)-type events associated with rock fracturing, 165 long period (LP)-type events, and 16 tremor (TR)-type events. Sulfur dioxide emissions data was obtained by the Differential Optical Absorption Spectroscopy (DOAS) equipment located 6 km ESE from the active crater. The average value was 285 ± 46 t/d during 1-15 December and 612 ± 67 t/d during 16-31 December, with a maximum daily value of 1,333 t/d on 26 December. On 10 December an explosion was detected on the N slope of the volcano at 1236 that produced an ash plume that rose 6 km above the crater and drifted SW (figure 47), based on GOES satellite images. Additionally, pyroclastic flows generated near the crater following this event traveled N and SE. Gas-and-steam emissions rose 20-880 m above the crater, accompanied by intermittent nighttime incandescence that was visible 640 m above the crater. A thin layer of ash was deposited to the S, SW, W, and NW. After this explosive event, seismicity gradually declined. On 18 December white gas-and-steam emissions were observed up to 980 m above the crater and nighttime crater incandescence was observed during 25-27 December. SERNAGEOMIN reported that after 19 December activity levels returned to baseline.
|
Figure 47. Webcam image showing an ash plume from Láscar on 10 December 2022 that rose to 6 km above the crater and drifted SW. Courtesy of SERNAGEOMIN (Reporte Especial de Actividad Volcanica (REAV), Region De La Araucania y Los Rios, Volcan Láscar, 10 de diciembre de 2022, 13:18 Hora local). |
Seismicity during January 2023 consisted of 22 VT-type events and 23 LP-type events. Sulfur dioxide emissions data obtained by the DOAS equipment had an average value of 483 ± 74 t/d, with a maximum daily value of 881 t/d on 13 January. Occasional low-level thermal anomalies were detected in satellite images, corresponding to passive degassing from the vents in the summit crater. More frequent and robust gas-and-steam emissions were reported during January compared to previous months, rising as high as 1.4 km above the crater. Starting on 11 January low intensity nighttime incandescence was occasionally observed. A total of 14 thermal anomalies were detected in satellite data during 13-28 January; the intensity of the anomalies increased on 17 January and peaked on 22 January. On 18 January sulfur dioxide emissions had a peak average value of 1,787 t/d. According to SERNAGEOMIN, a low-energy eruptive pulse was detected on 26 January at 2259, which corresponded to incandescent ejecta and an emission plume that likely contained tephra, rising almost 1.9 km above the crater and drifting NW. On 27 January at 2300 the intensity of LP events significantly increased, and crater incandescence was detected. A series of four LP events were recorded at 0015, 0032, 0043, and 0052 on 28 January, which corresponded with emissions that rose 380 m above the crater rim and drifted NW. Minor crater incandescence persisted and gas-and-steam plumes rose as high as 760 m above the crater. Elevated levels of seismicity continued during 28-30 January.
A Skysat image taken on 30 January showed a shallow, effusive, dome-like body that covered 5.3 m2 in the active crater (figure 48). On 31 January the effusive body was measured and had a diameter of 81 m along the minor axis and 93 m along the major axis. By 2 February the dome-like body had grown to cover an area of 6.2 m2 in the active crater, which suggested a growth rate of 308 m2 per day. A low-level reddish gas-and-steam emission rose 200-340 m above the crater rim and drifted SW at 2053 on 4 February. Mostly diffuse gas-and-steam emissions continued throughout the month, generally rising 400-500 m above the crater rim, though during 11-12 February emissions rose as high as 700 m above the crater rim. The average value of sulfur dioxide emissions was 443 t/d measured on 17 February using DOAS equipment and on 20 and 21 February the average value was 21 t/d and 460 t/d, respectively.
|
Figure 48. Satellite image showing the new, growing effusive dome growing in the active crater Láscar taken on 30 January 2023. According to measurements taken on 31 January, the dome had dimensions of 81 x 93 m, covering 5.3 m2. Courtesy of SERNAGEOMIN (Reporte Especial de Actividad Volcanica (REAV), Region De La Araucania y Los Rios, Volcan Láscar, 31 de enero de 2023, 15:00 Hora local). |
Information Contacts: Servicio Nacional de Geología y Minería, (SERNAGEOMIN), Observatorio Volcanológico de Los Andes del Sur (OVDAS), Avda Sta María No. 0104, Santiago, Chile (URL: http://www.sernageomin.cl/).
|
|
||||||||||||||||||||||||||
There is data available for 32 confirmed eruptive periods.
2022 Dec 10 - 2023 Feb 3 ± 1 days Confirmed Eruption (Explosive / Effusive) VEI: 3
| Episode 1 | Eruption (Explosive / Effusive) | ||||||||||||||||||||||||||||||||||
|---|---|---|---|---|---|---|---|---|---|---|---|---|---|---|---|---|---|---|---|---|---|---|---|---|---|---|---|---|---|---|---|---|---|---|
| 2022 Dec 10 - 2023 Feb 3 ± 1 days | Evidence from Observations: Reported | |||||||||||||||||||||||||||||||||
|
List of 5 Events for Episode 1
|
||||||||||||||||||||||||||||||||||
2015 Oct 30 - 2017 Apr 2 ± 1 days Confirmed Eruption (Explosive / Effusive) VEI: 2
| Episode 1 | Eruption (Explosive / Effusive) | Summit craters | |||||||||||||||||||||||||||||||||||||||||||
|---|---|---|---|---|---|---|---|---|---|---|---|---|---|---|---|---|---|---|---|---|---|---|---|---|---|---|---|---|---|---|---|---|---|---|---|---|---|---|---|---|---|---|---|---|
| 2015 Oct 30 - 2017 Apr 2 ± 1 days | Evidence from Observations: Reported | |||||||||||||||||||||||||||||||||||||||||||
|
List of 7 Events for Episode 1 at Summit craters
|
||||||||||||||||||||||||||||||||||||||||||||
2013 Apr 2 - 2013 Nov 20 Confirmed Eruption (Explosive / Effusive) VEI: 1
| Episode 1 | Eruption (Explosive / Effusive) | Central active crater | |||||||||||||||||||||||||||||||||
|---|---|---|---|---|---|---|---|---|---|---|---|---|---|---|---|---|---|---|---|---|---|---|---|---|---|---|---|---|---|---|---|---|---|---|
| 2013 Apr 2 - 2013 Apr 4 | Evidence from Observations: Reported | |||||||||||||||||||||||||||||||||
|
List of 5 Events for Episode 1 at Central active crater
|
||||||||||||||||||||||||||||||||||
| Episode 2 | Eruption (Explosive / Effusive) | Central active crater | |||||||||||||||||||||||
|---|---|---|---|---|---|---|---|---|---|---|---|---|---|---|---|---|---|---|---|---|---|---|---|---|
| 2013 Jul 1 - 2013 Jul 17 | Evidence from Observations: Reported | |||||||||||||||||||||||
|
List of 3 Events for Episode 2 at Central active crater
|
||||||||||||||||||||||||
| Episode 3 | Eruption (Explosive / Effusive) | Central active crater | |||||||||||||||||||||||
|---|---|---|---|---|---|---|---|---|---|---|---|---|---|---|---|---|---|---|---|---|---|---|---|---|
| 2013 Oct 1 - 2013 Nov 20 | Evidence from Observations: Reported | |||||||||||||||||||||||
|
List of 3 Events for Episode 3 at Central active crater
|
||||||||||||||||||||||||
2006 Apr 18 - 2007 Jul 18 (?) Confirmed Eruption (Explosive / Effusive) VEI: 3
| Episode 1 | Eruption (Explosive / Effusive) | |||||||||||||||||||||||||||||
|---|---|---|---|---|---|---|---|---|---|---|---|---|---|---|---|---|---|---|---|---|---|---|---|---|---|---|---|---|---|
| 2006 Apr 18 - 2007 Jul 18 (?) | Evidence from Observations: Reported | ||||||||||||||||||||||||||||
|
List of 4 Events for Episode 1
|
|||||||||||||||||||||||||||||
2005 May 4 - 2005 May 4 Confirmed Eruption (Explosive / Effusive) VEI: 3 (?)
| Episode 1 | Eruption (Explosive / Effusive) | ||||||||||||||||||||||||
|---|---|---|---|---|---|---|---|---|---|---|---|---|---|---|---|---|---|---|---|---|---|---|---|---|
| 2005 May 4 - 2005 May 4 | Evidence from Observations: Reported | |||||||||||||||||||||||
|
List of 3 Events for Episode 1
|
||||||||||||||||||||||||
[ 2003 Dec 9 - 2003 Dec 9 ] Uncertain Eruption
| Episode 1 | Eruption (Explosive / Effusive) | ||||||||||||||||||||||||
|---|---|---|---|---|---|---|---|---|---|---|---|---|---|---|---|---|---|---|---|---|---|---|---|---|
| 2003 Dec 9 - 2003 Dec 9 | Evidence from Unknown | |||||||||||||||||||||||
|
List of 3 Events for Episode 1
|
||||||||||||||||||||||||
2002 Oct 26 - 2002 Oct 27 Confirmed Eruption (Explosive / Effusive) VEI: 2
| Episode 1 | Eruption (Explosive / Effusive) | ||||||||||||||||||||||||
|---|---|---|---|---|---|---|---|---|---|---|---|---|---|---|---|---|---|---|---|---|---|---|---|---|
| 2002 Oct 26 - 2002 Oct 27 | Evidence from Observations: Reported | |||||||||||||||||||||||
|
List of 3 Events for Episode 1
|
||||||||||||||||||||||||
[ 2001 May 17 (?) - 2001 Jul 5 (?) ] Uncertain Eruption
| Episode 1 | Eruption (Explosive / Effusive) | ||||
|---|---|---|---|---|
| 2001 May 17 (?) - 2001 Jul 5 (?) | Evidence from Unknown | |||
2000 Jul 20 - 2001 Jan 18 (?) Confirmed Eruption (Explosive / Effusive) VEI: 2
| Episode 1 | Eruption (Explosive / Effusive) | |||||||||||||||||||||||||||||||||||||||||||||||||
|---|---|---|---|---|---|---|---|---|---|---|---|---|---|---|---|---|---|---|---|---|---|---|---|---|---|---|---|---|---|---|---|---|---|---|---|---|---|---|---|---|---|---|---|---|---|---|---|---|---|
| 2000 Jul 20 - 2001 Jan 18 (?) | Evidence from Observations: Reported | ||||||||||||||||||||||||||||||||||||||||||||||||
|
List of 8 Events for Episode 1
|
|||||||||||||||||||||||||||||||||||||||||||||||||
1996 Oct 18 - 1996 Oct 18 Confirmed Eruption (Explosive / Effusive) VEI: 2
| Episode 1 | Eruption (Explosive / Effusive) | |||||||||||||||||||
|---|---|---|---|---|---|---|---|---|---|---|---|---|---|---|---|---|---|---|---|
| 1996 Oct 18 - 1996 Oct 18 | Evidence from Observations: Reported | ||||||||||||||||||
|
List of 2 Events for Episode 1
|
|||||||||||||||||||
1994 Nov 13 - 1995 Jul 20 Confirmed Eruption (Explosive / Effusive) VEI: 2
| Episode 1 | Eruption (Explosive / Effusive) | |||||||||||||||||||||||||||||
|---|---|---|---|---|---|---|---|---|---|---|---|---|---|---|---|---|---|---|---|---|---|---|---|---|---|---|---|---|---|
| 1994 Nov 13 - 1995 Jul 20 | Evidence from Observations: Reported | ||||||||||||||||||||||||||||
|
List of 4 Events for Episode 1
|
|||||||||||||||||||||||||||||
1994 Jul 20 - 1994 Jul 26 Confirmed Eruption (Explosive / Effusive) VEI: 2
| Episode 1 | Eruption (Explosive / Effusive) | ||||||||||||||||||||||||
|---|---|---|---|---|---|---|---|---|---|---|---|---|---|---|---|---|---|---|---|---|---|---|---|---|
| 1994 Jul 20 - 1994 Jul 26 | Evidence from Observations: Reported | |||||||||||||||||||||||
|
List of 3 Events for Episode 1
|
||||||||||||||||||||||||
1993 Dec 17 - 1994 Feb 27 Confirmed Eruption (Explosive / Effusive) VEI: 2
| Episode 1 | Eruption (Explosive / Effusive) | ||||||||||||||||||||||||||||||||||
|---|---|---|---|---|---|---|---|---|---|---|---|---|---|---|---|---|---|---|---|---|---|---|---|---|---|---|---|---|---|---|---|---|---|---|
| 1993 Dec 17 - 1994 Feb 27 | Evidence from Observations: Reported | |||||||||||||||||||||||||||||||||
|
List of 5 Events for Episode 1
|
||||||||||||||||||||||||||||||||||
1993 Jan 30 - 1993 Aug 16 ± 15 days Confirmed Eruption (Explosive / Effusive) VEI: 4
| Episode 1 | Eruption (Explosive / Effusive) | Western crater of east summit cone | |||||||||||||||||||||||||||||||||||||||||||||||||||||||||||||||
|---|---|---|---|---|---|---|---|---|---|---|---|---|---|---|---|---|---|---|---|---|---|---|---|---|---|---|---|---|---|---|---|---|---|---|---|---|---|---|---|---|---|---|---|---|---|---|---|---|---|---|---|---|---|---|---|---|---|---|---|---|---|---|---|---|
| 1993 Jan 30 - 1993 Aug 16 ± 15 days | Evidence from Observations: Reported | |||||||||||||||||||||||||||||||||||||||||||||||||||||||||||||||
|
List of 11 Events for Episode 1 at Western crater of east summit cone
|
||||||||||||||||||||||||||||||||||||||||||||||||||||||||||||||||
1991 Oct 21 - 1992 May 23 (?) Confirmed Eruption (Explosive / Effusive) VEI: 2
| Episode 1 | Eruption (Explosive / Effusive) | ||||||||||||||||||||||||||||||||||
|---|---|---|---|---|---|---|---|---|---|---|---|---|---|---|---|---|---|---|---|---|---|---|---|---|---|---|---|---|---|---|---|---|---|---|
| 1991 Oct 21 - 1992 May 23 (?) | Evidence from Observations: Reported | |||||||||||||||||||||||||||||||||
|
List of 5 Events for Episode 1
|
||||||||||||||||||||||||||||||||||
1990 Nov 24 - 1990 Nov 24 Confirmed Eruption (Explosive / Effusive) VEI: 1
| Episode 1 | Eruption (Explosive / Effusive) | ||||||||||||||||||||||||
|---|---|---|---|---|---|---|---|---|---|---|---|---|---|---|---|---|---|---|---|---|---|---|---|---|
| 1990 Nov 24 - 1990 Nov 24 | Evidence from Observations: Reported | |||||||||||||||||||||||
|
List of 3 Events for Episode 1
|
||||||||||||||||||||||||
1987 Nov 16 (on or before) ± 15 days - 1990 Apr 6 Confirmed Eruption (Explosive / Effusive) VEI: 3
| Episode 1 | Eruption (Explosive / Effusive) | Western crater of east summit cone | ||||||||||||||||||||||||||||||||||||||||||||||||||||||||||||||||||||
|---|---|---|---|---|---|---|---|---|---|---|---|---|---|---|---|---|---|---|---|---|---|---|---|---|---|---|---|---|---|---|---|---|---|---|---|---|---|---|---|---|---|---|---|---|---|---|---|---|---|---|---|---|---|---|---|---|---|---|---|---|---|---|---|---|---|---|---|---|---|
| 1987 Nov 16 (on or before) ± 15 days - 1990 Apr 6 | Evidence from Observations: Reported | ||||||||||||||||||||||||||||||||||||||||||||||||||||||||||||||||||||
|
List of 12 Events for Episode 1 at Western crater of east summit cone
|
|||||||||||||||||||||||||||||||||||||||||||||||||||||||||||||||||||||
1986 Sep 14 - 1986 Sep 16 Confirmed Eruption (Explosive / Effusive) VEI: 3
| Episode 1 | Eruption (Explosive / Effusive) | Western crater of east summit cone | ||||||||||||||||||||||||||||||||||||||
|---|---|---|---|---|---|---|---|---|---|---|---|---|---|---|---|---|---|---|---|---|---|---|---|---|---|---|---|---|---|---|---|---|---|---|---|---|---|---|---|
| 1986 Sep 14 - 1986 Sep 16 | Evidence from Observations: Reported | ||||||||||||||||||||||||||||||||||||||
|
List of 6 Events for Episode 1 at Western crater of east summit cone
|
|||||||||||||||||||||||||||||||||||||||
1984 Dec 16 ± 15 days - 1985 Jul 16 ± 15 days Confirmed Eruption (Explosive / Effusive) VEI: 0
| Episode 1 | Eruption (Explosive / Effusive) | Western crater of east summit cone | ||||||||||||||||||
|---|---|---|---|---|---|---|---|---|---|---|---|---|---|---|---|---|---|---|---|
| 1984 Dec 16 ± 15 days - 1985 Jul 16 ± 15 days | Evidence from Observations: Reported | ||||||||||||||||||
|
List of 2 Events for Episode 1 at Western crater of east summit cone
|
|||||||||||||||||||
[ 1974 Jul 16 ± 15 days - 1974 Sep 16 ± 15 days ] Uncertain Eruption
| Episode 1 | Eruption (Explosive / Effusive) | ||||||||||||||||||||||||
|---|---|---|---|---|---|---|---|---|---|---|---|---|---|---|---|---|---|---|---|---|---|---|---|---|
| 1974 Jul 16 ± 15 days - 1974 Sep 16 ± 15 days | Evidence from Unknown | |||||||||||||||||||||||
|
List of 3 Events for Episode 1
|
||||||||||||||||||||||||
[ 1972 Jul 2 ± 182 days ] Uncertain Eruption
| Episode 1 | Eruption (Explosive / Effusive) | ||||||||||||||||||||||||
|---|---|---|---|---|---|---|---|---|---|---|---|---|---|---|---|---|---|---|---|---|---|---|---|---|
| 1972 Jul 2 ± 182 days - Unknown | Evidence from Unknown | |||||||||||||||||||||||
|
List of 3 Events for Episode 1
|
||||||||||||||||||||||||
1969 May 16 Confirmed Eruption (Explosive / Effusive) VEI: 1
| Episode 1 | Eruption (Explosive / Effusive) | ||||||||||||||
|---|---|---|---|---|---|---|---|---|---|---|---|---|---|---|
| 1969 May 16 - Unknown | Evidence from Observations: Reported | |||||||||||||
|
List of 1 Events for Episode 1
|
||||||||||||||
1959 Nov 16 ± 15 days - 1968 Jan 31 (on or after) Confirmed Eruption (Explosive / Effusive) VEI: 2
| Episode 1 | Eruption (Explosive / Effusive) | ||||||||||||||||||||||||||||||||||||||||||||
|---|---|---|---|---|---|---|---|---|---|---|---|---|---|---|---|---|---|---|---|---|---|---|---|---|---|---|---|---|---|---|---|---|---|---|---|---|---|---|---|---|---|---|---|---|
| 1959 Nov 16 ± 15 days - 1968 Jan 31 (on or after) | Evidence from Observations: Reported | |||||||||||||||||||||||||||||||||||||||||||
|
List of 7 Events for Episode 1
|
||||||||||||||||||||||||||||||||||||||||||||
1954 Jun 16 ± 15 days - 1954 Jul 16 ± 15 days Confirmed Eruption (Explosive / Effusive) VEI: 2 (?)
| Episode 1 | Eruption (Explosive / Effusive) | ||||||||||||||
|---|---|---|---|---|---|---|---|---|---|---|---|---|---|---|
| 1954 Jun 16 ± 15 days - 1954 Jul 16 ± 15 days | Evidence from Observations: Reported | |||||||||||||
|
List of 1 Events for Episode 1
|
||||||||||||||
1951 Nov 16 ± 15 days - 1952 Feb 19 Confirmed Eruption (Explosive / Effusive) VEI: 2 (?)
| Episode 1 | Eruption (Explosive / Effusive) | East summit crater | ||||||||||||||||||
|---|---|---|---|---|---|---|---|---|---|---|---|---|---|---|---|---|---|---|---|
| 1951 Nov 16 ± 15 days - 1952 Feb 19 | Evidence from Observations: Reported | ||||||||||||||||||
|
List of 2 Events for Episode 1 at East summit crater
|
|||||||||||||||||||
1940 Confirmed Eruption (Explosive / Effusive) VEI: 2
| Episode 1 | Eruption (Explosive / Effusive) | ||||||||||||||||||||||||
|---|---|---|---|---|---|---|---|---|---|---|---|---|---|---|---|---|---|---|---|---|---|---|---|---|
| 1940 - Unknown | Evidence from Observations: Reported | |||||||||||||||||||||||
|
List of 3 Events for Episode 1
|
||||||||||||||||||||||||
1933 Oct 9 - 1933 Dec Confirmed Eruption (Explosive / Effusive) VEI: 2
| Episode 1 | Eruption (Explosive / Effusive) | ||||||||||||||||||||||||
|---|---|---|---|---|---|---|---|---|---|---|---|---|---|---|---|---|---|---|---|---|---|---|---|---|
| 1933 Oct 9 - 1933 Dec | Evidence from Observations: Reported | |||||||||||||||||||||||
|
List of 3 Events for Episode 1
|
||||||||||||||||||||||||
1902 Confirmed Eruption (Explosive / Effusive) VEI: 2 (?)
| Episode 1 | Eruption (Explosive / Effusive) | |||||||||||||||||||
|---|---|---|---|---|---|---|---|---|---|---|---|---|---|---|---|---|---|---|---|
| 1902 - Unknown | Evidence from Observations: Reported | ||||||||||||||||||
|
List of 2 Events for Episode 1
|
|||||||||||||||||||
1898 - 1900 (?) Confirmed Eruption (Explosive / Effusive) VEI: 2
| Episode 1 | Eruption (Explosive / Effusive) | ||||||||||||||||||||||||
|---|---|---|---|---|---|---|---|---|---|---|---|---|---|---|---|---|---|---|---|---|---|---|---|---|
| 1898 - 1900 (?) | Evidence from Observations: Reported | |||||||||||||||||||||||
|
List of 3 Events for Episode 1
|
||||||||||||||||||||||||
1883 - 1885 Confirmed Eruption (Explosive / Effusive) VEI: 2
| Episode 1 | Eruption (Explosive / Effusive) | ||||||||||||||||||||||||
|---|---|---|---|---|---|---|---|---|---|---|---|---|---|---|---|---|---|---|---|---|---|---|---|---|
| 1883 - 1885 | Evidence from Observations: Reported | |||||||||||||||||||||||
|
List of 3 Events for Episode 1
|
||||||||||||||||||||||||
1875 Confirmed Eruption (Explosive / Effusive) VEI: 2
| Episode 1 | Eruption (Explosive / Effusive) | ||||||||||||||||||||||||
|---|---|---|---|---|---|---|---|---|---|---|---|---|---|---|---|---|---|---|---|---|---|---|---|---|
| 1875 - Unknown | Evidence from Observations: Reported | |||||||||||||||||||||||
|
List of 3 Events for Episode 1
|
||||||||||||||||||||||||
1858 Apr - 1858 Dec Confirmed Eruption (Explosive / Effusive) VEI: 2 (?)
| Episode 1 | Eruption (Explosive / Effusive) | |||||||||||||||||||
|---|---|---|---|---|---|---|---|---|---|---|---|---|---|---|---|---|---|---|---|
| 1858 Apr - 1858 Dec | Evidence from Observations: Reported | ||||||||||||||||||
|
List of 2 Events for Episode 1
|
|||||||||||||||||||
1854 Jan 20 - 1854 Jan 30 Confirmed Eruption (Explosive / Effusive) VEI: 1
| Episode 1 | Eruption (Explosive / Effusive) | Lascar or Aguas Calientes | ||||||||||||||||||
|---|---|---|---|---|---|---|---|---|---|---|---|---|---|---|---|---|---|---|---|
| 1854 Jan 20 - 1854 Jan 30 | Evidence from Observations: Reported | ||||||||||||||||||
|
List of 2 Events for Episode 1 at Lascar or Aguas Calientes
|
|||||||||||||||||||
[ 1853 ] Uncertain Eruption
| Episode 1 | Eruption (Explosive / Effusive) | ||||||||||||||
|---|---|---|---|---|---|---|---|---|---|---|---|---|---|---|
| 1853 - Unknown | Evidence from Unknown | |||||||||||||
|
List of 1 Events for Episode 1
|
||||||||||||||
1848 Confirmed Eruption (Explosive / Effusive) VEI: 2
| Episode 1 | Eruption (Explosive / Effusive) | Lascar or Agua Calientes | |||||||||||||||||||||||
|---|---|---|---|---|---|---|---|---|---|---|---|---|---|---|---|---|---|---|---|---|---|---|---|---|
| 1848 - Unknown | Evidence from Observations: Reported | |||||||||||||||||||||||
|
List of 3 Events for Episode 1 at Lascar or Agua Calientes
|
||||||||||||||||||||||||
5150 BCE ± 1250 years Confirmed Eruption (Explosive / Effusive) VEI: 0
| Episode 1 | Eruption (Explosive / Effusive) | Eastern crater, Tumbres-Talabre lava flow | ||||||||||||||||||
|---|---|---|---|---|---|---|---|---|---|---|---|---|---|---|---|---|---|---|---|
| 5150 BCE ± 1250 years - Unknown | Evidence from Isotopic: Cosmic Ray Exposure | ||||||||||||||||||
|
List of 2 Events for Episode 1 at Eastern crater, Tumbres-Talabre lava flow
|
|||||||||||||||||||
7250 BCE (?) Confirmed Eruption (Explosive / Effusive)
| Episode 1 | Eruption (Explosive / Effusive) | Lascar II (Tumbres scoria flow) | |||||||||||||||||||||||
|---|---|---|---|---|---|---|---|---|---|---|---|---|---|---|---|---|---|---|---|---|---|---|---|---|
| 7250 BCE (?) - Unknown | Evidence from Isotopic: 14C (uncalibrated) | |||||||||||||||||||||||
|
List of 3 Events for Episode 1 at Lascar II (Tumbres scoria flow)
|
||||||||||||||||||||||||
This compilation of synonyms and subsidiary features may not be comprehensive. Features are organized into four major categories: Cones, Craters, Domes, and Thermal Features. Synonyms of features appear indented below the primary name. In some cases additional feature type, elevation, or location details are provided.
Synonyms |
||||
| Laskar | Kar, Las | Illascar | Hlascar | Toconado | Toconao | ||||
Cones |
||||
| Feature Name | Feature Type | Elevation | Latitude | Longitude |
| Aguas Calientes
Simba, Volcan |
Stratovolcano | 5924 m | 23° 22' 0.00" S | 67° 41' 0.00" W |
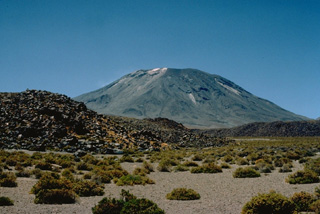 The blocky lava flow in the foreground is one of several young flows on the NW flank of Láscar volcano. The most prominent flow traveled down the north flank and extended 6 km to the NW. Láscar, northern Chile's most active volcano, has produced frequent explosive eruptions since its first recorded historical eruption in the mid-19th century. Recent eruptions have included lava dome growth in the summit crater.
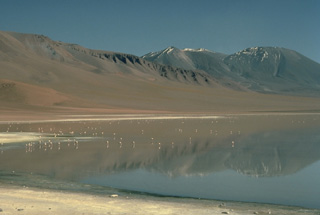 The elongated summit ridge of Láscar volcano (right) rises above a flock of flamingos in Laguna Lejía. Láscar is at the western end of an E-W-oriented volcanic complex that includes Volcán Aguas Calientes, out of view to the right. Six overlapping craters occupy the summit ridge of Láscar. The presently active crater, near the center horizon of this photo from the SE, has recently produced explosive eruptions accompanied by growth of a lava dome.
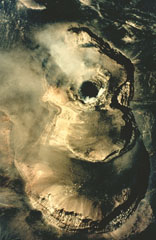 A vertical aerial photograph shows a growing lava dome in the summit of Láscar volcano on March 20, 1992. Three of six summit craters located along an E-W trend are seen in this photo, with north to the top. The lava dome (the dark steaming mass at left center) was first seen on March 4, but may have formed earlier following phreatic explosive eruptions in October 1991. Eruption plumes were visible beginning in late March. Ashfall occurred on May 15 and night glow visible May 21-23 marked the last reported activity of the 1991-92 eruption.
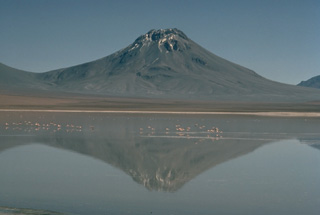 Symmetrical Volcán Aguas Calientes, also known as Simba, is a twin volcano of Láscar. It is seen here from the south as a backdrop to Laguna Lejía, renowned for its flamingos, with the slopes of Láscar at the extreme left. Aguas Calientes is at the eastern end of a short E-W volcanic chain that includes the historically active Láscar volcano on the west. A shallow lake occupies the well-preserved summit crater of Aguas Calientes. The thick lava flows at the summit are considered to be of Holocene age.
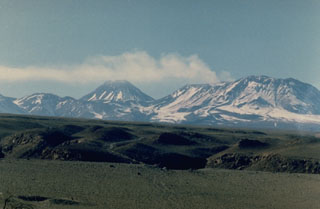 Volcán Láscar (right) is the most active volcano of the northern Chilean Andes. A steam plume rises in 1986 from one of six overlapping summit craters capping the andesitic-to-dacitic stratovolcano, which is seen here from Toconao to the NW. Volcán Aguas Calientes (left center), an older, higher stratovolcano 5 km to the east, displays a well-developed summit crater and a probable Holocene lava flow near its summit. Frequent explosive eruptions have been recorded from Láscar since the mid-19th century.
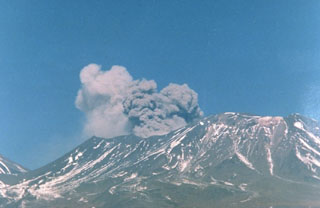 A brownish, ash-laden plume rises a few hundred m above Láscar volcano at about 1430 hrs on September 14, 1986. The plume, seen here from Toconao, 33 km NW, preceded much larger explosions on September 16. The saddle between Láscar and Aguas Calientes volcano is at the far left.
 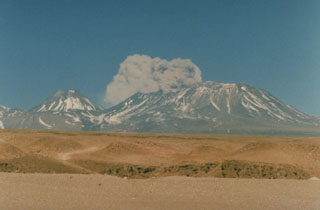 The onset of a brief explosive eruption from Láscar volcano is seen here at about 1430 hrs on September 14, 1986, from Toconao, 33 km NW. The September 14 eruption produced ash clouds that rose a few hundred m above the vent for about a half hour. Similar activity on the 15th was followed by a brief, but powerful explosion on the 16th that deposited ash in Salta, Argentina, 350 km to the SE. Conical Volcán Aguas Calientes rises to the left of the plume.
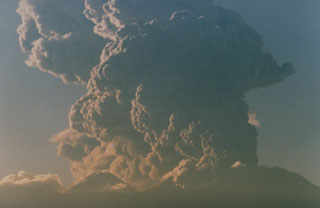 Following minor eruptions on September 14 and 15, 1986, a strong explosive eruption from Láscar volcano on September 16 deposited ash 350 km away at Salta, Argentina. The eruption cloud, seen here at about 7:30 a.m. from Toconao, 33 km to the NW, rose to 15 km altitude (about 9 km above the vent), producing an ash column that dispersed to the SE. The plume was traced on satellite imagery to about 400 km downwind and covered an area of more than 112,000 km2. The brief eruption ended on the 16th.
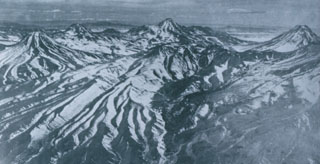 Colachi (left) is an andesitic-dacitic stratovolcano whose most recent activity produced pristine silicic lava flows of probable Holocene age. The largest of these covers a 7 km2 area on the saddle between Colachi and the neighboring volcano of Acamarachi (center horizon). This aerial view from the west also shows the conical peak of Aguas Calientes (far right), a twin volcano of Lascar volcano, whose slopes appear at the lower right. The Talabre valley in the center foreground is partially filled by an andesitic lava flow from Lascar.
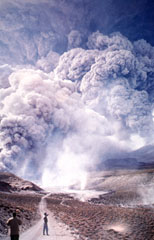 A pyroclastic flow descends the quebrada of Tumbre, north of Lascar at 0930 hours on April 20, 1993. A plinian eruption April 18-20 was the largest from Láscar in historical time. Pyroclastic flows containing white pumice, dark scoria, compositionally banded pumice, and dense blocks from the summit lava dome traveled as far as 8.5 km down the NW, NE, and SE flanks.
 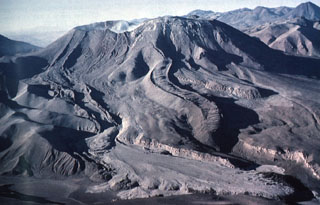 The lava flow with prominent lateral levees extending from the far left (eastern) side of the summit crater of Láscar is the Tumbres-Talabre lava flow. This flow was erupted about 7100 years ago and descended 8 km down the NW flank of the volcano. The distal part of the lava flow is overlain by light-colored pyroclastic-flow deposits in the foreground that originated during an eruption on April 19, 1993. Another steep-sided viscous lava flow with pronounced lateral levees is visible in the center of the photo.
 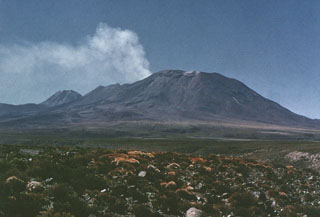 A strong plume of steam and sulfurous gases rises above the crater of Láscar volcano prior to the 1986 eruption. Thermal anomalies detected on Thematic Mapper satellite images between December 1984 and July 1985 may have originated from a lava lake or lava dome in the summit crater, although there were no direct observations prior to the 1986 eruption. Aguas Calientes volcano appears on the left horizon in this view from the NW.
 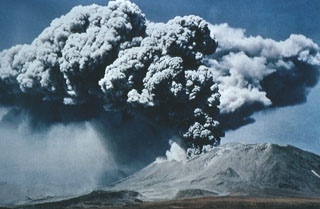 A powerful explosive eruption from Láscar volcano in northern Chile on April 19, 1993 produced an eruption column that rose to a maximum of 17 km altitude (12 km above the vent). The violent explosion of the dome inside the active crater of Láscar generated pyroclastic flows down the NE side that reached the Bofeladas de Tumbre. Plinian explosions on April 18-20 followed phreatomagmatic eruptions that began on January 30. Small explosions continued until May 8, and another eruption occurred on an unknown day in August.
 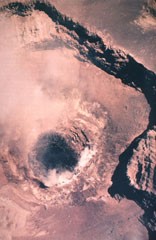 A vertical aerial view into the summit crater of Láscar shows a dark-colored dacitic lava dome that was extruded inside the active crater between February and December 1989. Ash eruptions had begun earlier in late 1987 and had continued in 1988. The active lava dome was observed in February and April 1989, and the dome was observed to be deflated in October 1989. An explosive eruption on February 20, 1990 destroyed 10-30% of the summit crater lava dome and produced an 8-km-high ash cloud.
 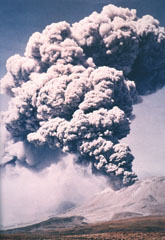 Major explosions April 19-20, 1993 produced eruption plumes that rose to 15 to 25 km altitude (10-15 km above the summit crater). The eruption was accompanied by pyroclastic flows that traveled as far as 8.5 km to the NW, NE, and SE. Ashfall occurred over large areas as far away as Paraguay, Uruguay, Brazil, and Argentina (including Buenos Aires, 1500 km to the SE). The eruption was the largest in historical time at Láscar, ejecting more than 0.1 cu km of tephra.
 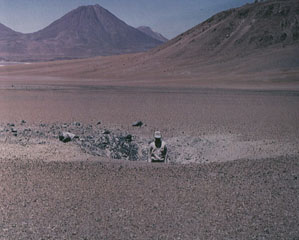 This impact crater, 6 m wide and 1.5 m deep was produced by ejection of a 1.5 cu m ballistic block that traveled 5 km from the summit crater of Láscar (out of view to the right). An explosive eruption on February 20, 1990 destroyed 10-30% of the summit crater lava dome that had been emplaced in 1989 and produced an 18-km-high ash cloud. Aguas Calientes volcano rises on the horizon.
  An ash plume rises above Láscar volcano on October 27, 2002, as seen from Pozo Tres, 60 km to the NW. Minor ash eruptions had been observed on 3 occasions at five-minute intervals on October 26, producing plumes that rose about 300 m above the summit crater. On the 27th two explosions were observed; the plume from the 2nd explosion reached at least 1.5 km above the crater.
 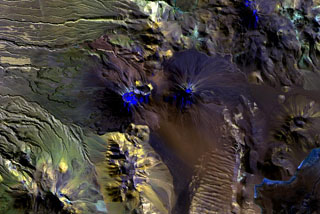 Multiple craters truncate the summit of Láscar volcano (left of center), and prominent lava flow levees are visible on its western flank. To the east is the symmetrical cone of Láscar's higher twin volcano, Aguas Caliente (right of center), with its smaller circular summit crater that contains a shallow lake. The most recent activity at this E-W-trending volcanic chain originated from Láscar volcano and continued into historical time.
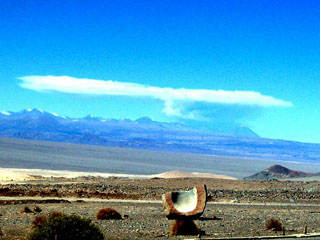 An eruption plume rises above Lascar on 18 April 2006 as photographed from El Abra copper mine, 220 km NW. The plume rose a maximum height of about 10 km. Intermittent ash eruptions continued until July 2007.
The following 25 samples associated with this volcano can be found in the Smithsonian's NMNH Department of Mineral Sciences collections, and may be availble for research (contact the Rock and Ore Collections Manager). Catalog number links will open a window with more information.
| Catalog Number | Sample Description | Lava Source | Collection Date |
|---|---|---|---|
| NMNH 116877-1 | Andesite | -- | -- |
| NMNH 116877-10 | Andesite Pumice | -- | -- |
| NMNH 116877-11 | Andesite | -- | -- |
| NMNH 116877-12 | Pumice | -- | -- |
| NMNH 116877-2 | Andesite | -- | -- |
| NMNH 116877-3 | Dacite | -- | -- |
| NMNH 116877-4 | Dacitic Pumice | -- | -- |
| NMNH 116877-5 | Dacitic Pumice | -- | -- |
| NMNH 116877-6 | Andesite | -- | -- |
| NMNH 116877-7 | Dacitic Pumice | -- | -- |
| NMNH 116877-8 | Dacite | -- | -- |
| NMNH 116877-9 | Andesite | -- | -- |
| NMNH 117577-1 | Andesite | -- | -- |
| NMNH 117577-10 | Pyroxene-Hornblende Dacite | -- | -- |
| NMNH 117577-11 | Andesite | -- | -- |
| NMNH 117577-12 | Andesite Pumice | -- | -- |
| NMNH 117577-13 | Pyroxenitic Pumice | -- | -- |
| NMNH 117577-2 | Dacitic Pumice | -- | -- |
| NMNH 117577-3 | Dacitic Pumice | -- | -- |
| NMNH 117577-4 | Andesite Pumice | -- | -- |
| NMNH 117577-5 | Olivine Basalt Andesite | -- | -- |
| NMNH 117577-6 | Andesite | -- | -- |
| NMNH 117577-7 | Dacite | -- | -- |
| NMNH 117577-8 | Mafic Inclusion | -- | -- |
| NMNH 117577-9 | Dacitic Pumice | -- | -- |
| Copernicus Browser | The Copernicus Browser replaced the Sentinel Hub Playground browser in 2023, to provide access to Earth observation archives from the Copernicus Data Space Ecosystem, the main distribution platform for data from the EU Copernicus missions. |
| MIROVA | Middle InfraRed Observation of Volcanic Activity (MIROVA) is a near real time volcanic hot-spot detection system based on the analysis of MODIS (Moderate Resolution Imaging Spectroradiometer) data. In particular, MIROVA uses the Middle InfraRed Radiation (MIR), measured over target volcanoes, in order to detect, locate and measure the heat radiation sourced from volcanic activity. |
| MODVOLC Thermal Alerts | Using infrared satellite Moderate Resolution Imaging Spectroradiometer (MODIS) data, scientists at the Hawai'i Institute of Geophysics and Planetology, University of Hawai'i, developed an automated system called MODVOLC to map thermal hot-spots in near real time. For each MODIS image, the algorithm automatically scans each 1 km pixel within it to check for high-temperature hot-spots. When one is found the date, time, location, and intensity are recorded. MODIS looks at every square km of the Earth every 48 hours, once during the day and once during the night, and the presence of two MODIS sensors in space allows at least four hot-spot observations every two days. Each day updated global maps are compiled to display the locations of all hot spots detected in the previous 24 hours. There is a drop-down list with volcano names which allow users to 'zoom-in' and examine the distribution of hot-spots at a variety of spatial scales. |
|
WOVOdat
Single Volcano View Temporal Evolution of Unrest Side by Side Volcanoes |
WOVOdat is a database of volcanic unrest; instrumentally and visually recorded changes in seismicity, ground deformation, gas emission, and other parameters from their normal baselines. It is sponsored by the World Organization of Volcano Observatories (WOVO) and presently hosted at the Earth Observatory of Singapore.
GVMID Data on Volcano Monitoring Infrastructure The Global Volcano Monitoring Infrastructure Database GVMID, is aimed at documenting and improving capabilities of volcano monitoring from the ground and space. GVMID should provide a snapshot and baseline view of the techniques and instrumentation that are in place at various volcanoes, which can be use by volcano observatories as reference to setup new monitoring system or improving networks at a specific volcano. These data will allow identification of what monitoring gaps exist, which can be then targeted by remote sensing infrastructure and future instrument deployments. |
| Volcanic Hazard Maps | The IAVCEI Commission on Volcanic Hazards and Risk has a Volcanic Hazard Maps database designed to serve as a resource for hazard mappers (or other interested parties) to explore how common issues in hazard map development have been addressed at different volcanoes, in different countries, for different hazards, and for different intended audiences. In addition to the comprehensive, searchable Volcanic Hazard Maps Database, this website contains information about diversity of volcanic hazard maps, illustrated using examples from the database. This site is for educational purposes related to volcanic hazard maps. Hazard maps found on this website should not be used for emergency purposes. For the most recent, official hazard map for a particular volcano, please seek out the proper institutional authorities on the matter. |
| IRIS seismic stations/networks | Incorporated Research Institutions for Seismology (IRIS) Data Services map showing the location of seismic stations from all available networks (permanent or temporary) within a radius of 0.18° (about 20 km at mid-latitudes) from the given location of Láscar. Users can customize a variety of filters and options in the left panel. Note that if there are no stations are known the map will default to show the entire world with a "No data matched request" error notice. |
| UNAVCO GPS/GNSS stations | Geodetic Data Services map from UNAVCO showing the location of GPS/GNSS stations from all available networks (permanent or temporary) within a radius of 20 km from the given location of Láscar. Users can customize the data search based on station or network names, location, and time window. Requires Adobe Flash Player. |
| DECADE Data | The DECADE portal, still in the developmental stage, serves as an example of the proposed interoperability between The Smithsonian Institution's Global Volcanism Program, the Mapping Gas Emissions (MaGa) Database, and the EarthChem Geochemical Portal. The Deep Earth Carbon Degassing (DECADE) initiative seeks to use new and established technologies to determine accurate global fluxes of volcanic CO2 to the atmosphere, but installing CO2 monitoring networks on 20 of the world's 150 most actively degassing volcanoes. The group uses related laboratory-based studies (direct gas sampling and analysis, melt inclusions) to provide new data for direct degassing of deep earth carbon to the atmosphere. |
| Large Eruptions of Láscar | Information about large Quaternary eruptions (VEI >= 4) is cataloged in the Large Magnitude Explosive Volcanic Eruptions (LaMEVE) database of the Volcano Global Risk Identification and Analysis Project (VOGRIPA). |
| EarthChem | EarthChem develops and maintains databases, software, and services that support the preservation, discovery, access and analysis of geochemical data, and facilitate their integration with the broad array of other available earth science parameters. EarthChem is operated by a joint team of disciplinary scientists, data scientists, data managers and information technology developers who are part of the NSF-funded data facility Integrated Earth Data Applications (IEDA). IEDA is a collaborative effort of EarthChem and the Marine Geoscience Data System (MGDS). |

