MARN reported that seismicity at San Miguel was detected on 23 May and remained elevated. At 1647 on 27 May an explosion generated a gas-and-ash plume that rose 700 m; seismicity decreased afterwards. Sulfur dioxide emissions were as high as 400 tons per day that same day based on measurements from an instrument located on the W flank, and then decreased to 268 and below 100 tons per day on 28 and 29 May, respectively. MARN warned the public to stay at least 3 km away from the crater.
Source: Ministerio de Medio Ambiente y Recursos Naturales (MARN)
Small gas-and-ash explosions during March and May 2023
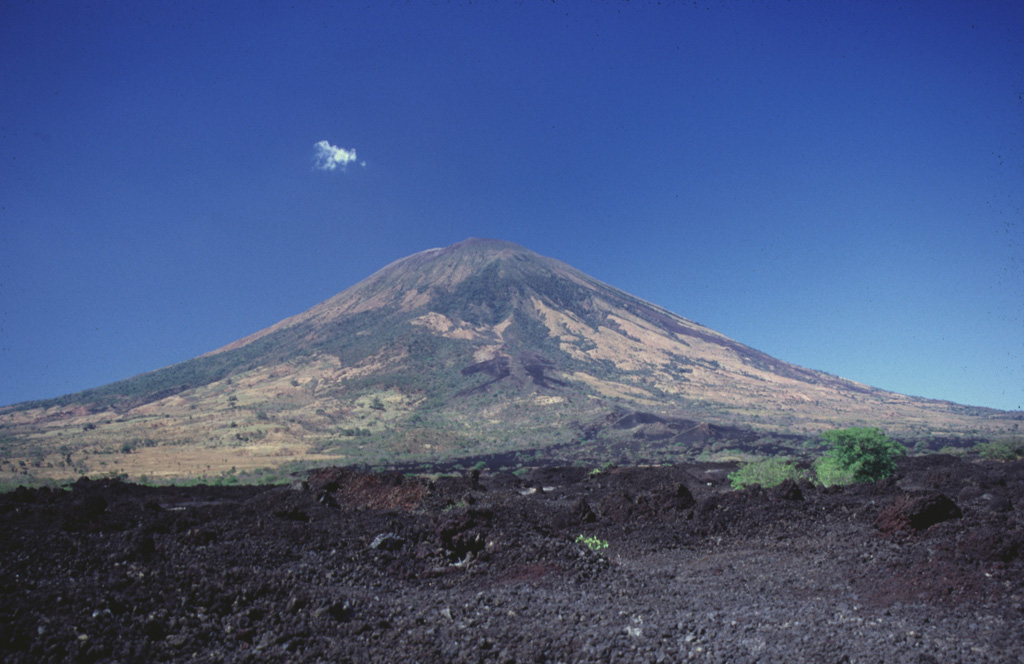
San Miguel in El Salvador is a broad, deep crater complex that has been frequently modified by eruptions recorded since the early 16th century and consists of the summit known locally as Chaparrastique. Flank eruptions have produced lava flows that extended to the N, NE, and SE during the 17-19th centuries. The most recent activity has consisted of minor ash eruptions from the summit crater. The current eruption period began in November 2022 and has been characterized by frequent phreatic explosions, gas-and-ash emissions, and sulfur dioxide plumes (BGVN 47:12). This report describes small gas-and-ash explosions during December 2022 through May 2023 based on special reports from the Ministero de Medio Ambiente y Recursos Naturales (MARN).
Activity has been relatively low since the last recorded explosions on 29 November 2022. Seismicity recorded by the San Miguel Volcano Station (VSM) located on the N flank at 1.7 km elevation had decreased by 7 December. Sulfur dioxide gas measurements taken with DOAS (Differential Optical Absorption Spectroscopy) mobile equipment were below typical previously recorded values: 300 tons per day (t/d). During December, small explosions were recorded by the seismic network and manifested as gas-and-steam emissions.
Gas-and-ash explosions in the crater occurred during January 2023, which were recorded by the seismic network. Sulfur dioxide values remained low, between 300-400 t/d through 10 March. At 0817 on 14 January a gas-and-ash emission was visible in webcam images, rising just above the crater rim. Some mornings during February, small gas-and-steam plumes were visible in the crater. On 7 March at 2252 MARN noted an increase in degassing from the central crater; gas emissions were constantly observed through the early morning hours on 8 March. During the early morning of 8 March through the afternoon on 9 March, 12 emissions were registered, some accompanied by ash. The last gas-and-ash emission was recorded at 1210 on 9 March; very fine ashfall was reported in El Tránsito (10 km S), La Morita (6 km W), and La Piedrita (3 km W). The smell of sulfur was reported in Piedra Azul (5 km SW). On 16 March MARN reported that gas-and-steam emissions decreased.
Low degassing and very low seismicity were reported during April; no explosions have been detected between 9 March and 27 May. The sulfur dioxide emissions remained between 350-400 t/d; during 13-20 April sulfur dioxide values fluctuated between 30-300 t/d. Activity remained low through most of May; on 23 May seismicity increased. An explosion was detected at 1647 on 27 May generated a gas-and-ash plume that rose 700 m high (figure 32); a decrease in seismicity and gas emissions followed. The DOAS station installed on the W flank recorded sulfur dioxide values that reached 400 t/d on 27 May; subsequent measurements showed a decrease to 268 t/d on 28 May and 100 t/d on 29 May.
 |
Figure 32. Webcam image of a gas-and-ash plume rising 700 m above San Miguel at 1652 on 27 May 2023. Courtesy of MARN. |
Information Contacts: Ministero de Medio Ambiente y Recursos Naturales (MARN), Km. 5½ Carretera a Nueva San Salvador, Avenida las Mercedes, San Salvador, El Salvador (URL: http://www.snet.gob.sv/ver/vulcanologia).
2023: January
| March
| May
2022: November
| December
2021: February
2020: February
| March
2018: January
| February
| May
2017: January
| April
| May
2016: January
| June
2015: January
| April
2014: January
| April
| May
| June
| July
| August
2013: December
2011: March
2010: August
2009: July
2006: October
2005: October
2004: February
2002: October
MARN reported that seismicity at San Miguel was detected on 23 May and remained elevated. At 1647 on 27 May an explosion generated a gas-and-ash plume that rose 700 m; seismicity decreased afterwards. Sulfur dioxide emissions were as high as 400 tons per day that same day based on measurements from an instrument located on the W flank, and then decreased to 268 and below 100 tons per day on 28 and 29 May, respectively. MARN warned the public to stay at least 3 km away from the crater.
Source: Ministerio de Medio Ambiente y Recursos Naturales (MARN)
On 16 March MARN reported that gas emissions at San Miguel had decreased in the past few days and noted that gas-and-ash plumes were last observed on 9 March.
Source: Ministerio de Medio Ambiente y Recursos Naturales (MARN)
MARN reported increased emissions at San Miguel during 7-9 March. Gas emissions began increasing along with seismicity at 2252 on 7 March and were continuous at least through the morning of 8 March. A total of 12 emissions were recorded, with the last one occurring at 1210 on 9 March. Some of the gas emissions contained ash, with the most intense period causing minor ashfall in El Tránsito (10 km S), La Morita (6 km W), and La Piedrita (3 km W), and a sulfur odor in Piedra Azul (5 km SW).
Source: Ministerio de Medio Ambiente y Recursos Naturales (MARN)
On 14 January MARN reported that a gradual decrease in activity to low levels had been recorded at San Miguel since 1 December 2022. Sulfur dioxide emissions were below the baseline of 300 tons per day and no deformation was detected. Minor emissions and occasional explosions of gas and ash continued to be recorded by the seismic network and were occasionally visible. At 0817 on 14 January a gas-and-ash emission was seen in webcam images rising just over the crater rim.
Source: Ministerio de Medio Ambiente y Recursos Naturales (MARN)
On 14 December MARN reported that activity at San Miguel continued to decrease. They noted that there were no major changes to seismicity and gas emissions, though minor explosions were occasionally detected by the seismic network and manifested as small gas emissions. Sulfur dioxide emissions were below the baseline of 300 tons per day.
Source: Ministerio de Medio Ambiente y Recursos Naturales (MARN)
On 7 December MARN reported that activity at San Miguel had decreased. No explosions had been recorded since 29 November and seismicity had decreased. Sulfur dioxide emissions were below the baseline of 300 tons per day.
Source: Ministerio de Medio Ambiente y Recursos Naturales (MARN)
MARN reported that a total of 194 explosions were recorded at San Miguel during 15-29 November, with a daily average of 12 events. Gas, steam, and ash plumes generally rose 500 m above the crater rim, though plumes occasionally rose higher, particularly during 26-27 November as activity intensified. No explosions were detected during 30 November-6 December and seismicity decreased. MARN noted that those living within a 5 km radius should identify evacuation routes and to take preparation measures identified by the Sistema Nacional de Protección Civil.
Sources: Ministerio de Medio Ambiente y Recursos Naturales (MARN); Protección Civil de El Salvador
MARN reported that the eruption at San Miguel continued during 23-28 November. Daily phreatic explosions produced gas, steam, and ash emissions that generally rose around 500 m above the crater rim. There were a total of 188 events recorded by 28 November, with a daily average of 13. The explosions were more energetic mid-week; explosions at 1302 and 1642 on 26 November and 0718 and 0802 on 27 November ejected hot rocks onto the flanks and produced eruption plumes that rose as high as 1.1 km above the summit. A cow was killed by hot ballistics during the morning of 27 November, according to a news article. El Director General de Protección Civil issued a Green Alert for the municipalities of Chinameca, San Rafael Oriente, and San Jorge, and warned the public to stay 3 km away from the volcano. The notice recommended that those living within a 3-6 km radius should identify evacuation routes and to take preparation measures as guided by the Sistema Nacional de Protección Civil.
Sulfur dioxide emissions generally averaged 283 tons per day during 26-27 November, below the baseline of 300 tons per day. Specific measurements during explosive events revealed that the emissions were sometimes as high as 1,200 tons per day. MARN warned the public to stay 2 km away from the volcano, and for those living within a 2-5 km radius to identify evacuation routes and to take preparation measures as guided by the Sistema Nacional de Protección Civil.
Sources: Ministerio de Medio Ambiente y Recursos Naturales (MARN); ASAP Televisión; Protección Civil de El Salvador
MARN reported that an eruption at San Miguel’s central crater began on 15 November, and by 1100 on 20 November a total of 62 phreatic explosions had been recorded, averaging 10 per day. An additional 24 explosions were recorded from 1100 on 20 November to 1100 on 21 November and 12 more were recorded between 1100 and 1100 during 21-22 November. Explosions generated gas, ash, and steam plumes that generally rose around 500 m above the crater rim, though at 1336 on 18 November and 1206 on 19 November eruption plumes rose as high as 1.1 km. Some of the events were accompanied by crater incandescence during 15-20 November. Sulfur dioxide emissions generally averaged 100-170 tons per day, below the baseline of 300 tons per day. Specific measurements during explosive events revealed that the emissions were sometimes higher; 1,200 tons per day was measured on 19 November during one of the largest explosions, and 378 tons per days was measured during an explosion on 21 November. Seismicity was characterized by volcano-tectonic events, long-period events, and tremor. Deformation data showed no significant changes. The public was warned to stay 2 km away from the volcano, and for those living within a 2-5 km radius to identify evacuation routes and to take preparation measures as guided by the Sistema Nacional de Protección Civil.
Source: Ministerio de Medio Ambiente y Recursos Naturales (MARN)
SNET stated that San Miguel’s seismic network recorded long-lasting and continuous periods of volcanic tremor that began on 7 February and continued through 14 February. Discrete earthquakes from minor rock fracturing were also detected. RSAM values fluctuated between 25 and 75 units, below normal values around 150 units.
Source: Servicio Nacional de Estudios Territoriales (SNET)
SNET stated that during 30-31 March the seismic network at San Miguel recorded a period of increased seismicity characterized by continuous, low-frequency, tremor-type signals. RSAM values were between 90 and 116 units, lower than the normal values of 150, at a seismic station located on the upper N flank.
Source: Servicio Nacional de Estudios Territoriales (SNET)
SNET stated that during 28 February-6 March there were no reports of noises or gas emissions at San Miguel from the network of local observers. Seismicity was stable; 50-60 low-magnitude earthquakes were recorded per hour with RSAM values between 40 and 98 units, lower than the normal values of 150. The sulfur dioxide emission flux was 517-808 tons per day.
Source: Servicio Nacional de Estudios Territoriales (SNET)
SNET reported that during 23-28 February activity at San Miguel was low. An increase in the number of very small-magnitude earthquakes was recorded by the VSM seismic station located on the upper N flank. RSAM values were between 45 and 75 units, lower than the normal values of 150.
Source: Servicio Nacional de Estudios Territoriales (SNET)
SNET reported that local observers of San Miguel reported a series of rumbling noises that occurred from 1900 on 20 February to 0750 on 21 February. The report noted an increase in amplitude of microearthquakes and minor gas emissions form the main crater. Sulfur dioxide levels had also increased. Beginning at 1055 on 22 February an ash emission that lasted 10 minutes long resulted in a small gas-and-ash plume that rose 400 m above the crater rim. Minor ashfall was reported in the area of Piedra Azul, 5 km SW. RSAM peaked at 510 units during the period of emissions, above the normal values of 150, as recorded by station VSM located on the upper N flank. The number of low-amplitude tremor events increased after a quiet period of about 11 hours and were associated with gas emissions; RSAM was 33-97 units and minor gas plumes were visible rising 400 m during 23-24 February.
Source: Servicio Nacional de Estudios Territoriales (SNET)
SNET reported a significant increase in the number of low- and high-frequency earthquakes beneath San Miguel’s crater beginning on 22 May. RSAM values fluctuated between 142 and 176 units (normal values are 50-150 units) during 30 May-1 June. Webcam images on 30 May showed a small gray gas emission.
Source: Servicio Nacional de Estudios Territoriales (SNET)
On 2 March SNET reported that gas plumes rose as high as 400 m above San Miguel’s crater rim during the previous week. Ash was in the emissions on 24, 26, and 28 February, and 1 March. RSAM values fluctuated between 70 and 179 units (normal values are 50-150 units) during 1-2 March. At 2200 on 5 March seismic amplitude began to increase, with RSAM values rising to 318 units by 0600 on 6 March. A webcam recorded minor gas emission during 5-6 March.
Source: Servicio Nacional de Estudios Territoriales (SNET)
SNET reported that during 0800-1100 on 19 February gas-and-ash emissions from San Miguel rose 350 m above the crater rim and drifted SW. Ash fell on the upper flanks of the volcano, and a sulfur odor was reported in La Piedra farm.
Source: Servicio Nacional de Estudios Territoriales (SNET)
On 2 February SNET reported that seismicity at San Miguel was decreasing, along with a decrease in emissions. RSAM values fluctuating between 63 and 114 units; normal values are between 50 and 150. Small pulses of gas near the crater rim were visible.
Source: Servicio Nacional de Estudios Territoriales (SNET)
SNET reported that during 25-26 January seismic activity at San Miguel was slightly higher than normal, with RSAM values fluctuating between 75 and 179 units. Small pulses of gas near the crater rim were visible.
Source: Servicio Nacional de Estudios Territoriales (SNET)
SNET reported that during 14-17 January there were four gas-and-ash emissions from San Miguel that rose no higher than 300 m above the crater rim. The report noted that prior to each emission seismicity decreased and then suddenly increased.
Source: Servicio Nacional de Estudios Territoriales (SNET)
SNET reported that at 1653 on 14 January and 1615 on 15 January gas-and-ash plumes from San Miguel rose no more than 300 m above the crater rim and dispersed SW. The report noted that prior to both emissions seismicity decreased and then suddenly increased.
Source: Servicio Nacional de Estudios Territoriales (SNET)
On 19 May SNET reported that during the previous 24 hours RSAM values at San Miguel continued to decrease, fluctuating between 69 and 80 units (typical background levels average 50 units). Sulfur dioxide flux was also lower, though changing winds may have affected readings.
Source: Servicio Nacional de Estudios Territoriales (SNET)
SNET reported that during 28 April-5 May RSAM values at San Miguel had decreased and fluctuated between 50 and 173 units (typical background levels average 50 units). Sulfur dioxide flux was also lower, though changing winds may have affected readings.
Source: Servicio Nacional de Estudios Territoriales (SNET)
SNET reported that during 27-28 April RSAM values at San Miguel fluctuated between 106 and 176 units (typical background levels average 50 units). At 1532 on 27 April a strong gas plume rose 1.2 km above the crater rim.
Source: Servicio Nacional de Estudios Territoriales (SNET)
In a special report from 17 April, SNET reported an increase in seismicity and gas emissions from San Miguel in recent days. Earlier that day during 0620-0630 RSAM values spiked to 356, an increase over normal values around 50. During 18-21 and 23-24 April RSAM values fluctuated between 80 and over 300.
Source: Servicio Nacional de Estudios Territoriales (SNET)
Based on satellite observations, the Washington VAAC reported that on 7 January steam plumes with minor amounts of ash rose from San Miguel to an altitude of 2.6 km (8,500 ft) a.s.l. and drifted 130 km SW. Only steam-and-gas plumes were detected later that day.
Source: Washington Volcanic Ash Advisory Center (VAAC)
SNET reported that at 0800 on 15 June seismicity at San Miguel dramatically increased and remained elevated. At 0410 on 18 June a small explosion occurred in the central crater, ejecting tephra onto the flanks near the crater, and causing ashfall in areas to the NW. Voluminous gas emissions were visible drifting SW during 19-20 June, and local residents on the W and SW flanks reported a sulfur odor.
Source: Servicio Nacional de Estudios Territoriales (SNET)
SNET reported that between 1304 and 1430 on 31 May seismic signals at San Miguel increased, and indicated rock fracturing at depth and possible gas-and-ash emissions. Though weather clouds partially covered the volcano, the webcam recorded some pulses of gas emissions. Seismicity decreased the next day.
Source: Servicio Nacional de Estudios Territoriales (SNET)
SNET reported that at 0520 on 12 January a gas-and-ash plume from San Miguel rose 400-800 m above the crater and drifted WSW, causing ashfall in San Jorge, Caseríos, La Piedra, Moritas, and La Placita. Gas-and-ash emissions continued through the rest of the day; ashfall was also later reported in San Rafael Oriente, Alegría, and Berlín en Usulután. Seismicity declined during 12-14 January. Gas plumes with minor to no ash content rose as high as 300 m. On 14 January seismicity stabilized above background levels, and gas emissions were observed. The next day local observers reported a millimeter of ash deposited in Las Cruces, on the N flank. A webcam recorded gas emissions rising 400 m and drifting N throughout the morning. Gas emissions during 17-18 January were weak, only rising 150 m, and RSAM values gradually declined. At 0900 on 18 January the emission plume became dark and drifted SW.
Source: Servicio Nacional de Estudios Territoriales (SNET)
SNET reported that at 1515 on 11 April a small explosion at San Miguel generated a gas-and-ash plume that rose 800 m and quickly dissipated to the SW. Minor ashfall (1 mm thick) was reported WSW of the crater, in La Piedra, Moritas, and San Jorge.
Source: Servicio Nacional de Estudios Territoriales (SNET)
SNET reported that at 0643 on 26 January a small explosion at San Miguel generated a plume that rose 300 m and quickly dissipated to the W. Local residents reported hearing rumbling and feeling tremor during the explosion. Minor ashfall was reported SW of the crater.
Source: Servicio Nacional de Estudios Territoriales (SNET)
On 27 August -2 September SNET reported that seismic activity at San Miguel had decreased significantly from the previous month. Small steam-and-gas plumes did not exceed 200 m above the summit. Views on 29 August were obscured by clouds. On 1 September there was a slight increase in seismicity and gas pulses rose 400 m above the summit.
Source: Servicio Nacional de Estudios Territoriales (SNET)
On 20-26 August SNET reported low seismic activity at San Miguel. On most days short pulses of white and whitish gray steam plumes were observed at the summit.
Source: Servicio Nacional de Estudios Territoriales (SNET)
On 13-19 August SNET reported low seismic activity at San Miguel. On most days white and whitish gray gas plumes rose 100-300 m above the crater. On 14 August field work was completed that assessed damage to the town of San Jorge affected by debris flows caused by heavy rainfall on 10-11 August.
Source: Servicio Nacional de Estudios Territoriales (SNET)
SNET reported low seismic activity and reduced emissions at San Miguel during 6-12 August. A remote camera and infrared visual display showed mild white fumerolic emissions rose less than 200 m above the crater. Heavy rain has contributed to a debris flow recorded by a station 1.7 km from the north flank on 9 August. On 11 August instruments recorded additional mud flows. SNET reported property damage and two people were affected by these flows.
Source: Servicio Nacional de Estudios Territoriales (SNET)
SNET reported decreasing seismic activity and reduced emissions at San Miguel during 30 July-5 August. A remote camera and infrared visual display showed minor white fumarolic emissions that rose less than 200 m above the crater.
Source: Servicio Nacional de Estudios Territoriales (SNET)
SNET reported seismic activity at San Miguel during 23-29 July. On 24 July an ash cloud from a small explosion rose 400 m and drifted SW and deposited small amounts of ash in La Morita, Piedra Azul, and San Rafael East. Ash clouds from small explosions on 27-28 July deposited small amounts of ash to the SW in the La Morita Townships of La Piedrita and La Ceiba.
Source: Servicio Nacional de Estudios Territoriales (SNET)
SNET reported elevated seismic activity at San Miguel on 17, 19, 20, and 22 July. RSAM had increased significantly. SO2 flux measurements indicated variability in air quality, which at times reached unhealthy levels.
Source: Servicio Nacional de Estudios Territoriales (SNET)
According to the Ministry of Environment and Natural Resources (MARN), elevated activity was detected on 10 July from San Miguel. RSAM had increased significantly and was also high on 14 July, but decreased the next day. On 15 July MARN reported that seismicity was continuing from the N flank. SO2 flux measurements indicated a significant decrease of gas.
Sources: Servicio Nacional de Estudios Territoriales (SNET); Servicio Nacional de Estudios Territoriales (SNET)
MARN issued a special report on 27 June and related the unstable system at San Miguel as RSAM values decreased then climbed to fluctuate between 118 and 335. Concentrations of sulfur dioxide (SO2) values measured over the past 24 hours have fluctuated between good and unhealthy.
Source: Servicio Nacional de Estudios Territoriales (SNET)
According to SNET, the Ministerio de Medio Ambiente y Recursos Naturales (MARN) reported that seismicity at San Miguel increased significantly during 11-12 June, and remained very high through 17 June. Webcam images on 17 June showed a small steam plume rising from the summit crater.
Source: Servicio Nacional de Estudios Territoriales (SNET)
According to SNET, the Ministerio de Medio Ambiente y Recursos Naturales (MARN) reported that during 4-5 June seismicity at San Miguel declined dramatically. Small dark gray plumes of gas and ash rose 200 m above the crater. During 7-8 June gas-and-ash emissions continued; observers noted 1 mm of ashfall on the N flank.
Source: Servicio Nacional de Estudios Territoriales (SNET)
According to SNET in a report from 1 June, the Ministerio de Medio Ambiente y Recursos Naturales (MARN) reported that seismicity at San Miguel remained high. Locals observed more intense gas plumes rising from the crater with occasional minor amounts of ash, especially after rainfall. Rumbling was also reported.
Source: Servicio Nacional de Estudios Territoriales (SNET)
According to SNET, the Ministerio de Medio Ambiente y Recursos Naturales (MARN) reported that during 22-23 May heavy rains at San Miguel caused lahars that originated from the upper part of the volcano and were heard by residents. Seismicity and gas output both remained high. Gas plumes rose 300 m and drifted W; the plumes were different colors and suggested that fine material was being carried out of the crater.
Source: Servicio Nacional de Estudios Territoriales (SNET)
According to SNET, the Ministerio de Medio Ambiente y Recursos Naturales (MARN) reported on 19 May that activity at San Miguel had increased significantly in the previous few days. The activity was characterized by an increase in the frequency and magnitude of gas emissions, rumbling in the crater, and small explosions followed by juvenile ashfall. On 18 May between 2230 and 2300 less than 1 mm of ash fell to the WNW in San Jorge. On 19 May the webcam recorded periodic pulses of gray gas plumes that rose 300 m and drifted W. On 20 May seismicity remained high and gray emissions rose 300 m.
Source: Servicio Nacional de Estudios Territoriales (SNET)
According to SNET, the Ministerio de Medio Ambiente y Recursos Naturales (MARN) reported that on 10 May San Miguel emitted small amounts of ash. Ashfall, less than 1 mm thick, was observed in areas between the Parque de las Placitas and Placitas.
Source: Servicio Nacional de Estudios Territoriales (SNET)
According to SNET, the Ministerio de Medio Ambiente y Recursos Naturales (MARN) reported that on 12 April moderate to strong gas plumes from San Miguel rose from the crater and drifted SW. The most robust plume occurred at 1607 and rose 400 m. Images recorded by a webcam showed that the plumes had dark tones, suggesting small amounts of ash.
Source: Servicio Nacional de Estudios Territoriales (SNET)
SNET reported that during 15-20 January RSAM values at San Miguel fluctuated between 14 and 97, except for a period starting at 1500 on 19 January where the values were 102-215. Gas emissions were characterized by light gray plumes that rose 100-250 m above the crater and drifted S and SW.
Source: Servicio Nacional de Estudios Territoriales (SNET)
SNET reported that during 8-10 January activity at San Miguel was low. The number of seismic events fluctuated but remained at low levels, sometimes lower than values recorded before the eruption on 29 December 2013. Gas emissions were also low and characterized by light gray plumes that rose 100-150 m above the crater and drifted S. RSAM values and sulfur dioxide emissions increased for a period of time during 11-12 January, but decreased again to low levels.
Source: Servicio Nacional de Estudios Territoriales (SNET)
SNET reported that sulfur dioxide gas flux in tonnes per day from San Miguel was high: 2,200 on 31 December 2013, 1,740 on 1 January 2014, and 700 on 2 January. The report noted that the measurement on 2 January was likely low due to changes in wind patterns that day. During 1-2 January RSAM values ranged from 17 to 28 units. On 5 January gas plumes rose as high as 150 m above the crater. The next day light-gray gas plumes rose 200 m and drifted SW. RSAM values during 5-6 January were between 15 and 33 units.
Source: Servicio Nacional de Estudios Territoriales (SNET)
According to news articles, an explosive eruption at San Miguel that began at 1030 on 29 December prompted an evacuation of 1,400-2,600 people. A dense ash plume rose from the crater. Based on wind data, the Washington VAAC reported that the ash plume rose to an altitude of 9.7 km (32,000 ft) a.s.l. and drifted ENE at higher altitudes and W at lower altitudes.
SNET reported that sulfur dioxide flux was 637 tonnes per day on 29 December and 1,244 tonnes per day on 30 December. During 30-31 December seismicity decreased significantly. Through the morning of 31 December emissions had consisted of gas and slight amounts of ash that drifted WSW.
Sources: Servicio Nacional de Estudios Territoriales (SNET); Washington Volcanic Ash Advisory Center (VAAC); United Press International (UPI); Diario del Hoy (elsalvador.com)
Servicio Nacional de Estudios Territoriales (SNET) reported that during a survey of the San Miguel crater on 9 and 16 March observers noted pulses of gas rising 200 m from the crater. On 12 March the number and amplitude of earthquakes increased. RSAM values rose the next day to 121 units per day on average, up from normal values around 50 units per day. RSAM values continued to fluctuate during the next few days and reached as high as 319 units on 19 March, 414 units on 20 March, and 234 on 21 March. On 18 and 20 March, local residents felt vibrations and heard minor rumbling. Observations on 25 March indicated that gas plumes rose 100 m from the crater. On 28 March SNET noted that seismicity had gradually decreased during the previous few days, and was as low as 80 RSAM units on 27 March. Access to areas within a 2-km-radius remained restricted.
Source: Servicio Nacional de Estudios Territoriales (SNET)
On 13 August, Servicio Nacional de Estudios Territoriales (SNET) reported that seismicity remained above background levels after an increase was detected on 1 August. Average background RSAM values ranged from 15 to 50 units per day. During 12-13 August, RSAM values ranged between 433 and 465. Over the next few days, seismicity decreased significantly; from 14 August to 16 August, RSAM values decreased from 188 to 132. Access to areas within a 2-km-radius remained restricted.
Source: Servicio Nacional de Estudios Territoriales (SNET)
On 20 July, Servicio Nacional de Estudios Territoriales (SNET) reported that the amplitude of seismic events from San Miguel had decreased to normal or background levels. Access to areas within a 2-km-radius continued to be restricted.
Source: Servicio Nacional de Estudios Territoriales (SNET)
Servicio Nacional de Estudios Territoriales (SNET) reported that the amplitude of seismic events from San Miguel had decreased during 9-13 July, but RSAM values remained above the background average. Access to areas within a 2-km-radius was restricted.
Source: Servicio Nacional de Estudios Territoriales (SNET)
Servicio Nacional de Estudios Territoriales (SNET) reported that seismic amplitude from San Miguel increased for a period of time between 0500 and 1400 on 6 July. Seismicity remained elevated above background levels on 7 July.
Source: Servicio Nacional de Estudios Territoriales (SNET)
Servicio Nacional de Estudios Territoriales (SNET) reported on 10 October that an Alert Level for San Miguel was established as Green within 4 km from the center of the crater due to a slight increase in seismic activity. On 15 October, the Alert Level was increased to Yellow due to further increases in seismic activity, but then decreased to Green again the next day.
Source: Servicio Nacional de Estudios Territoriales (SNET)
SNET reported that activity had not changed at San Miguel after small clusters of earthquakes occurred at the volcano during 27 September to about 14 October. During a visit to the volcano on 13 October small rockfalls were seen, but there were no significant changes in the crater and sulfur-dioxide emissions were very weak.
Source: Servicio Nacional de Estudios Territoriales (SNET)
According to a news article, a tectonic earthquake near San Miguel on the evening of 8 February caused landslides within the crater and on the volcano's flanks. One of the landslides threatened retention walls in the community of Carretos near the volcano. Citizens feared that heavy rains in the future could mix with the landslide material and overload the retention walls, causing them to fail.
Source: La Prensa Grafica
A news report stating that a rockslide released dangerous fumes at San Miguel on 17 October was found to be false.
Source: Associated Press
A news report stating that a rockslide released dangerous fumes at San Miguel on 17 October was found to be false.
Source: Associated Press
Reports are organized chronologically and indexed below by Month/Year (Publication Volume:Number), and include a one-line summary. Click on the index link or scroll down to read the reports.
Eruption during 30 March-4 April causes ashfall 10 km away
Card 0902 (03 April 1970) Renewed activity on 30 March
Reports arriving from the city of San Miguel state that Chaparraspique [Chaparrastique] volcano has again become active, at times intensively. It was reported that the first signs that the volcano had become active were noticed at 1300 GMT 30 March and that it continues to be covered by a layer of smoke and mist, which indicates that it may become active again at any moment, forcing the authorities to evacuate the area populated by hundreds of families.
Card 0904 (07 April 1970) Ashfall extends 10 km from the summit; crater visit
"Ash erupted from the crater of San Miguel volcano, El Salvador, on 30 March 1970, at 0230, 0700, and 0800. The first ash eruption, accompanied by a loud noise heard four kilometers away, reached a height of 400 m above the crater floor, according to Sr. Santiago Ventura Arevalo, Secretary of the Finca la Placita, San Miguel, and a report in La Prensa (San Salvador) of 31 March 1970. Ash fell in a fan-shaped area extending at least 10 km NE of the summit. From measurements of ash deposits three and four days after the eruption, the minimum volume of ash is estimated to be 75,000 m3. At the time of the ascent into the crater on 4 April 1970, there was ash in the crater floor to a depth of 15 mm. Infrequent ash eruptions up to 100 m high were observed on 3 and 4 April from the deep chimney in the summit crater. A land-based infrared radiation thermometry survey on 4 April detected no anomalous heat patterns on the NW side of the cone."
Information Contacts:
Card 0902 (03 April 1970) San Salvador Domestic Service, El Salvador.
Card 0904 (07 April 1970) Richard E. Stoiber, Dartmouth College, USA; Ian Lange, Fresno State College; Richard Birnie, USA Cold Reg. Research and Engineering Laboratory.
Explosive eruption began on 2 December; ashfall damages crops
An explosive eruption of San Miguel was reported to have begun during the morning of 2 December. "Smoke", loud noises, and a sulfur smell were reported from the nearby town of San Miguel. By 9 December, the eruption cloud was visible from a considerable distance and ashfalls had caused some crop damage. A few persons were evacuated. Although "fire" was reported by the press, only a white cloud was seen by Richard Stoiber during a 9 December overflight. The last activity at San Miguel was the eruption of more than 75,000 m3 of ash beginning 30 March 1970.
Further Reference. Martinez, M.A., 1977, The eruption of 2 December, 1976 of San Miguel Volcano, Republic of El Salvador, Central America: Centro de Investigaciones Geotécnicas, San Salvador, 4 p.
Information Contacts: AFP; Sercano Radio Network; R. Stoiber, Dartmouth College.
New spatter cone in the central crater
The following is based on a report in BVE 17. After 6 years of dormancy since the last activity in 1970, San Miguel started erupting at about 0030 on 2 December 1976. The eruption was characterized by lava fountains. On 12 December the eruption stopped, and fumarole activity was seen around a new spatter cone in the bottom of the central crater. Fifty-six days later, the activity started again during the night of 28 February and lasting until 1 March 1977.
Information Contacts: M.A. Martinez, Centro de Investigaciones Geotécnicas, San Salvador, El Salvador.
Small vapor plume
During a flight over El Salvador by Dartmouth geologists, a small, continuous vapor plume rose from the summit crater.
Information Contacts: R. Stoiber, S. Williams, R. Naslund, L. Malinconico, and M. Conrad, Dartmouth College.
Ash emission and seismicity
Weak steam and ash emission accompanied by frequent small earthquakes began in November and were continuing in early February. The eruption deposited a thin layer of ash near the summit. Geologists installed a telemetering seismometer about 1 km from the summit, recording about 200 discrete microseismic events/day from November through much of January. By the end of January, seismic activity had declined somewhat, to 100-120 events/day.
Information Contacts: José González and Salvador Jesus, Dept de Sismología, Centro de Investigaciones Geotécnicas, San Salvador, El Salvador; David Harlow, USGS.
Increased seismicity and minor ashfall near the crater
New fumaroles were found near the central vent in early January, followed by an increase in seismic activity from an average of 20-30 events/day. On 8 February there were 52 recorded earthquakes. Seismicity increased to 73 events on 19 February, 100 on the 20th, and peaked at 267 on the 21st. This activity then declined on 22 February to an average of 76 events/day, a rate which continued through at least 24 March. Minor ashfall was reported on 23 March within ~100 m of the crater.
The Centro de Investigaciones Geotécnicas (CIG) concluded that this activity was no cause for alarm, but they would increase their monitoring efforts. The population at risk from an eruption with significant ashfall is a mix of urban and rural residents. The city of San Miguel (10 km NE) has a population of ~150,000, and the rural zone that would likely be affected has a population of ~100,000.
Information Contacts: Jorge Alberto Rodríguez Deras, Director, Centro de Investigaciones Geotécnicas, San Salvador, El Salvador.
Minor gas-and-ash emission in January 2002; summary of earlier activity
On 16 January 2002 a gas-and-steam plume containing a little ash rose with a mushroom-like profile a few hundred meters above the summit crater of San Miguel. During a visit to the summit on 28-29 January, Demetrio Escobar and a group from Michigan Technological University observed a thin layer of ash inside the summit crater produced by the 16 January event. COSPEC measurements of 100 metric tons/day were recorded at a time that the plume from San Miguel rose about 100 m above the crater rim. Long-period earthquakes, volcanic tremor, and explosion events were recorded at San Miguel in late January and February. This style of increased seismicity and gas emission is within the range of normal activity at San Miguel, and the Servicio Geologico de El Salvador concluded that this activity was no cause for alarm, but planned the installation of more telemetry seismic stations.
The events at San Miguel received extensive coverage in the local press, which had previously reported ash eruptions on 25 December 2001. However, during field studies around the volcano during 4-6 January by Escobar and Craig Chesner, extensive interviews of local residents revealed that the report of ashfall was incorrect. Vigorous steam plumes from the volcano had been confused with fly ash from the burning of sugar cane fields.
Summary of previous activity. Intermittent periods of vigorous steam-and-gas emission from San Miguel have been commonly reported in recent years. On at least two occasions, in early 1995 and at the end of December 1997, minor gas-and-ash emissions had occurred. Although discussed previously in BGVN 20:03, Escobar provided additional information on the 1995 event. Elevated seismicity and gas emission occurred at San Miguel from 26 December 1994 to 11 January 1995.
On 12 January 1995 Escobar visited the volcano and heard jet-like sounds at the crater, along with probable small explosions. Gas emission formed a plume about 100 m high that was blown to the SW. Escobar found 3-4 mm of ash in the summit crater. He also observed fine ashfall deposits on the SW flank and measured up to 2-3 mm of gray ash on the NW flank at a distance of 3 km from the crater. Residents reported that the ashfall caused damage to coffee plantations.
Elevated seismicity continued, and similar conditions were observed during a visit to the crater in February 1995. On 20 March the telemetered seismic station worked only 11 hours, but registered 48 events, including 4 volcanic tremor events and 39 LP events. Three events were felt by residents living near the volcano.
At the time of a 23-24 April 1995 visit, residents reported they had not felt any seismic events, but that ashfall had occurred on 19 April following a rainstorm. Seismicity returned to normal in May of that year.
On 17 June 1996 seismic stations registered a seismic swarm at San Miguel volcano during 1128 to 1333, consisting of 24 volcano-tectonic events with a maximum magnitude of 2.5. No felt events were reported.
Residents living near the volcano reported minor ashfall on 31 December 1997, although no geologists were present to document the ashfall distribution. On 13 January 2000, volcanic tremor was recorded for 15 minutes. On 25 January, 17 minutes of tremor occurred, along with explosion events. During May tremor was recorded for a total of 2.5 hours, and intervals of long-period earthquakes, volcanic tremor and explosion events occurred later in the year.
On 26 August 2000 a lahar from San Miguel damaged houses and a highway N of the volcano, and a similar event on 6 September 2001 affected a highway. Previously lahars had destroyed or damaged houses and highways N of the volcano on 7 May 1985 and 28 September 1992.
Information Contacts: Carlos Pullinger and Demetrio Escobar, Seccion Vulcanologia, Servicio Geológico de El Salvador, c/o Servicio Nacional de Estudios Territoriales, Alameda Roosevelt y 55 Avenida Norte, Edificio Torre El Salvador, Quinta Planta, San Salvador, El Salvador; Gustavo Chigna, Instituto Nacional de Sismologia, Vulcanologia, Meteorologia e Hidrologia (INSIVUMEH), Ministero de Communicaciones, Transporto, Obras Públicas y Vivienda, 7a. Av. 14-57, zona 13, Guatemala City 01013, Guatemala (URL: http://www.insivumeh.gob.gt/); Bill Rose, Liset Rodríguez, Gustavo Chigna, Otoniel Matías, Janelle Byman, Elly Bunzendahll, Ivonne Branan, and Matt Watson, Michigan Technological University, Houghton, MI 49931 USA.
Restlessness persists during 2005-6; heavy tropical rains trigger lahars
According to El Salvador's Servicio Nacional de Estudios Territoriales (SNET) activity levels at San Miguel have generally remained similar to those during January 2002 when a minor plume rose above the summit crater (BGVN 27:02). The volcano's vigor continued into at least October 2006 at a level slightly at or above the base line of normal activity.
Recent publications have discussed the volcano and its lahar-hazard potential (Escobar, 2003; Chesner and others, 2003; Major and others, 2001). Figures 1 and 2 are taken from the latter publication.
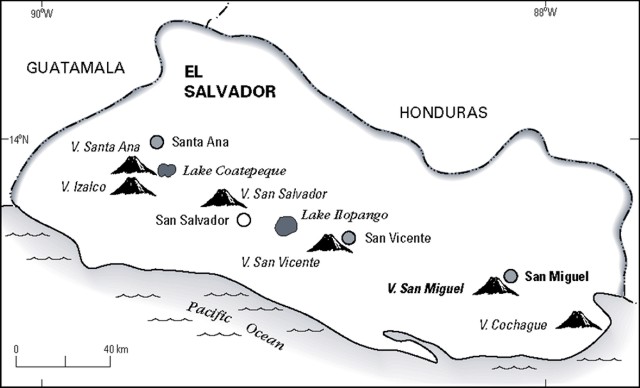 |
Figure 1. Index map indicating El Salvador's volcanic front and the location of volcan San Miguel. Major cities are also shown (circles). From Major and others (2001). |
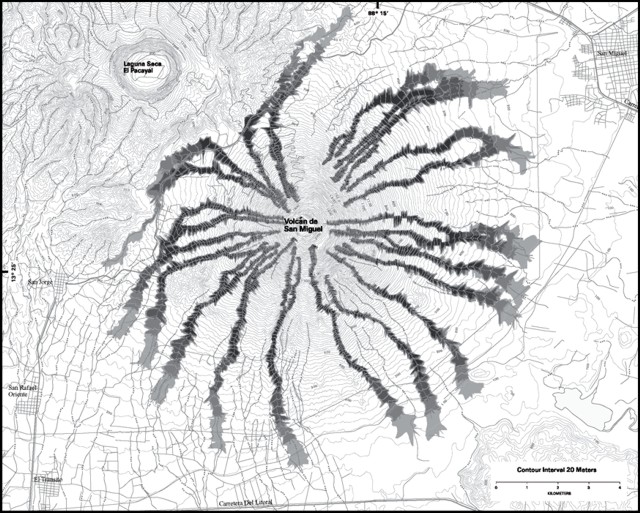 |
Figure 2. The lahar hazard map of San Miguel depicts likely lahar paths, which are shown as colored or shaded areas. The contour interval is 20 m; the urban center ~ 11 km NE of the summit is San Miguel. From Major and others (2001); their plate 1, cropped, highly reduced, and excluding the key. |
In January 2005 observers saw new fumaroles as well as small landslides on the N and SW wall of the crater. The accumulation of mass-wasted material in the crater led to a rise in the elevation of the crater floor.
During February 2005, weak fumaroles and small rock landslides persisted in the central crater. Digital sensors installed there recorded fumarolic temperatures in real time. On the outer portions of the cone the terrain is steeply sloping and contains prominent gullies (figure 3).
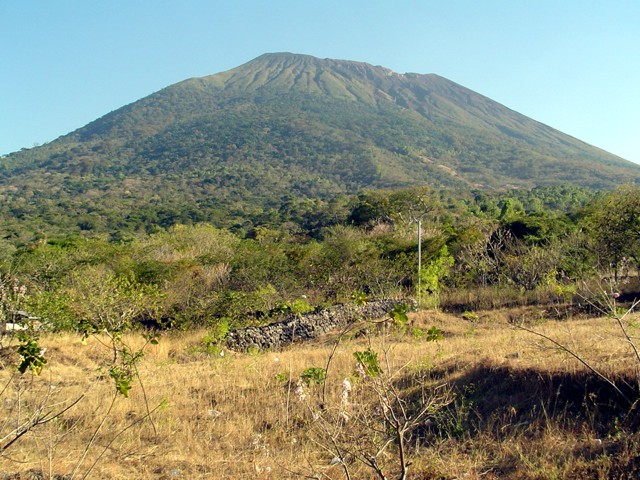 |
Figure 3. A photo of San Miguel taken from the N on 22 February 2005 showing the steep sides of the upper slopes and the incised drainages there. Although much of the area on the volcano is rural, hazards could easily affect 40,000 residents living nearby. Courtesy of Servicio Nacional de Estudios Territoriales (SNET). |
The SNET reports for March and April 2005 noted that the crater was structurally weak due to the fumarolic activity, ongoing rock alteration, occasional landslides, and fractures on the western plateau. Microseismicity had increased; but it did not exceed typical base-line levels. Workers at the Santa Isabel farm (finca) noted N-flank lahars after heavy rains during March. The N flank contains abundant fine-grained volcanic deposits of the sort easily swept away during times of heavy rain.
Intense rains during May 2005 were associated with tropical storm Adrian (over an unstated interval the meteorological station near the volcano, San Miguel UES, recorded 428 mm of rainfall). As a result of the deluge, fumarolic activity from the crater increased. The crater walls remained intact, but eroded material previously deposited in the central crater that was poorly consolidated had to some degree stabilized. Substantial further compaction, settling, or collapse in the central crater seemed to have ceased by July 2005. During August 2005 the crisis at volcan Santa Ana forestalled visits to San Miguel.
A spike in seismic activity occurred during August 2005, with 7,048 long-period earthquakes, compared to July 2005, with 2,239 long-period earthquakes. SNET reports noted that based on monitoring, San Miguel generally remained within its base-line of normal behavior during the reporting interval. Figure 4 shows a histogram of long-period and volcano-tectonic events from the SNET reports for the interval September 2005-June 2006.
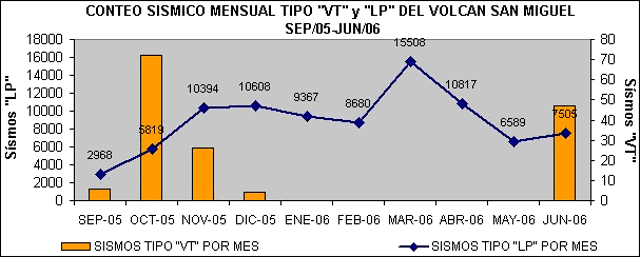 |
Figure 4. A plot of seismicity at San Miguel during September 2005-June 2006. Courtesy of SNET. |
On 14 September 2005 a visiting group (OIKOS- Soliradaridad Internacional) made a trek to the summit and videotaped the scene there. SNET said the video disclosed a lack of significant changes in the crater; however, they saw debris-flow deposits in summit drainages on the volcano's outboard flanks. The visitors described both sounds of degassing and moderately intense odors of H2S. During the course of September the seismic system recorded several minutes of tremor.
The October 2005 SNET report noted that workers at the plantation Santa Isabel noted N-slope lahars associated with rainfall. The lahars were also described as small debris flows; they descended from the high-elevation headwater areas, which are steep sided and narrow. The November report commented about the quantity of debris-flow material accumulating at the base of some N-flank channels. The same report also mentioned that moderate degassing was seen in the crater leaving areas of abundant sulfur, which appeared as yellow zones in one or more fumarolic areas.
The November 2005 report of SNET also discussed substantial landslides inside the crater that were followed by widening of the funnel-shaped area of collapse in the central crater. The landslides had left three distinct perched remnants of the crater floor (small terraces) at various elevations on the crater walls. The crater's western plain (one such terrace of the sort mentioned above) was stable but showed areas of subsidence (figure 5).
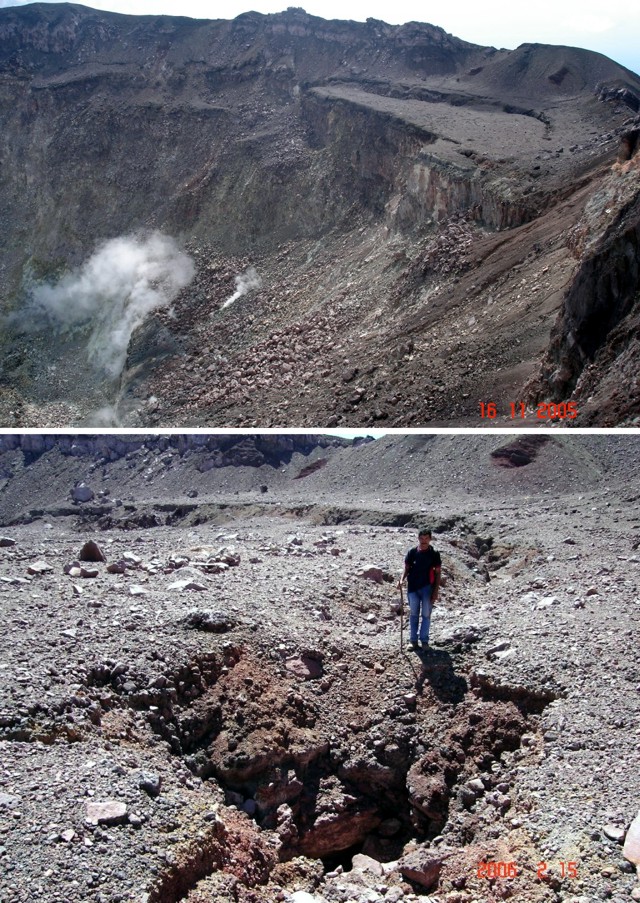 |
Figure 5. (top) A photo of San Miguel taken on 16 November 2005 showing the 'western plain' of San Miguel's crater (a terrace representing a remnant of a former crater floor). A considerable portion of the remaining terrace is in the process of subsidence (slumping). (bottom) A photo of the same area taken on 15 February 2006 (looking S). A zone of local subsidence, a pit along the head scarp, appears in the foreground but the subsidence also includes the region to the left of the large arcuate area extending well beyond the pit and still conspicuous in the upper left edge of the photograph. Courtesy of SNET. |
Lahar monitoring during December 2005 disclosed erosion of easily mobilized cinders and scoria material on the N to NW flanks during the previous wet season. December seismicity was elevated, but cracks in the crater changed little compared to previous measurements. A field team visited the summit on 11 January 2006 and again in February and found few substantive changes in the crater. On the ascent route during January, the team saw a small recent "fall of material" reaching 40 cm thick. Some fumaroles discharged yellowish gases. During February the team conducted measurements of cracks on the western plain but found few changes, suggesting the headscarp had moved little if at all. February and March tremor episodes were centered at ~ 5 Hz and lasted 1-3 minutes.
The March 2006 SNET report noted small rockslides on the crater's N and S sides and, with the beginning of the rainy season in March 2006, there was a potential for the development of lahars. During the March visit the team found abundant granular material in the gullies on the NW flank, judged to be the result of debris flows. Monitored cracks remained stable.
With the arrival of the wet season in April, lahars and enhanced fumarolic output became apparent. One debris flow intersected a highway. On 23-24 April, 105 mm of rain was recorded at plantation (finca) Santa Isabel. Figure 6 shows the results of one lahar which left a trail of debris during the rainy interval. Earlier in the month on the 16th, a tremor or multi-phase episode lasted over an hour.
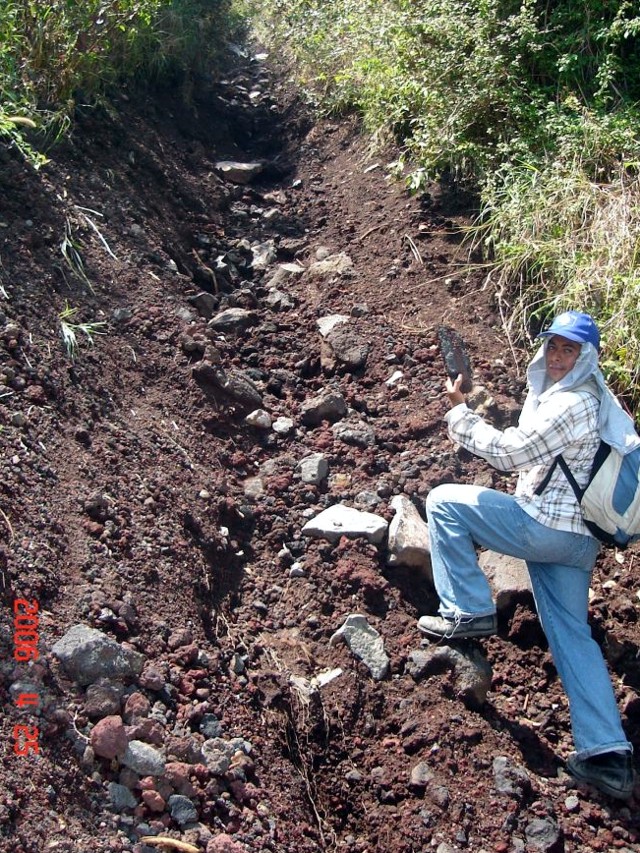 |
Figure 6. A San Miguel photo showing a part of the freshly scoured upslope channel in the Gato erosional gully. The material deposited in the channel consisted of reworked volcanic rocks and must have descended as a small lahar or debris flow. Several such flows occurred during heavy late-April rains at the start of the rainy season, a few days before this picture was taken. Courtesy of SNET (from their April 2006 report). |
In April 2006, an increase in fumarole degassing within the crater and small landslides contributed to the instability of the deposits on the NW flanks of the volcano. Steam emanated from the fumaroles occasionally forming a weak column that reached the edge of the crater. There was a slight increase in seismicity throughout the month. Seismic activity increased in March and April 2006 (figure 4). Rocks in the crater show intense hydrothermal alteration with a yellowish reddish color. Small rock landslides were observed in the N and S zone of the crater.
During June 2006, the temperature of the fumaroles, opening of cracks and the gas discharge by the crater of the volcano, remained stable. There was an increase of small landslides within the crater. The analysis of the seismicity indicates that the volcano is slightly above its base line of normal behavior. New landslides and cracked rock were observed in the walls of the crater (figure 7). Rains have transferred volcanic material down the NW flank. Seismicity gradually increased in both frequency and magnitude beginning on 16 June. 47 VT earthquakes and 7,505 LP earthquakes were recorded, an amount that surpasses those registered in May; but smaller than those registered in March and April (figure 4).
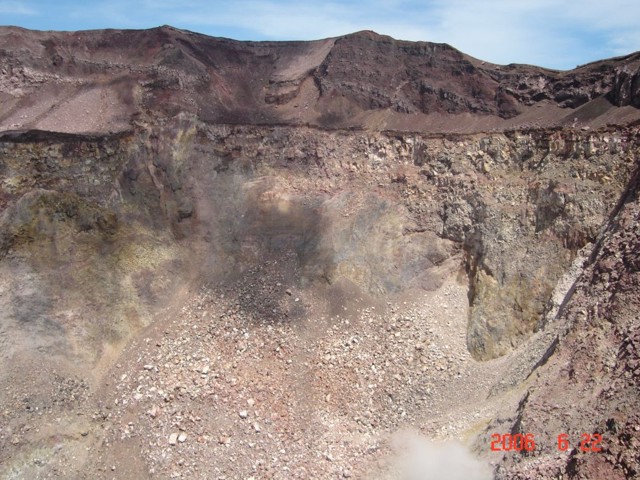 |
Figure 7. San Miguel's S crater wall exposes zones of altered and fractured rocks. A planar zone of structural weakness appears towards the right. Photo taken on 22 June 2006. Courtesy of SNET. |
During July 2006, stability continued with respect to fumarole temperatures, crack openings, and gas emissions around the crater. However, the seismicity increased by ~ 70%. Small and sporadic landslides took place inside the crater off the SE to SW walls. Intense hydrothermal alteration in the NW wall was also observed. SNET did not report any lahars during July 2006; however intense rains have continued to remove volcanic material from the NW flanks. The fumarolic field gave off weak emissions.
In August 2006, the monitored parameters such as fumarole temperature, crack opening, and visual estimates of gas discharge maintained normal levels. The seismicity diminished significantly in relation to July.
During September 2006, San Miguel reached a low level of activity. There were no significant changes in the morphology of the volcano as reported in previous months. At the S wall, there were evidence of small rock slides.
A sudden increase in seismicity occurred on 9 October 2006. Contact was made with other observatories and it was determined there were no landslides or rock falls associated with the event. Seismic increases such as 9 October had previously occurred, particularly on 19 June 2003 and from 2-6 May 2004. The 9 October increases were attributed to gas emission from the crater.
References. Chesner, C. A., Pullinger, C., Escobar, C. D., 2003, Physical and chemical evolution of San Miguel Volcano, El Salvador. GSA Special Paper 375.
Escobar, C.D., 2003, San Miguel Volcano and its Volcanic Hazards; MS thesis, Michigan Technological University, December 2003. 163 p.
Major, J.J.; Schilling, S.P., Pullinger, C.R., Escobar, C.D., Chesner, C.A, and Howell, M.M., 2001, Lahar-Hazard Zonation for San Miguel Volcano, El Salvador: U.S. Geological Survey Open-File Report 01-395. (Available on-line.)
Information Contacts: Carlos Pullinger, Seccion Vulcanologia, Servicio Geológico de El Salvador, c/o Servicio Nacional de Estudios Territoriales, Alameda Roosevelt y 55 Avenida Norte, Edificio Torre El Salvador, Quinta Planta, San Salvador, El Salvador (URL: http://www.snet.gob.sv/Geologia/Vulcanologia/).
Background seismicity since October 2006; crater visit in July 2007
A sudden increase in seismicity occurred on 9 October 2006 but no landslides or rock falls were associated with the event and it was attributed to gas emissions in the crater (BGVN 31:10). This report carries on from 9 October 2006.
During the morning of 10 October 2006, seismic activity declined to a continuous vibration with an amplitude that oscillated between 50 and 75 RSAM (real-time seismic amplitude measurement) units. This condition continued until 0600 on 11 October, when the seismicity increased to 125 continuous RSAM units.
The responsible authorities issued an alert that encompassed an area within 4 km from the center of the crater. Because of the elevated energy level of seismicity relative to the previous activity, the National Service of Territorial Studies elected to monitor the volcano and report developments to the National System of Civil Defense.
As of 15 October 2006, the level of activity at San Miguel was considered to be moderate, implying the possibility of an eruption sometime in the next several months. The civil defense authorities established a Yellow alert level (phase 3) for the area within 4 km of the crater center but later reduced it to Green. Around 15 October the RSAM continued to vary from 8 units to 45 units. During the preceding 24 hours, 55 earthquakes were registered; however, none were noticed by the local population. Sulfur dioxide (SO2) fluxes reached 150-250 metric tons per day, which was considered a low level. On 16 October, tremor fluctuated between 45 and 50 units, and 25 earthquakes were recorded but not felt by residents.
The period from the October 2006 activity through July 2007 was essentially devoid of any abnormal variations in seismicity, volcanism, or elevated gas emissions.
On 4 July 2007, volcanologists from Servicio Nacional de Estudios Territoriales (SNET) and Michigan Technological University climbed San Miguel to make observations and take fumarole temperatures. The volcano remained at a low level of activity. The crater morphology and the intensity and location of fumaroles within the crater remained similar to that observed in recent visits (e.g., October 2006 BGVN 31:10). The main fumarolic area was near the bottom of the crater on the S wall (figure 8). Other sparse fumaroles were present, with most clustered near the crater bottom and on the crater's W wall.
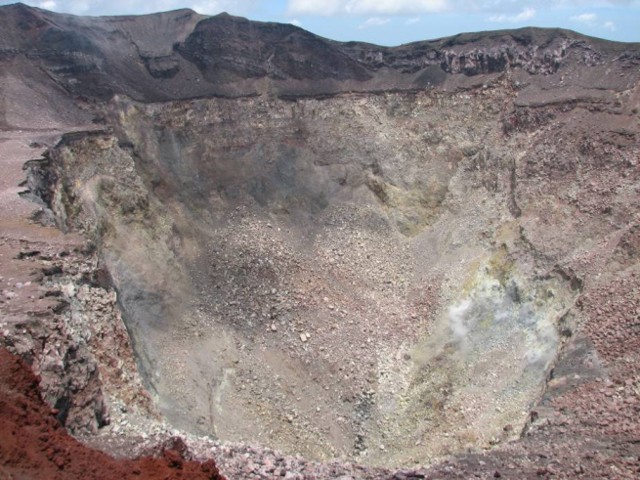 |
Figure 8. View of the crater at San Miguel, looking S on 4 July 2007. The whitish area in the bottom right of the photo reflects steaming from the main fumarole field. Courtesy of Servicio Nacional de Estudios Territoriales (SNET) and Michigan Technological University. |
Fumarole measurements: Temperatures were measured at two fumarolic areas on the upper W crater wall (figure 9). These are visited by SNET on a regular basis and comprise the only fumaroles safely accessible from the rim. Temperatures at fumaroles 1 and 2 were 67°C and 57°C, respectively. The gas lacked any sulfurous smell, suggesting water vapor only. These fumarole temperatures are similar to those measured in recent visits.
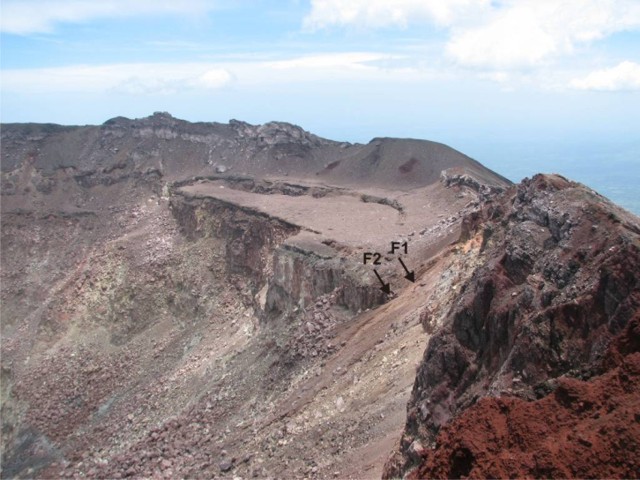 |
Figure 9. View of the W side of San Miguel's crater, taken from the N rim. Fumaroles 1 (F1) and 2 (F2) are in the right central portion of the image. Courtesy of Servicio Nacional de Estudios Territoriales (SNET) and Michigan Tech University. |
References. Chesner, C.A., Pullinger, C., Escobar, C.D., 2003, Physical and chemical evolution of San Miguel Volcano, El Salvador. GSA Special Paper 375.
Escobar, C.D., 2003, San Miguel Volcano and its Volcanic Hazards: MS thesis, Michigan Technological University, December 2003, 163 p.
Major, J.J., Schilling, S.P., Pullinger, C.R., Escobar, C.D., Chesner, C.A, and Howell, M.M., 2001, Lahar-Hazard Zonation for San Miguel Volcano, El Salvador: U.S. Geological Survey Open-File Report 01-395 (Available on-line).
Information Contacts: Eduardo Gutierrez, Demetrio Escobar, and Francisco Montalvo, Servicio Nacional de Estudios Territoriales (SNET), Km. 5 ½ carretera a Santa Tecla y Calle las Mercedes, contiguo a Parque de Pelota, Edificio SNET, Apartado Postal #27, Centro de Gobierno, El Salvador (URL: http://www.snet.gob.sv/); Matthew Patrick and Anna Colvin, Dept. of Geological and Mining Engineering and Sciences, Michigan Tech University, 1400 Townsend Drive, Houghton, MI 49931, USA.
Eruption on 29 December 2013 with 9.7-km-high ash plume
San Miguel volcano, known locally as Chaparrastique, is one of the most active in El Salvador. This report covers activity from August 2007 through December 2014. Information is taken from Servicio Nacional de Estudios Territoriales (SNET) unless otherwise noted. The last reported eruption of San Miguel occurred as a gas-and-steam plume with a small amount of ash on 16 January 2002 (BGVN 27:02). Between 2002 and July 2007 there were no eruptions, and seismicity remained within background levels, except for a single episode during 9-15 October 2006 (BGVN 32:09). Typical activity at the volcano during this time was characterized by small fumaroles and landslides within the central crater, and a few small lahars associated with heavy rainfall.
Between August 2007 and December 2013, the volcano had intermittent pulses of seismic and fumarolic activity, but no ash eruptions. With almost no advance warning, San Miguel erupted on 29 December 2013, and caused the evacuation of a few surrounding villages. It quickly returned to lower levels of activity in early 2014, but continued emitting small ash-bearing plumes intermittently through July of 2014.
Activity during August 2007-November 2008. At San Miguel, SNET monitors seismic activity, fumarolic activity, gas emissions, and nearby water chemistry. From August 2007 through November 2008, Real-time Seismic Amplitude Measurements (RSAM) values (typically between 12 and 50 units) and other measurements rarely exceeded baseline levels. Rapid fluctuations of internal gas pressure, measured by RSAM, suggested continued degassing of the volcano. The largest variation from background levels occurred in the second week of October 2007 when RSAM values reached levels between 100 and 400 units for 5 days before dropping to background levels. Moderate to loud cracks and pops from gas releases were common sounds in the summit area. No reports were found for the December 2008-May 2009 period.
Activity during June 2009-November 2013. Typical seismic behavior during this time, according to SNET monthly reports, included sporadic elevations in RSAM values lasting for a few days every few months; values were usually in the 100-300 unit range, with periodic spikes to 660 units. Small earthquake swarms also occurred a number of times (June and July 2009, July and August 2010, March and April 2011, July and August 2011, November 2011, March and April 2013, and September 2013). Most of the swarms originated below the NNE flank.
Temperature measurements inside the crater varied during this period as well. For example, in December 2010 the temperature, as measured in the fumarole field with a thermal camera, fluctuated between 82 and 112°C, and in March of 2011, infrared images revealed variations between 112 and 121°C. The temperature in the main fumarole field was 134°C in November of 2011, which was 13°C higher than historical averages. By May of 2013, however, fumarole temperatures were back down to 70-87°C.
SO2 emission rate variation during this period was very low. A mild sulfur odor was occasionally reported by SNET geologists on visits to the summit. Normal SO2 values for San Miguel range between 100 and 437 tons/day, and the recorded values only exceeded this range consistently in May, July, and August 2013 (with values up to 900 t/d).
Fumarolic activity increased and decreased periodically during this time reflecting variable degassing of the volcano. SNET reports the noise level of the fumaroles as an indication of activity; most of the time they sounded like a "pressure cooker," and occasionally the noise levels increased to those like "a jet engine." Intermittent steam plumes were observed rising to 100 or 200 m above the crater.
No significant lahars were reported during the periods of high precipitation, although a number of fresh debris deposits (up to 20,000 cubic meters in estimated size) were observed in drainages near and across the access road to the volcano during the rainy seasons, especially in June and July 2013.
Various indicator values at the volcano all remained at or near background values through the middle of December 2013.
Eruption of 29 December 2013. A special report by MARN (Ministerio de Medio Ambiente Y Recursos Naturales) noted the sudden eruption of San Miguel at 1030 local time on 29 December (figure 10). The main eruptive phase lasted until 1300. Washington VAAC reported that the ash plume rose to an altitude of 9.7 km (32,000 ft) and drifted ENE at altitudes above 6 km and W at lower altitudes (figures 11, 12).
 |
Figure 10. San Miguel volcano (Chaparrastique) erupts, 29 December 2013. Courtesy of REUTERS/Stringer. |
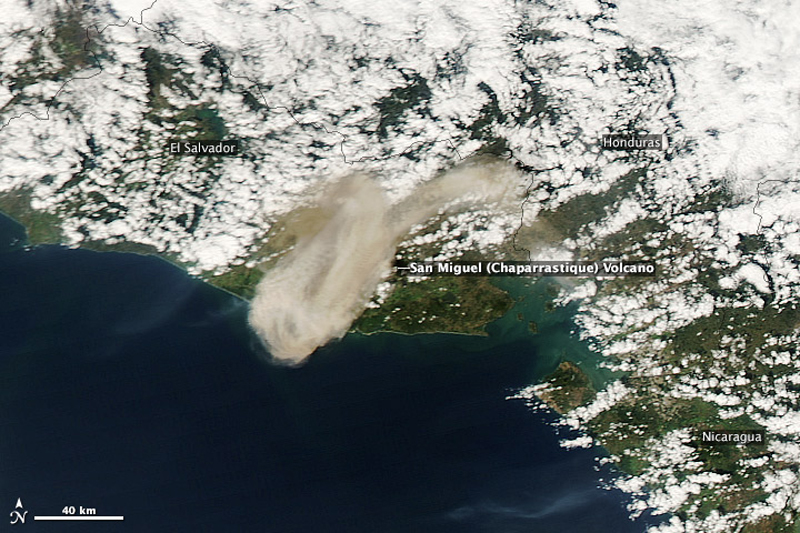 |
Figure 11. Volcanic ash from the eruption traveled more than 70 km downwind to the SW on 29 December 2013. It also traveled ENE of the volcano at higher elevations. Courtesy of NASA Earth Observatory (Jeff Schmaltz, LANCE/EOSDIS MODIS Rapid Response Team). |
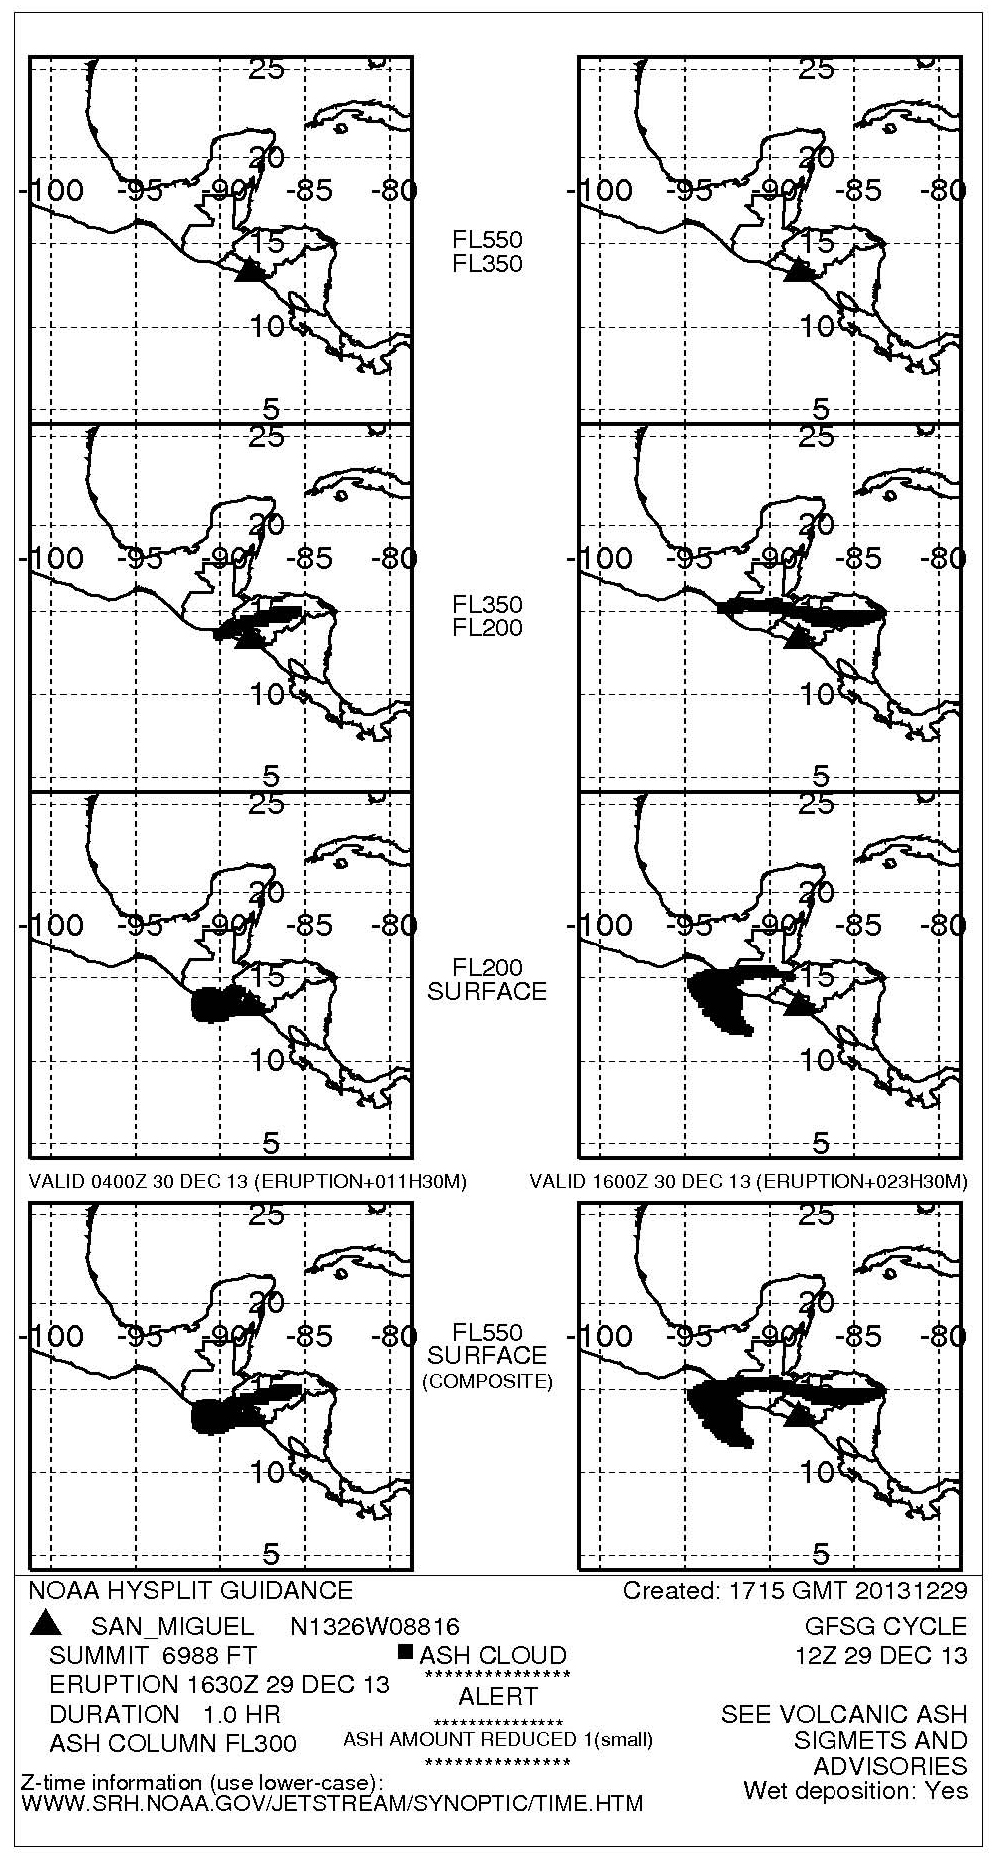 |
Figure 12. NOAA ash column map showing ash cloud dispersion in different directions. From the surface to 6 km, the cloud drifted W, and between 6 and 10 km the cloud drifted ENE.Courtesy of Washington Volcanic Ash Advisory Center. |
On 31 December MARN geoscientists estimated that the eruption deposits around the crater were about 50 cm thick. There was no incandescense at the crater, increase in emissions, or an increase in fumarole temperature prior to the eruption. The seismic stations recorded a sudden and dramatic increase in RSAM values at the time of the eruption. Only a very small increase in the average RSAM values was observed mid-December (figure 13).
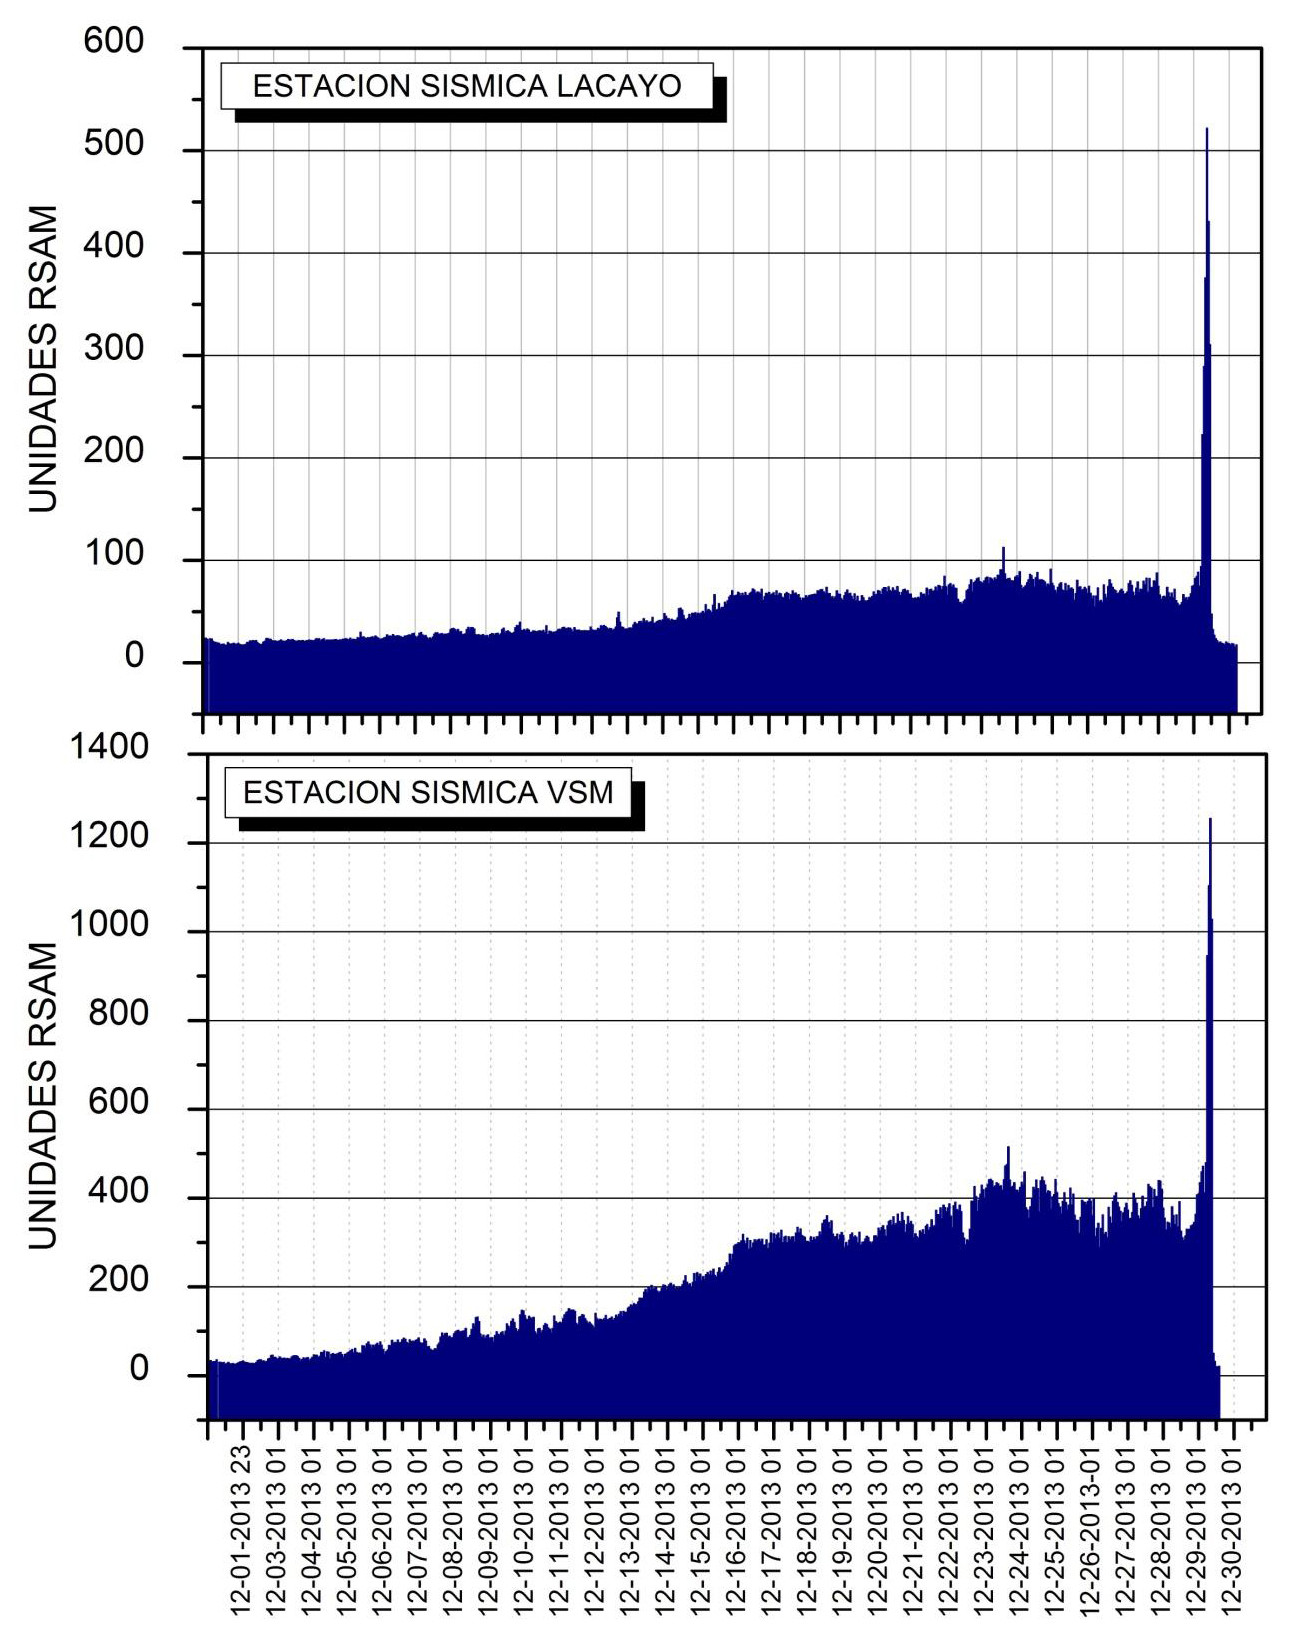 |
Figure 13. RSAM values from two seismic stations on the flanks of San Miguel for December 2013. They show a slight increase in average RSAM values in mid-December and the sudden spike on the morning of the eruption, 29 December. Figure from MARN Special Report. |
The sudden spike in RSAM values on 29 December was similar to seven prior spikes that were not associated with eruptions between October 2006 and December 2013 (figure 14).
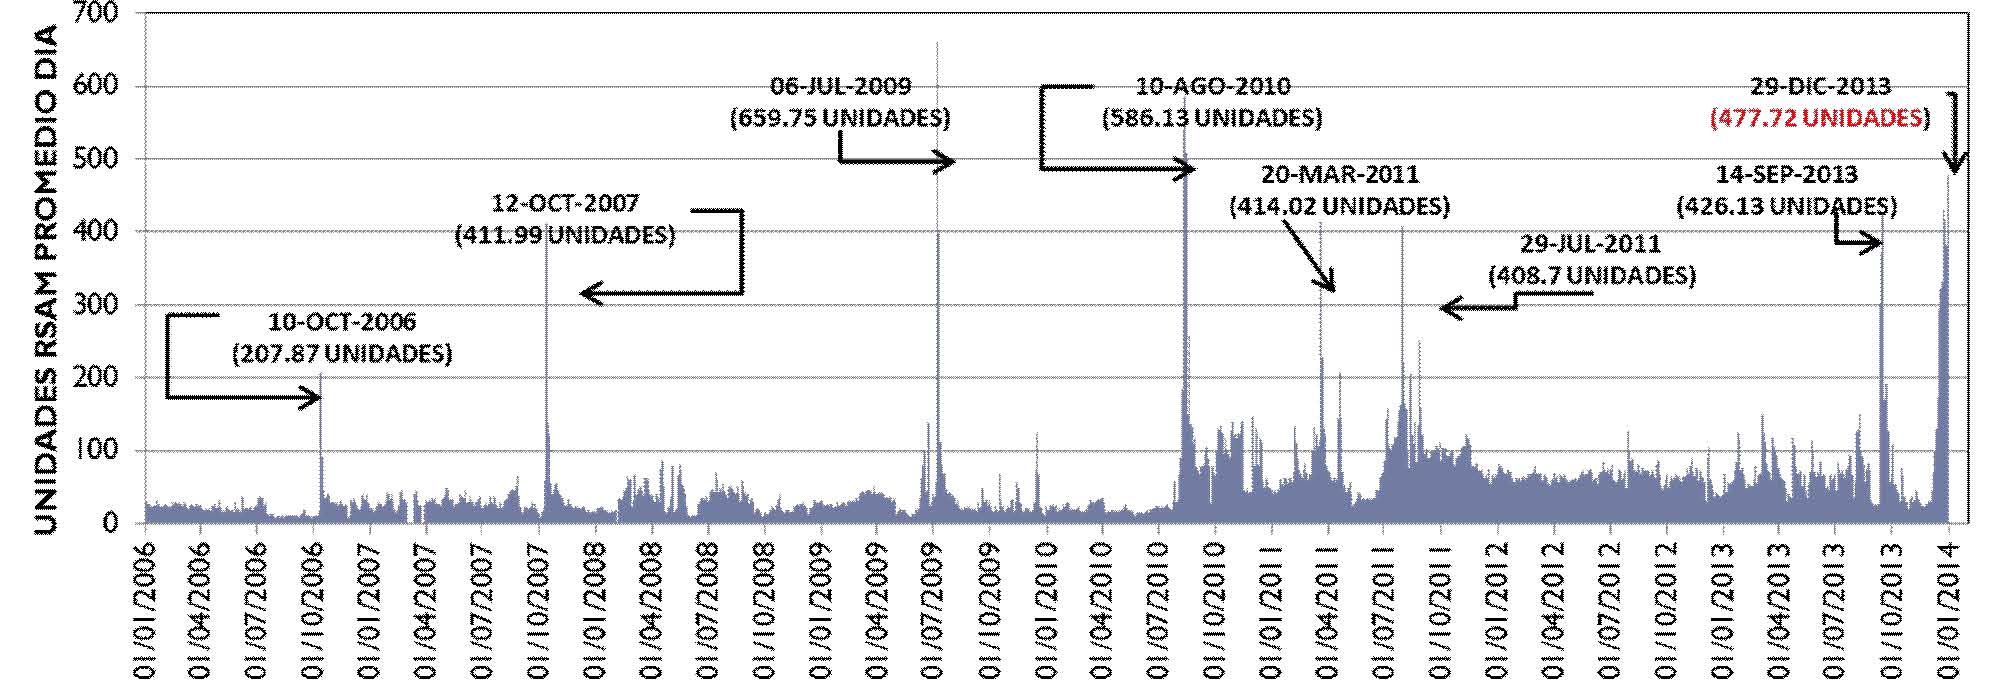 |
Figure 14. Daily average RSAM values from 1 January 2006 through 1 January 2014. Seven similar spikes of RSAM values during this time were not associated with eruptions. Figure from MARN special report. |
Hourly RSAM values recorded on 29 December show an increase above background levels at 0700, only three and a half hours before the eruption. By 1300 values had dropped back below previous levels. SNET reported that sulfur dioxide flux increased from 637 tons per day on 29 December, peaking at 2200 t/day on 31 December.
Ashfall deposits were observed in Santiago de Maria (1 mm), Placitas (5 mm) and San Jorge (2 mm) (figure 15).
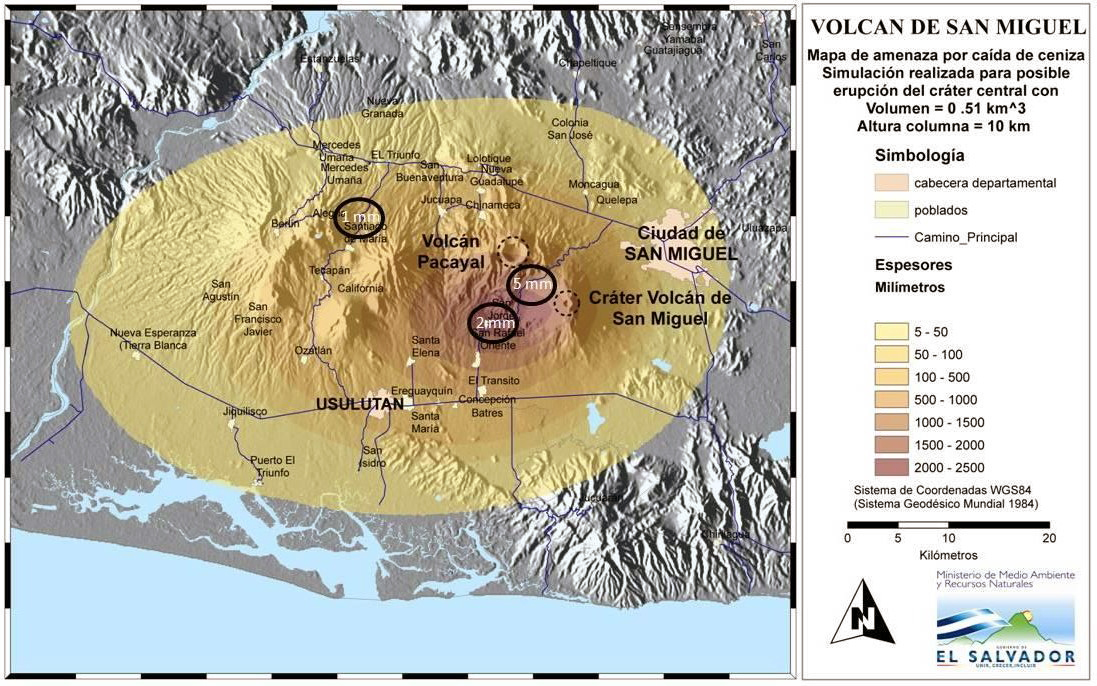 |
Figure 15. Ashfall hazard map with data points and simulation of the eruption from the central crater, with a volume of .51 km3 and a 10 km high plume. Figure from MARN Special Report. |
Activity during 2014. RSAM values quickly dropped back to normal levels within hours after the 29 December eruption. In January light-gray gas plumes continued to rise 100-250 m above the crater and drift generally S and SW. A spike to 262 RSAM units was attributed to a magma injection on 23 January. Small magnitude earthquakes (179) continued in the volcano area in February. Average RSAM values steadily increased from mid-January to late February from values below 200 to over 400 before dropping back below 200 at the beginning of March 2014. White and light-gray plumes rising to 300 m were reported in February and March. A small explosion occurred at 1644 on 12 February, but no additional information was given by MARN. Moderate SO2 emissions were also reported during this time. Decreasing seismicity was recorded in March and April.
SNET reported that on 12 April moderate-to-strong gas plumes rose from the crater and drifted SW. The biggest plume occurred at 1607 and rose 400 m. Images recorded by a webcam showed that the plumes had dark tones, suggesting small amounts of ash. Another plume, rising between 400 and 600 m was recorded on 29 April with the thermal camera, but visual observations were obscured by weather conditions.
The volcano was more active from May to July 2014 with at least nine episodes of ashfall reported. The firstwas observed in areas between the Parque de las Placitas and Placitas on 10 May with deposits less than 1 mm thick. From 18-20 May, an increase in the frequency and magnitude of gas emissions, rumbling in the crater, and small explosions were followed by juvenile ashfall. Less than 1 mm of ash fell about 9 km to the WSW of the volcano in San Jorge on 18 May. On 19 and 20 May the webcam recorded periodic pulses of gray gas plumes that rose 300 m and drifted W. During 22-23 May MARN reported that heavy rains at San Miguel caused lahars that originated from the upper part of the volcano and were heard by residents. Seismicity and gas output both remained high during this time, with gas plumes rising 300 m and drifting W. Locals observed gas plumes with occasional minor amounts of ash rising from the crater, especially after rainfall. Rumbling was also reported. The RSAM average values in late May and June were higher than those recorded during the 29 December and 12 February eruptions, raising concerns of a new eruption.
Strombolian activity in June and July was characterized by sudden fluctuations in seismicity (figures 16). Ash emissions during 4, 5 and 6 June caused millimeter-scale ash deposits in areas 3 km N, NW and SW of the crater. On 8 June, 1 mm of ashfall was reported on the N flank. An inspection of the crater on 10 June revealed strong degassing with plumes rising to 200 m, 2 cm of gray ash deposits, and the temperature of the fumaroles at 200°C. Ash emissions were also reported 28, 29 and 30 June. In July seismicity at San Miguel remained intermittently high, especially beneath the N flank, and RSAM reached over 1000 units for 10 consecutive days. A small explosion on 13 July at 0941 sent ash to the WSW. The following day, 1-mm-thick, dark-gray ash deposits were observed on the LACAYO farm, 4 km WSW. On 23 July at 1831 another ash cloud from a small explosion rose 400 m and drifted SW. Minutes later, local observers reported ashfall in the Cantons of La Morita (6 km SW) and Piedra Azul, and also in San Rafael Oriente (11 km SW). At 1806 on 25 July and 2018 on 27 July two additional smaller ash-and-gas explosions occurred. A longer gas-and-ash explosion, lasting fifteen minutes occurred on 28 July at 0615. Both the 27 and 28 July explosions rose between 300 and 500 m and drifted SW. Local and Civil Protection of San Jorge observers reported millimeter depth ashfall from these two events in the cantons of La Morita, La Piedrita, and La Ceiba, located WSW of the crater. These were the last reported ash emissions in 2014.
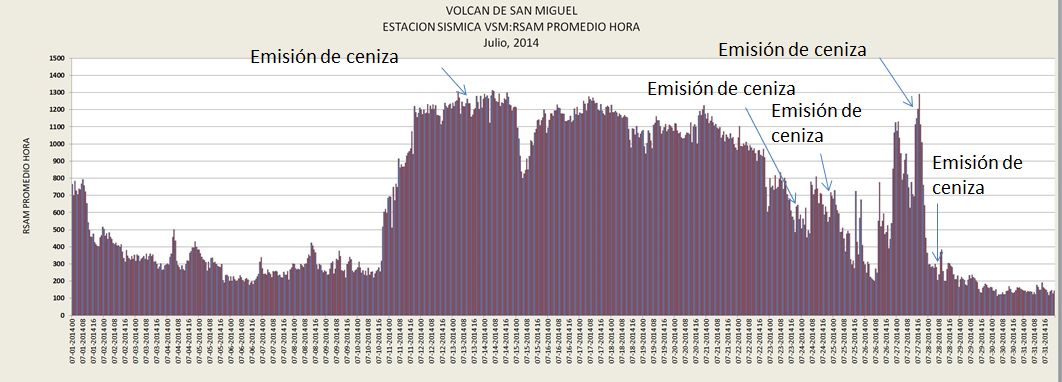 |
Figure 16. Average hourly RSAM values from the VSM seismic station and ash emissions (Emision de ceniza) for July 2014. Courtesy of SNET. |
Activity at San Miguel showed signs of decreasing in August 2014; fewer days of elevated SO2 and above-baseline RSAM were recorded, no ash emissions were reported, and only white or whitish gray steam or steam-and-gas plumes (interpreted by MARN as water vapor and SO2 emissions) rose 100-200 m above the crater. Heavy rains during 10-11 August generated two landslides along the creeks that flow down the SW and NE flanks of the volcano, causing some damage to the small communities in the region, including San Jorge located 9 km WSW of the summit. SO2 emissions and seismicity spiked briefly from 31 August to 5 September (RSAM spiked to 1113 on 2 September, SO2 reached 1135 t/d). Mudslides caused minor damage in early September.
Through December 2014 activity remained slightly elevated with RSAM values ranging between 50 and 387 units (figure 17), pulses of SO2 emissions spiking to 1739 t/day, gas plumes rising no more than 400 m above the crater, and smaller numbers of earthquakes. There were no reports of explosions with ash emissions, and no significant change in the temperature inside the crater during this time.
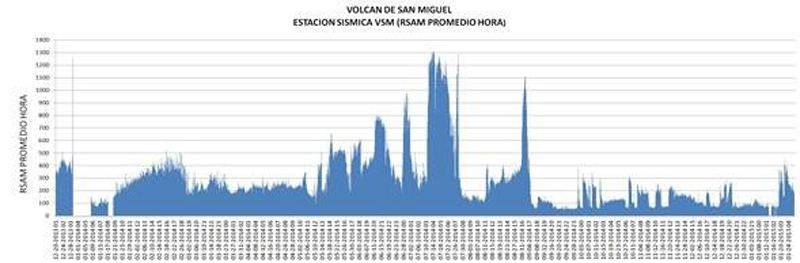 |
Figure 17. Hourly average RSAM values from the VSM Seismic Station from 20 December 2013, just prior to the 29 December eruption, through the end of December 2014. The vertical scale goes to 1400 RSAM. Average values decreased significantly after August 2014. |
Information Contacts: Servicio Nacional de Estudios Territoriales (SNET), Km. 5 1/2 carretera a Santa Tecla y Calle las Mercedes, contiguo a Parque de Pelota, Edificio SNET, Apartado Postal #27, Centro de Gobierno, El Salvador 2283-2246 (URL: http://www.snet.gob.sv/); Reuters (URL: http://www.reuters.com/, http://news.yahoo.com/el-salvador-volcano-erupts-evacuations-ordered-194649069.html); Washington Volcanic Ash Advisory Center (VAAC), Satellite Analysis Branch (SAB), NOAA/NESDIS E/SP23, NOAA Science Center Room 401, 5200 Auth Rd, Camp Springs, MD 20746, USA (URL: http://www.ospo.noaa.gov/Products/atmosphere/vaac/); NASA Earth Observatory, EOS Project Science Office, NASA Goddard Space Flight Center, Goddard, Maryland, USA (URL: http://earthobservatory.nasa.gov/)
Six small ash emission events during January 2015-June 2017
Volcán de San Miguel (Chaparrastique), in southern El Salvador, was active with several flank lava flows during the 17th-19th centuries, but recent activity has consisted of occasional ash eruptions from the summit crater. The beginning of the most recent eruption on 29 December 2013 resulted in a large ash plume that rose to 9.7 km altitude, and dispersed ash to many communities within 30 km of the volcano (BGVN 40:08). Intermittent ash plumes lasted through 28 July 2014. This report covers activity from January 2015 through June 2017, and describes six small ash emission events during this time. Information about San Miguel comes from the the Ministero de Medio Ambiente y Recursos Naturales (MARN) of El Salvador, and the Washington Volcanic Ash Advisory Center (VAAC).
Six ash-bearing explosions occurred at San Miguel between January 2015 and June 2017. Otherwise, minor seismicity and pulses of gas-and-steam emissions were the primary type of activity. The explosion on 26 January 2015 sent a plume 300 m above the crater, drifting SW. An explosion on 11 April 2015 resulted in an ash plume rising about 800 m above the crater that also drifted SW. Trace amounts of ash were emitted on 13 August 2015. The largest explosion of the period took place on 12 January 2016, when an ash plume drifting W caused ashfall as far as 25 km away, and the plume was ultimately visible as far as 300 km from the volcano. Incandescence was observed at the base of the 900-m-high eruptive column that appeared on 18 June 2016. Minor ash emissions were reported on 7 January 2017 drifting 130 km SW from San Miguel. Minor seismic swarms and steam-and-gas plumes were reported during February-June 2017.
Activity during 2015. After very little activity other than slightly elevated RSAM values since July 2014, a small ash-bearing explosion occurred on 26 January 2015 (figure 18). The ash plume rose about 300 m above the crater and drifted SW, dissipating quickly. Trace amounts of ash fell in the Piedra Azul area about 6 km SW of the crater.
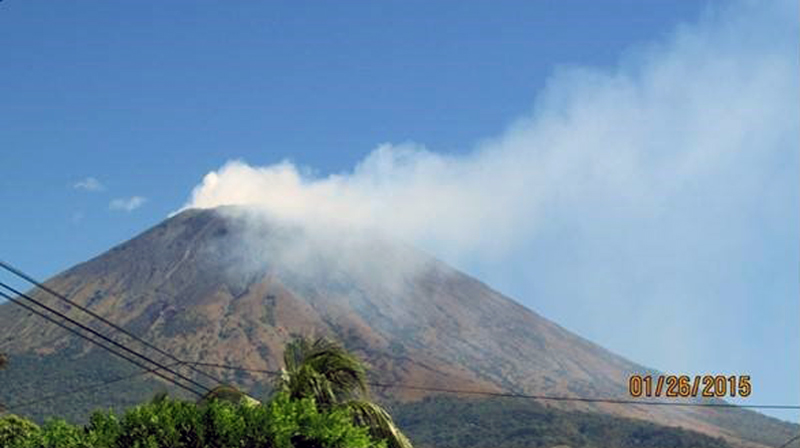 |
Figure 18. Gas-and-steam emissions at San Miguel on 26 January 2015, after an ash-bearing explosion that occurred earlier in the day. Courtesy of MARN (Informe Especial No. 8. Continúa constante emanación de gases del volcán Chaparrastique January 27, 2015 at 11:21 am). |
Another emission lasting for 20 minutes on 22 February 2015 sent a column of gas 300 m above the crater that dispersed to the SSW; no ash was observed. Occasional pulses of gas were reported during March rising 200 m above the summit crater. An explosion on 11 April 2015 resulted in an ash plume rising about 800 m above the crater and drifting SW. Local observers reported a millimeter of ashfall in the areas of La Piedra, Morita, and San Jorge, less than 10 km to the SW.
Occasional small pulses of gas that rose to about 200 m above the crater were typical behavior during May-July (figure 19). On 13 August 2015, the webcam captured a gas plume emission that contained minor amounts of ash and rose 200-300 m above the crater. A millimeter of ashfall was reported in San Jorge, and near the communities of Moritas and Piedrita to the SW. No emissions were reported during September, and the small pulses of gas observed during October did not exceed 200 m above the summit crater. No anomalous activity was reported during November, and small discrete pulses of gas were the only activity reported for December 2015.
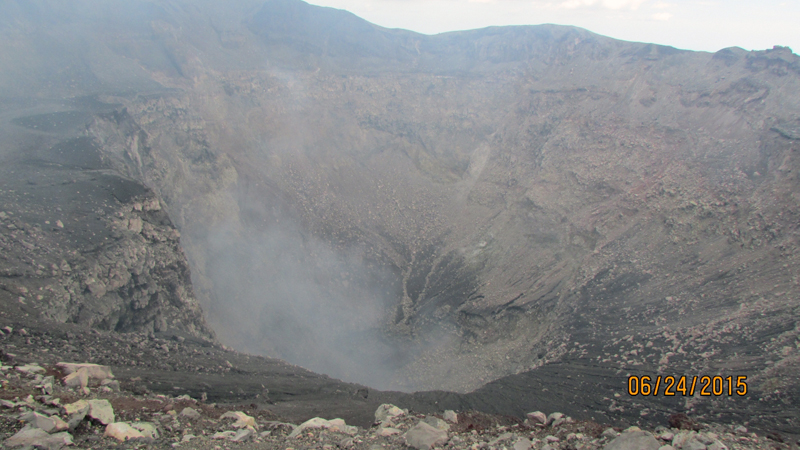 |
Figure 19. Diffuse degassing from the summit crater at San Miguel on 24 June 2015. Courtesy of MARN (Informe Mensual de Monitoreo Volcánico Junio, 2015). |
Activity during 2016. San Miguel began the year with what MARN described as a VEI 1 eruption of ash and gas on 12 January 2016 (figure 20). Periodic pulses of ash and gas lasting 3-5 minutes rose to less than 1,000 m above the crater and drifted WSW. Ashfall was reported from La Piedra, Moritas, La Placita, San Jorge, (all less than 10 km SW), San Rafael Oriente (10 km SW), Alegría (25 km NW) and Berlin in Usulután (21 km SW).
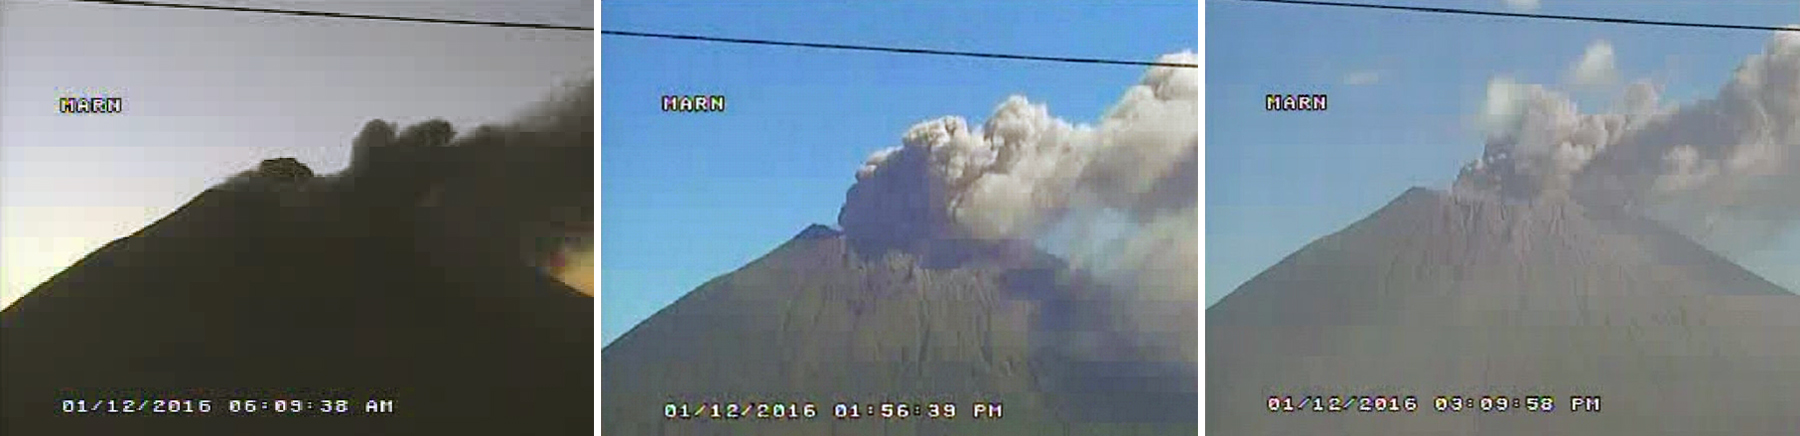 |
Figure 20. Ash eruption at San Miguel in the early morning of 12 January 2016. Image from the MARN webcam on the N side of the volcano. Courtesy of MARN (Informe Mensual de Monitoreo Volcánico Enero, 2016). |
NASA Earth Observatory captured images of two pulses of ash from the 12 January eruption that show the changing direction of the plume (figure 21). The first image, taken at 1635 (UTC) shows the ash plume headed directly W. The second image, taken three hours later at 1935 shows the active plume drifting SW, with the earlier plume segment farther to the W over the Pacific Ocean. The Washington VAAC reported the ash emission at 2.4 km altitude (300 m above the summit crater) drifting WSW at 1745 (UTC). At that time, the denser part of the plume extended 45 km from the volcano and the diffuse, wispy plume extended 130 km WSW. By midday on 13 January, the Washington VAAC reported ongoing emissions and that the plume extended 300 km SW. The plume was no longer visible in satellite images by the end of the day.
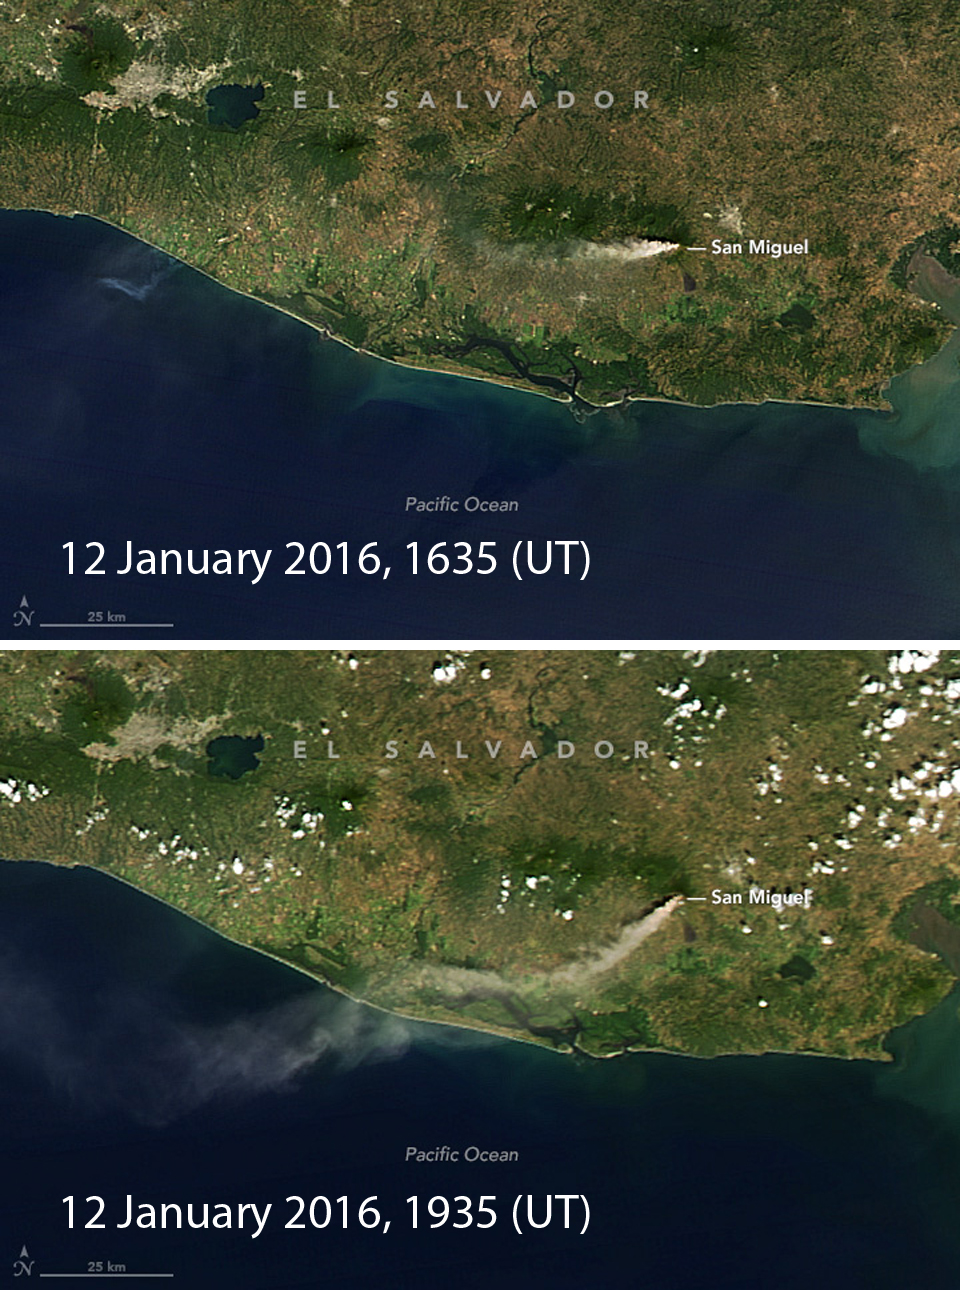 |
Figure 21. Moderate Resolution Imaging Spectroradiometer (MODIS) sensors on NASA's Aqua and Terra satellites acquired these natural-color images of ash streaming from San Miguel on 12 January 2016. Terra captured the upper image at 1035 local time (1635 UTC) which shows the ash plume drifting W; Aqua captured the lower image three hours later at 1335 local time (1935 UTC), and it shows the SW drift of the plume with the older remnant to the W over the Pacific Ocean. Courtesy of NASA Earth Observatory. |
Seismicity declined during 12-14 January 2016. On 15 January, local observers reported a millimeter of ash deposited in Las Cruces on the N flank. Gas emissions during 17-18 January were weak, only rising 150 m. At 0900 on 18 January, the emission plume became dark and drifted SW. By the next crater inspection on 19 February, MARN scientists noted only minor degassing from the summit crater.
Although a period of volcanic tremor occurred on 8 March 2016, only short pulses of gas were observed that did not rise more than 150 m above the crater. Another spike in seismicity occurred on 3 April, but no gas or ash emissions were observed. Otherwise, only minor pulses of gas issued from the crater during February through May. A seismic swarm indicating rock fracturing at depth on 31 May could have resulted in trace amounts of ash deposited within the crater, but cloudy weather prevented observations. A few pulses of gas were observed from the webcam other times during May.
Seismic activity increased significantly during the second week in June. An explosion in the early morning of 18 June 2016 lasted about 60 seconds, and sent an ash emission to about 900 m above the crater (figure 22). Incandescence was observed within the eruptive column, and the debris fell about 100 m down the N flank. Ashfall of less than half a millimeter was reported in the El Volcan area about 7 km NE of the crater. The volcanologist who examined the ash determined that it was juvenile material from a magmatic explosion. A continuous column of steam-and-gas issued from the crater until 29 June (figure 23). During this time, local observers and officials from the Civil Protection of San Jorge reported sulfur odors and slight acid rain damage to the vegetation in the La Morita, La Piedrita, La Ceiba, and LACAYO farms, located about 4 km W of the crater.
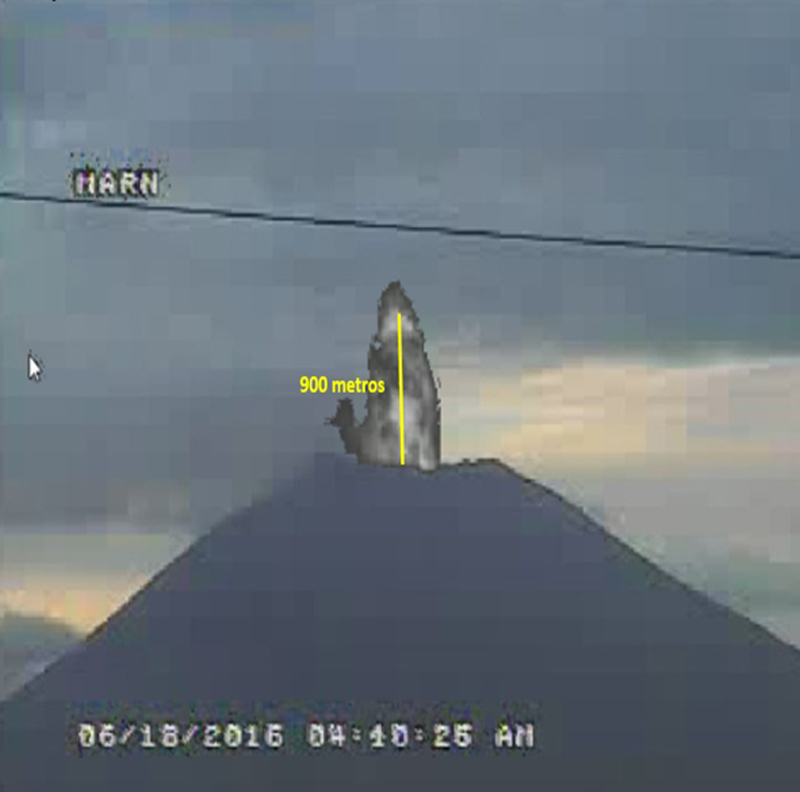 |
Figure 22. The pre-dawn eruption of 18 June 2016 at San Miguel photographed from the MARN webcam. The ash emission rose to about 900 m above the summit crater. Courtesy of MARN (Informe Mensual de Monitoreo Volcánico Junio, 2016). |
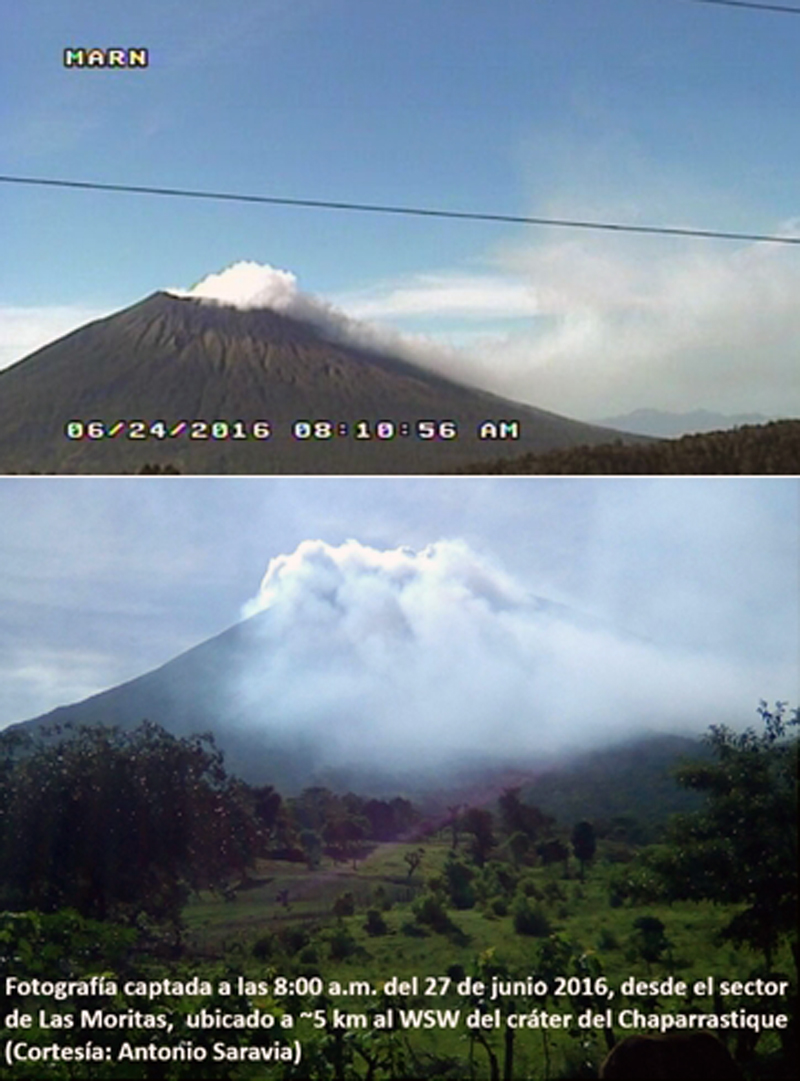 |
Figure 23. Gas plumes from San Miguel during the second half of June 2016 caused acid rain damage to vegetation W of the volcano. Upper image from the MARN webcam taken on 24 June 2016. The lower image was taken at 0800 on 27 June near Las Moritas, about 5 km WSW of the crater by Antonio Saravia. Courtesy of MARN (Informe Mensual de Monitoreo Volcánico Junio, 2016). |
Seismic activity was slightly elevated during the first half of July 2016, but otherwise only small pulses of gas were observed from the crater. Low-level activity continued from the summit crater during August. On 29 August, however, a seismic signal indicative of a lahar was noted near the VSM (Santa Isabel) seismic station, but no damage was reported. Periodic pulses of gases were noted during September 2016. A 20-minute-long seismic signal on 5 September indicated another lahar passing near seismic station VSM, but no damage was reported. GPS measurements during September indicated deformation of a few millimeters on the N flank. No explosions were reported during October-December 2016, only small plumes of steam and gas were observed (figure 24).
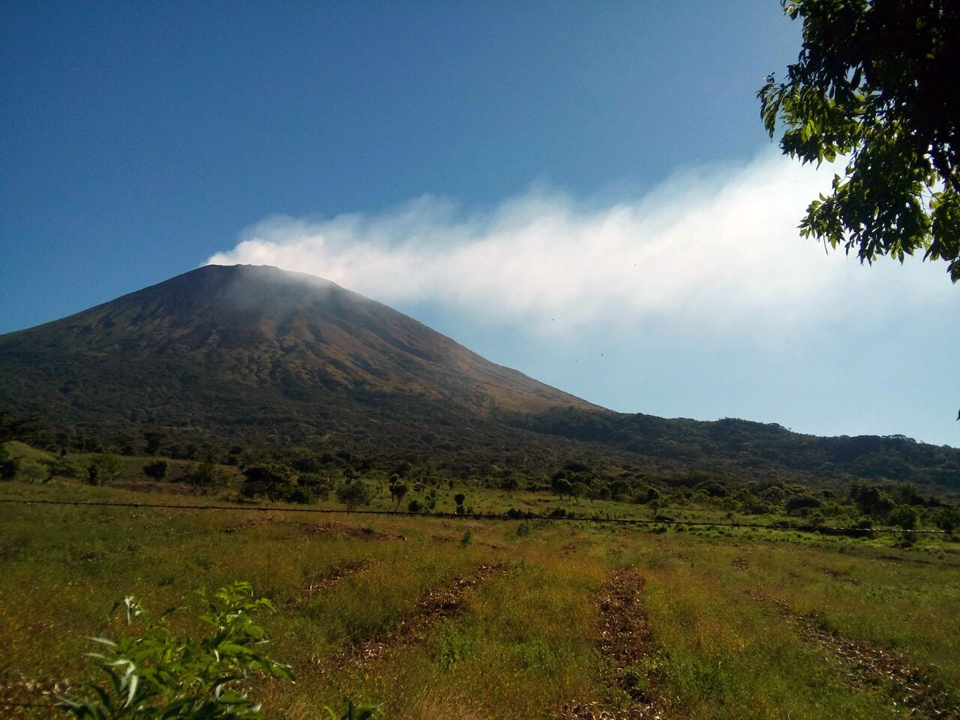 |
Figure 24. Steam-and-gas plumes blowing SW from San Miguel during December 2016. Image taken by the webcam located at the El Pacayal (Chinameca) volcano about 8 km S. Courtesy of MARN (Informe Mensual de Monitoreo Volcánico Diciembre, 2016). |
Activity during January-June 2017. On 7 January 2017, the Washington VAAC reported minor volcanic ash emissions from San Miguel at 2.6 km altitude extending SW about 130 km from the summit. Mild degassing continued during February and March. A brief seismic swarm occurred on 17 April 2017, but no explosions of gas or ash were observed in the webcam. A strong gas plume rose 1.2 km above the crater rim on 27 April. Seismicity decreased during May. Other than small gas plumes, the only activity reported during June 2017 was a slight increase in seismicity beginning on 12 June and lasting to the end of the month.
Information Contacts: Ministero de Medio Ambiente y Recursos Naturales (MARN), Km. 5½ Carretera a Nueva San Salvador, Avenida las Mercedes, San Salvador, El Salvador (URL: http://www.snet.gob.sv/ver/vulcanologia); Washington Volcanic Ash Advisory Center (VAAC), Satellite Analysis Branch (SAB), NOAA/NESDIS OSPO, NOAA Science Center Room 401, 5200 Auth Rd, Camp Springs, MD 20746, USA (URL: http://www.ospo.noaa.gov/Products/atmosphere/vaac/, archive at: http://www.ssd.noaa.gov/VAAC/archive.html).
Intermittent small ash emissions between 14 January and 30 May 2018
El Salvador's San Miguel, also known as Chaparrastique, had six small ash emission events during January 2015-June 2017 (BGVN 42:07). New activity consisting of intermittent ash emissions began on 14 January and continued until 30 May 2018, reported below based on information provided by El Salvador's Servicio Nacional de Estudios Territoriales (SNET) and special reports from the Ministero de Medio Ambiente y Recursos Naturales (MARN).
SNET and MARN reported that during 14-17 January 2018 there were four gas-and-ash emissions from San Miguel that rose no higher than 300 m above the crater rim, at least one of which dispersed SW. The reports noted that prior to each emission seismicity decreased and then suddenly increased. MARN reported that during 25-26 January seismic tremor levels fluctuated between 75 and 179 RSAM (Real-time Seismic Amplitude Measurement) units per hour on average, slightly above normal (50-150 units).
On 19 February, MARN reported the beginning of sustained gas emissions along with small ash emissions. The plume did not exceed 350 m above and was displaced by winds to the SW. This activity was similar to the activity on 14-15 January 2018.
SNET reported on 2 March that gas plumes rose as high as 400 m above the crater rim during the previous week. Ash appeared in "gas pulse" emissions on 24, 26, and 28 February, and 1 March. RSAM values fluctuated between 70 and 179 units during 1-2 March. At 2200 on 5 March seismic amplitude began to increase, with RSAM values rising to as high as 318 units by 0600 on 6 March. A webcam recorded minor gas emission during 5-6 March. MARN reported that RSAM values fluctuated between 68 and 248 units, with an average of 156 during 8-9 March. Continued volcanic tremor during 9-16 March was noted, along with persistent low-level degassing from the central crater. Volcanic tremor levels during 15-16 March fluctuated between 77 and 203 RSAM units per hour, with an average of 124.
By early April, MARN had noted a decrease in activity. On 3 April it reported that RSAM levels varied between 46 and 87 units, with an average of 55. Activity increased briefly during 7-13 April, and MARN reported that periodic microseisms combined with changes in seismic tremor and gas pulses had increased significantly, reaching maximum values of 400 RSAM units in an average hour (figure 25).
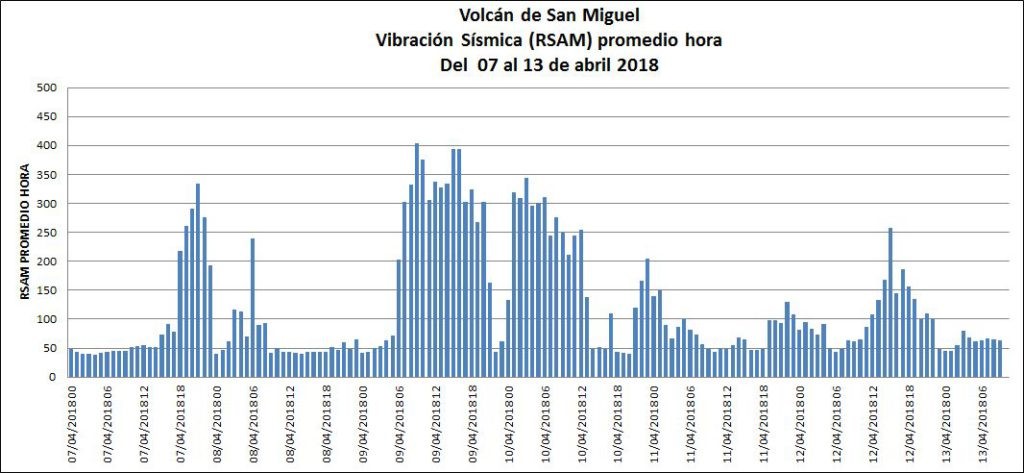 |
Figure 25. RSAM values at San Miguel during 7-13 April 2018. Courtesy of Ministero de Medio Ambiente y Recursos Naturales (MARN). |
Discrete earthquakes were detected between 13 and 17 April, and discontinuous volcanic tremor during 17-18 April was associated with weak, sporadic degassing from the central crater. Seismicity reached maximum values of 216 RSAM units in an average hour.
MARN reported that during 20-27 April volcanic tremor fluctuated between 37 and 106 RSAM units per average hour. Seismicity was low during 28 April-4 May, with RSAM between 39 and 61 units per hour.
In May MARN reported that the volcanic activity had declined compared to April. As of 18 May there was no change in volcanic activity, despite the seismic swarm that started on the night of 5 May felt in the municipalities of Chirilagua-Intipucá, 30 km SE. Average SO2 emission rates were variable during 1 January-6 May 2018 (figure 26).
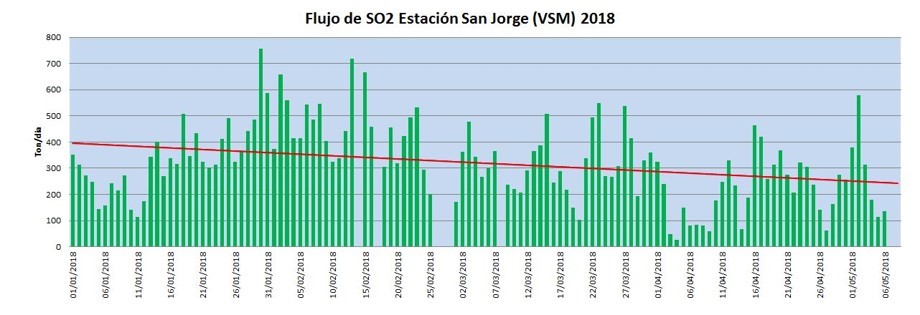 |
Figure 26. Sulfur dioxide emissions at San Miguel between from 1 January-6 May 2018. Courtesy of Ministero de Medio Ambiente y Recursos Naturales (MARN). |
SNET reported a significant increase in the number of low- and high-frequency earthquakes beneath the crater beginning on 22 May. RSAM values fluctuated between 142 and 176 units during 30 May-1 June. Webcam images on 30 May showed a small gray gas emission.
Information Contacts: Servicio Nacional de Estudios Territoriales (SNET), Ministero de Medio Ambiente y Recursos Naturales (MARN), Km. 5½ Carretera a Nueva San Salvador, Avenida las Mercedes, San Salvador, El Salvador (URL: http://www.snet.gob.sv/ver/vulcanologia, http://www.marn.gob.sv/category/avisos/vulcanologia/).
Small ash emissions during 22 February 2020
San Miguel, locally known as Chaparrastique, is a stratovolcano located in El Salvador. Recent activity has consisted of occasional small ash explosions and ash emissions. Infrequent gas-and-steam and ash emissions were observed during this reporting period of June 2018-March 2020. The primary source of information for this report comes from El Salvador's Servicio Nacional de Estudios Territoriales (SNET) and special reports from the Ministero de Medio Ambiente y Recursos Naturales (MARN) in addition to various satellite data.
Based on Sentinel-2 satellite imagery and analyses of infrared MODIS data, volcanism at San Miguel from June 2018 to mid-February was relatively low, consisting of occasional gas-and-steam emissions. During 2019, a weak thermal anomaly in the summit crater was registered in thermal satellite imagery (figure 27). This thermal anomaly persisted during a majority of the year but was not visible after September 2019; faint gas-and-steam emissions could sometimes be seen rising from the summit crater.
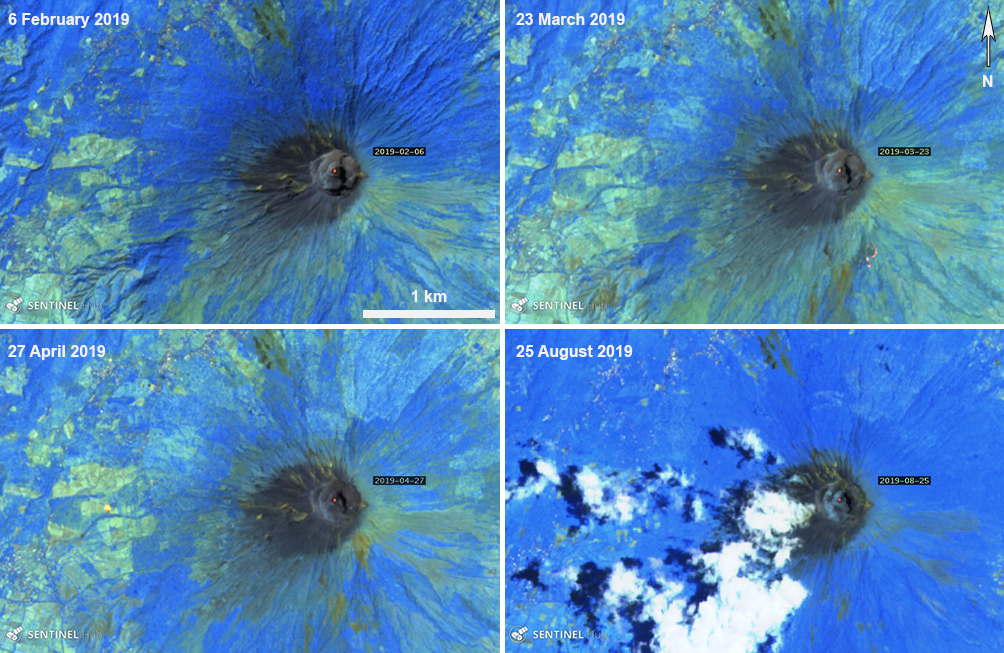 |
Figure 27. Sentinel-2 satellite imagery of a faint but consistent thermal anomaly at San Miguel during 2019. Images with "Atmospheric penetration" (bands 12, 11, 8A) rendering; courtesy of Sentinel Hub Playground. |
Volcanism was prominent beginning on 13-20 February 2020 when SO2 emissions exceeded 620 tons/day (typical low SO2 values are less than 400 tons/day). During 20-21 February the amplitude of microearthquakes increased and minor emissions of gas-and-steam and SO2 were visible within the crater (figure 28). According to SNET and special reports from MARN, on 22 February at 1055 an ash cloud was visible rising 400 m above the crater rim (figure 29), resulting in minor ashfall in Piedra Azul (5 km SW). That same day RSAM values peaked at 550 units as recorded by the VSM station on the upper N flank, which is above normal values of about 150. Seismicity increased the day after the eruptive activity. Minor gas-and-steam emissions continued to rise 400 m above the crater rim during 23-24 February; the RSAM values fell to 33-97 units. Activity in March was relatively low; some seismicity, including small magnitude earthquakes, occurred during the month in addition to SO2 emissions ranging from 517 to 808 tons/day.
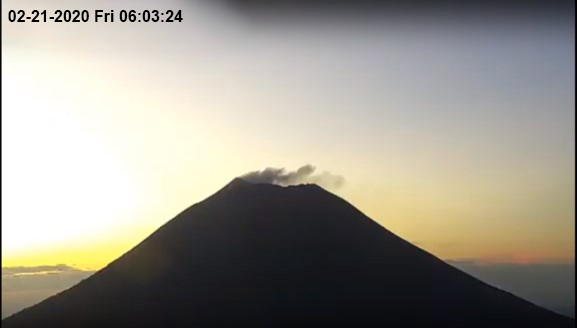 |
Figure 28. Minor gas-and-steam emissions rising from the crater at San Miguel on 21 February 2020. Courtesy of Ministero de Medio Ambiente y Recursos Naturales (MARN). |
 |
Figure 29. Gas-and-steam and ash emissions rising from the crater at San Miguel on 22 February 2020. Courtesy of Ministero de Medio Ambiente y Recursos Naturales (MARN). |
Information Contacts: Servicio Nacional de Estudios Territoriales (SNET), Ministero de Medio Ambiente y Recursos Naturales (MARN), Km. 5½ Carretera a Nueva San Salvador, Avenida las Mercedes, San Salvador, El Salvador (URL: http://www.snet.gob.sv/ver/vulcanologia); Sentinel Hub Playground (URL: https://www.sentinel-hub.com/explore/sentinel-playground).
Frequent explosions, gas-and-ash emissions, and elevated sulfur dioxide during November 2022
San Miguel in El Salvador, also locally known as Chaparrastique, is a broad, deep crater complex that has been frequently modified by eruptions recorded since the early 16th century. Flank eruptions have produced many lava flows, including several during the 17th to 19th centuries that extended to the N, NE, and SE. Eruptive activity during February 2020 consisted of small ash emissions with weak thermal anomalies (BGVN 45:03). This report covers explosive activity during November 2022 based on special reports from the Ministero de Medio Ambiente y Recursos Naturales (MARN) in addition to various satellite data.
According to MARN, an eruption at the central crater began on 15 November that consisted of intermittent phreatic explosions generating gas-and-ash emissions that generally rose 500 m above the crater (figure 30). By 1100 on 20 November a total of 62 phreatic explosions had been recorded, averaging 10 explosions per day. Seismicity was characterized by volcano-tectonic (VT) events, long-period (LP) earthquakes, and tremor (TR).
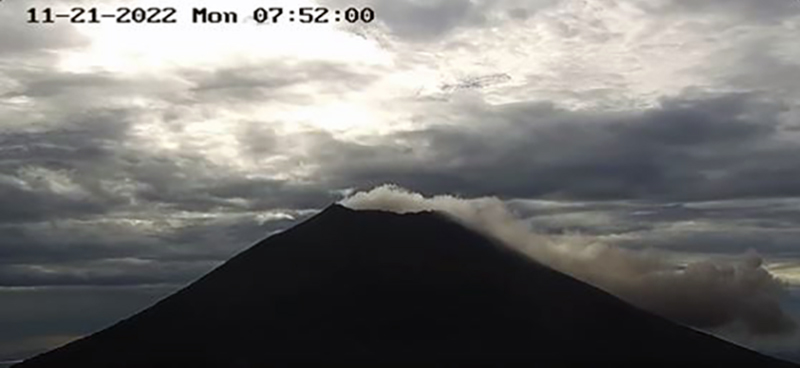 |
Figure 30. Webcam image showing a gas-and-ash plume from San Miguel on 21 November 2022. Courtesy of MARN. |
Eruption plumes at 1336 on 18 November and at 1206 on 19 November rose as high as 1.1 km above the crater rim. Some explosion events were accompanied by crater incandescence during 15-20 November; Sentinel-2 infrared satellite imagery showed a small thermal anomaly at the summit crater on 17 and 22 November (figure 31). Energetic explosions were reported at 1302 and 1642 on 26 November and at 0718 and 0802 on 27 November that ejected hot rocks onto the flanks and generated eruption plumes that rose as high as 1.1 km above the crater rim. A total of 194 explosions were recorded during 15-29 November, with a daily average of 12. On 7 December MARN reported that seismicity had decreased, and no explosions had been detected since 29 November.
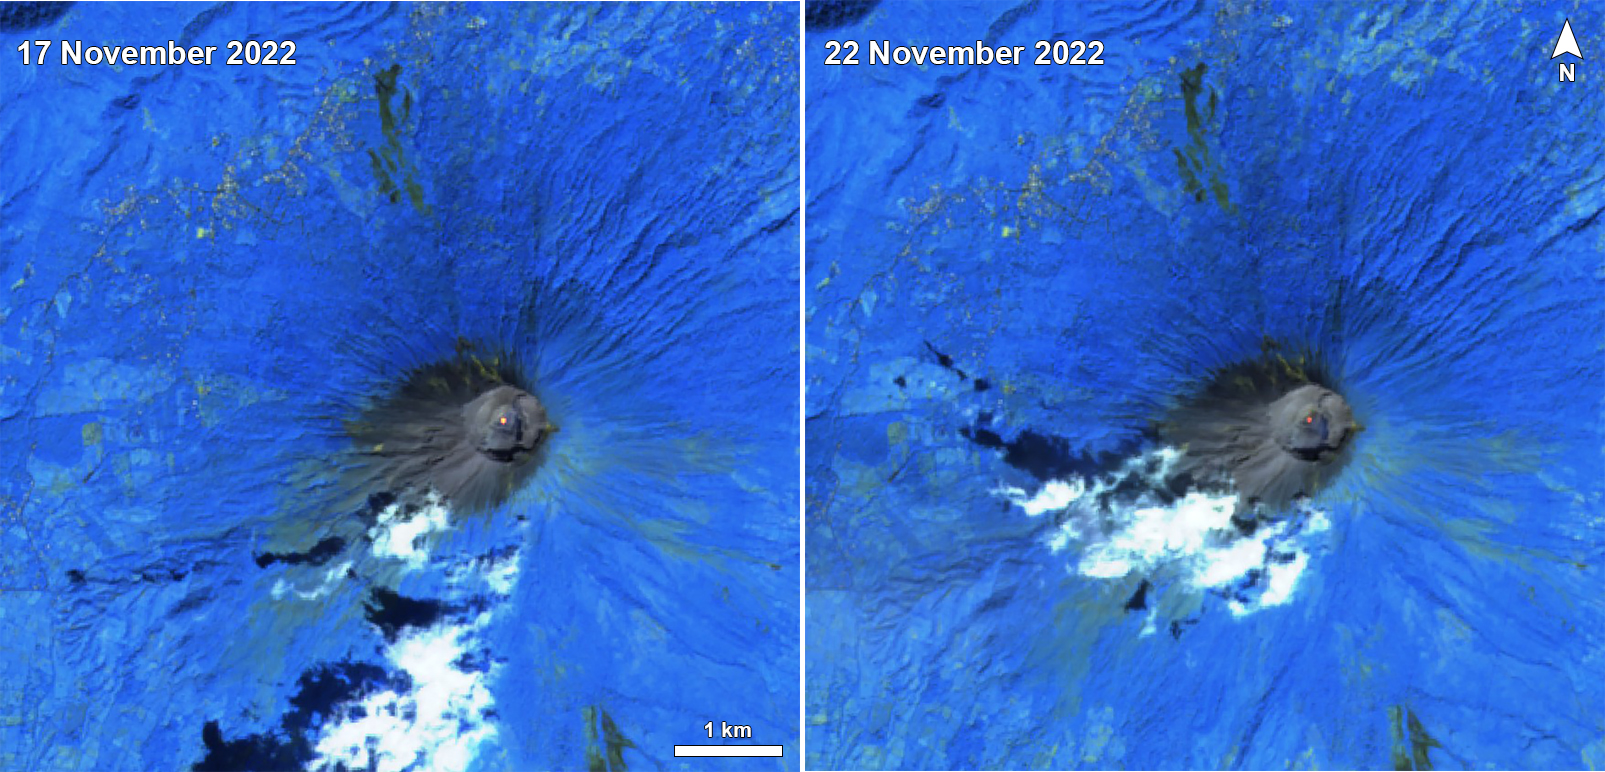 |
Figure 31. Sentinel-2 infrared satellite images showed a small thermal anomaly at the summit crater of San Miguel on 17 and 22 November 2022 (left and right). Images with "Atmospheric penetration" (bands 12, 11, 8A) rendering. Courtesy of Sentinel Hub Playground. |
Sulfur dioxide measurements that were taken during explosive events showed higher levels of sulfur dioxide emissions. On 19 November, during one of the largest explosions, SO2 emissions were 1,200 t/d, though on 21 November emissions were again lower at 378 t/d. During the more energetic explosions over 26-27 November, sulfur dioxide emission rates were again as high as 1,200 t/d, but they were otherwise 100-170 tons per day (t/d) on the 26th and 283 t/d on the 27th, which was lower than the typical baseline of 300 t/d. After 30 November sulfur dioxide emissions were again below baseline levels.
Information Contacts: Ministero de Medio Ambiente y Recursos Naturales (MARN), Km. 5½ Carretera a Nueva San Salvador, Avenida las Mercedes, San Salvador, El Salvador (URL: http://www.snet.gob.sv/ver/vulcanologia); Sentinel Hub Playground (URL: https://www.sentinel-hub.com/explore/sentinel-playground).
Small gas-and-ash explosions during March and May 2023
San Miguel in El Salvador is a broad, deep crater complex that has been frequently modified by eruptions recorded since the early 16th century and consists of the summit known locally as Chaparrastique. Flank eruptions have produced lava flows that extended to the N, NE, and SE during the 17-19th centuries. The most recent activity has consisted of minor ash eruptions from the summit crater. The current eruption period began in November 2022 and has been characterized by frequent phreatic explosions, gas-and-ash emissions, and sulfur dioxide plumes (BGVN 47:12). This report describes small gas-and-ash explosions during December 2022 through May 2023 based on special reports from the Ministero de Medio Ambiente y Recursos Naturales (MARN).
Activity has been relatively low since the last recorded explosions on 29 November 2022. Seismicity recorded by the San Miguel Volcano Station (VSM) located on the N flank at 1.7 km elevation had decreased by 7 December. Sulfur dioxide gas measurements taken with DOAS (Differential Optical Absorption Spectroscopy) mobile equipment were below typical previously recorded values: 300 tons per day (t/d). During December, small explosions were recorded by the seismic network and manifested as gas-and-steam emissions.
Gas-and-ash explosions in the crater occurred during January 2023, which were recorded by the seismic network. Sulfur dioxide values remained low, between 300-400 t/d through 10 March. At 0817 on 14 January a gas-and-ash emission was visible in webcam images, rising just above the crater rim. Some mornings during February, small gas-and-steam plumes were visible in the crater. On 7 March at 2252 MARN noted an increase in degassing from the central crater; gas emissions were constantly observed through the early morning hours on 8 March. During the early morning of 8 March through the afternoon on 9 March, 12 emissions were registered, some accompanied by ash. The last gas-and-ash emission was recorded at 1210 on 9 March; very fine ashfall was reported in El Tránsito (10 km S), La Morita (6 km W), and La Piedrita (3 km W). The smell of sulfur was reported in Piedra Azul (5 km SW). On 16 March MARN reported that gas-and-steam emissions decreased.
Low degassing and very low seismicity were reported during April; no explosions have been detected between 9 March and 27 May. The sulfur dioxide emissions remained between 350-400 t/d; during 13-20 April sulfur dioxide values fluctuated between 30-300 t/d. Activity remained low through most of May; on 23 May seismicity increased. An explosion was detected at 1647 on 27 May generated a gas-and-ash plume that rose 700 m high (figure 32); a decrease in seismicity and gas emissions followed. The DOAS station installed on the W flank recorded sulfur dioxide values that reached 400 t/d on 27 May; subsequent measurements showed a decrease to 268 t/d on 28 May and 100 t/d on 29 May.
|
Figure 32. Webcam image of a gas-and-ash plume rising 700 m above San Miguel at 1652 on 27 May 2023. Courtesy of MARN. |
Information Contacts: Ministero de Medio Ambiente y Recursos Naturales (MARN), Km. 5½ Carretera a Nueva San Salvador, Avenida las Mercedes, San Salvador, El Salvador (URL: http://www.snet.gob.sv/ver/vulcanologia).
|
|
||||||||||||||||||||||||||
There is data available for 41 confirmed eruptive periods.
2022 Nov 15 - 2023 May 27 Confirmed Eruption (Explosive / Effusive) VEI: 2
| Episode 1 | Eruption (Explosive / Effusive) | ||||||||||||||
|---|---|---|---|---|---|---|---|---|---|---|---|---|---|---|
| 2022 Nov 15 - 2023 May 27 | Evidence from Observations: Reported | |||||||||||||
|
List of 1 Events for Episode 1
|
||||||||||||||
2020 Feb 22 - 2020 Feb 22 Confirmed Eruption (Explosive / Effusive) VEI: 1
| Episode 1 | Eruption (Explosive / Effusive) | ||||||||||||||
|---|---|---|---|---|---|---|---|---|---|---|---|---|---|---|
| 2020 Feb 22 - 2020 Feb 22 | Evidence from Observations: Reported | |||||||||||||
|
List of 1 Events for Episode 1
|
||||||||||||||
2018 Jan 14 - 2018 Mar 4 ± 4 days Confirmed Eruption (Explosive / Effusive) VEI: 1
| Episode 1 | Eruption (Explosive / Effusive) | Summit crater | ||||||||||||||||||||||||||||||||||||||||||||||||||||||||||||||||||||||||||||||||||||||||||||||||||||||||||||
|---|---|---|---|---|---|---|---|---|---|---|---|---|---|---|---|---|---|---|---|---|---|---|---|---|---|---|---|---|---|---|---|---|---|---|---|---|---|---|---|---|---|---|---|---|---|---|---|---|---|---|---|---|---|---|---|---|---|---|---|---|---|---|---|---|---|---|---|---|---|---|---|---|---|---|---|---|---|---|---|---|---|---|---|---|---|---|---|---|---|---|---|---|---|---|---|---|---|---|---|---|---|---|---|---|---|---|---|---|---|
| 2018 Jan 14 - 2018 Mar 4 ± 4 days | Evidence from Observations: Reported | ||||||||||||||||||||||||||||||||||||||||||||||||||||||||||||||||||||||||||||||||||||||||||||||||||||||||||||
|
List of 20 Events for Episode 1 at Summit crater
|
|||||||||||||||||||||||||||||||||||||||||||||||||||||||||||||||||||||||||||||||||||||||||||||||||||||||||||||
2017 Jan 7 - 2017 Jan 7 Confirmed Eruption (Explosive / Effusive) VEI: 1
| Episode 1 | Eruption (Explosive / Effusive) | Summit crater | ||||||||||||||||||||||||||||
|---|---|---|---|---|---|---|---|---|---|---|---|---|---|---|---|---|---|---|---|---|---|---|---|---|---|---|---|---|---|
| 2017 Jan 7 - 2017 Jan 7 | Evidence from Observations: Reported | ||||||||||||||||||||||||||||
|
List of 4 Events for Episode 1 at Summit crater
|
|||||||||||||||||||||||||||||
2016 Jun 18 - 2016 Jun 18 Confirmed Eruption (Explosive / Effusive) VEI: 1
| Episode 1 | Eruption (Explosive / Effusive) | Summit crater | ||||||||||||||||||||||||||||||||||||||||||||||||||||||||||||||||||||
|---|---|---|---|---|---|---|---|---|---|---|---|---|---|---|---|---|---|---|---|---|---|---|---|---|---|---|---|---|---|---|---|---|---|---|---|---|---|---|---|---|---|---|---|---|---|---|---|---|---|---|---|---|---|---|---|---|---|---|---|---|---|---|---|---|---|---|---|---|---|
| 2016 Jun 18 - 2016 Jun 18 | Evidence from Observations: Reported | ||||||||||||||||||||||||||||||||||||||||||||||||||||||||||||||||||||
|
List of 12 Events for Episode 1 at Summit crater
|
|||||||||||||||||||||||||||||||||||||||||||||||||||||||||||||||||||||
2016 Jan 12 - 2016 Jan 18 Confirmed Eruption (Explosive / Effusive) VEI: 1
| Episode 1 | Eruption (Explosive / Effusive) | Summit crater | ||||||||||||||||||||||||||||||||||||||||||||||||
|---|---|---|---|---|---|---|---|---|---|---|---|---|---|---|---|---|---|---|---|---|---|---|---|---|---|---|---|---|---|---|---|---|---|---|---|---|---|---|---|---|---|---|---|---|---|---|---|---|---|
| 2016 Jan 12 - 2016 Jan 18 | Evidence from Observations: Reported | ||||||||||||||||||||||||||||||||||||||||||||||||
|
List of 8 Events for Episode 1 at Summit crater
|
|||||||||||||||||||||||||||||||||||||||||||||||||
2015 Aug 13 - 2015 Aug 13 Confirmed Eruption (Explosive / Effusive) VEI: 1
| Episode 1 | Eruption (Explosive / Effusive) | Summit crater | |||||||||||||||||||||||
|---|---|---|---|---|---|---|---|---|---|---|---|---|---|---|---|---|---|---|---|---|---|---|---|---|
| 2015 Aug 13 - 2015 Aug 13 | Evidence from Observations: Reported | |||||||||||||||||||||||
|
List of 3 Events for Episode 1 at Summit crater
|
||||||||||||||||||||||||
2015 Jan 26 - 2015 Apr 11 Confirmed Eruption (Explosive / Effusive) VEI: 1
| Episode 1 | Eruption (Explosive / Effusive) | Summit crater | |||||||||||||||||||||||||||||||||||||||||||||||||||||
|---|---|---|---|---|---|---|---|---|---|---|---|---|---|---|---|---|---|---|---|---|---|---|---|---|---|---|---|---|---|---|---|---|---|---|---|---|---|---|---|---|---|---|---|---|---|---|---|---|---|---|---|---|---|---|
| 2015 Jan 26 - 2015 Apr 11 | Evidence from Observations: Reported | |||||||||||||||||||||||||||||||||||||||||||||||||||||
|
List of 9 Events for Episode 1 at Summit crater
|
||||||||||||||||||||||||||||||||||||||||||||||||||||||
2013 Dec 29 - 2014 Jul 28 Confirmed Eruption (Explosive / Effusive) VEI: 3
| Episode 1 | Eruption (Explosive / Effusive) | Summit Crater | |||||||||||||||||||||||||||||||||||||||||||||||||||||||||||||||||||||||||||||||||||||||||||||||||||||||||||||||||||||||||||||||||||||||||||||||||||||||||||||||||||||||||||||||||||||||
|---|---|---|---|---|---|---|---|---|---|---|---|---|---|---|---|---|---|---|---|---|---|---|---|---|---|---|---|---|---|---|---|---|---|---|---|---|---|---|---|---|---|---|---|---|---|---|---|---|---|---|---|---|---|---|---|---|---|---|---|---|---|---|---|---|---|---|---|---|---|---|---|---|---|---|---|---|---|---|---|---|---|---|---|---|---|---|---|---|---|---|---|---|---|---|---|---|---|---|---|---|---|---|---|---|---|---|---|---|---|---|---|---|---|---|---|---|---|---|---|---|---|---|---|---|---|---|---|---|---|---|---|---|---|---|---|---|---|---|---|---|---|---|---|---|---|---|---|---|---|---|---|---|---|---|---|---|---|---|---|---|---|---|---|---|---|---|---|---|---|---|---|---|---|---|---|---|---|---|---|---|---|---|---|---|
| 2013 Dec 29 - 2014 Jul 28 | Evidence from Observations: Reported | |||||||||||||||||||||||||||||||||||||||||||||||||||||||||||||||||||||||||||||||||||||||||||||||||||||||||||||||||||||||||||||||||||||||||||||||||||||||||||||||||||||||||||||||||||||||
|
List of 35 Events for Episode 1 at Summit Crater
|
||||||||||||||||||||||||||||||||||||||||||||||||||||||||||||||||||||||||||||||||||||||||||||||||||||||||||||||||||||||||||||||||||||||||||||||||||||||||||||||||||||||||||||||||||||||||
2002 Jan 16 - 2002 Jan 16 Confirmed Eruption (Explosive / Effusive) VEI: 1
| Episode 1 | Eruption (Explosive / Effusive) | ||||||||||||||||||||||||||||||||||
|---|---|---|---|---|---|---|---|---|---|---|---|---|---|---|---|---|---|---|---|---|---|---|---|---|---|---|---|---|---|---|---|---|---|---|
| 2002 Jan 16 - 2002 Jan 16 | Evidence from Observations: Reported | |||||||||||||||||||||||||||||||||
|
List of 5 Events for Episode 1
|
||||||||||||||||||||||||||||||||||
1997 Dec 31 Confirmed Eruption (Explosive / Effusive) VEI: 1
| Episode 1 | Eruption (Explosive / Effusive) | ||||||||||||||||||||||||
|---|---|---|---|---|---|---|---|---|---|---|---|---|---|---|---|---|---|---|---|---|---|---|---|---|
| 1997 Dec 31 - Unknown | Evidence from Observations: Reported | |||||||||||||||||||||||
|
List of 3 Events for Episode 1
|
||||||||||||||||||||||||
1995 Jan 12 - 1995 Apr 19 Confirmed Eruption (Explosive / Effusive) VEI: 1
| Episode 1 | Eruption (Explosive / Effusive) | |||||||||||||||||||||||||||||
|---|---|---|---|---|---|---|---|---|---|---|---|---|---|---|---|---|---|---|---|---|---|---|---|---|---|---|---|---|---|
| 1995 Jan 12 - 1995 Apr 19 | Evidence from Observations: Reported | ||||||||||||||||||||||||||||
|
List of 4 Events for Episode 1
|
|||||||||||||||||||||||||||||
1985 Nov 16 ± 15 days - 1986 Feb 16 (on or after) ± 15 days Confirmed Eruption (Explosive / Effusive) VEI: 1
| Episode 1 | Eruption (Explosive / Effusive) | |||||||||||||||||||||||||||||
|---|---|---|---|---|---|---|---|---|---|---|---|---|---|---|---|---|---|---|---|---|---|---|---|---|---|---|---|---|---|
| 1985 Nov 16 ± 15 days - 1986 Feb 16 (on or after) ± 15 days | Evidence from Observations: Reported | ||||||||||||||||||||||||||||
|
List of 4 Events for Episode 1
|
|||||||||||||||||||||||||||||
1976 Dec 2 - 1977 Mar 1 Confirmed Eruption (Explosive / Effusive) VEI: 1
| Episode 1 | Eruption (Explosive / Effusive) | ||||||||||||||||||||||||||||||||||||||||||||
|---|---|---|---|---|---|---|---|---|---|---|---|---|---|---|---|---|---|---|---|---|---|---|---|---|---|---|---|---|---|---|---|---|---|---|---|---|---|---|---|---|---|---|---|---|
| 1976 Dec 2 - 1977 Mar 1 | Evidence from Observations: Reported | |||||||||||||||||||||||||||||||||||||||||||
|
List of 7 Events for Episode 1
|
||||||||||||||||||||||||||||||||||||||||||||
1970 Mar 30 - 1970 Apr 5 Confirmed Eruption (Explosive / Effusive) VEI: 1
| Episode 1 | Eruption (Explosive / Effusive) | |||||||||||||||||||||||||||||
|---|---|---|---|---|---|---|---|---|---|---|---|---|---|---|---|---|---|---|---|---|---|---|---|---|---|---|---|---|---|
| 1970 Mar 30 - 1970 Apr 5 | Evidence from Observations: Reported | ||||||||||||||||||||||||||||
|
List of 4 Events for Episode 1
|
|||||||||||||||||||||||||||||
1967 Jan 5 Confirmed Eruption (Explosive / Effusive) VEI: 2
| Episode 1 | Eruption (Explosive / Effusive) | |||||||||||||||||||||||||||||
|---|---|---|---|---|---|---|---|---|---|---|---|---|---|---|---|---|---|---|---|---|---|---|---|---|---|---|---|---|---|
| 1967 Jan 5 - Unknown | Evidence from Observations: Reported | ||||||||||||||||||||||||||||
|
List of 4 Events for Episode 1
|
|||||||||||||||||||||||||||||
1966 Jul 16 ± 15 days Confirmed Eruption (Explosive / Effusive) VEI: 2
| Episode 1 | Eruption (Explosive / Effusive) | |||||||||||||||||||
|---|---|---|---|---|---|---|---|---|---|---|---|---|---|---|---|---|---|---|---|
| 1966 Jul 16 ± 15 days - Unknown | Evidence from Observations: Reported | ||||||||||||||||||
|
List of 2 Events for Episode 1
|
|||||||||||||||||||
1966 Feb 22 Confirmed Eruption (Explosive / Effusive) VEI: 2
| Episode 1 | Eruption (Explosive / Effusive) | |||||||||||||||||||
|---|---|---|---|---|---|---|---|---|---|---|---|---|---|---|---|---|---|---|---|
| 1966 Feb 22 - Unknown | Evidence from Observations: Reported | ||||||||||||||||||
|
List of 2 Events for Episode 1
|
|||||||||||||||||||
1965 Jun 14 Confirmed Eruption (Explosive / Effusive) VEI: 2
| Episode 1 | Eruption (Explosive / Effusive) | Summit crater | |||||||||||||||||||||||
|---|---|---|---|---|---|---|---|---|---|---|---|---|---|---|---|---|---|---|---|---|---|---|---|---|
| 1965 Jun 14 - Unknown | Evidence from Observations: Reported | |||||||||||||||||||||||
|
List of 3 Events for Episode 1 at Summit crater
|
||||||||||||||||||||||||
1964 Oct 23 - 1964 Nov 16 ± 15 days Confirmed Eruption (Explosive / Effusive) VEI: 2
| Episode 1 | Eruption (Explosive / Effusive) | ||||||||||||||||||||||||
|---|---|---|---|---|---|---|---|---|---|---|---|---|---|---|---|---|---|---|---|---|---|---|---|---|
| 1964 Oct 23 - 1964 Nov 16 ± 15 days | Evidence from Observations: Reported | |||||||||||||||||||||||
|
List of 3 Events for Episode 1
|
||||||||||||||||||||||||
1954 Oct 21 - 1954 Oct 21 Confirmed Eruption (Explosive / Effusive) VEI: 2
| Episode 1 | Eruption (Explosive / Effusive) | ||||||||||||||||||||||||
|---|---|---|---|---|---|---|---|---|---|---|---|---|---|---|---|---|---|---|---|---|---|---|---|---|
| 1954 Oct 21 - 1954 Oct 21 | Evidence from Observations: Reported | |||||||||||||||||||||||
|
List of 3 Events for Episode 1
|
||||||||||||||||||||||||
1939 May - 1939 Jul Confirmed Eruption (Explosive / Effusive) VEI: 2
| Episode 1 | Eruption (Explosive / Effusive) | |||||||||||||||||||
|---|---|---|---|---|---|---|---|---|---|---|---|---|---|---|---|---|---|---|---|
| 1939 May - 1939 Jul | Evidence from Observations: Reported | ||||||||||||||||||
|
List of 2 Events for Episode 1
|
|||||||||||||||||||
[ 1936 (?) ] Uncertain Eruption
| Episode 1 | Eruption (Explosive / Effusive) | |||||||||||||||||||
|---|---|---|---|---|---|---|---|---|---|---|---|---|---|---|---|---|---|---|---|
| 1936 (?) - Unknown | Evidence from Unknown | ||||||||||||||||||
|
List of 2 Events for Episode 1
|
|||||||||||||||||||
1931 Mar - 1931 Jun Confirmed Eruption (Explosive / Effusive) VEI: 2
| Episode 1 | Eruption (Explosive / Effusive) | ||||||||||||||||||||||||
|---|---|---|---|---|---|---|---|---|---|---|---|---|---|---|---|---|---|---|---|---|---|---|---|---|
| 1931 Mar - 1931 Jun | Evidence from Observations: Reported | |||||||||||||||||||||||
|
List of 3 Events for Episode 1
|
||||||||||||||||||||||||
1930 Jan 26 ± 5 days Confirmed Eruption (Explosive / Effusive) VEI: 2
| Episode 1 | Eruption (Explosive / Effusive) | |||||||||||||||||||
|---|---|---|---|---|---|---|---|---|---|---|---|---|---|---|---|---|---|---|---|
| 1930 Jan 26 ± 5 days - Unknown | Evidence from Observations: Reported | ||||||||||||||||||
|
List of 2 Events for Episode 1
|
|||||||||||||||||||
1929 Aug Confirmed Eruption (Explosive / Effusive) VEI: 2
| Episode 1 | Eruption (Explosive / Effusive) | |||||||||||||||||||
|---|---|---|---|---|---|---|---|---|---|---|---|---|---|---|---|---|---|---|---|
| 1929 Aug - Unknown | Evidence from Observations: Reported | ||||||||||||||||||
|
List of 2 Events for Episode 1
|
|||||||||||||||||||
1920 Aug 14 - 1925 Confirmed Eruption (Explosive / Effusive) VEI: 2
| Episode 1 | Eruption (Explosive / Effusive) | ||||||||||||||||||||||||
|---|---|---|---|---|---|---|---|---|---|---|---|---|---|---|---|---|---|---|---|---|---|---|---|---|
| 1920 Aug 14 - 1925 | Evidence from Observations: Reported | |||||||||||||||||||||||
|
List of 3 Events for Episode 1
|
||||||||||||||||||||||||
1919 Dec 10 - 1920 Jan Confirmed Eruption (Explosive / Effusive) VEI: 2
| Episode 1 | Eruption (Explosive / Effusive) | |||||||||||||||||||
|---|---|---|---|---|---|---|---|---|---|---|---|---|---|---|---|---|---|---|---|
| 1919 Dec 10 - 1920 Jan | Evidence from Observations: Reported | ||||||||||||||||||
|
List of 2 Events for Episode 1
|
|||||||||||||||||||
1890 - 1891 Confirmed Eruption (Explosive / Effusive) VEI: 2
| Episode 1 | Eruption (Explosive / Effusive) | |||||||||||||||||||||||||||||
|---|---|---|---|---|---|---|---|---|---|---|---|---|---|---|---|---|---|---|---|---|---|---|---|---|---|---|---|---|---|
| 1890 - 1891 | Evidence from Observations: Reported | ||||||||||||||||||||||||||||
|
List of 4 Events for Episode 1
|
|||||||||||||||||||||||||||||
1884 Jan 25 - 1884 Jan 28 ± 1 days Confirmed Eruption (Explosive / Effusive) VEI: 2
| Episode 1 | Eruption (Explosive / Effusive) | NE side of main crater | |||||||||||||||||||||||
|---|---|---|---|---|---|---|---|---|---|---|---|---|---|---|---|---|---|---|---|---|---|---|---|---|
| 1884 Jan 25 - 1884 Jan 28 ± 1 days | Evidence from Observations: Reported | |||||||||||||||||||||||
|
List of 3 Events for Episode 1 at NE side of main crater
|
||||||||||||||||||||||||
1882 Dec 5 ± 4 days Confirmed Eruption (Explosive / Effusive) VEI: 2
| Episode 1 | Eruption (Explosive / Effusive) | ||||||||||||||||||||||||
|---|---|---|---|---|---|---|---|---|---|---|---|---|---|---|---|---|---|---|---|---|---|---|---|---|
| 1882 Dec 5 ± 4 days - Unknown | Evidence from Observations: Reported | |||||||||||||||||||||||
|
List of 3 Events for Episode 1
|
||||||||||||||||||||||||
1867 Dec 14 - 1868 Feb 16 (on or after) Confirmed Eruption (Explosive / Effusive) VEI: 2
| Episode 1 | Eruption (Explosive / Effusive) | WSW flank (1000 m) | |||||||||||||||||||||||||||||||||||||||||||
|---|---|---|---|---|---|---|---|---|---|---|---|---|---|---|---|---|---|---|---|---|---|---|---|---|---|---|---|---|---|---|---|---|---|---|---|---|---|---|---|---|---|---|---|---|
| 1867 Dec 14 - 1868 Feb 16 (on or after) | Evidence from Observations: Reported | |||||||||||||||||||||||||||||||||||||||||||
|
List of 7 Events for Episode 1 at WSW flank (1000 m)
|
||||||||||||||||||||||||||||||||||||||||||||
1862 Jan Confirmed Eruption (Explosive / Effusive) VEI: 2
| Episode 1 | Eruption (Explosive / Effusive) | |||||||||||||||||||
|---|---|---|---|---|---|---|---|---|---|---|---|---|---|---|---|---|---|---|---|
| 1862 Jan - Unknown | Evidence from Observations: Reported | ||||||||||||||||||
|
List of 2 Events for Episode 1
|
|||||||||||||||||||
1857 Nov Confirmed Eruption (Explosive / Effusive) VEI: 2 (?)
| Episode 1 | Eruption (Explosive / Effusive) | ||||||||||||||||||||||||
|---|---|---|---|---|---|---|---|---|---|---|---|---|---|---|---|---|---|---|---|---|---|---|---|---|
| 1857 Nov - Unknown | Evidence from Observations: Reported | |||||||||||||||||||||||
|
List of 3 Events for Episode 1
|
||||||||||||||||||||||||
1855 Dec Confirmed Eruption (Explosive / Effusive) VEI: 2
| Episode 1 | Eruption (Explosive / Effusive) | SSE flank (800 m) | ||||||||||||||||||||||||||||
|---|---|---|---|---|---|---|---|---|---|---|---|---|---|---|---|---|---|---|---|---|---|---|---|---|---|---|---|---|---|
| 1855 Dec - Unknown | Evidence from Observations: Reported | ||||||||||||||||||||||||||||
|
List of 4 Events for Episode 1 at SSE flank (800 m)
|
|||||||||||||||||||||||||||||
[ 1854 ] Uncertain Eruption
| Episode 1 | Eruption (Explosive / Effusive) | |||||||||||||||||||
|---|---|---|---|---|---|---|---|---|---|---|---|---|---|---|---|---|---|---|---|
| 1854 - Unknown | Evidence from Unknown | ||||||||||||||||||
|
List of 2 Events for Episode 1
|
|||||||||||||||||||
1844 Jul 25 - 1848 Confirmed Eruption (Explosive / Effusive) VEI: 2
| Episode 1 | Eruption (Explosive / Effusive) | NNW (1120 m) and upper east flanks | ||||||||||||||||||||||||||||
|---|---|---|---|---|---|---|---|---|---|---|---|---|---|---|---|---|---|---|---|---|---|---|---|---|---|---|---|---|---|
| 1844 Jul 25 - 1848 | Evidence from Observations: Reported | ||||||||||||||||||||||||||||
|
List of 4 Events for Episode 1 at NNW (1120 m) and upper east flanks
|
|||||||||||||||||||||||||||||
1819 Jul 18 Confirmed Eruption (Explosive / Effusive) VEI: 2
| Episode 1 | Eruption (Explosive / Effusive) | SSE flank (400 m; near Los Perolitos) | ||||||||||||||||||||||||||||
|---|---|---|---|---|---|---|---|---|---|---|---|---|---|---|---|---|---|---|---|---|---|---|---|---|---|---|---|---|---|
| 1819 Jul 18 - Unknown | Evidence from Observations: Reported | ||||||||||||||||||||||||||||
|
List of 4 Events for Episode 1 at SSE flank (400 m; near Los Perolitos)
|
|||||||||||||||||||||||||||||
[ 1811 ] Uncertain Eruption
| Episode 1 | Eruption (Explosive / Effusive) | |||||||||||||||||||
|---|---|---|---|---|---|---|---|---|---|---|---|---|---|---|---|---|---|---|---|
| 1811 - Unknown | Evidence from Unknown | ||||||||||||||||||
|
List of 2 Events for Episode 1
|
|||||||||||||||||||
[ 1798 (?) ] Uncertain Eruption
| Episode 1 | Eruption (Explosive / Effusive) | |||||||||||||||||||
|---|---|---|---|---|---|---|---|---|---|---|---|---|---|---|---|---|---|---|---|
| 1798 (?) - Unknown | Evidence from Unknown | ||||||||||||||||||
|
List of 2 Events for Episode 1
|
|||||||||||||||||||
1787 Sep 21 - 1787 Sep 23 Confirmed Eruption (Explosive / Effusive) VEI: 2
| Episode 1 | Eruption (Explosive / Effusive) | Summit, north and SE flanks | ||||||||||||||||||||||||||||||||||||||||||||||||
|---|---|---|---|---|---|---|---|---|---|---|---|---|---|---|---|---|---|---|---|---|---|---|---|---|---|---|---|---|---|---|---|---|---|---|---|---|---|---|---|---|---|---|---|---|---|---|---|---|---|
| 1787 Sep 21 - 1787 Sep 23 | Evidence from Observations: Reported | ||||||||||||||||||||||||||||||||||||||||||||||||
|
List of 8 Events for Episode 1 at Summit, north and SE flanks
|
|||||||||||||||||||||||||||||||||||||||||||||||||
1769 Confirmed Eruption (Explosive / Effusive) VEI: 2
| Episode 1 | Eruption (Explosive / Effusive) | East flank ? | |||||||||||||||||||||||
|---|---|---|---|---|---|---|---|---|---|---|---|---|---|---|---|---|---|---|---|---|---|---|---|---|
| 1769 - Unknown | Evidence from Observations: Reported | |||||||||||||||||||||||
|
List of 3 Events for Episode 1 at East flank ?
|
||||||||||||||||||||||||
1762 Confirmed Eruption (Explosive / Effusive) VEI: 2
| Episode 1 | Eruption (Explosive / Effusive) | NE flank (400 m) | |||||||||||||||||||||||
|---|---|---|---|---|---|---|---|---|---|---|---|---|---|---|---|---|---|---|---|---|---|---|---|---|
| 1762 - Unknown | Evidence from Observations: Reported | |||||||||||||||||||||||
|
List of 3 Events for Episode 1 at NE flank (400 m)
|
||||||||||||||||||||||||
1699 Confirmed Eruption (Explosive / Effusive) VEI: 2
| Episode 1 | Eruption (Explosive / Effusive) | SE flank (400 m) | ||||||||||||||||||||||||||||||||||||||
|---|---|---|---|---|---|---|---|---|---|---|---|---|---|---|---|---|---|---|---|---|---|---|---|---|---|---|---|---|---|---|---|---|---|---|---|---|---|---|---|
| 1699 - Unknown | Evidence from Observations: Reported | ||||||||||||||||||||||||||||||||||||||
|
List of 6 Events for Episode 1 at SE flank (400 m)
|
|||||||||||||||||||||||||||||||||||||||
1510 ± 5 years Confirmed Eruption (Explosive / Effusive)
| Episode 1 | Eruption (Explosive / Effusive) | ||||||||||||||||||||||||
|---|---|---|---|---|---|---|---|---|---|---|---|---|---|---|---|---|---|---|---|---|---|---|---|---|
| 1510 ± 5 years - Unknown | Evidence from Observations: Reported | |||||||||||||||||||||||
|
List of 3 Events for Episode 1
|
||||||||||||||||||||||||
This compilation of synonyms and subsidiary features may not be comprehensive. Features are organized into four major categories: Cones, Craters, Domes, and Thermal Features. Synonyms of features appear indented below the primary name. In some cases additional feature type, elevation, or location details are provided.
Synonyms |
| Chaparrastique | Perolitos, Los | Bosotlán |
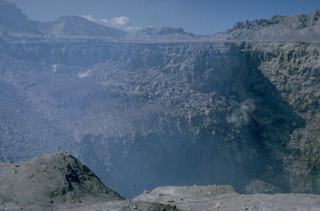 The summit of San Miguel volcano contains a deep crater whose morphology has been frequently modified by historical eruptions. In 1586 the volcano already had a truncated summit; before then the volcano was said to have had a sharp peak. In 1866 the crater was 600 m wide and 320 m deep and contained a subcrater on the ENE side. A cinder cone that formed at the NE side of the crater in 1884 had largely disappeared by 1924, and a ring plain on the crater floor was largely gone by 1949.
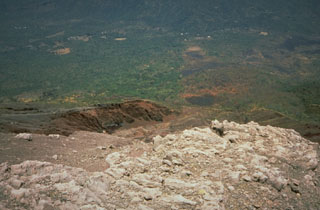 The fresh-looking lava flow at the upper right on the north flank of San Miguel volcano was emplaced during an eruption in 1844. The flow originated on July 25 from a NNW-flank fissure and traveled initially to the NNW before diverting to the NE and reaching to 8 km from the summit. After December the volcano began long-term explosive activity that lasted until 1848, when another lava flow occurred.
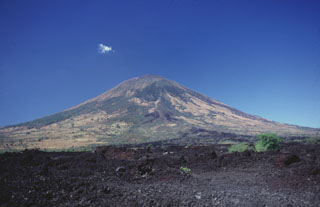 Symmetrical San Miguel volcano towers 2000 m above a barren basaltic lava flow erupted from a SE-flank vent in 1819. The conical volcano is not the highest volcano in El Salvador, but is one of the most prominent, since it rises from near sea level on the Pacific coastal plain. San Miguel (also known as Chaparrastique) is one of the most active volcanoes of El Salvador, with more than two dozen eruptions recorded since the beginning of the Spanish era.
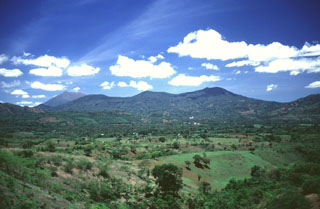 Chinameca volcano in the distance contains a 2-km-wide caldera, seen here from the north with the summit of San Miguel behind it to the left. A cluster of geothermal fields is located on the northern flank, surrounding the city of Chinameca.
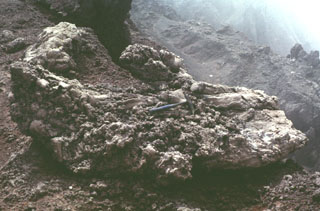 This large lava bomb in the summit crater of San Miguel was probably erupted in 1976. Lava fountaining took place in the central crater, which was active December 2-12, 1976 and February 28 to March 1, 1977, constructing a new spatter cone. Ashfall in December 1976 caused some crop damage.
 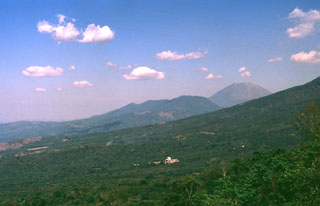 The Chinameca volcanic complex is seen here from the west beyond the lower flank of Pleistocene El Tigre volcano. The lower peak at the right side of the Chinameca complex is Cerro el Limbo, a cone on the western flank of Chinameca caldera. The higher peak at the upper right is San Miguel volcano, which is separated by a low saddle from Chinameca.
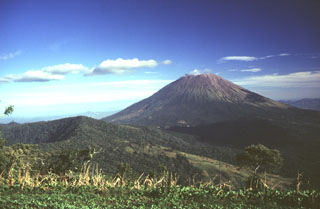 Conical San Miguel volcano, one of El Salvador's most prominent landmarks, rises across a low saddle SE of Chinameca (Pacayal) volcano. The 2130-m-high San Miguel is seen here from Cerro el Limbo, a cone on the western flank of Chinameca. The southern side of Chinameca's 2-km-wide summit caldera is visible at the left.
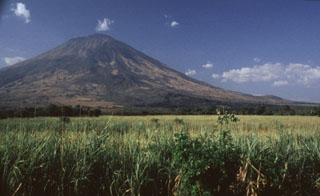 San Miguel is one of the most prominent volcanoes in El Salvador. Its southern slopes, seen here, rise more than 2000 m above the farmlands on the Pacific coastal plain. Both summit and flank vents have been active during historical time. The dark-colored lava flow at the right-center was erupted from a SE-flank vent in 1819.
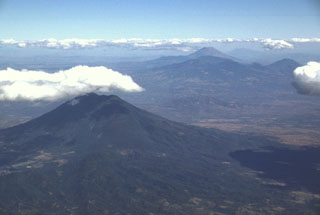 This view to the east across the main El Salvador volcanic front shows San Vicente volcano in the foreground and Tecapa, El Tigre, and Usulután volcanoes to the upper right. The small cone in the saddle between Usulután and El Tigre is Cerro Oromontique. Behind Tecapa and El Tigre is conical San Miguel, and to its right in the far distance is Conchagua volcano.
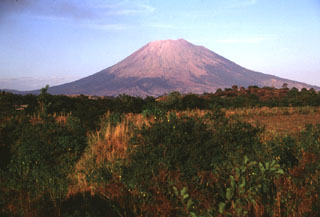 The SW side of San Miguel volcano towers more than 2000 m above the Pacific coastal plain; the base of the volcano lies only about 100 m above sea level. The symmetrical volcano is one of the most active in El Salvador and has produced dominantly basaltic and basaltic andesite lava flows and tephra. Frequent eruptions have kept much of the upper part of the edifice unvegetated. Flank vents are concentrated on the SE and NW quadrants of the volcano, but have been active during historical time on all sides.
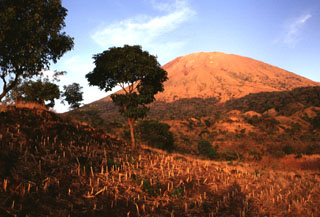 The low ridge in the left foreground is the vegetation-covered surface of a SW-flank lava flow erupted in 1867. Lava effusion began on the SW flank on December 14. Explosive activity continued, producing ashfall over the city of Usulután (20 km to the SW) and damaging tobacco plantations. The volcano was reported to be in activity again on February 2 and was particularly active on February 16. Lava fountains produced extensive scoria deposits that mantled the flow, causing it to be more vegetated than older flows.
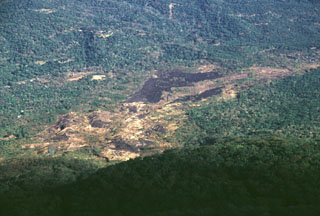 The sparsely vegetated basaltic lava flow cutting diagonally across the photo to the upper right was erupted from a NNW-flank vent in 1844. The flow traveled initially to the NNW toward the broad saddle between San Miguel and Chinameca volcanoes and then was deflected to the NE. It traveled in a narrow lobe as far as 8 km from the summit near the path of the present-day road between the town of San Jorge and the city of San Miguel.
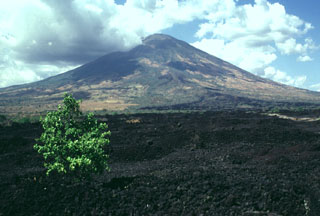 This sparsely vegetated basaltic lava flow was erupted from a fissure vent on the lower SE flank of San Miguel in 1819. The flow covers a broad 2.5-km-wide, 5-km-long area on the low-angle slopes below the volcano and reaches down to an elevation of less than 40 m above sea level. The principal coastal highway of El Salvador traverses the flow below the point of this photo, and the national railway crosses the flow closer to the vent.
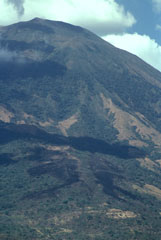 The dark-colored areas at the bottom of the photo are lava flows erupted from a SSE-flank vent of San Miguel in December 1855. The larger dark area above it extending diagonally across the image is a cloud shadow. The 1855 lava flows were erupted from a SSE-trending radial fissure and were the smallest flows erupted at San Miguel in historical time, extending only about a kilometer from the vent.
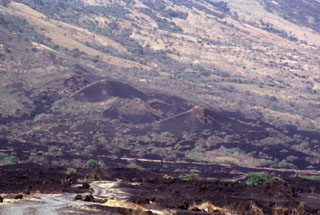 Small cinder cones on the lower SE flank of San Miguel between about 300 and 400 m altitude were constructed along a radial fissure that also was the source of a voluminous basaltic lava flow (foreground) erupted in 1819. The flow traveled about 5 km and covered a broad area below the base of the volcano.
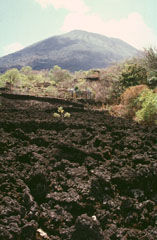 The basaltic lava flow in the foreground originated during a major effusive eruption that began from fissure vents on the NNW flank of San Miguel on July 25, 1844. By December lava was confined to the crater. The volcano then entered a several-year-long period of explosive activity. Another lava flow was reported in 1848, the year the eruption ended.
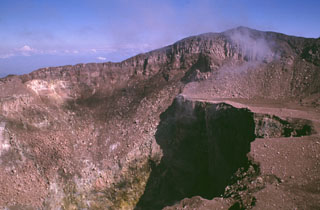 This view from the southern crater rim shows the 2030 m high point of San Miguel on the NE rim at the upper right. An ejecta-covered terrace on the eastern side of the crater is truncated by a deep inner crater. The crater morphology has varied dramatically since the beginning of documentation in the 16th century. In 1866 a 600-m-wide, 320-m-deep crater existed in the SE part of the summit crater, while a 100-m-wide, 80-m-deep adventive crater was located in its ENE part.
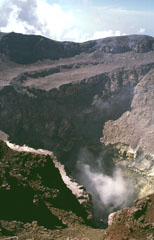 The summit crater of San Miguel volcano reflects a complex sequence of events. This view from the northern crater rim shows two lava benches that are truncated by a deep compound central pit crater from which steam plumes rise. The morphology of the summit crater has varied dramatically during historical time. The inner pit crater has gradually expanded to the east and north and increased in depth to nearly 350 m in 1999.
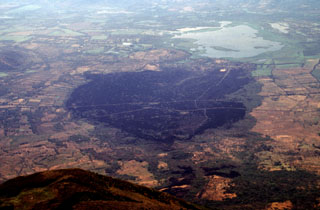 The dark sparsely vegetated area in the center of the photo marks basaltic lava flows erupted on the SE flank of San Miguel volcano in 1819. The flows, seen here from the summit of San Miguel, originated from fissure vents on the lower SE flank in July 1819 and traveled about 5 km downslope toward Laguna el Jocotal (upper right). The small lava flows at the lower right-center were erupted in December 1855. The principal coastal highway and the national railway of El Salvador cross the 1819 flows.
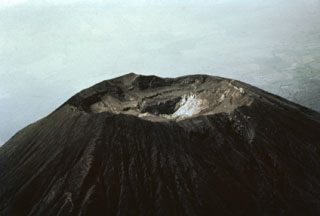 The summit of San Miguel volcano was reported to be peaked prior to the 16th century, but now is truncated by a 1-km-wide crater. This aerial view shows the 2130 m high point on the far NE crater rim in the center of the photo and several benches cut by a roughly 250-m-deep central crater. The morphology of the crater has varied greatly during historical time as a result of the creation and subsequent destruction of new craters. A cinder cone that formed in the NE part of the crater in 1884 had disappeared 50 years later.
 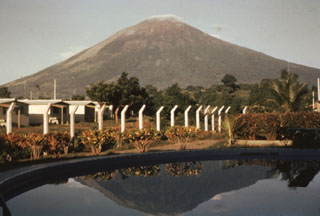 The northern slopes of the symmetrical cone of San Miguel are seen here from the city of San Miguel north of the volcano. A deep crater that has been frequently modified by historical eruptions (recorded since the early 16th century) caps the truncated summit of the basaltic-to-andesitic volcano. Radial fissures on its flanks have fed a series of fresh lava flows, including a NE-flank flow in 1762 that currently underlies the outskirts of the city of San Miguel, the third largest in El Salvador.
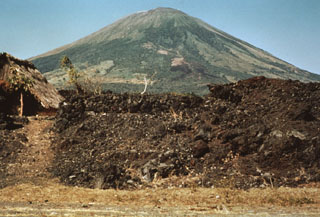 This barren lava flow issued from a fissure vent on the SE flank of San Miguel in 1819. The flow traveled about 5 km and covered a broad area below the SE base of the volcano, extending down to 25 m above sea level. Emplacement of the lava flow necessitated the construction of a new road at the base of the volcano.
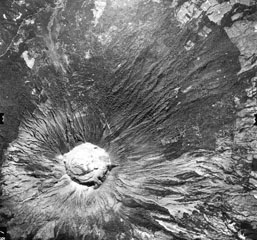 The symmetrical cone of San Miguel is truncated by a deep, 900-m-wide crater. Benches on the crater floor reflect a complex history of modification of the crater during historical time. The upper unvegetated part of San Miguel volcano is dissected by erosional gullies. Many lava flows have originated from flank vents, including those at the lower right and the dark-colored, sparsely vegetated flow crossed by the highway at the upper left. The latter was erupted in 1844.
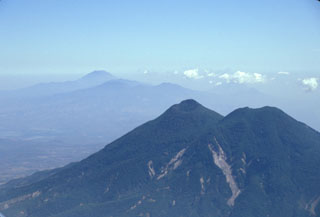 San Vicente is seen here in 2002 with landslide scarps that were produced during the January 2001 earthquake. The San Vicente area and towns at the base of the volcano were particularly affected by the tectonic earthquake and suffered extensive damage. The Tecapa volcanic complex and conical San Miguel volcano are in the distance.
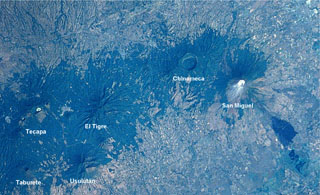 An E-W-trending chain of volcanoes extends about30 km across eastern El Salvador. The 2-km-wide Laguna Seca el Pacayal caldera is a prominent feature of Chinameca volcano. San Miguel is one of El Salvador's most active volcanoes; the dark area at the lower right is a lava flow from the 1819 eruption. The city of San Miguel is to the upper right.
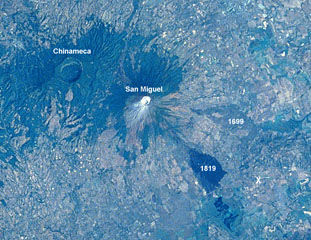 A large eruption took place from San Miguel in 1699, accompanied by strong earthquakes, flames, and rumblings. A major lava flow (right-center) traveled from SE-flank fissures for a straight-line distance of nearly 9 km. The flow divided around a light-colored kipuka and then banked against Pleistocene volcanic hills, where it was deflected to the south in a narrow lobe to the point labeled "X." The 2.5-km-wide caldera of Chinameca volcano lies across a saddle from San Miguel in this Space Shuttle image with north to the upper left.
 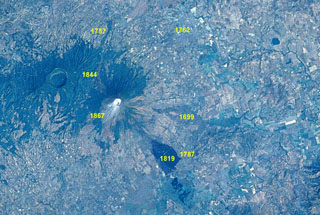 An eruption at San Miguel on September 21-23, 1787 from summit and N- and SE-flank vents produced five lava flows. Ashfall caused extensive crop damage. Other historical lava flows from San Miguel are labeled in this Space Shuttle image with north to the upper left. The 1762 lava flow (faintly seen at the upper right) extended as far as the present-day city of San Miguel. The 2.5-km-wide caldera of Chinameca volcano lies NW of San Miguel volcano, and the small dark-colored dot at the upper right is Laguna de Aramuaca maar.
 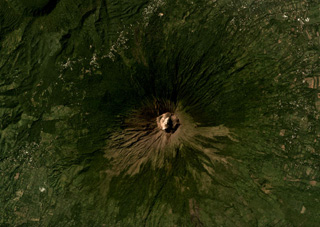 The summit crater of San Miguel, or Chaparrastique, volcano is in the center of this November 2019 Planet Labs satellite image monthly mosaic (N is at the top; this image is approximately 12 km across). Spatter and scoria cones have formed across the flanks during eruptions that emplaced lava flows up to 8 km from the vent. A flank cone that erupted a lava flow during the 1699 eruption is in the SW corner of this image (now vegetated) and the Chinameca caldera is in the NW corner.
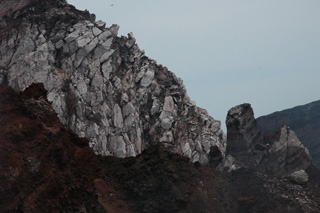 This 2011 photo taken at the summit of San Miguel shows a lava flow around 10 m thick overlying darker oxidized scoria and agglutinate deposits. Eruptions have also taken place across the flanks, producing lava flows and ashfall that caused extensive crop damage.
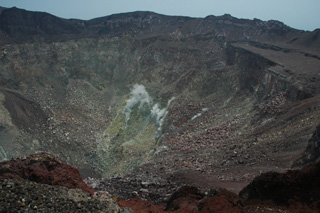 The roughly 800-m-wide San Miguel crater is seen here in 2011 with fumaroles in the geothermal area on the far crater wall producing small gas-and-steam plumes. Different colors in the crater walls are from various levels of oxidation and geothermal alteration of the rock.
There are no samples for San Miguel in the Smithsonian's NMNH Department of Mineral Sciences Rock and Ore collection.
| Copernicus Browser | The Copernicus Browser replaced the Sentinel Hub Playground browser in 2023, to provide access to Earth observation archives from the Copernicus Data Space Ecosystem, the main distribution platform for data from the EU Copernicus missions. |
| MIROVA | Middle InfraRed Observation of Volcanic Activity (MIROVA) is a near real time volcanic hot-spot detection system based on the analysis of MODIS (Moderate Resolution Imaging Spectroradiometer) data. In particular, MIROVA uses the Middle InfraRed Radiation (MIR), measured over target volcanoes, in order to detect, locate and measure the heat radiation sourced from volcanic activity. |
| MODVOLC Thermal Alerts | Using infrared satellite Moderate Resolution Imaging Spectroradiometer (MODIS) data, scientists at the Hawai'i Institute of Geophysics and Planetology, University of Hawai'i, developed an automated system called MODVOLC to map thermal hot-spots in near real time. For each MODIS image, the algorithm automatically scans each 1 km pixel within it to check for high-temperature hot-spots. When one is found the date, time, location, and intensity are recorded. MODIS looks at every square km of the Earth every 48 hours, once during the day and once during the night, and the presence of two MODIS sensors in space allows at least four hot-spot observations every two days. Each day updated global maps are compiled to display the locations of all hot spots detected in the previous 24 hours. There is a drop-down list with volcano names which allow users to 'zoom-in' and examine the distribution of hot-spots at a variety of spatial scales. |
|
WOVOdat
Single Volcano View Temporal Evolution of Unrest Side by Side Volcanoes |
WOVOdat is a database of volcanic unrest; instrumentally and visually recorded changes in seismicity, ground deformation, gas emission, and other parameters from their normal baselines. It is sponsored by the World Organization of Volcano Observatories (WOVO) and presently hosted at the Earth Observatory of Singapore.
GVMID Data on Volcano Monitoring Infrastructure The Global Volcano Monitoring Infrastructure Database GVMID, is aimed at documenting and improving capabilities of volcano monitoring from the ground and space. GVMID should provide a snapshot and baseline view of the techniques and instrumentation that are in place at various volcanoes, which can be use by volcano observatories as reference to setup new monitoring system or improving networks at a specific volcano. These data will allow identification of what monitoring gaps exist, which can be then targeted by remote sensing infrastructure and future instrument deployments. |
| Volcanic Hazard Maps | The IAVCEI Commission on Volcanic Hazards and Risk has a Volcanic Hazard Maps database designed to serve as a resource for hazard mappers (or other interested parties) to explore how common issues in hazard map development have been addressed at different volcanoes, in different countries, for different hazards, and for different intended audiences. In addition to the comprehensive, searchable Volcanic Hazard Maps Database, this website contains information about diversity of volcanic hazard maps, illustrated using examples from the database. This site is for educational purposes related to volcanic hazard maps. Hazard maps found on this website should not be used for emergency purposes. For the most recent, official hazard map for a particular volcano, please seek out the proper institutional authorities on the matter. |
| IRIS seismic stations/networks | Incorporated Research Institutions for Seismology (IRIS) Data Services map showing the location of seismic stations from all available networks (permanent or temporary) within a radius of 0.18° (about 20 km at mid-latitudes) from the given location of San Miguel. Users can customize a variety of filters and options in the left panel. Note that if there are no stations are known the map will default to show the entire world with a "No data matched request" error notice. |
| UNAVCO GPS/GNSS stations | Geodetic Data Services map from UNAVCO showing the location of GPS/GNSS stations from all available networks (permanent or temporary) within a radius of 20 km from the given location of San Miguel. Users can customize the data search based on station or network names, location, and time window. Requires Adobe Flash Player. |
| DECADE Data | The DECADE portal, still in the developmental stage, serves as an example of the proposed interoperability between The Smithsonian Institution's Global Volcanism Program, the Mapping Gas Emissions (MaGa) Database, and the EarthChem Geochemical Portal. The Deep Earth Carbon Degassing (DECADE) initiative seeks to use new and established technologies to determine accurate global fluxes of volcanic CO2 to the atmosphere, but installing CO2 monitoring networks on 20 of the world's 150 most actively degassing volcanoes. The group uses related laboratory-based studies (direct gas sampling and analysis, melt inclusions) to provide new data for direct degassing of deep earth carbon to the atmosphere. |
| Large Eruptions of San Miguel | Information about large Quaternary eruptions (VEI >= 4) is cataloged in the Large Magnitude Explosive Volcanic Eruptions (LaMEVE) database of the Volcano Global Risk Identification and Analysis Project (VOGRIPA). |
| EarthChem | EarthChem develops and maintains databases, software, and services that support the preservation, discovery, access and analysis of geochemical data, and facilitate their integration with the broad array of other available earth science parameters. EarthChem is operated by a joint team of disciplinary scientists, data scientists, data managers and information technology developers who are part of the NSF-funded data facility Integrated Earth Data Applications (IEDA). IEDA is a collaborative effort of EarthChem and the Marine Geoscience Data System (MGDS). |

