
All reports of volcanic activity published by the Smithsonian since 1968 are available through a monthly table of contents or by searching for a specific volcano. Until 1975, reports were issued for individual volcanoes as information became available; these have been organized by month for convenience. Later publications were done in a monthly newsletter format. Links go to the profile page for each volcano with the Bulletin tab open.
Information is preliminary at time of publication and subject to change.
Reports are sometimes published that are not related to a Holocene volcano. These might include observations of a Pleistocene volcano, earthquake swarms, or floating pumice. Reports are also sometimes published in which the source of the activity is unknown or the report is determined to be false. All of these types of additional reports are listed below by subject.
Ioto (Japan)
Villarrica (Chile)
Popocatepetl (Mexico)
Reventador (Ecuador)
Fuego (Guatemala)
Merapi (Indonesia)
Suwanosejima (Japan)
Kavachi (Solomon Islands)
Sabancaya (Peru)
Yasur (Vanuatu)
Sabancaya (Peru)
Ebeko (Russia)
 Cite this Report
Water columns containing ejecta, discolored water, and floating deposits during January-April 2024
Ioto (Iwo-jima) is located about 1,200 km S of Tokyo and lies within a 9-km-wide submarine caldera along the Izu-Bonin-Mariana volcanic arc. Observed eruptions date back to 1889 have been characterized by phreatic explosions, pumice deposits during 2001, and discolored water. A new eruption began in October 2023 that included explosions, black ejecta, discolored water, and floating pumice (BGVN 49:01). This report covers the rest of that eruption during January through March 2024, which consisted of fumarolic activity, discolored water plumes, and floating deposits, according to information from Japan Meteorological Association (JMA), the Japan Coast Guard (JCG), and satellite data.
According to the Japan Maritime Self-Defense Force Iwo Jima Air Base (JMSDF), intermittent eruptions occurred during 31 December 2023 through 6 January 2024, 28 February through 31 March, and 12-19 April off the SW coast of the island (figure 29). The newly formed land (also referred to as “New Land” or “Niijima”) about 1 km off the SE coast of Okinahama at the end of the October 2023 was confirmed to be shrinking based on an analysis by the Geospatial Information Authority of Japan using Synthetic Aperture Radar (SAR) data from Daichi-2, as well as from natural color satellite images (figure 30). Eruptive activity during the reporting period was characterized by white fumarolic activity, discolored water plumes emanating from New Land, water columns containing black material, and floating material.
 |
Figure 29. Map of Ioto showing the location of recorded eruptions from 1889 through April 2024. Eruptions were documented during 31 December 2023 through 6 January 2024 and 28 February 2024 through 31 March 2024, as highlighted in red just off the SE coast of the island and E of the 2001 eruption site. From Ukawa et al. (2002), modified by JMA. |
 |
Figure 30. Natural color satellite images showing “New Land” (white arrow) off the SE (Okinahama) coast of Ioto on 1 January 2024 (top left) that shank in size over time, as seen on 21 January 2024 (top right), 5 February 2024 (bottom left), and 26 March 2024 (bottom right). Discolored water was often visible surrounding the island, but particularly concentrated in proximity to New Land. Occasional white bubbles were also visible near New Land. Courtesy of Copernicus Browser. |
Water columns containing black ejecta rose as high as 30 m at intervals of several minutes to 30 minutes during January 2024. White fumarolic gas was also visible. JMA reported that the eruption paused on 7 January. According to observations by a surveillance camera, fumarolic activity from the Asodai sinkhole (Million Dollar Hole) in the W part of the island rose no higher than 10 m. Fumaroles from Idogahama in the NW part of the island also remained low.
According to observations conducted by the Japan Coast Guard on 13 February white gas-and-steam emissions were visible on the S and N parts of the island (figure 31). A brownish-colored puddle of water was reported at Okinahama Beach. The New Land continued to erode, such that only an arch-shaped part 25 m wide and about 10 m high remained (figure 32).
 |
Figure 31. Photos of white gas-and-steam emissions on the S (left) and N (right) parts of Ioto on 13 February 2024. Courtesy of JCG via JMA. |
 |
Figure 32. Photo of the New Land offshore of Okinahama near Ioto on 13 February 2024. Photo has been color corrected. Courtesy of JCG via JMA. |
JMSDF reported that the eruption resumed on 28 February. Water columns containing black material rose 50 m above the surface of the water every few minutes. Discolored water and floating deposits that appeared to be pumice were reported near the eruption site. White gas-and-steam emissions were visible from one vent on the NE part of the island. Webcam images showed gas-and-steam emissions from the Asodai sinkhole rose to less than 30 m.
Offshore eruptive activity continued during March. Water columns containing black ejecta rose 60 m high at intervals of several minutes to approximately 30 minutes. White gas-and-steam emissions, discolored water plumes, and floating material that was likely pumice were also reported near the eruption site. Field surveys conducted during 7-14 March confirmed eruptive activity and high-temperature pumice that were observed at Okinahama (figure 33). Aerial observations conducted by JCG on 16 March showed a small-scale eruption approximately 600 m offshore of Okinahama with intermittent, violent seawater bubbles (figure 34). Black pumice-like floating material was also observed at the site, accompanied by gas-and-steam emissions. New Land continued to decrease in size.
 |
Figure 33. Photo of an eruption off the coast of Okinahama of Ioto showing a water column with black ejecta accompanied by floating pumice taken on 13 March 2024. Photo has been color corrected. Courtesy of JMA. |
 |
Figure 34. Photos of a small-scale eruption at Ioto showing violently bubbling seawater accompanied by white gas-and-steam emissions on 16 March 2024. Photos have been color corrected. Courtesy of JCG via JMA. |
According to JMSDF, eruptions were observed on 12, 16, 18, and 19 April. Water columns containing black material rose approximately 10 m high on 12 and 16 April. On 18 April an eruption column rose 10-20 m high while white gas-and-steam emissions rose 10 m high on 19 April. Aerial observations made by JCG on 20 April showed discolored water plumes near Okinahama.
References. Ukawa, M., Fujita, E., Kobayashi, T., 2002, Recent volcanic activity of Iwo Jima and the 2001 eruption, Monthly Chikyu, Extra No. 39, 157-164.
Geologic Background. Ioto, also known as Ogasawara-Iojima to distinguish it from several other "Sulfur Island" volcanoes, lies within a 9-km-wide submarine caldera.The triangular, low-elevation, 8-km-long island narrows toward its SW tip and has produced trachyandesitic and trachytic rocks that are more alkalic than those of other volcanoes in the Ogasawara Volcanic Arc. The island has undergone uplift for at least the past 700 years, accompanying resurgent doming of the caldera; a shoreline landed upon by Captain Cook's surveying crew in 1779 is now 40 m above sea level. The Motoyama plateau on the NE half of the island consists of submarine tuffs overlain by coral deposits and forms the island's high point. Many fumaroles are oriented along a NE-SW zone cutting through Motoyama. Numerous recorded phreatic eruptions, many from vents on the W and NW sides of the island, have accompanied the uplift.
Information Contacts: Japan Meteorological Agency (JMA), 1-3-4 Otemachi, Chiyoda-ku, Tokyo 100-8122, Japan (URL: http://www.jma.go.jp/jma/indexe.html); Japan Coast Guard (JCG) Volcano Database, Hydrographic and Oceanographic Department, 3-1-1, Kasumigaseki, Chiyoda-ku, Tokyo 100-8932, Japan (URL: https://www1.kaiho.mlit.go.jp/GIJUTSUKOKUSAI/kaiikiDB/kaiyo22-2.htm); Copernicus Browser, Copernicus Data Space Ecosystem, European Space Agency (URL: https://dataspace.copernicus.eu/browser/).
Cite this Report
Explosions, ash emissions, and crater incandescence during October 2023-March 2024
Villarrica is located in central Chile and is found at the base of a presently active cone on the NW margin of a 6-km-wide caldera. Eruptions date back to 1558 and have been characterized by mild-to-moderate explosive activity with occasional lava effusions. The current eruption period began in December 2014 and has more recently consisted of an active lava lake, Strombolian activity, gas-and-ash emissions, and crater incandescence (BGVN 48:10). This report summarizes activity during October 2023 through March 2024, which included occasional Strombolian explosions, gas-and-steam and ash emissions, nighttime crater incandescence, and seismicity. Information for this report primarily comes from the Southern Andes Volcano Observatory (Observatorio Volcanológico de Los Andes del Sur, OVDAS), part of Chile's National Service of Geology and Mining (Servicio Nacional de Geología y Minería, SERNAGEOMIN) and satellite data.
Activity during October mainly consisted of Strombolian explosions, gas-and-steam and ash emissions, nighttime crater incandescence, and seismic activity, which included discrete 24,492 long-period (LP) events, 4,333 tremor (TRE) signals, and seven volcano-tectonic (VT) earthquakes. Low altitude gas-and-steam emissions sometimes containing a certain amount of ash rose as high as 480 m above the crater on 24 October. Occasional Strombolian explosions were recorded, ejecting material in and around the crater and generating nighttime crater incandescence. Crater incandescence associated with degassing was visible 40-80 m above the crater; the gas-and-steam emissions rose 40-300 m above the crater and drifted S, ESE, and ENE. Sulfur dioxide emissions measured using Differential Optical Absorption Spectroscopy (DOAS) equipment had an average value of 460 ± 75 tons per day (t/d) during 1-15 October and 620 ± 115 t/d during 16-31 October, with a maximum daily value of 1,045 t/d on 18 October.
During 3-4 October Strombolian explosions ejected material 40 m NW from the crater. During 4-5 October white gas-and-steam emissions rose 300 m above the crater and were occasionally accompanied by small pulses of gray-brown ash emissions that rose 60 m above the crater. On 6 October SERNAGEOMIN lowered the Volcanic Alert Level (VAL) to Yellow (the second level on a four-level scale), reporting that activity had returned to moderate and more stable levels. During 11-12 October lava fountains were visible, and incandescent material was ejected as high as 125 m above the crater. Incandescent bombs were ejected onto the upper flanks. Strombolian explosions were less intense during 12-16 October, with ballistics rising no higher than 100 m above the crater. During 15-16 October, some incandescent material was ejected onto the upper N flank. The Proyecto Observación Villarrica Internet (POVI) reported that satellite images taken during 22-23 October had the highest thermal radiance identified in Sentinel satellite data since July 2018, which was coincident with Strombolian activity and crater incandescence. On 31 October, SERNAGEOMIN reported an explosive event at 0700 that emitted a plume containing a larger volume of pyroclasts and rose 260 m above the crater.
During November, similar activity of Strombolian explosions, gas-and-steam and ash emissions, seismic activity, and nighttime crater incandescence continued. Seismicity consisted of 34,458 LP-type events, 3,817 TR-type events, and 206 VT-type earthquakes. The average sulfur dioxide flux was 816 ± 159 t/d during 1-15 November and 2406 ± 815 t/d during 16-30 November with a maximum daily value of 5,211 t/d recorded on 30 November. Gas-and-steam emissions rose 540-660 m above the crater and gas-and-ash emissions rose less than 150-180 m above the crater. SERNAGEOMIN reported that nighttime crater incandescence was widely distributed, which was consistent with a large exposure of the lava lake. During 3-4 November intense Strombolian explosions ejected material in the crater, accompanied by nighttime incandescence. POVI reported lava fountaining above the crater rim based on webcam images, which lasted for more than 15 seconds on 3 November. During 16-30 November Strombolian explosions ejected material 250 m from the crater.
Gas-and-steam and ash emissions, nighttime crater incandescence, and seismicity persisted during December. There were 45,157 LP-type events, 3,386 TR-type events, and 1,437 VT-type earthquakes detected throughout the month. The average sulfur dioxide flux was 1,165 ± 271 t/d during 1-15 December and 534 t/d during 16-31 December with a maximum daily value of 2,780 t/d on 8 December. White gas-and-steam emissions rose 680-1,020 m above the crater and gas-and-steam and ash emissions rose 320-640 m above the crater. The wide distribution of nighttime incandescence continued, which SERNAGEOMIN suggested was consistent with lava lake activity.
On 3 December at 1000 an LP-type event was detected accompanied by an ash plume that rose 320 m above the crater and drifted NE. SERNAGEOMIN suggested that this ash plume was a result of a collapse or partial collapse event. On 9 December at 2030 an LP-type event was detected, accompanied by an ash emission that rose 120 m above the crater and drifted ENE. Following this event, at around 2011 a low-altitude brown ash plume was observed. Strombolian explosions ejected material up to 250 m from the crater toward the NE flank on 10 December. On 15 December at 0630 monitoring stations near the volcano recorded an earthquake swarm associated with rock fracturing; over 100 events were detected. During 16-31 December Strombolian activity ejected material as far as 300 m toward the NE and E flanks.
Seismic activity during January 2024 consisted of 29,435 LP-type events, 4,863 TR-type events, and 1,587 VT-type earthquakes. The average sulfur dioxide flux measurement was 886 t/d ± 124 t/d during 1-15 January and 1,130 ± 91 t/d during 16-31 January with a maximum daily value of 2,397 t/d on 26 January. Gas-and-steam emissions rose 1-1.1 km above the crater and gas-and-ash emissions rose as high as 400 m above the crater at 1103 on 10 January. Continuous nighttime crater incandescence associated with a lava lake was visible. Starting at 0830 on 15 January, surveillance cameras recorded Strombolian explosions generating an ash plume that rose 200 m above the crater and ejecting material as far as 200 m from the crater (figure 129). Meter-sized pyroclasts were deposited in the area proximal to the crater and on the NE flank. During 30-31 January, notable pulsating Strombolian explosions ejected material 200 m above the crater and was deposited on the NE, SE, and SW flanks.
 |
Figure 129. Webcam image of a Strombolian explosion ejecting pyroclasts up to 200 m above the crater of Villarrica on 15 January 2025. Courtesy of SERNAGEOMIN (Reporte Especial de Actividad Volcanica (REAV), Region De La Araucania, Volcan Villarrica, 15 de enero de 2024, 11:30 Hora local). |
Similar activity continued during February, characterized by Strombolian explosions, gas-and-steam and ash emissions, nighttime crater incandescence, and seismicity. There were 38,752 LP-type events, 8,226 TR-type events, and 556 VT-type earthquakes recorded during the month. According to measurements made from DOAS equipment, the volcano emitted 781 ± 247 t/d of sulfur dioxide during 1-15 February and 827 ± 195 t/d during 16-29 February, with a maximum daily value of 2,857 t/d on 28 February. Gas-and-steam emissions rose to a maximum height of 980 m above the crater and ash emissions rose as high as 420 m above the crater on 12 February. Frequent crater incandescence and Strombolian explosions were reported; on 8 February, explosions produced an ash plume that rose 180 m above the crater and ejected material 370 m on the S flank. Overnight, material was deposited on all the flanks, with the NE, E, and SE as the most affected. A small Strombolian explosion was observed on 13 February around 2206 that ejected material 60 m above the crater, accompanied by crater incandescence (figure 130). On 14 February another small Strombolian explosion occurred at 0153 in the crater area accompanied by an ash emission that rose 40 m above the crater. Explosions on 24 February ejected material 150 m above the crater.
 |
Figure 130. Webcam image of a Strombolian explosion ejecting material 60 m above the crater of Villarrica on 13 February 2024 (local time) accompanied by nighttime crater incandescence. Courtesy of SERNAGEOMIN (Reporte Especial de Actividad Volcanica (REAV), Region De La Araucania, Volcan Villarrica, 13 de febrero de 2024, 23:04 Hora local). |
Activity during March persisted with Strombolian explosions, gas-and-steam and ash emissions, nighttime crater incandescence, and seismicity. There were 19,006 LP-type events, 4,736 TR-type events, and 199 VT-type events recorded throughout the month. The average measured sulfur dioxide flux was 2,045 ± 438 t/d during 1-15 March and 1,585 ± 254 t/d during 16-31 March, with a maximum daily value of 6,880 t/d on 1 March. Gas-and-steam emissions rose 500-660 m above the crater while ash emissions rose as high as 400 m above the crater. On 3 March at 1759, an ash plume rose 400 m above the crater and drifted NE (figure 131).
 |
Figure 131. Webcam image of an ash plume rising 400 m above the crater of Villarrica on 3 March 2024. Courtesy of SERNAGEOMIN (Reporte Especial de Actividad Volcanica (REAV), Region De La Araucania, Volcan Villarrica, 03 de marzo de 2024, 18:15 Hora local). |
Infrared MODIS satellite data processed by MIROVA (Middle InfraRed Observation of Volcanic Activity) showed frequent moderate-to-high thermal activity during October 2023 through March 2024 (figure 132). According to the MODVOLC thermal alert system, a total of 155 thermal hotspots were detected during October (9), November (17), December (41), January (49), February (25), and March (14). This activity was also frequently captured in infrared satellite images on clear weather days, often accompanied by gray ash on the flanks (figure 133).
 |
Figure 132. Moderate-to-high power thermal anomalies were detected at Villarrica during October 2023 through March 2024, according to this MIROVA graph (Log Radiative Power). The overall strength of the anomalies gradually started to decline by February. Courtey of MIROVA. |
 |
Figure 133. Consistent bright thermal anomalies (bright yellow-orange) were visible at the summit crater of Villarrica in infrared (bands B12, B11, B4) satellite images as seen on 25 October 2023 (top right), 26 November 2023 (top right), 31 December 2023 (middle left), 30 January 2024 (middle right), 17 February 2024 (bottom left), and 25 March 2024 (bottom right). Traces of ash deposits were often visible on the SE and E flanks. Courtesy of Copernicus Browser. |
Geologic Background. The glacier-covered Villarrica stratovolcano, in the northern Lakes District of central Chile, is ~15 km south of the city of Pucon. A 2-km-wide caldera that formed about 3,500 years ago is located at the base of the presently active, dominantly basaltic to basaltic andesite cone at the NW margin of a 6-km-wide Pleistocene caldera. More than 30 scoria cones and fissure vents are present on the flanks. Plinian eruptions and pyroclastic flows that have extended up to 20 km from the volcano were produced during the Holocene. Lava flows up to 18 km long have issued from summit and flank vents. Eruptions documented since 1558 CE have consisted largely of mild-to-moderate explosive activity with occasional lava effusion. Glaciers cover 40 km2 of the volcano, and lahars have damaged towns on its flanks.
Information Contacts: Servicio Nacional de Geología y Minería (SERNAGEOMIN), Observatorio Volcanológico de Los Andes del Sur (OVDAS), Avda Sta María No. 0104, Santiago, Chile (URL: http://www.sernageomin.cl/); Proyecto Observación Villarrica Internet (POVI) (URL: http://www.povi.cl/); MIROVA (Middle InfraRed Observation of Volcanic Activity), a collaborative project between the Universities of Turin and Florence (Italy) supported by the Centre for Volcanic Risk of the Italian Civil Protection Department (URL: http://www.mirovaweb.it/); Hawai'i Institute of Geophysics and Planetology (HIGP) - MODVOLC Thermal Alerts System, School of Ocean and Earth Science and Technology (SOEST), Univ. of Hawai'i, 2525 Correa Road, Honolulu, HI 96822, USA (URL: http://modis.higp.hawaii.edu/); Copernicus Browser, Copernicus Data Space Ecosystem, European Space Agency (URL: https://dataspace.copernicus.eu/browser/).
Cite this Report
Persistent gas-and-ash emissions and extensive ashfall during December 2023-March 2024
Popocatépetl is located 70 km SE of Mexico City, Mexico and contains a 400 x 600 m-wide summit crater. Recorded eruptions date back to the 14th century; three major Plinian eruptions, the most recent of which took place about 800 CE, have occurred since the mid-Holocene. They were characterized by pyroclastic flows and voluminous lahars that swept into basins below the volcano. The current eruption period began in January 2005 and has consisted of phreatic explosions, lava dome growth, and ash plumes. More recently, activity has included daily gas-and-ash emissions, ashfall, and occasional explosions (BGVN 49:01). This report updates similar activity during December 2023 through March 2024 using daily reports from Mexico’s Centro Nacional de Prevención de Desastres (CENAPRED) and various satellite data.
Daily gas-and-steam emissions, sometimes containing ash, continued during December 2023 through March 2024. CENAPRED reported the number of low-intensity gas-and-ash emissions, also known as “exhalations” and the minutes of tremor in their daily reports (figure 227). A total of 18 volcano-tectonic (VT) tremor events were detected during the reporting period. The average number of exhalations was 53 per day, with a maximum number of 445 on 19 January 2024. Sulfur dioxide plumes frequently exceeded two Dobson Units (DU) and drifted in multiple directions, according to satellite data from the TROPOMI instrument on the Sentinel-5P satellite (figure 228).
 |
Figure 227. Graph showing the number of minutes of tremor (in gold, left scale) and number of daily “exhalations” (in blue, right scale) at Popocatépetl each day during December 2023 through March 2024. The maximum number of daily exhalations was 445 on 19 January 2024; the maximum duration of tremor was 1,431 minutes on 20 January 2024. Data from CENAPRED daily reports. |
 |
Figure 228. Strong sulfur dioxide plumes were detected at Popocatépetl and drifted in different directions on 19 December 2023 (top left), 16 January 2024 (top right), 28 February 2024 (bottom left), and 24 March 2024 (bottom left). Courtesy of NASA Global Sulfur Dioxide Monitoring Page. |
Activity during December 2023 consisted of gas-and-steam and ash emissions (figure 229) and four VT-type events. An average number of 56 exhalations occurred each day, which mostly were composed of water vapor, volcanic gases, and a small amount of ash. The National Center for Communications and Civil Protection Operations (CENACOM) reported light ashfall in Amecameca (20 km NW) on 7 December and in Domingo Arenas and San Nicolás de los Ranchos (15 km NE) on 9 December. On 23 December at 0447 an ash plume rose to 1.2 km altitude. Light gas-and-steam emissions accompanied by small amounts of ash drifted SE on 30 December. According to reports from the Washington VAAC ash plumes rose to 5.8-7 km altitude and drifted in different directions based on satellite and webcam images. The highest ash plume rose to 7 km altitude on 16 December at 0611 and extended E.
 |
Figure 229. Webcam image showing a strong ash plume rising above Popocatépetl at 0719 on 6 December 2023. Courtesy of CENAPRED daily report. |
Activity during January 2024 was characterized by gas-and-steam and ash emissions that drifted in different directions (figure 230) and two VT-type events. There was an average of 39 exhalations during the month. A minor explosion was detected at 0342 on 2 January. CENACOM reported light ashfall on 6, 11-12, 14-16, 18, and 23-26 January. Affected towns included Nealtican (21 km E), Domingo Arenas (20 km NE), San Salvador el Verde (30 km NNE), San Martín Texmelucan (35 km NE), San Pedro Cholula (34 km E), Huejotzingo (28 km NE), Nativitas (40 km NE), Tetlatlahuaca (40 km NE), Zacatelco (45 km NE), Xicohtinco, Ayometla (46 km ENE), Papalotla (62 km NNW), Tenancingo (47 km ENE), San Pablo del Monte (49 km E), Mazatecochco (50 km ENE), Tlaxcala (50 km NW), Tepeyanco (47 km NW), Juan C. Bonilla (32 km ENE), Tlaltenango (35 km NE), Calpan, Nativitas (40 km NE), Papalotla de Xicohténcatl, Xicohtzinco (40 km ENE), San Juan Huactzinco, San Lorenzo Chiautzingo, San Nicolás de los Ranchos (15 km ENE), Ixtacuixtla, Santa Ana Chiautempan, Nopalucan (87 km NE), Totolac, Panotla, San Juan Cuautlancingo (38 km E), and Ixtacuixtla de Mariano Matamoros. On 18 January operations at the Puebla International Airport, which is located 30 km NE in the municipality of Huejotzingo, were suspended due to ashfall. On 23 January operations at the Hermanos Serdán International Airport were suspended during 1200-1700 due to the presence of ash. On 27 January an exhalation produced an ash plume at 0957 that rose 2.4 km above the crater and drifted ENE. During January, the Washington VAAC reported ash plumes and resuspended ash plumes that rose to 5.5-7.6 km altitude and drifted in various directions based on webcam and satellite images. The highest plume at 7.6 km altitude was recorded at 1951 on 23 January and drifted 289 km NE[AB1.1]. Throughout the day on 24 January the ash plumes remained at high altitudes, drifting as far as 343 km NE. On 30 January at 2240 an ash plume rose to 7.6 km altitude and drifted 111 km NE, which remained through the next day.
 |
Figure 230. Webcam image showing a strong ash plume rising above Popocatépetl at 1839 on 13 January 2024. Courtesy of CENAPRED daily report. |
Persistent gas-and-steam and ash emissions that drifted in multiple directions (figure 231) were reported during February, accompanied by ash plumes, ashfall, and three VT-type events. There was an average of 53 exhalations each day during the month. CENACOM reported light ashfall in Tetela del Volcán (20 km SW), Hueyapan (17 km SSW), and Axochiapan (60 km SSW) on 6 February, in Cuernavaca (65 km WSW) on 9 February, in San Nicolás de los Ranchos on 12 February, and in Nativitas, Santa Isabel (45 km ESE), Tetlatlahuaca (42 km NE), Tlaxcala, Santa Ana Chiautempan, and Zacatelco at 0830 on 14 February. The Hermanos Serdán International Airport was closed from 0800-1300 due to ash on the runway on 14 February. Light ashfall was also reported in Nativitas, Tetlatlahuca, Zacatelco, Xicohtzinco, Ayometla, Papalotla, Tenancingo, San Pablo del Monte (49 km E), Mazatecochco, Tepeyanco, and Tlaxcala on 16 February, in Hueyapan and Morelos (64 km W) on 19 February, in Hueyapan, Tetela del Volcano, and Jiutepec (59 km SW) on 21 February, and in Jiutepec, Atlatlahucan (30 km SW), Cuautla (43 km SW), Tlaltizapán (65 km SW), Ciudad Ayala (45 km SW), Huaquechula (30 km SE), and Tlapanalá (39 km SE) on 22 February. Extensive ashfall during 27-30 February affected Hueyapan, Tetela del Volcán, Morelos, Tepetlixpa, Ecatzingo (15 km SW), Yecapixtla (30 km SW), Tetela del Volcán, Morelos, Ixtacuixtla, Panotla, Tepetitla (36 km NE), Nativitas, Zacatelco, Santa Apolonia Teacalco (40 km NE), San Damián Texóloc (45 km NE), Tetlahuaca, Xicohtzingo, Paplotla, Tenancingo, Santa Catarina Ayometla (47 km ENE), Magdalena Tlaltelulco (53 km NE), San Francisco Tetlanohcan (55 km NE), Teolocholco (51 km ENE), Tlaxcala, Iztacalco (62 km NW), Iztapalapa (59 km NW), Coyoacán (65 km WNW), Atlautla (10 km W), Ayapango (24 km WNW), Chalco (44 km NW), Tenango del Aire (29 km NW), Temamatla (32 km NW), Ozumba (18 km W), Tlalmanalco (27 km NW), Amecameca, Benito Juárez (10-12 km SE), Chiautzingo, Cocotitlán (34 km NW), San Matías Tlalancaleca, San Martín Texmelucan, Santa Rita Tlahuapan, Nealtican, Domingo Arenas, and San Salvador el Verde, Huejotzingo. Ash and resuspended ash plumes rose to 5.2-7.6 km altitude and drifted in multiple directions, according to the Washington VAAC, based on images from webcam and satellites. At 1151 on 24 February an ash plume rose to 7.6 km altitude and drifted ENE, which remained in satellite images the next day, extending as far as 225 km SE.
 |
Figure 231. Webcam image showing a strong ash plume rising above Popocatépetl at 0708 on 25 February 2024. Photo has been color corrected. Courtesy of CENAPRED daily report. |
Similar activity of continuous gas-and-steam and ash emissions that drifted in different directions, ash plumes, ashfall events, and a total of four VT-type events were recorded during March. CENACOM reported daily extensive ashfall during the month, which affected Chalco, Tlalmanalco, Huejotzingo, Atlixco (23 km SE), Calpan, San Gregorio Atzompa, San Nicolas de los Ranchos, Juan C. Bonilla, Nealtican, Tlaltenango, San Miguel Xoxtla (35 km NE), Santiago Xalitzintla (15 km NE), Acajete, San Andrés Cholula (36 km E), San Pedro Cholula, Cuautlancingo, Nopalucan, Tepatlaxco, Tecuanipan, Teotlalcingo (26 km NNE), Amozoc (61 km E), Tochimilco (16 km SSE), Rafael Lara Grajales, San José Chiapa, Santa Clara Ocoyucan (33 km SE), Tepeaca (76 km E), Cuapiaxtla, Tianguismanalco (22 km SE), San Juan Cuautlancingo, San Martín Texmelucan, San Jerónimo Tecuanipan, San Antonio Tlatenco, San Lorenzo Chiautzingo, Amozoc de Mota, San Felipe Teotlalcingo (26 km NE), San Salvador el Verde, San Matías Tlalancaleca, Tlahuapan, Domingo Arenas, Chuautlalcingo, Santiago Miahuatlán, Santiago Xalixintla, Coronango (35 km ENE), Tetlatlahuca, Zacatelco, Xicolcohtzingo, Santa Catarina Ayometla, Papalotla, Tenancingo, San Pablo del Monte, Mazatecochco de José María Morelos, Tepeyanco, Tlaxcala, Santa Isabel Cholula, and Nativitas. The Hermanos Serdán International Airport was closed on 1 March and for a few hours on 2 March to clear ash off the runway. On 7, 11-12, and 17 March operations at the Hermanos Serdán International Airport were suspended at 0700 to clear runways, taxiways, and platforms from ash. The Washington VAAC reported ash plumes rising to 5.2-7.9 km altitude and drifting in different directions. The highest ash plume rose to 7.9 km altitude at 2121 on 22 March, which drifted at least 130 km ESE based on webcam and satellite images (figure 232).
 |
Figure 232. Webcam image showing a strong ash plume accompanied by incandescent ejecta from Popocatépetl at 2100 on 22 March 2024. Courtesy of CENAPRED daily report. |
MODIS thermal anomaly data provided through MIROVA (Middle InfraRed Observation of Volcanic Activity) showed intermittent thermal anomalies during the reporting period, with an increase in both number and frequency toward the end of March (figure 233). According to data from MODVOLC thermal alerts, a total of eight hotspots were detected at the summit crater on 27 January 2024, 25 February, 23, and 26, 27, and 31 March. Thermal activity in the summit crater was also visible in infrared satellite data accompanied by ash plumes, as shown on 10 February and 6 March (figure 234).
 |
Figure 233. Intermittent low-to-moderate power thermal anomalies were detected at Popocatépetl during December 2023 through March 2024. Toward the end of March, there was an increased number and frequency of thermal anomalies. Courtesy of MIROVA. |
 |
Figure 234. Infrared (bands B12, B11, B4) satellite images show a thermal anomaly (bright yellow-orange) of variable intensities in the summit crater of Popocatépetl on 1 January 2024 (top left), 10 February 2024 (top right), 6 March 2024 (bottom left), and 26 March 2024 (bottom right). On 10 February a strong ash plume drifted NE and on 6 March a strong ash plume drifted SE. Courtesy of Copernicus Browser. |
Geologic Background. Volcán Popocatépetl, whose name is the Aztec word for smoking mountain, rises 70 km SE of Mexico City to form North America's 2nd-highest volcano. The glacier-clad stratovolcano contains a steep-walled, 400 x 600 m wide crater. The generally symmetrical volcano is modified by the sharp-peaked Ventorrillo on the NW, a remnant of an earlier volcano. At least three previous major cones were destroyed by gravitational failure during the Pleistocene, producing massive debris-avalanche deposits covering broad areas to the south. The modern volcano was constructed south of the late-Pleistocene to Holocene El Fraile cone. Three major Plinian eruptions, the most recent of which took place about 800 CE, have occurred since the mid-Holocene, accompanied by pyroclastic flows and voluminous lahars that swept basins below the volcano. Frequent historical eruptions, first recorded in Aztec codices, have occurred since Pre-Columbian time.
Information Contacts: Centro Nacional de Prevención de Desastres (CENAPRED), Av. Delfín Madrigal No.665. Coyoacan, México D.F. 04360, México (URL: http://www.cenapred.unam.mx/, Daily Report Archive https://www.gob.mx/cenapred/archivo/articulos); Secretaría de Gestión Integral de Riesgos y Protección Civil (SGIRPC), 18 norte 406, Col. Barrio los Remedios Puebla, Pue. C.P. 72377, México (URL: https://sg.puebla.gob.mx/); Washington Volcanic Ash Advisory Center (VAAC), Satellite Analysis Branch (SAB), NOAA/NESDIS OSPO, NOAA Science Center Room 401, 5200 Auth Rd, Camp Springs, MD 20746, USA (URL: www.ospo.noaa.gov/Products/atmosphere/vaac, archive at: http://www.ssd.noaa.gov/VAAC/archive.html); MIROVA (Middle InfraRed Observation of Volcanic Activity), a collaborative project between the Universities of Turin and Florence (Italy) supported by the Centre for Volcanic Risk of the Italian Civil Protection Department (URL: http://www.mirovaweb.it/); Hawai'i Institute of Geophysics and Planetology (HIGP) - MODVOLC Thermal Alerts System, School of Ocean and Earth Science and Technology (SOEST), Univ. of Hawai'i, 2525 Correa Road, Honolulu, HI 96822, USA (URL: http://modis.higp.hawaii.edu/); NASA Global Sulfur Dioxide Monitoring Page, Atmospheric Chemistry and Dynamics Laboratory, NASA Goddard Space Flight Center (NASA/GSFC), 8800 Greenbelt Road, Goddard, Maryland, USA (URL: https://so2.gsfc.nasa.gov/); Copernicus Browser, Copernicus Data Space Ecosystem, European Space Agency (URL: https://dataspace.copernicus.eu/browser/).
Cite this Report
Daily explosions, gas-and-ash emissions, and incandescent avalanches during December 2023-March 2024
Volcán El Reventador in Ecuador is a stratovolcano with a 4-km-wide avalanches scarp open to the E that was formed by edifice collapse. Recorded eruptions date back to the 16th century and have been characterized by explosive events, lava flows, ash plumes, and lahars. Frequent lahars in this region of heavy rainfall have built deposits on the scarp slope. The current eruption period began in July 2008 and has more recently consisted of daily explosions, gas-and-ash emissions, and incandescent avalanches (BGVN 49:01). This report updates activity during December 2023 through March 2024 based on daily reports from Ecuador’s Instituto Geofisico (IG-EPN) and satellite data.
During December 2023 through March 2024, IG-EPN reported daily explosions, gas-and-ash plumes that rose as high as 1.7 km above the crater (table 20), and frequent crater incandescence, which was often accompanied by incandescent avalanches of material that generally affected all flanks. March had the highest monthly average number of explosions, as well as the most during a single day (24 hours over 29-30 March, with 79).
Table 20. Monthly summary of explosions and plume heights recorded at Reventador from December 2023 through March 2024. Data could not be collected for 14 December 2023. Data courtesy of IG-EPN (December 2023-March 2024 daily reports).
| Month | Average number of explosions per day | Max plume height above the crater rim (km) |
| Dec 2023 | 43 | 1 |
| Jan 2024 | 35 | 1.4 |
| Feb 2024 | 36 | 1.7 |
| Mar 2024 | 44 | 1.4 |
Activity during December 2023 consisted of 23-72 daily explosions, nighttime crater incandescence, and incandescent avalanches of material (figure 185). Seismicity was generally characterized by long-period (LP) events, tremor associated with emissions (TREMI), and harmonic tremor (TRARM). Frequent gas-and-ash emissions rose 400-1,000 m above the crater and drifted in multiple directions, based on webcam and satellite images. IG also reported that ash plumes rose 705-1,010 m above the crater and drifted W, NW, WNW, and SE, based on data from the Washington Volcano Ash Advisory Center (VAAC). Incandescent avalanches of material were recorded on the flanks generally as far as 800 m below the crater rim; during 5-6 December incandescent material was observed up to 1.8 km below the crater. Occasionally, incandescent ejecta rose 150-300 m above the crater rim.
 |
Figure 185. Webcam image of incandescent material on the flanks of Reventador accompanied by an ash plume rising more than 700 m above the summit on 26 December 2023 (UTC). Courtesy of IG-EPN (INFORME DIARIO DEL VOLCAN REVENTADOR No. 2023-360, 26 de diciembre de 2023). |
There were 9-58 daily explosions recorded during January 2024, which were accompanied by crater incandescence, incandescent avalanches of material, and incandescent ejecta. Seismic events consisted of LP, TREMI, and TRARM-type events. Gas-and-ash emissions rose 200-1,100 m above the crater and generally drifted W, NW, and SW. IG reported that ash plumes rose 400-1,400 m above the crater and drifted SW, NW, S, WSW, W, WNW, SSE, and SSW (figure 186). Incandescent material on the flanks descended as far as 1 km below the crater. Incandescent ejecta rose 200-500 m above the crater. A small lahar was recorded on 6 January.
 |
Figure 186. Webcam image of a gray ash plume rising more than 700 m above the summit of Reventador on 26 January 2024 (UTC). Courtesy of IG-EPN (INFORME DIARIO DEL VOLCAN REVENTADOR No. 2024-027, 27 de enero de 2024). |
During February, IG-EPN reported 22-62 daily explosions, continued nighttime crater incandescence, and incandescent ejecta and avalanches on the flanks (figure 187). Seismicity was characterized by LP, TREMI, and TRARM-type events. Gas-and-ash emissions rose 100-1,100 m above the crater and generally drifted N, NW, SW, and W. Ash plumes rose as high as 1.7 km above the crater during 31 January to 1 February and 7-8 February according to data from the Washington VAAC via IG-EPN. Incandescent material on the flanks extended 250-800 m below the crater rim and incandescent ejecta rose 200 m above the crater. High frequency seismic signals corresponding to lahar events were detected at 0015 on 24 February.
 |
Figure 187. Webcam image showing strong incandescent material deposited on the flanks of Reventador on 3 February 2024 (UTC) accompanied by a strong ash plume that rose more than 700 m above the summit. Courtesy of IG-EPN (INFORME DIARIO DEL VOLCAN REVENTADOR No. 2024-034, 03 de febrero de 2024). |
Similar activity was reported during March, although cloudy weather often prevented clear views of the summit. There were 21-79 daily explosions recorded, along with persistent crater incandescence and frequently incandescent material on the flanks. Seismic events included LP, TREMI, and TRARM-type events. Gas-and-ash emissions rose 200-1,000 m above the crater and drifted generally W, NW, SW, and E. Ash plumes rose 700-1,400 m above the crater and drifted generally NW and W based on data from the Washington VAAC (figure 188). Incandescent material extended as far as 1 km below the crater on the flanks. Rainfall at 0210 on 19 March generated small mud and debris flows, according to IG-EPN. Similar events were also reported during 22-23 March. On 26 March mud and debris flows were reported at 1523.
 |
Figure 188. Webcam image showing a gray ash plume rising 700 m above the summit of Reventador on 16 March 2024 (UTC). Courtesy of IG-EPN (INFORME DIARIO DEL VOLCAN REVENTADOR No. 2024-076, 16 de marzo de 2024). |
Although the summit was often visibly obscured by weather clouds, MIROVA (Middle InfraRed Observation of Volcanic Activity) analysis of MODIS satellite data showed intermittent low-to-moderate thermal activity (figure 189). The MODVOLC hotspot system identified a total of 12 hotspots on 3, 20, and 29 December 2023, 19, 21, 22, 26, and 28 February 2024, and 17 and 31 March.
 |
Figure 189. Intermittent low-to-moderate strength thermal activity was detected at Reventador during December 2023 through March 2024, based on this MIROVA graph (Log Radiative Power). Courtesy of MIROVA. |
Geologic Background. Volcán El Reventador is the most frequently active of a chain of Ecuadorian volcanoes in the Cordillera Real, well east of the principal volcanic axis. The forested, dominantly andesitic stratovolcano has 4-km-wide avalanche scarp open to the E formed by edifice collapse. A young, unvegetated, cone rises from the amphitheater floor to a height comparable to the rim. It has been the source of numerous lava flows as well as explosive eruptions visible from Quito, about 90 km ESE. Frequent lahars in this region of heavy rainfall have left extensive deposits on the scarp slope. The largest recorded eruption took place in 2002, producing a 17-km-high eruption column, pyroclastic flows that traveled up to 8 km, and lava flows from summit and flank vents.
Information Contacts: Instituto Geofísico, Escuela Politécnica Nacional (IG-EPN), Casilla 17-01-2759, Quito, Ecuador (URL: http://www.igepn.edu.ec/); MIROVA (Middle InfraRed Observation of Volcanic Activity), a collaborative project between the Universities of Turin and Florence (Italy) supported by the Centre for Volcanic Risk of the Italian Civil Protection Department (URL: http://www.mirovaweb.it/); Hawai'i Institute of Geophysics and Planetology (HIGP) - MODVOLC Thermal Alerts System, School of Ocean and Earth Science and Technology (SOEST), Univ. of Hawai'i, 2525 Correa Road, Honolulu, HI 96822, USA (URL: http://modis.higp.hawaii.edu/).
Cite this Report
Frequent explosions, ash plumes, ashfall, and incandescent avalanches during December 2023-March 2024
Fuego is one of three large stratovolcanoes overlooking the city of Antigua, Guatemala. It has been erupting since January 2002, with recorded eruptions dating back to 1531 CE. Typical activity is characterized by ashfall, pyroclastic flows, lava flows, and lahars. Frequent explosions with ash emissions, block avalanches, and lava flows have been reported since 2018. Recent activity has consisted of daily explosions, ash plumes, ashfall, and block avalanches (BGVN 48:12). This report covers similar activity during December 2023 through March 2024, using daily reports from the Instituto Nacional de Sismologia, Vulcanología, Meteorología e Hidrologia (INSIVUMEH) and various satellite data.
Daily explosions reported during December 2023 through March 2024 generated ash plumes that rose to 5 km altitude and drifted as far as 30 km in different directions. The explosions also caused rumbling sounds of varying intensities, with shock waves that vibrated the roofs and windows of homes near the volcano. Incandescent pulses of material rose as high as 400 m above the crater, accompanied by block avalanches that descended multiple drainages. Ashfall was also often reported in nearby communities (table 30). MIROVA (Middle InfraRed Observation of Volcanic Activity) analysis of MODIS satellite data showed frequent low-to-moderate power thermal activity during the reporting period (figure 177). A total of 35 MODVOLC thermal alerts were issued on 14, 24, 26, and 31 December 2023, 5, 7, and 12 January 2024, 2, 12, 14, 15, 27, and 28 February, and 2, 10, 11, 12, 18, 19, 20, 21, 22, and 26 March. On clear weather days, thermal anomalies and ash plumes were also visible in the summit crater, based on infrared satellite images (figure 178).
Table 30. Activity at Fuego during December 2023 through March 2024 included multiple explosions every hour. Ash emissions rose as high as 5 km altitude and drifted in multiple directions as far as 30 km, causing ashfall in many nearby communities. Data from daily INSIVUMEH reports.
| Month | Explosions per hour | Maximum ash plume altitude | Ash plume direction and distance (km) | Drainages affected by block avalanches | Communities reporting ashfall |
| Dec 2023 | 1-12 | 4.3-4.9 | 10-30 km W, NW, SW, S, E, SE, N, NE | Seca, Taniluyá, Ceniza, Las Lajas, Trinidad, Santa Teresa, and Honda | Panimaché I and II, Morelia, Finca Pale Verde, Sangre de Cristo, Morelia, Santa Sofía, Yucales, Yepocapa, Acatenango, El Porvenir, La Reunión, El Rodeo, San Cayetano, San Miguel Dueñas, La Reina, Santa Rosa, and La Trinidad, Ciudad Vieja, Alotenango, Antigua, and San Lucas Sacatepéquz |
| Jan 2024 | 1-11 | 4-5 | 10-305 km E, NE, N, NW, S, SE, SW, W | Santa Teresa, Ceniza, Las Lajas, Seca, Taniluyá, Trinidad, Honda, and El Jute | La Reunión, El Rodeo, Alotenango, El Porvenir, San Cayetano, San Miguel Dueñas, Ciudad Vieja, Antigua, San Lucas, Parramos, La Soledad, Panimaché I and II, Yepocapa, Morelia, Santa Sofía, Palo Verde, Quisaché, Sangre de Cristo, La Rochela, Ceilán, San Andrés Osuna, La Asunción, Yucales, Siquinalá, and Santa Lucía Cotzumalguapa |
| Feb 2024 | 1-11 | 4-4.8 | 10-30 km E, N, NE, SE, S, SW, W, NW | Seca, Taniluyá, Ceniza, Las Lajas, and Honda | La Rochela, Ceilán, Finca Asunción, El Rodeo, Zapote, Siquinalá, Panimaché I and II, Morelia, Quisache, La Soledad, Acatenango, El Campamento, Santa Sofía, Yucales, Yepocapa, El Porvenir, and Palo Verde |
| Mar 2024 | 3-12 | 4.3-4.8 | 10-30 km S, SW, W, SE, N, NE, E, NW | Seca, Taniluyá, Ceniza, Las Lajas, Honda, and Trinidad | Panimaché I and II, Morelia, Santa Sofía, El Porvenir, Sangre de Cristo, Palo Verde, La Candelaria, La Reunión, El Rodeo, Yepocapa, La Soledad, Acatenango, Parramos, Ceilán, La Rochela, La Asunción, and Yucales |
 |
Figure 177. Moderate-power and frequent thermal activity was detected at Fuego during December 2023 through March 2024, based on this MIROVA graph (Log Radiative Power). Courtesy of MIROVA. |
 |
Figure 178. Infrared (bands B12, B11, B4) satellite images showing a persistent thermal anomaly accompanied by incandescent avalanches of material on the NW and SW flanks and ash plumes (brownish-gray) emanating from the summit crater of Fuego on 25 December 2023 (top left) 9 January 2024 (top right) 13 February 2024 (bottom left), and 19 March 2024 (bottom right). Courtesy of Copernicus Browser. |
Activity during December 2023 consisted of 3-7 explosions each day, producing gas-and-ash plumes that rose to 4.3-4.8 km altitude and drifted variably as far as 15-30 km in multiple directions. Explosions produced weak and moderate block avalanches that descended the Seca (W), Taniluyá (SW), Ceniza (SSW), Las Lajas (SE), Trinidad (S), Santa Teresa (W), and Honda (E) drainages, sometimes extending to vegetated areas. The explosions were also accompanied by rumbling sounds and weak-to-moderate shock waves. Incandescent material was ejected 50-300 m above the crater. Fine ash particles were reported in Panimaché I and II (8 km SW), Morelia (9 km SW), Palo Verde (10 km WSW), Sangre de Cristo (8 km WSW), Morelia (9 km SW), Santa Sofía (12 km SW), Yucales (12 km SW), Yepocapa (8 km NW), Acatenango (8 km E), El Porvenir (11 km SW), La Reunión (7 km SE), El Rodeo (10 km SSE), San Cayetano, San Miguel Dueñas (10 km NE), La Reina, Santa Rosa, La Trinidad, Ciudad Vieja (14 km NE), Alotenango (8 km ENE), Antigua (18 km NE), and San Lucas Sacatepéquz.
There were 1-11 explosions of variable intensity during January 2024 that generated gas-and-ash plumes that rose to 4-5 km altitude and drifted as far as 305 km E, NE, N, NW, S, SE. Moderate-to-strong block avalanches descended the Santa Teresa, Ceniza, Las Lajas, Seca, Taniluyá, Trinidad, Honda, and El Jute (ESE) drainages, sometimes reaching vegetation, which raised incandescent material up to 300 m above the crater. Occasionally during the night and early morning, incandescent pulses of material rose 100-400 m above the crater. Ashfall was reported in La Reunión, El Rodeo, Alotenango, El Porvenir, San Cayetano, San Miguel Dueñas, Ciudad Vieja, Antigua, San Lucas, Parramos (18 km NNE), La Soledad (11 km N), Panimaché I and II, Yepocapa, Morelia, Santa Sofía, Palo Verde, Quisaché (8 km NW), Sangre de Cristo, La Rochela (8 km SW), Ceilán (9 km S), San Andrés Osuna (11 km SSW), La Asunción (12 km SW), Yucales, Siquinalá (21 km SSW), and Santa Lucía Cotzumalguapa (23 km SW).
During February, there were 2-11 explosions that produced gas-and-ash plumes that rose to 4.3-4.8 km altitude and drifted variably 10-30 km in multiple directions (figure 179). Incandescent material rose 100-400 m above the crater. Block avalanches descended the Seca, Taniluyá, Ceniza, Las Lajas, and Honda drainages, sometimes destroying nearby vegetation. Fine ashfall was reported in La Rochela, Ceilán, Finca Asunción, El Rodeo, Zapote (10 km SSE), Siquinalá, Panimaché I and II, Morelia, Quisache, La Soledad, Acatenango, El Campamento, Santa Sofía, Yucales, Yepocapa, El Porvenir, and Finca Palo Verde throughout the month.
 |
Figure 179. Photo showing Strombolian explosions at Fuego at 0321 on 21 February 2024. Smaller explosions occurred every five minutes, which continued to generate incandescent ejecta, while larger events occurring roughly every hour produced shock waves. Incandescent material was deposited on the N and E flanks. Photo was taken looking toward the N flank. Courtesy of Bastian Steinke, University of Auckland. |
There were 3-12 daily explosions that produced ash plumes that rose to 4.3-4.8 km altitude and drifted as far as 30 km in different directions during March. Ashfall was reported in Panimaché I and II, Morelia, Santa Sofía, El Porvenir, Sangre de Cristo, Palo Verde, La Candelaria, La Reunión, El Rodeo, Yepocapa, La Soledad, Acatenango, Parramos, Ceilán, La Rochela, La Asunción, and Yucales. The explosions were accompanied by rumbles and shock waves that generated moderate-to-strong avalanches that descended the Seca, Taniluyá, Ceniza, Las Lajas, Honda, and Trinidad drainages, sometimes reaching vegetation. Incandescent ejecta rose 100-300 m above the crater. During 11-12 and 16-17 March blocks were deposited 1-2 km around the crater due to explosive activity.
Geologic Background. Volcán Fuego, one of Central America's most active volcanoes, is also one of three large stratovolcanoes overlooking Guatemala's former capital, Antigua. The scarp of an older edifice, Meseta, lies between Fuego and Acatenango to the north. Construction of Meseta dates back to about 230,000 years and continued until the late Pleistocene or early Holocene. Collapse of Meseta may have produced the massive Escuintla debris-avalanche deposit, which extends about 50 km onto the Pacific coastal plain. Growth of the modern Fuego volcano followed, continuing the southward migration of volcanism that began at the mostly andesitic Acatenango. Eruptions at Fuego have become more mafic with time, and most historical activity has produced basaltic rocks. Frequent vigorous eruptions have been recorded since the onset of the Spanish era in 1524, and have produced major ashfalls, along with occasional pyroclastic flows and lava flows.
Information Contacts: Instituto Nacional de Sismologia, Vulcanologia, Meteorologia e Hydrologia (INSIVUMEH), Unit of Volcanology, Geologic Department of Investigation and Services, 7a Av. 14-57, Zona 13, Guatemala City, Guatemala (URL: http://www.insivumeh.gob.gt/ ); MIROVA (Middle InfraRed Observation of Volcanic Activity), a collaborative project between the Universities of Turin and Florence (Italy) supported by the Centre for Volcanic Risk of the Italian Civil Protection Department (URL: http://www.mirovaweb.it/); Hawai'i Institute of Geophysics and Planetology (HIGP) - MODVOLC Thermal Alerts System, School of Ocean and Earth Science and Technology (SOEST), Univ. of Hawai'i, 2525 Correa Road, Honolulu, HI 96822, USA (URL: http://modis.higp.hawaii.edu/); Copernicus Browser, Copernicus Data Space Ecosystem, European Space Agency (URL: https://dataspace.copernicus.eu/browser/); Bastian Steinke, University of Auckland, 34 Princes Street, Auckland Central, Auckland 1010, New Zealand (URL: https://www.auckland.ac.nz/en.html).
Cite this Report
Pyroclastic flows and incandescent avalanches during October 2023-March 2024
Merapi, located just north of the major city of Yogyakarta in central Java, Indonesia, has had activity within the last 20 years characterized by pyroclastic flows and lahars accompanying growth and collapse of the steep-sided active summit lava dome. The current eruption period began in late December 2020 and has more recently consisted of frequent incandescent avalanches and ash plumes (BGVN 48:10). This report covers similar activity during October 2023 through March 2024, based on information from Pusat Vulkanologi dan Mitigasi Bencana Geologi (PVMBG, also known as Indonesian Center for Volcanology and Geological Hazard Mitigation, CVGHM) and Balai Penyelidikan dan Pengembangan Teknologi Kebencanaan Geologi (BPPTKG), the Center for Research and Development of Geological Disaster Technology, a branch of PVMBG which specifically monitors Merapi. Additional information comes from MAGMA Indonesia, and various satellite data.
BPPTKG reported that during October and November white gas-and-steam emissions rose 10-300 m above the crater, and incandescent avalanches of material were mainly reported to the S and SW (figure 140). The avalanches descended 1,200-2,000 m toward the Bebeng (SW), 1,000-1,600 m toward the Boyong (S), 700-1,300 m toward the Senowo (W), and 1,500 m toward the Sat/Putih drainages. During the week of 24-30 November pyroclastic flows traveled as far as 2 km down the Bebeng drainage and as far as 1.5 km down the Boyong drainage. Morphological changes to the SW lava dome were due to continuing collapses of material; based on webcam images, the SW dome had grown slightly taller while the dome in the summit crater remained unchanged.
 |
Figure 140. Photo of an incandescent avalanche descending Merapi’s flank on 23 October 2024. Courtesy of Øystein Lund Andersen. |
Similar activity was reported during December 2023 and January 2024, with white gas-and-steam emissions rising 10-1,200 m above the crater, avalanches of material descending the S and SW flanks, and pyroclastic flows on the SW drainage. Avalanches of material continued down the Bebeng drainage as far as 1.9 km, the Boyong drainage as far as 2 km, and the Sat/Putih drainage as far as 1.5 km. On 1 December a pyroclastic flow descended 2 km on the Bebeng drainage at 1927. An ash plume and incandescent material on the flanks accompanied this activity; the ash plume drifted SW-NW. According to BNBP, light ashfall occurred in Tlogolele Village (5 km NW), Senden Village, Suroteleng Village, Jrakah Village, Klakah Village (4 km NW), and Selo (6 km NNW) District. During 1-7 December there were six pyroclastic flows that traveled as far as 3 km down the Bebeng drainage and 1.3 km down the Boyong drainage. Light ashfall was reported in the Sawangan District (15 km W), Magelang, and Selo District (5 km NNE).
According to BNPB, several dark gray pyroclastic flows were detected by the seismic network and webcams starting at 1449 on 8 December and traveled as far as 3.5-3.8 km down the Krasak drainage on the SW flank. Ashfall was reported in Kriniing Village, Paten Village (9 km WNW), Dukun District, Stabelan Village (4 km NW), Klakah Village (4 km NW), and Tlogolele. An analysis of aerial photos taken on 20 December showed that the SW dome was 2,948,100 m3 and the central dome was 2,358,400 m3. During the week of 29 December to 4 January there were two pyroclastic flows that descended 1.8 km on the SW flank and during 12-18 January there were four pyroclastic flows detected on the SW flank, traveling as far as 2.4 km.
An eruptive event at 0845 on 21 January caused minor ashfall in Jelok Village (40 km S). Another eruptive event at 1355 generated pyroclastic flows and an ash plume that rose 1 km above the summit and caused ashfall in areas within 17 km SE, E, and NE, although some affected villages were located at greater distances. Another pyroclastic flow was detected at 1412, descending 2.4 km on the SW flank. Ashfall was reported in several areas of the Klaten and Boyolali Regencies, including Kemalang (15 km SE), Klaten, Selo Districts, Musuk, Boyolali (17 km E), Cepogo (4 km NE), Musuk (11 km ESE), Tamansari, Boyolali Kota, Teras (22 km E), Mojosongo (45 km E), and Sambi (28 ENE) at around 1430 (figure 141). Ash was washed away quickly due to rainfall.
 |
Figure 141. Photo of traces of ashfall (light gray) from Merapi on plants in the Boyolali Regency on 21 January 2024. Courtesy of Aris Wasita via Antara News. |
A pyroclastic flow at 0215 on 23 January traveled 2 km on the SW flank. On 24 January a gray-to-brown ash plume rose 1 km above the crater at 1556 and drifted from E to SE, according to information from a ground observer. A pyroclastic flow was also reported in the SW drainage, traveling as far as 1.8 km the same day. Ashfall was reported in Deles, Kemalang (15 km SE), Klaten (32 km SE), Jemowo, and Boyolali (17 km E). On 25 January three pyroclastic flows descended the SW flank as far as 1.5 km at 1606, 1609, and 1613. During the week of 19-25 January an eruption generated an ash plume that rose 1 km above the crater and caused ashfall in Kemalang, Klaten, Selo, Musuk, Boyolai, and Boyolali City. During 19 January to 1 February, pyroclastic flows were reported on the SW flank as far as 3 km from the crater.
Activity during February and March consisted of white gas-and-steam emissions that rose 10-1,000 m above the crater, pyroclastic flows in the SW and S drainage, and avalanches of material on the S and SW flanks. Avalanches of material traveled as far as 2 km on the Bebeng drainage and 1.4 km on the Boyong drainage (figures 142 and 143). On 1 February a pyroclastic flow descended the SW flank as far as 1.8 km. During 9-22 February, four pyroclastic flows descended the SW flank for 1.5-1.6 km. On 4 March a series of pyroclastic flows traveled as far as 2.6 km on the SW flank at 1603. Ashfall from those events was reported at the Pasarbubar station (800 m N), and minor ashfall occurred in Selo and Cepogo (4 km NE). The estimated volume of the SW dome was 2,066,400 m3 and the estimated volume of the dome in the main crater was 2,358,000 m3 based on 21 March aerial photos.
 |
Figure 142. Photo of incandescent avalanches of material descending Merapi on 2 February 2024. Photo has been color corrected. Courtesy of Hendra Nurdiyansyah via Antara News. |
 |
Figure 143. Photo showing a strong incandescent avalanche descending the flank of Merapi on 30 March 2024. Courtesy of Øystein Lund Andersen. |
Intermittent low-to-moderate power thermal anomalies continued during the reporting period, based on a MIROVA (Middle InfraRed Observation of Volcanic Activity) analysis of MODIS satellite data (figure 144). There was a decrease in the rate of frequency of anomalies during November and January through March, compared to October and December; only four anomalies were detected during March. According to the MODVOLC thermal algorithm, a total of 24 thermal anomalies were detected on 2, 3, 12, 16, 17, and 19 October 2023, 12 and 19 November, 8, 10, 12, 13, and 20 December, 8 and 30 January 2024, 12 February, and 2 March. Infrared satellite imagery consistently captured thermal anomalies at the summit crater, often accompanied by incandescent avalanches of material mainly affecting the SW and S flanks (figure 145).
 |
Figure 144. Intermittent low-to-moderate power thermal anomalies were detected at Merapi during October 2023 through March 2024, as shown on this MIROVA plot (Log Radiative Power). There was a decrease in the rate of frequency of anomalies during November 2023 and January 2024 through March. Courtesy of MIROVA. |
 |
Figure 145. Infrared (bands B12, B11, B4) satellite images show a persistent thermal anomaly (bright yellow-orange) at the summit crater of Merapi on 10 October 2023 (top left), 19 December 2023 (top right), 12 February 2024 (bottom left), and 23 March 2024 (bottom right). Incandescent avalanches often descended the S and SW flanks, as seen in these images. Courtesy of Copernicus Browser. |
Geologic Background. Merapi, one of Indonesia's most active volcanoes, lies in one of the world's most densely populated areas and dominates the landscape immediately north of the major city of Yogyakarta. It is the youngest and southernmost of a volcanic chain extending NNW to Ungaran volcano. Growth of Old Merapi during the Pleistocene ended with major edifice collapse perhaps about 2,000 years ago, leaving a large arcuate scarp cutting the eroded older Batulawang volcano. Subsequent growth of the steep-sided Young Merapi edifice, its upper part unvegetated due to frequent activity, began SW of the earlier collapse scarp. Pyroclastic flows and lahars accompanying growth and collapse of the steep-sided active summit lava dome have devastated cultivated lands on the western-to-southern flanks and caused many fatalities.
Information Contacts: Balai Penyelidikan dan Pengembangan Teknologi Kebencanaan Geologi (BPPTKG), Center for Research and Development of Geological Disaster Technology (URL: http://merapi.bgl.esdm.go.id/, Twitter: @BPPTKG); Badan Nasional Penanggulangan Bencana (BNPB), National Disaster Management Agency, Graha BNPB - Jl. Scout Kav.38, East Jakarta 13120, Indonesia (URL: http://www.bnpb.go.id/); Pusat Vulkanologi dan Mitigasi Bencana Geologi (PVMBG, also known as Indonesian Center for Volcanology and Geological Hazard Mitigation, CVGHM), Jalan Diponegoro 57, Bandung 40122, Indonesia (URL: http://www.vsi.esdm.go.id/); MAGMA Indonesia, Kementerian Energi dan Sumber Daya Mineral (URL: https://magma.esdm.go.id/v1); Antara News, Wisma ANTARA 19th Floor, Jalan Merdeka Selatan No. 17, Jakarta Pusat (URL: http://www.antaranews.com/); MIROVA (Middle InfraRed Observation of Volcanic Activity), a collaborative project between the Universities of Turin and Florence (Italy) supported by the Centre for Volcanic Risk of the Italian Civil Protection Department (URL: http://www.mirovaweb.it/); Hawai'i Institute of Geophysics and Planetology (HIGP) - MODVOLC Thermal Alerts System, School of Ocean and Earth Science and Technology (SOEST), Univ. of Hawai'i, 2525 Correa Road, Honolulu, HI 96822, USA (URL: http://modis.higp.hawaii.edu/); Copernicus Browser, Copernicus Data Space Ecosystem, European Space Agency (URL: https://dataspace.copernicus.eu/browser/); Øystein Lund Andersen (URL: https://www.oysteinlundandersen.com/, https://twitter.com/oysteinvolcano).
Cite this Report
Continued eruption plumes, incandescent ejecta, and ashfall during November 2023-February 2024
Suwanosejima is an 8-km-long island that consists of a stratovolcano and two active summit craters, located in the northern Ryukyu Islands, Japan. Volcanism during the 20th century is characterized by Strombolian explosions, ash plumes, and ashfall. The current eruption began in October 2004 and has more recently consisted of frequent ash plumes, explosions, and crater incandescence (BGVN 48:12). This report covers similar activity of ash plumes, incandescent ejecta, and ashfall during November 2023 through February 2024 using monthly and weekly reports from the Japan Meteorological Agency (JMA) and satellite data.
The MIROVA (Middle InfraRed Observation of Volcanic Activity) Log Radiative Power graph of the MODIS thermal anomaly data showed only two low-power thermal anomalies during mid-to-late January. Weak thermal activity was visible on 22 December 2023, and 11 and 16 January 2024, based on infrared satellite imagery (figure 85).
 |
Figure 85. Infrared (bands B12, B11, B4) satellite images showed thermal activity at the Otake crater of Suwanosejima on 11 (left) and 16 (right) January 2024. Courtesy of Copernicus Browser. |
Activity in the Otake crater during November and December 2023 was relatively low and characterized by ash plumes rising as high as 1.6 km above the crater (figure 86) and material ejected as far as 300 m from the crater. Although no explosions were detected, occasional incandescence was visible at Otake crater in a high-sensitivity surveillance camera. According to the Toshima Village Office, Suwanosejima Branch Office, ashfall was occasionally observed in the village (3.5 km SSW). As many as 22 volcanic earthquakes were detected on the W side of the volcano during November and 35 were detected during December. Near the Otake crater, there were 52 volcanic earthquakes detected during November and 59 during December. Based on observations conducted by the University of Tokyo Graduate School of Science, Kyoto University Disaster Prevention Research Institute, Toshima Village, and JMA, the amount of sulfur dioxide emissions released during November was 500-900 tons per day (t/d) and during December was 200-300 t/d. An eruptive event at 1423 on 11 November produced an ash plume that rose 1.2 km above the crater and ashfall was reported 3.5 km SW of Mitake crater. Subsequent ash plumes rose 1-1.5 km above the crater and mainly drifted SE and W on 14, 16, 20-21, and 25 November. During 24-25 December eruption plumes rose as high as 1.2 km above the crater and drifted S and SE and rose 1-1.6 km above the crater and drifted SW, S, SE, and E during 27-28 and 30 December and 1 January.
 |
Figure 86. Webcam image of an eruption plume rising 1.2 km above the Otake crater at Suwanosejima at 1427 on 11 November 2023. Photo has been color corrected. Courtesy of JMA (Volcanic activity commentary for Suwanosejima, November 2023). |
Similar activity continued during January, with ash plumes rising 2 km above the crater and ejecta traveling 200-1,100 m from the Otake crater. Crater incandescence was occasionally observed at night using high-sensitivity surveillance cameras. The Toshima Village Office, Suwanosejima Branch Office occasionally heard rumbling sounds and reported ashfall in the village. The number of volcanic earthquakes occurring on the W side of the volcano was 22, while the number near Otake crater was 167. Ash plumes rose 1-2 km above the crater during 1-2, 6, and 8 January that drifted in multiple directions. Continuous ash emissions were reported during 0157-0620 and 0834-2235 on 2 January. An explosion at 0548 on 13 January generated an ash plume that rose 800 m and drifted SE. On 14 January an explosion at 0022 ejected large blocks 1.1 km N and 1 km S from the vent (figure 87) and produced an ash plume 500 m above the crater. Around 0055 the Volcano Alert Level (VAL) was raised to 3 (on a 5-level scale).
 |
Figure 87. Webcam image of an explosion and incandescent ejecta from Suwanosejima’s Otake crater at 0022 on 14 January 2024. An accompanying plume rose 2 km above the crater and material was ejected 1.1 km from the crater. Courtesy of JMA (Volcanic activity commentary for Suwanosejima, January 2024). |
Explosions at 2313 on 15 January generated an ash plume that rose more than 1 km above the crater and drifted S. Later, around 1100 on 19 January, since no rocks were deposited within 1 km from the center of Otake crater, the VAL was lowered to 2 (the second-lowest level on a 5-level scale). Seven explosions were detected from 1759 on 19 January to 1222 on 22 January. Details about the plumes were reported for two of them and unknown for the remaining ones; on 21 January an explosion at 1632 produced an ash plume that rose 1 km above the crater and drifted SE, and at 2215 an ash plume rose 600 m above the crater before merging into weather clouds. Three explosions were detected at 1135 on 29 January, at 0950 and at 2223 on 31 January, generating ash plumes that rose 500-1,000 m above the crater and drifted SE and E.
During February, activity consisted of eruption plumes that rose 1.4 km above the crater, incandescent ejecta traveling as far as 600 m from the crater, nighttime crater incandescence, rumbling sounds, and ashfall in Toshima village. There were 15 explosions detected throughout the month. As many as 23 volcanic earthquakes were recorded on the W side of the volcano, and 141 near Otake crater. Eruptions recorded at 1147 on 6 February and at 1314 on 12 February produced ash plumes that rose 1 km above the crater and drifted SE and S, respectively. At 0810 and 1414 on 13 February generated ash plumes that rose 1.1-1.3 km above the crater and drifted N. An explosion at 1908 on 15 February generated an ash plume that rose 400 m above the crater and drifted E. Explosions were also recorded at 2125 on 15 February, at 0616 on 19 February, at 0604 and 2157 on 24 February, and at 1149 on 25 February, although specific details of the emissions weren’t reported. Eruptive events at 1702 and 2056 on 23 February produced ash plumes that rose at least 1 km above the crater and drifted S. Explosions at 2343 on 25 February and at 0431, 1402, 1910, and 1918 on 26 February generated ash plumes that rose 400-800 m above the crater and drifted S. More explosions were detected at 0135, 0249, and 0617 on 27 February and 1537 on 28 February that generated ash plumes rising 500-800 m above the crater and drifted S, W, and SE. An eruptive event at 0104 on 28 February produced an ash plume that rose 1.4 km above the crater and drifted S.
Geologic Background. The 8-km-long island of Suwanosejima in the northern Ryukyu Islands consists of an andesitic stratovolcano with two active summit craters. The summit is truncated by a large breached crater extending to the sea on the E flank that was formed by edifice collapse. One of Japan's most frequently active volcanoes, it was in a state of intermittent Strombolian activity from Otake, the NE summit crater, between 1949 and 1996, after which periods of inactivity lengthened. The largest recorded eruption took place in 1813-14, when thick scoria deposits covered residential areas, and the SW crater produced two lava flows that reached the western coast. At the end of the eruption the summit of Otake collapsed, forming a large debris avalanche and creating an open collapse scarp extending to the eastern coast. The island remained uninhabited for about 70 years after the 1813-1814 eruption. Lava flows reached the eastern coast of the island in 1884. Only about 50 people live on the island.
Information Contacts: Japan Meteorological Agency (JMA), 1-3-4 Otemachi, Chiyoda-ku, Tokyo 100-8122, Japan (URL: http://www.jma.go.jp/jma/indexe.html); MIROVA (Middle InfraRed Observation of Volcanic Activity), a collaborative project between the Universities of Turin and Florence (Italy) supported by the Centre for Volcanic Risk of the Italian Civil Protection Department (URL: http://www.mirovaweb.it/); Copernicus Browser, Copernicus Data Space Ecosystem, European Space Agency (URL: https://dataspace.copernicus.eu/browser/).
Cite this Report
Continued yellow-green discolored water plumes during August 2023-January 2024
Kavachi is a submarine volcano in the SW Pacific located in the Solomon Islands south of Gatokae and Vangunu Islands. Its first recorded eruption occurred in 1939 and it has since produced many ephemeral islands up to 1 km long where lava flows were occasionally observed. Volcanism has been characterized by phreatomagmatic explosions that ejected steam, ash, and incandescent bombs. The current eruption period has been ongoing since at least March 2020 and has primarily been characterized by variable yellow-green discolored water plumes (BGVN 48:08). This report covers similar activity of discolored water plumes during August 2023 through January 2024 based on satellite imagery.
Natural color satellite imagery showed occasional discolored (light yellow-green) submarine plumes on clear weather days that generally originated from a single point during each month, except for August, of the reporting period (figure 30). The discolored water plumes drifted or extended in different directions with each observation. On 2 September, the discolored plume extended radially around a single point. On 7 September and 7 October discolored plumes extended SW. The discolored water plume drifted NW on 2 October. A weak, light blue discolored water plume extended E on 17 October, NW on 27 October, and E on 15 January. On 1 November and 31 December, a yellow-green plume drifted SE and SW. A small ring of yellow-green discolored water was visible on 11 December. On 21 December yellow-green and bluish discolored water extended both NE and NW and on 26 December the plume drifted W.
 |
Figure 30. Natural color satellite images showing light yellow-green discolored plumes of water originating from Kavachi (white arrow) on 27 October 2023 (top left), 1 November 2023 (top right), 31 December 2023 (bottom left), 15 January 2024 (bottom right). The plumes varied in intensity, length, and direction, though they all originated from a single point. Courtesy of Copernicus Browser. |
Geologic Background. Named for a sea-god of the Gatokae and Vangunu peoples, Kavachi is located in the Solomon Islands south of Vangunu Island. Sometimes referred to as Rejo te Kvachi ("Kavachi's Oven"), this shallow submarine basaltic-to-andesitic volcano has produced ephemeral islands up to 1 km long many times since its first recorded eruption during 1939. Residents of the nearby islands of Vanguna and Nggatokae (Gatokae) reported "fire on the water" prior to 1939, a possible reference to earlier eruptions. The roughly conical edifice rises from water depths of 1.1-1.2 km on the north and greater depths to the SE. Frequent shallow submarine and occasional subaerial eruptions produce phreatomagmatic explosions that eject steam, ash, and incandescent bombs. On a number of occasions lava flows were observed on the ephemeral islands.
Information Contacts: Copernicus Browser, Copernicus Data Space Ecosystem, European Space Agency (URL: https://dataspace.copernicus.eu/browser/).
Cite this Report
Explosions, gas-and-ash plumes, and seismicity during May-October 2024
Sabancaya, in Peru, is northeast of Ampato and southeast of Hualca Hualca. Observed eruptions date back to 1750 and have been characterized by explosions, phreatic activity, ash plumes, and ashfall. The current eruption period began in November 2016 and has more recently consisted of frequent explosions, gas-and-ash plumes, and thermal activity (BGVN 49:05). This report describes similar activity during May through October 2024 using information from the Instituto Geophysico del Peru (IGP) and various satellite data.
MODIS thermal anomaly data provided by MIROVA (Middle InfraRed Observation of Volcanic Activity) showed frequent low-to-moderate power thermal anomalies during August through October (figure 128). A short break in activity occurred in late September, followed by frequent low-power anomalies. A total of 10 thermal alerts were detected by the MODVOLC thermal alert system: one in May, eight in July, and one in August. Infrared satellite images showed persistent thermal activity at the summit crater throughout the reporting period (figure 129). Near-daily sulfur dioxide (SO2) plumes recorded by the TROPOMI instrument on the Sentinel-5P satellite exceeded 2 Dobson Units (DUs) during the reporting period (figure 130). Seismicity throughout the reporting period included volcano-tectonic (VT) type events that indicate rock fracturing events. Slight inflation was reported at the N part of the volcano near Hualca Hualca (4 km N).
 |
Figure 128. Thermal activity at Sabancaya showed frequent thermal anomalies of low-to-moderate power during August through October 2024, based on this MIROVA graph (Log Radiative Power). There was a short pause in activity detected in late September. Courtesy of MIROVA. |
 |
Figure 129. Infrared (bands B12, B11, B4) satellite image showing a thermal anomaly (yellow-orange) at the summit crater of Sabancaya on 12 June 2024. An ash plume (gray-brown) is visible rising from the summit crater and drifting S. Courtesy of Copernicus Browser. |
 |
Figure 130. Sulfur dioxide plumes from Sabancaya were detected by the TROPOMI instrument on the Sentinel-5P satellite throughout the reporting period, as shown here on 10 May 2024 (top left), 15 August 2024 (top right), 7 September 2024 (bottom left), and 25 October 2024 (bottom right). Each plume shown exceeded 2 DU and drifted predominately S and SW. Ubinas to the SE also frequently emits sulfur dioxide plumes. Courtesy of NASA Global Sulfur Dioxide Monitoring Page. |
During May, IGP reported daily explosions, seismicity, and SO2 emissions. There were 1,148 explosions detected, with 8-63 explosions reported each day. Gas-and-ash plumes rose 1.2-4 km above the summit and drifted in multiple directions. On 12 and 15 May gas-and-ash plumes rose 4 km above the summit and drifted S, SE, and E; on the 15th, they also drifted NE (figure 131). There were 1,118 volcanic earthquakes recorded during the month, the most of which was 63 on 18 May. Weekly sulfur dioxide measurements ranged from 541 to 1,203 tons per day (t/d); the highest was recorded during 6-13 May.
 |
Figure 131. Webcam image of a gas-and-ash plume rising 4 km above the summit of Sabancaya and drifting S, SE, E, and NE at 0949 on 18 May 2024. Courtesy of IGP (REPORTE VULCANOLÓGICO DIARIO 18 de mayo de 2024). |
Similar activity continued during June. There were 1,118 explosions and 15-54 explosions were reported each day. Gas-and-ash plumes rose 500-2,900 m above the summit and drifted in multiple directions. On 25 June a gas-and-ash plume rose 2.9 km above the summit and drifted S, SE, and NE (figure 132). There were 1,211 volcanic earthquakes detected during the month, the most of which was 54 on 4 June. Weekly sulfur dioxide measurements ranged from 534 and 877 t/d; the highest measurement was recorded during 3-9 June.
 |
Figure 132. Webcam image of a gas-and-ash plume rising 2.9 km above the summit of Sabancaya and drifting S, SE, and NE at 1223 on 25 June 2024. Courtesy of IGP (REPORTE VULCANOLÓGICO DIARIO 25 de junio de 2024). |
In July, activity was generally consistent with continued explosions, seismicity, and SO2 emissions. There was a total of 1,771 explosions, with 21-80 recorded each day. Gas-and-ash plumes rose 200-3,100 m above the summit and drifted in multiple directions. On 28 July a gas-and-ash plume rose 3.1 km above the summit and drifted less than 10 km S, SE, E, and NE (figure 133). There were 1,771 volcanic earthquakes reported, the most of which was 80 on 19 July. Weekly SO2 emissions were between 497-1,196 t/d; the higher measurement was recorded during 15-22 July.
 |
Figure 133. Webcam image of a gas-and-ash plume rising 3.1 km above the summit of Sabancaya and drifting S, SE, E, and NE at 0711 on 28 July 2024. Courtesy of IGP (REPORTE VULCANOLÓGICO DIARIO 28 de julio de 2024). |
During August, similar activity continued. There were 1,846 explosions during the month with 30-72 each day. Gas-and-ash plumes rose 600-2,500 m above the summit and drifted in multiple directions. On 16 August a gas-and-ash plume rose 2.5 km above the summit and drifted SW, S, and SE (figure 134). There were 1,846 reported volcanic earthquakes, the most of which was 72 on 29 August. Weekly SO2 measurements were between 158-621 t/d; the higher measurement was recorded during 11-18 August.
 |
Figure 134. Webcam image of a gas-and-ash plume rising 2.5 km above the summit of Sabancaya and drifting SW, S, and SE at 1229 on 16 August 2024. Courtesy of IGP (REPORTE VULCANOLÓGICO DIARIO 16 de agosto de 2024). |
Explosions, seismicity, and SO2 emissions continued during September. A total of 1,356 explosions were reported, with 5-60 reported each day. Gas-and-ash plumes rose 800-2,300 m above the summit and drifted in multiple directions. On 24 September a gas-and-ash plume rose 2.3 km above the summit and drifted SW, S, and SE (figure 135). There were 1,356 volcanic earthquakes detected, the most of which was 60 on 10 September. SO2 measurements were between 328-1,055 t/d; the higher average occurred during 2-8 September.
 |
Figure 135. Webcam image of a gas-and-ash plume rising 2.3 km above the summit of Sabancaya and drifting SW, S, and SE at 0743 on 24 September 2024. Courtesy of IGP (REPORTE VULCANOLÓGICO DIARIO 24 de septiembre de 2024). |
Similar activity continued through October. There were 1,320 explosions with 2-42 occurring each day. Gas-and-ash plumes rose 400-2,200 m above the summit and drifted in multiple directions. On 30 October a gas-and-ash plume rose 2.2 km above the summit and drifted S, SW, W, and NW (figure 136). There were 1,320 earthquakes reported, the highest number of which was 42 on 7 October. The number of earthquakes were not reported on 23 and 24 October. Slight inflation continued to the N near Hualca Hualca. SO2 measurements each week were 504-770 t/d, the higher average was recorded during 21-27 October.
 |
Figure 136. Webcam image of a gas-and-ash plume rising 2.2 km above the summit of Sabancaya and drifting S, SW, W, and NW at 1355 on 30 October 2024. Courtesy of IGP (REPORTE VULCANOLÓGICO DIARIO 24 de octubre de 2024). |
Geologic Background. Sabancaya, located in the saddle NE of Ampato and SE of Hualca Hualca volcanoes, is the youngest of these volcanic centers and the only one to have erupted in historical time. The oldest of the three, Nevado Hualca Hualca, is of probable late-Pliocene to early Pleistocene age. The name Sabancaya (meaning "tongue of fire" in the Quechua language) first appeared in records in 1595 CE, suggesting activity prior to that date. Holocene activity has consisted of Plinian eruptions followed by emission of voluminous andesitic and dacitic lava flows, which form an extensive apron around the volcano on all sides but the south. Records of observed eruptions date back to 1750 CE.
Information Contacts: Instituto Geofisico del Peru (IGP), Centro Vulcanológico Nacional (CENVUL), Calle Badajoz N° 169 Urb. Mayorazgo IV Etapa, Ate, Lima 15012, Perú (URL: https://www.igp.gob.pe/servicios/centro-vulcanologico-nacional/inicio); MIROVA (Middle InfraRed Observation of Volcanic Activity), a collaborative project between the Universities of Turin and Florence (Italy) supported by the Centre for Volcanic Risk of the Italian Civil Protection Department (URL: http://www.mirovaweb.it/); NASA Global Sulfur Dioxide Monitoring Page, Atmospheric Chemistry and Dynamics Laboratory, NASA Goddard Space Flight Center (NASA/GSFC), 8800 Greenbelt Road, Goddard MD 20771, USA (URL: https://so2.gsfc.nasa.gov/); Copernicus Browser, Copernicus Data Space Ecosystem, European Space Agency (URL: https://dataspace.copernicus.eu/browser/).
Cite this Report
Gas-and-ash explosions, SO2 plumes, and thermal anomalies continue through April 2024
Yasur, the southernmost active volcano in Vanuatu, has been erupting since at least 1774 with frequent Strombolian explosions and plumes from several vents in the 400-m-diameter summit crater (BGVN 48:11). This report summarizes activity during November 2023-April 2024, using information from bulletins of the Vanuatu Meteorology and Geo-Hazards Department (VMGD) and various satellite data. According to VMGD, Yasur (also called Tanna, after the island on which it is located) has remained on Alert Level 2 (major unrest state, on a scale of 0-5) since 18 October 2016; VMGD has warned the public not to enter the restricted area within a radius of 600 m around the cone (Danger Zone A on the VMGD’s Caldera Safety Map, as pictured in BGVN 43:02).
According to VMGD, satellite and visual observations demonstrated that frequent ash explosions, confined to the crater, continued during the reporting period, along with gas-and-steam emissions. Some explosions ejected bombs that landed back in and around the crater. According to the 4 December 2023 VMGD Bulletin, satellite observations indicated that gas-and-steam and ash emissions from the summit crater had increased. Small sulfur dioxide plumes were occasionally detected during this report period by the TROPOMI instrument aboard the Sentinel-5P satellite. Infrared detectors aboard the Sentinel-2 satellites and MODIS data compiled by the MIROVA system (figure 92) both recorded heat signals from the summit crater.
 |
Figure 92. MIROVA (Log Radiative Power) graph of thermal data for Yasur during the year ending on 11 March 2024, showed variable low-to-moderate power thermal anomalies detected by MODIS instruments. Detected thermal anomalies became much less frequent after August 2023. Courtesy of MIROVA. |
Geologic Background. Yasur has exhibited essentially continuous Strombolian and Vulcanian activity at least since Captain Cook observed ash eruptions in 1774. This style of activity may have continued for the past 800 years. Located at the SE tip of Tanna Island in Vanuatu, this pyroclastic cone has a nearly circular, 400-m-wide summit crater. The active cone is largely contained within the small Yenkahe caldera, and is the youngest of a group of Holocene volcanic centers constructed over the down-dropped NE flank of the Pleistocene Tukosmeru volcano. The Yenkahe horst is located within the Siwi ring fracture, a 4-km-wide open feature associated with eruption of the andesitic Siwi pyroclastic sequence. Active tectonism along the Yenkahe horst accompanying eruptions has raised Port Resolution harbor more than 20 m during the past century.
Information Contacts: Geo-Hazards Division, Vanuatu Meteorology and Geo-Hazards Department (VMGD), Ministry of Climate Change Adaptation, Meteorology, Geo-Hazards, Energy, Environment and Disaster Management, Private Mail Bag 9054, Lini Highway, Port Vila, Vanuatu (URL: http://www.vmgd.gov.vu/, https://www.facebook.com/VanuatuGeohazardsObservatory/); MIROVA (Middle InfraRed Observation of Volcanic Activity), a collaborative project between the Universities of Turin and Florence (Italy) supported by the Centre for Volcanic Risk of the Italian Civil Protection Department (URL: http://www.mirovaweb.it/); NASA Global Sulfur Dioxide Monitoring Page, Atmospheric Chemistry and Dynamics Laboratory, NASA Goddard Space Flight Center (NASA/GSFC), 8800 Greenbelt Road, Goddard, Maryland, USA (URL: https://so2.gsfc.nasa.gov/); Copernicus Browser (URL: https://dataspace.copernicus.eu/browser); Copernicus Browser (URL: https://dataspace.copernicus.eu/browser).
Cite this Report
Daily explosions, gas-and-ash plumes, and seismicity during November 2023-April 2024
Sabancaya, located in the saddle northeast of Ampato and southeast of Hualca Hualca volcanoes in Peru, has a record of observed activity dating back to 1750. Eruptions have been characterized by explosions, phreatic activity, and ash plumes, and ashfall. The current eruption period began in November 2016 and has recently consisted of frequent explosions, gas-and-ash plumes, and thermal activity (BGVN 48:11). This report updates similar activity during November 2023 through April 2024 using information from Instituto Geophysico del Peru (IGP) that use weekly activity reports and various satellite data.
Frequent low-power thermal activity was detected by MODIS satellite data, according to a MIROVA (Middle InfraRed Observation of Volcanic Activity) analysis during November 2023 through 11 March 2024 due to the active lava dome (figure 125). A gradual increase in power was visible during November and peaked in early December 2023. On clear weather days, thermal activity was visible in infrared satellite imagery, which showed the active lava dome in the summit crater (figure 126). Frequent sulfur dioxide plumes were also recorded throughout the reporting period by the TROPOMI instrument on the Sentinel-5P satellite (figure 127). Many of these plumes exceeded 2 Dobson Units (DUs) and drifted in different directions.
 |
Figure 125. Frequent low-power thermal anomalies detected at Sabancaya during 11 March 2023 through 11 March 2024, as shown in this MIROVA graph (Log Radiative Power). There was a gradual increase in power during November, peaking in early December. Courtesy of MIROVA. |
 |
Figure 126. Infrared (bands B12, B11, B4) satellite image showing a consistent thermal anomaly in the summit crater of Sabancaya, as shown on 9 January 2024, represented by the active lava dome. Sometimes gas-and-steam emissions also accompanied this activity. Courtesy of Copernicus Browser. |
 |
Figure 127. Frequent sulfur dioxide plumes rose from Sabancaya were detected by the TROPOMI instrument on the Sentinel-5P satellite. Plumes from 30 November 2023 (top left), 22 December 2023 (top middle), 17 January 2024 (top right), 23 February 2024 (bottom left), 2 March 2024 (bottom middle), and 19 April 2024 (bottom right) exceeded 2 Dobson Units (DUs) and drifted in different directions. Courtesy of NASA Global Sulfur Dioxide Monitoring Page. |
IGP reported moderate activity during November and December 2023. The average number of volcanic explosions reported each week were 5, 10, 22, 31, and 45 during November, and 36, 55, 59, and 62 during December. Gas-and-ash plumes in November rose 2.1-3.1 km above the summit and drifted SE, W, SW, S, NE, and E. During December gas-and-ash plumes rose 1.6-3.5 km above the summit and drifted W, NW, E, SE, and SW. There were 775 volcanic earthquakes detected during November and 1,097 during December. Seismicity also included volcano-tectonic (VT)-type events that indicate rock fracturing. Minor inflation was observed in the N part of the volcano near Hualca Hualca (4 km N). Thermal anomalies were often identified in satellite monitoring due to the active lava dome.
Similar activity was described during January and February 2024. The average number of volcanic explosions reported each week were 61, 50, 52, and 47 during January, and 29, 33, 35, and 30 during February. Gas-and-ash plumes during January rose 1.7-2.5 km above the summit and drifted W, NW, and SW. Gas-and-ash plumes during February rose 1.6-2.6 km above the summit and drifted W, SW, E, SE, S, N, and NW. There were 1,248 volcanic earthquakes detected during January and 932 during February. VT-type earthquakes and slight inflation in the N part of the volcano persisted. Thermal anomalies were detected in satellite monitoring due to the presence of the lava dome. During 29 January and 4 February moderate sulfur dioxide emissions were measured at values of 2,102 tons per day (t/d). During February sulfur dioxide measurements ranged from 749-1,742 t/d. On 26 February a lahar was reported on the SE flank in the Sallalli drainage that moved toward the Parcomayo River, according to IGP.
During March and April 2024 the average number of volcanic explosions reported each week were 41, 20, 29, 19, and 12 during March, and 32, 44, 57, and 35 during April. Gas-and-ash plumes rose 1.5-2.8 km above the summit and drifted SW, W, NW, S, SE, and E during March, and 2.3-4.1 km above the summit and drifted S, SW, SE, E, and W during April. As many as 1,311 volcanic earthquakes were recorded during March and 865 during April. Seismicity characterized by VT-type events continued, in addition to slight inflation in the N part of the volcano. During the week of 26 February to 3 March sulfur dioxide emissions averaged 1,745 t/d. Sulfur dioxide flux values in March ranged from 504-2,134 t/d, and during April they varied from 524-1,733 t/d. Occasionally, thermal anomalies were identified in satellite monitoring due to the active lava dome at the summit crater.
Geologic Background. Sabancaya, located in the saddle NE of Ampato and SE of Hualca Hualca volcanoes, is the youngest of these volcanic centers and the only one to have erupted in historical time. The oldest of the three, Nevado Hualca Hualca, is of probable late-Pliocene to early Pleistocene age. The name Sabancaya (meaning "tongue of fire" in the Quechua language) first appeared in records in 1595 CE, suggesting activity prior to that date. Holocene activity has consisted of Plinian eruptions followed by emission of voluminous andesitic and dacitic lava flows, which form an extensive apron around the volcano on all sides but the south. Records of observed eruptions date back to 1750 CE.
Information Contacts: Instituto Geofisico del Peru (IGP), Centro Vulcanológico Nacional (CENVUL), Calle Badajoz N° 169 Urb. Mayorazgo IV Etapa, Ate, Lima 15012, Perú (URL: https://www.igp.gob.pe/servicios/centro-vulcanologico-nacional/inicio); MIROVA (Middle InfraRed Observation of Volcanic Activity), a collaborative project between the Universities of Turin and Florence (Italy) supported by the Centre for Volcanic Risk of the Italian Civil Protection Department (URL: http://www.mirovaweb.it/); NASA Global Sulfur Dioxide Monitoring Page, Atmospheric Chemistry and Dynamics Laboratory, NASA Goddard Space Flight Center (NASA/GSFC), 8800 Greenbelt Road, Goddard MD 20771, USA (URL: https://so2.gsfc.nasa.gov/); Copernicus Browser, Copernicus Data Space Ecosystem, European Space Agency (URL: https://dataspace.copernicus.eu/browser/).
Cite this Report
Ongoing explosive activity during December 2023-May 2024
Ebeko, located on the N end of Paramushir Island in Russia’s Kuril Islands just S of the Kamchatka Peninsula, consists of three summit craters along a SSW-NNE line at the northern end of a complex of five volcanic cones. Observed eruptions date back to the late 18th century, with small-to-moderate explosions from the summit crater. The current eruptive period began in June 2022, and has recently included frequent explosions, ash plumes, and thermal activity (BGVN 48:12). This report covers similar activity during December 2023 through May 2024, based on information from the Kamchatka Volcanic Eruptions Response Team (KVERT) and satellite data. Dates are reported in UTC.
According to KVERT, moderate explosions continued throughout the reporting period, and the Aviation Color Code remained at Orange (the second highest level). Based on visual observations from the town of Severo-Kurilsk (7 km ESE), explosions ejected ash 2-4.5 km above the summit at least once a week, and usually several times (figure 52); none were reported during the week ending 30 May.
 |
Figure 52. Photograph of an ash explosion from the active summit crater of Ebeko on 12 March 2024. Photo by L. Kotenko, courtesy of IVS FEB RAS, KVERT. |
Satellite data showed an ash plume extending 11 km SE on 6 February. Ashfall was reported at Severo-Kurilsk on 18, 19, and 26 February, and 6 and 12 March 2024. According to KVERT, thermal anomalies over the volcano were recorded beginning on 15 February; several were recorded each month in March-May. The MIROVA system also identified intermittent weak thermal anomalies during May-July 2024.
Geologic Background. The flat-topped summit of the central cone of Ebeko volcano, one of the most active in the Kuril Islands, occupies the northern end of Paramushir Island. Three summit craters located along a SSW-NNE line form Ebeko volcano proper, at the northern end of a complex of five volcanic cones. Blocky lava flows extend west from Ebeko and SE from the neighboring Nezametnyi cone. The eastern part of the southern crater contains strong solfataras and a large boiling spring. The central crater is filled by a lake about 20 m deep whose shores are lined with steaming solfataras; the northern crater lies across a narrow, low barrier from the central crater and contains a small, cold crescentic lake. Historical activity, recorded since the late-18th century, has been restricted to small-to-moderate explosive eruptions from the summit craters. Intense fumarolic activity occurs in the summit craters, on the outer flanks of the cone, and in lateral explosion craters.
Information Contacts: Kamchatka Volcanic Eruptions Response Team (KVERT), Far Eastern Branch, Russian Academy of Sciences, 9 Piip Blvd., Petropavlovsk-Kamchatsky, 683006, Russia (URL: http://www.kscnet.ru/ivs/kvert/); MIROVA (Middle InfraRed Observation of Volcanic Activity), a collaborative project between the Universities of Turin and Florence (Italy) supported by the Centre for Volcanic Risk of the Italian Civil Protection Department (URL: http://www.mirovaweb.it/).
Select a month and year from the drop-downs and click "Show Issue" to have that issue displayed in this tab.
The default month and year is the latest issue available.
Aira (Japan)
Increased explosive activity; rain-caused debris flows
Atmospheric Effects (1980-1989) (Unknown)
Tiny aerosols recondense above 30 km; little change to N hemisphere cloud; unusual sunrises and sunsets
Chichon, El (Mexico)
Vapor emission but no eruptive activity
Colima (Mexico)
Lava extrusion ended June 1982 but plume emission continues
Kilauea (United States)
Renewed fountaining and lava flow production on E Rift
Langila (Papua New Guinea)
Explosions build to 6-day Strombolian-Vulcanian event
Lengai, Ol Doinyo (Tanzania)
Tephra emission continues; lava flow
Long Valley (United States)
Seismicity remains elevated; but no new swarms
Manam (Papua New Guinea)
Rumblings, night glow, increased vapor emissions
Ruapehu (New Zealand)
Possibly pre-eruptive changes continue
St. Helens (United States)
Spine added to February lobe, then extrusion stops; seismicity indicates renewed extrusion by late March
Cite this Report
Increased explosive activity; rain-caused debris flows
The rate of explosions at the summit crater of Minami-dake has gradually increased since December. In January, 53 were recorded and in February, 73 explosions were recorded, one of the larger monthly totals since the eruption began in 1955.
Ashfall and eruption clouds were observed on 11, 14, and 27 February at Miyakonojo Observatory. The air shock from the explosion at 2241 on 5 February was large enough to be felt at Miyazaki Observatory, 80 km NE. On 18 February a hut at Arimura, 3 km SSE of the summit, was set on fire by an incandescent block, 50-100 cm in diameter. The explosion at 1043 on the 21st was not large enough to be accompanied by any observed explosive sound or felt air shock at Kagoshima Observatory but strong NW winds carried lapilli toward the SE foot of the volcano where 4 car windshields were cracked or broken. Two incandescent columns, rising about 200 m above the crater, were observed in February for 10 seconds on the 1st, and for 5 seconds on the 27th.
Rain on 2 February triggered debris flows in S flank valleys. One flowed into nine houses and a hotel after pushing away a 10-m-long sand-trap wall, and covered the adjacent road for about 50 m. The monthly number of recorded seismic events was 4,456 in January, but decreased to 2410 in February.
Geologic Background. The Aira caldera in the northern half of Kagoshima Bay contains the post-caldera Sakurajima volcano, one of Japan's most active. Eruption of the voluminous Ito pyroclastic flow accompanied formation of the 17 x 23 km caldera about 22,000 years ago. The smaller Wakamiko caldera was formed during the early Holocene in the NE corner of the caldera, along with several post-caldera cones. The construction of Sakurajima began about 13,000 years ago on the southern rim and built an island that was joined to the Osumi Peninsula during the major explosive and effusive eruption of 1914. Activity at the Kitadake summit cone ended about 4,850 years ago, after which eruptions took place at Minamidake. Frequent eruptions since the 8th century have deposited ash on the city of Kagoshima, located across Kagoshima Bay only 8 km from the summit. The largest recorded eruption took place during 1471-76.
Information Contacts: JMA, Tokyo.
Cite this Report
Tiny aerosols recondense above 30 km; little change to N hemisphere cloud; unusual sunrises and sunsets
Lidar data. Lidar measurements from Nagoya, Japan (35.13°N, 136.88°E) 2, 6, 13, 19, and 27 December showed similar altitudes and peak backscattering ratios, but small secondary peaks were detected at 35-36 km only on the 13th and 19th. Both the altitude and the strength of peak backscatter measured at Garmisch-Partenkirchen, Germany were significantly higher on 1 January than for the very consistent readings of 10, 18, and 29 January. Late February-early March lidar data from Mauna Loa, Hawaii, Fukuoka, Japan, and Hampton, Virginia were similar to data at the same locations a month earlier. Integrated aerosol backscatter was considerably higher in Virginia than in Hawaii, suggesting that the bulk of the cloud had moved from the low latitudes where it was concentrated for several months after the March-April 1982 eruption.
Unusual sunrises and sunsets. From Tsukuba, Japan (36°N, 140°E) Toshio Fujita observed unusual twilight glows through January. Evening glows in December appeared redder than those in November, but by mid-January the red twilight colors were rapidly becoming lighter. A twilight photograph taken 24 January showed much paler colors than one taken 7 December at a time of similar solar depression angle. Despite the difference in color, the peak backscattering ratio measured 26 January was very close to the 8 December value. The maximum backscattering ratio increased from 17 (at 23 km altitude) on 8 December, to 28 on 28 December, but both heights of the strongest aerosol layers and their peak backscattering ratios were gradually descending by mid-January, and maximum backscattering was 16 on the 26th. Fujita attributed the differences in color at times of similar lidar readings to varying turbidity in the lower atmosphere. In mid-February, lidar at Tsukuba again measured relatively weak backscattering and the strongest aerosol layer had descended farther to about 20 km altitude.
Edward Brooks noted considerable variation in dawn and dusk colors from Jeddah, Saudi Arabia in February. Colorful early dawns 6-9 February indicated the presence of higher stratospheric aerosols, but the absence of unusual late dawn colors suggested that lower stratospheric aerosols were absent. This pattern reversed early 10 February, when no early dawn was evident but a colorful late dawn resulted from illumination of volcanic layers near the tropopause, visible as faint N-S bands. Similar bands were visible that evening, when aerosols could be observed both at the tropopause and higher in the stratosphere. Few unusual colors were visible early 11 February, but on the 12th both the upper and lower aerosol layers were illuminated. For the next several days, bands of material, generally trending SSW-NNE, were often observed at dawn and twilight with both early and late colors. Only higher aerosols were illuminated at dawn 19 February; some lower-altitude material appeared to be present early 20 February, but no unusual colors were evident that evening.
From Norwich, England, H. H. Lamb reported that on all cloudless days the sun continued to be surrounded by a white sheen of diffused light that seemed to be increasing steadily in extent, from about 20° in angular radius in mid-January to 25-30° as of 10 February. The sun itself often appeared nearly white at elevations of 5-15° and on partly cloudy days the sky was a paler gray than usual. Richard Keen observed no unusual sunsets from Boulder, Colorado between 13 January and 17 February.
Fred Schaaf observed increased optical effects in February from Millville, New Jersey after a notable weakening in January. By 15 February, late dawn colors (lower altitude aerosols) had returned to moderate levels. During the afternoon of 18 February, the sun was surrounded by a red-brown ring with a radius of about 30° that remained visible until shortly after sunset, when weather clouds obscured further observations. The next evening, twilight glow was stronger and Schaaf calculated that later glows seen for the first time since 31 January were produced by aerosols as high as about 16 km. Twilights were less impressive for the next few days, but similar effects were seen 23 February. On the 26th, the length of twilight glows indicated aerosols to 16-19 km. On 2 March, moderate to strong early twilight colors from material at about 16 km were followed by a very weak secondary glow that may have indicated the presence of aerosols to 32-40 km.
Balloon data - Wyoming. David Hofmann reported that balloon launches from Laramie, Wyoming continued to penetrate remnants of the extensive cloud of tiny aerosols at 29-35 km altitude first detected 28 January, and encountered a newly formed cloud of similar particles 2 March. The average radius of the 28 January particles was about 0.015 µm, with a few as large as 0.05-0.06 µm. Given the particle size distribution and a 30-50% drop in electrical conductivity measured within the cloud, Hofmann calculated a particle concentration of about 1,200/cm3. During the next week, this concentration dropped to about 100/cm3, a rate of decay corresponding closely to the expected rate of particle coagulation. About 90% of the particles disappeared when heated to 150°C, indicating that the cloud was composed of H2SO4 and H2O droplets. Remnants of this cloud were still present 2 March but had diffused and coagulated considerably, extending from 25-35 km altitude with a maximum concentration of about 50 particles per cm3. Although coagulation had increased the size of individual particles, they remained too small to be detected by lidar at these concentrations. Superimposed on the remnants of the 28 January cloud, a new cloud was detected 2 March. Sharply constrained between 31 and 34 km altitude, the new cloud reached concentrations of about 300 particles per cm3, and appeared to be about 4-5 days old.
Hofmann noted that between 25 and 35 km altitude, liquid H2SO4 is vulnerable to vaporization if its temperature is raised slightly. If cooled again, it would then recondense into tiny droplets. High-altitude wind data indicated that the 28 January cloud originated in the Alaska-Siberia area, in a zone of 30-40°C stratospheric warming. From this warm area, the cloud reached Wyoming in about 30 hours, carried by 200 km/hour winds. Cooling of about 40°C probably occurred during transport, sufficient to recondense the H2SO4. Similar clouds have been detected for the past several years, usually in the spring, but the 28 January cloud had particle concentrations 15 times as high as clouds seen in 1982, which in turn were 5 times as concentrated as 1981 clouds (Rosen and Hofmann, 1983).
The much larger particles from the original El Chichón cloud remained evident over Wyoming. During the most recent fully-analyzed sounding on 11 February, a very broad layer extended from the tropopause (11 km) to about 27 km with a peak concentration of 10 particles (larger than 0.15 µm) per cm3 at 19 km altitude. A sounding in an equatorial airmass, on 10 March, showed a similar profile, with a peak concentration of 8 particles per cm3 at 19-20 km altitude and the top of the cloud at roughly 27 km. The profile included a 1 km-thick zone of very clean air (about 1/2 particle per cm3) centered at about 15 km altitude, probably tropospheric in origin.
Reference. Rosen, J. M., and Hofmann, D. J., 1983, Unusual behavior in the condensation nuclei concentration at 30 km: JGR, v. 88, p. 3725-3731.
Geologic Background. The enormous aerosol cloud from the March-April 1982 eruption of Mexico's El Chichón persisted for years in the stratosphere, and led to the Atmospheric Effects section becoming a regular feature of the Bulletin. Descriptions of the initial dispersal of major eruption clouds remain with the individual eruption reports, but observations of long-term stratospheric aerosol loading will be found here.
Information Contacts: D. Hofmann, Univ. of Wyoming; W. Fuller, NASA; T. DeFoor, MLO; M. Hirono, Kyushu Univ., Japan; R. Reiter, Garmisch-Partenkirchen, W. Germany; E. Brooks, Saudi Arabia; H. Lamb, Univ. of East Anglia, England; T. Fujita, Meteorological Research Inst., Japan; S. Hayashida, Nagoya Univ., Japan; F. Schaaf, Millville NJ; R. Keen, Univ. of Colorado.
Cite this Report
Vapor emission but no eruptive activity
Geologists who left the volcano 10 February reported that activity at that time was limited to vapor emission from vents in and around the crater lake. No eruptive activity had been reported as of early March.
Geologic Background. El Chichón is a small trachyandesitic tuff cone and lava dome complex in an isolated part of the Chiapas region in SE México. Prior to 1982, this relatively unknown volcano was heavily forested and of no greater height than adjacent non-volcanic peaks. The largest dome, the former summit of the volcano, was constructed within a 1.6 x 2 km summit crater created about 220,000 years ago. Two other large craters are located on the SW and SE flanks; a lava dome fills the SW crater, and an older dome is located on the NW flank. More than ten large explosive eruptions have occurred since the mid-Holocene. The powerful 1982 explosive eruptions of high-sulfur, anhydrite-bearing magma destroyed the summit lava dome and were accompanied by pyroclastic flows and surges that devastated an area extending about 8 km around the volcano. The eruptions created a new 1-km-wide, 300-m-deep crater that now contains an acidic crater lake.
Information Contacts: H. Sigurdsson, Univ. of Rhode Island.
Cite this Report
Lava extrusion ended June 1982 but plume emission continues
A French team reached the N rim of the summit cone in early December. Storm damage to trails prevented them from reaching the S side of the cone, so they were unable to see the S flank lava flow produced by the eruption that began in December 1981. Only fumarolic activity was observed in the W part of the crater and on the N flank. Gas of essentially atmospheric composition was emitted at 500°C from the NE part of the cone and from a vent that had recently extruded a lava flow. Rockfalls occurred several times per day from the front of this flow and it may still have been advancing very slowly.
James Luhr and others visited Colima in mid-January and again in early February. The S flank lava flow appeared to have advanced very little since last observed by Luhr in March 1982. Residents of the area reported that incandescence had ended in June 1982. Plume emission continued in early 1983 at about the same intensity as a year earlier, but there were no episodic increases in intensity of plume emission as there had been in early 1982.
Geologic Background. The Colima complex is the most prominent volcanic center of the western Mexican Volcanic Belt. It consists of two southward-younging volcanoes, Nevado de Colima (the high point of the complex) on the north and the historically active Volcán de Colima at the south. A group of late-Pleistocene cinder cones is located on the floor of the Colima graben west and east of the complex. Volcán de Colima (also known as Volcán Fuego) is a youthful stratovolcano constructed within a 5-km-wide scarp, breached to the south, that has been the source of large debris avalanches. Major slope failures have occurred repeatedly from both the Nevado and Colima cones, producing thick debris-avalanche deposits on three sides of the complex. Frequent recorded eruptions date back to the 16th century. Occasional major explosive eruptions have destroyed the summit (most recently in 1913) and left a deep, steep-sided crater that was slowly refilled and then overtopped by lava dome growth.
Information Contacts: J. Cheminée, IPG, Paris; J. Luhr, Univ. of California, Berkeley.
Cite this Report
Renewed fountaining and lava flow production on E Rift
"The E rift zone eruption of Kīlauea that began on 3 January resumed on 10 February, and lava production continued until 4 March along eruptive fissures established during the initial outbreak on 3 January (figure 17). The renewed eruption followed nearly a month in which vent activity was limited largely to incandescence and emission of burning gases along parts of a 2-km segment of the vent system that extended E from about 0.75 km NE of Puʻu Kamoamoa to the area S of Puʻu Kahaualeʻa. During the quiet period, a little incandescant spatter was ejected sporadically from the E vents; at least some of the ejecta consisted of wallrock remelted and eroded from the vents by vigorous emission of burning gas. There was no measurable production of new lava.
"Increased spatter production was first recognized on 10 February; a small (6 m-high) spatter cone had formed at the E vents (0.7 km S of Puʻu Kahaulea). By 12 February, a second small spatter cone had formed, and a glowing crack extended tens of meters NE of the 2 cones. Subsequent intermittent production of low fountains and small lava flows through 24 February led to growth of a flat-topped shield estimated to be about 200 m long, 100 m wide, and 10 m thick. The shield was capped by a 170 m-long line of juxtaposed spatter cones ranging up to about 15 m high. Lava production during the 2-week shield-building period is estimated at 0.5 x 10⁶ m3. In addition, a short (probably 10-minute) episode of spatter production occurred at a vent just E of Puʻu Kamoamoa at about 2220 on 19 February. Gas emission during this period was low and was characterized by extremely low atomic C/S ratios (approximately 0.05) suggesting that the near-surface magma had largely degassed during the non-eruptive interval.
"Beginning at 0145 on 25 February, fountaining and lava flow production increased in the W and central parts of the shield and a flow about a kilometer long extended NE. Gas composition also changed at this time, becoming more C-rich (C/S approximately 0.15) and generally reverting to a composition indistinguishable from that of the early January gases. Thirteen hours later, at about 1440 on 25 February, the main eruptive locus shifted about 100 m uprift and eruption from the shield vents soon terminated, at 1518. Fountains played continuously at this new locus until the end of the eruptive episode on 4 March. During this period, sporadic lava production also occurred from local vents as far uprift as 0.75 km NE of Puʻu Kamoamoa.
"During its week of sustained activity, the main fountain, about 0.75 km SSW of Puʻu Kahaualeʻa, was commonly 40-80 m high. Estimated to be about 30 m wide at its base, the fountain arose from a lava pond about 60 m in diameter. By the evening of 25 February, the S rim of the levee containing the lava pond had developed a spillway through which 2 major flows were supplied during the ensuing week. One of these moved NE 25-26 February within the same graben that contained the upper part of the 7 January flow. Following the path of that earlier flow, the new flow turned SE about 0.5 km W of Kalalua and stopped about 3 km from its source.
"By the morning of 27 February, the active lava river leading from the pond had been diverted SE, producing a flow that eventually extended more than 7 km from the vent to its terminus, about 3.8 km from the coast. This latest flow, parallel to and a kilometer SW of the 7 January flow, advanced slowly through the rain forest until 4 March, when lava production stopped. In the half nearest the vent, where the feeding channel was largely pāhoehoe, the average velocity of the advancing flow front was about 90 m/hour. In the lower half, where the flow was dominantly ʻāʻā, the front advanced episodically, but at an average rate of about 30 m/hour, even on the steepest (about 7°) slopes.
"In the early evening of 2 March, the advancing ʻāʻā front, locally up to 10 m thick, entered the NE part of a sparsely populated subdivision on the S flank, just E of Hawaiʻi Volcanoes National Park. Two dwellings were destroyed before lava production at the vent stopped at about 1500 on 4 March. Subsequent movement in the distal part of the flow was limited to minor adjustments that led to only a few meters of additional lava advance.
"Preliminary estimates, as yet without benefit of careful mapping or methodical thickness measurements, indicate that about 10 x 106 m3 of lava were extruded 10 February-4 March. Thermocouple measurements in pāhoehoe toes gave lava temperatures of about 1112°-1120°C, slightly cooler than in January. The basalt is sparsely porphyritic with scattered small phenocrysts of olivine and plagioclase.
Seismicity and deformation. "Apparently because the feeder dike system had become fully established in early January and was maintained until eruptive activity resumed in February, the renewed lava emission was not accompanied by increased numbers of shallow earthquakes in either the summit or E rift zone. Harmonic tremor had declined by 30 January to about 10% of its high amplitude in early January; originating from a source beneath February's eruptive vents, the tremor slowly doubled in amplitude 30 January-25 February. From 25 February-4 March, average tremor amplitude was about 30% of the early January level. On 4 March, when lava production terminated, the tremor amplitude dropped abruptly to a low, but constant, level that was continuing as of 10 March.
"By 25 February, the E-W component tiltmeter in Uwekahuna Vault near the summit had recorded approximately 9 µrad of gradual summit re-inflation following the major subsidence of early January. The vigorous eruptive activity 25 February-4 March in the middle E rift zone coincided with an 11 µrad E-W deflation at Uwekahuna. Rapid summit re-inflation averaging about a µrad per day has occurred 4-10 March.
"No significant extension across the E rift has occurred in the vicinity of Kalalua since the major eruption of 7 January. However, a survey line across the eruptive fissure near Puʻu Kahaualeʻa showed extension 29 January-12 February of at least 13 mm/day. By 14 February, new lava had obstructed the line."
Geologic Background. Kilauea overlaps the E flank of the massive Mauna Loa shield volcano in the Island of Hawai`i. Eruptions are prominent in Polynesian legends; written documentation since 1820 records frequent summit and flank lava flow eruptions interspersed with periods of long-term lava lake activity at Halema`uma`u crater in the summit caldera until 1924. The 3 x 5 km caldera was formed in several stages about 1,500 years ago and during the 18th century; eruptions have also originated from the lengthy East and Southwest rift zones, which extend to the ocean in both directions. About 90% of the surface of the basaltic shield volcano is formed of lava flows less than about 1,100 years old; 70% of the surface is younger than 600 years. The long-term eruption from the East Rift Zone between 1983 and 2018 produced lava flows covering more than 100 km2, destroyed hundreds of houses, and added new coastline.
Information Contacts: E. Wolfe, A. Okamura, R. Koyanagi, HVO.
Cite this Report
Explosions build to 6-day Strombolian-Vulcanian event
"The increased Vulcanian activity of Crater 2 in January culminated in a rise of the magma column, with an eruptive phase maximum 11-16 February. The 3-11 February buildup of the eruption consisted of approximately hour-long periods of loud rumbling noises, with deep explosion sounds at 5-30 second intervals. Several times per day at irregular intervals, individual explosions produced black ash-laden columns that rose as much as 3-4 km before being dissipated by the NW winds. Night glow, observed 3 February, became more intense during this period. Low Strombolian fountaining was visible 3-5 and 9 February.
"During the six days of maximum activity, Crater 2 simultaneously displayed continuous Strombolian fountaining to 100 m and intermittent powerful Vulcanian explosions. Most of the Vulcanian explosions were laterally directed, while the continuous moderate vapour emissions and Strombolian fountaining were central and vertical, leading to the conclusion that Crater 2 may contain two more or less independent vents.
"Seismic activity consisted of a sub-continuous background of harmonic tremor and Strombolian B-type earthquakes. Each individual Vulcanian eruption produced large-amplitude low-period explosion events. The most powerful explosions occurred 12-13 and 15 February at the rate of 2-5 per hour.
"During the eruption, Crater 3 (a separate composite cone 300 m W of Crater 2) released only weak white vapours. However, the volume of emission increased to moderate or large during the first 10 days of February, the time of the activity buildup at Crater 2."
Geologic Background. Langila, one of the most active volcanoes of New Britain, consists of a group of four small overlapping composite basaltic-andesitic cones on the lower E flank of the extinct Talawe volcano in the Cape Gloucester area of NW New Britain. A rectangular, 2.5-km-long crater is breached widely to the SE; Langila was constructed NE of the breached crater of Talawe. An extensive lava field reaches the coast on the N and NE sides of Langila. Frequent mild-to-moderate explosive eruptions, sometimes accompanied by lava flows, have been recorded since the 19th century from three active craters at the summit. The youngest and smallest crater (no. 3 crater) was formed in 1960 and has a diameter of 150 m.
Information Contacts: P. de Saint Ours and P. Lowenstein, RVO.
Cite this Report
Tephra emission continues; lava flow
Satellite images and reports from the ground indicated that the activity continued through early March with varying intensity. Imagery from the NOAA 7 polar orbiter showed a small plume over the crater on most days. Although larger than most observed in February, a plume on the 9th appeared to be at low altitude and extended less than 10 km NNE. On 2 March, a plume was visible to 80-100 km E of the volcano. Low-level winds were blowing in the opposite direction, but those at 6-7.5 km were moving toward the E at about 10 km per hour. Dennis Haller noted, however, that weather stations in the area are widely separated and that low-velocity winds are often quite variable in direction. On 8 March, the plume extended less than 50 km NE, again in the wrong direction for the low-altitude winds observed elsewhere in the region.
Tanzania National Park Service officials in Arusha (roughly 120 km SE of the volcano) reported that during activity on 2 February, an eruption column and incandescence could be seen 150 km away. A second eruption occurred 19 February, and as of early March activity was said to be occasional. The active vent was described as "inside the cone." Most eruptions in this century have been from the N crater, which contained a tiny hornito when Maurice Krafft climbed the volcano in 1980. Evidence of flowing lava along the road nearest the volcano was also reported. A passenger aboard a commercial airliner (date of flight unknown) saw lava flowing from the back of the crater and bubbling inside. Peter Swan and Peter Jones reported fine ash around Olduvai (~70 km from the volcano) 14 February. Jones noted that visibility was limited and there was a constant odor of volcanic fume. From Magadi, Kenya (130 km N of Ol Doinyo Lengai), P. R. Ellis saw small plumes rising from the volcano's W side at the beginning of March and noted that there had been several other observations of activity from the Magadi area.
Ol Doinyo Lengai's most recent reported eruption was August-September 1974, when it ejected tephra from the N crater.
Geologic Background. The symmetrical Ol Doinyo Lengai is the only volcano known to have erupted carbonatite tephras and lavas in historical time. The prominent stratovolcano, known to the Maasai as "The Mountain of God," rises abruptly above the broad plain south of Lake Natron in the Gregory Rift Valley. The cone-building stage ended about 15,000 years ago and was followed by periodic ejection of natrocarbonatitic and nephelinite tephra during the Holocene. Historical eruptions have consisted of smaller tephra ejections and emission of numerous natrocarbonatitic lava flows on the floor of the summit crater and occasionally down the upper flanks. The depth and morphology of the northern crater have changed dramatically during the course of historical eruptions, ranging from steep crater walls about 200 m deep in the mid-20th century to shallow platforms mostly filling the crater. Long-term lava effusion in the summit crater beginning in 1983 had by the turn of the century mostly filled the northern crater; by late 1998 lava had begun overflowing the crater rim.
Information Contacts: D. Haller, NOAA/NESDIS; Natl. Park Service, Tanzania; D. Miller, U.S. Embassy, Dar es Salaam; P. Swan, Arusha; P. Jones, Ngorongoro; P. Ellis, Magadi, Kenya; M. Krafft, Cernay; R. Hay, Univ. of California, Berkeley.
Cite this Report
Seismicity remains elevated; but no new swarms
As of early March, an average of 10-30 events per day of magnitude greater than or equal to 1 continued to occur in the epicentral area of the major January earthquake swarm. Few larger events were recorded in February, but five shocks with M>3 occurred 18-19 February and a M 4 earthquake was recorded 24 February in the January epicentral region. Heavy snows have severely limited deformation monitoring, but available data suggest that no major changes have occurred since January.
Geologic Background. The large 17 x 32 km Long Valley caldera east of the central Sierra Nevada Range formed as a result of the voluminous Bishop Tuff eruption about 760,000 years ago. Resurgent doming in the central part of the caldera occurred shortly afterwards, followed by rhyolitic eruptions from the caldera moat and the eruption of rhyodacite from outer ring fracture vents, ending about 50,000 years ago. During early resurgent doming the caldera was filled with a large lake that left strandlines on the caldera walls and the resurgent dome island; the lake eventually drained through the Owens River Gorge. The caldera remains thermally active, with many hot springs and fumaroles, and has had significant deformation, seismicity, and other unrest in recent years. The late-Pleistocene to Holocene Inyo Craters cut the NW topographic rim of the caldera, and along with Mammoth Mountain on the SW topographic rim, are west of the structural caldera and are chemically and tectonically distinct from the Long Valley magmatic system.
Information Contacts: D. Hill, USGS, Menlo Park, CA.
Cite this Report
Rumblings, night glow, increased vapor emissions
"Main crater [experienced increased activity] for a few days in mid February. Ash-laden emissions from Southern crater also increased.
"White vapour was first observed over Main crater 8 February and increased on the 9th. This was accompanied by a change in the seismic pattern, with a progressive decrease in the daily number of B-type events (from 2100) but an increase in amplitude of the shocks.
"Activity stayed at low level until 15-16 February, when low to loud rumbling noises from Main crater were heard at 5-minute intervals. Harmonic tremor, formerly in bands, became continuous. Large amounts of blue vapour were observed with the white plume. On the night of 16 February red glow was seen over Main crater. The activity lasted 4 days and was accompanied by an increase in the daily number of recorded seismic events from 1400 to 1800.
"Beginning 20 February, night glow and blue vapour emissions disappeared, and rumbling noises and plume volume decreased. In the last days of the month seismic activity fluctuated between [1100] and 1300 daily events, but some explosions from Southern crater were again heard and recorded."
Geologic Background. The 10-km-wide island of Manam, lying 13 km off the northern coast of mainland Papua New Guinea, is one of the country's most active volcanoes. Four large radial valleys extend from the unvegetated summit of the conical basaltic-andesitic stratovolcano to its lower flanks. These valleys channel lava flows and pyroclastic avalanches that have sometimes reached the coast. Five small satellitic centers are located near the island's shoreline on the northern, southern, and western sides. Two summit craters are present; both are active, although most observed eruptions have originated from the southern crater, concentrating eruptive products during much of the past century into the SE valley. Frequent eruptions, typically of mild-to-moderate scale, have been recorded since 1616. Occasional larger eruptions have produced pyroclastic flows and lava flows that reached flat-lying coastal areas and entered the sea, sometimes impacting populated areas.
Information Contacts: P. de Saint Ours and P. Lowenstein, RVO.
Cite this Report
Possibly pre-eruptive changes continue
When NZGS personnel returned to Ruapehu 10-11 February, they found the lake turbid. It had been clear on their previous visit, 24 January. Upwelling was slight over the central vent with a trace of dark sulfur, and minor from two or three cells at the N end of the lake.
Thick strands of gray sulfur spheroids and some yellow teardrop shapes floated near the outlet. Fine-grained glass-foam fragments also were present in the floating material. Glass-foam appeared in May 1973; was produced in abundance during the April 1975 eruption; was found during the October-November 1977 eruptive period; and appeared in sulfur slicks on 21 February 1978. No glass-foam was found during the February 1980 or November 1981-January 1982 eruptive periods.
Lake water temperature at the outlet was 19°C, 1° cooler than on 24 January. The water's magnesium concentration had remained stable, but chlorine concentration had risen by 250 ppm, indicating to the NZGS a resumption of fumarolic activity. The Mg/Cl ratio was 0.106.
The horizontal deformation survey showed a 12-mm extension of the 600-m-wide crater as measured between 2 stations on opposite sides of the rim. After a period of rapid inflation, then deflation, the distance across the crater had returned to that of 19 October.
When NZGS personnel flew over Ruapehu 6 days later, the lake was relatively clear and a pale blue-green. Upwelling was absent over the central vent, but moderate at the N end of the lake, where 3 brownish cells were visible. The NZGS attributed the lake's rapid clearing (by sediment settlement) to cessation of heat flow from the main vent.
On 22 February the NZGS found the slightly steaming, calm lake a bright blue-green, with no upwelling over the main vent. Yellow and gray sulfur strands were drifting S from moderate upwelling over at least three locations at the lake's N end. Water temperature measured at the outlet was 23.5°C, up 4.5° from 10 February. The horizontal deformation survey showed shortening of 5 mm across the crater. Only 2 µrad of tilt had occurred since the last measurements on 3 January.
The level of volcanic tremor and B-type earthquakes was moderately high throughout January and [tremor peaked on 2 February]. Activity rapidly declined to a very low level 10-15 February. It remained low until 0845 on 23 February, when a B-type earthquake sequence with events of ML 3.0-3.1 was triggered by a magnitude 2.1 roof rock earthquake. On 24 February, the NZGS noted that "The increased seismicity and the recent changes in the appearance of the lake indicate that Ruapehu has entered a phase where the probability of eruption is now at a relatively high level. Visitors to the crater are being advised not to approach the lake too closely." A similar sequence of B-type earthquakes occurred 26 February at 2356. The series of magnitude 3.0-3.1 events was again triggered by a high-frequency roof rock earthquake, of magnitude 2.0. On 1 March at 0757, a third sequence of B-type events reached M 2.9. Depths for the 1 March events were estimated at 300-600 m beneath Crater Lake, somewhat shallower than usual. Weak volcanic tremor began 2 March at about 0500, at perhaps 300 m below Crater Lake. J. H. Latter noted that this probably represented gas moving toward the surface.
The Chief Ranger, Tongariro National Park, and pilot K. Newton both reported that the lake was gray early 24 February, but there were no signs of ash deposits or upwelling from the main vent. The NZGS interpreted the color change "as being due to a sudden, strong upwelling, possibly in the form of a hydrothermal eruption, following the shallow seismic events at 0845 on 23 February." By the 28th, the lake temperature had risen a further 3.5° in 6 days, to 27°C, and an additional 9 mm of shortening (deflation) was measured across the 600 m-wide crater. Moderate upwelling was noted from the N end of the lake but the water became noticeably clearer during 4 hours of observations. The lake was still milky gray when observed from the air 2 March, but only slight upwelling was occurring and there were no signs of recent eruptions.
Geologic Background. Ruapehu, one of New Zealand's most active volcanoes, is a complex stratovolcano constructed during at least four cone-building episodes dating to about 200,000 years ago. The dominantly andesitic 110 km3 volcanic massif is elongated in a NNE-SSW direction and surrounded by another 100 km3 ring plain of volcaniclastic debris, including the NW-flank Murimoto debris-avalanche deposit. A series of subplinian eruptions took place between about 22,600 and 10,000 years ago, but pyroclastic flows have been infrequent. The broad summit area and flank contain at least six vents active during the Holocene. Frequent mild-to-moderate explosive eruptions have been recorded from the Te Wai a-Moe (Crater Lake) vent, and tephra characteristics suggest that the crater lake may have formed as recently as 3,000 years ago. Lahars resulting from phreatic eruptions at the summit crater lake are a hazard to a ski area on the upper flanks and lower river valleys.
Information Contacts: P. Otway, NZGS, Wairakei; J. Latter, DSIR, Wellington.
Cite this Report
Spine added to February lobe, then extrusion stops; seismicity indicates renewed extrusion by late March
Extrusion of a new lobe onto the E flank of the composite lava dome stopped by 2 March. However, a renewed increase in seismicity was evident by 4 March and an eruption was expected by the end of the month. Poor weather hampered observations throughout February and early March, denying geologists access to the crater and views of the dome on most days.
Because of the weather, it was difficult to determine exactly when the February lava extrusion began. Between 30 January and 4 February, 21 gas and ash explosions were observed on seismic records and by FAA radar at Portland airport. Infrared photographs from an overflight during the night of 4-5 February did not appear to show new lava in the notch in the dome's upper E flank, but at 0930 on the 5th it contained a large smooth-sided creased rock (about 10 x 20 m in lateral dimension and 10 m high), probably the new lobe. An overflight during the night of 5-6 February showed that a substantial amount of new lava had been extruded. University of Washington seismologists note that for most extrusion episodes at Mt. St. Helens, surface events (principally rockfalls) have begun to dominate the seismic record at about the time that lava extrusion started. Surface events began to increase noticeably late 4 February, although most were small and the number of surface events did not exceed the number of subsurface earthquakes until early 6 February. Gas-emission events were also recorded [seismically], some of which were associated with [observations of] minor vapor-and-ash plumes. By the afternoon of 7 February, subsurface earthquake activity had decreased to one to five events per day and remained at that level through the end of the month.
After observing the new lobe on 7 February, geologists were next able to see it on the 11th, when it appeared to have grown in size by about 30%. A well-developed, smooth-sided crease was oriented along the long axis of the lobe's surface. Similar features observed during late stages of extrusions in December 1980, and February, June, and September 1981 were thought to represent the last material extruded from a vent and not disrupted by later flow. Although rockfall seismicity continued, indicating that the lobe was advancing, little growth was apparent between observations 11 and 15 February. Measurements on 23 February showed that the new lobe had advanced 23.5 m to the E since the 11th.
A type of seismicity not previously recorded at Mt. St. Helens was first detected 14 February. Hundreds of tiny events that were remarkably similar to each other (many were identical for as much as 20 cycles) occurred at an average interval of 40 seconds. In the 24 hours beginning at 0830, 559 of these events were recorded, but none was large enough to locate and their origin is uncertain.
Television footage 21 February showed a spine, not present on the 19th, growing from the center of the lobe. On 24 February, the spine was roughly 30 m tall, and by the 28th it had roughly doubled in height, extending about 20 m above the dome's summit. The relatively undisturbed growth of the spine indicated that little downslope movement of the lobe was occurring during this period. On 28 February, geologists noted that no rocks had fallen from the lobe front onto the previous night's snowfall. Observations 1 March indicated that extrusion had ended. The new lobe had filled all but 10-15 m of the 60-100 m-deep notch, oozed out its E end, and reached the E foot of the dome (figure 23). Geologists estimated that it was roughly the same size as previous lobes. Total seismic energy released during the February extrusion episode was comparable to that associated with previous extrusions, but occurred over a longer time span.
 |
Figure 23. Sketch showing the Mt. St. Helens composite lava dome in the crater as viewed from the NNE in late February 1983. The February 1983 lobe is shown with its spine, as are lobes extruded in May and August 1982. Sketch by Bobbie Myers. |
Deformation data were limited, but indicated that little swelling of the dome was associated with the extrusion. Although the W side of the dome has usually been the area of most rapid outward movement, none was measured until 7 February, and only 0.7 cm of expansion occurred between then and 1 March. During the same period, the N side of the dome moved outward 7-8 cm, but deformation there began before the extrusion (SEAN 08:01) and shortening of measured lines totaled about 20-25 cm. Visual observations indicated substantial deformation of the dome's E side, but no instrumental measurements were possible.
SO2 emission peaked on 15 February, reaching 400 t/d, about twice the early February rate (SEAN 08:01). By late February, SO2 emission had dropped to slightly more than 100 t/d and the average for the month was about 170 t/d.
The number of surface seismic events remained steady through early March, but an increase in subsurface earthquakes was evident by 4 March. Six subsurface events were recorded on 1 March and ten on the 3rd; the twelve events on 4 March were larger, so energy release was substantially higher. Energy release continued to accelerate significantly 5-6 March, and 25 subsurface events were recorded on the 6th. Because of the increased seismicity, the USGS and University of Washington issued an advisory notice 6 March stating that renewed eruptive activity could be expected. Poor weather prevented deformation measurements that have previously been successfully used to predict the time of eruption onset.
Seismic energy release declined late 6 March, and only twelve to fifteen events were recorded daily 7-9 March, but both values remained significantly above background levels. An updated advisory notice issued 8 March suggested that an eruption would begin within the next 3 weeks. On 9 March, observers in a helicopter saw that most of the spine had fallen, but did not report the presence of any additional new lava. Measurements on the N and W sides of the dome 10 March did not show large acceleration of displacement rates.
Geologic Background. Prior to 1980, Mount St. Helens was a conical volcano sometimes known as the Fujisan of America. During the 1980 eruption the upper 400 m of the summit was removed by slope failure, leaving a 2 x 3.5 km breached crater now partially filled by a lava dome. There have been nine major eruptive periods beginning about 40-50,000 years ago, and it has been the most active volcano in the Cascade Range during the Holocene. Prior to 2,200 years ago, tephra, lava domes, and pyroclastic flows were erupted, forming the older edifice, but few lava flows extended beyond the base of the volcano. The modern edifice consists of basaltic as well as andesitic and dacitic products from summit and flank vents. Eruptions in the 19th century originated from the Goat Rocks area on the N flank, and were witnessed by early settlers.
Information Contacts: T. Casadevall, C. Newhall, D. Swanson, B. Myers, S. Brantley, USGS CVO, Vancouver, WA; S. Malone, University of Washington.
Special announcements of various kinds and obituaries.
Cite this Report
Deaths of two volcanologists (Robin Cooke and Elias Ravian) at Karkar
We are saddened to report that R.J.S. Cooke, 40, and Elias Ravian, 34, were killed on 8 March 1979 by a directed blast of debris from Karkar volcano. Robin Cooke came to Rabaul Volcanological Observatory in 1971 and was named Senior Volcanologist 2 years later. His contributions to volcanology were many, particularly in seismic monitoring and in generously sharing his reports of local volcanism with scientists of the world. Elias Ravian had been a highly respected worker at the Observatory for 9 years. Both men devoted much of themselves to better understaning of the volcanism that took their lives.
Cite this Report
Deaths of two volcanologists (Gustav Hantke and Tom McGetchin)
We are saddened to report the deaths of volcanologists Gustav Hantke and Tom McGetchin. We will mis them both.
For two decades (1941-1959) Hantke single-handedly compiled summaries of global volcananism into a series of papers, published in Bulletin Volcanologique from 1951 to 1962. In 1966 he published, with A. Parodi, the Catalog of Active Volcanoes of the World for Colombia, Ecuador, and Peru. He died in his native Germany on 16 October at the age of 75.
Tom McGetchin's brief but brilliant career included teaching at MIT, founding the Geosciences group at Los Alamos Scientific Lab, and directing the Lunar & Planetary Science Research Institute. Tom was best known for his irrepressible enthusiasm and his innovative application of other sciences, particularly physics, to volcanological problems. He died in Hawaii after a long illness on 22 October at the age of 43.
Cite this Report
Death of David Johnston at St. Helens
Very few volcanologists throughout history have lost their lives by eruption, but last year Robin Cooke and Elias Ravian were killed at Karkar and now we must report the death of David Johnston at Mt. St. Helens. At the time of the 18 May eruption, Dave was monitoring the volcano from a position just 8 km NNW of the summit. No one knew better than Dave the risk involved in his St. Helens work, and no one contributed more to the understanding of this volcano's eruptive mechanisms. Although only 30 years old, his PhD work on Augustine, and subsequent work with the USGS had already established his position among the leading young volcanologists in the world. His enthusiasm and warmth will be missed at least as much as his scientific strength.
Cite this Report
Deaths of three volcanologists (Maurice and Katia Krafft, Harry Glicken) at Unzen
Volcanology has lost three of its most valuable professionals and our network has lost three of our most faithful contributors. Maurice and Katia Krafft, 45 and 44, were natives of Alsace who blended art and science in unique ways. They were famous not only for their superb photography and books, but for the enthusiasm and humor that made friends for them throughout the world. Always a close team, they were scholarly, selective collectors of volcanological literature and art. They had recently compiled guidebooks to the Comores and Zaire, a history of volcanology, a beautiful book of still photographs, and an informative IAVCEI video on volcanic hazards.
Harry Glicken, 33, was a Californian working as a post-doctoral fellow at Tokyo Metropolitan University. His study of the 1980 debris avalanche at Mt. St. Helens was a landmark. His brief but geographically diverse research career took him to Indonesia, Alaska, the Caribbean, and Japan, where he worked on the 1888 Bandai eruption, and most recently on pyroclastic surge deposits from Oshima volcano. All three of these fine people had much yet to give to volcanology, and we mourn their loss.
Cite this Report
Deaths of six volcanologists (Zapata, Brown, Cuenca, García, Menyailov, and Trujillo) at Galeras
We are saddened to report the deaths of six volcanologists in the 14 January 1993 eruption of Galeras.
José Arlés Zapata (INGEOMINAS, Pasto, Colombia) was a gas geochemist who had helped monitor Ruiz as a student. He was one of the initial employees of the Galeras Observatory at Pasto.
Geoff Brown (Open University, Milton Keynes, U.K.) had wide-ranging interests that included petrologic studies, the use of gravity data to monitor subvolcanic magma movements, and the dynamics of hydrothermal systems.
Fernando Cuenca (INGEOMINAS, Bogotá, Colombia) was a geophysicist who had recently conducted a magnetic survey of Galeras.
Néstor García (Universidad Nacional, Manizales, Colombia), an industrial chemist, helped monitor Ruiz before the 1985 tragedy, and had since worked closely with the staff of the Ruiz Observatory.
Igor Menyailov (Institute of Volcanology, Petropavlovsk, Russia) had worked extensively on volcanic gases in Kamchatka, the Kuril Islands, and Nicaragua for a quarter century.
Carlos Trujillo (CESMAG, Pasto, Colombia) had used the volcano and its observatory as a classroom for his community college students, and was an enthusiastic participant in monitoring efforts.
Menyailov, García, and Brown had all given valuable reports to SEAN/GVN in the past, covering activity in Nicaragua, Colombia, and Costa Rica. The loss of four Colombian scientists was a particularly severe blow to the nation's volcanology program, which has developed rapidly since the 1985 Ruiz eruption. All six were strong scientists with much yet to give to volcanology. Our science was strengthened by their contributions and is weakened by their loss.
Cite this Report
Deaths of two volcanologists (Victor Pérez and Alvaro Sánchez) at Guagua Pichincha
We are saddened to report the deaths of two volcanologists from the Instituto Geofísico, Escuela Politécnica Nacional, Ecuador, during the 12 March 1993 eruption of Guagua Pichincha.
Ing. Victor H. Pérez, age 31, graduated from the Escuela Pécnica Nacional in 1986, and had done his thesis on the volcanic geology of the area between Cotopaxi and Antisana volcanoes. He joined the Instituto in early 1992, and had worked in volcano monitoring, volcano mapping, and neotectonics.
Egdo. Alvaro Sánchez, age 25, was an outstanding geology student and mountaineer who was responsible for the daily processing of seismic data at the Institute.
Cite this Report
Kamchatkan volcanoes activity reports halted by lack of funding
Following notice in early December that seismic stations at Shiveluch and Tolbachik had closed, on 22 December the following message was sent from the Alaska Volcano Observatory (AVO): "KVERT [Kamchatka Volcanic Eruptions Response Team] has informed AVO that, because of a long delay in promised funding from the Ministry of Transportation in Moscow, KVERT must suspend transmittal of information on volcanic activity in Kamchatka. The length of the suspension is unknown at this time. Expressions of concern and support... by interested parties would be appreciated."
An AVO Information Release on 9 January 1995 suggested that "Letters of concern might mention the Kamchatka Volcanic Eruptions Response Team under the leadership of Vladimir Kirianov, its value in monitoring and reporting of volcanic eruptions, the suspension of KVERT activities because of the delay in funding, the need for rapid transfer of funds, etc." Letters should be sent to the Russian Department of Air Transport official handling the KVERT funds [outdated contact information removed].
KVERT began regularly sending reports to AVO for further distribution in April 1993. Since then, KVERT has provided the overwhelming bulk of information for GVN reports about Kamchatkan volcanic activity, the first steady stream of information from this important region. For example, information provided by KVERT has described significant eruptions at Shiveluch (22 April 1993), Bezymianny (21 October 1993), and Kliuchevskoi (1-3 October 1994). Continuous activity at Shiveluch (gas-and-steam plumes, growth of extrusive lava dome) and Kliuchevskoi (minor ash explosions, gas-and-steam plumes, lava fountaining, lava flows) has also been consistently reported. Prompt notification of Kamchatkan eruptions is especially critical because of the large volume of international air traffic in the vicinity.
Information Contacts: Vladimir Yu. Kirianov, Institute of Volcanic Geology & Geochemistry (see Kliuchevskoi); Thomas P. Miller, Alaska Volcano Observatory (AVO), a cooperative program of a) U.S. Geological Survey, 4200 University Drive, Anchorage, AK 99508-4667, USA, b) Geophysical Institute, University of Alaska, PO Box 757320, Fairbanks, AK 99775-7320, USA, and c) Alaska Division of Geological & Geophysical Surveys, 794 University Ave., Suite 200, Fairbanks, AK 99709, USA.
Cite this Report
Aviator's observation form
Tens of commercial jet aircraft, which are not designed to fly through particulate and corrosive gases, have suffered damage from inadvertently encountering ash clouds that had drifted tens to hundreds of kilometers from erupting volcanoes; in one case, a plane descended more than 6 km before the engines could be restarted (Casadevall, 1994). As a result of this vulnerability, there have been new and evolving strategies for alerting aviators as to the presence, location, and movement of eruption plumes. Conversely, pilots often see aspects of volcanism that merit preservation in the Bulletin. In order to solicit and register these observations, a form for pilots relates a series of key questions (plate 1, back page).
 |
Plate 1. A form developed to help pilots record and submit their observations related to volcanism. Courtesy of Ed Miller, ALPA. |
The form, called the "Volcanic Activity Reporting Form," is now included in the US Aeronautical Information Manual (FAA, 1995), a reference used by all large US carriers. A similar form is in use by members of the International Civil Aviation Organization (ICAO).
The form is divided into two parts. The critical upper part (numbers 1-8) gets radioed to air traffic control immediately. Most of the form's lower part provides stated choices on topics such as ash density and color, continuousness of the eruption, as well as the effects on the aircraft and atmosphere (numbers 9-15). The last block (number 16) allows pilots to provide further written information.
The forms are ultimately to be sent (via mail or fax) to GVN for archiving. Expenses for postage or connections by fax can be reimbursed by the GVN.
In addition to the form itself, we wish to receive other aviation observations. These may include eyewitness accounts or photos made by passengers or crew, descriptions of damage, or ash collected by mechanics, as well as relevant weather details from meteorologists. These can (and already do) complement volcanological and atmospheric studies of eruptive activity. Ideally, such multiple perspectives can build a much more comprehensive picture of volcanic processes than can result from any one vantage point.
Every day thousands of people fly across potentially ash-contaminated airspace--to some degree, the people in these planes are just as vulnerable as villages perched on a volcano's flanks. Conventional planes still lack on- board instruments to warn pilots if hazardous atmospheric ash lies ahead. Such plumes are relatively rare, but to consistently avoid them requires interdisciplinary communication and cooperation between both aviators and scientists.
References. Casadevall, T.J. (ed.), 1994, Volcanic ash and aviation safety, Proceeding of the First International Symposium on Volcanic Ash and Aviation Safety (Seattle, Washington, July 1991): U.S. Geological Survey Bulletin 2047, 450 p.
Federal Aviation Administration, 1995, Volcanic Activity Reporting Form: US Aeronautical Information Manual (AIM), 1995 (June), Appendix 2 (1 May 1997), p. A2-1, Superintendent of Documents, US Government Printing Office, Washington, D.C.
Further Reference. Casadevall, T.J., and Thompson, T.B., 1995, Volcanoes and principal aeronautical features, Geophysical Investigation Map GP-1011: U.S. Geological Survey, prepared in cooperation with Jeppesen Sanderson, Inc.
Information Contacts: Captain Ed Miller (Retired), Air Line Pilots Association, 535 Herndon Parkway, P.O. Box 1169, Herndon, VA 20172-1169 USA; Tom Fox, Air Navigation Bureau, International Civil Aviation Organization (ICAO), 999 University St., Montreal H3C 5H7, Canada.
Cite this Report
Seismic network installed for the first time in the Galapagos Islands
During 13 to 29 August 1997 the Geophysical Institute of the Escuela Politecnica Nacional (IG-EPN) in Quito, Ecuador, and the Charles Darwin Foundation installed the first seismographic network ever to be established in the Galápagos Islands, site of the well-documented Gal pagos mantle plume with its active volcanism. The network consists of three telemetered seismic stations located at Pta. Espinosa on the NE end of Fernandina Island (Station FERN; 0°16.0'S, 91°26.7'W, elev. 3 m), on the NE corner of Sierra Negra caldera (Volc n Chico) on Isabela Island (Station VCHI; 0°47.5'S, 91°04.0'W, elev. 1,490 m), and at Bartolome Island, at the E end of Santiago Island (station BART; 0°16.9'S, 90°33.1'W, elev. 100 m). The IRIS project is scheduled to install a wide-band station on Santa Cruz Island in the coming weeks. Once the IRIS device is operative, these four permanent stations will effectively constitute an array in the form of a parallelogram that will cover the western center of the archipelago.
The importance of the new network lies in its ability to monitor the active volcanoes of Fernandina, Volcán Chico, and Sullivan Bay, as well as more distant volcanic centers. In addition the new network will detect tectonic activity generated in this mantle-plume setting or associated with the NNW-SSE and ENE-WSW structural lineaments that apparently control the distribution of volcanoes and that were first recognized by Charles Darwin. The data will also provide better hypocenter locations for seismic events related to subduction of the Nazca and Cocos plates along the South American and Central American coasts.
The instrumentation includes vertical 1-Hz seismometers (Mark Products L-4C) set in massive lavas whose responses have attenuations of 12 to 18 dB. State-of-the-art electronics and radio telemetry as well as solar panels complete the systems. The seismic signals are continuously telemetered to the Charles Darwin Scientific Station located at Academy Bay on Santa Cruz Island. Data acquisition is carried out with the IASPEI software and the events sent via email to IG-EPN for processing.
After only a few days of operation, several low-magnitude A-type earthquakes were detected and tentatively located in the southern part of Isabela Island near Volcán Chico. Several medium-size events, well-located on the South American continent by regional and international seismographic networks, were recorded by the new Gal pagos net. Once the IRIS station is functioning, better identification of locations will be possible. It is hoped that in the future, if funding becomes available, two or three more seismic stations will be installed on other active volcanoes.
This project received financial aid and help from the USAID Mission in Quito, the Charles Darwin Foundation, the Escuela Politecnica Nacional, the Galápagos National Park Service, the Ecuadorian Air Force, the Civil Aviation Authority, Banco del Pacifico, the Ecuadorian Institute Electrification, TAME, ORSTOM, and the Charles Darwin Scientific Station.
Information Contacts: Minard L. Hall, Escuela Politecnica Nacional, Casilla 2759, Quito, Ecuador.
Cite this Report
Death of Werner F. Giggenbach at Rabaul
We are saddened to report that Dr. Werner F. Giggenbach died on 7 November 1997 while conducting field research at Rabaul volcano. He was a Senior Scientist with the Institute of Geological and Nuclear Sciences, Lower Hutt, New Zealand, and was nearing his 60th birthday. Werner was a leading geochemist in the study of volcanic and geothermal systems, and developed many of the techniques used to sample volcanic gases and geothermal fluids in the field and to analyze them in the laboratory. The international standard bottle for collecting volcanic gases is called the Giggenbach bottle. Moreover, he was known and respected for his integrated physical and geochemical models of how volcanic and geothermal systems work. He assisted New Zealand and more than a dozen other countries in developing their geothermal energy potential. During his career Werner contributed reports to the GVN Bulletin concerning White Island, Rumble III, Raoul Island, Ngāuruhoe, Erebus, and Lonquimay. He left the world a legacy of exceptionally innovative and practical contributions to the volcanological and geothermal sciences, and will be deeply missed.
Cite this Report
Death of Oleg Volynets in Petropavlovsk-Kamchatsky
On 24 October, in Petropavlovsk-Kamchatsky, the volcano community lost a distinguished scientist and an exceptionally kind, warm human being. Oleg Volynets worked for over 39 years on the volcanoes of the NW Pacific rim, and died at the peak of an unusually productive career. His colleague Vera Ponomareva wrote that he "combined the qualities of a unique expert in Kamchatka rocks with broad knowledge in modern geochemistry. More important, he was our conscience, a true 'chevalier sans peur et sans reproche.' His death is a deep personal grief for many people." He found time to share his extensive knowledge of Russian volcanoes with us here at the Smithsonian, and we are among those "many people."
Cite this Report
Deaths of two volcanologists (Asep Mukti and Wildan) at Semeru
An explosion at Semeru on 27 July 2000 took the lives of two dedicated Volcanological Survey of Indonesia (VSI) staff members, Wildan and Mukti. Asep Wildan was born in Bandung and a graduate of the physics department at the Institute of Technology Bandung. He worked with VSI since 1993, most recently as a geophysicist in VSI's Eastern Java section where he investigated volcano seismology at Semeru and other volcanoes in East Java and Bali. He is survived by his wife and young daughter.
Mukti was born in the city of Banyuwangi on the eastern tip of Java. A high-school graduate, he served with VSI since 1990 in the capacity of volcano observer and was posted at Semeru. He is survived by his mother. Efforts are underway to work with VSI to provide economic assistance for the families of Wildan and Mukti.
Asep Wildan and Mukti made important contributions to VSI's volcano research and monitoring programs, and both had, in the past, generously provided vital assistance to international researchers working at Semeru. They will be greatly missed by their many Indonesian and international friends and colleagues.
Cite this Report
Death of volcano seismologist Diego Viracucha at Guagua Pichincha
Diego Viracucha, an accomplished 37-year-old mountaineer and for 9 years a volcano seismologist at the Instituto Geofisico, looked into the crater on the morning of 14 January 2001 and reported his impressions via radio. He informed his two assistants that he was going to go ahead alone for several hundred meters W of the seismic station "Pino" in order to take photos. He planned to return in 20 minutes and remain in contact via radio, but later attempts to contact him failed. Apparently he slipped and fell over the caldera rim, a 200- to 300-m-high cliff in that region; his body was found hours later. Given the length of the fall and the impact, he probably died immediately from head wounds and internal injuries.
Recovery of the body was accomplished using mountaineering techniques rather than a helicopter due to fog. The day-long effort involved many, including six IG volcanologists, the Civil Defense, the Guards of the Refuge, the Red Cross, an elite police group, mountaineer groups, and family members. The site of the accident was 2.5 hours from GGP Refuge and it took all day to recover the body. A second accident occurred during this effort when Galo Viracucha, a cousin of Diego, fell and rolled 150 m downslope and later died from his injuries.
Diego had studied the seismic patterns of Cotopaxi, Guagua Pichincha, Cayambe and Tungurahua. He was an accomplished mountaineer and had scaled almost all of the important peaks of Ecuador's volcanoes. One of his greatest passions since September 1999 was keeping a close visual-photographic record of the changes in the domes of Guagua Pichincha. His excellent companionship, his unflagging enthusiasm, his well-stilled knowledge of the seismicity of the active volcanoes--leaves a tremendous void in the Instituto's monitoring efforts.
Cite this Report
Global high-temperature thermal monitoring system (MODIS Thermal Alerts)
The MODIS Thermal Alerts website (http://modis.higp.hawaii.edu/) is the first truly global high-temperature thermal monitoring system for volcanic activity. This system is capable of detecting and documenting changes in active lava flows, lava domes, lava lakes, strongly incandescent vents, and hot pyroclastic flows. No alert is likely to be triggered by an ash cloud. MODIS cannot see through weather clouds and is also liable to miss events of less than several hours duration. Nevertheless, MODIS is capable of adding significant information to the record of global volcanic activity.
As described by Flynn and others (2001), Wright and others (2002), and Rothery and others (2003), the MODIS Thermal Alerts website provides a series of maps updated every 24 hours to show 'thermal alerts' based on night-time (approximately 2230 local time) infrared data from the Moderate Resolution Imaging Spectroradiometer (MODIS) instrument that is carried by NASA's Terra and Aqua satellites. Thermal alerts are based on an 'alert ratio' (3.9 µm radiance - 12 µm radiance) / (3.9 µm radiance + 12 µm radiance) and an alert is triggered whenever this ratio has a value more positive than -0.8. This threshold value was chosen empirically by inspection of images containing known volcanic sites at high temperature, and is the most negative value that avoids numerous false alarms. There are also some day-time alerts (at approximately 1030 local time) based on the same algorithm. These incorporate a correction for estimated solar reflection and a more stringent threshold, whereby the alert ratio must be more positive than -0.6 to trigger an alert.
In order to bring this valuable tool to the attention of a wider community, Dave Rothery and Diego Coppola have provided an analysis of volcanic activity detected by MODIS in Melanesia from January 2001 to December 2002, which they relate as fully as possible to conventional observations in the Bulletin of the Global Volcanism Network. In the cases of Manam, Rabaul, Ulawun, and Pago there is a high degree of correspondence between MODIS alerts and independently derived observations. In the cases of Bagana, Tinakula, and Ambrym the MODIS alerts represent the only hitherto reported evidence of activity during 2001-2002. Lopevi and Yasur are intermediate cases, where MODIS adds significantly to what has previously been reported. All the 'new' activity is not necessarily unknown to local volcanologists (though this may be so in some cases), and in fact additional information from local sources would help to refine the MODIS interpretation. However, the MODIS Thermal Alerts provide a useful source of near real-time information that is openly available for the benefit of the global volcanism community.
Graphs of the 'alert ratio' and number of alerted pixels indicate the magnitude of every anomaly detected during the period. In some cases these are accompanied by maps indicating the center coordinates of the alerted pixels. The original pixels are 1 x 1 km squares, which means that the true site of a spatially small anomaly that has triggered an alert can be anywhere within a 1-km box surrounding the center point. The geolocational accuracy of MODIS pixel coordinates is generally reckoned to be better than 1 km, but may become worse for high volcanoes, especially when seen close to the edge of an imaging swath (when the satellite can be more than 45 degrees away from the zenith). Furthermore, for some of the more remote volcanoes MODIS scientists believe there may remain significant map-location errors.
References. Flynn, L.P., Wright R., Garbeil, H., Harris, A.J.L., and Pilger, E., 2001, A global thermal alert system using MODIS: initial results from 2000-2001: Advances in Environmental Monitoring and Modelling, no. 3, Monitoring volcanic hotspots using thermal remote sensing, edited by Harris, A.J.L., Wooster, M.J., and Rothery, D. A. (http://www.kcl.ac.uk/kis/schools/hums/geog/advemm/vol1no3.html).
Wright, R., Flynn, L., Garbeil, H., Harris, A., and Pilger, E., 2002, Automated volcanic eruption detection using MODIS: Remote Sensing of Environment, v. 82, p. 135-155.
Rothery, D.A., Thorne, M.T., and Flynn, L., 2003, MODIS thermal alerts in Britain and the North Sea during the first half of 2001: International Journal of Remote Sensing, v. 24, p. 817-826.
Cite this Report
Deaths of four PHIVOLCS staff (Daligdig, Tungol, Javier, Abengoza) and former director Ray Punongbayan in a helicopter crash in the Philippines
Our friends at the Philippine Institute of Volcanology and Seismology (PHIVOLCS), and indeed all in volcanology, have suffered a grievous loss in the 28 April 2005 helicopter crash that took the lives of four Air Force crew members, four PHIVOLCS scientists, and its former director Ray Punongbayan. They were inspecting landslide-prone areas about 110 km ENE of Pinatubo, looking for areas to resettle communities affected by the 2004 typhoons.
PHIVOLCS staff were Jessie Daligdig, Norman Tungol, Dindo Javier, and Orlando Abengoza, all in their 40s. Ray Punongbayan, 67, joined PHIVOLCS at its start in 1982, and served as its director from 1983 through 2002. This was a time of great growth for PHIVOLCS, and Ray placed major emphasis on hazard mitigation—through maps, education, monitoring, a quick response team, and linkages with volcanologists around the world. Their success at Pinatubo set a standard for all of us, and this loss saddens the full international community.
Cite this Report
Death of Jim Luhr, Director of the Global Volcanism Program
Jim Luhr, director of our volcano program since 1995, passed away unexpectedly in his sleep on 1 January 2007. He was 53 years of age, and died of complications from influenza. He leaves behind his wife Karen Prestegaard, a professor at the University of Maryland, and their two school-aged daughters.
One of Jim's legacies is the greatly expanded public access to Smithsonian volcano data resulting from his promotion of the growth of our widely used website. In the mid-1990s, he helped create a new exhibit hall exposing millions of visitors each year to displays with significant emphasis on geophysics, plate tectonics, and volcanology (giving visitors electronic access to geologic and geophysical information).
Jim acted as chief editor of the graphically stunning book Earth. He also co-edited the book "Paricutín: The Volcano Born in a Mexican Cornfield," an outgrowth of his many detailed field and laboratory studies of Mexican volcanoes. Jim was well known for his work on the petrology of young volcanic rocks and the atmospheric impact of eruptions.
[Notice from BGVN 31:11] With deep regret we announce that Jim Luhr passed away unexpectedly and peacefully in his sleep on 1 January 2007 at the age of 53. He directed the Smithsonian's Global Volcanism Program during 1995 through 2006, and in that role helped elevate both this Bulletin and its younger sister publication, the Smithsonian / USGS Weekly Volcanic Activity Report. Jim was well-known for well-crafted, multifaceted analytical studies of his beloved Mexican volcanoes.
Cite this Report
Death of Tom Simkin, founder and Director of the Global Volcanism Program until 1995
Tom Simkin, who founded and for 28 years served as director of the Global Volcanism Program, died on 10 June at the age of 75 from complications after surgery for esophageal cancer, an ailment diagnosed ~6 months earlier. Tom saw our reporting on Earth's volcanism evolve from brief reports transmitted by postcard to its current formats in print and in various forms on the web. He began by incorporating previous databases, and enlisting volcano watchers to share their observations with the Smithsonian. This led to the most comprehensive database available on global volcanism during the past 10,000 years (the Holocene). This allowed Tom to write authoritative, pioneering papers describing the pace and character of active global volcanism. He authored two editions of the sought-after reference book, Volcanoes of the World, and had been collaborating in retirement on the third edition, an effort that will continue in his absence.
He received a bachelors degree from Swarthmore College and a Ph.D. from Princeton University and was known for his field studies on both North Skye in the U.K. and Fernandina and other Galápagos Islands volcanoes. He edited books commemorating the Krakatau 1883 eruption and the Parícutin 1943-52 eruption. He led efforts to create the popular wall map This Dynamic Planet, which plots earthquakes, volcanoes, meteorite impacts, and tectonic plate parameters; the map's latest (2006) edition features a companion website enabling users to prepare customized images. In recognition of his contributions to volcanology, Tom received the Krafft Medal (IAVCEI) in 2004 and was recently awarded the Jefferson Medal from the Virginia Museum of Natural History for 2010.
Cite this Report
Death of volcanologist Herman Patia Principal Volcanologist at the Rabaul Volcano Observatory
One of the first homegrown volcanologists in Papua New Guinea (PNG), Herman Patia (figure 1), grew up the youngest of nine children in Gunanba, a village at the Eastern end of New Britain Island and S of Rabaul caldera. He died on 18 June 2012, two days short of his 50th birthday, in Rabaul Town after a month of unstated illness (Itikarai, 2012, which this obituary summarizes). Patia completed all his early schooling through his BS degree in PNG. He completed an MS degree at the Australian National University with a thesis on Rabaul’s petrology and geochemistry (Patia, 2004). He continued to write papers, including co-authorship on the workshop report cited below (Johnson and others, 2010).
 |
Figure 1. Herman Patia standing before a poster on Papua New Guinea volcanism. Courtesy of Keith-Reid (2007). |
Patia began work at Rabaul Volcano Observatory (RVO) in 1986 and rose to the position of Principal Volcanologist. RVO monitors the country’s 57 known Holocene volcanoes, some of which are quite active and close to settlements. Like many scientists working at volcano observatories, Patia’s contributions were multifaceted, spanning from research and publishing to volcano monitoring, and from mapping and hazards assessment to raising community awareness. PNG volcanoes draw international interest, and visitors recall benefitting from Herman’s advice and assistance. He was widely known as someone with both technical competence as well as an amiable, good-natured disposition.
More than once, duty dictated an immediate response to a sudden crisis, putting Patia in situations that could entail considerable risk. For example, in responding to a crisis at Langila in the early 1990’s, he and his then RVO colleague Patrice de Saint Ours survived a close call while monitoring behavior at the summit. A sudden explosion discharged incandescent lava fragments at close range. They escaped by running down the volcano’s ash- and scoria-covered flank, hot lava fragments burning holes in Patia’s backpack.
References. Itikarai, I., 2012, Patia parts with his volcanoes, Papua New Guinea Weekend Online Courier, June 2012.
Johnson, R.W., Itikarai, I., Patia, H., and McKee, C., 2010, Rabaul Volcano Workshop Report; Volcanic systems of the Northeastern Gazelle Peninsula, Papua New Guinea: synopsis, evaluation, and a model for Rabaul volcano, Rabaul Observatory Twinning Program, Dept. Of Mineral Policy and Geohazards Management (DMPGM), Government. of Papua New Guinea and Australian Agency for International Development (AusAID), Australian Government, 84 p., ISBN 978-1-921672-89-7.
Keith-Reid, R., 2007, Profile: Detecting Volcanoes-Meet volcanologist Herman Patia, Islands Business International.
Patia, H., 2004, Petrology and geochemistry of the recent eruption history at Rabaul Caldera, Papua New Guinea: implications for magmatic processes and recurring volcanic activity. Unpubl. Masters of Philosophy thesis, Australian National University, Canberra, 111 pp. (Available at https://digitalcollections.anu.edu.au/handle/1885/7345).
The enormous aerosol cloud from the March-April 1982 eruption of Mexico's El Chichón persisted for years in the stratosphere, and led to the Atmospheric Effects section becoming a regular feature of the Bulletin. Descriptions of the initial dispersal of major eruption clouds remain with the individual eruption reports, but observations of long-term stratospheric aerosol loading will be found in this section.
Cite this Report
Atmospheric effects of probable volcanic origin
In the Tucson, Arizona area (32.25°N, 110.95°W), Marjorie and Aden Meinel report strongly enhanced sunset glows beginning 24 August. That evening, silvery, undulate striae, similar to phenomena associated with the 1974 Fuego eruption, were seen at sunset against a glowing background. As the sun set, striae and background passed simultaneously through the same sequence of colors, indicating that they were at the same altitude, calculated by the Meinels to be about 19 km. The striae were not visible the following evening, but the strong background glow recurred and a secondary glow was visible until about 70 minutes after sunset, as after the eruptions of Krakatau in 1883 and Agung in 1963. The glow became fainter on succeeding evenings, but a strong enhancement occurred 16 September and the glow was still nearly as bright several days later. The Meinels believe that the August phenomena were probably caused by material injected into the upper atmosphere by the 17 August eruption of Hekla, while the September enhancement could have been due either to a return of the Hekla material or normal seasonal trends in glow intensity.
In England, H.H. Lamb observed a week or more of reddened sunsets, culminating in a colored ring around the sun seen from Ketteringham, Norfolk before sunset on 12 June. The same evening lidar observations confirmed the presence of a dust veil over Garmisch-Partenkirchen, West Germany (47.5°N, 11.0°W). Lamb saw no apparent abnormal coloring the following week, nor was any observed during the few breaks in bad weather from late June through mid-July. On 14 July, unusual light diffusion in brownish layers above cumulonimbus clouds was followed by a shower that deposited russet-colored mud. Meteorological data suggest transit from the Arctic. By early September, clear skies showed a brownish coloration at sunset and more than usually diffused light around the sun, interpreted by Lamb to indicate a rather thin dust veil.
Information Contacts: Marjorie Meinel and Aden Meinel; H. Lamb, Univ. of East Anglia, England.
Cite this Report
Volcanic material in stratosphere over Virginia, Wyoming, and Colorado; source uncertain
A thick zone of probable volcanic material was observed in the upper troposphere and lower stratosphere during the night of 8-9 June. NASA's lidar at Hampton, Virginia (37.1°N, 76.3°W), operating at the ruby wavelength of 0.6943 µm, recorded several layers with scattering ratios greater than the normal background reading of 1.1 (scattering ratio = 1 + aerosol scatter/molecular scatter). Thin layers were centered at altitudes of 17.4 km (about 1 km thick, scattering ratio 1.5) and 16.5 km (about 1/2 km thick, scattering ratio 1.3). A much broader layer extended downward from 16 km through the tropopause at 13.3 km to 12 km altitude. Within this broad layer, clearly-defined scattering peaks were located at 14.9 km and 14.1 km, both with scattering ratios of 2. Residual material from St. Helens remains in the stratosphere, raising the background scattering ratio to 1.2.
Weather balloons launched from Laramie, Wyoming (41.33°N, 105.63°W) began to detect volcanic material 16 May. Since then, a thick zone showing some variation in structure has remained between 12 and 18 km altitude. During the night of 8-9 June, an intense new volcanic layer between 11 and 14 km altitude joined the post-26 May material over Laramie and nearby Boulder, Colorado. The previous material, concentrated between 16 and 18 km, was truncated by a reversal in wind direction at 18 km altitude.
The two most likely source volcanoes are Alaid and Pagan, which both injected eruption columns into the stratosphere, at the end of April and on 15 May respectively. No other major explosive eruptions have been reported since then.
Information Contacts: P. McCormick, NASA Langley Research Center, VA; D. Hofmann and J. Rosen, Univ. of Wyoming.
Cite this Report
Volcanic material below the tropopause over NW North America in mid-July; source unknown
High-altitude aerial sampling 9, 10, and 13 July revealed at extensive zone of sulfate aerosols and silicate fragments just below the tropopause at high northern latitudes.
On 9 July, instruments aboard a Los Alamos Scientific Laboratories (LASL) B-57 research aircraft, flying at an altitude of about 13.5 km from Seattle, Washington (47.5°N, 122.5°W) about 2,300 km to Anchorage, Alaska (62°N, 149°W), sampled a very constant sulfate concentration of 0.7-0.8 mg/m3, well above the normal mid-latitude background of about 0.1 mg/m3. The next day, flying directly N from Anchorage at a constant 12 km altitude from 62°N to 75°N (a distance of more than 1,500 km) along the 145° meridian, sampling instruments measured sulfate concentrations of about 1.5 mg/m3. A few silicate particles, larger than 1 mm and probably coated with acid, were also recovered. At 75°N, the aircraft climbed through the tropopause, just above the 12 km altitude of the northbound flight path, to about 16.5 km, then flew S at that altitude back to 62°N. The zone of high sulfate and silicate concentration terminated sharply at the tropopause and no unusual concentrations were recorded in the stratosphere during the return flight.
A U-2 aircraft operating from the NASA Ames Research Center near San Francisco (37.33°N, 121.92°W) flew at gradually increasing altitude to about 50°N, 155°W on 13 July. As the aircraft climbed toward the tropopause, marked by the polar jet stream, concentrations of sulfate increased gradually from about 2 mg/m3 to about 4.5 mg/m3. Some silicate particles were also collected. Sulfate concentrations of 2 mg/m3 or higher were measured for about 2 hours of flight time, representing a lateral distance of about 1,800 km. As in the 9-10 July flights, the zone of high sulfate and silicate concentration was truncated abruptly at the tropopause. While descending on the return leg of the flight, a sulfate concentration of 5 mg/m3 was recorded at the top of the polar jet stream.
While the sulfates and silicates sampled from the aircraft were almost certainly of volcanic origin, it is not yet possible to pinpoint their source, nor their time of eruption [but see 6:10]. Airmass movement in the days prior to 9 July will be analyzed to help locate a probable source area and the presence or absence of significant variation in silicate chemistry should help determine whether all are from a single eruption or whether multiple sources are likely.
Information Contacts: R. Chuan, Brunswick Corp., CA; W. Rose, Jr., Michigan Tech. Univ.
Cite this Report
Aircraft and satellite data on stratospheric ejecta from four eruptions
Filter samples from LASL high-altitude aircraft and data from NASA's SAGE satellite provided information about the height and dispersal of the eruption cloud ejected by Ulawun in October 1980, and the LASL aircraft also collected tephra probably produced by the May 1981 eruption of Pagan.
Ulawun's brief but powerful eruption took place 6-7 October 1980, producing a cloud estimated by ground observers to have reached 7-10 km in height. On 24 October, the aircraft sampled the lower stratosphere at about 19 km altitude, between the equator and 5°N at about 80°W (just S of Panama). Data from these samples indicated atmospheric concentrations of as much as 6 parts per billion (ppb) of sulfate by mass, of which only 25-50% could be attributed to the 18 May eruption of St. Helens. The SAGE satellite detected tephra from St. Helens N of 40°N in October 1980, but also detected a large cloud of new material from 26°N to 10°S (data collection was truncated at 10°S) between 125°W and the International Date Line. SAGE next collected data from the equatorial region in mid-November, when a zone of significant particle enhancement (roughly 5 times background), extending upward from the tropopause (about 16.5 km altitude at the equator) to about 22 km, circled the globe in an irregular band 10-20° wide between 20°S and 10°N.
Pagan's eruption began 15 May. Japanese weather radar recorded the top of the eruption column at 18-20 km altitude and weather satellite images showed that the high-altitude cloud traveled SSE. Ten weeks later, filter samples collected by the LASL aircraft just S of Panama (from the equator to 5°N) on 24 July showed lower stratospheric sulfate concentrations of about 5 ppb by mass at altitudes of 18.2, 19, and 19.2 km. Between 5°N and 35°N at 16.8 km altitude (above the tropopause), sulfate concentrations were as high as 4 ppb by mass; only about 1 ppb could be attributed to material remaining from the St. Helens eruption 14 months earlier. High concentrations of sulfate aerosols and silicate particles collected at mid to high northern latitudes in early July are probably from the late April-early May eruption of Alaid. From these data, the average lower stratospheric sulfate concentration over the entire Northern Hemisphere in July 1981 was calculated to be about 2.5 ppb by mass, primarily contributed by the eruptions of Pagan and Alaid but including a little material from the St. Helens eruption. The same calculations made from July 1980 data yielded a slightly lower concentration, about 2.3 ppb by mass, with St. Helens as the dominant source. In the last decade, only two relatively brief periods can be identified as showing "background" sulfate concentrations, without a substantial volcanic component: mid-1973 through mid-1974 (about 0.34 ppb sulfate by mass), and late 1978 through late 1979 (about 0.47 ppb sulfate by mass).
Information Contacts: W. Sedlacek, LASL; P. McCormick, NASA.
Cite this Report
Stratospheric aerosols from unknown source
A sudden increase in stratospheric aerosols was recorded on 23 January at 1200 GMT by the Nd-YAG lidar, wavelength 1.06 µm, operated by Kyushu University, Fukuoka, Japan (33.65°N, 130.35°E). The scattering ratio at 17 km altitude (about 4) was about 20 times the normal average value. The same equipment detected a strong aerosol layer at 11-17 km on 30 January and a very strong layer at 10-17 km on 2 February. Peak concentrations were about the same as those recorded 1 month after the 18 May 1980 eruption of St. Helens. NOAA's lidar unit on Mauna Loa, Hawaii (19.5°N, 155.6°W) detected a several-kilometer-thick layer centered at 17 km on 28 January, and its next reading, on 4 February, showed 2-3 different layers between 17 and 20 km altitude. No unusual atmospheric debris had been detected during the previous measurement by this instrument on 19 January. Lidar data gathered during clear weather the last week in January from Wallops Island, Virginia (37.9°N, 75.5°W) revealed no notable stratospheric material. However, ground-based ruby lidar at Garmisch-Partenkirchen, West Germany measured strong aerosol layers at 13-16 km on 2 February and 15-17 km the next night.
Motokazu Hirono interpreted the fine structures of the Kyushu University lidar profiles to indicate a volcanic source. However, SEAN has no recent report of a large explosive eruption and the source of the stratospheric aerosols is not yet known.
Reference. Hirono, M., Fujiwara, M., Shibata, T., and Kugimiya, N., 1981, Lidar Observations of Volcanic Clouds in the Stratospheric over Fukuoka caused by Eruptions of St. Helens in May 1980; Geophysical Research Letters, v. 8, no. 9, p. 1019-1022.
Information Contacts: M. Hirono, Kyushu Univ., Japan; B. Mendonça, NOAA/Air Resources Lab, CO; P. McCormick, NASA, VA; R. Reiter, Garmisch-Partenkirchen, W. Germany.
Cite this Report
Voluminous volcanic aerosol cloud; source uncertain
A widely-distributed and voluminous cloud of aerosols remained in the upper troposphere in early March. Aircraft observations indicated that aerosols had been disseminated over broad areas of middle and lower northern latitudes by mid-February. Although the cloud was clearly of volcanic origin, no eruption has been unequivocally identified as its source.
Solar irradiance measurements. On 11 January a pyrheliometer (which measures direct solar irradiance over a broad spectrum at the earth's surface) at Mauna Loa Observatory, Hawaii detected a substantial decrease in solar radiation, nearly as large as that measured after the major eruption of Agung in 1963. A small decrease measured by this instrument during its preceding reading 4 January was within the noise level. Lidar data collected at Mauna Loa indicated that material in the upper troposphere, between 10 and 13 km altitude, was responsible for the initial decrease. Solar irradiance has remained low at Mauna Loa, as it did for about 3 years after the Agung eruption. A pyrheliometer at Aspendale Observatory, Australia (about 38°S, 145°E) had shown no major increase in atmospheric turbidity as of early March. No other atmospheric data are presently available from the Southern Hemisphere.
Lidar and balloon measurements. Stratospheric aerosols were first detected by lidar on 23 January at Kyushu University, Fukuoka, Japan as a thin layer centered at about 17 km altitude. Scattering ratios were at background levels during their next observation 26 January but each measurement since then, beginning 30 January, has recorded backscatter from the cloud, with peak concentrations on 2 February. Their most recent data, on 3 March, indicated the presence of an aerosol layer between 9 and 17 km altitude.
No stratospheric layer was evident on the Mauna Loa lidar until 28 January (9 days after the preceding measurement). It continued to detect stratospheric material through late February and on the 26th the aerosol layer was about 3 km thick, centered at 18 km altitude. Lidar data collected during poor conditions 5 March showed an apparently weak layer centered at 17.3 km. No aerosol layer was detected during a balloon flight from Laramie, Wyoming 5 February, but instruments aboard balloons launched 17 and 27 February measured aerosol concentrations between 13.5 and 18 km altitude that were similar to those observed following the 18 May, 1980 eruption of St. Helens. William Fuller reports that lidar data obtained 26 January from Hampton, Virginia indicated that the stratosphere at this latitude was reasonably clear, with peak backscattering ratios at about background levels. Measurements made with the NASA Langley Research Center airborne lidar 10 February from the ground at Wallops Island, Virginia showed a considerable increase in stratospheric material. The base of the layer was at 12 km and it extended to 18 km with a peak backscattering ratio 4-5 times greater than normal. Stratospheric lidar measurements will continue on a regular basis from Hampton with a ground-based 48-inch lidar and possibly with the airborne lidar. During the night of 8-9 March, the ground-based lidar at Hampton detected the aerosol layer between 12.9 and 16.5 km.
Airborne lidar measurements - Virginia to Costa Rica. By mid-February, stratospheric aerosols were distributed over a broad area of the Northern Hemisphere, as described in the following report from William Fuller.
"A flight was conducted 13 February from Wallops Island to San José, Costa Rica (9.9°N, 84.1°W) with the lidar on board the NASA Wallops Electra aircraft. Lidar measurements indicated that the very intense stratospheric layer was present along the entire flight path. As the aircraft proceeded S, the layer became very intense until the maximum scattering ratio occurred at 21°N, 87.1°W, just E of the Yucat n Peninsula. The stratospheric layer remained strong to 10°N, 82-83°W where the southernmost measurement was made. On the return flight 21 February, lidar measurements were made from New Orleans (30.0°N, 90.05°W) to Wallops Island and the stratospheric layer continued to be present."
Aerial sampling. On 6 March at about 1900 GMT, impact samples of the aerosol cloud were collected at about 20°N, 96.2°W (SW Gulf of Mexico) on a grid carried by a NASA U-2 aircraft. The samples were similar to those collected from the St. Helens aerosol cloud 1-2 weeks after the 18 May, 1980 eruption. More than 70 particles/cm3 greater than 0.6 µm in diameter, all liquid droplets, were recovered at 16.75 km altitude. Preliminary analysis by the Atmospheric Experiments Branch of the NASA Ames Research Center showed that substantial quantities of H2SO4 were present in the cloud, indicating that its source was volcanic. Virtually no mineral grains were recovered. Hand-held geiger counters in the aircraft recorded radioactivity at only one-half of normal background. Additional analyses of the 6 March samples are planned, as are a series of additional flights.
Unusual sunsets - Arizona. Aden and Marjorie Meinel saw sunset glows from Tucson, Arizona beginning 23 January, when late twilight coloration indicated possible enhancement in the region between 18 and 20 km altitude. Glow was stronger the next night and on 15 January glowset was 43 minutes after sunset. The glow was weaker 26 and 27 January, and after cloudy weather 28-29 January, no enhancement was visible 30 January. The Meinels observed a faint glow 19 February, similar to that of 24 January, but after two nights of cloudiness saw none 22 February. Glow was next visible from Tucson 2 March and was present for the next 2 nights.
Information Contacts: W. Fuller, P. McCormick, and M. Fujiwara, NASA, VA; B. Ragent, G. Ferry, V. Overbeck, K. Snetsinger, and D. Hayes, NASA Ames Research Center, CA; K. Coulson, Mauna Loa Observatory (MLO), HI; B. Mendonça, NOAA, CO; A. and M. Meinel, Univ. of Arizona; J. Rosen, Univ. of Wyoming; M. Hirono, Kyushu Univ., Japan; J. Gras, CSIRO, Australia.
Cite this Report
Volcanic cloud remains in stratosphere; source still uncertain
The widely-distributed volcanic aerosol cloud remained in the lower stratosphere through early April. Since 29 January, each lidar measurement at MLO has detected the cloud. As of 9 April, it was centered at about 18 km altitude (with a peak backscattering ratio of 1.6) and was about 2 km thick. A balloon flight the first week in April from Laramie, Wyoming showed a broad layer centered at 18 km altitude. From Hampton, Virginia, lidar data 8 April showed a 3-km-thick layer centered at about 17 km altitude (backscattering ratio about 1.6). The cloud has also been intermittently present over Toronto, Canada (43.6°N, 70.5°W) since early March.
A NASA sampling aircraft flew S from San Francisco 18 March, and collected about 20 times the normal concentration of H2SO4 from a layer at the base of the stratosphere. Silicate particles about 0.25 µm in diameter were present both as discrete fragments and within the acid droplets. Chemical analysis of these particles showed that they contained no Na, and their Si/Al ratio was consistent with a basaltic composition. Additional sampling flights are planned in mid-April by NASA and LASL.
No eruption can be unequivocally identified as the source for the cloud. Careful inspection of satellite images has yielded no large eruption clouds that had gone unreported from the ground, but cloudy weather often obscured volcanically active areas of the world. The best candidate appears to be Pagan (18.13°N, 145.80°E), where moderate explosive activity was reported in early January. However, no ground observations are available between 6 January and 8 February, and the source eruption for the cloud probably occurred in mid-January. Careful inspection of images from the Japanese geostationary weather satellite by Yosihiro Sawada showed a possible volcanic cloud from Pagan 14 January at 1900 local time (0900 GMT), but interference from weather clouds made this impossible to confirm. Sawada observed a similar feature on an image returned at 2200 local time 19 January 1981, the same day that visiting islanders reported explosive activity.
[Unpublished data from NASA's Total Ozone Mapping Spectrometer (TOMS), which is sensitive to the SO2 that is emitted by most eruptions, strongly suggest that this cloud was ejected by Nyamuragira (Zaire) during the initial explosive phase of its December 1981-January 1982 eruption.]
Information Contacts: R. Chuan, Brunswick Corp.; Y. Sawada, Meteorological Research Inst., Japan; N. Banks, USGS-HVO, HI; K. Coulson, MLO; W. Fuller, NASA, VA; D. Hofmann, Univ. of Wyoming; B. Ragent, NASA, CA; W. Evans, ARPX-AES, Downsview, Canada.
Cite this Report
Lidar from Hawaii, Japan, and southeastern US; unusual sunrises and sunsets
The initial dispersal of the major stratospheric cloud from the March-April, 1982 eruption of El Chichón is described in the El Chichón [volcano reports]. Its persistent atmospheric effects are reported below.
Lidar data collected in June at Mauna Loa, Hawaii showed backscattering that typically increased from near the base of the stratosphere to a peak at 26-27 km altitude, with significantly enhanced values to 33-34 km. Data were less variable from night to night and layering within the cloud was less distinct than in May. The cloud above Hawaii has apparently affected incoming solar radiation, measured for about 50 years by the Hawaiian Sugar Planters Association. Although mean daily solar radiation would normally have been about 110% of the long-term average (because precipitation in May at the primary station was only 27% of normal), the measured value for the month was only 92% of average.
Lidar at Fukuoka, Japan showed decreased backscattering from the 21-29 km layer in late June, but backscattering increased again in early July. The less dense layer at 18.5 km remained stable through this period. In early July, backscattering detected by lidar at Hampton, Virginia increased sharply for the (highest) layer centered at about 25 km altitude, approaching those values measured at lower latitudes for the first time.
To assess latitudinal variation in the stratospheric cloud, a lidar-equipped NASA aircraft flew from Wallops Island, Virginia to Puerto Rico during the night of 8-9 July, to about 12°N (near the coast of Venezuela) 10 July, and from Puerto Rico to the vicinity of Albany, New York (about 42°N) 11 July. From 25-30°N to the southern limit of the flight, preliminary data show greatly enhanced backscattering from a dense layer between 21 and 33 km altitude. Some material was present below 21 km, but it was much less dense. Strong local variation in the cloud was observed. Although the cloud diminished in density N of 25-30°N, significantly enhanced stratospheric backscattering was detected to the N limit of the flight.
Brilliant sunrises and sunsets - Saudi Arabia. Weather satellite images first showed the front of the 4 April stratospheric cloud (visible over water during the day) over the Red Sea 21 April. Edward Brooks, who has made frequent sunrise and sunset observations from Jeddah, Saudi Arabia (21.5°N, 39.16°E) saw WNW-ESE-trending bands of haze in the WNW sky after sunset 20 April and similar bands before dawn the next morning. The twilight of 24 April was a brilliant pink from bands and patches of WSW-ENE-trending aerosol. During the next several weeks, volcanic cloud effects could be seen in the sky around sunrise and sunset most days, often as bands of material oriented within 45° of E-W. Brooks observed a layer 10° above the horizon at twilight 18 May and calculated its altitude at roughly 20-25 km. Multiple layers began to be visible in June. At sunrise on 5 June, criss-cross bands of aerosol trended SW-NE and SSE-NNW. Brilliant sunrises and sunsets were common in mid-June. Beginning on 19 June, many sunrises illuminated two distinct layers, at about 30-minute intervals. This effect weakened later in the month and by 30 June the higher layer (illuminated earlier in the morning) had disappeared. Brooks and others also noted that on 6 July roughly the upper half of the eclipsed moon was considerably darker than the lower half, which Brooks interprets as indicating the presence of volcanic aerosols in the atmosphere of the earth's northern (but not southern) hemisphere.
Further References. Galindo, I., Hofmann, D.J., and McCormick, M.P., eds., 1984, Atmospheric Effects of the Volcanic Eruption of El Chichón; Geof¡sica Internacional, v. 23, nos. 2-3, p. 113-448 (22 papers).
Pollack, J.B., Toon, O.B., Danielsen, E.F., Hofmann, D., et al., eds., 1983, The El Chichón Volcanic Cloud: An Introduction; Geophysical Research Letters, v. 10, no. 11, p. 989-1128 (18 papers).
Information Contacts: W. Fuller and P. McCormick, NASA; T. DeFoor, MLO; M. Hirono, Kyushu Univ., Japan; E. Brooks, Saudi Arabia; K. How, Hawaiian Sugar Planters Assoc.; M. Matson, NOAA/NESS.
Cite this Report
Cloud movement; lidar measurements; observations from the southwest Pacific area
The major stratospheric cloud remained dense over lower northern latitudes. It has been estimated to cover the earth from S of the equator to as far N as Japan between 21 and 33 km altitude and to average 9.6 km thick. Lidar measurements and reports from England indicated that gradual northward dispersal was continuing.
At Mauna Loa, Hawaii, lidar measurements showed that cloud material was densest at 25-27 km altitude. Lidar at Fukuoka, Japan showed increasing concentrations during July at 22-25 km altitude. Measurements of well-resolved fine structures on 26 July showed a more dense layer at 22-24 km and a less dense one at 28-29 km. The backscattering ratio of 42 at 25 km altitude detected 1 July by lidar at Hampton, Virginia was the highest ever observed in the stratosphere from there. Measurements from the 8-13 July NASA flight revealed several separate layers of material, with greatest concentrations between 24 and 26 km altitude.
As observed from Norwich, England (52.5°N, 1°E) the cloud was a thin veil that was not always present. On most evenings when the sun was visible, a round area of diffused pale bluish-white light appeared around the sun, extending 20-30° out from it and remaining obvious after sunset. On 28 and 29 May a brownish band appeared around the perimeter of the bright area, separating it from blue sky; this was interpreted as Bishop's Ring. A similar ring and a prominent sun pillar were noted around the midnight sun on 13 June at latitude 67.5°N between Bodí and the Lofoten Islands, Norway.
Observations from Australia, Samoa, and New Zealand. This report is from John Gras and Keith Bigg.
"At Sydney, Australia (33.77°S, 151.1°E) brilliant sunsets have been observed consistently since 17 June until present (21 July). Twilight intensity measured at 20° elevation was also greatly enhanced on 24 May, but had subsided on 30 May increasing again by 17 June. Shadow heights indicated layers at 15 and 25 km on 24 May and between 15 and 20 km subsequent to 17 June.
"Brilliant twilights were also observed at Samoa (14.28°S, 170.68°E) during a visit 19-29 June. Twilight intensity and shadow height on 27 June indicated a pronounced layer at 20 km.
"No enhancement of twilight was evident at New Plymouth, New Zealand (39°S, 174°E) 26 June-2 July."
Information Contacts: W. Fuller, NASA; M. Hirono, Kyushu Univ., Japan; H. Lamb, Univ. of East Anglia, England; John Gras and Keith Bigg, CSIRO Division of Cloud Physics, Australia.
Cite this Report
Northern hemisphere observations and lidar
Lidar measurements from several locations in the northern hemisphere suggest that the bulk of the El Chichón stratospheric cloud remains confined to lower northern latitudes. Measurements at MLO, Hawaii showed that the cloud remained densest at 25-27 km altitude, but seemed more uniform than last month. Lidar at Fukuoka, Japan showed the aerosols in multi-layer structures above 21 km, in the easterly winds, but well-mixed below that altitude, in the westerly winds. Over Hampton, Virginia, multiple layers were detected between 16 and 31 km, but lower backscattering ratios indicated that the aerosols were much less dense than over Hawaii or Japan. Farther N, at L'Aquila, Italy (42.37°N, 13.4°E) large aerosol enhancements were detected 28 July, and 5, 11-21, and 25-30 August. Layers 3-4 km thick with backscattering ratios as large as 10-12 were observed around 25 km altitude, and on 26 August there was a layer at 32 km altitude with a backscattering ratio of 2.
Scientists from the Department of Physics and Astronomy, University of Wyoming studied the cloud during two unmanned, balloon flights from S Texas (27.3 and 27.7°N) and 7 flights from SE Wyoming (41°N). Optical particle counter measurements of the concentration of particles with radii greater than 0.15 µm revealed two stratospheric layers. The lower layer was 2-3 km thick with peak concentrations, at least 40 times background levels, at about 18 km. The upper was about 3 km thick with peak concentrations, at least 200 times background levels, at about 25 km. Ten sublayers were identified in the upper layer over Texas in May, but only some were found over Wyoming before July.
Since early September brilliant colors persisting at least 30 minutes after sunset have been observed from Norwich, England. At that time on 7 September the brightest area was faintly rimmed with a brown band, interpreted as Bishop's Ring. On 8 September, long smooth streaks at an altitude of 20-25 km were illuminated until 30-35 minutes after sunset.
Information Contacts: T. DeFoor, MLO; M. Hirono, Kyushu Univ., Japan; P. McCormick and W. Fuller, NASA; G. Visconti, Univ. L'Aquila, Italy; D. Hofmann, Univ. of Wyoming; H. Lamb, Univ. of East Anglia, England.
Cite this Report
Little stratospheric cloud movement evident in satellite, lidar, and balloon data
Satellite, lidar, and balloon data continue to indicate that little latitudinal movement of the stratospheric cloud has occurred in recent months. Mean monthly sea surface temperatures determined from the NOAA 7 satellite have been as much as 3°C lower in some regions than the actual ocean temperatures measured at the same time and place by ships, apparently because of interference from the El Chichón cloud. Previous work had shown that the satellite temperatures are normally quite accurate, varying from ship measurements by a maximum of about 0.5°C. Significant discrepancies between actual temperatures and satellite temperatures have remained between 10°S and 30°N, with maximum variations from 15-20°N. No substantial northward movement has been detected through September. Variations peaked in June and July, declining somewhat in August and September.
September lidar data showed gradual vertical expansion of the cloud but little evidence of large-scale northward movement. Layers were detected below the tropopause in Hawaii, but this material may be from Galunggung or some other source, rather than from El Chichón. Balloon soundings from Wyoming (41°N) continued to show a very broad layer around 18 km altitude and some layers as high as 25 km during September, but there were large variations between soundings. The upper layers were not as broad as they had been over Texas (about 27.5°N) during previous measurements. When samples collected from these layers by the Wyoming sondes were heated to 150°C, 98% of the material volatilized, a result consistent with an H2SO4-H2S composition. The composition of the particulate matter, the 2% that did not volatilize, has not been determined.
Brilliant sunsets continued to be seen by H.H. Lamb from Norwich, England through mid-September. A probable Bishop's Ring was seen after sunset 7 September and long, smooth streaks at 20-25 km altitude were illuminated the next evening, but low-level haze prevented any useful observations 9-10 September. No anomalous features were present at sunset or during twilight on the 11th, but a brightly-colored layer could be seen around sunset 12-14 September. The timing of the end of illumination of this layer indicated that it was at about 21 km altitude. When dark, it showed a structure of long streaks.
In late October, government and university scientists will begin a satellite and field experiment designed to determine the key radiative, dynamical, and chemical properties of the El Chichón stratospheric eruption cloud. A NASA Electra aircraft, equipped with a number of remote sensors (including 2-wavelength lidar, 13-channel sun photometer, 4-channel direct diffuse photometer, and Brewer spectrometer) will collect data over the US, the Caribbean, and Central and South America between 19 October and 5 November. The flight plan will be coordinated with a number of concurrrent in-situ and satellite (SME, NOAA/TIROS N, NIMBUS 7, and GOES) measurements. Coordinated rendezvous are planned with high-flying aircraft and with balloon experiments in Texas, New Mexico, and Wyoming. Comprehensive data sets from this research will be made readily available to the scientific community. For more information, contact Pat McCormick or George Maddrea at NASA Langley Research Center.
Information Contacts: W. Fuller, P. McCormick, and G. Maddrea, NASA; T. DeFoor, MLO; M. Hirono, Kyushu Univ., Japan; A. Strong and M. Matson, NOAA/NESS; D. Hofmann, Univ. of Wyoming; B. Mendonça, NOAA; H. Lamb, Univ. of East Anglia, England.
Cite this Report
Ejecta from El Chichón reaches both poles; lidar and sunset observations
In late October and early November, a NASA Electra aircraft with a package of remote sensing instruments on board gathered data on El Chichón's stratospheric cloud from about 46°N to 46°S. Only very preliminary results were available at press time. Lidar profiles were collected over the entire flight path, optical depths of the atmosphere were determined by sun photometry at 13 wavelengths, and the total SO2 and O3 columns over the aircraft were measured. No dramatic changes in the position or morphology of the cloud appeared to have occurred since a similar flight (N Hemisphere only) 8-13 July. Stratospheric material was detected over the entire flight path, and M. P. McCormick believes that ejecta from El Chichón has reached both poles. As in July, there was a distinct boundary between the much more dense cloud at lower northern latitudes and more diffuse material farther from the volcano. The densest portion of the cloud extended only a few degrees farther N in November than in July. A similar boundary was found at lower southern latitudes. The strongest concentration of aerosols was typically at 23-24 km altitude, with the base of the cloud at about 21 km, but considerable variation in its morphology was observed.
From lower northern latitudes, ground-based lidar continued to detect stratospheric debris from El Chichón, but peak backscattering ratios were smaller and occurred at slightly lower altitudes in October than in September. Farther north, however, new layers have been observed since 3 November over Garmisch-Partenkirchen, West Germany.
Edward M. Brooks resumed daily sunrise and sunset observations from Jeddah, Saudi Arabia on 26 August. Between April and June, brilliant colors had been visible 40 minutes from sunrise and sunset, indicating material at 20-25 km altitude, but by October, only faint remnants of color could be seen that long before sunrise and after sunset. However, Brooks continued to see unusual colors, although somewhat nearer to sunrise and sunset, and at dawn on 21 October observed a brown NNW-SSE-trending band that looked like volcanic ash at 10° above the ESE horizon. In early November, the timing of the appearance and disappearance of color indicated that the layers being illuminated may have only been in the upper troposphere. H. H. Lamb observed brilliant sunsets from Norwich, England in early and mid-September, but reported that sunset colors were less spectacular, although still usually abnormal, by late October.
Information Contacts: P. McCormick, NASA; T. DeFoor, MLO; M. Hirono, Kyushu Univ., Japan; S. Hayashida and A. Ono, Nagoya Univ., Japan; R. Reiter, Garmisch-Partenkirchen, W. Germany; E. Brooks, Saudi Arabia; H. Lamb, Univ. of East Anglia, England.
Cite this Report
Lidar data from Germany and Hawaii; visual observations
Data from ground-based lidar distant from El Chichón indicated that the dense portion of the stratospheric cloud ejected 4 April was spreading slowly northward. However, at low latitudes, where dense aerosols have been observed since shortly after the eruption, both the altitudes and concentrations of the strongest layers have decreased noticeably in November.
During the late October-early November NASA flight between 46°N and 46°S the dense portion of the cloud terminated at 6-10°S and 30-37°N. In some areas, the edge was quite abrupt, almost cliff-like, but in other regions, it was more gradual. The N boundary of the dense aerosols was at 35-37°N in late October, but at the time of the return flight in early November an arctic air mass had pushed it back to about 30°N, its approximate July position. Peak backscattering ratios were about half of those measured in July, but the cloud had become more homogeneous. By mid to late November, however, ground-based lidar showed that the dense cloud had advanced significantly farther N.
The following is from a report from Reinhold Reiter. "Short-interval lidar observations by the Fraunhofer-Institut für Atmospharische Umwelforschung, Garmisch-Partenkirchen, West Germany have been made since October 1976. Our first lidar sighting of an aerosol cloud attributed to the El Chichón activity was on 3 May at 15-16 km altitude (figure 1). This layer, with a scattering ratio of 3 (ratio of total to molecular backscattering) at 0.69 µm (ruby wavelength) was clearly distinguishable from the layer produced by the as yet unknown eruption in late December 1981 or early January 1982 (the so-called "mystery cloud"). From 11 May on, a broad layer between 10 and 20 km had developed with a backscattering maximum at 18 km. This layer remained very steady throughout the summer months. The maximum scattering ratio of 8 was observed 16 May; later on the layer showed values of 2-3. This layer, transported by the stratospheric westerlies, was joined by aerosol layers after the end of May that were carried by the stratospheric summer easterlies above 20 km. In the height range 20-25 km, the aerosol concentrations fluctuated drastically (figure 1) and not before mid-August had a rather homogeneous aerosol layer developed. The highest scattering ratio of 14 was observed with a height resolution of 600 m at 24.6 km on 1 August. After mid-October the double structure merged into a broad layer between 13 and 25 km, which can be explained by the change of the stratospheric wind pattern to the winter regime with westerlies throughout this height range.
 |
Figure 1. Lidar observations of volcanic aerosols over West Germany, January 1982-April 1983, showing the arrival dates of layers at different altitudes from two eruptions. Data include the passage of material from the "Mystery Cloud" [later beleived to have been ejected from Nyamuragira (Zaire) in late December 1981] and the aerosols from the March 1982 eruption of El Chichón. Vertically integrated particulate backscatter intensity (sr-1) is subdivided into 10-20, 20-30, and > 30 km altitude ranges. Measurements were made by the 694.3 nm pulsed ruby laser (height resolution 600 m) at Garmisch-Partenkirchen. |
"In November the stratospheric aerosol again changed its structure because of the arrival of the uppermost El Chichón clouds. Above 25 km, 2 new layers could be observed with scattering ratios of about 3, one centered at about 27 km, the other centered at about 30 km, tailing off to 35 km."
In Hawaii, lidar measurements showed a gradual decrease in total integrated backscatter until 3 December, when a hole appeared in in the aerosol layers at 26 km altitude, dropping integrated backscatter by nearly a factor of 2. Preliminary data from 10 December measurements indicates a return to a pattern similar to that of late November. The lower stratospheric layer first observed there in October was very strong in mid-November, but had nearly disappeared by the end of the month. In Hampton, Virginia increasingly strong backscattering ratios (twice those previously recorded at this latitude) at high altitudes were measured in November, showing that northward spread of the dense portion of the cloud had resumed, but lower stratospheric layers like those detected from Hawaii were not observed.
Unusual sunrises and sunsets were seen in Japan, Saudi Arabia, and Germany. Toshio Fujita reported fiery red glows and unusual twilights from various locations in Japan since 17 May. These were seen as far N as Sendai (38.27°N, 140.90°E) in late October. During the autumn, evening glows have been more brilliant than usual at Sapporo (43.05°N, 141.33°E). Many of these observations corresponded with detection of increased aerosols at 25-27 km altitude by the Meteorological Research Institute lidar (36°N, 140°E). Backscattering ratios ranged from 30-150. Small pale brownish halos often surrounded the moon, with diffused light extending 3-5 diameters. In Saudi Arabia, Edward Brooks continued to see long and unusually-colored dawns and twilights through early December, but noted considerable day-to-day variation. He could often see distinct bands of volcanic material (27 and 29 October, 5, 6, 11, 14-15, 17, 24, and 27 November, and 3-4 December). After sunset on 5 November, a SSW-NNE band of ash was illuminated after cirrus clouds (in the upper troposphere) had lost their illumination, indicating that the ash was at stratospheric altitudes. Separate tropospheric and stratospheric layers were illuminated before sunrise 3 December.
Information Contacts: P. McCormick and W. Fuller, NASA; R. Reiter, Garmisch-Partenkirchen, W. Germany; T. DeFoor, MLO; M. Hirono, Kyushu Univ., Japan; S. Hayashida, Nagoya Univ., Japan; T. Fujita, Meteorological Research Inst., Japan; E. Brooks, Saudi Arabia; A. Strong, NOAA.
Cite this Report
Dispersal of the stratospheric aerosol cloud continues
Atmospheric data indicated continued dispersal of the dense part of the stratospheric aerosol cloud ejected by El Chichón's 4 April eruption. Balloon data from Wyoming (41°N) began to show a few isolated layers of the dense portion of the cloud in July and August. More layers gradually appeared and by 30 November about 80% of the zone between the tropopause (roughly 10 km altitude) and 30 km altitude contained aerosols from the cloud. Particle concentration dropped sharply above 30 km altitude and was two orders of magnitude lower at 32 km. By the next balloon launch on 9 December, no major gaps were evident in the aerosols within this 20 km-thick region. Data collected 30 December were similar. Particles in the upper half of the cloud averaged about 0.3 µm in diameter, as compared to a mean particle size of about 0.1 µm in the lower half, more typical of volcanic clouds. From the balloon data, the total mass of the El Chichón cloud was estimated to be 8-10 megatons, about 40 times that of the cloud ejected 18 May 1980 from St. Helens. Most of the mass of the El Chichón cloud was concentrated in its upper layers. No decay of the cloud was evident from the balloon data, indicating that the rate of particle settling did not yet exceed the rate of gas to particle conversion.
Gas and particle samples were collected for LANL between the tropopause and 20 km altitude from a WB57-F aircraft that flew from the equator to 75°N in April-May, July-August, and October. The maximum lower stratospheric sulfate concentration detected was 167 ppb by mass from a sample taken 20 April. Because the 4 April cloud had probably not reached the sampling area by then, this material is thought to have been collected from the smaller 29 March cloud. The average lower stratospheric concentrations over the entire Northern Hemisphere were calculated to be 11.85 ppb by mass in April-May, 9.27 ppb in July-August, and 7.54 ppb in October, in contrast to the July 1981 value of 2.5 ppb (primarily from Alaid and Pagan) and the July 1980 value of 2.3 ppb (mostly from St. Helens). However, unlike the 1980 and 1981 eruptions, the bulk of the material from El Chichón's explosions reached altitudes higher than 20 km, so the 1982 concentration figures represent only 20-33% of the total cloud mass, estimated at about 5 megatons from the aircraft data.
Comparison of October and December data collected from a NASA Ames Research Center Convair 990 aircraft showed that considerable mass transport of the El Chichón cloud took place in the Northern Hemisphere during the autumn. Visible wavelength optical depth measurements indicated that large quantities of material had reached 54°N, the northern limit of the flight, by mid-December. Significant variation in particle size distribution at different locations was detected. Measurements were also made at many infrared wavelengths. Data reduction was not yet complete, but spectral resolution of about 1.5% will allow isolation of the effects from volcanic components in the stratosphere from the effects of other material such as ozone. Samples were collected during U-2 flights to 21 km altitude. The concentrations of SO2 and CN had declined since the summer and new particle formation in the lower stratosphere appeared to have stopped.
Lidar data from Hawaii indicated that most of the aerosol material was between 16 and 30 km although some enhancement in backscattering was detected to 38 km. Total integrated backscatter varied, but was generally less than in November. Maximum backscatter measured from Fukuoka, Japan dropped in mid-December, but returned to November levels 5 days later. The amount of stratospheric material over Hampton, Virginia increased in December, but peak values for individual layers have not been as large as those measured over lower latitudes before significant lateral dispersal of the cloud began.
During the lunar eclipse of 30 December, the moon was much darker than normal, with only the extreme S limb showing substantial light. Edward Brooks notes that this relatively uniform darkening of most of the moon during the total phase of the eclipse suggests that the El Chichón cloud was present over all but extreme southern latitudes. Darkening of the moon during the 6 July total eclipse was asymmetrical, concentrated on its N half.
Edward Brooks continued to see some brilliant dawns and twilights from Saudi Arabia, but noted considerable variation in their intensity and length. SSW-NNE bands of ash were visible low in the ESE sky near sunrise on 14 December. Beginning in mid-December, long dawns and twilights indicated the presence of high-altitude material over the area. From Boulder, Colorado (40°N, 105.2°W), Richard Keen observed brick-red color to 1.5 hours after sunset 3-4 November and 11-12 January. This corresponds to a solar depression angle of about 18°, indicating that the volcanic material reached an altitude of about 40 km [but see 08:01]. On other nights, the glow has persisted only until a solar depression angle of 6-7° was reached, yielding a maximum cloud height of about 23 km.
Information Contacts: D. Hofmann, Univ. of Wyoming; W. Sedlacek, LASL; J. Pollack, NASA, CA; T. DeFoor, MLO; M. Hirono, Kyushu Univ., Japan; W. Fuller, NASA, VA; E. Brooks, Saudi Arabia; R. Keen, Univ. of Colorado; M. Matson and A. Strong, NOAA.
Cite this Report
Stratospheric aerosol cloud data to 76°N; unusual sunrises and sunsets
Aerosol cloud - Instrumental observations. Lidar data continued to show a gradual decrease in both the altitude and intensity of backscatter from the aerosol cloud's densest layer. From Fukuoka, Japan, no notable peak was found above 21 km altitude after 24 January. A single broad layer was detected, with maximum backscatter at 18-19 km. The strongest layer over Mauna Loa, Hawaii remained at about 22 km altitude through early February while the cloud's integrated backscatter declined slowly. A layer between 16.8 and 17.4 km measured 26 January may not have been El Chichón material; it accounted for about 2% of the 26 January integrated backscatter. A 12-16 km layer was detected the same night from Wallops Island, Virginia.
Between 27 January and 5 February, a NASA P-3 Electra aircraft collected aerosol data from 27°N-76°N. The cloud was quite homogeneous from 27-38°N, with peak ruby lidar scattering ratios of roughly 8 at about 20 km altitude. To 55°N, both the upper and lower altitude portions of the aerosol cloud continued to be present, in similar concentrations. As the aircraft approached Greenland at about 55°N and entered the polar vortex, a system circulating air southward from the polar region, the upper aerosol layers disappeared fairly abruptly. However, lower stratospheric material remained, with scattering ratios of 3-8 at 15-16 km altitude, values similar to those at the same altitudes S of 55°N. As the aircraft flew W at 76°N, a similar pattern persisted until it exited the polar vortex at about 100°W, when the upper layer reappeared; scattering ratios ranged from 2-4 at 18-23 km altitude and some material was detected to 30 km altitude. M. P. McCormick noted that these data support information from the SAM II satellite indicating that the lower stratospheric aerosols from El Chichón moved fairly rapidly to the poles but material at higher altitudes has yet to fully penetrate the polar regions.
David Hofmann reported that late January-early February balloon data from Laramie, Wyoming revealed an extensive cloud of aerosols at higher altitudes than previously observed. The base of the layer, at about 29 km altitude, was marked by a boundary zone that was only about 50 m thick. Particle concentrations on 28 January exceeded 600/cm3 at 29 km, compared to normal background values of 1-2/cm3 at that altitude. Enhanced concentrations were measured to about 35 km altitude. A second balloon flight, on 1 February, again penetrated the cloud. The aerosol particles were about 0.02 µm in diameter, too small to be detected by lidar. They had no non-volatile cores and were probably H2SO4 droplets formed in the north polar region from SO2 ejected by El Chichón. Given a wind speed of about 80 km/hour (from the E) at these altitudes, the cloud was at least 8000 km in lateral extent. By a third flight on 4 February, the high-altitude cloud was greatly attenuated.
Gas and particle samples were collected for LANL between the tropopause and 20 km altitude from a WB57-F aircraft that flew from the equator to 75°N in April-May, July-August, and October. Eugene Mroz reports that calculations based on information from these samples, combined with data from balloon launches to 30 km altitude at 33°N and limited sampling to 10°S, yield a mass of 5.68 x 10¹² g of sulfate injected into the stratosphere by El Chichón's explosions. Using the same methods, the mass of sulfate in the "mystery cloud" ejected in early January by a volcano that remains unidentified was calculated to be 0.85 x 10¹² g.
Unusual sunrises and sunsets. Brilliant sunrises and sunsets continued to be reported from England in early January and Saudi Arabia in late January. However, no unusual colors were seen from Wyoming in January, or from Colorado after mid-January, and sunset colors in New Jersey weakened considerably in late January and early February.
In mid-January, H. H. Lamb reported that during clear days for the previous 3-4 weeks the sun over Norwich, England had increasingly appeared to be surrounded by a white sheen of diffused light extending to about a 20° radius, although there was little apparent diminuition of solar brightness. On 16 December at 1605 GMT, with the sun about 6° below the horizon, a roughly round, vivid purple patch was seen at 20-25° elevation, indicating to Lamb that the layer was at 20-24 km altitude. Twenty minutes later, the W sky was a brilliant orange, changing to fiery red nearer the horizon during the next 20 minutes. A brilliant afterglow continued until 1700, which Lamb interpreted to presumably indicate the presence of aerosol material to 34 km altitude. There were no unusual sunset colors for the next several nights, and cloudy weather made observations after 24 December difficult. Glow was stronger than usual through breaks in the clouds 26 December and on the 28th the increased spread of diffuse white light around the sun throughout the day (see above) began to be obvious. On 9 January at 1630-1635 GMT, with the sun about 5° below the horizon 22-27 minutes after sunset, a vivid magenta-purple area developed at 15-27° elevation above a greenish-pale yellow sky, suggesting an aerosol layer at about 18-20 km altitude. During the next 15-20 minutes, the sky changed to a more normal appearance, but at 1700-1705 a fainter purple patch appeared at 10-15° elevation, suggesting a possible second aerosol layer at about 35 km altitude.
From Jeddah, Saudi Arabia, Edward Brooks saw several sunrises in early January that were preceded by two distinct periods of unusual colors. SW-NE-trending bands of volcanic aerosols were seen at dawn 1 January and the next day 2 periods of dawn color were separated by the appearance of dull reddish SSW-NNE-trending volcanic aerosol layers. Similar layers were seen 5 and 6 January in association with 2-stage dawns, and after a period of cloudy weather, on 13 January. Several long-lasting and bright-colored dawns and twilights were observed during the next several days. On 21 January, the second part of a 2-stage dawn included faint N-S bands of volcanic aerosols. When weather conditions permitted, bright dawn and twilight colors were visible until 29 January, then were succeeded by several days of little or no color. A brilliant twilight 2 February was followed by the observation of NNE-SSW-trending bands after sunset 3-4 February that may have been volcanic aerosols. An early dawn 5 February indicated the presence of high-altitude aerosols, but the later stage of dawn color was absent, indicating that no lower altitude material was present.
From Boulder, Colorado, Richard Keen reported that a salmon-colored primary twilight glow visible to solar depression angles of 6-7° preceded the brick-red secondary glow that persisted to 1.5 hours after sunset 11-13 January (7:12; note that 13 January has been added). Keen noted that Volz (1969) described similar double twilights after the 1963 Agung eruption and showed that the later glow can be produced by secondary illumination of the same single layer. Keen therefore suggests that the double twilights that he observed in November and January were caused by a particularly thick layer at about 23 km altitude and that there probably was no 40 km layer. To produce a double twilight, the 23 km layer would have to extend at least 1500 km W of Boulder. Since 13 January, he has seen no unusual twilights. From Laramie, Wyoming, David Hofmann observed no unusual twilight colors since about early January. Fred Schaaf observed numerous double twilights from Millville, New Jersey (39.4°N, 74.9°W) through mid-January, but secondary glow was not present on 19 January and other twilight colors were much weaker. Twilight color remained subdued or absent for the next several days. A rather strong double twilight was visible 28 January, but colors were weaker on succeeding days. Daytime aerosol effects also seemed weaker in January than in December.
Reference. Volz, F. E., 1969, Twilights and stratospheric dust before and after the Agung eruption: Applied Optics, v. 8, p. 2507-2517.
Information Contacts: M. Hirono, Kyushu Univ., Japan; T. DeFoor, MLO; P. McCormick and W. Fuller, NASA; D. Hofmann, Univ. of Wyoming; E. Mroz, LASL; H. Lamb, Univ. of East Anglia, England; E. Brooks, Saudi Arabia; R. Keen, Univ. of Colorado; F. Schaaf, Millville, NJ.
Cite this Report
Tiny aerosols recondense above 30 km; little change to N hemisphere cloud; unusual sunrises and sunsets
Lidar data. Lidar measurements from Nagoya, Japan (35.13°N, 136.88°E) 2, 6, 13, 19, and 27 December showed similar altitudes and peak backscattering ratios, but small secondary peaks were detected at 35-36 km only on the 13th and 19th. Both the altitude and the strength of peak backscatter measured at Garmisch-Partenkirchen, Germany were significantly higher on 1 January than for the very consistent readings of 10, 18, and 29 January. Late February-early March lidar data from Mauna Loa, Hawaii, Fukuoka, Japan, and Hampton, Virginia were similar to data at the same locations a month earlier. Integrated aerosol backscatter was considerably higher in Virginia than in Hawaii, suggesting that the bulk of the cloud had moved from the low latitudes where it was concentrated for several months after the March-April 1982 eruption.
Unusual sunrises and sunsets. From Tsukuba, Japan (36°N, 140°E) Toshio Fujita observed unusual twilight glows through January. Evening glows in December appeared redder than those in November, but by mid-January the red twilight colors were rapidly becoming lighter. A twilight photograph taken 24 January showed much paler colors than one taken 7 December at a time of similar solar depression angle. Despite the difference in color, the peak backscattering ratio measured 26 January was very close to the 8 December value. The maximum backscattering ratio increased from 17 (at 23 km altitude) on 8 December, to 28 on 28 December, but both heights of the strongest aerosol layers and their peak backscattering ratios were gradually descending by mid-January, and maximum backscattering was 16 on the 26th. Fujita attributed the differences in color at times of similar lidar readings to varying turbidity in the lower atmosphere. In mid-February, lidar at Tsukuba again measured relatively weak backscattering and the strongest aerosol layer had descended farther to about 20 km altitude.
Edward Brooks noted considerable variation in dawn and dusk colors from Jeddah, Saudi Arabia in February. Colorful early dawns 6-9 February indicated the presence of higher stratospheric aerosols, but the absence of unusual late dawn colors suggested that lower stratospheric aerosols were absent. This pattern reversed early 10 February, when no early dawn was evident but a colorful late dawn resulted from illumination of volcanic layers near the tropopause, visible as faint N-S bands. Similar bands were visible that evening, when aerosols could be observed both at the tropopause and higher in the stratosphere. Few unusual colors were visible early 11 February, but on the 12th both the upper and lower aerosol layers were illuminated. For the next several days, bands of material, generally trending SSW-NNE, were often observed at dawn and twilight with both early and late colors. Only higher aerosols were illuminated at dawn 19 February; some lower-altitude material appeared to be present early 20 February, but no unusual colors were evident that evening.
From Norwich, England, H. H. Lamb reported that on all cloudless days the sun continued to be surrounded by a white sheen of diffused light that seemed to be increasing steadily in extent, from about 20° in angular radius in mid-January to 25-30° as of 10 February. The sun itself often appeared nearly white at elevations of 5-15° and on partly cloudy days the sky was a paler gray than usual. Richard Keen observed no unusual sunsets from Boulder, Colorado between 13 January and 17 February.
Fred Schaaf observed increased optical effects in February from Millville, New Jersey after a notable weakening in January. By 15 February, late dawn colors (lower altitude aerosols) had returned to moderate levels. During the afternoon of 18 February, the sun was surrounded by a red-brown ring with a radius of about 30° that remained visible until shortly after sunset, when weather clouds obscured further observations. The next evening, twilight glow was stronger and Schaaf calculated that later glows seen for the first time since 31 January were produced by aerosols as high as about 16 km. Twilights were less impressive for the next few days, but similar effects were seen 23 February. On the 26th, the length of twilight glows indicated aerosols to 16-19 km. On 2 March, moderate to strong early twilight colors from material at about 16 km were followed by a very weak secondary glow that may have indicated the presence of aerosols to 32-40 km.
Balloon data - Wyoming. David Hofmann reported that balloon launches from Laramie, Wyoming continued to penetrate remnants of the extensive cloud of tiny aerosols at 29-35 km altitude first detected 28 January, and encountered a newly formed cloud of similar particles 2 March. The average radius of the 28 January particles was about 0.015 µm, with a few as large as 0.05-0.06 µm. Given the particle size distribution and a 30-50% drop in electrical conductivity measured within the cloud, Hofmann calculated a particle concentration of about 1,200/cm3. During the next week, this concentration dropped to about 100/cm3, a rate of decay corresponding closely to the expected rate of particle coagulation. About 90% of the particles disappeared when heated to 150°C, indicating that the cloud was composed of H2SO4 and H2O droplets. Remnants of this cloud were still present 2 March but had diffused and coagulated considerably, extending from 25-35 km altitude with a maximum concentration of about 50 particles per cm3. Although coagulation had increased the size of individual particles, they remained too small to be detected by lidar at these concentrations. Superimposed on the remnants of the 28 January cloud, a new cloud was detected 2 March. Sharply constrained between 31 and 34 km altitude, the new cloud reached concentrations of about 300 particles per cm3, and appeared to be about 4-5 days old.
Hofmann noted that between 25 and 35 km altitude, liquid H2SO4 is vulnerable to vaporization if its temperature is raised slightly. If cooled again, it would then recondense into tiny droplets. High-altitude wind data indicated that the 28 January cloud originated in the Alaska-Siberia area, in a zone of 30-40°C stratospheric warming. From this warm area, the cloud reached Wyoming in about 30 hours, carried by 200 km/hour winds. Cooling of about 40°C probably occurred during transport, sufficient to recondense the H2SO4. Similar clouds have been detected for the past several years, usually in the spring, but the 28 January cloud had particle concentrations 15 times as high as clouds seen in 1982, which in turn were 5 times as concentrated as 1981 clouds (Rosen and Hofmann, 1983).
The much larger particles from the original El Chichón cloud remained evident over Wyoming. During the most recent fully-analyzed sounding on 11 February, a very broad layer extended from the tropopause (11 km) to about 27 km with a peak concentration of 10 particles (larger than 0.15 µm) per cm3 at 19 km altitude. A sounding in an equatorial airmass, on 10 March, showed a similar profile, with a peak concentration of 8 particles per cm3 at 19-20 km altitude and the top of the cloud at roughly 27 km. The profile included a 1 km-thick zone of very clean air (about 1/2 particle per cm3) centered at about 15 km altitude, probably tropospheric in origin.
Reference. Rosen, J. M., and Hofmann, D. J., 1983, Unusual behavior in the condensation nuclei concentration at 30 km: JGR, v. 88, p. 3725-3731.
Information Contacts: D. Hofmann, Univ. of Wyoming; W. Fuller, NASA; T. DeFoor, MLO; M. Hirono, Kyushu Univ., Japan; R. Reiter, Garmisch-Partenkirchen, W. Germany; E. Brooks, Saudi Arabia; H. Lamb, Univ. of East Anglia, England; T. Fujita, Meteorological Research Inst., Japan; S. Hayashida, Nagoya Univ., Japan; F. Schaaf, Millville NJ; R. Keen, Univ. of Colorado.
Cite this Report
Continued monitoring of stratospheric cloud from El Chichón
Lidar data from Fukuoka, Japan showed a significant decrease in peak values during the limited intervals when weather permitted observations. Broad, almost monolayer profiles were obtained. On 22 March, lidar at Hampton, Virginia showed a broader peak than it had on the 3rd, but about the same total amount of aerosol. From Mauna Loa, Hawaii, lidar detected only minor variations in total aerosol through March. In late April and early May, a lidar-equipped NASA aircraft will collect data on the El Chichón aerosols from high northern to high southern latitudes, and will coordinate with balloon launches from Palestine, Texas.
David Hofmann reported that a balloon launch from Laramie, Wyoming early 8 April detected remnants of the extensive cloud of tiny aerosols observed 28 January. About 20 particles per cm3 remained between 25 and 33 km altitude. A new layer of similar particles, probably about 1 week old, was observed at 20 km, an unusually low altitude. Particle concentrations were about 125/cm3, but the layer was only 200 m thick. The arctic airmass over Wyoming on 8 April lowered the tropopause to 9-10 km altitude, so the densest layers of the main El Chichón cloud were lower than usual. Counts of particles larger than 0.15 µm reached 13/cm3 at 12 km and were still 7/cm3 at 20 km. The layer terminated rather abruptly at 23 km.
Edward Brooks reported brilliant dawns and twilights and visible bands of volcanic aerosols over Jeddah, Saudi Arabia during several periods between late February and late March. In addition to colors observed shortly before sunrise and soon after sunset, caused by illumination of aerosols in the lower stratosphere, the presence of higher layers often resulted in unusual colors long before sunrise and after sunset. Early and late colors were both visible near dawn 21 February, but remained feeble. Brightly colored sunsets were observed 21-22 February, and another 2-stage dawn the 23rd. That evening, brown volcanic aerosols formed a layer at about 6° above the horizon. Clouds obscured the sky for the next several days, but many N-S bands of aerosols were visible at 1-3° elevation in the E sky early 28 February. During the first week in March, both early and late dawn colors were usually faint and were sometimes entirely absent. N-S bands of volcanic aerosols were present early 4 March at about 5° elevation. Clouds made observations difficult 10-14 March, but the return of clear weather revealed more bands of aerosols 15-19 and 22 March accompanying long, brilliant dawns and twilights.
Fred Schaaf saw several examples of Bishop's Ring in March from Millville. New Jersey, but frequent cloudiness limited his observations. Before sunset on 13 March, the sun was surrounded by a band about 6° wide that formed a ring with a radius of about 24-30°. On 15 March, the sun's brightness was considerably diminished by a haze that could not be accounted for by weather conditions or local pollution. A milky area bordered by a Bishop's Ring that was again about 24-30° in radius was visible an hour before sunset 20 March. A similar Bishop's Ring was observed before sunset 30 March. Sunset glows through the month were only weak to moderate and there was only one weak example of late glow indicating illumination of higher aerosols. Richard Keen reported that he had observed no unusual twilights from Boulder, Colorado since mid-January.
Information Contacts: M. Hirono, Kyushu Univ., Japan; M. Osborn, NASA; T. DeFoor, MLO; D. Hofmann, Univ. of Wyoming; E. Brooks, Saudi Arabia; F. Schaaf, Millville NJ; R. Keen, Univ. of Colorado.
Cite this Report
Stratospheric aerosols reduce solar radiation; high latitude aerosols sampled
Atmospheric scientists continued to monitor the stratospheric cloud ejected by El Chichón's March-April 1982 explosions. Poor weather plagued attempts to gather lidar data in Hawaii and Japan, but a few measurements were obtained. In Hawaii, declines were recorded in April for both peak and integrated backscatter, indicating decreases in the aerosol concentration within the densest layers and the cloud as a whole. In Japan, however, limited data showed a recovery of peak backscattering ratios to March levels, after a decline in early April.
Pyrheliometer data from Japan and Colorado show substantial reductions in direct solar radiation after the March-April 1982 injection of stratospheric aerosols. Japanese stations between 26.3°N and 43.3°N showed significant increases in turbidity and decreases in transmissivity since last autumn. These effects seemed to occur earlier at the southernmost station. Direct solar radiation first began to show a slight decline at Boulder, Colorado in July 1982 (about 2%) and was about 6% below the 1978 value in September (figure 2). The major decrease in direct solar radiation occurred in late October (around the 27th), with November and December 1982 having average values 13% and 20% less than the 1978 means. However, January-April 1983 data show increasing direct solar radiation, indicating a slow diminuition in cloud density over Boulder. Total radiation data (direct plus diffuse on a horizontal surface) show a much smaller effect. Changes to these data first became apparent in November with a decrease of slightly more than the 2% measurement/analytical noise, and the December 1982 values were about 3% below the December 1978 mean. Edwin Flowers noted that reductions in direct solar radiation caused by previous volcanic aerosol clouds were usually of short duration, interspersed with periods of normal transmission. However, once the effects of the El Chichón aerosols began to be observed, solar radiation values remained depressed, without periods of normal transmission, indicating the cloud's strong lateral uniformity.
 |
Figure 2. Comparison of direct solar radiation (in watt-hours/m2) at Boulder, Colorado (40°N, 105.2°W) before and after the arrival of El Chichón aerosols. The dense cloud of H2SO4 droplets scatters sunlight, measureably reducing the amount that reaches the Earth's surface. Ratios (1982-83 divided by 1978-79 values) show little change before the appearance of a dense aerosol cloud over Colorado in late October 1982. A slight increase in direct solar radiation January-April 1983 suggests a slow diminution in aerosol density. The right-hand column shows the number of hours of measurement each month, 1982-83 and 1978-79 (left and right of slash, respectively). Courtesy of Edwin Flowers. |
A cooperative NASA-NOAA effort, using real-time TOMS data from the Nimbus-7 polar orbiting satellite, identified episodes of tropospheric-stratospheric "folding" that brought stratospheric air to within 3 km of sea level in the arctic. During one of these events, on 23 March, a NOAA P3 Orion aircraft sampled stratospheric aerosols along the coast of Greenland on a flight between Thule (77.5°N, 69.3°W) and Söndre Strömfjord (67°N, 50.6°W). In 6 hours of sampling, mainly at about 4.5 km altitude, aerosols were collected with 9 different filter systems. Concentrations of 0.1 and 1.0 µm particles exceeded 2000/cm3 with occasional peak values to 5,000/cm3. These particles were predominantly droplets, probably of H2SO4. Larger (1-5 µm) fragmented particles were present in concentrations about 1/1000 of the smaller ones and were predominantly composed of Si, lesser amounts of Fe, and traces of Al. In scanning electron micrographs, these particles appeared similar to El Chichón ash collected on the ground shortly after the March-April 1982 explosions. Although the sampling system was designed to operate at 4.5 km altitude or lower, some aerosols were also collected at about 7.5 km, also in stratospheric air. Along with the droplets and fragmented particles, some NaCl was recovered, although in concentrations only 1/1,000-1/10,000 of the droplets. Salt had also been collected at 4.5 km, but Russell Schnell noted that at the lower altitude the source of the NaCl could have been sea water, extremely unlikely at 7.5 km. NaCl crystals were collected by NASA aircraft from the El Chichón cloud in April and May 1982. In tropospheric air, aerosol concentrations were 100/cm3 or less and included very few particles that looked volcanic.
H. H. Lamb reported increased evidence of stratospheric aerosols over Norwich, England. Since early March normal blue skies have been absent; clear sky colors range from milky blue at considerable distance from the sun to strongly increasing whiteness within 30°-50° of arc from the sun. Sky seen in gaps between clouds within 15°-30° of the sun has invariably been virtually white. During many evenings, particularly in March but continuing as of mid-April, the dominant sky color after sunset has been sepia brown to bronze. From Jeddah, Saudi Arabia, Edward Brooks occasionally observed bands of volcanic aerosols from late March through late April, although brilliant dawn and twilight colors were less frequent than in previous months. In addition to colors observed shortly before sunrise and shortly after sunset, caused by illumination of aerosols in the lower stratosphere, material higher in the stratosphere sometimes resulted in colors long before sunrise and after sunset. On 23 March, SSW-NNE bands of aerosols were visible to 7° altitude in the WSW sky around sunset, and faint SSE-NNW aerosol bands below 5° in the ENE were illuminated during a 2-stage dawn the next day. Many sunrises and sunsets in late March were pale to nearly colorless. A brilliant sunset 4 April was followed by a 2-stage dawn on the 5th. Although dawn colors were nearly absent 7 April, faint brown, narrow, closely-spaced N-S bands of volcanic aerosols were seen at 15° altitude in the E; a colorful dusk that evening was also accompanied by brown N-S-trending aerosols. More aerosol bands were visible the next morning. A dense haze, probably stratospheric, was visible early 9 April as were gray N-S bands of haze that evening, accompanying chalky-appearing dawn and dusk colors that extended to 30-35° altitude. Pale dawns and twilights were observed when cloud conditions permitted 10-15 April, but brilliant colors reappeared at sunset 16 April and bands of aerosols were present at 3° altitude late on the 18th and early on the 19th. Neither bright colors nor aerosol bands were observed from sunset 19 April through the 21st.
Information Contacts: R. Schnell, NOAA/GMCC; E. Flowers, NOAA; T. Yamauchi, JMA, Japan; T. Fujita, Meteorological Research Inst., Japan; M. Hirono, Kyushu Univ., Japan; T. DeFoor, MLO; E. Brooks, Saudi Arabia; H. Lamb, Univ. of East Anglia, England.
Cite this Report
Aerosol cloud remains strong
The following paragraph is from Alan Strong. "Stratospheric aerosols from El Chichón continue to produce offsets in satellite measurements of sea-surface temperatures. NOAA has used these offsets to monitor the month-to-month evolution of the aerosol cloud over the northern and southern hemispheres. Revised analyses agree well with data from the Solar Mesospheric Explorer satellite and show spreading S of the equator by June 1982, followed by a more extensive southward push during August, when the northern limit of the aerosols was rarely beyond 30°N. During autumn, material began diffusing northward over the Pacific Ocean and by December was extensive over North America. The NOAA 7 satellite measurements continued to show large sea surface temperature offsets (i.e. high aerosol concentrations) into January, but by February this higher-latitude material appeared to migrate away from North America over the North Pacific. In April, although some material was indicated between 10°S and 20°N, with some increases being seen in the southern hemisphere, the highest concentrations appeared to be north of 50°N over the Pacific."
David Hofmann reported that data from a balloon launched at Palestine, Texas (31.6°N, 96.5°W) on 16 May showed a peak concentration of about 5.2 particles (larger than 0.15 µm) per cm3 at about 20 km altitude. Remnants of the extensive cloud of tiny aerosols first detected above Wyoming 28 January were encountered between 25 km and the upper limit of reliable data collection at 35 km altitude, peaking at 12 particles per cm3 at 30 km. Background at this altitude is about 1-2 particles per cm3. Similar concentrations of these tiny particles were measured from Laramie, Wyoming 25 May. The larger (> 0.15 µm) aerosols were again centered at about 20 km altitude. Concentrations of 7.3/cm3 were detected, more than in Texas nine days earlier, but slightly less than January-February peak values of 8-10/19cm3 over Wyoming.
Lidar observations from Fukuoka, Japan showed a slight decrease in both the altitude and density of the strongest layer of El Chichón aerosols in early May. From Mauna Loa, Hawaii a new layer that straddled the troposphere/stratosphere boundary (tropopause heights during May lidar measurements were 15.6-15.9 km) was first noted 11 May between 15.2 and 16.5 km altitude and was quite strong during the next observation 25 May, ranging from 13-16.4 km. This layer was weaker during subsequent lidar measurements, but some material was still present at these altitudes 8 June. The new material slightly boosted the integrated backscatter over Mauna Loa, but little change was noted in aerosol layers higher in the stratosphere.
JMA has collected pyrheliometer data from a number of stations since 1959. A marked increase in atmospheric turbidity has been evident since autumn 1982 in the combined data (figure 3), while data from individual locations shows effects beginning earlier at southern stations (figure 4).
 |
Figure 3. Variations in atmospheric turbidity over Japan, 1959-1982, comparing the effects of several large eruptions in two plots. The increase after the El Chichón eruption is substantially larger than those following major explosive events at Tiatia, Agung, St. Helens, Alaid, and Pagan. I) Monthly minimum turbidity coefficients (connected by solid line) from pyrheliometer observations at JMA stations were used to reduce local tropospheric effects. The dashed line connects winter values only; T. Yamauchi cautions that abundant water vapor over Japan during the summer might disturb turbidity observations. Three other points are also plotted for each month: the middle point, of "normal" value, is the mean of the 1959-1982 minimum values for that month; the upper and lower points define the range of one standard deviation from that "normal" value. II) The 3-month running means of deviations form the "normal" value are connected by the solid line. The dots again show one standard deviation for each month. The abnormally high turbidity after several of the large eruptions, especially El Chichón, is emphasized by this plot. Courtesy of Toshio Fujita and Toyotaro Yamauchi. |
 |
Figure 4. Atmospheric turbidity measured at ten stations in Japan, 1980-83, comparing the cloud from El Chichón with those produced by eruptions from St. Helens, Alaid, and Pagan. Note that El Chichón aerosols were first detected at the southernmost stations, nearest in latitude to the volcano. Left: monthly minimum (solid lines) of Feussner-Dubois' turbidity factor (t0) from pyroheliometer observations (at 0900, 1200, and 1500 local time) by JMA stations. The middle dot is the mean minimum monthly value, 1951-1980; the top and bottom dots define one standard deviation from the mean. Right: the solid line shows the deviation of the 3-month running mean of the monthly minimum turbidity factor (t0) from the 1951-1980 mean monthly minimum. Dots again mark a range of one standard deviation. Courtesy of Toyotaro Yamauchi and H, Shimura. |
José Caburian reported gaudy dawns and twilights in the Philippines in early 1983. Dawns and twilights at low latitudes are usually relatively brief, but colors have been observed for an hour or more before sunrise and after sunset. From Jeddah, Saudi Arabia, Edward Brooks observed pale dawn and twilight colors 22-25 April but on the 26th, colors were present only in the sky N of the sunrise and sunset points. Late dawn and early dusk colors were visible 27-28 April, indicating aerosols at lower altitudes, but material at higher altitudes produced colors long before sunrise 29 April-1 May and well after sunset 29 April. Bands of aerosols were observed early 1 May and late 2 May. Only late dawn colors were seen 4-5 May but NNE-SSW bands of aerosols were present early on the 5th. Overcast weather limited observations 7-10 May but little color was apparent through breaks in the clouds. Two-stage dawns, indicative of aerosols in both the lower stratosphere and at higher altitudes, were seen 11-12 May; early dawn on the 12th was fiery red, and long dark NNW-SSE bands of aerosols were visible nearer to sunrise. Only late dawn colors were noted 13-15 May, but there were broad N-S bands of aerosols on the 14th. Sunrises and sunsets were nearly colorless 16-19 May, but brilliant 2-stage dawns and twilights with N-S bands of aerosols occurred 20-21 May. Long crepuscular rays extended to 30° above the horizon early 21 May. Fred Schaaf noted that twilight effects at Millville, New Jersey continued to diminish in April and early May. An aureole around the sun remained prominent on some days, although it was far weaker than in previous months. A Bishop's Ring of 20-30° radius was visible for 1 or more hours before sunset in late April. From a good viewing site 22 April, Schaaf observed 10 minutes of purple light that faded at 5-10° altitude at 1910 local time, indicating material only to roughly 9.5-13 km altitude.
Information Contacts: A. Strong, NOAA/NESDIS; T. Yamauchi, JMA; T. Fujita, Meteorological Research Inst., Japan; D. Hofmann, Univ. of Wyoming; E. Brooks, Saudi Arabia; F. Schaaf, Millville NJ; J. Caburian, Manila, Philippines; T. DeFoor, MLO; M. Hirono, Kyushu Univ., Japan.
Cite this Report
Slight decline in aerosols; fresh volcanic material in lower stratosphere; new layer near tropopause
Reinhold Reiter provided the following summary of the results of lidar measurements from Garmisch-Partenkirchen, West Germany, January 1982-April 1983. A more detailed analysis [appears in Reiter and others, 1983].
"The stratospheric dust veil from the early 1982 "Mystery Cloud" caused from January on (before the El Chichón eruption) a clearly increased background level of particle backscattering at 10-20 km altitude, but not at higher levels. We observed the arrival of the dust veil from El Chichón on 3 May 1982 at 10-20 km altitude (peak at 15 km). In this height interval the aerosol backscatter intensity rose until March 1983, with fluctuations of a factor of 5 (weakened by preloading from the "Mystery Cloud"). We noted the strongest increase, by about a factor of 40, in January 1983 in the height interval 20-30 km. Since August 1982, a clearly increased aerosol backscatter from the El Chichón dust veil can also be seen at levels higher than 30 km. In contrast to the other dust veils that we traced in the stratosphere (St. Helens and Alaid), the aerosol backscatter intensity increased, as figure 4 shows, up to the recent past, i.e. over many months. Only in the 20-30 km range can a slight decrease be recognized from January 1983 on; at this level sedimentation of particles seems now to prevail over their influx. The time history of the stratospheric aerosol loading can be explained by El Chichón's position near the equator. There was only a slow meridional transport and a poleward homogenization of the stratospheric material in the northern hemisphere. Surely, part of the material also entered the stratosphere in the southern hemisphere.
"Important for an assessment of possible global climate affects is the change in the optical thickness. Before the eruption of St. Helens, its value was about 0.002, before the eruption of El Chichón, 0.022, and presently it is about 0.18. This means a considerable increase which, according to known models, suggests most probably a cooling of the earth's surface by some tenths of a degree within the next 1-2 years. In the stratosphere, however, warming is to be expected."
The following is from M. P. McCormick. "A dedicated El Chichón survey mission was flown on the NASA CV990 aircraft 8-20 May, 1983, from 71°N to 56°S (California - Alaska - S of New Zealand, and return to California). Previous missions were conducted on the NASA Electra aircraft in July and October-November 1982, and January-February 1983 and on the CV990 in December 1982. These flights were coordinated with measurements by satellites or balloons, or with in situ measurements aboard other aircraft.
"During the May 1983 flight, lidar profiles were obtained over the full latitude range, showing a definite peak in integrated stratospheric backscattering (related to optical depth or mass of stratospheric aerosols) at about 50-55°N. This agreed with lidar data collected during the January-February 1983 arctic mission. The May lidar profiles showed a well-defined southern boundary of the dense stratospheric aerosols between 40° and 50°N, with a minimum near 20°N, a small maximum near the equator, and a definite falloff to even lower values near 10°S. These data are preliminary at this time and are being processed for future publication. In addition to the airborne lidar measurements, other experiments conducted during the May 1983 flight included measurements of optical depth at visible and infrared wavelengths, radiation flux, and total SO2 and O3 column content."
Ground-based lidar in Hawaii and Virginia showed a continuing gradual (although somewhat irregular) decrease in total integrated backscatter. Peak backscattering remained similar.
Edward Brooks reported that bands of aerosols and brilliant dawns and twilights were visible on some days through mid-June from Jeddah, Saudi Arabia. Aerosol bands were seen early 22-24 and 26 May and impressive sunrises and sunsets were frequent during this period, some showing 2 distinct stages caused by illumination of unusually high layers. Optical effects declined 16-20 June, but weather conditions made observations difficult. From Millville, New Jersey, Fred Schaaf reported that only occasional observations were possible because of cloudy weather. Aerosols at moderate altitudes were illuminated 10 May and early sunset color was slightly enhanced 11 and 13 May. Jos‚ Caburian noted that fiery red sunrises and sunsets, seen in the Philippines for the previous several months, were not evident at the end of May and early June.
Recently erupted volcanic material from an unknown source was collected at 18-19 km altitude over the western US during a series of flights by a NASA U-2 aircraft 22-29 April. Samples from a 22 April mission flown at 37°N from near San Francisco (about 37.7°N, 122.5°W) to Topeka, Kansas (39.02°N, 95.68°W) included particles ranging from less than 0.1 µm to 20-30 µm in diameter: fragments of magnesian olivine, Cl-rich agglomerates, and H2SO4 droplets, plus a few glass shards, fragments of SiO2, and particles of copper and zinc oxide. The copper oxide-zinc oxide particles were similar to those found in previous aircraft samples of volcanic debris, with a characteristic 2:1 Cu to Zn ratio. During a flight from Topeka southward to Palestine, Texas 28 April, concentrations of volcanic material were less than on 22 April but remained above background levels. However, flying northward from Topeka to the U.S.-Canada border (49°N) the next day, particle concentrations were substantially higher, and the debris included many large fragments.
The source of the volcanic material remains uncertain. The samples were not similar to ejecta collected from the El Chichón aerosol cloud, and Raymond Chuan added that the large size of some of the particles suggests that the eruption probably occurred no more than about 2 months before the late April flights. Some large particles had been found in July 1982 samples from the El Chichón stratospheric cloud but none were recovered during flights in November 1982. Chuan also noted that a mid to high northern latitude source for the April 1983 material is suggested by the higher concentration of volcanic debris on more northern flight paths. No observations of early 1983 eruption clouds large enough to penetrate the stratosphere have been reported to SEAN. However, the largest clouds from the 8 April eruption of Asama (Japan, 36.40°N, 138.53°E) were produced before dawn and were not observed. Ashfall from this eruption extended more than 250 km ENE, reaching the coast of Honshu. Large plumes from Etna (Italy, 37.73°N, 15.00°E) have been observed from the ground and on satellite imagery during the eruption that began 28 March.
Lidar data from Mauna Loa, Hawaii showed an aerosol layer straddling the tropopause on 11 May that had not been present during the previous measurement on 4 May. This layer was narrow and well-defined, extending from 15.2-16.4 km altitude on 11 May and from 15.6-16.4 km on 28 May. Lidar data on 25 May seemed to show some mixing between the new layer and the base of the El Chichón material. Lesser amounts of aerosol were detected by lidar at 13-15.6 km on 8 June and 11.4-15.2 km on 29 June, but no upper tropospheric material was present 22 June. Clouds that were probably at too high an altitude to be cirrus persisted over Hawaii for several weeks and a corona and brilliant white aureole sometimes surrounded the sun. A relatively weak layer peaking at 13.5 km altitude was detected by lidar at Hampton, Virginia on 23 June but none was present at that level 22, 26, 27, or 30 June. Lidar data were not collected at Hampton between 22 March and 22 June. The relationship between these lidar observations and the fresh volcanic material collected during the NASA flight on 22 April is uncertain.
References. Labitzke, K., Naujokat, B., and McCormick, M. P., 1983, Temperature effects on the stratosphere of the April 4, 1982 eruption of El Chichón, Mexíco, in Pollack, J.B., Toon, O.B., Danielsen, E.F., Hofmann, D., et al., eds., 1983, The El Chichón volcanic cloud: An introduction: Geophysical Research Letters, v. 10, no. 11.
Reiter, R., et al, 1983, The El Chichón cloud over central Europe observed by Lidar at Garmisch-Partenkirchen during 1982: Geophysical Research Letters, v. 10, no. 11.
Information Contacts: R. Reiter, Garmisch-Partenkirchen, W. Germany; P. McCormick, D. Woods, and W. Fuller, NASA; T. DeFoor, MLO; E. Brooks, Saudi Arabia; F. Schaaf, Millville, NJ; J. Caburian, Manila, Philippines; R. Chuan, Brunswick Corp.
Cite this Report
El Chichón aerosols weaken gradually; new layer sometimes present near tropopause
Lidar data showed a continuing gradual decline in backscattering ratios from El Chichón aerosols. However, lidar in Hampton, Virginia and Fukuoka, Japan detected layers near the local tropopause that may have been from another eruption. A weak layer peaking at 13.5 km altitude was present over Hampton 23 June and aerosols were also observed at 9-14 km on 7 July and 11-13.5 km on 26 July. In July, this material was associated with a "double tropopause", a condition in which 2 temperature inversions were found instead of the single one that typically marks the boundary between the troposphere (where temperature decreases with altitude) and the lower stratosphere (where temperature increases with altitude). No aerosols were detected below the El Chichón material 12 and 27 July. From Fukuoka, new thin layers were observed 1-5 August between 12 and 16 km altitudes, at or below the local tropopause. The layers had fine structures of 100 m and were much more stable than the often-observed cirrus clouds in that altitude range, indicating the possibility that they were volcanic ejecta. Their peak scattering ratios were about 3-30 using YAG lidar. Aerosol layers were observed below the El Chichón material at Mauna Loa, Hawaii on some nights in May and June, but none were detected in July and early August. The source of this material and its relationship to the recently-erupted volcanic material collected in late April by a NASA aircraft over the central United States remain uncertain. Although the eruption of Una Una, Indonesia (0.17°S, 120.61°E) that began 18 July probably injected tephra into the stratosphere, meteorologists anticipated little northward migration of this material until autumn.
From Norwich, England, H. H. Lamb observed little change in optical phenomena. Skies in the direction of the sun continued to be whitish with much diffuse radiation; broken clouds seen against this background appeared an unusually pale gray. Clear twilight skies still produced abnormal colors, often bronze or sepia near the horizon, and whitish shades sometimes with a magenta or purplish patch above, in the direction of the sun. Before sunset, a fan-shaped area of brilliant bluish-white glow above the sun was common. On 30 June between 2245 and 2315 GMT (and probably for some time before and after) noctilucent clouds, structured like dense cirrus, were seen glowing strongly with a soft bluish-white light against the background of the brightest part of the twilight sky, between the horizon and about 9° elevation. The implied altitude of the clouds was about 80 km. Noctilucent clouds are rare at England's latitude and are seen only within about 2-3 weeks of the summer solstice. Lamb last observed noctilucent clouds a year or 2 after the 1963 Agung eruption, which injected large quantities of aerosols into the stratosphere.
Richard Keen reported that enhanced twilights returned to Boulder, Colorado on 14 June, after an absence of 5 months. Unusual twilights were observed 14 and 17 June, and 2-5, 13-14, 17, 22, and 24 July. The twilights were salmon-colored, with brightest and most pronounced coloring at solar depression angle (SDA) of 4°, disappearing on the horizon at SDA 5-6°. In addition, the 3, 13, and 17 July twilights included fainter purplish color that continued to an SDA of about 11°. None of the twilights were as bright as those seen in January, and they ended at somewhat smaller SDA's, suggesting that they were produced by aerosols at somewhat lower altitudes. Cloudy weather February-May made observations difficult but no unusual twilights were observed on clear evenings. Raymond Chuan began to see similar salmon-colored twilights about 10 July from Costa Mesa, California (33.65°N, 117.93°W) and these continued through the week of 18 July, but no enhanced colors were present in early August.
From Millville, New Jersey, Fred Schaaf observed twilight glows in June, July, and early August that were the strongest since January. Skies were whitened by volcanic aerosols 9 June and a 20° Bishop's Ring was seen the next evening. Purple light after sunset indicated aerosols to more than 8 km altitude 13-14 June. Faint but very late color 22 June was followed by a 2-stage twilight the next evening suggesting the presence of both lower-altitude material and aerosols extending to 24 km. Colors caused by high-altitude material were not evident 24-25 June but returned on the 26th, from aerosols at 24-27 km. Sunsets showed no evidence of high-altitude material for the rest of June, but Bishop's Ring was seen on the 30th. Poor weather prevented additional observations until 10 July, when a 2-stage twilight again indicated aerosols at low and high altitudes; if aerosols were being directly illuminated, continued color at 2200 suggests material extended to 40-48 km. Twilight was spectacular the next evening. Shortly after sunset, an intense narrow red band was observed, indicating strong low-altitude aerosols, but late color was also the strongest since January; if caused by direct illumination, aerosols reached more than 50 km altitude. Twilights were similar 12-13 July. Poor weather limited observations during the next 2 weeks. Moderately-colored 2-stage twilights were observed 22 and 26 July, with a mid-level layer at 13-19 km altitude. This layer was still present 27 July, but higher material seemed absent. Dawn observations 1, 2, and 5 August continued to show mid-level aerosols but no high-altitude material was observed.
Late June observations by Edward Brooks of dawns and twilights from Jeddah, Saudi Arabia were hampered by haze, sand, and occasional clouds. However, very early dawns, although often nearly colorless, suggested the presence of high-altitude aerosols. Brilliant dusk colors were observed 3 July and and faint bands of volcanic aerosols were observed with a very early dawn the next day.
Information Contacts: T. DeFoor, MLO; W. Fuller, NASA; M. Hirono, Kyushu Univ., Japan; R. Reiter, Garmisch-Partenkirchen, W. Germany; H. Lamb, Univ. of East Anglia, England; F. Schaaf, Millville, NJ; R. Keen, Univ. of Colorado; E. Brooks, Saudi Arabia; R. Chuan, Brunswick Corp.
Cite this Report
June-July balloon data show new layers near tropopause; only El Chichón aerosols detected by lidar in August
Balloon data from Laramie, Wyoming in June and July showed little change in the El Chichón stratospheric aerosol cloud. Maximum concentrations of about 5-6 particles (> 0.15 µm) per cm3 were measured at about 20 km altitude. A few small layers were also detected near the tropopause, perhaps from recent eruptions.
The profile of stratospheric aerosols from the March-April 1982 eruption of El Chichón remained almost constant during August over Fukuoka, Japan. Integrated backscatter of the aerosol cloud over Hampton, Virginia declined slightly in August from July values. New layers near the local tropopause, occasionally observed in recent months, were not reported in August.
From Millville, New Jersey, Fred Schaaf continued to observe moderate to strong twilight glows in August and early September. Primary glow shortly after sunset often blended with somewhat later purple light but faded quickly, indicating aerosol layers that reached a maximum altitude of 8-13 km. Two-stage twilights 14, 15, and 24 August were characterized by long intervals between illumination of the lower and higher layers. If late colors were caused by direct illumination of high-altitude layers, aerosol material was present to roughly 32-40 km altitude. Late colors were usually present, but were not observed 5-6 September. Schaaf noted that their occasional absence during evenings when early colors were visible suggests that they are produced by primary illumination of high-altitude layers rather than secondary glow from material at lower latitudes.
Information Contacts: W. Fuller, NASA; M. Hirono, Kyushu Univ., Japan; D. Hofmann, Univ. of Wyoming; F. Schaaf, Millville, NJ.
Cite this Report
El Chichón cloud remains over mid-latitudes
Lidar data from Fukuoka, Japan and Hampton, Virginia showed little change in the remnants of the stratospheric cloud ejected by the March-April 1982 eruption of El Chichón.
Edward Brooks resumed dawn and twilight observations from Jeddah, Saudi Arabia in late August. Bright colors were seen during some dawns and dusks in late August but colors became more intense in early September. NNW-SSE bands of aerosols were seen low in the W sky during brilliant dusks 12 and 13 September. During the evening of the 14th, faint N-S aerosol bands were visible, but their rapid fading suggested that they were at relatively low altitudes. Aerosol bands, trending N-S and NNW-SSE, were seen in the E sky at dawn 18-19 September. Colors remained brilliant through 24 September. Brooks noted that the very late twilight illumination at high sky angles observed at times since April 1982 would require particles to be present at altitudes near 100 km if caused by primary scatter. He suggests instead that secondary scattering from aerosols near 25 km altitude was responsible for late, high angle illumination.
From Millville, New Jersey, Fred Schaaf observed moderate to strong early and late twilight colors during the first half of September. After the arrival of a northern air mass 15 September, both early and late colors became weak. Moderately strong early and late colors returned 6 October. Schaaf noted that if late colors were caused by direct illumination of high-altitude aerosols (timing of illumination would indicate altitudes in excess of 70 km), they should have been unaffected by the northern airmass; the near disappearance of late colors in mid-September suggests that they are the result of secondary scattering from lower-altitude material.
Information Contacts: E. Brooks, Saudi Arabia; F. Schaaf, Millville, NJ; W. Fuller, NASA; M. Fujiwara and M. Hirono, Kyushu Univ., Japan.
Cite this Report
Lower stratospheric layer; source uncertain
Lidar data from Hampton, Virginia showed a sharp increase in backscattering from aerosols in the lower stratosphere on 27 October. Accompanying the enhanced aerosols was a lowered, multiple tropopause, with sever al temperature inversions (the strongest at 9.4 km) instead of the single one that usually marks the boundary between the troposphere and the stratosphere. Poor weather had prevented observations since 3 October, when backscattering integrated from the tropopause to 30 km altitude was only half the 27 October value. Four nights later, lower stratospheric backscattering had declined but was still somewhat enhanced, and the altitude of the tropopause was 2 km higher. Preliminary analysis of 8 November data indicated an additional decrease in the amount of lower stratospheric aerosols and a further rise in the tropopause altitude. The source of the enhanced aerosols could not be determined but NASA scientists suggested either a recent eruption (perhaps the 3 October Miyakejima activity) or El Chichón material transported southward by an arctic air mass from high latitudes, where it has recently been concentrated. No lower stratospheric layers were reported in October from Fukuoka, Japan.
From Jeddah, Saudi Arabia, Edward Brooks reported variable dawns and dusks; some were brief because aerosols were at lower elevation than before. Dusk on 28 September ended quickly and was the same color as the sun, indicating that the scatterers were at low altitude and relatively large. Two distinct periods of enhanced colors were observed at dusk 2 October and dawn on the 8th, suggesting illumination of layers at 2 altitudes. Dusks 10-11 October and dawn on the 11th ended quickly, indicating that the scattering layer was at low altitude. Dusks 29 September and 9 October produced no significant color enhancement.
Information Contacts: W. Fuller and P. McCormick, NASA; M. Fujiwara and M. Hirono, Kyushu Univ., Japan; E. Brooks, Saudi Arabia.
Cite this Report
El Chichón aerosols monitored by balloon, lidar, and sunset observations
Balloon data - Antarctica and Wyoming. University of Wyoming atmospheric scientists launched a balloon from McMurdo, Antarctica (77.85°S, 166.62°E) on 27 October. Aerosols with a size and altitude distribution typical of remnants of debris injected by El Chichón were detected between the tropopause (at 12 km) and 19 km altitude. The layer's broad peak was centered on 15 km, where concentrations of particles larger than 0.15 µm were about 6/cm3, similar to values observed over Laramie, Wyoming at the same latitude 6 days earlier (see below).
From 22 km to the top of the sounding at 33 km, the balloon passed through a zone of much smaller particles, reminiscent of the cloud of tiny condensation nuclei observed over Wyoming in early 1983 and (in lesser quantities) during previous springtimes. Maximum concentrations of particles larger than 0.01 µm reached 100/cm3 at 25 km altitude, an order of magnitude less than the maximum in the early 1983 cloud over Wyoming. A secondary peak was measured at 30 km altitude (20/cm3), and concentrations were increasing again (to 10/19cm3) shortly before the balloon burst at about 33 km.
Stratospheric temperatures were unusually warm during the 27 October balloon mission, rising from -75°C at the tropopause, to about -50 to -60°C at 25 km, (the altitude of peak CN concentrations), to -25°C at 33 km. Comparison of the peak CN concentration during the 27 October balloon launch with a particle coagulation curve suggests that roughly 16 days had elapsed since the evaporation event. Temperature profile data in the South Polar region is sparse, but weather soundings at the Pole show a warming from about -50°C at roughly 30 km altitude (10 millibars) on 6 October, to -30°C at the same altitude on 11 October. This temperature change is consistent with those observed in conjunction with CN events in the arctic.
Balloons were launched from Laramie, Wyoming on 21 October and 22 November. A double tropopause was detected during the 21 October mission, with temperature reversals at 11 and 15 km altitude. Each reversal was associated with an aerosol layer. The denser layer was at 15 km, where particle concentrations were 6/cm3 larger than 0.15 µm and 4/cm3 larger than 0.25 µm. On 22 November, the aerosol layer extended from the tropoopause, at 7.5 km altitude in arctic air, to 22 km, reaching peak particle concentrations of 9-10/19cm3 (>0.15 µm) at 13 km. A secondary peak of 0.3/cm3 at 30 km (a high concentration for that altitude), suggested that equatorial air was present above the arctic air. Ratios of particles larger than 0.15 µm to those larger than 0.25 µm were similar to a month earlier, remaining at about 1.5, a value characteristic of the El Chichón aerosols but in distinct contrast with ratios of 4-5 for most volcanic aerosol clouds. Hofmann noted that multiple aerosol layers and complex boundaries between troposphere and stratosphere are often seen over mid-latitudes in the autumn, when air from polar regions is present at low altitudes while higher-altitude air has been transported from equatorial regions.
Lidar data. From Mauna Loa, Hawaii aerosol profile shape and backscattering values became increasingly variable in the autumn. The 13 September and 19 October profiles were jagged, with many small peaks. The 10 August profile was smooth; the 6 October pattern was similar but with a single new peak superimposed. On 9 November, a layer only 30-60 m thick was present between 15 and 16 km, just below the tropopause. On 30 November, backscattering increased very steeply from the base of the aerosol layer, dropping off above 21 km. At Hampton, Virginia, lidar data in late October and November showed variable aerosol profiles. When the jet stream moved south of Hampton, it transported polar air containing lower stratospheric aerosols into the region. Bases of aerosol layers in both the polar and tropical air masses were near the tropopause, several km lower in polar air than in tropical air (roughly 10 km vs 15 km). "Polar" aerosols were emplaced beneath the higher-altitude "tropical" layers, approximately doubling integrated backscattering values over Hampton in polar airmasses. A distinct layer at 18.5-19.8 km observed 29 and 30 November did not appear to be part of this pattern and its source is uncertain. This layer was not present 8 December. Late November lidar data from Fukuoka, Japan were very similar to late October results.
Unusual sunrises and sunsets. From Norwich, England, H. H. Lamb provided the following report.
"Abnormal coloured sunset and twilight glows presumed associated with the El Chichón eruption's stratospheric cloud have continued to be observed on almost any clear evening. In July, August, and September, the most regularly noticeable anomalies were cold yellow to sepia or stone-coloured twilights, later turning fiery red at the horizon. Frequently a nearly circular beautiful purple to rose patch of softer colour, some 10° of arc or a little more in diameter, was present above the horizontal yellow-brown layers of colour. The timing of the decline in elevation and ultimate disappearance of the purple/rose patch consistently indicated a height of about 20 km for the layer responsible throughout the period from late July to 14 October. On 5, 6, and 25 September and again on 7 October the purple/rose patch merged or extended into crepuscular rays in the same colour, the timing of which was used to derive the probable height of the layer.
"Since mid-October the displays have become more brilliant again and greater heights have been indicated for the active layer. On 21 October, the after-sunset glow was a brilliant fiery red along the horizon and at 1750 GMT a roughly circular purple patch of light developed strongly to over 20° elevation. This indicates a layer above 50 km height unless some secondary scattering effect was responsible. But on 24, 29, and 30 October a purple patch which later turned to rose pink became strongly illuminated about 1700 GMT up to 30° elevation, declining in elevation to 20° by 1707 and to 10° as it faded quickly about 1710. Over these dates a height of about 27 km is consistently indicated by these timings.
"It is not known whether this renewal of the optical effects and evidence of greater heights should be attributed to fresh dispersal of El Chichón material from other latitudes and/or other heights by the seasonal changes of the winds or whether a new stratospheric veil is involved."
Richard Keen continued to observe colorful twilights from Boulder, Colorado. An enhanced, salmon-colored twilight with maximum brightness and coloration at an SDA of 4° occurred 28 July. Similar twilights were observed 3 and 11-13 September (no observations were made in August). These included a fainter purplish glow to an SDA of 9°, similar to twilights of 3, 13, and 17 July. Strong double twilights, comparable to those seen from Boulder in November 1982 and January 1983, occurred 15-16 and 21 September, 3-6, 22, and 24-26 October, and 3, 6, 12, 14, and 23 November. They typically consisted of an enhanced salmon-colored 4° SDA primary twilight followed by a deep red secondary twilight to an SDA of about 17°. Keen had earlier noted that an aerosol layer at about 20 km altitude would have to extend about 1500 km W of a given observation point for secondary twilight illumination to occur. He suggests that a second requirement appears to be the absence of cirrus clouds in the same range. Satellite imagery showed that middle and high-altitude weather clouds were absent for 1500 km W from Boulder during all such observations, and these conditions were successfully used to predict double twilights.
Edward Brooks continued to observe some bright dawns and dusks through mid-November from Jeddah, Saudi Arabia. Colors were often strong in late October and sometimes reached 40° elevation, but illumination was usually most intense within a few degrees of the horizon. In early November, dawn and dusk colors were typically present only near the horizon; on the 8th, the absence of early dawn colors and the brief late dawn illumination low in the sky suggested that the scattering layer was at lower altitude than before. In mid-November, the onset of variable autumn weather coincided with frequent changes in dawns and dusks, which ranged from prolonged and bright-colored to brief and subdued.
From Millville, New Jersey, Fred Schaaf observed strong twilight colors in October. The timing and extent of illumination 10 October suggested an aerosol altitude of little more than 8 km. Strong 2-stage twilights were seen 27-28 October. Twilight effects weakened suddenly 30 October as arctic air moved into the area, as had occurred in mid-September, and remained weak through early November. Double twilights returned 8 November, when first-stage aerosol illumination ended at a time indicating that the top of the layer was at about 16-19 km. On the 12th, the arrival of arctic air again coincided with the weakening of twilight colors. In late November, colors were often intense but the aerosols appeared to be lower, with the top of the illuminated layer estimated at 11-13 km on the 29th.
Information Contacts: D. Hofmann, Univ. of Wyoming; R. Reiter, Garmisch-Partenkirchen, W Germany; T. DeFoor, MLO; W. Fuller and P. McCormick, NASA; M. Fujiwara and M. Hirono, Kyushu Univ., Japan; H. Lamb, Univ. of East Anglia, England; R. Keen, Univ. of Colorado; E. Brooks, Saudi Arabia; F. Schaaf, Milleville, NJ.
Cite this Report
Balloon and lidar data and colorful sunsets indicate continued presence of El Chichón aerosols
Balloon data - Wyoming. Particle counters on a balloon flight from Laramie, Wyoming 14 December detected a layer of tiny condensation nuclei (CN), centered at about 30 km altitude. Particle concentrations reached about 200/cm3, compared to background values of about 10/19cm3 at that altitude. Temperatures at 30 km altitude had warmed to -30 to -35°C on 10-11 December. David Hofmann noted that particle concentrations observed on the 14th were consistent with values that would be expected in a CN cloud produced a few days earlier.
Data on larger particles were collected during a balloon flight 21 December. The base of the aerosol layer was just above the tropopause (at about 8 km altitude, indicating an arctic air mass). Maximum particle concentrations of about 10/19cm3 (larger than 0.15 µm) were detected at about 12.5 km, declining gradually to about half that value at 18 km and 10% of the peak at 23 km. No distinct sublayers were observed.
Lidar data. In December, lidar at Mauna Loa, Hawaii detected slightly less stratospheric aerosol, as measured by total integrated backscattering, than in October and November. On 7 December, major backscattering peaks, marking the strongest aerosol layers, were separated by only small decreases in values; the 23.2 km layer was the strongest among several sharp peaks. The 2 major layers were well-defined on 14 December. On the 28th, each had a broad, smooth shape and backscattering values dropped sharply between them. At Hampton, Virginia peak backscattering remained somewhat enhanced over lowest summer values. The aerosol profile was considerably more irregular on 3 January than during the previous reading 7 December. The 12 January data at Fukuoka, Japan showed a broad monolayer that included most aerosols below 21 km.
Unusual sunrises and sunsets. From Jeddah, Saudi Arabia, Edward Brooks reported that dawn and twilight colors diminished in late November. Dawns showed no evidence of the presence of a volcanic aerosol layer over nearby Saudi Arabia 28 November - 6 December. Colored but rather subdued dawns indicated that aerosols returned during the second week in December. On 18 December, only the late dawn had significant color, indicating that the aerosol layer was at relatively low altitude. Separate early and late dawn illumination 24 December showed the presence of 2 scattering layers, at high and low altitudes respectively.
Information Contacts: D. Hofmann, Univ. of Wyoming; T. DeFoor, MLO; W. Fuller and M. Osborn, NASA; M. Fujiwara and M. Hirono, Kyushu Univ., Japan; E. Brooks, Saudi Arabia.
Cite this Report
El Chichón cloud persists; lidar data to N Pole
NASA Airborne Lidar Mission, 37°N-North Pole. The following is a report from M. P. McCormick. "An airborne lidar mission was flown 19-28 January on the NASA Electra aircraft from 37°N to the North Pole, via Goose Bay, Labrador, and Söndre Strömfjord and Thule airbases, Greenland. The primary objective of the mission was to provide correlative stratosperic aerosol measurements for the SAM II (Stratospheric Aerosol Measurement) satellite, successfully accomplished on 3 separate satellite underflights.
"The El Chichón cloud was very consistent from 37°N-76°N, generally as a single broad layer with very little structure. From Thule a flight was conducted 24 January to the North Pole along the 60° W meridian to determine the northerly extent of the El Chichón material and to search for polar stratospheric clouds (PSC's, see below). As the aircraft proceeded north from Thule, considerable structure and varied intensity were observed in the El Chichón cloud, with an increase in peak scattering ratio.
"First detected by the SAM II satellite, PSC's are thought to be ice clouds that form during the Arctic and Antarctic winter by freezing of diluted sulfuric acid-water aerosol droplets at temperatures less than about -80° to -85°C, followed by rapid growth by sublimation (McCormick et al., 1982, and Steele et al., 1983). Nacreous or mother-of-pearl clouds are thought to be subsets of PSC's. From 85°N to the Pole, PSC's were detected for the first time by a remote sensor other than SAM II. They occurred at 19-21 km altitude, above the main El Chichón layer.
"A second flight was conducted 25 January from Thule to 86°N and PSC's were again detected within the temperature region of -85°C from about 81°N - 86°N. A third mission was flown 27 January from Thule to 87°N over the same flight path (60° meridian) and somewhat to the east. The El Chichón layer decreased in intensity and was less structured. There were no indications of PSC's, correlating with stratospheric temperature data, which showed that the low-temperature region had moved over the north pole toward Siberia. Returning to Virginia on 28 January, the same consistency was observed in the stratospheric layer as on the earlier northbound flight, with a slight decrease in peak scattering ratio.
"In addition to the uplooking airborne lidar, a downlooking lidar was used to study the tropospheric aerosols. In-situ measurements of aerosol mass and number density, CO2 and O3 were made over the full flight range at various altitudes during the mission.
Lidar data. At Mauna Loa, Hawaii, a distinct double aerosol layer was observed 3 January, similar to the pattern observed in December. No strong upper peak was present a week later, but numerous small layers were detected above the main lower peak. On 19 January, enhanced higher-altitude layers were no longer detected. Two distinct layers were observed over Fukuoka, Japan on 10 February, in contrast to the broad monolayer present a month earlier.
Lidar at Garmisch-Partenkirchen, West Germany continued to detect aerosols from the March-April 1982 eruption of El Chichón. Altitude and values of peak backscattering were slightly lower than in the summer but secondary peaks at higher altitudes were sometimes detected. Integrated backscattering between 1 km above the tropopause and the top of the aerosol layer, about 20% below expected values in the second half of September and the first half of October, rose to 70% above expected values 14 November as the tropopause altitude dropped to 9.9 km in arctic air and backscattering was enhanced between 9 and 13 km.
Unusual sunrises and sunsets. Edward Brooks reported that dawns and dusks indicated a variable and often weak aerosol layer over Jeddah, Saudi Arabia in late December and early January. Morning and evening colors on 26 December suggested that few scattering particles were present at either low or high altitudes. Stronger sunrises and sunsets were observed 27-30 December, but only late dawn colors, illuminating low-altitude aerosols, were visible 31 December. Dawns were essentially colorless 3 and 7-9 January; only late dawn colors (aerosols at low altitude) were visible on the 4th, while only early dawn colors (high-altitude material) were seen 2 days later.
From Millville, New Jersey, Fred Schaaf reported that twilight colors were usually weak to moderate in December and early January. On 16 December, early twilight colors merged into a strong crimson glow at 12° altitude, suggesting that the top of the scattering layer was at 13-18 km altitude. Colors were strong again the following evening and included secondary illumination to a solar depression angle of about 12°. As in previous months, the arrival of arctic air 24 December weakened twilight colors. On 8 January, weak to moderate colors were replaced suddenly by a milky area at 12° altitude, indicating the top of the aerosol layer at 13-16 km. The same evening, a secondary glow remained visible to an SDA of 10°. On 12 January, the time that illumination ended suggested that highest aerosols were at 11-13 km. Only early twilight colors were visible 19 January. A week later, timing of the end of purplish illumination indicated that aerosols reached 16-19 km altitude and a deep-hued secondary glow persisted for much longer. However, colors were very weak the following night. On 1 February, moderate colors disappeared at a time indicating aerosols reached 11-16 km.
References. McCormick, M. P., Steele, H. M., Hamill, P., Chu, W. P., and Swissler, T. J., 1982, Polar stratospheric cloud sightings by SAM II: Journal of the Atmospheric Sciences, v. 39, no. 6, p. 1387-1397.
Steele, H. M., Hamill, P., McCormick, M. P., and Swissler, T. J., 1983, The formation of polar stratospheric clouds: Journal of the Atmospheric Sciences, v. 40, no. 8, p. 2055-2067.
Information Contacts: P. McCormick, NASA; R. Reiter, Garmisch-Partenkirchen, W. Germany; T. DeFoor, MLO; M. Fujiwara and M. Hirono, Kyushu Univ., Japan; E. Brooks, Saudi Arabia; F. Schaaf, Millville, NJ.
Cite this Report
Lidar still detects aerosols but dawn/twilight colors decrease
Lidar data. Lidar data from Mauna Loa, Hawaii showed a substantial decrease in total aerosol backscatter between measurements on 1 and 15 February. Total backscatter as well as altitudes and values of peak backscatter were nearly identical on 15, 22, and 29 February but shapes of aerosol profiles varied somewhat. A broad, single layer without fine structures was detected over Fukuoka, Japan on 11 March. Two distinct layers had been seen from Fukuoka a month earlier. Total backscatter over Hampton, Virginia remained at roughly double the Mauna Loa values. Three distinct layers were observed 8 February, but the aerosol profile showed a single broad layer on 21 February and 1 March.
Unusual sunrises and sunsets. From Boulder, Colorado, Richard Keen reported that unusual twilights were not seen during December. However, Keen notes that clear skies for 1,500 km to the west of the observation site are necessary to generate double twilights, and December weather was usually poor. Double twilights, with salmon color at 4° SDA followed by persistent deep red secondary color, were observed on 2, 4, 6, and 7 January. Double twilights were also observed on 24, 28, and 30 January, and 5-6 February, but were not as bright as those in late 1983 or early January 1984. The secondary twilights of late January-February were also not as persistent; at the end of red secondary glow, SDA was 16° on 4 January, 14° on 28 January, 13° on 30 January and 12° on 6 February. Keen notes that these observations imply a thinning and/or lowering of the aerosol layer. No double twilights have occurred at Boulder from 6 February through early March, but skies west of Boulder were again frequently cloudy.
Optical effects at Jeddah, Saudi Arabia were often weak in late January and February. From sunset 25 January to sunrise 28 January dusk and dawn observations by Edward Brooks indicated that aerosol scatterers were nearly absent. Only early dawn colors (higher altitude aerosols) were seen 1, 2, and 4 February. Of the twilights between 1 and 9 February, only on the 6th did colors indicate a strong scattering layer. Brighter dusks and dawns were more frequent from mid-February, but scattering effects remained inconsistent. No dawn colors were visible 21, 25, and 27 February and colors were subdued on many other mornings and evenings late in the month.
Fred Schaaf reported that twilight effects at Millville, New Jersey in February and early March were the weakest since aerosols from the March-April 1982 El Chichón eruption first arrived over the area. Frequent cloudy weather limited observations. Little or no high-altitude aerosol material appeared to be present and colors produced by lower altitude material had diminished.
Information Contacts: T. DeFoor, MLO; W. Fuller, NASA; M. Fujiwara and M. Hirono, Kyushu Univ., Japan; R. Keen, Univ. of Colorado; E. Brooks, Saudi Arabia; F. Schaaf, Millville, NJ.
Cite this Report
Aerosols persist at mid-latitudes; sunset reports
Unusual sunrises and sunsets. Paul Handler observed brilliant twilights 11-18 March from Guana Island, British Virgin Islands (18.50°N, 64.62°W). Skies 30-45° above the horizon were tinted lavender pink and colors remained for 36-37 minutes after sunset, suggesting the presence of aerosols to about 18 km altitude (Meinel and Meinel, 1983). Yellowish-green illumination was observed one evening, and green clouds were seen around sunset during the week before Handler's visit. The source of the aerosols was unknown.
From Jeddah, Saudi Arabia, Edward Brooks observed few colorful dawns and twilights in early March. Little stratospheric aerosol material appeared to be present, and the bright yellow dawns of 9 and 12 March were the only colorful ones observed during the first half of the month. Effects of stratospheric aerosols were occasionally observed in late March, but colors were not usually strong. Pale colors were seen 17-21 March. The absence of late dusk illumination 22 March indicated that there were no significant aerosols in the stratosphere, and scatterers appeared scarce the next morning. The brief dusk color sequence 30 March indicated a thin layer of aerosols. Dawns were bright and began early 31 March and 1 April, suggesting the presence of high aerosol layers. Dusks and dawns were strong during the first 3 days of April.
Lidar data. Lidar data from Fukuoka, Japan showed two backscattering peaks 28 and 29 March; on the 29th the lower peak was below the local tropopause. Layer altitudes and peak backscattering were very similar 1, 7, and 14 March at Hampton, Virginia, but integrated values were substantially lower on the 7th. More structure was evident on 2 April and integrated backscattering had dropped again to below 7 March levels. Data collection from Mauna Loa, Hawaii was curtailed by the onset of the eruption 25 March. Integrated backscattering has remained very similar since 16 February. Two layers were evident 7 and 13 March, but a broad, multiple-peaked layer was present on the 21st.
Reference. Meinel, A.B., and Meinel, M.P., 1983, Sunsets, twilights and evening skies: Cambridge University Press, Cambridge, England.
Information Contacts: P. Handler, Univ. of Illinois; E. Brooks, Saudi Arabia; M. Fujiwara and M. Hirono, Kyushu Univ., Japan; T. DeFoor, MLO; W. Fuller, NASA.
Cite this Report
Stratospheric aerosols decrease
Lidar data from Fukuoka, Japan and Hampton, Virginia showed generally weaker stratospheric aerosol backscattering in April. On 22 April, the lidar profile at Fukuoka showed a broad single layer that decreased gradually upward from 17 km. At Hampton, integrated backscattering on 25 and 26 April was only half that on the 11th, and lower than values measured in previous months. Lava from the March-April eruption of Mauna Loa cut electric power lines to Mauna Loa Observatory and no lidar data has been collected there since 21 March.
Edward Brooks reported that dawn and dusk colors at Jeddah, Saudi Arabia were variable but generally unimpressive in April, continuing the trend of recent months. Dawn colors were bright 1-3 April and remained bright on the 4th and 5th, but no late dusk colors were observed, indicating the absence of high-altitude aerosols. Dawn was colorless 7 April and faint 8-11 April. A bright dusk 11 April and dawn the next morning were followed by cloudy weather through the 14th. Dawn and dusk were colorless on the 15th, but moderately strong from the 16th through dawn on the 21st.
Information Contacts: W. Fuller, NASA; M. Fujiwara and M. Hirono, Kyushu Univ., Japan; E. Brooks, Saudi Arabia.
Cite this Report
Volcanic aerosols remain in stratosphere
Lidar continued to detect remnants of the aerosol cloud produced by the March-April 1982 explosions from El Chichón, México. Peak backscattering ratios decreased at Fukuoka, Japan, where 2 layers were evident. Altitudes and peak backscattering ratios of the main layers at Hampton, Virginia were similar in April and May. However, measurements made in an Arctic airmass 16 May yielded a total backscatter nearly twice as large as it had been a week earlier in tropical air. Aerosols were relatively dense down to the tropopause, at 11 km altitude on the 9th and 9.6 km on the 16th. On 24 May, many small layers were present, the tropopause was much higher (13.5 km), and total backscatter had decreased to late April levels. Little structure was evident in the aerosol material 4 June. Values from Garmisch-Partenkirchen, Germany showed minor variation between January and April, but were generally slightly lower than in late 1983. Lidar measurements resumed 30 May at Mauna Loa Observatory. Peak and total backscattering had decreased slightly since late March.
From Jeddah, Saudi Arabia, dawns and dusks observed by Edward Brooks varied in intensity. Moderately strong colors observed from 16-21 April persisted through dawn on the 23rd, but were only intermittently present through the end of the month. Weak dawns and twilights from 30 April through the dawn of 6 May suggested that little or no aerosol material was present. Moderate colors returned late 6 May and dusk on the 9th was long and strongly illuminated, indicating the presence of high-altitude aerosols. Dawns and twilights were colorful through 14 May, and faint N-S bands of high-altitude aerosols were visible at dawn on the 11th. Morning and evening colors were again absent 15-18 May, then clouds prevented observations through the 22nd. Moderate colors were present 23-24 May but were weak the following 2 days.
Information Contacts: R. Reiter, Garmisch-Partenkirchen, W Germany; W. Fuller, NASA; M. Fujiwara and M. Hirono, Kyushu Univ., Japan; T. DeFoor, MLO; E. Brooks, Saudi Arabia.
Cite this Report
Atmospheric turbidity over Japan declines gradually from late 1982 to early 1983 peak; lidar shows persistent aerosols
Toyotaro Yamauchi and Hidehiro Shimura report that atmospheric turbidity over Japan (figure 5) reached a maximum between late autumn 1982 and spring 1983. Atmospheric turbidity has decreased gradually since then, but was still considerably higher than normal during the winter of 1983-84. At noon on clear days in December 1982, direct solar radiation (I) and global solar radiation (G) showed decreases of 0.17 kW/m2 (20%) and 0.02 kW/m2 (3%), and diffuse solar radiation (D) a 0.07 kW/m2 (74%) increase at Tsukuba, Japan (36.17°N, 141.09°E) as compared to a normal year. In December 1983, I was 0.05 kW/m2 (6%) lower and D was 0.02 kW/m2 (26%) higher than a normal year at Tsukuba, while G was approximately normal (figure 6).
 |
Figure 5. Three measures of aerosol content of the atmosphere; (top) variation in atmospheric turbidity (t0), (center) transmissivity (A), and (bottom) direct solar radiation (I), for all stations in Japan, 1950-1983. The largest changes followed the eruptions of Agung in 1963 and El Chichón in 1982. Courtesy of T. Yamauchi and H. Shimura. |
 |
Figure 6. Monthly means of direct, diffuse, and global solar radiation observed at noon on clear days at Tsukuba, Japan. [Note that the decline in direct solar radiation after the 1982 El Chichón eruption is mirrored by an increase in diffuse radiation as the aerosol cloud scatters sunlight.] Courtesy of Minoru Obata, Aerological Observatory. |
Lidar at Mauna Loa, Hawaii continued to detect stratospheric aerosols from the March-April 1982 eruption of El Chichón. Altitude and peak backscatter of the main layer remained similar through June. A small peak in the upper troposphere or lower stratosphere was also observed throughout the month. Particularly pronounced on 14 June, it was distinctly weaker although still evident on the 29th. There was no obvious single source for this layer, although moderate explosions had occurred at low latitudes at several volcanoes in previous weeks, including Pagan (Mariana Islands), Soputan (Indonesia), and Manam (Papua New Guinea). A similar layer was present over Hampton, Virginia in late May, but a distinct lower layer was not reported from there in June. Altitude and backscattering of the main layer were relatively uniform through the month, but a lower tropopause on the 25th (10.5 km) was accompanied by an increase in total backscatter.
Information Contacts: T. Yamauchi and H. Shimura, JMA; T. DeFoor, MLO; W. Fuller, NASA.
Cite this Report
El Chichón aerosols persist in stratosphere
July lidar data indicated the continuing presence of stratospheric aerosols from El Chichón. A small layer in the upper troposphere or lower stratosphere over Mauna Loa, Hawaii in June was still present in July, although somewhat weaker. Layer altitudes, and values of peak and integrated backscatter at Hampton, Virginia in early July and early August were similar to late June figures. Collection of lidar data resumed at Fukuoka, Japan in mid-July. A single layer was reported in contrast to the pair of layers observed in May.
Brightness and duration of July twilights at Boulder, Colorado were the strongest since January, but Richard Keen noted that it was difficult to determine whether the cause was less cloudiness west of Boulder or the presence of thicker and/or higher aerosols. Bright salmon-pink topinkish-lavender twilights, peaking in color intensity at an SDA of 4-5°, were observed 20 March, 14-15 April, 7 May, 1-5 and 16-18 July, and 2 August. Rather dim reddish secondary twilight colors persisted to an SDA of 9° on 14-15 April. Brighter red secondary twilights remained visible to an SDA of 9° on 4 July, 11° on the 5th and 16th, 12° on the 17th and 13° on the 18th. Keen related the general lack of twilight effects March-June to frequent high-level coloudiness over the western United States in the spring. Dates in July without twilight effects corresponded to dates of thunderstorm activity over the Great Basin. Late May - early June dawns observed by Edward Brooks from Jeddah, Saudi Arabia were later than those of the previous year, indicating a significant reduction in stratospheric aerosols. Brooks noted that observations during the second week in June showed no firm evidence of volcanic aerosols in the stratosphere. Fred Schaaf noted that twilight glows were sometimes visible from Millville, New Jersey in June and July, after having been nearly absent March-May. Timing and position of the glow suggested maximum aerosol altitudes of little more than 8 km.
Information Contacts: R. Keen, Univ. of Colorado; E. Brooks, Saudi Arabia; F. Schaaf, Millville, NJ; M. Fujiwara and M. Hirono, Kyushu Univ., Japan; T. DeFoor, MLO; W. Fuller, NASA.
Cite this Report
10 years of lidar data from Virginia summarized
H. H. Lamb's report describes observations from Holt, England (52.9°N, 1.1°E), about 30 km N of Norwich, his previous observing site.
"Twilight optical effects presumably attributable to the remnants of the El Chichón aerosol remained visible on clear evenings in November, 1983, but then became less noticeable and in early 1984 seemed generally weak. After a long period in which an untrained observer would surely have noticed nothing unusual about the twilight glows, on 19 August pink crepuscular rays reached 20-22° elevation at 1945-1950 GMT, about a half-hour after sunset, indicating an illuminating layer at about 25-27 km altitude."
Little variation was seen in aerosol profiles measured by lidar at Mauna Loa, Hawaii in August and at Hampton, Virginia in August and early September. Integrated backscattering at Mauna Loa was consistently higher in August than in July; values dropped somewhat at Hampton. The lidar profile at Mauna Loa suggested that aerosols extended downward several km into the troposphere from the stratospheric layer. Figure 7 shows changes in stratospheric aerosols over Hampton during the past 10 years, with timing of large explosive eruptions.
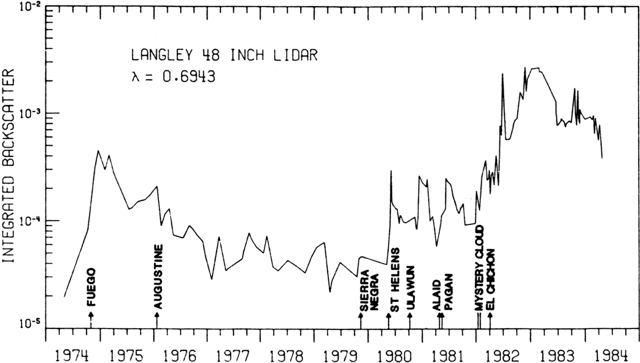 |
Figure 7. Atmospheric effects of some large explosive eruptions, 1974-1984. Integrated backscattering measured at the 48-inch lidar at Hampton, Virginia. Courtesy of the NASA Langley Research Center. |
Information Contacts: H. Lamb, Univ. of East Anglia, England; W. Fuller, NASA; T. DeFoor, MLO.
Cite this Report
Two years of lidar data from Germany summarized
Lidar and balloon data showed that aerosols from the March-April 1982 eruption of El Chichón remain in the stratosphere. Despite the 15-km eruption clouds reported during the Mayon eruption, no new aerosol layers were detected. At Mauna Loa, Hawaii, integrated backscattering values were lower in September than in August. Cirrus clouds were abundant throughout the month, masking any upper tropospheric aerosols that might have been present. A sunrise during clear weather in early October did not show any apparent aerosol layers. At Hampton, Virginia, a very broad backscattering peak and somewhat increased integrated backscatter were measured 6 September, but a profile with a narrower peak on 19 September (the last measurement of the month) yielded integrated values lower than in August. September values from Fukuoka, Japan were similar to those from the last measurement in mid-July. April-June lidar data from Garmisch-Partenkirchen, Germany show a gradual decrease in backscattering from stratospheric aerosols. A 3-dimensional representation of the structure of the aerosol profile since early 1982 is shown in figure 8. Balloon data from Laramie, Wyoming have continued to show slow decay of the El Chichón aerosols. No material from Mayon was evident during a flight 6 October.
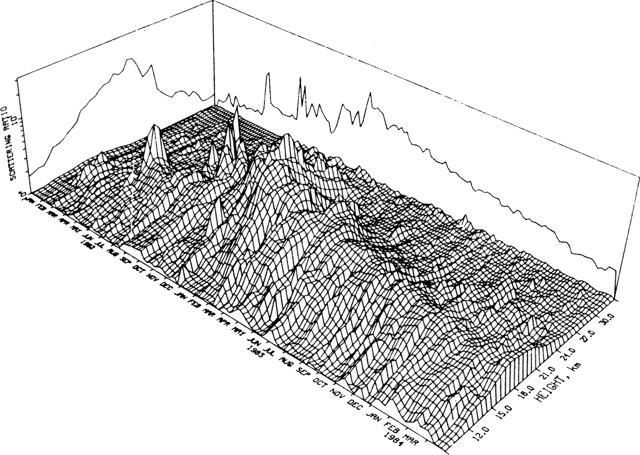 |
Figure 8. Development and gradual decay of the El Chichón aerosol cloud over Garmisch-Partenkirchen, West Germany, January 1982-March 1984. The aerosol profile structure is represented in three dimensions. Courtesy of Reinhold Reiter. |
Information Contacts: R. Reiter, Garmisch-Partenkirchen, W. Germany; T. DeFoor, MLO; M. Osborn, NASA; M. Fujiwara and M. Hirono, Kyushu Univ., Japan; J. Rosen, Univ. of Wyoming.
Cite this Report
Lidar data from Italy and Germany
Lidar at Garmisch-Partenkirchen, Germany continued to detect remnants of the stratospheric aerosols from the El Chichón eruption. Peak backscattering ratios were somewhat lower in the summer and early autumn than they had been in the spring. At Firenze, Italy (43.8°N, 15.25°E), lidar data were collected April 1982-March 1984 by the Istituto di Ricerca Sulle Onde Electromagnetiche (figures 9 and 10). Integrated backscattering increased from just after the El Chichón eruption through early 1983, then declined gradually. At Hampton, Virginia, integrated backscattering was about the same in late October as in mid-September. A relatively weak secondary layer appeared to be present above the main layer of El Chichón material. Integrated backscattering varied considerably in October at Mauna Loa, Hawaii. An intense layer observed 30 October between a double tropopause at 15 and 15.3 km was probably cirrus cloud; below 13 km several layers appeared on the lidar data and cirrus were visible to the naked eye. At Fukuoka, Japan, increases in peak and integrated backscattering were noted for several days beginning 8 October between 9 and 22 km. Values rose to about 1.8 times seasonal means, then returned to previous levels.
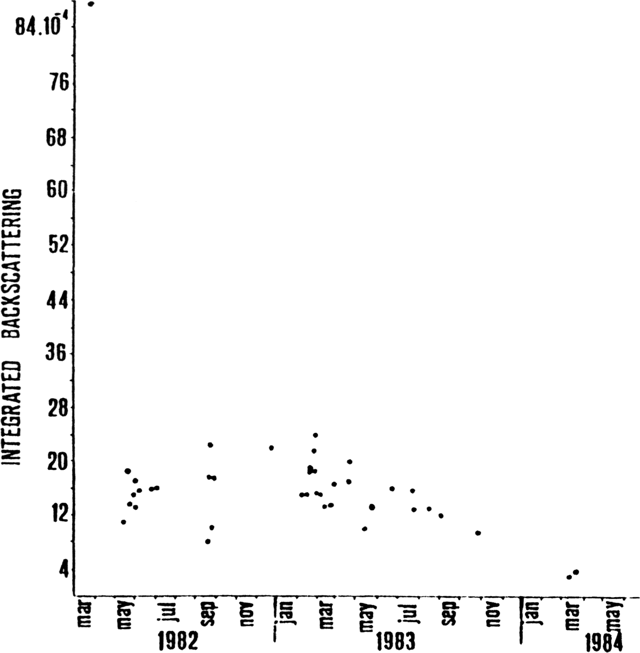 |
Figure 9. Arrival and decay of the El Chichón aerosol cloud over Firenze, Italy, April 1982-March 1984. Integrated backscattering measured by Nd-YAG lidar (with second harmonic generator, producing a wavelength of 0.53 microns). Receiving optics were redesigned and new acquisition and processing software written in fall 1982. Prior data were from a system designed for detecting lower tropospheric aerosols and are thus less reliable. Courtesy of Leopoldo Stefanutti. |
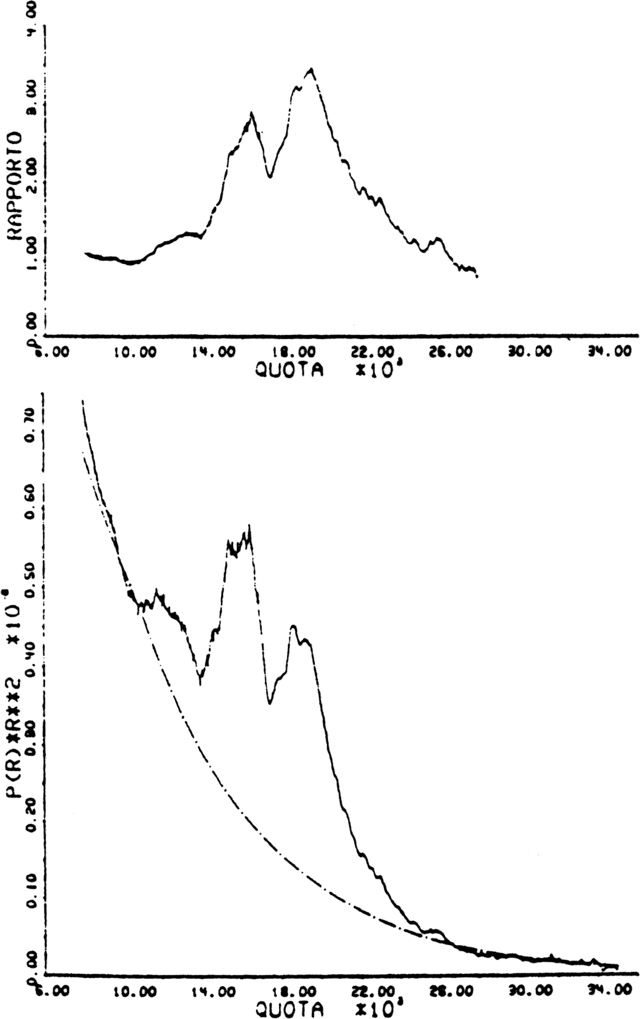 |
Figure 10. Profile of volcanic aerosol layers over Firenze, Italy, 18 February 1983, about the time of maximum enhancement (figure 9). Backscattering ratios (top) and coefficients (bottom) vs. altitude, from Nd-YAG lidar data. The dashed line on the lower graph represents the US standard atmosphere. Courtesy of Leopoldo Stefanutti. |
M. Patrick McCormick and Thomas Swissler provided the following information about the relationship between backscattering ratios measured by lidar at wavelengths generated by ruby (0.6943 µm), and Nd-YAG (1.064 and 0.532 µm) laser transmitters. For any two wavelengths, the relationship can be expressed as:
(1) (R1-1) = (N1/N2)4-x (R2-1) where R1 and R2 are backscattering ratios produced by lidar operating at wavelengths N1 and N2. The value of x varies with the aerosol size distribution at a given time. Using techniques described in McCormick et al., (1984), McCormick and Swissler calculated values of x for a typical background aerosol size distribution (no significant volcanic contribution) from Russell et al. (1981) and for the aerosols measured by Hofmann using a 6-channel dustsonde on 24 August and 21 December, 1983 (about 17 and 21 months after the March-April 1982 eruption of El Chichón). After calculating x, equation (1) can be simplified to:
(2) (R1-1) = k(R2-1)
By substituting k values into equation (2) from the appropriate model in table 1, lidar data of different frequencies can be made approximately comparable.
Table 1. For each of three aerosol models, values of k relating pairs of lidar frequencies are shown. Values of x used to derive k for each model are also shown. Subscripts of k show the two frequencies being compared, where r = ruby (0.6943 µm), y = Nd YAG (1.064 µm), and g = Nd YAG 2nd harmonic (0.532 µm). In addition to the Russell and Hofmann models, Hirono's value of 0.4 for k(r,y) is extrapolated for k(g,y) and k(g,r).
| Aerosol model | x | k(r,y) | k(g,y) | k (g,r) |
| Hirono (SEAN 07:05) | 1.85 | 0.40 | 0.23 | 0.56 |
| Russell et al. 1981 | 1.60 | 0.36 | 0.19 | 0.53 |
| Hofmann 24 Aug and 21 Dec 1983 | 0.90 | 0.27 | 0.12 | 0.44 |
From Millville, New Jersey, Fred Schaaf continued to observe unusual twilight colors. From mid-July through mid-September, weak to moderate primary glows were usually present, and purple and crimson colors were often observed for somewhat longer after sunset. Timing of the disappearance of later colors suggested that aerosols were present to at least 8-13 km. Strong crepuscular rays were observed during the evenings of 20 August and 11 September. On a few evenings, little or no glow was evident. In late September and early October, weak secondary illumination was visible, and the timing of primary colors suggested that aerosols were present to 13-19 km altitude on 26 September. From about 38°N, 75.5°W (Maryland-Virginia border), Schaaf saw moderate colors and many crepuscular rays on 28 October. In arctic air over New Jersey 7-8 November, colors were relatively weak and faded quickly.
References. Russell, P. B., Swissler, T.J., McCormick, M. P., Chu, W. P., Livingston, J. M., and Pepin, T. J., 1981, Satellite and correlative measurements of the stratospheric aerosol. I: An optical model for data conversions: Journal of Atmospheric Sciences, v. 38, no. 6, p. 1279-1294.
McCormick, M. P., Swissler, T. J., Fuller, W. H., Hunt, W. H., and Osborn, M. T., 1984, Airborne and ground-based Lidar measurements of the El Chichón stratospheric aerosol from 90°N to 56°S: Geofísica Internacional, v. 23, no. 2, p. 187-221.
Information Contacts: L. Stefanutti, Isto. di Ricerca Sulle Onde Electromagnetiche, Italy; R. Reiter, Garmischen-Partenkirchen, W. Germany; P. McCormick, T. Swissler, W. Fuller, and M. Osborn, NASA; T. DeFoor, MLO; M. Fujiwara and M. Hirono, Kyushu Univ. Japan; F. Schaaf, Millville, NJ.
Cite this Report
Aerosols increase over Italy but decline over Hawaii
Since the El Chichón eruption cloud was first detected over Mauna Loa, Hawaii in April 1982, the aerosols measured by lidar there have extended downward from the stratosphere into the upper troposphere, without a sharply-defined base. Aerosol concentrations in the upper troposphere decreased graduually with decreasing altitude. November lidar data showed a return to typical pre-El Chichón profiles in the upper troposphere, with few aerosols and cleanest air at the top of the troposphere, near the tropopause.
The Mauna Loa lidar cannot reliably measure aerosol concentrations above about 30 km altitude, but the presence of a distinct break in slope in the recorded profile at roughly 39 km in past months has suggested enhanced aerosol concentrations to that altitude. However, lidar measurements on 15 and 27 November showed no structure between 30 and 40 km altitude, suggesting that no aerosols were present. The 27 November data also showed a substantial decrease in the integrated aerosol backscattering, suggesting a decline in the stratospheric aerosol load. The decrease in integrated backscattering appeared real and the instrument signal looked typical, but the presence of a heavy cirrus layer at the altitude where the instrument is usually normalized may have distorted the data. No similar decreases in aerosol backscattering were observed at Fukuoka, Japan or Hampton, Virginia.
Lidar data at Firenze, Italy showed no firm evidence of aerosols from the eruption of Mayon (Philippines) in September, but integrated backscattering increased from the end of October through the end of November. Aerosol loading seemed quite continuous from about 14 km to 22-23 km altitude. Measurements at the end of November showed more evidence of inhomogeneity of aerosol distribution with height.
William Fuller reports that a ground truth measurement experiment took place over Laramie, Wyoming 29-30 November during the overflight of the newly-launched SAGE II satellite. Sun photometer and airborne lidar measurements were conducted on board the Ames Research Center CV 990 aircraft. Aerosol, water vapor, ozone, and NO2 measurements were made using balloon-borne samplers. Excellent data sets were obtained on each day.
Information Contacts: T. DeFoor, MLO; W. Fuller, NASA; M. Fujiwara and M. Hirono, Kyushu Univ., Japan; L. Stefanutti, Isto. di Ricera Sulle Onde Electromagnetiche, Italy.
Cite this Report
Strong twilight colors resume over England
H. H. Lamb reported a resumption of strong sunset colors in late November in the vicinity of Holt, England. The effects were stronger than they had been in more than 12 months. The timings and elevations of the optical phenomena seemed to suggest the illumination of an aerosol layer at about 22-25 km altitude. Lamb noted that for both the March-April 1982 eruption of El Chichón, and the August 1883 eruption of Krakatau, the first strong optical effects over England were at about the same time of year.
On 25 November, Lamb noted a strong purple patch that extended to more than 20° elevation and appeared about 30 minutes after sunset. At sunset on 28 November, the slightly greenish orange sun was surrounded by strong orange diffused light, and a purplish patch more prominent than on the 25th was present 50-60 minutes after sunset. However, no anomalous colors or other optical effects were seen at sunset in clear weather on 30 November.
During clear weather in early December, optical phenomena similar to those of late 1982 and early 1983 yet stronger than those of late 1983 were consistently observed by Lamb and his colleague Michael Kelly. The 6 December effects were very similar to the most impressive twilight seen in November 1982. As the sun set on 6 December, it was surrounded by orange light to about 3 solar diameters. From 10 to 20 minutes after sunset, a horizontal pinkish purple band appeared, evidently from the illumination of a layer above the surface haze. This band gradually climbed to 10° elevation, becoming broader and more diffuse. At 1600, 20 minutes after sunset, the entire western sky was a brilliant yellow to 35° elevation, edged by a brown layer along the horizon. By 1610, a purple patch had developed from 10-30° elevation above a shield-shaped area of bright white sky. At 1616, the maximum elevation of the purple glow was 20° and the sky from the horizon to 3° was a fiery deep brownish red. The next morning, the rising sun was pale yellow and surrounded by orange diffused light to 4 solar diameters. Twilight observations that evening were similar to those the previous day, but the purple patch at 1615 was asymmetrical, roughly triangular, with a vertical northern edge. It then narrowed to a broad column of light, which reached only 10-12° elevation by 1622 and faded fast. Sunrise on 8 December was obscured by clouds. That evening, purple light development was less pronounced than on the 6th and 7th, and gradually changed to a dirty gray. A fiery red band was present along the horizon at 1630. After sunset on 10 December, the purple patch was especially beautifully colored and in the form of crepuscular rays, reaching 25° elevation at 1615 and fading soon after 1620, when the maximum elevation was about 18°.
Richard Keen reported that brightness and duration of twilights at Boulder, Colorado showed a noticeable and steady decrease from late August through early December, indicative of a continued thinning and/or lowering of the aerosol layer. Enhanced salmon-pink to lavender twilights, peaking in color intensity at an SDA of 4°, were observed on either the mornings or evenings of 26, 27, 29, and 30 August; 2, 3, 5, and 15 September, 7 October, and 4-6 December. Extended lavender to purplish twilights were visible to an SDA of 11° in either the morning or evening sky on all these dates except 26 and 29 August and 5 December. Keen related the occurrence of extended twilights on individual dates to the absence of cirrus clouds for 1000-2000 km in the direction of the sun.
The shapes of lidar profiles and total aerosol backscattering at Mauna Loa, Hawaii varied considerably in December. Data on 11 and 19 December were similar to those of October and early November, with higher integrated backscattering than in late November and early December. Breaks in slope in recorded profiles on those dates suggested that aerosols were present to 34 and 39 km altitudes. Aerosol concentrations and maximum layer altitudes decreased again at the end of December.
Information Contacts: H. Lamb, Univ. of East Anglia, England; R. Keen, Univ. of Colorado; T. DeFoor, MLO.
Cite this Report
Major stratospheric warming evaporates aerosols
Significant concentrations of aerosols from El Chichón remained in the stratosphere at the beginning of 1985. Major stratospheric warming in late December and January may have evaporated and recondensed the El Chichón aerosols over a large portion of mid and high northern latitudes.
A small stratospheric warming event started about 7 December over the Aleutians. Air circulation at the 30 km level carried air from the zone of warming toward the western United States, cooling the air in transport. Balloon-borne particle counters detected increased numbers of tiny condensation nuclei (CN) at about 30 km altitude over Laramie, Wyoming on 14 and 18 December. The bases of December particle count profiles were relatively smooth, suggesting that the CN droplets were about 1-2 weeks old.
A much larger and more intense stratospheric warming began in late December and increased stratospheric temperatures persisted through January. Labitzke et al. (1985) note that "The evolution of this warming was very unusual. Only the development of the winter of 1956/7 appears to be similar, although few stratospheric data are available from that event." They report that stratospheric warming was first observed 26 December over Sable Island (44°N, 60°W) where the temperature at about 30 km altitude (10 hPa) was -24°C. Within a few days, the entire Arctic had warmed, resulting in a complete reversal of the stratospheric and mesospheric circulation over high latitudes and a breakdown of the polar vortex. By 29 December, temperatures at 30 km over the Labrador Sea area were 55° higher than they had been 5 days earlier and effects extended over much of eastern and central North America. Satellite data showed the rapid disappearance of the polar vortex over Europe and radiosonde measurements over Berlin (52.32°N, 13.25°E) on 2 January showed that intense warming had occurred in the 3 days since the previous measurement. The lower and middle stratosphere remained very disturbed in mid-January and a new warming pulse was developing over Labrador.
Balloon soundings from Laramie on 9, 24, and 31 January measured CN concentrations as high as 100/cm3 at 30 km altitude, compared to background values of 2-3/cm3. In contrast to previous years, meteorological data suggested that Laramie was within the zone of warming, so the January soundings may have sampled ongoing or very fresh CN events.
January lidar data from Mauna Loa, Hawaii showed no major changes from the previous month. The profile on 15 January showed a pronounced peak, whereas the layer was much broader on the 22nd, but integrated backscattering values on the two nights were very similar. Early February lidar data from Hampton, Virginia were similar to those from previous measurements in November.
Reference. Labitzke, K., Lenschow, R., Naujokat, B., and Petzoldt, K., 1985, First note on the major stratospheric warming at the end of December 1984: Beilage zur Berliner Wetterkarte SO 1/85, Met. Inst. Free University of Berlin. A shortened version has been submitted to the Map Newsletter.
Information Contacts: D. Hofmann, Univ. of Wyoming; T. DeFoor, MLO; W. Fuller, NASA.
Cite this Report
El Chichón aerosols persist over N Hemisphere
The 20 February lidar profile at Hampton, Virginia showed quite uniform aerosol density to 23.5 km altitude. By 6 March, the lidar profile had returned to a more normal shape with a distinct peak. At Mauna Loa, Hawaii, lidar data indicated that the aerosol layer on 19 February terminated at a much lower altitude and had smaller peaks than 5 days earlier; integrated backscattering was nearly halved. No significant increase in backscattering was observed from Garmisch-Partenkirchen, Germany October 1984-January 1985. A second higher-altitude layer was detected in December and January, but maximum backscattering ratios did not increase.
Information Contacts: R. Reiter, Garmisch-Partenkirchen, W Germany; T. DeFoor, MLO; W. Fuller, NASA.
Cite this Report
El Chichón aerosols continue gradual decline
Integrated aerosol backscattering remained about the same over Mauna Loa, Hawaii and decreased slightly over Hampton, Virginia in March. Lidar data from Garmisch-Partenkirchen, Germany showed little change in altitudes of aerosol layers or peak backscattering ratios during winter 1984-85. No new aerosol layers were reported.
Information Contacts: T. DeFoor, MLO; M. Osborn, NASA; R. Reiter, Garmisch-Partenkirchen, W Germany.
Cite this Report
Fewer stratospheric aerosols remain over low latitudes
An airborne lidar mission supporting the SAGE II satellite detected substantially smaller amounts of stratospheric aerosol at low latitudes than an mid-latitudes. Maximum backscattering ratios off the east coasts of Central America and Brazil were similar to those measured over southern California. However, the aerosol layers off Central America and Brazil were narrower, truncated at the base by higher tropopauses characteristic of the tropics, and integrated backscattering at low latitudes was only about 1/3 that over California. Sun photometer data were also collected from the aircraft, and balloons and ozone-sensing rockets were launched from Natal, Brazil.
Data from Mauna Loa, Hawaii showed a continuing gradual decline in stratospheric aerosols, with integrated backscattering at the end of April dropping to little more than half the early March values. Peak backscattering over Fukuoka, Japan declined sharply in early April, but had returned to near late March values by mid-April.
Information Contacts: W. Fuller, NASA; M. Fujiwara, Kyushu Univ., Japan; T. DeFoor, MLO.
Cite this Report
El Chichón aerosols persist over low and mid latitudes
Stratospheric aerosol concentrations continued to decline through mid-May at Mauna Loa, Hawaii, but a new layer was detected just above the tropopause late in the month. The new layer was only a small anomaly on the 23 May lidar profile, but was somewhat stronger by the time of the next measurement on 30 May. It was not sharply defined, suggesting that it was at least a month old, although it had not been previously observed at Mauna Loa. Small layers of this type can be produced by recirculation of existing aerosols as well as by a new injection of material. No such layer was detected by the SAGE II support mission in late March and early April. Lidar at Garmisch-Partenkirchen, Germany continued to detect remnants of the El Chichón stratospheric aerosol cloud. Layer altitudes and peak backscattering ratios changed little from February through April.
Information Contacts: R. Reiter, Garmisch-Partenkirchen, W. Germany; T. DeFoor, MLO, HI; W. Fuller, NASA, VA.
Cite this Report
El Chichón aerosols persist; tropospheric layers may be smoke from forest fires
Persistent remnants of the El Chichón stratospheric aerosol cloud were measured over Virginia and Hawaii. Tropospheric aerosol layers were also detected by lidar over Virginia in late June and early July, and by an airline pilot at about 11 km altitude over Tennessee in late June. No volcanic source was recognized for the tropospheric aerosols, but many forert fires were burning in the western United States during this period. In early July, smoke from one major fire rose to 5.5 km altitude. Enhanced sunrises and sunsets have been reported from Boulder, Colorado, roughly 1,500 km away.
Information Contacts: W. Fuller, NASA; T. DeFoor, MLO; P. Handler, Univ. of Illinois; M. Matson, NOAA/NESDIS.
Cite this Report
Stratospheric aerosols from El Chichón persist
Stratospheric aerosols produced by the 1982 eruption of El Chichón continued to be measured over Virginia and Hawaii in July. A tropospheric layer, perhaps smoke from major forest fires in the western United States was detected over Virginia on 9 July, but no such layer was present 9 days later. Peak and integrated backscattering remained similar to values of the past few months, but were distinctly lower than the beginning of this year.
Information Contacts: T. DeFoor, MLO; W. Fuller, NASA.
Cite this Report
Aerosol data similar over Alaska and lower latitudes
Stratospheric aerosols from the El Chichón eruption weakened in August over Japan, Hawaii, and Virginia.
The following is a report from William Fuller. "An airborne lidar mission supporting the SAGE II/SAM II correlative measurement experiment was flown on the NASA Wallops P-3 aircraft on 7, 8, and 9 August 1985 from Fairbanks, Alaska. SAGE II missions were flown on 7 and 9 August just south and north of Fairbanks (64.8°N, 147.9°W) and SAM II measurements were conducted to 74°N. Other correlative measurements supporting the experiments were as follows: in-situ balloon-borne aerosol, water vapor, ozone measurements, and higher-altitude sampling from a NASA U-2 aircraft. Sun photometer data were also obtained on the P-3 flights. One set of data was taken at the Wallops flight facility on 2 August prior to departing for Alaska. Peak scattering ratios from 63°N to 74°N were approximately the same as at 38°N latitude, on the order of 1.4. The peaks occurred at lower altitudes because of the lower tropopause heights at high latitudes (10 km at 64°N, 16 km at 38°N."
Information Contacts: W. Fuller, NASA; M. Hirono, Kyushu Univ. Japan; T. DeFoor, MLO.
Cite this Report
El Chichón aerosols weaken slightly
Lidar measurements indicated that the stratospheric aerosol cloud from the 1982 eruption of El Chichón had weakened very slightly over Germany, Japan, and Hawaii.
Information Contacts: R. Reiter, Garmisch-Partenkirchen, W Germany; T. DeFoor, MLO; M. Fujiwara, Kyushu Univ., Japan.
Cite this Report
El Chichón aerosols persist in the lower stratosphere
Lidar data from Japan, Hawaii, and Virginia showed the continuing presence of aerosols from the 1982 eruption of El Chichón (figure 11). Although both peak and integrated backscattering values remained very uniform over Hawaii from measurement to measurement, the lidar profiles showed substantial variation. The 1 October profile was relatively smooth; two small peaks were apparent on the 16 October data; a zone of sharply decreased aerosol concentration was detected between 20.5 and 23 km altitude on 23 October; and there was a step increase (in contrast to the usual gradual increase) in backscattering at the base of the stratosphere on the 30 October profile.
 |
Figure 11. Aerosol layers from the eruptions of El Chichón and Ruiz as monitored from four lidar sites, April 1982-mid 1986. El Chichón aerosols arrived first at lower altitude sites, but by early 1983 measurements were very similar at low and mid-latitudes. Values were much smaller for the Ruiz aerosols (to the right of the arrow). Peak backscatter data (x axis; note logarithmic scale) were normalized to ruby values. Courtesy of M.O. McCormick. |
From Holt, England, H. H. Lamb has observed weakening of optical phenomena associated with stratospheric aerosols since his report of strong effects in November and December 1984. On 16 February, the clear sky appeared dirty at twilight and a distinct purple patch developed 20 minutes after sunset. Strong optical effects and colors were observed after sunset on 4-6 and 13 March, and 21 April, with measurements indicating an aerosol height of 20-25 km, as in December. Lamb's next detailed sunset observations were on 1 September and 13 October, with a characteristic fiery red layer along the horizon being particularly notable on the latter date. Measurements of the elevation of the top of the illuminated patch in September and October suggested that the aerosol layer was at 15-18 km altitude.
Information Contacts: H. Lamb, Univ. of East Anglia, England; T. DeFoor, MLO; M. Fujiwara, Kyushu Univ. Japan; M. Osborn, NASA.
Cite this Report
New stratospheric aerosol layers
Data from Hawaii and Wyoming suggest that aerosol material, perhaps from the 13 November eruption of Ruiz volcano, Colombia, has recently been injected into the stratosphere. Through 22 November, lidar measurements at Mauna Loa, Hawaii continued to show only remnants of the 1982 El Chichón aerosol cloud. On 26 and 27 November, a distinct new layer centered at 25-25.5 km appeared on Mauna Loa lidar profiles (figure 12), accompanied by a substantial increase in total backscatter. This layer was absent over Mauna Loa on 3 December, but new layers centered at 15, 16.8, and 18.6 km altitude (tropopause altitude was 16.5 km) were detected and total backscatter remained elevated. Preliminary data 7 and 10 December showed some apparent new material, but less distinctly than on the 3rd. No new material was evident 10 December over Hampton, Virginia.
 |
Figure 12. Arrival of Ruiz aerosols at different altitudes, shown by preliminary lidar profiles from Mauna Loa, Hawaii, 26 November-30 December 1985. Backscattering ratios are on the x axis, altitudes above sea level on the y axis. In the six dated graphs, the solid line records the data collected that night, the dotted line represents the average December profile. The final graph compares the average December profile (solid line) containing the new Ruiz aerosols with the average November profile (dotted line), primarily aerosols remaining from the 1982 eruption of El Chichón. Courtesy of Thomas DeFoor. |
While flying from Honolulu to Los Angeles on 27 November at approximately 22°N, 140°W, David Hofmann saw a cloud of particles above the aircraft at an estimated elevation of 12 km. The gray haze and large ring around the sun were very similar towhat Hofmann observed shortly after the eruption of Fuego volcano, Guatemala in October 1974, suggesting that this cloud was also of volcanic origin.
On 5 December, balloon-borne particle counters detected a 10-fold increase in condensation nuclei (CN, H2SO4 droplets with diameters much less than 0.1 µm) between 15 and 17 km altitude over Laramie, Wyoming. Particle counts were 400 per cm3 compared to background values of 40 particles per cm3 at that altitude [see 10:12]. This CN event is distinguishable from El Chichón aerosols by both its altitude (El Chichón aerosols are found at 17-19 km) and particle size (El Chichón particles are now larger than 0.1 µm). A subsequent balloon flight on 11 December showed only background CN concentrations at these elevations.
Information Contacts: D. Hofmann and J. Rosen, Univ. of Wyoming; T. DeFoor, MLO; R. Reiter, Garmisch-Partenkirchen, W Germany; W. Fuller, NASA.
Cite this Report
New aerosols over Hawaii, Japan, and Wyoming; unusual haze over Fiji
Lidar instruments in Hawaii and Japan detected new stratospheric aerosol layers that may have been produced by the 13 November eruption of Ruiz volcano, Colombia. Lidar profiles at Mauna Loa, Hawaii showed a distinct new layer centered at 25-25.5 km altitude on 26 and 27 November. That layer was not detected during the next measurement on 3 December, but distinct new upper tropospheric and lower stratospheric material was evident that night, and apparent new layers centered at 18-22 km were present during the rest of December (figures 13 and 15). At Fukuoka, Japan, a relatively strong scattering layer appeared at 16.9 km (0.2 km above the tropopause observed at the Fukuoka Meteorological Observatory, 7 km from the lidar site) on 28 November, but there were two probable cirrus cloud layers at 6-15 km and it was not possible to confirm that the layer was volcanic. The next night, a very thin scattering layer was present at 18.4 km (3 km above the tropopause); the 29 November lidar profile was of a type not observed except after major volcanic eruptions. Layers were observed at about the same altitude during most December lidar measurements at Fukuoka. Lidar at the National Institute for Environmental Studies at Tsukuba, Japan detected an aerosol layer about 1 km thick at 18 km altitude on 11 and 12 December (figure 14). No such layer had been observed through November. The layer became more obscure 13 and 16 December. Another small layer was detected at about 22 km through December, but it was not certain whether it had been present in previous months. Weak layers centered at 25.8 and 24.5 km were detected from Hampton and Wallops Island, Virginia in December.
 |
Figure 13. New aerosol layer at 18 km altitude (arrow) detected on preliminary lidar profiles from Tsukuba, Japan, 11 and 12 December 1985, one month after the Ruiz eruption. Backscattering ratios are on the x axis, with the solid vertical line representing a ratio of 1, and altitudes are on the y axis. Courtesy of Sachiko Hayashida. |
 |
Figure 14. Timing of large explosive eruptions, 1974-1986, compared to lidar measurements of stratospheric aerosols over Mauna Loa, hawaii. Non-Rayleigh backscattering coefficients are integrated over the lower stratosphere. Courtesy of Thomas DeFoor and Elmer Robinson. |
 |
Figure 15. Timing of large explosive eruptions, 1971-1985, compared to particle concentrations (per milligram of ambient air) measured during 200 balloon soundings from Laramie, Wyoming and five from southern Texas (circled crosses). Data were collected for two particle sizes (radii 0.25 and 0.15 microns) at the stratospheric maximum (18-22 km altitude). Courtesy of David Hofman. |
The following is from Ram Krishna. "An ususual, heavy haze was observed at Nadi, Fiji (17.78°S, 177.48°E) from 20 through 22 November. The haze significantly reduced the very good visibility normally encountered in this area, and, according to reports by pilots, it extended through the boundary layer to the inversion and was evident for many tens of kilometers across Viti Levu to Vanua Levu. Winds were light throughout the period and meteorological analyses could not provide reliable back trajectories. The appearance, density, and spatial extent of the haze suggest that it was an aerosol formed from volcanic sulfur-containing gas emission not too far upstream. Volcanic activity in Vanuatu has been implicated in previous haze episodes and is a likely explanation for the present episode, but this could not be confirmed. A similarly heavy haze was observed on 21 December, but it did not persist beyond that date."
Four balloon-borne aerosol observations were made over Laramie, Wyoming during December, showing enhanced concentrations of condensation nuclei (CN particles with radii between 0.01 and 0.1 µm) above background, probably from the 13 November eruption of Ruiz (table 2 and figure 15). The strongest enhancement was a 10-fold increase at 15-18 km on 5 December, when smaller increases were also measured at 23 and 28 km altitudes (data in table 2 replace the preliminary 5 December values in 10:11). Only one weak layer was detected on 11 December, but flights on 18 and 31 December showed several zones of enhanced aerosol concentrations. Increased concentrations of optically active aerosols (larger than 0.15 µm) were not present in any of the samplings. Preliminary data from the 10 January flight showed no substantial CN enhancement.
Table 2. Zones of enhanced condensation nuclei concentration detected by balloon-borne instruments over Laramie, Wyoming, 5-31 December. Concentrations are expressed as counts per cm3; normal background concentrations for each altitude are given after the slash. Data courtesy of David Hofmann.
| Date | Altitude (km) | Concentration (/cm3) |
| 05 Dec 1985 | 15-18 | 600/50 |
| 05 Dec 1985 | 23 | 30/7 |
| 05 Dec 1985 | 28 | 10/194 |
| 11 Dec 1985 | 20 | 18/7 |
| 18 Dec 1985 | 12-14 | 70/20 |
| 18 Dec 1985 | 16 | 35/15 |
| 18 Dec 1985 | 18 | 45/8 |
| 31 Dec 1985 | 13-17 | 80/30 |
| 31 Dec 1985 | 19 | 40/10 |
| 31 Dec 1985 | 20 | 15/7 |
| 31 Dec 1985 | 22-25 | 30/7 |
Information Contacts: T. DeFoor, MLO; M. Fujiwara, Kyushu Univ., Japan; S. Hayashida, National Inst. for Environmental Studies, Japan; W. Fuller and M. Osborn, NASA; R. Krishna, Fiji Meteorological Service; D. Hofmann, Univ. of Wyoming.
Cite this Report
Apparent new stratospheric aerosols at high N latitudes
From Tsukuba, Japan (36.2°N, 140.1°E), Sachiko Hayashida reported that the aerosol layer detected at 18 km altitude on 11 and 12 December was probably present on 1 December, but with a scattering ratio of only about 1.3 (figure 16). On 6 January, another aerosol layer was observed at about 22 km altitude. The peak scattering ratio of this layer increased to about 2.8 on 9 and 10 January. Aerosols were concentrated in a layer about 1 km thick. The 14 January profile showed a decrease in peak scattering ratio to about 1.6. At Mauna Loa, Hawaii (19.5°N, 155.6°W), lidar profiles showed an increase in aerosol concentrations through January as the layer centered at about 20 km altitude strengthened (figures 17-19). Only remnants of El Chichón's 1982 eruption cloud were detected by lidar at Garmisch-Partenkirchen, Germany (47.5°N, 11.0°E) through 4 January. The next measurement, on 21 January, showed new layers centered at 18.6 and 21 km altitude. Data on 22 and 26 January continued to show new aerosols, centered at 18 and 17.4 km.
 |
Figure 16. Lidar profiles from Tsukuba, Japan (36.2°N, 140.1°E), courtesy or Sachiko Hayashida. Solid vertical lines represent a scattering ratio of 1. Lidar wavelength is 0.53 µm. |
 |
Figure 17. Lidar profiles from Mauna Loa, Hawaii (19.5°N, 155.6°W), 8-28 January 1986. The dotted line superimposed on each profile represents the average January data. Courtesy of Thomas DeFoor. |
 |
Figure 18. Average lidar profiles measured during four periods (5-22 November 1985, 26-27 November 1985, 3-30 December 1985, and 8-28 January 1986) at Mauna Loa, Hawaii. The dotted line superimposed on each profile represents the average 5-22 November 1985 data, just before the arrival of fresh aerosol layers. Courtesy of Thomas DeFoor. |
 |
Figure 19. Lidar data from various locations, showing altitudes of aerosol layers. Note that some layers have multiple peaks. Backscattering ratios from Fukuoka, Japan, are for the Nd-YAG wavelength of 1.06 µm; from Tsukuba, Japan, for the Nd-YAG wavelength of 0.53 µm; all others are for the ruby wavelength of 0.69 µm. Altitudes of maximum backscattering ratios and coefficients are shown for each layer at Mauna Loa; maxima were at the same altitude on 14 January. Integrated values show total backscatter, expressed in steradians-1, integrated over 300-m intervals from 16-33 km at Mauna Loa and from the tropopause to 30 km at Hampton. |
NASA's SAGE II/SAM II/Polar Stratospheric Cloud mission 7-22 January included airborne lidar measurements from near Hampton, VA to 77°N. Initial data at 42.5°, 67.5°, and 76.5°N (between Hampton and Thule, Greenland) 8-14 January showed relatively low backscattering ratios (figure 20). However, during flights on 16, 21, and 22 January that penetrated the circumpolar vortex wind system, lidar detected strong fresh-looking aerosol layers about 2.5-3 km thick, centered at 18-20 km. Possible sources of the strong layers included the Kliuchevskoi eruption or remnants of the 1982 El Chichón cloud. After exiting the circumpolar vortex at about 76.8°N, 108°W on 16 January, backscattering ratios dropped sharply. NASA's Stratospheric Aerosol and Gas Experiment II (SAGE II) satellite detected aerosol concentrations that were enhanced 10 times or more above background on 4 and 6 December at 20.9°N and 1.3°N.
 |
Figure 20. Lidar data from a NASA airborne mission and the SAGE II satellite, showing altitudes of aerosol layers. Note that some layers have multiple peaks. Backscattering ratios are for the ruby wavelength of 0.69 µm. Integrated values show total backscatter, expressed in steradians-1, integrated over 300-m intervals from the tropopause to 30 km. |
On 18 January, balloon-borne instruments over Laramie, Wyoming (41°N, 105.5°W) detected the first enhancement of optically active aerosols (radius > 0.15 µm) thought to have been produced by the 13 November eruption of Ruiz. A concentration of about 5/cm3 above a background of 1.8/cm3 was measured at 17-19 km (figure 21). No other major stratospheric perturbations have been observed in this component at Laramie since the eruption of El Chichón in 1982. Flights on 10 January and 3 February showed smaller increases in optically active particles.
 |
Figure 21. Aerosols collected by balloons launched from Laramie, WY (41°N, 105.5°W) in late 1985 and early 1986. Left, concentration of optically active aerosols (radius > 0.15 µm); right, concentration of condensation nuclei (radius > 0.01 µm). |
Enhanced concentrations of condensation nuclei (CN, radius > 0.01 µm) were also measured on 18 January between 16 and 19 km altitude, peaking at 100/cm3 as compared to a background of 20-30/cm3. Figure 21 illustrates this increase and includes the profile for 5 December, when the first lower stratospheric CN perturbation was observed over Laramie since the eruption of El Chichón. This CN enhancement is thought to be caused by aerosols from the 13 November eruption of Ruiz, but increases observed at about 25 km altitude on 3 February are interpreted as having been produced by evaporation and recondensation of older aerosols in association with a stratospheric warming event at high northern latitudes.
The following is from Richard Keen. "Enhanced twilights continued to be observed in 1985, but in general the brightness, color intensity, and duration of the twilight phenomena were not as great as in 1984. Salmon or lavender-colored twilights, with peak color intensity at a solar depression angle (SDA) of 4°, were observed on 6 February, 5 and 24 July, 1, 2, 26, 27, & 29 October, and 13 December. The concentration of observations in October may be due to the normal absence of high cirrus clouds over the W United States during the early fall. Horizontal striations were noted in the twilights of 6 February and 13 December.
"A spectacular twilight was seen on 31 December. The bright salmon color peaked at an SDA of 5°, implying a somewhat higher aerosol layer than that responsible for the twilight phenomena earlier in the year. In addition, there were pronounced horizontal striations and banding in the twilight glow. This twilight was similar to those observed in late 1982 and 1983. Enhanced twilights in early January 1986 (on the 7th and 12th) were modest 4° SDA twilights of the type observed earlier in 1985, so the bright 31 December twilight was apparently due to a passing localized aerosol cloud.
"Hemispherically averaged volcanic aerosol optical thicknesses can be derived from observations of the brightness of the moon during total lunar eclipses (Keen, 1983). The 2 lunar eclipses of 1985 (4 May and 28 October) were observable only from the Eastern Hemisphere. Aerosol optical thicknesses have been derived using observations from England, Spain, Austria, South Africa, and Australia for the 1985 eclipses (table 3).
Table 3. Aerosol optical thicknesses derived from observations of lunar eclipses, 1982-85. Data for the 1985 eclipses are from England, Spain, Austria, South Africa, and Australia. The 25 June 1983 observations was for a partial eclipse. Courtesy of Richard Keen.
| Date | Hemisphere | Optical Depth |
| 30 Dec 1982 | N | 0.12 |
| 25 Jun 1983 | S | 0.03 |
| 05 May 1985 | N | 0.04 |
| 28 Oct 1985 | S | 0.00 |
The uncertainty of the derived optical thicknesses is ± 0.02. These observations indicate that the Northern Hemisphere volcanic aerosols from El Chichón decayed to 1/3 of their peak values between 1982 and 1985; the calculated e-folding decay time is 2.1 years. The Southern Hemisphere aerosol layer, which in 1983 was apparently only 1/4 as thick as the Northern Hemisphere layer, had decayed to undetectability by 1985."
Edward Brooks observed unusual sunrises and sunsets from Trinidad, Florida, and Massachusetts. On 31 December, the sunset was a vivid pink to dark purple at Key West, Florida (24.57°N, 81.60°W). At Port of Spain, Trinidad (10.63°N, 61.52°W), the 12 January evening sky was a brilliant orange to red with a dark blue crepuscular ray for about 30 minutes after sunset (solar depression angle about 15°). On 20 January, the sunset was brightly colored at Jacksonville, Florida (30.33°N, 81.67°W). Two days later at Boca Raton, Florida (26.37°N, 80.08°W), sunrise was strongly pink and sunset was also a brilliant pink with multiple dark and light crepuscular rays. Pink crepuscular rays were associatated with the 5 February sunset at Newton, Massachusetts (42.33°N, 71.22°W), and the sky remained bright red for about 30 minutes after sunset (solar depression angle about 10°; note differing SDA rates at low and mid-latitudes).
Reference. Keen, R.A., 1983, Volcanic Aerosols and Lunar Eclipses; Science, v. 222, p. 1011-1013.
Information Contacts: William Fuller, NASA Langley Research Center, Hampton, VA 23665 USA; Sachiko Hayashida, National Institute for Environmental Studies, Yatabe-machi, Tsukuba, Ibaraki 305, Japan; Thomas DeFoor, Mauna Loa Observatory, P.O. Box 275, Hilo, HI 96720 USA; D.J. Hofmann and J.M. Rosen, Department of Physics and Astronomy, University of Wyoming, Laramie, WY 82071 USA; H. Jäger, Fraunhofer-Institut fur Atmospharische Umweltforschung, Kreuzeckbahnstrasse 19, D-8l00 Garmisch-Partenkirchen, West Germany; Richard Keen, CIRES, Campus Box 449, University of Colorado, Boulder, CO 80309 USA; Edward M. Brooks, Department of Geology and Geophysics, Boston College, Chestnut Hill, MA 02167 USA.
Cite this Report
Stratospheric aerosols persist
Lidar data from Mauna Loa, Hawaii on 5 February showed continued development of the aerosol layer centered at about 20 km (figure 22). The entire profile was depressed on the 12th, but a week later the 20 km layer had strengthened and backscattering was slightly enhanced above 25 km. By 28 February, the higher layer had become prominent, the first significant enhancements detected at that altitude over Mauna Loa since 26-27 November (probably from Ruiz). From Hampton, VA (37.1°N, 76.3°W), lidar data on 14 February showed a layer centered around 20 km that was at a similar altitude but weaker than layers observed in Japan in January. Lidar profiles from the segments of the NASA airborne mission W of Thule, Greenland (about 77.5°N, 69.5°W) were similar to profiles from Tsukuba, Japan, 9-10 January.
 |
Figure 22. Lidar profiles from Mauna Loa, Hawaii, 5-28 February 1986. The dotted line superimposed on each profile represents the average data 5-22 November, before the arrival of new aerosols over Hawaii. Courtesy of Thomas DeFoor. |
Balloon flights over Laramie, WY on 3 and 22 February detected no layers of optically active areosols (radius > 0.15 µm) or condensation nuclei (CN, radius > 0.01 µm) that could be associated with recent volcanic activity. An increase in CN at 25 km on 3 February was attributed to evaporation and recondensation of older aerosols, rather than a new volcanic event.
From Millville, New Jersey (39.4°N, 74.9°W), Fred Schaaf observed an unusual sunrise on 11 January. Glow reached 15° altitude at 0702 and visible NE-SW horizontal striations seemed to be at higher altitudes than normal weather clouds. The intensity of the effects were similar to those observed after the 1980 St. Helens eruption, but much weaker than those that followed the eruption of El Chichón in 1982.
Information Contacts: Thomas DeFoor, Mauna Loa Observatory, P.O. Box 275, Hilo, HI 96720 USA; William Fuller, NASA Langley Research Center, Hampton, VA 23665 USA; J.M. Rosen and D.J. Hofmann, Department of Physics and Astronomy, University of Wyoming, Laramie, WY 82071 USA; Fred Schaaf, R. D. 2, Box 248, Millville, New Jersey 08332 USA.
Cite this Report
New stratospheric aerosols
On 18-19 January, lidar operated by the University of Bonn at the Andoya Rocket Range, Norway (69.28°N, 16.02°E) detected strong layers to 24.5 km that were not present during their previous observation on 30-31 December. Stratospheric aerosols were less conspicuous the next night and little aerosol material was evident the nights of 20-21 and 21-22 January, and the morning of 1 February. Strong layers to almost 26 km were observed again the night of 2-3 February. Lidar data from Garmisch-Partenkirchen, Germany showed no apparent new aerosols until 4 January, when a layer was detected at 26.4 km. Backscattering ratios were largest 21, 22, and 26 January for layers centered from 17.4-21 km, but enhanced values at similar altitudes continued to be observed through February including a 24-km layer on the 22nd. The source of these high-latitude aerosols was uncertain, but may have included material from both the 13 November 1985 eruption of Ruiz, Colombia and vigorous late-l985 explosive activity from Kliuchevskoi Volcano, Kamchatka. Aerosols had also been detected in January at high northern latitudes by a NASA airborne mission.
At lower latitudes, new stratospheric aerosols have been present since shortly after the Ruiz eruption. At Mauna Loa, Hawaii lidar data showed a series of small sharp peaks between 16.5 and 26 km on 5 March (figure 23). The layer centered at about 20 km altitude strengthened later in the month, dominating the profile 20 and 28 March. A layer at about 23 km, not evident on 12 March, was seen on 20 and 28 March, and a broad zone of enhanced backscattering at 28-35 km was present on 28 March. From Fukuoka, Japan (33.65°N, 130.35°E), lidar continued to detect a layer centered at 18.4 km altitude on several nights in March, as during much of December. A very sharp peak, measured at 22 km on 11 March, was weaker but still present on 24 March, and sharp peaks were found at 21.4 and 25.1 km during the next observation on 31 March.
 |
Figure 23. Lidar data from various locations, showing altitudes of aerosol layers. Note that some layers have multiple peaks. Backscattering ratios from Fukuoka, Japan, are for the Nd-YAG wavelength of 1.06 µm; all others are for the ruby wavelength of 0.69 µm. Integrated values show total backscatter, expressed in steradians-1, integrated over 300-m intervals from 16-33 km at Mauna Loa and from the tropopause to 30 km at Hampton. Altitudes of maximum backscattering ratios and coefficients are shown for each layer at Mauna Loa; maxima were at the same altitudes on 12, 20, and 28 March. The 23 December-26 January data from Garmisch-Partenkirchen and the 5 March data from Hampton replace previously published preliminary values. |
Robert Malmström reported that sunsets at La Palma, Canary Is. (28.75°N, 17.88°W) appeared similar to one another 9-21 January, but the sky was distinctly more pink on the 23rd (about 1945 GMT) and 24th. On 30 January there was a very strong pink glow, again at about 1945 GMT, that was reminiscent of sunsets seen after the El Chichón eruption.
Information Contacts: H. Jäger, Fraunhofer-Institut für Atmosphärische Umweltforschung, Kreuzeckbahnstrasse 19, D-8100 Garmisch-Partenkirchen, West Germany; U. von Zahn, Physikalisches Institut, Universität Bonn, Nussallee 12, 5300 Bonn 1, West Germany; Thomas DeFoor, Mauna Loa Observatory, P.O. Box 275, Hilo, HI 96720 USA; William Fuller, NASA Langley Research Center, Hampton, VA 23665 USA; Motowo Fujiwara, Physics Department, Kyushu University Fukuoka 812, Japan; Robert Malmström, Gaildorferstrasse 27, D-7000 Stuttgart 50, West Germany.
Cite this Report
Ruiz aerosols persist, but no Augustine material evident
Lidar instruments in Germany, Virginia, and Hawaii continued to detect stratospheric aerosols that were probably from the 13 November 1985 eruption of Ruiz. No new layers from the late March explosive activity of Augustine were apparent as of late April. At Mauna Loa, Hawaii, lidar continued to detect a strong layer at about 21 km altitude, accompanied by a weaker layer at about 27 km on 1 and 22 April (figure 24). High-altitude layers had previously been observed at Mauna Loa two weeks after the Ruiz eruption and in late February. April backscattering ratios at Garmisch-Partenkirchen, West Germany were similar to those of late February. At Hampton, VA, stratospheric layers were centered at about 19-20 km altitude. Enhanced backscattering, perhaps from large forest fires in the eastern United States, continued down into the troposphere.
 |
Figure 24. Lidar data from various locations, showing altitudes of aerosol layers. Note that some layers have multiple peaks. Backscattering ratios are for the ruby wavelength of 0.69 µm. Integrated values show total backscatter, expressed in steradians-1, integrated over 300-m intervals from 16-33 km at Mauna Loa and from the tropopause to 30 km at Hampton. Altitudes of maximum backscattering ratios and coefficients are shown for each layer at Mauna Loa. |
Further Reference. DeFoor, T., and Robinson, E., 1987, Stratospheric Lidar Profiles from Mauna Loa Observatory, Winter 1985-1986: GRL, v. 14, p. 618-621.
Information Contacts: Thomas DeFoor, Mauna Loa Observatory, P.O. Box 275, Hilo, HI 96720 USA; William Fuller, NASA Langley Research Center, Hampton, VA 23665 USA; H. Jäger, Fraunhofer-Institut fur Atmosphärische Umweltforschung, Kreuzeckbahnstrasse 19, D-8l00 Garmisch-Partenkirchen, West Germany.
Cite this Report
Ruiz aerosols persist; balloon data since 1971
Balloon soundings from Laramie, WY on 19 May showed maximum particle concentrations of about 2.8/cm, (radius > 0.15 µm) at about 20 km altitude. Figure 25 plots 1971-86 balloon data, showing perturbations associated with major eruptions.
 |
Figure 25. Aerosol mixing ratios (particles/mg ambient air) versus time at the stratospheric maximum (18-22 km) for r > 0.25 µm and r > 0.15 µm during 200 balloon soundings at Laramie, WY and 5 in S Texas (circled crosses). The times of major volcanic eruptions believed to have perturbed the stratosphere at Laramie are indicated by arrows. |
Lidar instruments in Virginia, Hawaii, Japan, and Germany continued to detect stratospheric aerosol layers thought to be from the 13 November 1985 eruption of Ruiz. At Mauna Loa, Hawaii, backscattering ratios of the sharp layer centered at 20.5-21 km diminished through May, while backscattering was enhanced at higher altitudes (figure 26). Higher altitude material had first been detected over Hampton, VA on 29 April, and peak backscattering ratios were at 20.5-21.5 km in early June, up from 19-20 km in early May. The lower layer appeared to be weakening and did not form a distinct peak. At Fukuoka, Japan, lidar continued to measure 2-3 layers in April and May, generally centered at altitudes of about 19 and 21-23 km, similar to March observations. From Garmisch-Partenkirchen, Germany, peak May backscattering ratios were similar to those of April, but altitudes increased slightly.
 |
Figure 26. Lidar data from various locations, showing altitudes of aerosol layers. Note that some layers have multiple peaks. Backscattering ratios from Fukuoka, Japan, are for the Nd-YAG wavelength of 1.06 µm; all others are for the ruby wavelength of 0.69 µm. Integrated values show total backscatter, expressed in steradians-1, integrated over 300-m intervals from 16-33 km at Mauna Loa and from the tropopause to 30 km at Hampton. Altitudes of maximum backscattering ratios and coefficients are shown for each layer at Mauna Loa. Mauna Loa backscattering values were truncated at 23 km on 8 May because of instrument problems. The 5 May data from Hampton replace previously published preliminary values. |
Information Contacts: David Hofmann and James Rosen, Department of Physics and Astronomy, University of Wyoming, Laramie, WY 82071 USA; Motowo Fujiwara, Physics Department, Kyushu University, Fukuoka 812, Japan; Thomas DeFoor, Mauna Loa Observatory, P.O Box 275, Hilo, HI 96720 USA; H. Jäger, Fraunhofer-Institut für Atmosphärische Umweltforschung, Kreuzeckbahnstrasse 19, D-8100 Garmisch-Partenkirchen, West Germany; William Fuller, NASA Langley Research Center, Hampton, VA 23665 USA.
Cite this Report
Ruiz aerosols persist; 1985-86 lidar data summarized
Lidar profiles at Mauna Loa, Hawaii varied substantially in June (figure 27). No trends were obvious but the increased integrated stratospheric backscattering coefficient observed since May persisted, apparently due to increased aerosols above about 21 km.
 |
Figure 27. Lidar data from Hawaii and Virginia, showing altitudes of aerosol layers. Note that some layers have multiple peaks. Backscattering ratios are for the ruby wavelength of 0.69 µm. Integrated values show total backscatter, expressed in steradians-1, integrated over 300-m intervals from 16-33 km at Mauna Loa and from the tropopause to 30 km at Hampton. Altitudes of maximum backscattering ratios and coefficients are shown for each layer at Mauna Loa. The 9 June data from Hampton replace previously published preliminary values. |
Thomas DeFoor reports that "Figure 28 shows the trend in integrated non-Rayleigh backscattering coefficient between January 1985 and June 1986. Integrated aerosol scattering reached its lowest value since before the "Mystery Cloud" (20 January 1982 = 0.6 x 10⁻⁴ sr-1) on 23 May 1985 (1.0 x 10⁻⁴) as the remnant of the El Chichón aerosol continued to decline toward the 'non-volcanic' background of 0.4 x 10⁻⁴ sr-1. However, this trend was abruptly interrupted with an increase beginning 30 May 1985. This increase and the subsequent declining trend through 22 November 1985 is judged to have been the result of an unknown 1985 eruption. Evidence strongly suggests that this injection was at least several months old at first detection and probably had a Southern Hemisphere source, as it was apparently not detected by other Northern Hemisphere lidar stations. The increased backscatter first observed 26 November 1985 was probably the result of the 13 November Ruiz eruption. The variable backscatter values that followed for the next few months are not surprising. However, the apparent increasing trend between February and June 1986 is peculiar, especially since there is no obvious evidence of post-Ruiz aerosol sources in any of the Mauna Loa lidar profiles to date."
 |
Figure 28. Integrated non-Rayleigh backscatter coefficient between 16 and 33 km at Mauna Loa, Hawaii, 15 January 1985-24 June 1986. The decline of El Chichón aerosols toward background January-May 1985 was interrupted by the 30 May arrival of aerosols from an unknown source, perhaps originating in the Southern Hemisphere several months earlier. Aerosols from Ruiz appeared in late November 1985 and a gradual increase again from an unknown source, was detected February-June, 1986. Courtesy or Thomas DeFoor. |
At Hampton, VA, peak backscattering ratios have declined slightly since late April but integrated backscattering has generally increased. An unusually high tropopause on 9 June depressed integrated values but the remaining profile was similar in shape to others during the month. Lidar data from Firenze, Italy (43.78°N, 11.25°E) indicated a very small aerosol layer at about 20 km, with a scattering ratio (at 0.53 µm wavelength) of about 1.2-1.3.
Richard Keen observed the 24 April lunar eclipse from Auckland, New Zealand. Visual magnitude of the moon at mid-eclipse was -2.0, very close to the theoretical brightness for this eclipse, yielding a derived volcanic aerosol optical thickness of 0.00 ± 0.02. Because the moon passed through the southern part of the earth's shadow, this value is representative of the Southern Hemisphere stratosphere. The 28 October 1985 Southern Hemisphere lunar eclipse also yielded an unmeasureable volcanic aerosol optical thickness, suggesting that there had been no significant recent injections of stratospheric aerosols from Southern Hemisphere volcanoes. Stratospheric aerosols from an early 1985 Southern Hemisphere eruption suggested above by DeFoor were below the eclipse detection threshold.
Information Contacts: Thomas DeFoor, Mauna Loa Observatory, P.O. Box 275, Hilo, HI 96720 USA; William Fuller, NASA Langley Research Center, Hampton, VA 23665 USA; Leopoldo Stefanutti, Istituto di Ricerca sulle Onde Elettromagnetiche, CNR, Via Panciatichi 64, 50127 Firenze, Italy; Richard Keen, CIRES, Campus Box 449, University of Colorado, Boulder, CO 80309 USA.
Cite this Report
Ruiz stratospheric aerosols persist
A NASA airborne lidar mission, supporting correlative measurements with the SAGE II satellite, was flown on the NASA-Wallops P-3 aircraft on 29 and 31 July from Peterson AFB, Colorado Springs. Data collected 29 July over Laramie, WY and SE Utah, and on 31 July over Laramie were similar (figure 29). Other correlative measurements supporting the experiment were in-situ balloon-borne aerosol sampling, H2O vapor, O3, balloon-borne NO2, sun photometer, and high-altitude sampling from a NASA U-2 aircraft. Balloon data over Laramie showed peak concentrations of 1.5 particles (radius > 0.15 µm) per cm3 at 19-20 km altitude.
 |
Figure 29. Airborne lidar data collected from Laramie, WY and SE Utah in support of SAGE II satellite observations, Germany, and Hawaii, showing altitudes of aerosol layers. Backscattering ratios are for the ruby wavelength of 0.69 µm. The integrated value shows total backscatter, expressed in steradians, integrated over 300-m intervals from the 16-33 km at Mauna Loa. Altitudes of maximum backscattering ratios and coefficients are shown for each layer at Mauna Loa. |
Lidar profiles from Mauna Loa, Hawaii showed broader layers in early July than in June, suggesting vertical dispersal of Ruiz aerosols, but a sharper layer was detected on 28 July. Total backscatter was about the same as in June. At Garmisch-Partenkirchen, Germany, altitudes and peak backscattering ratios in June were similar to those in May.
Information Contacts: William Fuller, NASA Langley Research Center, Hampton, VA 23665 USA; Thomas DeFoor, Mauna Loa Observatory, P.O. Box 275, Hilo, HI 96720 USA; H. Jäger, Fraunhofer-Institut für Atmosphärische Umweltforschung, Kreuzeckbahnstrasse 19, D-8l00 Garmisch-Partenkirchen, West Germany; James Rosen, Department of Physics and Astronomy, University of Wyoming, Laramie, WY 82071 USA.
Cite this Report
Ruiz aerosol layer broader and less intense
Stratospheric aerosols from from the November 1985 eruption of Ruiz persisted through over Mauna Loa, Hawaii. The zone of enhanced lidar backscattering was distinctly broader and less intense than it had been several months earlier (figure 30). However, total backscatter has remained relatively stable since the arrival of Ruiz aerosols over Mauna Loa in late November. At Hampton, VA, peak backscattering remained at about the same altitude as in June, but total backscatter had declined since late June.
 |
Figure 30. Average monthly lidar profiles at Mauna Loa, Hawaii, March-August, 1986. The dotted line superimposed on each profile represents the average 5-22 November 1985 data, before the arrival of Ruiz aerosols. |
Information Contacts: Thomas DeFoor, Mauna Loa Observatory, P.O. Box 275, NllO, Hawaii 96720 USA; William Fuller, NASA Langley Research Center, Hampton, VA 23665 USA.
Cite this Report
New aerosol layers seen over Alaska
From Fairbanks, Alaska (64.83°N, 147.83°W) Glenn Shaw observed optical phenomena that may have been produced by volcanic aerosols. On 6 October at about 1600 local time, a thin striated filamentous layer with considerable wave structure, similar to subvisible cirrus, could be seen in the SW sky. The sun, at 6° altitude, turned blood red when it passed behind the layer. Altitude of the layer could not be precisely determined, but the summits of 5000-m mountains S of Fairbanks were clearly visible beneath it. At twilight, cloudiness partially obscured illumination of the layer, but strong colors did not appear, suggesting that the material was not stratospheric. Similar aerosols were visible on 8 October. Optical effects of layers of dust from Asian deserts (usually in the spring), and probable industrial air pollution from Siberia ("Arctic haze"; usually in the winter) are distinctly different from those observed on 6 and 8 October. No eruption clouds were evident in an initial inspection of 4-6 October Japanese GMS imagery, and no large explosive eruptions have been reported at high northern latitudes.
About a month earlier (on 9 September), Fred Schaaf observed ultra-cirris clouds from Millville, New Jersey (39.4°N, 74.9°W) for the first time since December. They were brightly illuminated at a solar depression angle of 4-5°, and oriented parallel to the western horizon. At 1942, striations were still visible up to 6°, although purple illumination was almost gone, indicating an altitude of roughly 16 km for their tops.
Lidar from Hawaii, Japan, Virginia, and Germany continued to detect stratospheric aerosols from the November 1985 eruption of Ruiz, but showed no evidence of new aerosol layers. Data from Mauna Loa, Hawaii were similar in August and September. However, in mid to late Septemver, the broad stratospheric layer typically had a pair of peaks instead of the single maximum backscattering value that had characterized previous months (figure 31). At Fukuoka, Japan, peak backscattering increased slightly from early August through late September, but the height of the peak values remained similar. The altitude of the strongest layer over Garmisch-Partenkirchen, Germany dropped from about 20 km in July and August to 16-17 km on 5 and 22 September, but returned to about 20 km on 30 September; scattering ratios remained approximately stable. The 16 September measurement at Hampton, VA yielded data very similar to August values.
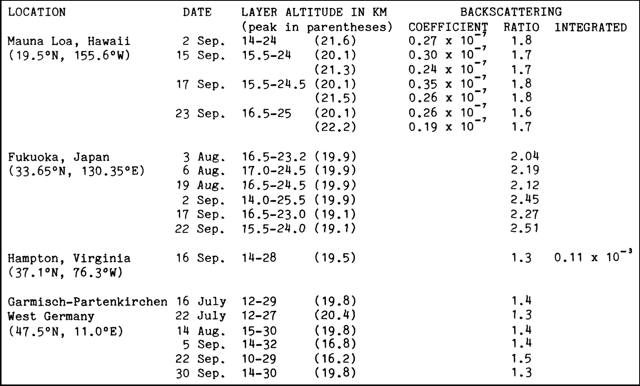 |
Figure 31. Lidar data from various locations, showing altitudes of aerosol layers. Note that some layers have multiple peaks. Backscattering ratios from Fukouka, Japan, are for the Nd-YAG wavelength of 1.06 µm; all others are for the ruby wavelength of 0.69 µm. Integrated values show total backscatter, expressed in steradians-1, integrated over 300-m intervals from the tropopause to 30 km at Hampton. Altitudes of maximum backscattering ratios and coefficients are shown for each layer at Mauna Loa. |
Information Contacts: Glenn Shaw and Juergen Kienle, Geophysical Institute, University of Alaska, Fairbanks, AK 99775 USA; Will Gould, NOAA/NESDIS, Room 100, World Weather Bldg,, Washington, DC 20233 USA; Thomas DeFoor, Mauna Loa Observatory, P.O. Box 275, Hilo, HI 96720 USA; Motowo Fujiwara, Physics Department, Kyushu University, Fukuoka 812, Japan; H. Jäger, Fraunhofer-Institut für Atmosphärische Umweltforschung, Kreuzeckbahnstrasse 19, D-8100 Garmisch-Partenkirchen, West Germany; William Fuller, NASA Langley Research Center, Hampton, VA 23665 USA; Fred Schaaf, 706 E St., Millville, New Jersey 08332 USA.
Cite this Report
New stratospheric aerosols over Europe, Japan, and USA; 24 September Etna eruption possible source
Lidar in Italy, Germany, Japan, and the USA detected the arrival of new stratospheric aerosols between 29 September and 5 November (figure 32), but their source remains uncertain. The 24 September eruption of Mt. Etna produced substantial tephra falls, but ground observers estimated that the eruption column reached a maximum altitude of only 10-13 km. No other strong explosive eruptions have been reported in recent months.
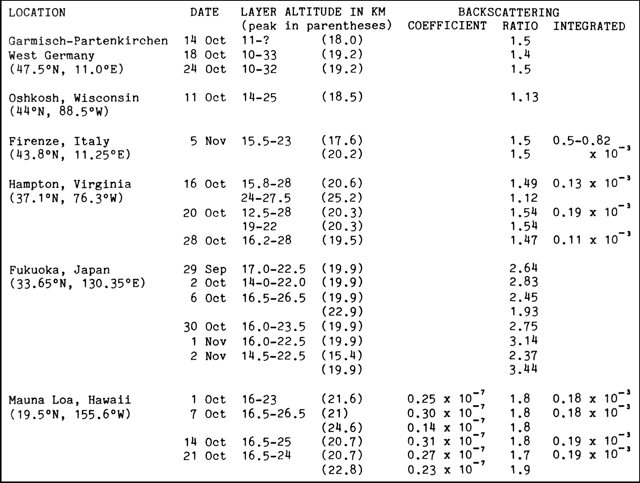 |
Figure 32. Lidar data from various locations, showing altitudes of aerosol layers. Note that some layers have multiple peaks. Backscattering ratios from Fukouka, Japan, are for the Nd-YAG wavelength of 1.06 µm; from Oshkosh, Wisconsin, for the Nd-YAG wavelength of 0.53 µm; all others are for the ruby wavelength of 0.69 µm. Integrated values show total backscatter, expressed in steradians-1, integrated over 300-m intervals from 16-33 km at Mauna Loa and from the tropopause to 30 km at Hampton. Altitudes of maximum backscattering ratios and coefficients are shown for each layer at Mauna Loa. |
From Fukuoka, Japan, a sharp new peak in the lidar profile at 19.9 km altitude, accompanied by a general background increase in stratospheric aerosols, was first detected 29 September. The new peak was less distinct during the next observation, on 2 October, but the increase in total backscatter was substantial, especially at altitudes below the peak. On 6 October, a secondary peak was detected at 23 km, associated with a substantial increase in backscattering at 22-26 km. No observations were made 7-29 October, but data 30 October and 1-2 November continued to show substantially enhanced total backscatter.
Lidar in Garmisch-Partenkirchen, Germany showed a peak on 24 October from an apparently fresh layer that was probably not thicker than 500-1000 m. During initial observations (1807-1821 local time; = GMT + 1 hour), the peak was seen at 19.2 km altitude; later (1822-1845) at 19.8 km. Scattering ratios of the individual peaks were about 1.6.
At Firenze, Italy, lidar measurements resumed on 5 November, when a distinct new aerosol layer was observed from 15.5 to at least 18 km altitude. Data were noisy above 20 km, but a second peak was noted at 20.2 km and possible enhancement continued to 23 km.
At Hampton, VA, a new layer at 18.5-22 km was first seen on 16 October, 1 month after the previous observation. The layer remained evident on 20 October, but by the 28th had merged with remnants of the November 1985 Ruiz aerosols. Data collected at Oshkosh, Wisconsin (44°N, 88.5°W) on 11 October did not appear to show new aerosols. Data from Mauna Loa, Hawaii seemed to show an increase in total backscatter, but no fresh aerosol layers were evident.
Particle sampling data from balloons launched near Laramie, WY showed a new layer of condensation nuclei (CN), too small to be detected by lidar, on 5 September. CN concentrations were about 100 x normal background values in a zone about 0.75 km thick. By 1 October, the layer had broadened to 2 km (22-24 km altitude) but concentrations had decreased to about 5 x background. In early September, particle sizes were an order of magnitude smaller than normal for that altitude, but were somewhat larger by the beginning of October. Balloon launches from Laramie will resume in December.
Information Contacts: Motowo Fujiwara, Physics Department, Kyushu University, Fukuoka 812, Japan; Leopoldo Stefanutti, Istituto di Ricerca sulle onde Elettromagnetiche, CNR, Via Panciatichi 64, 50127 Firenze, Italy; H. Jäger, Fraunhofer-Institut für Atmosphärische Umweltforschung, Kreuzeckbahnstrasse 19, D-8100 Garmisch-Partenkirchen, West Germany; William Fuller, NASA Langley Research Center, Hampton, VA 23665 USA; Thomas DeFoor, Mauna Loa Observatory, P.O. Box 275, Hilo, HI 96720 USA; James Rosen, Department of Physics and Astronomy, University of Wyoming, Laramie, WY 82071 USA.
Cite this Report
Enhanced aerosols persist; perhaps brought from tropics by seasonal winds
Lidar stations continued to detect increased stratospheric aerosols in November (figure 33). At Mauna Loa, Hawaii, a substantial increase in both peak and total backscatter was measured 18 November and numerous tiny sharp peaks were evident on initial data. From Fukuoka, Japan, very sharp peaks were recorded between 20.5 and 22 km altitude on 10, 17, and 21 November. Lidar at Hampton, VA detected both increased total backscatter and the presence of new higher-latitude layers in late November and early December. A thin layer at 21 km altitude was measured from Garmisch-Partenkirchen, Germany on 7 November, slightly higher than another new layer that had been observed on 24 October.
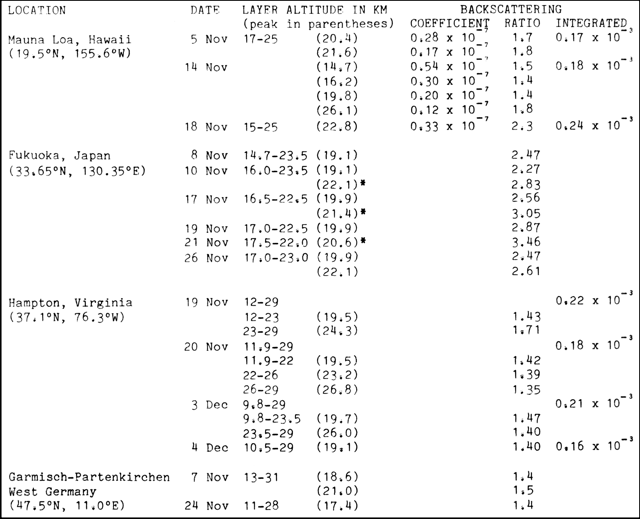 |
Figure 33. Lidar data from various locations, showing altitudes of aerosol layers. Note that some layers have multiple peaks. Backscattering ratios from Fukouka, Japan, are for the Nd-YAG wavelength of 1.06 µm; all others are for the ruby wavelength of 0.69 µm. Integrated values show total backscatter, expressed in steradians-1, integrated over 300-m intervals from 16-33 km at Mauna Loa and from the tropopause to 30 km at Hampton. Altitudes of maximum backscattering ratios and coefficients are shown for each layer at Mauna Loa. Layers from Fukuoka, Japan, marked with an asterisk have very sharp peaks. |
No eruption columns are known to have penetrated the stratosphere since the November 1985 eruption of Ruiz, although a brief strong explosive eruption occurred at Etna on 24 September, shortly before the initial appearance of increased aerosols. M. P. McCormick suggested the following interpretation for the observations.
"At certain times of the year, SAGE and SAGE II satellite observations show layers at altitudes well above the 'normal' stratospheric aerosol peak for that particular latitude. A clear seasonal cycle has become evident in both hemispheres, showing low-latitude type layers outside the equatorial belt in late fall and winter periods, with very few cases observed in summer (figure 34). The most obvious explanation for this 'extra' layer is that we are observing transport of low-latitude aerosols into the winter hemisphere by planetary wave activity, which is greater in the winter hemisphere. Care must be given, therefore, to interpreting local measurements by lidar or made in situ which show this type of layer as possibly due to a new volcanic eruption."
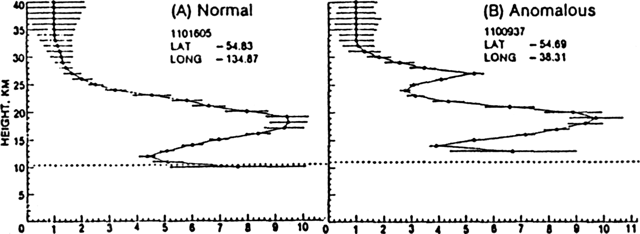 |
Figure 34. Extinction ratio (aerosol plus molecular extinction divided by molecular extinction) plotted as a function of altitude for two SAGE II observations taken on the same day at different longitudes. The B profile shows a secondary peak at about 27 km, well above the 'normal' peak for this latitude. Presented by G. S. Kent at the Sixth Conference on Atmospheric Radiation, Williamsburg, VA, May 12-16, 1986. |
Information Contacts: M.P. McCormick and William Fuller, NASA Langley Research Center, Hampton, VA 23665 USA; Thomas DeFoor, Mauna Loa Observatory, P.O. Box 275, Hilo, HI 96720 USA; Motowo Fujiwara, Physics Department, Kyushu University, Fukuoka 812, Japan; H. Jäger, Fraunhofer-Institut für Atmosphärische Umweltforschung, Kreuzeckbahnstrasse 19, D-8100 Garmisch-Partenkirchen, West Germany.
Cite this Report
Continued fluctuations in stratospheric aerosols
From Mauna Loa, Hawaii, lidar data on 2 December showed a sharp decline in aerosols between 21 and 25 km altitudes (figure 35), the zone where increased concentrations were observed in November. Data later in December showed aerosols returning to that altitude range.
 |
Figure 35. Lidar data from Hawaii and Virginia, showing altitudes of aerosol layers. Note that some layers have multiple peaks. Backscattering ratios are for the ruby wavelength of 0.69 µm. Integrated values show total backscatter, expressed in steradians-1, integrated over 300-m intervals from 16-33 km at Mauna Loa and from the tropopause to 30 km at Hampton. Because of probable cirrus layers at 14-17 km on 30 December at Mauna Loa and 11.1-12.8 km on 22 December at Hampton, data are integrated from 17.1 and 13 km, respectively. If different, altitudes of maximum backscattering ratios and coefficients are shown for each layer at Mauna Loa. |
On 30 December, NE-SW bands of clouds about 500 km long and 250 km apart were seen in the vicinity of Hawaii on infrared weather satellite imagery. Cloud altitudes could not be determined from the satellite data. They looked like gravity waves in cirrus, and may have caused the very sharp peak detected by lidar that night between 14 and 17 km (tropopause altitude was 16.5 km). Lidar profiles from Hampton, VA in late December and early January were similar to the 4 December data, unlike the complex layers observed in November.
Information Contacts: Thomas DeFoor, Mauna Loa Observatory, P.O. Box 275, Hilo, HI 96720 USA; William Fuller, NASA Langley Research Center, Hampton, VA 23665 USA.
Cite this Report
4.5 years of lidar data summarized
Lidar data from Mauna Loa, Hawaii continued to show remnants of the broad aerosol layer seen 18 November and 12 and 16 December between 20 and 25 km altitude (figure 36). Only the upper portion of the layer was detected 6 and 20 January and only the lower portion on the 16th, suggesting the layer was breaking up into different atmospheric circulation regimes. From Fukuoka, Japan, some higher altitude peaks continued to be detected through early January, but peak values were declining later in the month. Data from Garmisch-Partenkirchen, Germany showed that peak backscattering ratios increased slightly from early December through late January, while peak altitudes declined gradually.
 |
Figure 36. Lidar data from various locations, showing altitudes of aerosol layers. Note that some layers have multiple peaks. Backscattering ratios from Fukouka, Japan, are for the Nd-YAG wavelength of 1.06 µm; all others are for the ruby wavelength of 0.69 µm. Integrated values show total backscatter, expressed in steradians-1, integrated over 300-m intervals from 16-33 km at Mauna Loa and from the tropopause to 30 km at Hampton. Altitudes of maximum backscattering ratios and coefficients are shown for each layer at Mauna Loa. |
Peak backscattering ratios measured at four lidar observation sites since the March/April 1982 eruption of El Chichón showed that values at sites nearer the equator remained substantially stronger through late 1982, as aerosols gradually migrated to higher latitudes. A generally consistent decline then continued until the November 1985 Ruiz eruption. Data remained scattered through late 1986, with no obvious trends.
Information Contacts: Thomas DeFoor, Mauna Loa Observatory, P.O. Box 275, Hilo, HI 96720 USA; M.P. McCormick and William Fuller, NASA Langley Research Center, Hampton, VA 23665 USA; Motowo Fujiwara, Physics Department, Kyushu University, Fukuoka 812, Japan; H. Jäger, Fraunhofer-Institut für Amosphärische Umweltforschung, Kreuzeckbahnstrasse 19, D-8100 Garmisch-Partenkirchen, West Germany.
Cite this Report
Aerosols weaken slowly; 1985-86 Hawaii data
Lidar observations from Hampton, VA continued to show a second aerosol layer above 23 km altitude through late February, but it was thinner by the 25th, and appeared to be absent the first week in March. Aerosols over Mauna Loa, Hawaii were weaker in February than in January, with most of the decline in the lower stratosphere (figure 38).
 |
Figure 37. Lidar data from Hawaii and Virginia, showing altitudes of aerosol layers. Note that some layers have multiple peaks. Backscattering ratios are for the ruby wavelength of 0.69 µm. Integrated values show total backscatter, expressed in steradians-1, integrated over 300-m intervals from 16-33 km at Mauna Loa and from the tropopause to 30 km at Hampton. Altitudes of maximum backscattering ratios and coefficients are shown for each layer at Mauna Loa. Note that the backscattering ratio for the 10 February measurement at Hampton has been revised from the previously reported value. An unusually low tropopause (8 km) over Hampton on 12 February resulted in an increased integrated value that night. |
 |
Figure 38. Average monthly lidar profiles from Mauna Loa, Hawaii. September 1986-February 1987. The dotted line superimposed on each profile represents the average 5-22 November data, before the arrival of the Ruiz aerosols. |
January 1985-December 1986 integrated backscatter data from Mauna Loa shows decay of the El Chichón aerosol through May 1985, when a sudden increase was detected from an unknown source, then a decline until the appearance of Ruiz material in November 1985. Data have been irregular since then, but 1986 has shown a slight increase in mean integrated backscatter, despite the absence of any known injection of volcanic aerosols into the stratosphere.
Information Contacts: Thomas DeFoor, Mauna Loa Observatory, P.O. Box 275, Hilo, HI 96720 USA; William Fuller, NASA Langley Research Center, Hampton, VA 23665 USA.
Cite this Report
Ruiz aerosols persist; optical effects seen from England
Stratospheric aerosol layers observed from Fukuoka, Japan, have been significantly disturbed since late February (figure 39). Additional layers were detected at higher altitudes and backscattering ratios increased. February and March lidar data from Garmisch-Partenkirchen, Germany, generally showed peaks at higher altitudes than in January, but backscattering ratios remained similar. At Mauna Loa, Hawaii, a progressive depletion of aerosols in the lower stratosphere continued through March, but increased concentration between 21 and 25 km compensated for declines from 16 to 21 km, yielding the same average integrated backscatter as in February.
 |
Figure 39. Lidar data from various locations, showing altitudes of aerosol layers. Note that some layers have multiple peaks. Backscattering ratios from Fukouka, Japan, are for the Nd-YAG wavelength of 1.06 µm; all others are for the ruby wavelength of 0.69 µm. Integrated values show total backscatter, expressed in steradians-1, integrated over 300-m intervals from 16-33 km at Mauna Loa. Altitudes of maximum backscattering ratios and coefficients are shown for each layer at Mauna Loa. |
H. H. Lamb has continued to monitor twilight optical effects from Holt, England (53°N, 1°E). No remarkable evening colors were observed through late spring and most of the summer of 1986. On 8 September at 1850 GMT (20 minutes after sunset), the W sky was a cold yellow color. During the next 10 minutes a purplish patch of light developed, to 23° elevation at 1855 and 19° at 1900, suggesting that the illuminated layer was at 18-20 km altitude. By 1905, the sky near the horizon was a fiery red. Similar phenomena were observed 17-18 September, the last 5 days of October, and 15 November. Abnormal yellow color was visible in the evening sky on 14 and 20 December, and on the 20th a purple patch developed above the yellow, grading into white. A purple patch was seen again at dawn on the 21st, with a crepuscular ray to beyond 20° elevation at 0730 GMT, about 40 minutes before sunrise.
These observations suggested an aerosol layer at an altitude of 20 km or more. None of the effects were as intense as those observed between 1982 and 1984-5, produced by the El Chichón aerosols. Lidar in Italy, Germany, Japan, and the USA had begun to detect additional aerosol layers between late September and early November, and aerosol material, probably in the upper troposphere, was visible in daylight from Fairbanks, Alaska in early October. However, satellite data suggested that these apparent new aerosols may have been older material seasonally transported from lower to higher latitudes.
Information Contacts: H.H. Lamb, Climatic Research Unit, School of Environmental Sciences, University of East Anglia, Norwich NR4 7TJ England; Thomas DeFoor, Mauna Loa Observatory, P.O. Box 275, Hilo, HI 96720 USA; Motowo Fujiwara, Physics Department, Kyushu University, Fukuoka 812, Japan; Horst Jäger, Fraunhofer-Institut für Atmosphärische Umweltforschung, Kreuzeckbahnstrasse 19, D-8100 Garmisch-Partenkirchen, West Germany.
Cite this Report
Ruiz aerosols remain in stratosphere
Lidar in Hawaii, Virginia, and Germany continued to detect stratospheric aerosols from the November 1985 eruption of Ruiz (figure 40). Data from Mauna Loa, Hawaii showed a continuing gradual decline in both total backscatter and the thickness of the zone of enhanced aerosols. From Hampton, VA, the aerosol layer was quite uniform from the tropopause upward, with little sublayering evident. Altitudes of peak backscattering measured from Garmisch-Partenkirchen, Germany, which had increased slightly in February and March, returned to January levels. Backscattering ratios have remained stable.
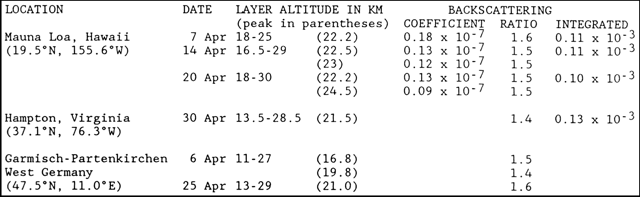 |
Figure 40. Lidar data from various locations, showing altitudes of aerosol layers. Note that some layers have multiple peaks. Backscattering ratios are for the ruby wavelength of 0.69 µm. Integrated values show total backscatter, expressed in steradians-1, integrated over 300-m intervals from 16-33 km at Mauna Loa. Altitudes of maximum backscattering ratios and coefficients are shown for each layer at Mauna Loa. |
Information Contacts: Thomas DeFoor, Mauna Loa Observatory, P. O. Box 275, Hilo, HI 96720 USA; Horst Jäger, Fraunhofer-Institut für Atmosphärische Umweltforschung, Kreuzeckbahnstrasse 19, D-8100 Garmisch-Partenkirchen, West Germany; William Fuller, NASA Langley Research Center, Hampton, VA 23665 USA.
Cite this Report
Ruiz aerosols persist in stratosphere
Lidar in Hawaii, Virginia, and Germany continued to detect remnants of the aerosols from the November 1985 eruption of Ruiz (figure 41). Total backscatter over Hawaii increased in late May, as a higher altitude layer, centered around 28 km, became evident. This material lacked the sharp sublayering that generally characterizes fresh aerosols, and no large explosive eruptions have recently been reported.
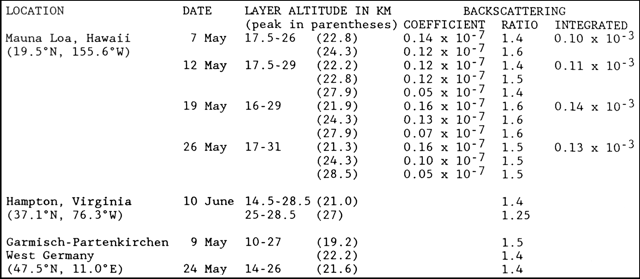 |
Figure 41. Lidar data from various locations, showing altitudes of aerosol layers. Note that some layers have multiple peaks. Backscattering ratios are for the ruby wavelength of 0.69 µm. Integrated values show total backscatter, expressed in steradians-1, integrated over 300-m intervals from 16-33 km at Mauna Loa. Altitudes of maximum backscattering ratios and coefficients are shown for each layer at Mauna Loa. |
Smoke from major forest fires in China that started 6 May could be tracked on polar orbiting satellite imagery as it moved over Kamchatka and S of the Aleutian Islands. The maximum altitude reached by the smoke was uncertain.
Information Contacts: Thomas DeFoor, Mauna Loa Observatory, P.O. Box 275, Hilo, HI 96720 USA; Horst Jäger, Fraunhofer-Institut für Atmosphärische Umweltforschung, Kreuzeckbahnstrasse 19, D-8100 Garmisch-Partenkirchen, West Germany; William Fuller, NASA Langley Research Center, Hampton, VA 23665 USA.
Cite this Report
New stratospheric layer may be from forest fire smoke
An apparently new aerosol layer was detected at the base of the stratosphere on lidar and balloon data. The source of the aerosols was uncertain. No large explosive eruptions were documented in the weeks before the layer was first observed in early June. However, large forest fires that burned from about 6 to 22 May in N China produced extensive clouds of smoke that were tracked for thousands of kilometers on NOAA weather satellite imagery. One major smoke plume moved over Kamchatka, then covered most of the Gulf of Alaska before advancing over Canada's Yukon Territory. Another extended into the Arctic Basin in streamers several hundred kilometers wide and thousands of kilometers long. A third major zone of smoke entered a low pressure area and could be traced as far as Ellesmere Island, just W of northern Greenland.
Instruments on a balloon launched near Laramie, WY on 29 May detected strong particle enhancement from ground level through the tropopause into the lower stratosphere. Highest values were measured between 10 km and the top of the layer at about 13 km, with concentrations of particles larger than 0.15 µm exceeding 10/19cm3, compared to recent lower stratospheric values of about 0.5/cm3. Concentrations remained above 5/cm3 throughout the troposphere, increasing to more than 10/19cm3 near ground level. More than a month later (8 July), the next balloon flight from Laramie detected no unusual tropospheric material, but an aerosol layer extended from the tropopause at 11 km to about 14 km. Counts of particles larger than 0.15 µm reached 3/cm3. The layer was relatively smooth and the distribution of particle sizes suggested that it was probably several weeks old (figure 42). The ratios of the number of particles of 0.15 µm diameter to those of 0.25 µm size was somewhat less than 10 on 29 May, decreasing to about 5 on 8 July. Smaller particles are generally expected from biomass burning, typically yielding ratios of the 0.15/0.25 µm size fractions greater than 10, compared to values of 2-5 for eruption-generated aerosols.
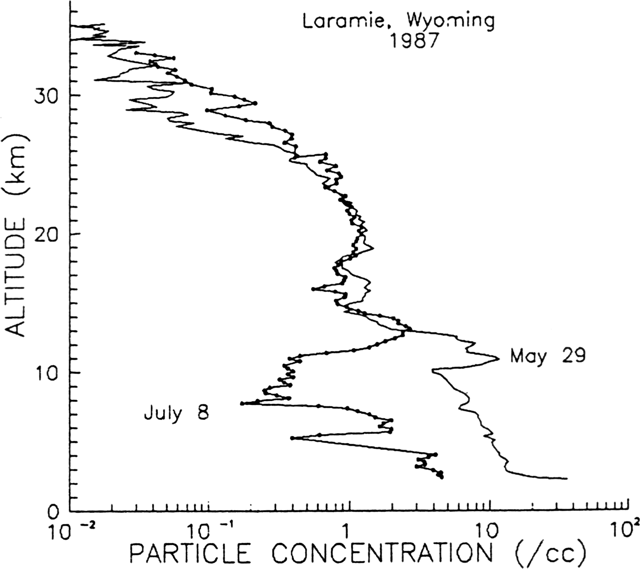 |
Figure 42. Plots of concentrations of particles with radii >0.15 µm counted from balloons launched from Laramie, WY on 29 May and 8 July 1987. Note that the x axis is a logarithmic scale. The 8 July tropopause was at about 11 km altitude. |
Lidar at Hampton, VA detected a distinct layer between the tropopause (13 km) and 15 km altitude on 10 June (figure 43). Eight days later, remnants of the layer were still present, but it was not evident on 25 or 29 June.
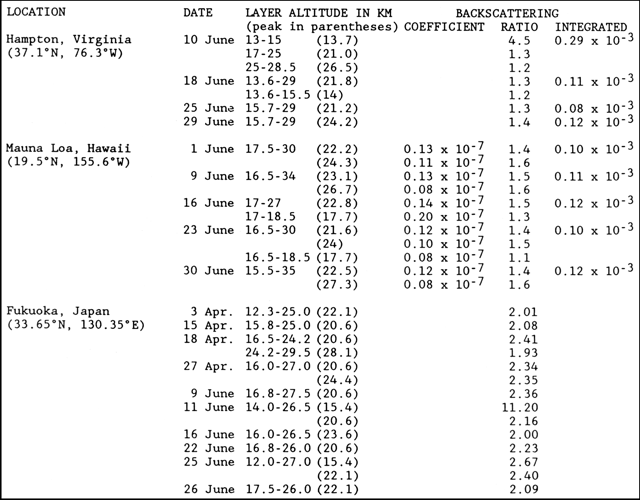 |
Figure 43. Lidar data from various locations, showing altitudes of aerosol layers. Note that some layers have multiple peaks. Backscattering ratios from Fukouka, Japan, are for the Nd-YAG wavelength of 1.06 µm; all others are for the ruby wavelength of 0.69 µm. Integrated values show total backscatter, expressed in steradians-1, integrated over 300-m intervals from 16-33 km at Mauna Loa and from the tropopause to 30 km at Hampton, Virginia. Altitudes of maximum backscattering ratios and coefficients are shown for each layer at Mauna Loa. |
A strong but thin layer at the tropopause (15.6 km) was observed 19 May by lidar at Mauna Loa, Hawaii, and the upper troposphere was very turbid during the next measurement, on 26 May. Each of the five June lidar measurements at Mauna Loa showed a small layer at the base of the stratosphere, most strongly on 16 June. The upper troposphere remained turbid through June. On 11 June a very strong scattering layer that had not been present 2 days earlier appeared just above the tropopause at Fukuoka, Japan. A similar but weaker layer was detected again on 25 June, but was not evident on 16, 22, or 26 June. Late on 10 July, lidar at Garmisch-Partenkirchen, West Germany measured minor peaks at 12.5 and 14 km, probably near the tropopause, with scattering ratios estimated at 1.2-1.3. The next day, peaks of the same intensity were observed at 14 and 16 km, and on 12 July there was a peak of the same scattering ratio at 15 km.
Integrated backscatter data from Mauna Loa, January 1985-June 1987, show a rapid decline in the aerosol produced by the 1982 El Chichón eruption, a sudden increase in June 1985 from an unknown source, then a decline until the appearance of the Ruiz aerosol in December 1985. A gradual increase was observed through much of 1986, then values have diminished for most of the first half of 1987.
Information Contacts: David Hofmann and James Rosen, Department of Physics and Astronomy, University of Wyoming, Laramie, WY 82071 USA; William Fuller and Mary Osborn, NASA Langley Research Center, Hampton, VA 23665 USA; Thomas DeFoor, Mauna Loa Observatory, P. O. Box 275, Hilo, HI 96720 USA; Motowo Fujiwara, Physics Department, Kyushu University, Fukuoka 812, Japan; Horst Jäger, Fraunhofer-Institut für Atmosphärische Umweltforschung, Kreuzeckbahnstrasse 19, D-8100 Garmisch-Partenkirchen, West Germany; Will Gould, NOAA/NESDIS, World Weather Building, Camp Springs, MD 20746, USA.
Cite this Report
New aerosols extend into lower stratosphere
New aerosols that extended into the lower stratosphere were detected at several locations in May and June: at Mauna Loa, Hawaii in each of seven lidar measurements 19 May-30 June; at Fukuoka, Japan on 11 and 25 June but not on three other June dates; at Hampton, VA on 10 and 18 June but not on the 25th or 29th; and from balloons above Laramie, WY on 29 May and 8 July. Peaks near the local tropopause were observed from Garmisch-Partenkirchen Germany beginning 24 May and on most dates through the end of July (table 4). However, July lidar data from Hawaii (figure 44) and Virginia no longer revealed any new material (figure 45).
Table 4. Lidar data from Garmisch-Partenkirchen, Germany (47.5°N, 11.0°E), showing altitudes of peak backscattering ratios of layers near the local tropopause, late May-late July.
| Date | Peak Altitude (km) | Tropopause (km) | Scattering Ratio |
| 24 May 1987 | 10.2 | 9.3 | 1.4 |
| 10 Jun 1987 | 13.2 | 11.4 | 1.4 |
| 22 Jun 1987 | 10.8 | 10.6 | 1.4 |
| 28 Jun 1987 | 15.0 | 13.5 | 1.3 |
| 10 Jul 1987 | 14.4 | 13.4 | 1.3 |
| 11 Jul 1987 | 13.8 | 13.1 | 1.5 |
| 11 Jul 1987 | 16.2 | -- | 1.6 |
| 12 Jul 1987 | 12.6 | 12.3 | 1.3 |
| 12 Jul 1987 | 15.6 | -- | 1.3 |
| 29 Jul 1987 | 14.4 | 11.2 | 1.2 |
 |
Figure 44. Average monthly lidar profiles from Mauna Loa Hawaii, February-July 1987. The dotted line superimposed on each profile represents the average 5-22 November 1985 data, before the arrival of Ruiz aerosols. Courtesy of Thomas DeFoor. |
 |
Figure 45. Lidar data from various locations, showing altitudes of aerosol layers. Note that some layers have multiple peaks. Backscattering ratios are for the ruby wavelength of 0.69 µm. Integrated values show total backscatter, expressed in steradians-1, integrated over 300-m intervals from 16-33 km at Mauna Loa and from the tropopause to 30 km at Hampton, Virginia. Altitudes of maximum backscattering ratios and coefficients are shown for each layer at Mauna Loa. |
Information Contacts: Horst Jäger, Fraunhofer-Institut für Atmosphärische Umweltforschung, Kreuzeckbahnstrasse 19, D-8100 Garmisch-Partenkirchen, West Germany; Thomas DeFoor, Mauna Loa Observatory, P. O. Box 275, Hilo, HI 23665 USA; William Fuller, NASA Langley Research Center, Hampton, VA 23665 USA.
Cite this Report
Aerosols at 12 km mostly H2SO4 spheres; no new layers
The last two Bulletins reported lower stratospheric layers, perhaps from forest fires in China. Since June, however, no evidence of these layers has been detected by lidar at Hampton, VA or Mauna Loa, Hawaii (figure 46). August profiles at Hampton were smooth, without significant sublayering. Altitudes of peak backscattering at Mauna Loa dropped from 26-29 km in July to 22-25 km in August. There were no indications of recent aerosol injections.
 |
Figure 46. Lidar data from Virginia and Hawaii, showing altitudes of aerosol layers during August 1987. Note that some layers have multiple peaks. Backscattering ratios are for the ruby wavelength of 0.69 µm. Integrated values show total backscatter, expressed in steradians-1, integrated over 300-m intervals from 16-33 km at Mauna Loa and from the tropopause to 30 km at Hampton, Virginia. Altitudes of maximum backscattering ratios and coefficients are shown for each layer at Mauna Loa. |
Samples taken on 3 August near San Francisco (about 37.7°N, 122.5°W) by a NASA aircraft at about 12 km altitude did not show unusual concentrations of aerosols. Most particles were H2SO4 spheres, with a few chlorides and nitrates. The size distribution was generally unimodal, with a mean geometric radius of 0.06 µm, but there was a small bulge at about 0.3 µm radius.
Information Contacts: Mary Osborn, NASA Langley Research Center, Hampton, VA 23665 USA; Thomas DeFoor, Mauna Loa Observatory, P. O. Box 275, Hilo, HI 23665 USA; Rudolf Pueschel, Mail Stop 245-5, NASA Ames Research Center, Moffett Field, California 94035 USA.
Cite this Report
Aerosols over Hawaii, 1974-87, summarized
September lidar data from Mauna Loa, Hawaii generally yielded profiles similar to those of the two previous months. On 1 September, aerosol backscattering above 20 km was significantly stronger than the month's average, but fresh layers were not evident and values returned to normal during the next measurement, on 8 September (figure 47). Poor weather limited lidar observations at Fukuoka, Japan during the summer, but data revealed no new aerosols after apparent forest fire debris was detected in the lower stratosphere on 11 and 25 June. A single broad aerosol layer was present over Hampton, VA during each of the September lidar measurements. Much of the variation in integrated backscatter was caused by varying tropopause heights. August and September data from Garmisch-Partenkirchen, West Germany were similar to those of July, but no layers near the local tropopause have been reported since late July.
 |
Figure 47. Lidar data from various locations, showing altitudes of aerosol layers during July-September 1987. Note that some layers have multiple peaks. Backscattering ratios from Fukouka, Japan, are for the Nd-YAG wavelength of 1.06 µm; all others are for the ruby wavelength of 0.69 µm. Integrated values show total backscatter, expressed in steradians-1, integrated over 300-m intervals from 16-33 km at Mauna Loa and from the tropopause to 30 km at Hampton, Virginia. Altitudes of maximum backscattering ratios and coefficients are shown for each layer at Mauna Loa. |
Integrated backscattering values at Mauna Loa since late 1974 show that the increase in stratospheric aerosols following the 1982 El Chichón eruption dwarfed the effects of other eruptions of the 13-year period. Although remnants of aerosols injected by the November 1985 eruption of Ruiz persist in the stratosphere, values are approaching background levels.
Information Contacts: Thomas DeFoor, Mauna Loa Observatory, P.O. Box 275, Hilo, HI 23665 USA; Horst Jäger, Fraunhofer-Institut für Atmosphärsiche Umweltforschung, Kreuzeckbahnstrasse 19, D-8100 Garmisch-Partenkirchen, West Germany; Motowo Fujiwara, Physics Department, Kyushu University, Fukuoka 812, Japan; William Fuller, NASA Langley Research Center, Hampton, VA 23665 USA.
Cite this Report
Stratospheric aerosols stable or declining
Stratospheric aerosol concentrations measured by lidar from Hawaii, Virginia, and Germany in October remained stable or declined slightly from the previous month (figure 48). Integrated backscatter over Mauna Loa, Hawaii on 27 October was the lowest since the 1982 eruption of El Chichón.
 |
Figure 48. Lidar data from Virginia, Hawaii, and Germany, showing altitudes of aerosol layers during October-November 1987. Note that some layers have multiple peaks. Backscattering ratios are for the ruby wavelength of 0.69 µm. Integrated values show total backscatter, expressed in steradians-1, integrated over 300-m intervals from 16-33 km at Mauna Loa and from the tropopause to 30 km at Hampton, Virginia. Altitudes of maximum backscattering ratios and coefficients are shown for each layer at Mauna Loa. |
Information Contacts: Thomas DeFoor, Mauna Loa Observatory, P.O. Box 275, Hilo, HI 96720 USA; William Fuller, NASA Langley Research Center, Hampton, VA 23665 USA; Horst Jäger, Fraunhofer-Institut für Atmosphärische Umweltforschung, Kreuzeckbahnstrasse 19, D-8100 Garmisch-Partenkirchen, West Germany.
Cite this Report
Lowest aerosol values since 1981
Lidar data from Mauna Loa, Hawaii continued to show a gradual decline in stratospheric aerosols (figure 49). Integrated backscattering on 24 November was the lowest measured since the 1982 increases associated with the eruptions of El Chichón and the "Mystery Cloud" (probably from the initial explosive phase of the December 1981-January 1982 Nyamuragira eruption in Zaire). Values measured in Virginia and Germany remained relatively stable. The low integrated backscattering recorded 9 October off the coast of North Carolina was attributed at least partly to the high tropopause that night.
 |
Figure 49. Average monthly lidar profiles from Mauna Loa, Hawaii, June-November 1987. The dotted line superimposed on each profile represents the average 5-22 November 1985 data, before the arrival of Ruiz aerosols. |
 |
Figure 50. Lidar data from various locations, showing altitudes of aerosol layers during October-November 1987. Note that some layers have multiple peaks. Data from the Cape hatteras area are from a NASA airborne mission taking correlative measurements with the SAGE II satellite. Backscattering ratios are for the ruby wavelength of 0.69 µm. Integrated values show total backscatter, expressed in steradians-1, integrated over 300-m intervals from 16-33 km at Mauna Loa and from the tropopause to 30 km at Hampton, Virginia and the NASA airborne mission. Altitudes of maximum backscattering ratios and coefficients are shown for each layer at Mauna Loa. The 22 October and 12 November data from Hampton replace previously published values. |
Information Contacts: William Fuller, NASA Langley Research Center, Hampton, VA 23665 USA; Thomas DeFoor, Mauna Loa Observatory, P. O. Box 275, Hilo, HI 96720 USA; Horst Jäger, Fraunhofer-Institut für Atmosphärische Umweltforschung, Kreuzeckbahnstrasse 19, D-8100 Garmisch-Partenkirchen, West Germany.
Cite this Report
1985-87 aerosol data from Hawaii summarized
A long-term decline in integrated backscattering measured at Mauna Loa, Hawaii persisted through the end of 1987. Aerosols from the 1982 eruption of El Chichón declined rapidly through the first half of 1985, followed by a sharp increase from a source that remains unknown, then a renewed decline until the arrival of Ruiz aerosols in December 1985. After a slow increase through much of 1986, aerosol concentrations have generally declined again through 1987. At low aerosol concentrations, data are sensitive to normalization effects, which probably accounts for many of the small changes plotted in 1987. However, a minor peak in mid-1987 may reflect the effects of large forest fires in China.
Altitudes of peak backscattering over Fukuoka, Japan were slightly higher in the autumn than during the summer but peak backscattering ratios changed little (figure 51). Values were similar at Garmisch-Partenkirchen, West Germany in November and December.
 |
Figure 51. Lidar data from various locations, showing altitudes of aerosol layers during October-December 1987. Note that some layers have multiple peaks. Backscattering ratios from Fukouka, Japan, are for the Nd-YAG wavelength of 1.06 µm; all others are for the ruby wavelength of 0.69 µm. Integrated values show total backscatter, expressed in steradians-1, integrated over 300-m intervals from 16-33 km at Mauna Loa and from the tropopause to 30 km at Hampton, Virginia. Altitudes of maximum backscattering ratios and coefficients are shown for each layer at Mauna Loa. |
Information Contacts: Thomas DeFoor, Mauna Loa Observatory, P. O. Box 275, Hilo, HI 96720 USA; Motowo Fujiwara, Physics Department, Kyushu University, Fukuoka 812, Japan; Horst Jäger, Fraunhofer-Institut für Atmosphärische Umweltforschung, Kreuzeckbahnstrasse 19, D-8100 Garmisch-Partenkirchen, West Germany.
Cite this Report
High latitude aerosols similar; 1982-87 values shown
The following is a report from William Fuller. "NASA Langley Research Center conducted a SAM II, Polar Stratospheric Cloud (PSC), and CHEOPS II (Chemistry of Ozone in the Polar Stratosphere) airborne mission 10-31 January. Stratospheric lidar measurements were conducted from Wallops flight facility (38°N, 76.3°W) to Andoya, Norway (69.3°N, 16°E) by way of Goose Bay, Canada and Iceland. The aerosol measurements showed very little change in the stratospheric profiles during the transit flight from Wallops to Andoya, and during the SAM II mission, as the data indicate (figure 52). The SAM II, CHEOPS II, and PSC missions were conducted from Andoya. A PSC mission was flown to 84°N, 15°W, to a low stratospheric temperature region where there was a high probability of the occurrence of PSCs. The early formation of PSCs was detected, peaking at 23 km with a scattering ratio of 1.22, but was much weaker than the PSC measurements of the 1984 and 1986 Arctic missions."
 |
Figure 52. Lidar data from various locations, showing altitudes of aerosol layers during December 1987-January 1988. Note that some layers have multiple peaks. Backscattering ratios are for the ruby wavelength of 0.69 µm. Integrated values show total backscatter, expressed in steradians-1, integrated over 300-m intervals from 16-33 km at Mauna Loa. Altitudes of maximum backscattering ratios and coefficients are shown for each layer at Mauna Loa. |
Concentrations of stratospheric aerosols over Hawaii continued to decline slowly, reflecting a long-term trend at other Northern Hemisphere sites (figure 53). Peak backscattering over Germany occurred at a somewhat higher altitude in January than in December.
 |
Figure 53. Peak aerosol backscatter, normalized to ruby values, from four lidar sites, 1 April 1982 (just after the first major explosion of El Chichón) through 1987. Courtesy of M.P. McCormick and William Fuller. |
Information Contacts: William Fuller, NASA Langley Research Center, Hampton, VA 23665 USA; Thomas DeFoor, Mauna Loa Observatory, P. O. Box 275, Hilo, HI 96720 USA; Horst Jäger, Fraunhofer-Institut für Atmosphärische Umweltforschung, Kreuzeckbahnstrasse 19, D-8100 Garmisch-Partenkirchen, West Germany.
Cite this Report
Stratospheric aerosol concentrations continue to decline
Stratospheric aerosol concentrations continued to decline in the absence of new large explosive eruptions (figure 54). Lidar profiles from Mauna Loa, Hawaii showed a return to conditions similar to those before the November 1985 Ruiz eruption. A distinct change was evident between the 1 March measurements from Hampton, VA and the previous data set in December, but values had not yet returned to background.
 |
Figure 54. Lidar data from various locations, showing altitudes of aerosol layers during February-March 1988. Note that some layers have multiple peaks. Backscattering ratios are for the ruby wavelength of 0.69 µm. Integrated values show total backscatter, expressed in steradians-1, integrated over 300-m intervals from 16-33 km at Mauna Loa and from the tropopause to 30 km at Hampton, Virginia. Altitudes of maximum backscattering ratios and coefficients are shown for each layer at Mauna Loa. |
Information Contacts: Thomas DeFoor, Mauna Loa Observatory, P. O. Box 275, Hilo, HI 96720 USA; Horst Jäger, Fraunhofer-Institut für Atmosphärische Umweltforschung, Kreuzeckbahnstrasse 19, D-8100 Garmisch-Partenkirchen, West Germany; William Fuller, NASA Langley Research Center, Hampton, VA 23665 USA.
Cite this Report
Lidar figures since 1974 summarized; Antarctic data
Lidar data from Hampton, VA continued to show a gradual decline in stratospheric aerosols, but values had not yet dropped to the level of 1977-79. Similar trends have been measured in Europe, Hawaii, and Japan (for 1982-87). The increased aerosol observed from Mauna Loa, Hawaii on 19 March (figure 55) was concentrated between 20 and 25 km altitude and did not appear to be newly injected material. January-March data from Fukuoka, Japan were similar to values measured in late 1987.
 |
Figure 55. Lidar data from various locations, showing altitudes of aerosol layers during January-March 1988. Note that some layers have multiple peaks. Backscattering ratios from Fukouka, Japan, are for the Nd-YAG wavelength of 1.06 µm; all others are for the ruby wavelength of 0.69 µm. Integrated values show total backscatter, expressed in steradians-1, integrated over 300-m intervals from 16-33 km at Mauna Loa and from the tropopause to 30 km at Hampton, Virginia. Altitudes of maximum backscattering ratios and coefficients are shown for each layer at Mauna Loa. |
Stratospheric aerosol measurements using Nd-YAG, frequency-doubled lidar (0.532 µm), were made from Italy's base at Terra Nova Bay, Antarctica (74.6988°S, 164.0856°E) from 28 December, 1987 to 10 February, 1988. Lidar data were compared with the Antarctic molecular atmosphere derived from the base Meteorological Office's daily radiosonde soundings. Good lidar profiles were obtained, most of them during the day, to more than 30 km height (figure 56). Aerosols were detected between about 16 and 25 km, with only gradual variations in the layer structure during the period. Integrated backscattering values (between 10 and 30 km) varied from 0.02-0.03 x 10⁻³.
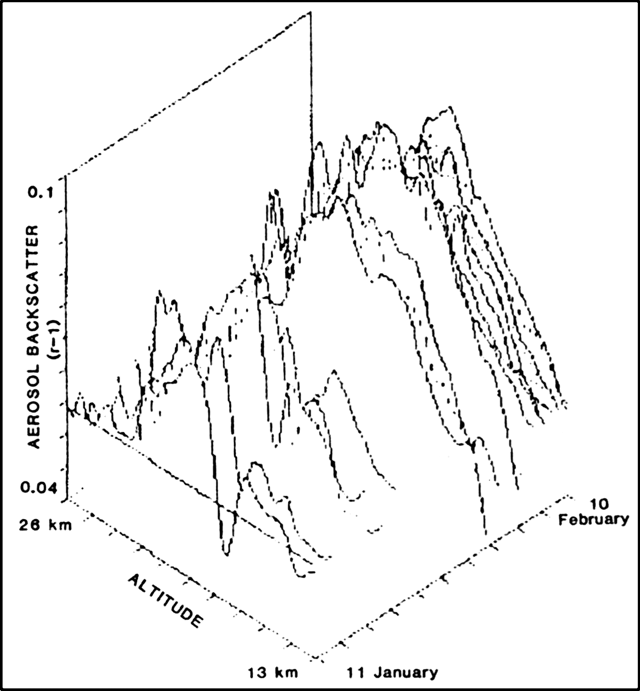 |
Figure 56. Lidar profiles (at 0.532 µm) from Italy's base at Terra Nova Bay, Antarctica (74.6988°S, 164.0856°E), 11 January-10 February, 1988. Courtesy of Leopoldo Stefanutti. |
The source of the Antarctic aerosols is uncertain. The last known vigorous explosive activity in the Antarctic region was the late 1984 eruption of Mt. Erebus but no eruption clouds large enough to penetrate the stratosphere were observed. Remnants of large eruptions elsewhere on the globe that continue to be detected at lower latitudes may also persist in the Antarctic stratosphere.
Information Contacts: Leopoldo Stefanutti, Istituto di Ricerca sulle Onde Elettromagnetiche, Via Panciatichi 64, 50127 Firenze, Italy; William Fuller, NASA Langley Research Center, Hampton, VA 23665 USA; Thomas DeFoor, Mauna Loa Observatory, P.O. Box 275, Hilo, HI 96720 USA; Motowo Fujiwara, Physics Department, Fukuoka University, Jonan-ku, Fukuoka 814-01, Japan.
Cite this Report
Little change in stratospheric aerosols
No eruptions are known to have added significant quantities of aerosols to the stratosphere since Ruiz in November 1985. April lidar profiles from Mauna Loa, Hawaii generally showed aerosols gradually returning to pre-Ruiz values, although enhanced backscattering was measured between about 21 and 25 km altitude on 19 March. March-April lidar data from Garmisch-Partenkirchen, West Germany showed little change in stratospheric aerosol values.
Information Contacts: Horst Jäger, Fraunhofer-Institut für Atmosphärische Umweltforschung, Kreuzeckbahnstrasse 19, D-8100 Garmisch-Partenkirchen, West Germany; Thomas DeFoor, Mauna Loa Observatory, P.O. Box 275, Hilo, HI 96720 USA.
Cite this Report
No new aerosols detected
No significant additions of aerosols to the stratosphere have been detected since the period following the eruption of Ruiz in November 1985. April and May lidar observations from Mauna Loa, Hawaii showed a continuation of the gradual decline in the stratosphere's aerosol content.
Information Contacts: Thomas DeFoor, Mauna Loa Observatory, P.O. Box 275, Hilo, HI 96720 USA.
Cite this Report
Small new layer near tropopause may be from Banda Api
Apparent small new aerosol layers near the tropopause, perhaps from the May eruption of Banda Api, Indonesia (4.525°S, 129.871°E), were detected by lidar at Mauna Loa, Hawaii and Fukuoka, Japan (figure 57). Very small lower stratospheric layers that looked sharp and fresh were evident on profiles from all three June observations at Mauna Loa (figure 58). The 8 June data showed peaks at 15.9 and 17.7 km altitude; only the peak at 17.7 km was evident on 16 and 21 June. Data from Fukuoka first showed a very thin layer at about 15.4 km altitude (about 1 km below the tropopause) on 5 July, nearly a month after the previous measurement on 10 June. The layer was less than 0.75 km thick, much thinner than the usual cirrus cloud. The next night, a similar layer appeared at the same altitude. Observation with a height resolution of 0.15 km showed it to be thinner than 0.3 km. No cirrus clouds were visible either night. No new layers were detected in late June from Hampton, VA.
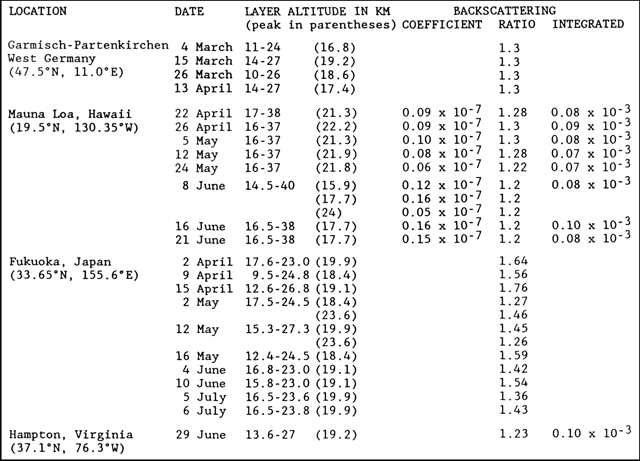 |
Figure 57. Lidar data from various locations, showing altitudes of aerosol layers during March-July 1988. Note that some layers have multiple peaks. Backscattering ratios from Fukouka, Japan, are for the Nd-YAG wavelength of 1.06 µm; all others are for the ruby wavelength of 0.69 µm. Integrated values show total backscatter, expressed in steradians-1, integrated over 300-m intervals from 16-33 km at Mauna Loa and from the tropopause to 30 km at Hampton, Virginia. Altitudes of maximum backscattering ratios and coefficients are shown for each layer at Mauna Loa. |
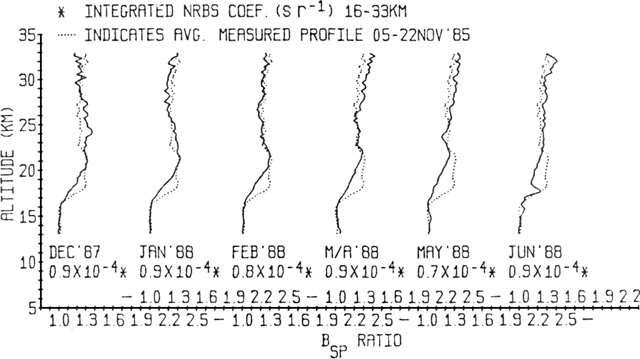 |
Figure 58. Average monthly lidar profiles from Mauna Loa, Hawaii, December 1987-June 1988. The dotted line superimposed on each profile represents the average 5-22 November 1985 data, before the arrival of Ruiz aerosols. |
Figure 59 shows vertically integrated backscattering at Garmisch-Partenkirchen, West Germany, 1982-87. Seasonal variations measured 1983-85 were discussed in Jäger and Carnuth, 1987. The 3 closely spaced higher values in May-June 1987 are from a lower stratospheric layer that may have been caused by strong forest fires in China.
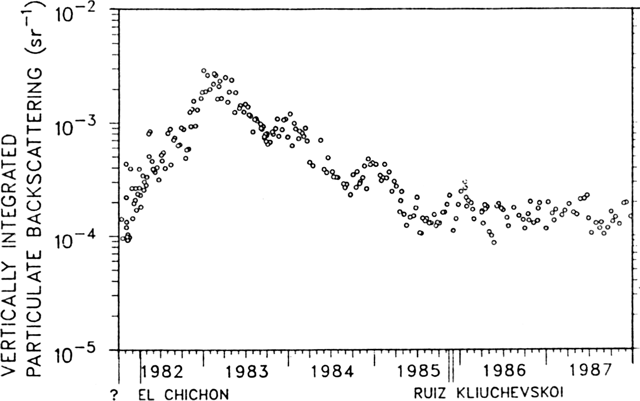 |
Figure 59. Vertically integrated ruby-wavelength backscattering data from Garmisch-Partenkirchen, West Germany, 1982-1987. Integration was performed from 1 km above the local tropopause to the top of the aerosol layer (at 25-35 km). |
Reference. Jäger, H., and Carnuth, W., 1987, The Decay of the El Chichón Stratospheric Perturbation, Observed by Lidar at Northern Midlatitudes; Geophysical Research Letters, v. 14, p. 696-699.
Information Contacts: Motowo Fujiwara, Physics Department, Fukuoka University, Jonan-ku, Fukuoka 814-01, Japan; Thomas DeFoor, Mauna Loa Observatory, P. O. Box 275, Hilo, HI 96720 USA; Horst Jäger, Fraunhofer-Institut für Atmosphärische Umweltforschung, Kreuzeckbahnstrasse 19, D-8100 Garmisch-Partenkirchen, West Germany; William Fuller and Mary Osborn, NASA Langley Research Center, Hampton, VA 23665 USA.
Cite this Report
Decline in aerosol backscattering
Lidar data from the USSR showed aerosols at similar altitudes as those observed at other Northern Hemisphere locations (figure 60), but data from Obninsk (55°N, 38°E) on 30 June included a higher altitude layer. Integrated backscattering returned to 3 April/27 May values after a substantial decline in late May and early June. No evidence of material from the 29 July eruption of Makian (Indonesia) had been detected by lidar stations as of early August. Lidar data from Mauna Loa, Hawaii has documented a a continuing irregular decline in integrated aerosol backscattering since late 1986. No large explosive eruptions are known to have produced significant stratospheric aerosols since the Ruiz eruption of November 1985.
 |
Figure 60. Lidar data from various locations, showing altitudes of aerosol layers during April-August 1988. Note that some layers have multiple peaks. Backscattering ratios from Obninsk and Teplokluchenka, USSR, are for the Nd-YAG wavelength of 0.53 µm; all others are for the ruby wavelength of 0.69 µm. Integrated values show total backscatter, expressed in steradians-1, integrated over 500-m intervals from 15-30 km at Obninsk and Teplokluchenka, and from the tropopause to 30 km at Hampton, Virginia. Altitudes of maximum backscattering ratios and coefficients are shown for each layer at Mauna Loa. |
Information Contacts: Sergei Khmelevtsov, Institute of Experimental Meteorology, Lenin St. 82, Obninsk, Kaluga Reg., USSR; Thomas DeFoor, Mauna Loa Observatory, P.O. Box 275, Hilo, HI 96720 USA; Horst Jäger, Fraunhofer-Institut für Atmosphärische Umweltforschung, Kreuzeckbahnstrasse 19, D-8100 Garmisch-Partenkirchen, West Germany; William Fuller and Mary Osborn, NASA Langley Research Center, Hampton, VA 23665 USA.
Cite this Report
Tropospheric layers probably from forest fires
Lidar data indicated that few aerosols remain in the stratosphere from the November 1985 Ruiz eruption, and no subsequent eruptions appear to have produced large amounts of stratospheric ejecta. At Mauna Loa, Hawaii, the small lower stratospheric layers observed in early and mid June were not detected on 26 June or in subsequent measurements (figure 61). Stratospheric aerosols measured at Hampton, VA continued their gradual decline. However, relatively dense layers, perhaps from major forest fires in the western United States, were evident in the troposphere during observations on 23 August. Winds at about 5.8 km altitude on 22 and 23 August were favorable for transport of smoke from the fires to the Hampton area. Late July-early August data from Garmisch-Partenkirchen, West Germany were similar to those of early July.
 |
Figure 61. Lidar data from various locations, showing altitudes of aerosol layers during June-August 1988. Note that some layers have multiple peaks. Backscattering ratios are for the ruby wavelength of 0.69 µm. Integrated values show total backscatter, expressed in steradians-1, integrated over 300-m intervals from 16-33 km at Mauna Loa and from the tropopause to 30 km at Hampton, Virginia. Altitudes of maximum backscattering ratios and coefficients are shown for each layer at Mauna Loa. Upper and lower limits of layers at Mauna Loa were not clearly evident and are therefore not reported. |
Information Contacts: William Fuller, NASA Langley Research Center, Hampton, VA 23665 USA; Thomas DeFoor, Mauna Loa Observatory, P. O. Box 275, Hilo, HI 96720 USA; Horst Jäger, Fraunhofer-Institut für Atmosphärische Umweltforschung, Kreuzeckbahnstrasse 19, D-8100 Garmisch-Partenkirchen, West Germany.
Cite this Report
Aerosols continue to decline toward background levels
Lidar data from Virginia, Japan, and Hawaii indicated that stratospheric aerosol concentrations continued to decline toward background levels through September (figure 62). Small lower stratospheric layers measured in June at Mauna Loa, Hawaii and in early July at Fukuoka, Japan, perhaps from the May eruption of Banda Api, have not been evident since then. No large injections of volcanic material into the stratosphere have been detected since the November 1985 eruption of Ruiz.
 |
Figure 62. Lidar data from various locations, showing altitudes of aerosol layers during August-September 1988. Note that some layers have multiple peaks. Backscattering ratios from Fukouka, Japan, are for the Nd-YAG wavelength of 1.06 µm; all others are for the ruby wavelength of 0.69 µm. Integrated values show total backscatter, expressed in steradians-1, integrated over 300-m intervals from 16-33 km at Mauna Loa and from the tropopause to 30 km at Hampton, Virginia. Altitudes of maximum backscattering ratios and coefficients are shown for each layer at Mauna Loa. Upper and lower limits of layers at Mauna Loa were not clearly evident and are therefore not reported. |
Information Contacts: William Fuller, NASA Langley Research Center, Hampton, VA 23665 USA; Thomas DeFoor, Mauna Loa Observatory, P.O. Box 275, Hilo, HI 96720 USA; Motowo Fujiwara, Physics Department, Fukuoka University, Jonanku, Fukuoka 814-01, Japan.
Cite this Report
No new volcanic aerosols
No large new volcanic layers appear to have been injected since the November 1985 eruption of Ruiz. Lidar data in September and October showed few remaining stratospheric volcanic aerosols. Satellite data suggest that eruption clouds ejected on 9 May at Banda Api and 29 July at Makian, both in Indonesia, may have penetrated the stratosphere. Small new layers were detected by lidar after the Banda Api eruption, but neither eruption appears to have had a significant long-term effect on the stratosphere.
Information Contacts: Thomas DeFoor, Mauna Loa Observatory, P.O. Box 275, Hilo, HI 96720 USA; Horst Jäger, Fraunhofer-Institut für Atmosphärische Umweltforschung, Kreuzeckbahnstrasse 19, D-8100 Garmisch-Partenkirchen, West Germany.
Cite this Report
No new stratospheric injections
Lidar stations in Germany, Japan, and Hawaii detected no apparent new stratospheric aerosol layers, and no recent large explosive eruptions have been reported. Substantially increased backscattering was measured between 17 and 22 km altitude at Mauna Loa, Hawaii on 1 November. Despite some instrument problems that night, the increased aerosols appeared real, but the profile did not have the characteristics of material from a new eruption.
 |
Figure 63. Lidar data from various locations, showing altitudes of aerosol layers during September-November 1988. Note that some layers have multiple peaks. Backscattering ratios from Fukouka, Japan, are for the Nd-YAG wavelength of 1.06 µm; all others are for the ruby wavelength of 0.69 µm. Integrated values show total backscatter, expressed in steradians-1, integrated over 300-m intervals from 16-33 km at Mauna Loa and from the tropopause to 30 km at Hampton, Virginia. Altitudes of maximum backscattering ratios and coefficients are shown for each layer at Mauna Loa. Some upper and lower limits of layers at Mauna Loa were not clearly evident and are therefore not reported. |
Information Contacts: Thomas DeFoor, Mauna Loa Observatory, P.O. Box 275, Hilo, HI 96720 USA; Motowo Fujiwara, Physics Department, Fukuoka University, Jonan-ku, Fukuoka 814-01, Japan; Horst Jäger, Fraunhofer-Institut für Atmosphärische Umweltforschung, Kreuzeckbahnstrasse 19, D-8100 Garmisch-Partenkirchen, West Germany.
Cite this Report
1985-88 Hawaii aerosol data summarized
Lidar data from Mauna Loa, Hawaii continued to document the gradual decay in stratospheric aerosol density. No large volcanic aerosol injections have occurred since the November 1985 eruption of Ruiz. A small increase in aerosols was detected after the 9 May eruption of Banda Api, Indonesia, but effects on the stratosphere appear to have been brief. The cause of the small November peak at Mauna Loa is uncertain, but profile characteristics did not suggest that the material was from a new eruption.
Information Contacts: Thomas DeFoor, Mauna Loa Observatory, P.O. Box 275, Hilo, HI 96720 USA.
Cite this Report
Stratosphere injections unlikely from recent eruptions
Lidar data from Hawaii, Japan, and Germany generally showed continuing low concentrations of stratospheric aerosols (figure 64. A broad layer centered at about 24 km altitude was detected over Mauna Loa, Hawaii on 26 January, but its profile was not characteristic of newly injected material. At Fukuoka, Japan, peak backscattering increased slightly in December and January, to levels last measured shortly after the May eruption of Banda Api, Indonesia.
 |
Figure 64. Lidar data from various locations, showing altitudes of aerosol layers during December 1988-January 1989. Note that some layers have multiple peaks. Backscattering ratios from Fukouka, Japan, are for the Nd-YAG wavelength of 1.06 µm; all others are for the ruby wavelength of 0.69 µm. Integrated values show total backscatter, expressed in steradians-1, integrated over 300-m intervals from 16-33 km at Mauna Loa and from the tropopause to 30 km at Hampton, Virginia. Altitudes of maximum backscattering ratios and coefficients are shown for each layer at Mauna Loa. Some upper and lower limits of layers at Mauna Loa were not clearly evident and are therefore not reported. |
No recent eruptions appear to have produced clouds that reached the stratosphere. Observations of the December-January eruption of Lonquimay, Chile from the ground and from weather satellites revealed no clouds exceeding 9 km altitude. Weather conditions hampered observations during the December-January eruption of Tokachi-dake, Japan, and no large eruption clouds were seen, although ash fell tens of kilometers away.
Information Contacts: Thomas DeFoor, Mauna Loa Observatory, P.O. Box 275, Hilo, HI 96720 USA; Motowo Fujiwara, Physics Department, Fukuoka University, Jonan-ku, Fukuoka 814-01, Japan; Horst Jäger, Fraunhofer-Institut für Atmosphärische Umweltforschung, Kreuzeckbahnstrasse 19, D-8100 Garmisch-Partenkirchen, West Germany.
Cite this Report
Hampton, Virginia lidar data since 1974 summarized
Stratospheric aerosols continued their descent toward background levels in February. Lidar data at Mauna Loa, Hawaii were similar to those of the previous month. The long-term trend in integrated backscattering at Hampton, VA shows a continuing irregular decline since the maximum reached shortly after the 1982 El Chichón eruption. However, values remained slightly higher than during the period of relative atmospheric quiet in the late 1970's, ended by the May 1980 eruption of St. Helens.
Information Contacts: William Fuller, NASA Langley Research Center, Hampton, VA 23665 USA; Thomas DeFoor, Mauna Loa Observatory, P.O. Box 275, Hilo, HI 96720 USA.
Cite this Report
Stratospheric aerosols continue long-term decline
Lidar data has continued to show gradual declines in stratospheric aerosols (figure 65). Aerosol concentrations over Obninsk, USSR were more variable than from other sites during summer 1988, but generally declined from April-June values. No large explosive eruptions have been reported in recent months and no fresh aerosol layers have been observed.
 |
Figure 65. Lidar data from various locations, showing altitudes of aerosol layers during July 1988-March 1989. Note that some layers have multiple peaks. Backscattering ratios from Obninsk are for the Nd-YAG wavelength of 0.53 µm; all others are for the ruby wavelength of 0.69 µm. Integrated values show total backscatter, expressed in steradians-1, integrated over 500-m intervals from 15-30 km at Obninsk; and 300-m intervals from 16-33 km at Mauna Loa and from the tropopause to 30 km at Hampton, Virginia. |
Information Contacts: Sergei Khmelevtsov, Institute of Experimental Meteorology, Lenin St. 82, Obninsk, Kaluga Reg., USSR; Thomas DeFoor, Mauna Loa Observatory, P. O. Box 275, Hilo, HI 96720 USA; Horst Jäger, Fraunhofer-Institut für Atmosphärische Umweltforschung, Kreuzeckbahnstrasse 19, D-8100 Garmisch-Partenkirchen, West Germany; Mary Osborn, NASA Langley Research Center, Hampton, VA 23665 USA.
Cite this Report
No new stratospheric aerosols
Recent eruptions have apparently contributed little new aerosol material to the stratosphere. Aerosol concentrations over Obninsk and Teplocluchenka, USSR increased slightly during fall and winter 1988 from spring and summer values (figure 66). Poor weather limited observations from Mauna Loa, Hawaii; the one successful April 1989 observation registered the lowest integrated aerosol backscattering measured since before the 1982 eruption of El Chichón.
 |
Figure 66. Lidar data from various locations, showing altitudes of aerosol layers during October 1988-April 1989. Note that some layers have multiple peaks. Backscattering ratios from Obninsk and Teplocluchenka are for the Nd-YAG wavelength of 0.53 µm; all others are for the ruby wavelength of 0.69 µm. Integrated values show total backscatter, expressed in steradians-1, integrated over 500-m intervals from 15-30 km at Obninsk and Teplocluchenka, and 300-m intervals from 16-33 km at Mauna Loa. |
Information Contacts: Sergei Khmelevtsov, Yu. Kaufman, and B. Chen, Institute of Experimental Meteorology, Lenin St. 82, Obninsk, Kaluga Reg., USSR; Thomas DeFoor, Mauna Loa Observatory, P. O. Box 275, Hilo, HI 96720 USA.
Cite this Report
Aerosols continue decline towards background levels
No large explosive eruptions have recently been reported and lidar stations have not detected new material in the stratosphere. May data from Mauna Loa, Hawaii showed a continued gradual decline of stratospheric aerosols toward background.
Information Contacts: Thomas DeFoor, Mauna Loa Observatory, P.O. Box 275, Hilo, HI 96720 USA.
Cite this Report
No new volcanic injections into the stratosphere
Lidar data from Northern Hemisphere stations showed no evidence of new injections of volcanic material into the stratosphere (figure 67). A polar stratospheric cloud, with strongest backscatter at about 23 km altitude, was detected from Obninsk, USSR on 1 February.
 |
Figure 67. Lidar data from various locations, showing altitudes of aerosol layers during January-June 1989. Note that some layers have multiple peaks. Backscattering ratios from Obninsk and Teplocklychenka are for the Nd-YAG wavelength of 0.53 µm; all others are for the ruby wavelength of 0.69 µm. Integrated values show total backscatter, expressed in steradians-1, integrated over 500-m intervals from 15-30 km at Obninsk and Teplocluchenka, and 300-m intervals from 16-33 km at Mauna Loa. |
Information Contacts: Sergei Khmelevtsov, Institute of Experimental Meteorology, Lenin St. 82, Obninsk, Kaluga Reg., USSR; Thomas DeFoor, Mauna Loa Observatory, P. O. Box 275, Hilo, HI 96720 USA; Horst Jäger, Fraunhofer-Institut für Atmosphärische Umweltforschung, Kreuzeckbahnstrasse 19, D-8100 Garmisch-Partenkirchen, West Germany.
Cite this Report
Stratospheric aerosols near background levels
No recent large explosive eruptions have been reported and the aerosol content of the stratosphere appears to be nearing background levels. Data from a single July observation at Mauna Loa, Hawaii showed little change from the previous month. A data set collected at Hampton, VA during marginal weather conditions on 24 July showed a profile typical of recent months, with a peak backscattering ratio of 1.2 at about 20 km altitude. Preliminary plans have been made for lidar instruments at the NASA Langley Research Center and several other sites to monitor the atmosphere almost continuously for much of October.
Information Contacts: Thomas DeFoor, Mauna Loa Observatory, P.O. Box 275, Hilo, HI 96720 USA; David Woods, NASA Langley Research Center, Hampton, VA 23665 USA.
Cite this Report
New aerosols, possibly from July Santiaguito explosion
Lidar data from Utah and Hawaii, and unusual sunsets seen from Colorado, indicated that a small new aerosol layer has been injected into the lower stratosphere. The strongest effects were observed from Salt Lake City, Utah (41°N, 112°W) 4-6 August (figure 68) by lidar equipment generally used for monitoring cirrus clouds in the upper troposphere. A slight enhancement may have been present 7 August, but no additional stratospheric aerosols have been detected over Utah since then. Strong red sunsets were seen in the area at the beginning of August and some faint aerosol-like cloud bands were also visible in daylight. Richard Keen saw a bright salmon-pink twilight from Golden, Colorado (39.75°N, 105.25°W) the evening of 4 August. The colors peaked at a solar depression angle of 4°, and horizontal striations were visible. Keen had not observed unusual twilights since early 1986.
 |
Figure 68. Lidar data from various locations, showing altitudes of aerosol layers during July-September 1989. Backscattering ratios are all for the ruby wavelength of 0.69 µm. Only bases of higher altitude layers at Mauna Loa are shown. Because of different sampling parameters, the very preliminary data from Salt Lake City are not directly comparable to those from other locations. A 75-m sampling interval was used, and 3-4 ten-shot averages were combined to yield the results shown. Integrated values show total backscatter, expressed in steradians-1, integrated over 300-m intervals from 16-33 km at Mauna Loa. |
Meteorological analysis at the University of Utah suggested that the aerosols had been carried to the area by a strong subtropical jet stream, and that the same material had probably been over Hawaii around 1 August. Equipment problems at Mauna Loa, Hawaii had prevented lidar observations since 5 July, but when observations resumed there on 16 August, a very small aerosol layer was detected within a double tropopause. A somewhat stronger layer was detected on the aerosol profile 23 August, and a small amount of apparently new material was detected again 30 August and 6 September. No new material was evident at Hampton, VA on 25 July. Instrument problems prevented additional data collection there as of early September.
The source of the new aerosol material was uncertain, but University of Utah meteorologists suggested that Central America was the most likely recent source. The plume produced by the strong 19 July explosion of Santiaguito was reported to have reached only about 4 km above the vent (approximate elevation 2,500 m). However, wind shearing of the plume was distinctly visible. Its lower portion, which contained the bulk of the ash and reached 4 km above the vent, moved NW, while a less dense upper portion was carried SE. Analyses of radiosonde data, newly available photographs from a different viewpoint (Llano del Pinal), and weather satellite information are planned, and may allow better characterization of cloud dynamics.
Observations of the February and August 1989 lunar eclipses indicate no significant new aerosol layers (figure 69). Richard Keen made brightness estimates of the 17 August eclipse by comparing the reduced brightness of the moon seen in reversed binoculars with the actual brightness of stars. Although a thunderstorm obscured the eclipse at mid-totality, 15 minutes before the end of totality the moon's visual magnitude was -2.0, 0.2 magnitudes fainter than predicted by the model in Keen, 1983 [citation in 11:3]. The observed minus calculated residual yields a globally averaged volcanic aerosol vertical optical thickness of only 0.005, which, within the probable error of the method, is zero. Data from Mauna Loa, Hawaii also document a continuing decline in the aerosol content of the stratosphere. A small irregular increase in stratospheric aerosols following the November 1985 eruption of Ruiz is superimposed on the gradual decay of the much larger El Chichón aerosol erupted in 1982. No large new injections of volcanic material are evident on the Mauna Loa records since 1985.
 |
Figure 69. Global volcanic aerosol optical thickness derived from lunar eclipse observations, 1960-89. Arrows show some major explosive eruptions. Courtesy of Richard Keen. |
Further Reference. Sassen, K., and Horel, J., 1990, Polarization Lidar and synoptic analyses of an unusual volcanic aerosol cloud: Journal of the Atmospheric Sciences, v. 24, p. 2881-2889.
Information Contacts: Ken Sassen, Dept. of Meteorology, University of Utah, Salt Lake City, UT 84112 USA; Thomas DeFoor, Mauna Loa Observatory, P.O. Box 275, Hilo, HI 96720 USA; Richard Keen, 34296 Gap Road, Golden, CO 80403 USA; William I. Rose, Dept. of Geology and Geological Engineering, Michigan Technological University, Houghton, MI 49931 USA; Mary Osborn, NASA Langley Research Center, Hampton, VA 23665 USA.
Cite this Report
Continued minor lower stratospheric aerosol layer
September lidar data from Mauna Loa, Hawaii (figure 70) continued to show minor aerosol enhancement in the lower stratosphere, perhaps from the 19 July explosion of Santiaguito, Guatemala. Lidar at Garmisch-Partenkirchen, West Germany also recorded a small increase near the base of the stratosphere on 16 September.
 |
Figure 70. Lidar data from various locations, showing altitudes of aerosol layers during August-October 1989. Backscattering ratios are all for the ruby wavelength of 0.69 µm. Only bases of higher altitude layers at Mauna Loa are shown. Integrated values show total backscatter, expressed in steradians-1, integrated over 300-m intervals from 16-33 km at Mauna Loa and from the tropopause to 30 km at Hampton. |
Inspection of data from NASA's SAGE satellite, which has a precessing orbit that was centered at 7-7.4°N on 19 July and 12.2-12.5°N the next day, revealed cloud layers at about 16 km altitude, near the tropopause. However, the 19 July SAGE data were collected before the explosion, and the layers had characteristics typical of cirrus clouds.
Information Contacts: Thomas DeFoor, Mauna Loa Observatory, P.O. Box 275, Hilo, HI 96720 USA; Horst Jäger, Fraunhofer-Institut für Atmosphärische Umweltforschung, Kreuzeckbahnstrasse 19, D-8100 Garmisch-Partenkirchen, West Germany; Mary Osborn, NASA Langley Research Center, Hampton, VA 23665 USA.
Cite this Report
New aerosols seen August/September no longer evident
The new stratospheric aerosols, perhaps from the 19 July explosion of Santiaguito, Guatemala, were no longer evident when observations from Hawaii resumed on 20 October (after a period of cloudy weather), nor in subsequent early November data (figure 71). Lidar measurements from Hampton, VA have not revealed any new aerosol material.
 |
Figure 71. Lidar data from various locations, showing altitudes of aerosol layers during October-November 1989. Backscattering ratios are all for the ruby wavelength of 0.69 µm. Only bases of layers at Mauna Loa are shown. Integrated values show total backscatter, expressed in steradians-1, integrated over 300-m intervals from 16-33 km at Mauna Loa and from the tropopause to 30 km at Hampton. |
Enhanced twilight glows over Millville, New Jersey (39.4°N, 74.9°W) 3-5 October were described as only fairly strong, but the most impressive of the past several years.
Information Contacts: Thomas DeFoor, Mauna Loa Observatory, P.O. Box 275, Hilo, HI 96720 USA; Mary Osborn, NASA Langley Research Center, Hampton, VA 23665 USA; Fred Schaaf, RD 2, Box 248, Millville, New Jersey 08332 USA.
Cite this Report
August balloon data show aerosols near tropopause
Balloon data from sampling missions over Laramie, WY showed enhanced aerosols near the tropopause on 24 August, not evident a month earlier, that had a clearly volcanic character (figure 72). By the next measurements from Wyoming on 24 October, the aerosols had apparently gone. High tropopauses (15 km on 24 July, 16 km on 24 August, and 15.5 km on 24 October) suggested that air sampled on those days (and therefore the likely source of the 24 August aerosols) was from low latitudes. The background sulfate aerosol level of about 0.5/cm3 at 20 km did not seem to have been affected.
 |
Figure 72. Concentrations of particles with radii greater than 0.15 µm counted from balloons launched from Laramie, WY on 24 July, 14 August, and 24 October 1989. Courtesy of David Hofmann. |
Small aerosol enhancements were detected in the lower stratosphere over Garmisch-Partenkirchen, West Germany in mid-November. Stratospheric aerosols have remained at background levels at Mauna Loa, Hawaii since observations resumed there on 20 October following a period of cloudy weather.
Information Contacts: David Hofmann, Department of Physics and Astronomy, University of Wyoming, Laramie, WY 82071 USA; Horst Jäger, Fraunhofer-Institut für Atmosphärische Umweltforschung, Kreuzeckbahnstrasse 19, D-8100 Garmisch-Partenkirchen, West Germany; Thomas DeFoor, Mauna Loa Observatory, P.O. Box 275, Hilo, HI 96720 USA.
Cite this Report
Aerosols, probably from Redoubt, seen over Germany
Lidar data from Germany and an unusual sunrise over Colorado indicated apparent new aerosol layers, probably from the explosive activity at Redoubt, Alaska, that began 14 December [but see caution in 15:1].
Lidar profiles at Garmisch-Partenkirchen, West Germany (figure 73) remained similar to previous measurements through 19 December. On 23 December, strong signals were detected below and between the local tropopauses at 9.4 and 13.6 km, and enhanced backscattering extended up to about 17 km. The next measurement, on 25 December, showed moderately enhanced backscattering through the tropopause (at 11.7 km) to about 15 km altitude. On the 3 January profile, backscattering was enhanced below 12 km (tropopause at 10.5 km). No enhanced layers were evident on 9 January. No new aerosols were evident over Mauna Loa, Hawaii on 19 December or in preliminary 4 January data, suggesting that Redoubt aerosols have not yet reached lower northern latitudes.
 |
Figure 73. Lidar data from various locations, showing altitudes of aerosol layers during October-December 1989. Backscattering ratios are all for the ruby wavelength of 0.69 µm. Only bases of layers at Mauna Loa are shown. Integrated values show total backscatter, expressed in steradians-1, integrated over 300-m intervals from 16-33 km at Mauna Loa and from the tropopause to 30 km at Hampton. |
Richard Keen saw horizontal striations in the SE sky from Golden, Colorado early 24 December from shortly before until about an hour after sunrise. From the timing of its initial illumination, several minutes before nearby cirrus clouds were illuminated, the new material appeared to be in the upper troposphere or lower stratosphere. Aerosols were not evident on other days through 9 January. The striations appeared similar to those seen several weeks after the 1980 eruption of St. Helens (after the initial dense ash cloud had moved away) but lacked the vivid coloration of the aerosol layers from El Chichón's 1982 eruption.
Information Contacts: Horst Jäger, Fraunhofer-Institut für Atmosphärische Umweltforschung, Kreuzeckbahnstrasse 19, D-8100 Garmisch-Partenkirchen, West Germany; Thomas DeFoor, Mauna Loa Observatory, P.O. Box 275, Hilo, HI 96720 USA; Richard Keen, 34296 Gap Road, Golden, CO 80403 USA.
The enormous aerosol cloud from the March-April 1982 eruption of Mexico's El Chichón persisted for years in the stratosphere, and led to the Atmospheric Effects section becoming a regular feature of the Bulletin. Descriptions of the initial dispersal of major eruption clouds remain with the individual eruption reports, but observations of long-term stratospheric aerosol loading will be found in this section.
Cite this Report
Lidar data from Russia and Germany
Lidar data from Russia during April through December 1994 (table 1) continued to show a volcanic aerosol layer over Obninsk, generally between 14 and 21 km altitude. Throughout most of 1994 (see Bulletin v. 19, no. 4 for January-March 1994 data), backscattering ratios and integrated backscatter for the Nd-YAG wavelength generally remained stable at 1.2-1.4 and 0.18-0.34 x 10⁻³, respectively. However, after 4 November the backscattering ratio was consistently-3.
Table 1. Lidar data from Russia and Germany showing altitudes of aerosol layers; some layers have multiple peaks. Backscattering ratios are for the Nd-YAG wavelength of 0.53 microns, with equivalent ruby values (0.69 microns) in parentheses for data from Germany. The integrated value shows total backscatter, expressed in steradians^-1, integrated over 150-m intervals from 15-30 km at Obninsk, and over 300-m intervals from the tropopause to 30 km at Garmisch-Partenkirchen.
| DATE | LAYER ALTITUDE (km) (peak) | BACKSCATTERING RATIO | BACKSCATTERING INTEGRATED |
| Obninsk, Russia (55°N, 38°E) | |||
| 12 Apr 1994 | 11.3-23.9 (18.7) | 1.23 | 0.22 x 10⁻³ |
| 17 Apr 1994 | 13.9-16.4 (15.7) | 1.32 | 0.33 x 10⁻³ |
| 17 Apr 1994 | 16.4-19.3 (18.5) | 1.35 | -- |
| 17 Apr 1994 | 19.3-24.8 (20.3) | 1.33 | -- |
| 21 Apr 1994 | 11.8-20.5 (18.4) | 1.37 | 0.33 x 10⁻³ |
| 21 Apr 1994 | 20.5-23.1 (21.6) | 1.34 | -- |
| 28 Apr 1994 | 12.1-21.1 (17.5) | 1.28 | 0.23 x 10⁻³ |
| 13 May 1994 | 13.9-21.2 (19.9) | 1.20 | 0.18 x 10⁻³ |
| 15 May 1994 | 13.5-17.9 (11.0) | 1.26 | 0.22 x 10⁻³ |
| 15 May 1994 | 17.9-21.5 (19.7) | 1.23 | -- |
| 16 May 1994 | 11.6-17.6 (16.6) | 1.24 | 0.22 x 10⁻³ |
| 16 May 1994 | 17.6-21.4 (19.1) | 1.23 | -- |
| 08 Jun 1994 | 14.9-21.8 (19.9) | 1.24 | 0.22 x 10⁻³ |
| 28 Jun 1994 | 15.1-24.5 (18.7) | 1.23 | 0.22 x 10⁻³ |
| 08 Jul 1994 | 12.4-14.2 (14.0) | 1.12 | 0.23 x 10⁻³ |
| 08 Jul 1994 | 14.2-25.1 (18.8) | 1.24 | -- |
| 10 Jul 1994 | 12.0-14.0 (13.7) | 1.12 | 0.23 x 10⁻³ |
| 10 Jul 1994 | 14.0-25.1 (18.4) | 1.24 | -- |
| 11 Jul 1994 | 13.0-14.1 (13.7) | 1.12 | 0.24 x 10⁻³ |
| 11 Jul 1994 | 14.1-26.8 (18.8) | 1.25 | -- |
| 28 Jul 1994 | 10.5-14.0 (13.1) | 1.09 | 0.23 x 10⁻³ |
| 28 Jul 1994 | 14.0-24.5 (19.0) | 1.26 | -- |
| 19 Aug 1994 | 11.5-25.4 (17.2) | 1.21 | 0.21 x 10⁻³ |
| 06 Sep 1994 | 12.7-25.1 (17.6) | 1.33 | 0.29 x 10⁻³ |
| 15 Sep 1994 | 12.6-15.5 (14.8) | 1.24 | 0.27 x 10⁻³ |
| 15 Sep 1994 | 15.5-25.3 (17.6) | 1.28 | -- |
| 07 Oct 1994 | 13.1-24.8 (15.1) | 1.44 | 0.35 x 10⁻³ |
| 08 Oct 1994 | 13.0-25.1 (18.8) | 1.26 | 0.25 x 10⁻³ |
| 09 Oct 1994 | 13.3-25.1 (18.8) | 1.25 | 0.23 x 10⁻³ |
| 10 Oct 1994 | 10.7-16.1 (14.9) | 1.25 | 0.24 x 10⁻³ |
| 10 Oct 1994 | 16.1-20.3 (17.6) | 1.27 | -- |
| 24 Oct 1994 | 13.3-22.7 (19.7) | 1.23 | 0.21 x 10⁻³ |
| 04 Nov 1994 | 13.1-20.2 (19.6) | 1.27 | 0.25 x 10⁻³ |
| 11 Nov 1994 | 16.0-30.0 (20.5) | 1.14 | 0.11 x 10⁻³ |
| 05 Dec 1994 | 16.6-20.6 (19.4) | 1.10 | 0.08 x 10⁻³ |
| 05 Dec 1994 | 20.6-24.8 (24.1) | 1.15 | -- |
| 10 Dec 1994 | 17.0-22.1 (19.3) | 1.14 | 0.08 x 10⁻³ |
| 11 Dec 1994 | 13.3-21.7 (19.0) | 1.16 | 0.12 x 10⁻³ |
| Garmisch-Partenkirchen, Germany (47.5°N, 11.0°E) | |||
| 01 Dec 1994 | 12-31 (17.9) | 1.17 (1.4) | -- |
| 01 Dec 1994 | 11-30 (22.0) | 1.20 (1.5) | -- |
| 06 Dec 1994 | 11-30 (18.4) | 1.19 (1.5) | -- |
| 15 Dec 1994 | 11-30 (18.2) | 1.25 (1.6) | -- |
| 17 Dec 1994 | 12-29 (16.2) | 1.23 (1.6) | -- |
| 06 Jan 1994 | 10-30 (21.3) | 1.25 (1.6) | -- |
| 16 Jan 1994 | 11-29 (21.3) | 1.28 (1.6) | -- |
| 19 Jan 1994 | 8-28 (18.0) | 1.29 (1.7) | -- |
| 27 Jan 1994 | 9-26 (19.0) | 1.25 (1.6) | -- |
| 07 Feb 1994 | 11-27 (18.1) | 1.24 (1.6) | -- |
During December through early February 1995, lidar data from Germany revealed the continued presence of an aerosol layer over Garmisch-Partenkirchen. Peak altitude during this period was usually 16-19 km. The backscattering ratio for the Nd-YAG wavelength, 1.2-1.3, has been unchanged since June 1994 (see Bulletin v. 19, nos. 10-11).
In Germany, a secondary peak on 1 December and the above-20-km peaks on 6 and 16 January may have been fresh volcanic aerosols caused by the 19 September eruption of Rabaul or the 1 October eruption of Kliuchevskoi (Bulletin v. 19, nos. 8-9). A secondary peak at ~24 km altitude was also detected on 5 December at Obninsk, Russia.
Information Contacts: Sergey Khmelevtsov, Institute of Experimental Meteorology, Lenin Str. 82, Obninsk, Russia; Horst Jager, Fraunhofer -- Institut fur Atmospharische Umweltforschung, Kreuzeckbahnstrasse 19, D-8100 Garmisch-Partenkirchen, Germany.
Cite this Report
Lidar data from Cuba
At Camaguey, Cuba, a volcanic aerosol layer was detected at 19-23 km altitude from 18 November through 28 December 1994 (table 2). Backscatter ratios (0.53 µm) were in the 1.26-1.40 range, with integrated backscatter values of 0.18-0.29 x 10⁻³. These data are similar to those acquired in Cuba during July-October 1994 (Bulletin v. 19, v. 10).
Table 2. Lidar data from Cuba showing altitudes of aerosol layers (bases only). Backscattering ratios are for the Nd-YAG wavelength of 0.53 µm. The integrated value shows total backscatter, expressed in steradians^-1, integrated over 300-m intervals from 16-33 km.
| DATE | LAYER ALTITUDE (km) (peak) | BACKSCATTERING RATIO | BACKSCATTERING INTEGRATED |
| Camaguey, Cuba (21.2°N, 77.5°W) | |||
| 05 Nov 1994 | 18.1 (23.2) | 1.38 | 0.22 x 10⁻³ |
| 09 Nov 1994 | 16.3 (25.0) | 1.41 | 0.28 x 10⁻³ |
| 18 Nov 1994 | 18.4 (23.8) | 1.40 | 0.25 x 10⁻³ |
| 24 Nov 1994 | 18.1 (22.6) | 1.40 | 0.29 x 10⁻³ |
| 29 Nov 1994 | 17.5 (21.6) | 1.42 | 0.29 x 10⁻³ |
| 03 Dec 1994 | 18.1 (22.0) | 1.33 | 0.23 x 10⁻³ |
| 07 Dec 1994 | 18.4 (22.0) | 1.33 | 0.18 x 10⁻³ |
| 17 Dec 1994 | 18.4 (22.6) | 1.26 | 0.19 x 10⁻³ |
| 24 Dec 1994 | 17.8 (21.1) | 1.39 | 0.22 x 10⁻³ |
| 28 Dec 1994 | 17.8 (19.0) | 1.28 | 0.20 x 10⁻³ |
Information Contacts: Juan Carlos Antuna, Centro Meteorologico de Camaguey, Apartado 134, Camaguey 70100, Cuba.
Cite this Report
Lidar data from Cuba and Germany
Lidar data from Germany during April-June (table 3) continued to reveal a volcanic aerosol layer centered at 18-20 km altitude. Backscattering ratios again showed a decline from earlier in the year (Bulletin v. 20, no. 2). In Cuba, a volcanic aerosol layer was detected at 20-22 km altitude between 20 May and 28 June. Lidar data (0.53 µm) showed a noticeable decline in both integrated backscattering and backscatter ratios from November-December values (Bulletin v. 20, no. 4).
Table 3. Lidar data from Germany and Cuba, showing altitudes of aerosol layers. Only bases of the layers are shown for Cuba. Backscattering ratios are for the Nd-YAG wavelength of 0.53 µm, with equivalent ruby values (0.69 µm) in parentheses. Integrated values show total backscatter, expressed in steradians^-1, integrated over 300-m intervals from the tropopause to 30 km at Garmisch-Partenkirchen and 16-33 km at Camaguey.
| DATE | LAYER ALTITUDE (km) (peak) | BACKSCATTERING RATIO | BACKSCATTERING INTEGRATED |
| Garmisch-Partenkirchen, Germany (47.5°N, 11.0°E) | |||
| 03 Apr 1995 | 10-31 (18.9) | 1.26 (1.6) | -- |
| 24 Apr 1995 | cirrus-27 (19.0) | 1.20 (1.5) | -- |
| 02 May 1995 | 10-24 (18.4) | 1.17 (1.4) | -- |
| 07 May 1995 | 11-27 (19.1) | 1.14 (1.3) | -- |
| 17 May 1995 | cirrus-27 (17.6) | 1.26 (1.6) | -- |
| 22 May 1995 | 10-30 (18.2) | 1.18 (1.4) | -- |
| 28 May 1995 | 10-27 (19.7) | 1.15 (1.4) | -- |
| 20 Jun 1995 | 10-29 (19.4) | 1.16 (1.4) | -- |
| 27 Jun 1995 | 12-27 (18.1) | 1.13 (1.3) | -- |
| 29 Jun 1995 | cirrus-26 (18.3) | 1.12 (1.3) | -- |
| Camaguey, Cuba (21.2°N, 77.5°W) | |||
| 20 May 1995 | 16.0 (20.8) | 1.17 | 1.10 x 10⁻⁴ |
| 27 May 1995 | 16.0 (21.7) | 1.20 | 1.39 x 10⁻⁴ |
| 28 Jun 1995 | 16.6 (21.1) | 1.15 | 0.99 x 10⁻⁴ |
Information Contacts: Horst Jager, Fraunhofer -- Institut fur Atmospharische Umweltforschung, Kreuzeckbahnstrasse 19, D-8100 Garmisch-Partenkirchen, Germany; Juan Carlos Antuna, Centro Meteorologico de Camaguey, Apartado 134, Camaguey 70100, Cuba.
Cite this Report
Lidar data from Germany and Virginia
Lidar data from Germany for July and August (table 4) again revealed the presence of a volcanic aerosol layer centered at 17-19 km altitude. Backscattering ratios have decreased since the last reports (Bulletin v. 20, nos. 2 and 7). October lidar data from Hampton, Virginia, showed an aerosol layer at 18-19 km altitude; these values are similar to the previous report (Bulletin v. 19, no. 11). Backscatter data declined to the range of 1.22-1.25 from 1.38-1.50.
Table 4. Lidar data from Germany and Virginia, USA, showing altitudes of aerosol layers. Backscattering ratios are for the ruby wavelength of 0.69 microns. The integrated value shows total backscatter, expressed in steradians^-1, integrated over 300-m intervals from the tropopause to 30 km.
| DATE | LAYER ALTITUDE (km) (peak) | BACKSCATTERING RATIO | BACKSCATTERING INTEGRATED |
| Garmisch-Partenkirchen, Germany (47.5°N, 11.0°E) | |||
| 07 Jul 1995 | 11-27 (19.7) | 1.12 (1.3) | -- |
| 19 Jul 1995 | 12-26 (19.8) | 1.13 (1.3) | -- |
| 21 Jul 1995 | 13-29 (18.0) | 1.12 (1.3) | -- |
| 26 Jul 1995 | 11-28 (19.1) | 1.13 (1.3) | -- |
| 31 Jul 1995 | 13-24 (18.8) | 1.09 (1.2) | -- |
| 03 Aug 1995 | 12-27 (17.5) | 1.12 (1.3) | -- |
| Hampton, Virginia (37.1°N, 76.3°W) | |||
| 23 Mar 1995 | 12-25 (17.8) | 1.36 | 0.135 x 10⁻³ |
| 04 May 1995 | 12-25 (18.7) | 1.3 | 0.104 x 10⁻³ |
| 19 Oct 1995 | 15-30 (18.1) | 1.22 | 0.059 x 10⁻³ |
| 23 Oct 1995 | 15-30 (18.8) | 1.25 | 0.065 x 10⁻³ |
Information Contacts: Horst Jager, Fraunhofer -- Institut fur Atmospharische Umweltforschung, Kreuzeckbahnstrasse 19, D-8100 Garmisch-Partenkirchen, Germany; Mary Osborn, NASA Langley Research Center (LaRC), Hampton VA 23665, USA.
Cite this Report
Lidar data from Cuba, Germany, and Hawaii; aerosol layer with unknown source
Colorful twilights of long duration have been reported since late September 1995 by observers in England and across the United States in Florida, Maryland, Kentucky, Arkansas, Texas, New Mexico, Colorado, California and Hawaii (F. M. Mims III and others, 1996). This report describes information compiled by Mims and co-authors and includes lidar backscatter data from sites in Cuba, Germany, and Hawaii (figure 1 and table 5). Lidar values are similar to those from earlier in 1995 (Bulletin v. 20, nos. 7 and 10).
 |
Figure 1. Lidar backscattering in 1994 and 1995 for Camagüey, Cuba and Garmisch-Partenkirchen, Germany (see table 1 for details). Data courtesy of Rene Estevan and Horst Jäger; plot courtesy of Forrest Mims III. |
Table 5. Lidar data from Cuba and Germany showing altitudes of aerosol layers; some layers have multiple peaks. Backscattering ratios are for the Nd-YAG wavelength of 0.53 microns, with equivalent ruby values (0.69 microns) in parentheses for data from Germany. The integrated value shows total backscatter, expressed in steradians^-1, integrated over 300-m intervals from 16-33 km for Cuba and from the tropopause to 30 km at Garmisch-Partenkirchen. Courtesy of Rene Estevan and Horst Jäger.
| DATE | LAYER ALTITUDE (km) (peak) | BACKSCATTERING RATIO | BACKSCATTERING INTEGRATED |
| Camaguey, Cuba (21.2°N, 77.5°W) | |||
| 28 Jul 1995 | 15.1 (21.4) | 1.23 | 1.75 x 10⁻⁴ |
| 28 Jul 1995 | 15.1 (22.0) | 1.21 | -- |
| 13 Aug 1995 | 15.4 (23.8) | 1.24 | 1.79 x 10⁻⁴ |
| 18 Aug 1995 | 16.0 (20.5) | 1.18 | 1.04 x 10⁻⁴ |
| 26 Aug 1995 | 13.9 (19.9) | 1.24 | 1.58 x 10⁻⁴ |
| 26 Aug 1995 | 13.9 (20.0) | 1.31 | -- |
| 30 Aug 1995 | 14.5 (22.6) | 1.26 | 1.69 x 10⁻⁴ |
| 15 Sep 1995 | 16.6 (18.4) | 1.20 | 1.10 x 10⁻⁴ |
| 15 Sep 1995 | 16.6 (21.1) | 1.17 | -- |
| Garmisch-Partenkirchen, Germany (47.5°N, 11.0°E) | |||
| 10 Aug 1995 | 10-28 (19.8) | 1.13 (1.3) | -- |
| 04 Sep 1995 | 11-26 (17.9) | 1.11 (1.2) | -- |
| 09 Sep 1995 | 10-27 (18.2) | 1.14 (1.3) | -- |
| 18 Sep 1995 | 11-33 (18.4) | 1.14 (1.3) | -- |
| 26 Sep 1995 | 13-27 (18.4) | 1.17 (1.3) | -- |
| 09 Oct 1995 | 14-32 (18.5) | 1.13 (1.3) | -- |
| 15 Oct 1995 | 11-27 (19.0) | 1.10 (1.2) | -- |
| 23 Oct 1995 | 13-29 (17.5) | 1.13 (1.3) | -- |
| 05 Nov 1995 | 9-32 (16.3) | 1.14 (1.3) | -- |
| 11 Nov 1995 | 11-31 (18.1) | 1.11 (1.2) | -- |
| 20 Nov 1995 | 11-29 (17.3) | 1.16 (1.3) | -- |
| 01 Dec 1995 | 8-32 (17.4) | 1.13 (1.3) | -- |
| 09 Dec 1995 | 11-31 (14.9) | 1.14 (1.3) | -- |
| 28 Dec 1995 | 10-27 (16.5) | 1.11 (1.2) | -- |
| Mauna Loa, Hawaii (19.5°N, 155.6°W) | |||
| 01 Aug 1995 | 16-27 (22.0) | 1.38 | 0.93 x 10⁻⁴ |
| 08 Aug 1995 | 16-27 (22.0) | 1.31 | 0.61 x 10⁻⁴ |
| 16 Aug 1995 | 16-27 (22.0) | 1.35 | 0.71 x 10⁻⁴ |
| 23 Aug 1995 | 16-27 (22.3) | 1.27 | 0.59 x 10⁻⁴ |
| 31 Aug 1995 | 16-27 (22.0) | 1.32 | 0.67 x 10⁻⁴ |
| 12 Sep 1995 | 16-26 (21.7) | 1.31 | 0.53 x 10⁻⁴ |
| 12 Oct 1995 | 16-26 (23.2) | 1.28 | 0.74 x 10⁻⁴ |
Visual observations from both the ground and commercial aircraft of colorful twilights and a prominent solar aureole suggest a stratospheric cloud now extends from about 20 to 37°N. The origin of the scattering aerosols is presently unknown. Many of the twilights last fall and winter had a duration of 45-60 minutes, which implies an altitude for the aerosols of ~23-35 km. Photographs of the twilights closely resemble images of El Chichón and Pinatubo twilights.
Increased aerosol optical thickness (AOT) has been measured at two sites (Seguin, Texas, and San Diego, California) where extended twilights have been reported. (The optical thickness is equal to the negative natural logarithm of the attenuation of incident light, or Tau = -ln(I/Io), where I and Io are the initial and final light intensity, respectively.) The lowest AOT (1.003 µm) at Seguin, Texas, during winter 1995-96 was 0.03 higher, double the smallest AOT during the previous two winters (figure 2).
 |
Figure 2. Aerosol optical thickness (AOT) at 1.003 microns from 23 September 1989 to 27 March 1996 measured at Seguin, Texas USA. The data show both the seasonal cycle (greatest optical clarity in winter, least in summer) and the volcanic perturbation from Pinatubo. Courtesy of Forrest M. Mims III. |
Visual and AOT observations of the aerosol cloud have been corroborated by lidar measurements in Cuba from September-December 1995 (figure 1 and table 5). Several episodes of unusually high total integrated backscatter at 16-33 km occurred during this period. Finally, backscatter data from Germany confirm visual and Sun photometer observations that the new aerosol has not reached 47.5°N.
Reference. Mims, F.M., III, Meinel, C., Roosen, R.G., Russell, R.T., Hawkins, G.P., and Easton, H., 1996, Stratospheric aerosol cloud of unknown origin: unpublished manuscript.
Information Contacts: Horst Jäger, Fraunhofer -- Institut für Atmosphärische Umweltforschung, Kreuzeckbahnstrasse 19, D-8100 Garmisch-Partenkirchen, Germany; Forrest M. Mims III, Sun Photometer Atmospheric Network (SPAN), 433 Twin Oak Rd., Seguin, TX 78155 USA; Rene Estevan and Juan Carlos Antuña, Centro Meteorologico de Camagüey, Apartado 134, Camagüey 70100, Cuba [J.C.A is presently at Univ. Maryland, Dept. of Meteorology, College Park, MD 20742 USA]; John Barnes, Mauna Loa Observatory, P.O. Box 275, Hilo, HI 96720 USA.
Cite this Report
Lidar data from Virginia, Germany, and Cuba
Lidar data from Virginia, USA, again revealed the presence of a volcanic aerosol layer centered at about 22 km altitude in April and May 1996 (table 6), somewhat higher than the 18-19 km measured during August-December 1995 (Bulletin v. 20, no. 10, and table 6). Over Germany, the aerosol layer was concentrated around 15-20 km altitude during January-April 1996, consistent with measurements made during late 1995 (Bulletin v. 21, no. 2). Backscattering ratios continued to show a decreasing trend at Hampton, and remained stable at Garmisch-Partenkirchen. Data from Cuba during January-April 1996 were highly variable, but still comparable to late-1995 data (Bulletin v. 21, no. 2). The base of the aerosol layer was consistently around 15-17.5 km (dropping to 12.7-13.3 km in April), but the layer peak ranged from 18.1 up to 27.1 km. Backscattering ratios were also variable, with seven measurements showing the expected slow decrease to the 1.11-1.17 range, but with the other six being anomalously high in the 1.35-1.51 range.
Table 6. Lidar data from Virginia, Cuba, and Germany showing altitudes of aerosol layers; some layers have multiple peaks. Backscattering ratios from Virginia are for the ruby wavelength of 0.69 µm; those from Germany and Cuba are for the Nd-YAG wavelength of 0.53 µm, with equivalent ruby values in parentheses for data from Germany. The integrated value shows total backscatter, expressed in steradians-1, integrated over 300-m intervals from 16-33 km for Cuba and from the tropopause to 30 km at Hampton and Garmisch-Partenkirchen. Courtesy of Mary Osborn, Horst Jäger, and Rene Estevan.
| DATE | LAYER ALTITUDE (km) (peak) | BACKSCATTERING RATIO | BACKSCATTERING INTEGRATED |
| Hampton, Virginia (37.1°N, 76.3°W) | |||
| 04 Dec 1995 | 13-25 (18.7) | 1.22 | 1.05 x 10⁻⁴ |
| 25 Apr 1996 | 15-26 (22.4) | 1.14 | 0.61 x 10⁻⁴ |
| 21 May 1996 | 15-28 (22.4) | 1.18 | 0.64 x 10⁻⁴ |
| 31 May 1996 | 16-26 (22.0) | 1.13 | 0.32 x 10⁻⁴ |
| Garmisch-Partenkirchen, Germany (47.5°N, 11.0°E) | |||
| 04 Jan 1996 | 10-32 (19.1) | 1.15 (1.30) | -- |
| 11 Jan 1996 | 09-31 (19.2) | 1.14 (1.28) | -- |
| 17 Jan 1996 | 10-30 (16.4) | 1.13 (1.25) | -- |
| 31 Jan 1996 | 10-28 (19.8) | 1.12 (1.23) | -- |
| 06 Feb 1996 | 09-28 (15.7) | 1.11 (1.21) | -- |
| 23 Feb 1996 | 10-27 (14.7) | 1.13 (1.25) | -- |
| 27 Feb 1996 | 10-27 (18.2) | 1.10 (1.20) | -- |
| 05 Mar 1996 | 09-31 (17.9) | 1.13 (1.25) | -- |
| 05 Mar 1996 | PSC peak at 19.8 | -- | -- |
| 07 Mar 1996 | 09-28 (17.9) | 1.14 (1.27) | -- |
| 14 Mar 1996 | 10-31 (15.8) | 1.15 (1.29) | -- |
| 23 Mar 1996 | 12-28 (18.0) | 1.13 (1.25) | -- |
| 15 Apr 1996 | 10-27 (17.2) | 1.12 (1.24) | -- |
| Camaguey, Cuba (21.2°N, 77.5°W) | |||
| 19 Jan 1996 | 14.8 (19.9) | 1.17 | 0.55 x 10⁻⁴ |
| 24 Jan 1996 | 15.1 (21.7) | 1.08 | 0.12 x 10⁻⁴ |
| 29 Jan 1996 | 15.1 (18.7) | 1.58 | 4.90 x 10⁻⁴ |
| 04 Feb 1996 | 15.4 (23.5) | 1.35 | 1.40 x 10⁻⁴ |
| 09 Feb 1996 | 17.2 (27.1) | 1.11 | 0.26 x 10⁻⁴ |
| 15 Feb 1996 | 17.5 (22.3) | 1.51 | 1.00 x 10⁻⁴ |
| 15 Feb 1996 | 17.5 (23.8) | 1.48 | -- |
| 24 Feb 1996 | 17.2 (25.6) | 1.11 | 0.27 x 10⁻⁴ |
| 02 Mar 1996 | 16.9 (23.8) | 1.16 | 0.13 x 10⁻⁴ |
| 18 Mar 1996 | 15.1 (18.1) | 1.17 | 0.66 x 10⁻⁴ |
| 31 Mar 1996 | 15.7 (21.4) | 1.16 | 0.69 x 10⁻⁴ |
| 05 Apr 1996 | 12.7 (23.8) | 1.36 | 3.20 x 10⁻⁴ |
| 12 Apr 1996 | 13.3 (19.4) | 1.27 | 0.66 x 10⁻⁴ |
Information Contacts: Mary Osborn, NASA Langley Research Center (LaRC), Hampton VA 23665, USA; Horst Jäger, Fraunhofer -- Institut für Atmosphärische Umweltforschung, Kreuzeckbahnstrasse 19, D-8100 Garmisch-Partenkirchen, Germany; Rene Estevan and Juan Carlos Antuña, Centro Meteorologico de Camagüey, Apartado 134, Camagüey 70100, Cuba [J.C.A is presently at Univ. Maryland, Dept. of Meteorology, College Park, MD 20742 USA];
Cite this Report
Lidar data from Hampton, Virginia
Table 7 lists the 48-inch lidar measurements at 0.69 µm taken with ruby laser in Hampton, Virginia (37.1°N, 76.3°W). An aerosol layer peak was located at 19.3-25.3 km during early October; lidar backscatter ratios were consistent at 1.11-1.16 (table 7).
Table 7. Lidar data from Virginia, USA, showing altitudes of aerosol layers. Backscattering ratios are for the ruby wavelength of 0.69 µm. Integrated values show total backscatter, expressed in steradians-1, integrated over 300-m intervals from the tropopause to 30 km.
| DATE | LAYER ALTITUDE (km) (peak) | BACKSCATTERING RATIO | BACKSCATTERING INTEGRATED |
| Hampton, Virginia (37.1°N, 76.3°W) | |||
| 04 Oct 1996 | 15-30 (21.4) | 1.13 | 5.84 x 10⁻⁵ |
| 11 Oct 1996 | 14-30 (25.3) | 1.16 | 4.55 x 10⁻⁵ |
| 16 Oct 1996 | 15-29 (19.3) | 1.11 | 4.26 x 10⁻⁵ |
Information Contacts: Mary Osborn, NASA Langley Research Center (LaRC), Hampton VA 23665, USA.
Cite this Report
Lidar data from Germany may suggest an aerosol layer centered at about 19 km
Lidar data for part of 1996 (mid-May through the month of September) over Germany (table 8) indicated a possible aerosol layer centered between 14.7 and 21.6 km altitude. The possible layer's center often resided at ~19 km. The "ci" in Table 9 stands for cirrus. Cirrus in the tropopause region usually obscures the lower boundary of the aerosol layer.
Table 8. Backscattering ratios from German lidar data for the Nd-YAG wavelength of 0.53 µm, 16 May-30 September 1996. The equivalent backscattering ratios for ruby are in parentheses (ruby wavelength, 0.69 µm). Courtesy of Horst Jäger.
| DATE | LAYER ALTITUDE (km) (peak) | BACKSCATTERING RATIO | BACKSCATTERING INTEGRATED |
| Garmisch-Partenkirchen, Germany (47.5°N, 11.0°E) | |||
| 16 May 1996 | 11-30 (19.8) | 1.11 (1.20) | -- |
| 22 May 1996 | ci-29 (14.7) | 1.09 (1.20) | -- |
| 24 May 1996 | 12-31 (17.9) | 1.11 (1.20) | -- |
| 31 May 1996 | 14-38 (20.1) | 1.09 (1.20) | -- |
| 08 Jun 1996 | 14-27 (19.6) | 1.09 (1.20) | -- |
| 19 Jun 1996 | 9-27 (18.8) | 1.10 (1.20) | -- |
| 03 Jul 1996 | 13-28 (19.7) | 1.07 (1.20) | -- |
| 31 Jul 1996 | 11-30 (19.4) | 1.09 (1.20) | -- |
| 06 Aug 1996 | ci-26 (19.5) | 1.07 (1.20) | -- |
| 08 Aug 1996 | ci-27 (18.5) | 1.06 (1.10) | -- |
| 18 Aug 1996 | 12-27 (21.6) | 1.06 (1.10) | -- |
| 23 Aug 1996 | 11-26 (16.4) | 1.06 (1.10) | -- |
| 26 Sep 1996 | 12-26 (19.1) | 1.06 (1.10) | -- |
| 30 Sep 1996 | 12-25 (15.6) | 1.07 (1.20) | -- |
Information Contacts: Horst Jäger, Fraunhofer -- Institut für Atmosphärische Umweltforschung, Kreuzeckbahnstrasse 19, D-8100 Garmisch-Partenkirchen, Germany.
Cite this Report
Lidar data from Hampton, Virginia, USA
Table 9 lists the 48-inch lidar measurements at 0.69 µm taken with a ruby laser in Hampton, Virginia (37.1°N, 76.3°W). An aerosol layer peak was located in the range 13-31 km altitude during early October; lidar backscatter ratios varied between 1.13 and 1.21.
Table 9. Lidar data from Virginia, USA, showing altitudes of aerosol layers. Backscattering ratio are for the ruby wavelength of 0.69 µm. Integrated values show total backscatter, expressed in steradians-1, integrated over 300-m intervals from the tropopause to 30 km.
| DATE | LAYER ALTITUDE (km) (peak) | BACKSCATTERING RATIO | BACKSCATTERING INTEGRATED |
| Hampton, Virginia (37.1°N, 76.3°W) | |||
| 10 Oct 1996 | 14-29 (15.5) | 1.15 | 4.94 x 10⁻⁵ |
| 31 Oct 1996 | 15-31 (27.5) | 1.13 | 4.45 x 10⁻⁵ |
| 03 Dec 1996 | 12-30 (22.3) | 1.16 | 5.58 x 10⁻⁵ |
| 01 Jan 1997 | 14-28 (21.1) | 1.21 | 7.34 x 10⁻⁵ |
| 22 Jan 1997 | 13-28 (21.2) | 1.19 | 6.41 x 10⁻⁵ |
Information Contacts: Mary Osborn, NASA Langley Research Center (LaRC), Hampton VA 23665, USA.
Cite this Report
Lidar data from Cuba, Hawaii, and Virginia
Table 10 lists atmospheric data from Cuba, Hawaii, and Virginia. Lidar data from Cuba for 27 September through 19 December 1996 indicated a possible atmospheric layer centered between 13.6 and 20.5 km altitude. Lidar data from Hawaii for 3 July through 18 December indicated a possible atmospheric layer centered between 21.7 and 28.0 km altitude. Lidar data from Virginia (USA) for 26 February through 3 April indicated a possible atmospheric layer centered between 15.5 and 20.5 km altitude.
Table 10. Lidar data collected for Cuba (1996), Hawaii (1996) and Virginia (1997), showing altitudes of aerosol layers. Backscattering ratios from Camagüey are for the Nd-YAG wavelength of 0.53 µm; those from Mauna Loa and Hampton are for the ruby wavelength of 0.69 µm. Integrated values show total backscatter, expressed in steradians-1, integrated over 300-m intervals from 16-33 km for Cuba, 15.8-33 km for Hawaii, and from the tropopause to 30 km for Virginia. For Cuba, only bases of the layers are shown. Courtesy of Rene Estevan Arredenta, John Barnes, and Mary Osborne.
| DATE | LAYER ALTITUDE (km) (peak) | BACKSCATTERING RATIO | BACKSCATTERING INTEGRATED |
| Camaguey, Cuba (21.2°N, 77.5°W) | |||
| 27 Sep 1996 | 9.1 (16.3) | 1.37 | 2.28 x 10⁻⁴ |
| 25 Oct 1996 | 15.1 (20.5) | 1.21 | 1.00 x 10⁻⁴ |
| 30 Oct 1996 | 8.8 (19.0) | 1.52 | 5.40 x 10⁻⁴ |
| 08 Nov 1996 | 9.4 (18.7) | 1.45 | 3.54 x 10⁻⁴ |
| 01 Dec 1996 | 10.0 (18.1) | 1.39 | 1.05 x 10⁻⁴ |
| 05 Dec 1996 | 9.4 (16.0) | 1.31 | 2.14 x 10⁻⁴ |
| 11 Dec 1996 | 10.0 (18.1) | 1.25 | 1.91 x 10⁻⁴ |
| Mauna Loa, Hawaii (19.5°N, 155.6°W) | |||
| 03 Jul 1996 | 16-28 (24.7) | 1.22 | 0.48 x 10⁻⁴ |
| 10 Jul 1996 | 16-33 (24.1) | 1.34 | 0.99 x 10⁻⁴ |
| 17 Jul 1996 | 6-34 (22.0) | 1.29 | 0.83 x 10⁻⁴ |
| 01 Aug 1996 | 16-27 (25.3) | 1.18 | 0.51 x 10⁻⁴ |
| 07 Aug 1996 | 16-32 (24.7) | 1.36 | 0.88 x 10⁻⁴ |
| 20 Aug 1996 | 17-31 (24.4) | 1.34 | 0.91 x 10⁻⁴ |
| 28 Aug 1996 | 16-31 (25.9) | 1.28 | 0.67 x 10⁻⁴ |
| 04 Sep 1996 | 17-29 (23.5) | 1.24 | 0.76 x 10⁻⁴ |
| 11 Sep 1996 | 17-30 (28.0) | 1.40 | 0.88 x 10⁻⁴ |
| 18 Sep 1996 | 17-32 (24.1) | 1.29 | 0.78 x 10⁻⁴ |
| 27 Sep 1996 | 17-32 (24.4) | 1.28 | 0.73 x 10⁻⁴ |
| 02 Oct 1996 | 17-34 (25.3) | 1.36 | 0.84 x 10⁻⁴ |
| 10 Oct 1996 | 16-34 (28.0) | 1.38 | 0.97 x 10⁻⁴ |
| 17 Oct 1996 | 16-33 (25.0) | 1.38 | 0.93 x 10⁻⁴ |
| 31 Oct 1996 | 16-32 (22.1) | 1.30 | 0.95 x 10⁻⁴ |
| 27 Nov 1996 | 15-30 (24.4) | 1.40 | 1.19 x 10⁻⁴ |
| 04 Dec 1996 | 17-34 (23.8) | 1.28 | 0.63 x 10⁻⁴ |
| 10 Dec 1996 | 16-34 (25.0) | 1.37 | 1.00 x 10⁻⁴ |
| 18 Dec 1996 | 16-34 (21.7) | 1.45 | 1.20 x 10⁻⁴ |
| Hampton, Virginia (37.1°N, 76.3°W) | |||
| 26 Feb 1997 | 11-25 (19.6) | 1.18 | 0.818 x 10⁻⁴ |
| 13 Mar 1997 | 11-25 (15.5) | 1.15 | 0.562 x 10⁻⁴ |
| 21 Mar 1997 | 11-25 (16.1) | 1.15 | 0.536 x 10⁻⁴ |
| 25 Mar 1997 | 13-25 (17.3) | 1.16 | 0.508 x 10⁻⁴ |
| 03 Apr 1997 | 10-25 (20.5) | 1.17 | 0.645 x 10⁻⁴ |
Information Contacts: Rene Estevan Arredondo, Centro Meterorologico de Camagüey, Apartado 134, Camaguey 70100, Cuba; John Barnes, Mauna Loa Observatory, P.O. Box 275, Hilo, HI 96720 USA; Mary Osborn, NASA Langley Research Center (LaRC), Hampton, VA 23665 USA.
Cite this Report
German lidar data from early 1991 through mid-1997
The Pinatubo aerosol layer at Garmisch-Partenkirchen declined to a minimum in the summer of 1996 (figure 3 and table 11). Since then no further decay was observed. The January-June 1997 average value of the integrated backscatter represents ~70% of 1991 pre-Pinatubo value. It is too early, however, to establish the aerosol load observed since mid-1996 as a new stratospheric background.
 |
Figure 3. Graph showing the log of the lidar backscatter versus time at Garmisch-Partenkirchen, Germany for the latter two-thirds of 1991 through mid-1997. The plotted data are preliminary 532 nm integral values of stratospheric aerosol backscatter (integrated from the tropopause or cirrus to the top of the aerosol layer) versus time. Labeled arrows indicate the eruptions of Pinatubo and Kliuchevskoi. Courtesy of Horst Jager. |
Table 11. Lidar data from Germany (October 1996-June 1997) and Hawaii (July-December 1996) showing altitudes of aerosol layers. Backscattering rations are for the Nd-YAG wavelength of 0.53 um, with equivalent ruby values in parentheses for data from Germany; those from Mauna Loa are for the ruby wavelength of 0.69 um. The integrated value shows total backscatter, expressed in steradians-1, integrated over 300-m intervals from the tropopause to 30 km at Garmisch-Partenkirchen and 15.8-33 km at Hawaii. The "ci" stands for cirrus clouds; their presence in the tropopause region usually obscures the lower boundary of the aerosol layer. Courtesy of Horst Jager and John Barnes.
| DATE | LAYER ALTITUDE (km) (peak) | BACKSCATTERING RATIO | BACKSCATTERING INTEGRATED |
| Garmisch-Partenkirchen, Germany (47.5°N, 11.0°E) | |||
| 03 Oct 1996 | 13-28 (16.3) | 1.08 (1.15) | -- |
| 24 Oct 1996 | 9-27 (19.8) | 1.08 (1.16) | -- |
| 31 Oct 1996 | Ci-26 (15.2) | 1.06 (1.12) | -- |
| 03 Nov 1996 | Ci-30 (14.4) | 1.06 (1.12) | -- |
| 09 Nov 1996 | 12-27 (15.1) | 1.08 (1.15) | -- |
| 22 Nov 1996 | 9-32 (15.2) | 1.08 (1.15) | -- |
| 04 Dec 1996 | Ci-30 (16.7) | 1.08 (1.16) | -- |
| 26 Dec 1996 | 10-30 (23.3) | 1.07 (1.14) | -- |
| 29 Dec 1996 | 9-26 (22.5) | 1.07 (1.13) | -- |
| 12 Jan 1997 | 12-29 (17.5) | 1.09 (1.17) | -- |
| 15 Jan 1997 | 12-29 (22.1) | 1.09 (1.17) | -- |
| 17 Jan 1997 | 10-28 (19.8) | 1.08 (1.15) | -- |
| 30 Jan 1997 | 10-27 (18.7) | 1.09 (1.17) | -- |
| 06 Feb 1997 | 14-28 (22.5) | 1.09 (1.17) | -- |
| 10 Feb 1997 | 11-29 (20.3) | 1.07 (1.13) | -- |
| 22 Feb 1997 | 13-27 (19.8) | 1.08 (1.15) | -- |
| 01 Mar 1997 | 12-26 (20.9) | 1.08 (1.16) | -- |
| 09 Mar 1997 | 11-28 (20.1) | 1.10 (1.20) | -- |
| 12 Mar 1997 | 16-26 (20.6) | 1.07 (1.15) | -- |
| 02 Apr 1997 | 13-26 (22.7) | 1.07 (1.14) | -- |
| 07 Apr 1997 | 12-27 (18.7) | 1.10 (1.20) | -- |
| 17 Apr 1997 | 12-26 (15.9) | 1.06 (1.13) | -- |
| 24 Apr 1997 | 13-30 (18.5) | 1.10 (1.20) | -- |
| 14 May 1997 | Ci-28 (19.7) | 1.08 (1.16) | -- |
| 06 Jun 1997 | Ci-25 (19.9) | 1.08 (1.16) | -- |
| Mauna Loa, Hawaii (19.5°N, 155.6°W) (corrected data) | |||
| 03 Jul 1996 | 16-28 (24.7) | 1.22 | 0.48 x 10⁻⁴ |
| 10 Jul 1996 | 16-33 (24.1) | 1.34 | 0.99 x 10⁻⁴ |
| 17 Jul 1996 | 16-34 (22.0) | 1.29 | 0.83 x 10⁻⁴ |
| 01 Aug 1996 | 16-27 (25.3) | 1.18 | 0.51 x 10⁻⁴ |
| 07 Aug 1996 | 16-32 (24.7) | 1.36 | 0.88 x 10⁻⁴ |
| 20 Aug 1996 | 17-31 (24.4) | 1.34 | 0.91 x 10⁻⁴ |
| 28 Aug 1996 | 16-31 (25.9) | 1.28 | 0.67 x 10⁻⁴ |
| 04 Sep 1996 | 17-29 (23.5) | 1.24 | 0.76 x 10⁻⁴ |
| 11 Sep 1996 | 17-30 (28.0) | 1.40 | 0.88 x 10⁻⁴ |
| 18 Sep 1996 | 17-32 (24.1) | 1.29 | 0.78 x 10⁻⁴ |
| 27 Sep 1996 | 17-32 (24.4) | 1.28 | 0.73 x 10⁻⁴ |
| 02 Oct 1996 | 17-34 (25.3) | 1.36 | 0.84 x 10⁻⁴ |
| 10 Oct 1996 | 16-34 (28.0) | 1.38 | 0.97 x 10⁻⁴ |
| 17 Oct 1996 | 16-33 (25.0) | 1.38 | 0.93 x 10⁻⁴ |
| 31 Oct 1996 | 16-32 (22.1) | 1.30 | 0.95 x 10⁻⁴ |
| 27 Nov 1996 | 15-30 (24.4) | 1.40 | 1.19 x 10⁻⁴ |
| 04 Dec 1996 | 17-34 (23.8) | 1.28 | 0.63 x 10⁻⁴ |
| 10 Dec 1996 | 16-34 (25.0) | 1.37 | 1.00 x 110-4 |
| 18 Dec 1996 | 16-34 (21.7) | 1.45 | 1.20 x 10⁻⁴ |
Correction: Lidar data from Mauna Loa, Hawaii, for July-December 1996 (Bulletin v. 22, no. 3) was incorrect by a factor of 1,000. Corrected data is presented in this issue (table 11).
Information Contacts: Horst Jager, Fraunhofer-Institut fur Atmospharische Umweltforschung, Kreuzeckbahnstrasse 19, D-8100 Garmisch-Partenkirchen, Germany.
Cite this Report
Lidar data from Germany
The Pinatubo aerosol layer at Garmisch-Partenkirchen declined to a minimum in the summer of 1996 (Bulletin v. 21, no. 12, and v. 22, no. 5). Since then no further decay has been observed. The backscattering ratio during June-October 1997 was consistently in the 1.05-1.08 range (Nd-YAG) with the peak layer altitude at 16.4-19.2 km (table 12).
Table 12. Lidar data from Germany (June-October 1997) showing altitudes of aerosol layers. Backscattering ratios are for the Nd-YAG wavelength of 0.53 µm with equivalent ruby values in parentheses. The integrated value shows total backscatter, expressed in steradians-1, integrated over 300-m intervals from the tropopause to 30 km. The "ci" stands for cirrus clouds; their presence in the tropopause region usually obscures the lower boundary of the aerosol layer. Courtesy of Horst Jager.
| DATE | LAYER ALTITUDE (km) (peak) | BACKSCATTERING RATIO | BACKSCATTERING INTEGRATED |
| Garmisch-Partenkirchen, Germany (47.5°N, 11.0°E) | |||
| 04 Jun 1997 | ci-25 (19.9) | 1.08 (1.16) | -- |
| 29 Jun 1997 | 9-26 (16.8) | 1.08 (1.15) | -- |
| 11 Jul 1997 | 13-27 (17.9) | 1.06 (1.12) | -- |
| 15 Jul 1997 | 12-27 (17.7) | 1.07 (1.14) | -- |
| 20 Jul 1997 | 10-27 (18.5) | 1.07 (1.14) | -- |
| 30 Jul 1997 | 13-24 (18.2) | 1.05 (1.10) | -- |
| 04 Aug 1997 | 12-25 (18.8) | 1.06 (1.12) | -- |
| 18 Aug 1997 | 12-25 (17.7) | 1.05 (1.10) | -- |
| 08 Sep 1997 | 14-25 (18.3) | 1.08 (1.15) | -- |
| 26 Sep 1997 | 14-28 (16.5) | 1.08 (1.16) | -- |
| 06 Oct 1997 | 13-28 (16.4) | 1.07 (1.14) | -- |
| 17 Oct 1997 | 14-26 (17.7) | 1.06 (1.13) | -- |
| 28 Oct 1997 | 11-28 (19.2) | 1.08 (1.16) | -- |
Information Contacts: Horst Jager, Fraunhofer-Institut fur Atmospharische Umweltforschung, Kreuzeckbahnstrasse 19, D-8100 Garmisch-Partenkirchen, Germany.
Cite this Report
Volcanic aerosol optical thicknesses since 1960
Richard A. Keen submitted the following report. About once per year, on average, the moon is eclipsed as it passes into the earth's shadow; at these times it can be used a remote sensor of the globally averaged optical depth of stratospheric aerosols of volcanic origin. Conceptually, the linkage between volcanic aerosols and lunar eclipses is as follows: 1) The moon is visible during total lunar eclipses due to sunlight refracted into the shadow (umbra) by the earth's atmosphere (primarily the stratosphere); 2) Stratospheric aerosols reduce the transmission of sunlight into the umbra; and 3) The path length of sunlight through a stratospheric aerosol layer is ~40x the vertical thickness of the layer. Therefore, the brightness of the eclipsed moon is extremely sensitive to the amount of aerosols in the stratosphere.
Methodology and data reduction. Aerosol optical thicknesses can be calculated for the date of an eclipse from the difference between the observed brightness of the eclipse and a modeled brightness computed for an aerosol-free standard atmosphere, modified by assumed distributions of ozone and cloud. A report on this technique, applied to observations during 1960 through 1982, appeared in Keen (1983); an update following the eruption of Pinatubo was reported in February 1993 (Bulletin v. 18, no. 2).
This report updates the time series from 1960 through the lunar eclipse of 16 September 1997 (figure 4), the last total lunar eclipse until January 2001. Plotted values are actual derived optical depths, modified as described below. Due to the higher concentration of Agung and El Chichón aerosols in the southern and northern hemispheres, respectively, a sampling bias due to the moon's passing though the southern or northern portion of the umbra was removed by using an empirical adjustment factor of 0.8 (thus, if the moon passed south of the earth's shadow axis during an eclipse following Agung, the derived optical thickness was multiplied by 0.8, while the derived value was divided by 0.8 if the moon passed north of the axis).
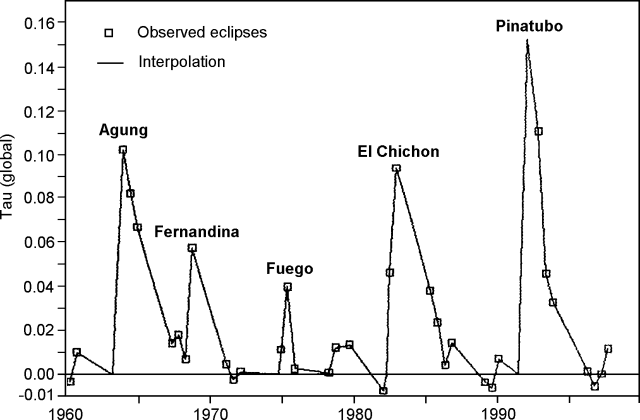 |
Figure 4. Volcanic aerosol optical thicknesses derived from 35 total or near-total lunar eclipses during 1960-97. Courtesy of Richard Keen. |
No lunar eclipses occurred until 18 months after the June 1991 Pinatubo eruption, while results from Agung and El Chichón indicate that peak optical depths occurred about 9 months after those eruptions. Therefore, for plotting purposes, the time series of optical thicknesses following Pinatubo was extrapolated backwards to a date 9 months after the eruption using a composite decay curve derived from the Agung and El Chichón data. Finally, the global optical depths were set to zero on the dates of the eruptions of Agung, Fuego, and Pinatubo; observed values were near zero for eclipses close to the eruption dates of Fernandina and El Chichón.
Time series. The volcanic eruptions probably responsible for the major peaks in the time series are identified, although the correlation of Fernandina with the 1968 peak is highly uncertain. Comparative maximum global optical thicknesses are: Pinatubo (1991), 0.15; Agung (1963), 0.10; El Chichón (1982), 0.09; Fernandina (1968), 0.06; Fuego (1974), 0.04. The results indicate that the volcanic aerosol veil from Pinatubo disappeared between the eclipses of November 1993 and April 1996, with optical depth probably reaching zero sometime in 1995. A slight increase to an observed value of 0.01 for the September 1997 eclipse is close to the noise level due to the uncertainty in the brightness observations; if real, it could indicate aerosols from the eruption of Soufriere Hills. Interestingly, a similarly slight increase in optical depth in 1979 may have been due to the eruption of Soufriere of St. Vincent.
Acknowledgments. Thanks are due to the following who supplied observations of the four eclipses in 1996-97: K. Hornoch and M. Plsek (Czech Republic), G. Glitscher (Germany), K. Yoshimoto (Japan), K. Al-Tell, N. Abanda, M. Odeh, S. Abdo (Jordan), R. Bouma, G. Comello, H. Feijth, and E. van Dijk (Netherlands), B. Granslo and O. Skilbrei (Norway), C. Vitorino and A. Pereira (Portugal), P. Schlyter (Sweden), R. Pickard, A. Moss, J. Shanklin, and W. Worraker (UK), and D. Green (USA).
Reference. Keen, R., 1983, Volcanic aerosols and lunar eclipses: Science, v. 222, p. 1011- 1013.
Information Contacts: Richard A. Keen, 34296 Gap Road, Golden, CO 80403 USA.
Cite this Report
Lidar data from Germany and Virginia
Table 13 lists atmospheric lidar data from Hampton, Virginia for 8 April 1997 through 26 February 1998, and from Garmisch-Partenkirchen, Germany for 3 November 1997 to 14 April 1998. The aerosol backscatter measured at Hampton on 26 February 1998 shows a typical winter increase in stratospheric aerosol compared to measurements made the previous summer. The increase from summer to winter is generally a function of the difference in tropopause height between the two seasons. In this case there is a significant decrease in integrated stratospheric aerosol compared to measurements obtained during the winter of 1997 (Bulletin v. 22, nos. 1, 3).
Table 13. Lidar data collected for Virginia (April 1997-February 1998) and Germany (November 1997-April 1998) showing altitudes of aerosol layers. Backscattering rations from Hampton are for the ruby wavelength of 0.69 µm; those from Garmisch-Partenkirchen are for the Nd-YAG wavelength of 0.53 µm, with equivalent ruby values in parentheses. The integrated value shows total backscatter, expressed in steradians-1, integrated over 300-m intervals from the tropopause to 30 km for both Virginia and Germany. Courtesy of Mary Osborne and Horst Jäger.
| DATE | LAYER ALTITUDE (km) (peak) | BACKSCATTERING RATIO | BACKSCATTERING INTEGRATED |
| Hampton, Virginia (37.1°N, 76.3°W) | |||
| 08 Apr 1997 | 17-27 (20.5) | 1.12 | 5.02 x 10⁻⁵ |
| 16 Apr 1997 | 17-27 (19.6) | 1.17 | 6.90 x 10⁻⁵ |
| 07 May 1997 | 17-27 (20.3) | 1.14 | 4.90 x 10⁻⁵ |
| 22 May 1997 | 15-28 (20.5) | 1.13 | 4.76 x 10⁻⁵ |
| 11 Jun 1997 | 15-25 (20.6) | 1.12 | 3.01 x 10⁻⁵ |
| 15 Jul 1997 | 15-27 (18.1) | 1.14 | 3.73 x 10⁻⁵ |
| 01 Aug 1997 | 15-28 (23.6) | 1.11 | 3.53 x 10⁻⁵ |
| 05 Sep 1997 | 14-30 (21.7) | 1.11 | 4.06 x 10⁻⁵ |
| 26 Feb 1998 | 12-28 (16.4) | 1.10 | 4.28 x 10⁻⁵ |
| Garmisch-Partenkirchen, Germany (47.5°N, 11.0°E) | |||
| 03 Nov 1997 | 13-26 (17.4) | 1.07 (1.13) | -- |
| 08 Nov 1997 | 10-26 (19.9) | 1.06 (1.13) | -- |
| 10 Nov 1997 | 9-25 (18.9) | 1.08 (1.15) | -- |
| 19 Nov 1997 | 10-24 (20.3) | 1.06 (1.12) | -- |
| 27 Nov 1997 | 10-23 (16.0) | 1.07 (1.13) | -- |
| 09 Jan 1998 | 10-26 (21.9) | 1.08 (1.15) | -- |
| 30 Jan 1998 | 11-28 (14.7) | 1.07 (1.13) | -- |
| 13 Feb 1998 | 12-30 (18.1) | 1.08 (1.16) | -- |
| 18 Feb 1998 | 12-27 (18.3) | 1.09 (1.18) | -- |
| 10 Mar 1998 | 11-33 (17.3) | 1.10 (1.20) | -- |
| 25 Mar 1998 | 10-28 (17.0) | 1.05 (1.09) | -- |
| 14 Apr 1998 | 11-32 (16.3) | 1.07 (1.13) | -- |
A graph of integral stratospheric aerosol backscatter (figure 5) shows how the stratospheric aerosol load had declined by the end of 1997 to pre-Pinatubo values. More observations are needed to decide whether a new background level has been reached or will be reached in the near future.
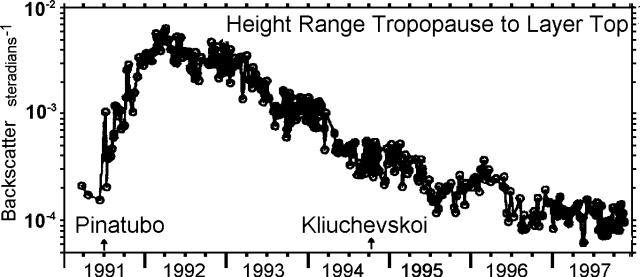 |
Figure 5. Graph showing the log of the lidar backscatter versus time at Garmisch-Partenkirchen, Germany for the latter two-thirds of 1991 through end-1997. The plotted data are preliminary 532 nm integral values of stratospheric aerosol backscatter (integrated from the tropopause or cirrus to the top of the aerosol layer) versus time. Labeled arrows indicate the eruptions of Pinatubo and Kliuchevskoi. Courtesy of Horst Jäger. |
Information Contacts: Mary Osborn, NASA Langley Research Center (LaRC), Hampton, VA 23665 USA; Horst Jäger, Fraunhofer -- Institut für Atmosphärische Umweltforschung, Kreuzeckbahnstrasse 19, D-82467 Garmisch-Partenkirchen, Germany.
Cite this Report
Lidar data from Hawaii and Germany
Table 14 lists atmospheric lidar data from Mauna Loa, Hawaii for 2 July 1997 through 21 January 1998, and from Garmisch-Partenkirchen, Germany for 20 April through 24 June 1998. Measurements indicate that the aerosol layer peak location over Hawaii was at a consistently lower elevation in the second half of 1997 (19.2-25.3 km) compared to the second half of 1996 (21.7-28.0 km) (Bulletin v. 22, no. 5). Measurements from Germany showed no significant change compared to earlier in 1998 (Bulletin v. 23, no. 3).
Table 14. Lidar data from Hawaii (July 1997-January 1998) and Germany (April-June 1998) showing altitudes of aerosol layers. Backscattering ratios from Mauna Loa are for the ruby wavelength of 694 nm; those from Garmisch-Partenkirchen are for the Nd-YAG wavelength of 532 nm, with equivalent ruby values in parentheses. Integrated values show total backscatter, expressed in steradians-1, integrated over 300-m intervals from 15.8-33 km for Hawaii, and from the tropopause to 30 km for Germany. Courtesy of John Barnes and Horst Jäger.
| DATE | LAYER ALTITUDE (km) (peak) | BACKSCATTERING RATIO | BACKSCATTERING INTEGRATED |
| Mauna Loa, Hawaii (19.5°N, 155.6°W) | |||
| 02 Jul 1997 | 16-28 (23.8) | 1.26 | 0.69 x 10⁻⁴ |
| 11 Jul 1997 | 17-29 (18.4) | 1.50 | 0.72 x 10⁻⁴ |
| 16 Jul 1997 | 16-28 (23.2) | 1.26 | 0.78 x 10⁻⁴ |
| 23 Jul 1997 | 16-29 (22.9) | 1.31 | 0.97 x 10⁻⁴ |
| 01 Aug 1997 | 16-27 (19.9) | 1.23 | 0.55 x 10⁻⁴ |
| 06 Aug 1997 | 16-28 (19.5) | 1.37 | 0.98 x 10⁻⁴ |
| 14 Aug 1997 | 17-28 (22.3) | 1.30 | 0.67 x 10⁻⁴ |
| 21 Aug 1997 | 17-30 (22.6) | 1.24 | 0.54 x 10⁻⁴ |
| 27 Aug 1997 | 16-27 (21.4) | 1.31 | 0.89 x 10⁻⁴ |
| 03 Sep 1997 | 16-28 (24.7) | 1.24 | 0.62 x 10⁻⁴ |
| 10 Sep 1997 | 17-28 (25.3) | 1.28 | 0.67 x 10⁻⁴ |
| 17 Sep 1997 | 16-27 (25.3) | 1.25 | 0.80 x 10⁻⁴ |
| 22 Oct 1997 | 16-27 (23.5) | 1.26 | 0.83 x 10⁻⁴ |
| 07 Nov 1997 | 16-29 (21.4) | 1.20 | 0.68 x 10⁻⁴ |
| 12 Nov 1997 | 17-27 (19.9) | 1.18 | 0.85 x 10⁻⁴ |
| 06 Dec 1997 | 16-28 (24.1) | 1.28 | 1.18 x 10⁻⁴ |
| 19 Dec 1997 | 16-27 (19.6) | 1.28 | 0.95 x 10⁻⁴ |
| 24 Dec 1997 | 16-28 (20.2) | 1.27 | 0.99 x 10⁻⁴ |
| 07 Jan 1998 | 17-28 (19.2) | 1.50 | 1.00 x 10⁻⁴ |
| 16 Jan 1998 | 16-29 (19.3) | 1.41 | 1.33 x 10⁻⁴ |
| 21 Jan 1998 | 16-28 (20.8) | 1.61 | 1.27 x 10⁻⁴ |
| Garmisch-Partenkirchen, Germany (47.5°N, 11.0°E) | |||
| 20 Apr 1998 | 11-34 (18.5) | 1.06 (1.12) | -- |
| 23 Apr 1998 | 13-30 (19.0) | 1.06 (1.11) | -- |
| 29 Apr 1998 | 11-33 (15.5) | 1.06 (1.13) | -- |
| 07 May 1998 | 14-33 (18.6) | 1.05 (1.10) | -- |
| 11 May 1998 | 13-28 (19.4) | 1.05 (1.09) | -- |
| 14 May 1998 | 12-28 (20.3) | 1.05 (1.10) | -- |
| 20 May 1998 | 12-27 (19.2) | 1.05 (1.10) | -- |
| 30 May 1998 | 11-27 (22.5) | 1.04 (1.08) | -- |
| 09 Jun 1998 | 13-29 (15.8) | 1.05 (1.10) | -- |
| 24 Jun 1998 | 13-30 (19.4) | 1.04 (1.08) | -- |
Information Contacts: John Barnes, Mauna Loa Observatory, P.O. Box 275, Hilo, HI 96720 USA; Horst Jäger, Fraunhofer -- Institut für Atmosphärische Umweltforschung, Kreuzeckbahnstrasse 19, D-82467 Garmisch-Partenkirchen, Germany.
Cite this Report
Lidar data from Hampton, Virginia, USA
Table 15 lists the ground-based 48-inch lidar measurements at 0.69 µm taken with a ruby laser in Hampton, Virginia (37.1°N, 76.3°W) during 1998. The lowest levels of aerosol loading ever reported in the 24-year lidar record at Hampton were measured during the summer of 1998.
Table 15. Lidar data from Virginia, USA, for April-December 1998 showing altitudes of aerosol layers. Backscattering ratios are for the ruby wavelength of 0.69 µm. The integrated values show total backscatter, expressed in steradians-1, integrated over 300-m intervals from the tropopause to 30 km. Courtesy of Mary Osborne.
| DATE | LAYER ALTITUDE (km) (peak) | BACKSCATTERING RATIO | BACKSCATTERING INTEGRATED |
| Hampton, Virginia (37.1°N, 76.3°W) | |||
| 03 Apr 1998 | 13-26 (19.6) | 1.09 | 4.11 x 10⁻⁵ |
| 07 Apr 1998 | 12-27 (14.5) | 1.10 | 5.38 x 10⁻⁵ |
| 13 Apr 1998 | 15-25 (21.5) | 1.06 | 2.98 x 10⁻⁵ |
| 20 May 1998 | 13-28 (25.9) | 1.08 | 3.42 x 10⁻⁵ |
| 19 Jun 1998 | 13-23 (20.9) | 1.04 | 1.70 x 10⁻⁵ |
| 02 Jul 1998 | 14-29 (18.8) | 1.06 | 1.17 x 10⁻⁵ |
| 14 Jul 1998 | 15-29 (18.5) | 1.05 | 1.62 x 10⁻⁵ |
| 10 Sep 1998 | 17-30 (27.7) | 1.06 | 0.89 x 10⁻⁵ |
| 24 Sep 1998 | 13-29 (16.6) | 1.11 | 2.99 x 10⁻⁵ |
| 15 Oct 1998 | 13-33 (14.2) | 1.11 | 4.81 x 10⁻⁵ |
| 24 Nov 1998 | 14-29 (17.9) | 1.10 | 3.79 x 10⁻⁵ |
| 02 Dec 1998 | 12-27 (18.2) | 1.09 | 3.15 x 10⁻⁵ |
Information Contacts: Mary Osborn, NASA Langley Research Center (LaRC), Hampton, VA 23681 USA.
Cite this Report
Lidar data from Garmisch-Partenkirchen, Germany
Atmospheric lidar measurements from Germany (table 16) from July through December 1998 showed no significant change compared to levels recorded earlier in 1998 (Bulletin v. 23, no. 6). Layer altitudes were in the 12-29 km range, with peaks at 14.0-21.9 km.
Table 16. Lidar data from Germany (July-December 1998) showing altitudes of aerosol layers. Backscattering ratios are for the Nd-YAG wavelength of 532 nm, with the equivalent ruby values (690 nm) in parentheses. Courtesy of Horst Jäger.
| DATE | LAYER ALTITUDE (km) (peak) | BACKSCATTERING RATIO | BACKSCATTERING INTEGRATED |
| Garmisch-Partenkirchen, Germany (47.5°N, 11.0°E) | |||
| 29 Jul 1998 | 14-29 (16.6) | 1.05 (1.09) | -- |
| 06 Aug 1998 | 12-28 (15.4) | 1.06 (1.11) | -- |
| 19 Aug 1998 | 12-30 (14.0) | 1.06 (1.12) | -- |
| 26 Aug 1998 | 12-29 (14.6) | 1.07 (1.13) | -- |
| 09 Sep 1998 | 13-27 (15.5) | 1.10 (1.19) | -- |
| 22 Sep 1998 | 15-29 (19.8) | 1.04 (1.08) | -- |
| 25 Sep 1998 | 12-30 (21.9) | 1.04 (1.08) | -- |
| 13 Oct 1998 | 11-30 (15.2) | 1.06 (1.12) | -- |
| 16 Oct 1998 | 12-24 (15.9) | 1.04 (1.09) | -- |
| 18 Nov 1998 | 11-29 (14.9) | 1.06 (1.11) | -- |
| 08 Dec 1998 | 12-27 (17.9) | 1.08 (1.15) | -- |
Information Contacts: Horst Jäger, Fraunhofer-Institut fuer Atmosphaerische, Umweltforschung, IFU, Kreuzeckbahnstr., 19 D-82467, Garmisch-Partenkirchen, Germany.
Cite this Report
Tracing recent ash by satellite-borne sensors and ground-based lidar
Observers at the Alaska Volcano Observatory initially inferred that the 19 April Shishaldin plume reached ~13-14 km altitude based on what appeared to be as the most reliable pilot reports (see above and Bulletin v. 24, no. 3). Yet, one pilot reported the plume to 18.3 km altitude and satellite data suggested similar altitudes. Through at least late May, scientists continued to detect and track stratospheric aerosols. At the time of this writing we have learned of successful satellite detection by GOES 10, the Total Ozone Mapping Spectrometer (TOMS), Stratospheric Aerosol and Gas Experiment (SAGE II), and the Polar Ozone and Aerosol Measurement (POAM). Ground-based lidar also detected presumed Shishaldin aerosol layers far from the source.
GOES observations. GOES 10 data portrayed early images of the plume (figure 6). According to Dave Schneider, thermal split-window imagery showed curiously little evidence of the plume in the stratosphere. Detection conditions were non-ideal: a warmer stratospheric cloud (the plume) overlying a colder tropospheric cloud deck. He also commented on a lack of evidence for ash at lower levels and wondered what role sulfate may have played.
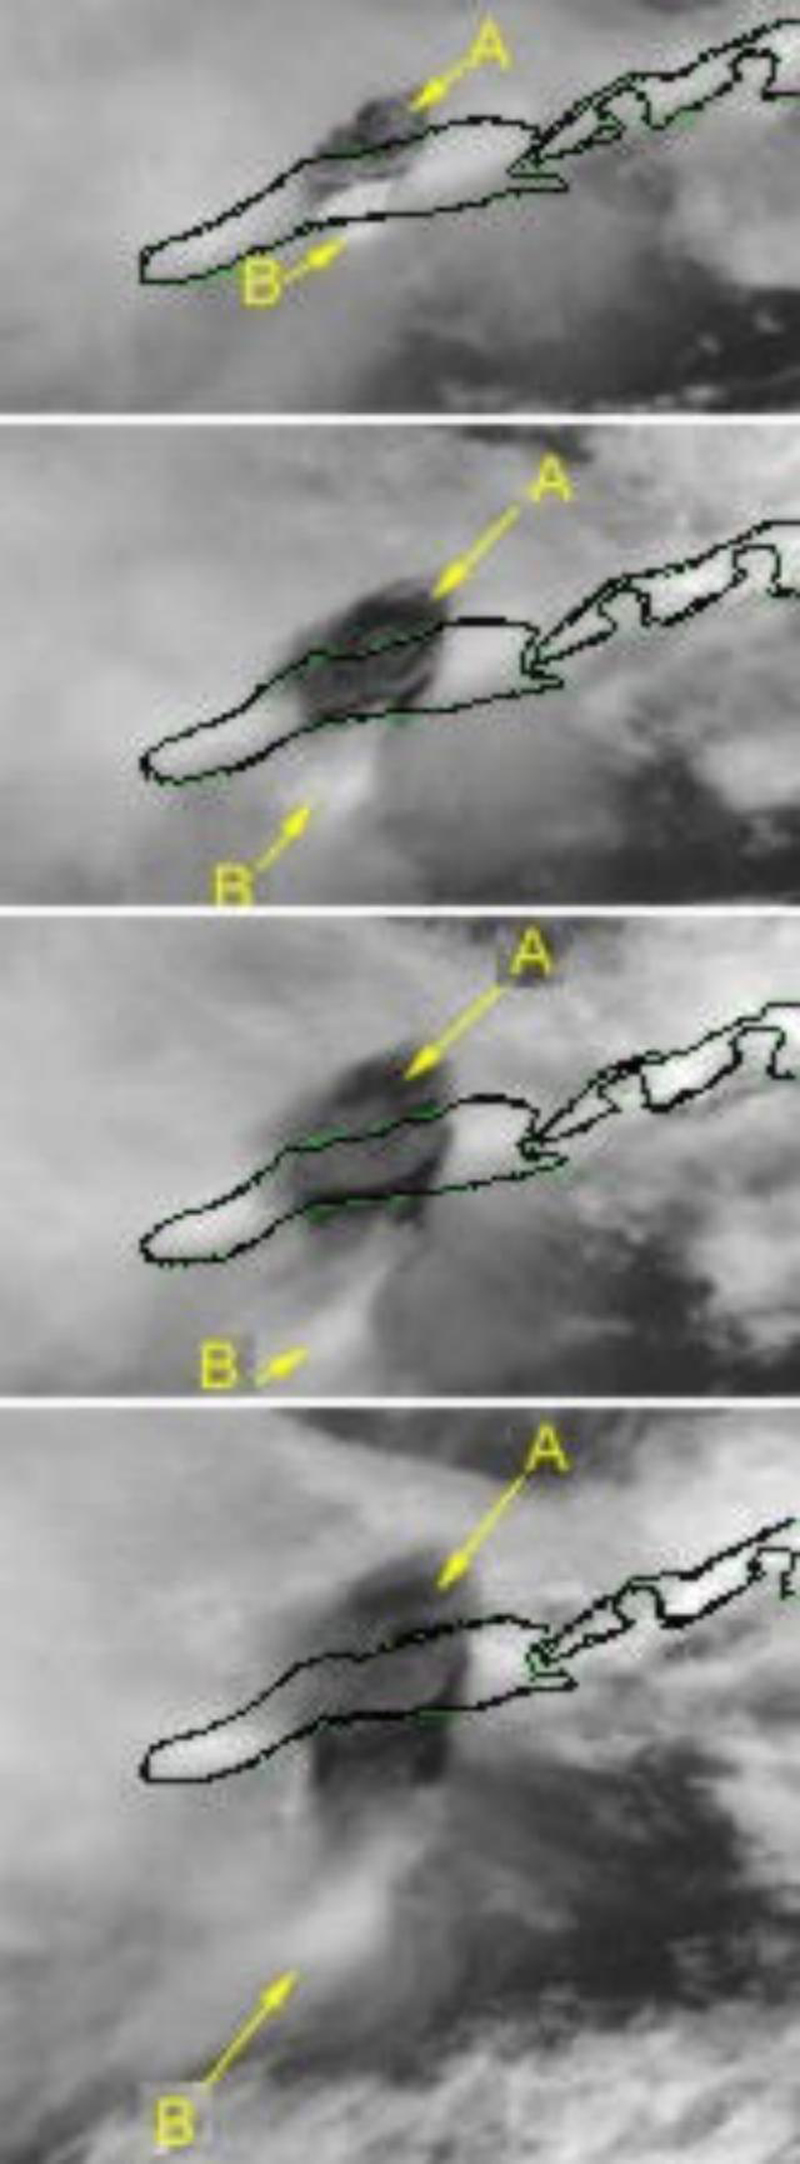 |
Figure 6. Detailed view of the spreading eruption cloud from Shishaldin on 19 April, taken from a series of images taken by the GOES 10 satellite (channel 1). Unimak Island is outlined. The top frame was imaged at 1200; the following frames at subsequent half-hour increments. The cloud labeled "A" was at higher altitude and moved N; cloud "B" was at lower altitude and moved S. Courtesy of NOAA/NESDIS. |
TOMS observations. The TOMS instrument rides aboard NASA's Earth Probe satellite and collects information about airborne gases and particles, including ozone, SO2, and volcanic ash. TOMS passed over Shishaldin at 2142 GMT on 19 April, two hours after the eruption began as a small white plume in the GOES images. Thus, TOMS captured an early stage of the event while the eruption column was actively growing. This early post-eruption data reflected very high concentrations of SO2 and ash in a pixel over the volcano and smaller amounts in two adjacent pixels (unshaded boxes, figure 7). The TOMS images can now retrieve ash as well as SO2 concentrations; the dense 19 April plume, however, was not conducive to realistic SO2 measurement.
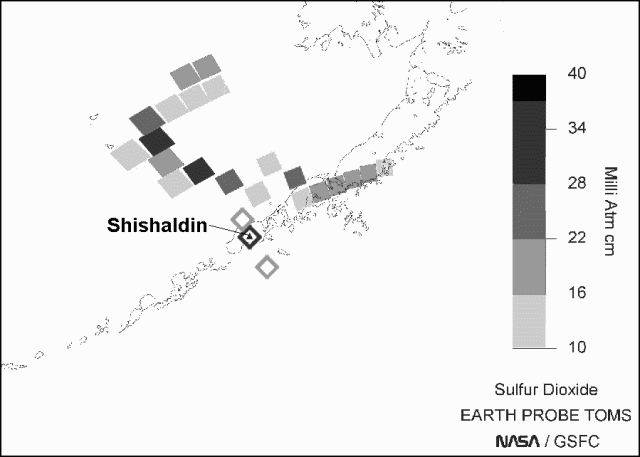 |
Figure 7. TOMS measurements of SO2 near Alaska on 19 April (unshaded boxes, no scale) and 20 April 1999 (shaded boxes, see scale at right) with respect to local coastal margins (lines) and Shishaldin volcano (triangle). For 20 April, shaded boxes (pixels) indicate SO2 gas concentrations of up to 40 milliAtm · cm. Each pixel represents a footprint of TOMS (about 40 x 40 km) containing SO2. The total SO2 depicted in the 20 April image, obtained by summing the pixels, was 20 ktons. (TOMS Orbits 15142 and 15168.) Courtesy of Arlin Krueger and Steve Schaefer, NASA/GSFC. |
On 20 April the Shishaldin cloud was still found close to the volcano as an arc-shaped plume of SO2 (figure 7) to the N of and disconnected from the volcano. However, no detectable ash remained in the plume. This dispersed cloud was used to determine that the mass of SO2 in the eruption was 20 ktons. Traces of this SO2 cloud still remained on 21 April after drifting slightly to the N, but were gone on 22 April.
POAM III and SAGE II satellite observations. As discussed on their web site (NRL, 1999) the POAM instrument was developed by the U.S. Naval Research Laboratory (NRL) to measure the vertical distribution of atmospheric ozone, water vapor, nitrogen dioxide, aerosol extinction, and temperature. Solar extinction by the atmosphere is measured using the solar occultation technique; the sun is observed through the Earth's atmosphere as it rises and sets as viewed from the satellite. POAM data on stratospheric aerosols provide information on how the aerosol burden varied with altitude, latitude, season, and annually in a record going back over 3 years. The data have good vertical resolution (1 km), wide geographic coverage, and dense sampling in the polar regions over the latitude range 55°N-71°N. The following discusses data collected by the instrument's latest version (POAM III). SAGE II, another very similar satellite-based, limb-profiling technique has also contributed data.
As shown on figures 8 and 9, trajectory modeling and observational data from POAM III and SAGE II indicated that air parcels moving away from the eruption column at different altitudes took very different paths during the days following the eruption. The forward trajectory model (figure 8) shows strong correspondance with those run independantly by Barbara Stunder at the same altitudes. The modeling indicated that the part of the plume at ~12 km altitude first moved slightly SW, then E, then NE, and finally ESE. Modeling also indicated that the part of the plume at ~18-19 km altitude moved N and varying amounts to the E. In accord with this, high altitude volcanic aerosol material was detected N of 70°N latitude on 23 April by SAGE II. Finally, the modeling indicated that the part of the plume at ~14-16 km altitude branched away from the higher altitude material and began heading E. On 23 April the plume was observed on a POAM III profile (figures 8 and 9).
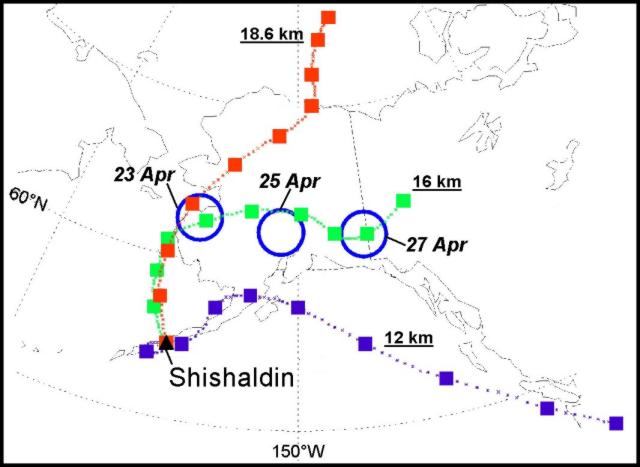 |
Figure 8. Simulated air parcel trajectories that originated at Shishaldin on 19 April (squares), and profiles actually observed by POAM III (open circles). The figure illustrates stratospheric circulation and observations during 9 days beginning at 2000 GMT on 19 April and ending at 2000 GMT on 28 April. The trajectory paths were estimated from the motion of their respective associated air parcels at the indicated altitudes; each successive square indicates the results of 24 hours movement. The three aerosol layers sensed by POAM III limb profiling are depicted as circles that have these dates, center coordinates, and altitudes: 23 April at 62.7°N, 197.1°W, 15 km altitude; 25 April at 62.4°N, 207.9°W, 14 km altitude; and 27 April at 62.0°N, 218.7°W, 13 km altitude. Courtesy of Mike Fromm, NRL. |
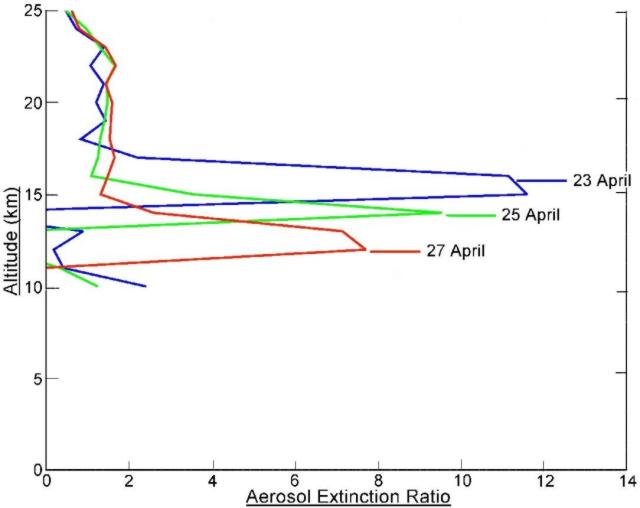 |
Figure 9. POAM III aerosol extinction ratios on 23, 25, and 27 April. The peaks are due to volcanic aerosols from Shishaldin. The measurement locations are given in the caption for figure 12. Normal background ratios are 1-2. Courtesy of Mike Fromm, NRL. |
Figure 9 illustrates aerosol extinction ratios for the aerosol layers seen on 23, 25, and 27 April (circles, figure 8). The peak values shown in figure 9 lie 3-4 standard deviations above the normal background. Anomalously high extinction ratios in the lower stratosphere such as these continued well into May. The plot indicates the plume's height progressively decreased during the course of the three observations, descending from altitudes of ~15 to ~13 km, implying that the volcanic particulate settled out at roughly 0.5 km per day.
Figure 10 illustrates the POAM III results for several weeks following the 19 May Shishaldin eruption. It maps the location of all available POAM profiles (+ symbols) and 14 profiles with varying loads of enhanced stratospheric aerosols (circles). Larger circles indicate larger aerosol loads; more specifically, the circle sizes vary in proportion to the peak aerosol enhancement, determined in relation to the standard deviation of the aerosol extinction ratio in relevant background conditions. The altitudes of peak extinctions varied from 12-15 km.
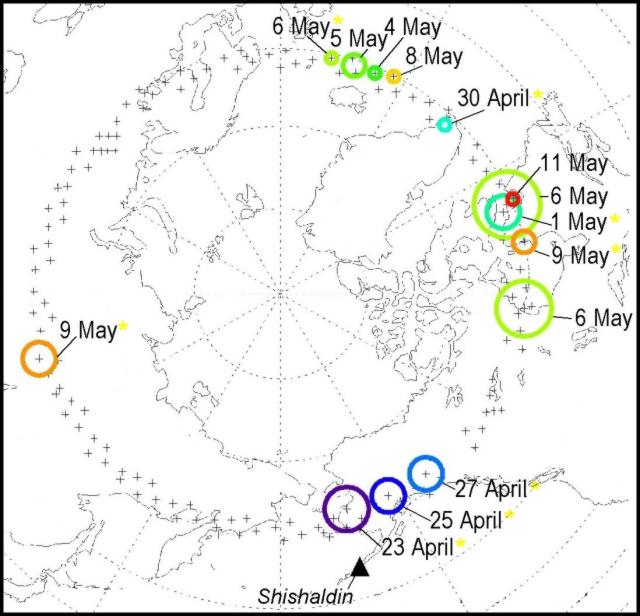 |
Figure 10. A polar orthographic projection showing POAM III profiles taken 23 April-11 May 1999. The locations of all possible profiles during the period appear as crosses. The locations of 14 profiles with enhanced stratospheric extinction appear as open circles (labeled with their observation dates). Circle sizes vary in proportion to the peak aerosol enhancement (see text). In back-trajectory models, the profiles with starred dates can be traced back to Shishaldin on 19 April (see text). The map's line-spacings are as follows: latitude, 10°; longitude, 30°. Courtesy of Mike Fromm, NRL. |
Looked at on the scale of weeks after the eruption, the atmospheric circulation carried 19 April eruptive products towards the W. For the starred profiles on figure 10, isentropic (constant entropy, which assumes conservation of potential temperature) modeling of back trajectories strongly suggested Shishaldin as the source. POAM III continued to detect enhancements of aerosols in the lowest stratosphere at least until 23 May. The latitudes of the profile's center points moved gradually from about 62°N in late April to 57°N in late May.
Attempts to link additional POAM III observations (those that lack stars) with Shishaldin through isentropic trajectory analysis is in progress, but thus far some of them have failed to lead either back to Shishaldin or to another clear source. Around 5-6 May, for example, two stratospheric aerosol layers resided over or near Hudson Bay, Canada and were also not traceable to Shishaldin in trajectory models. As for another layer at that time, S of Iceland, the models indicate a likely source at the eruption.
Ground-based lidar observations. Lidars (light radars), which measure the amount of backscattered laser energy due to plume and atmospheric conditions (Jørgensen and others, 1997), detected aerosol layers over Germany, Virginia, and Greece. Beginning on the evening of 6 May, Horst Jäger detected a stratospheric layer while profiling with a 532-nm wavelength lidar operated in Garmisch-Partenkirchen, Germany (47.5°N, 11.0°E). His 6 May data showed a small but pronounced peak in the scattering ratio (figure 11). The source of the anomaly was between 15.1 and 15.4 km altitude, well above the estimated maximum altitude of the local troposphere (11.4 km, as determined by a midnight radiosonde from Munich). A maximum scatter ratio of 1.35 occurred at 15.2 km.
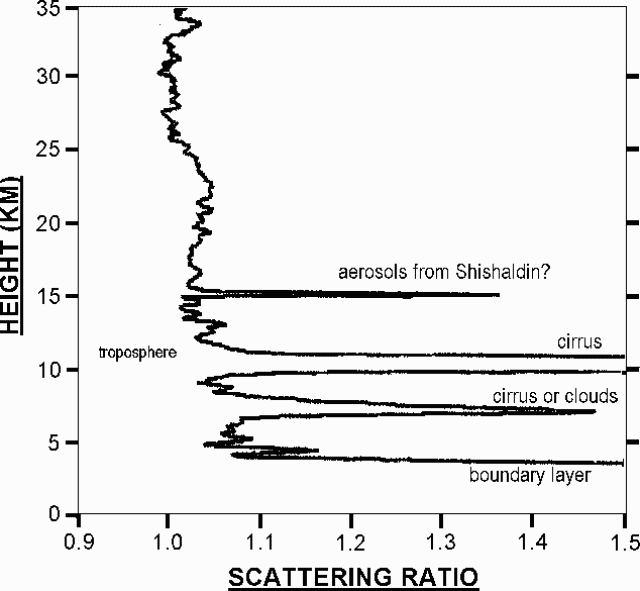 |
Figure 11. Lidar backscatter ratios as a function of height as measured from the 532-nm lidar at Garmisch-Partenkirchen, Germany on 16 May 1999. Courtesy of Horst Jäger. |
On 9 May the atmosphere lacked detectible layers in the expected altitude region. On 16 May the lidar achieved maximum scatter ratios of 1.1-1.2 at 14.3, 15.6, 16.3, and 17.3 km. Thus, over Germany, the layers did not form a major perturbation to the stratosphere; these faint backscatters became prominent only because of the low aerosol background during the times of measurement.
The altitude and timing of the peak in German lidar suggested a link to the 19 April Shishaldin eruption plume. The last eruption to produce similar results at the Garmisch-Partenkirchen site was the October 1994 eruption of Kliuchevskoi (Bulletin v. 19, no. 10). That plume reached heights of 25 km.
At Hampton, Virginia, ground-based 694-nm lidar also showed high-altitude peaks (table 17). Measurements there on 11 May detected a diffuse layer (with a peak ratio of 1.17) that was narrow (~1 km thick) and located at 16.9 km altitude, well above the tropopause height. Measurements on 21 May also disclosed two narrow layers. One had a peak ratio of 1.10 at 17.5 km; the other, a peak ratio of 1.19 at 14.5 km. The presence of particles at this height are generally considered to be associated with an eruption; the timing of these observations suggested the layers were due to the 19 April Shishaldin eruption. This may imply that the erupted aerosols had reached mid-latitudes during the month following the eruption.
Table 17. Lidar data from Virginia, USA, for February-May 1999 showing altitudes of aerosol layers. Backscattering ratios are for the ruby wavelength of 0.69 µm. The integrated values show total backscatter, expressed in steradians-1, integrated over 300-m intervals from the tropopause to 30 km. Courtesy of Mary Osborne.
| DATE | LAYER ALTITUDE (km) (peak) | BACKSCATTERING RATIO | BACKSCATTERING INTEGRATED |
| Hampton, Virginia (37.1°N, 76.3°W) | |||
| 11 Feb 1999 | 11-27 (23.5) | 1.10 | 5.03 x 10⁻⁵ |
| 23 Feb 1999 | 10-27 (24.1) | 1.09 | 5.93 x 10⁻⁵ |
| 05 Mar 1999 | 09-25 (10.7) | 1.11 | 6.61 x 10⁻⁵ |
| 14 Apr 1999 | 15-27 (22.1) | 1.09 | 2.49 x 10⁻⁵ |
| 11 May 1999 | 12-26 (16.9) | 1.17 | 4.72 x 10⁻⁵ |
| 21 May 1999 | 13-27 (14.5) | 1.19 | 4.48 x 10⁻⁵ |
Commenting on research conducted on the Mediterranean island of Crete (35°30'N, 23°43'E), Christos S. Zerefos reported that the portable VELIS lidar instrument of Gian P. Gobbi also detected an aerosol layer during 10-13 May. Profiles disclosed increased aerosols at 15-16 km altitudes. Aerosols were seen again on 14 May, but they were not detected on 15 May. The optical depth at 532 nm was at most 0.02.
Conclusions. The 19 April Shishaldin eruption provided a modest injection to ~17-19 km altitude and a TOMS estimate the next day found ~20 kt of SO2 . In trajectory models, components of the plume at various altitudes moved away from the source in 3 branches; POAM III profiles on the ENE-directed path showed the plumes there decreased in altitude with time. Trajectory models have yet to confirm that several POAM III profiles came from the Shishaldin eruption and at this point their source remains ambiguous. The exact trajectories that presumably carried the Shishaldin aerosols over the German, Crete, and Virginia lidar systems have yet to be either consistently traced or modeled.
References. Hans, E., Jørgensen, H.E., Mikkelsen, T., Streicher, J., Herrmann, H., Werner, C., and Lyck, E., 1997, Lidar calibration experiments, Applied Physics B, Lasers and optics, v. 64, no. 3, Springer-Verlag, p. 355-61.
F. Congeduti, F. Marenco, E. Vincenti, P. Baldetti, and G.P. Gobbi, 1998, The new transportable lidar facilities at IFA: 9-eyes and VELIS, in Proceedings of the Workshop onSynergy of Active Instruments in the Earth Radiation Mission,M. Quante and others (eds.), http://aragorn.gkss. de/deutsch/Radar/workshop_papers.html
Naval Research Lab, 1999, Remote Sensing Division, Remote Sensing Physics Branch, Middle Atmospheric Physics Section, POAM Home page, http://wvms.nrl. navy.mil/POAM/poam.html.
Lidar Researchers Directory (including a bibliography produced by NASA) URL: http://arbs8.larc.nasa.gov/lidar/directory.html.
Sparks, R.S.J., Bursik, M.I., Carey, S.N., Gilbert, J.S., Glaze, L.S., Sigurdsson, H., and Woods, A.W., 1997, Volcanic plumes: John Wiley and Sons, Ltd., ISBN-0-471-93901-3, 574 p.
Information Contacts: Horst Jäger, Fraunhofer - Institut für Atmosphärische Umweltforshung (IFU), Kreuzeckbahnstrasse 19, D-82467 Garmisch-Partenkirchen, Germany; Mike Fromm, Computational Physics, Inc., 2750 Prosperity Avenue, Fairfax, Virginia, 22031 USA; Naval Research Laboratory, 4555 Overlook Ave. SW, Washington, DC 20375 (URL: http://www.nrl. navy.mil); Barbara Stunder, U.S. National Oceanic and Atmospheric Administration (NOAA), Air Resources Laboratory, SSMC3, Rm. 3151 (R/E/AR), 1315 East-West Highway, Silver Spring, MD 20910, USA; Mary Osborn, NASA Langley Research Center (LaRC), Hampton, VA 23681 USA; Christos S. Zerefos, Aristotle University of Thessaloniki, Physics Department, Laboratory of Atmospheric Physics, Campus Box 149, 540 06 Thessaloniki, Greece; Arlin J. Krueger and Steve Schaefer; TOMS Instrument Scientists, Code 916, Building 33, Room E413, Goddard Space Flight Center, Greenbelt, MD 20771, USA, Dave Schneider, Alaska Volcano Observatory (see Shishaldin).
Cite this Report
Volcanic aerosol optical thicknesses derived from lunar eclipse observations
The following report, discussing volcanic aerosol optical thicknesses since 1960 as derived from lunar eclipse observations, was provided by Richard Keen. About once per year, on average, the moon is eclipsed as it passes into the Earth's shadow; at these times the moon can be used as a remote sensor of the global average optical depth of stratospheric aerosols of volcanic origin. Volcanic aerosols and lunar eclipses can be linked because the moon is visible during total lunar eclipses due to sunlight refracted into the shadow (umbra) by the Earth's atmosphere (primarily by the stratosphere), stratospheric aerosols reduce the transmission of sunlight into the umbra, and the path length of sunlight through a stratospheric aerosol layer is about 40 times the vertical thickness of the layer. Therefore, the brightness of the eclipsed moon is extremely sensitive to the amount of aerosols in the stratosphere.
Methodology and data reduction. Aerosol optical thicknesses can be calculated for the date of an eclipse from the difference between the observed brightness of the eclipse and a modeled brightness computed for an aerosol-free standard atmosphere, modified by assumed distributions of ozone and cloud. Details of this technique, applied to observations during 1960 through 1982, appear in Keen (1983); updates following the eruption of Pinatubo appeared in February 1993 (Bulletin v. 18, no. 2) and November 1997 (Bulletin v. 22, no. 11). This report updates the time series through the lunar eclipse of 9 January 2001, the last total lunar eclipse until May 2003.
Figure 12 plots the global optical thicknesses derived from 38 total or near-total lunar eclipses during 1960-2001. Results from eight eclipses during 1880-1888 have been added to figure 12 to allow comparison with the effects of Krakatau in 1883. The plotted values are actual derived optical depths, modified as follows: Due to the higher concentration of aerosols from Agung and El Chichón in the Southern and Northern Hemispheres, respectively, a sampling bias due to the moon's passing though the southern or northern portion of the umbra was removed by using an empirical adjustment factor of 0.8 (thus, if the moon passed S of the Earth's shadow axis during an eclipse following an Agung eruption, the derived optical thickness was multiplied by 0.8, while the derived value was divided by 0.8 if the moon passed N of the axis). Furthermore, no lunar eclipses occurred until 18 months following the Pinatubo eruption in June 1991, while results from Agung and El Chichón indicate that peak optical depths occurred about 9 months after those eruptions. Therefore, for plotting purposes on figure 12, the time series of optical thicknesses following Pinatubo was extrapolated backwards to a date 9 months after the eruption using a composite decay curve (with a time constant of 1.92 years) derived from the Agung and El Chichón eclipse data. Finally, the global optical depths were set to zero on the dates of the eruptions of Krakatau, Agung, Fuego, and Pinatubo; observed values were near zero for eclipses close to the dates of the eruptions of Fernandina and El Chichón.
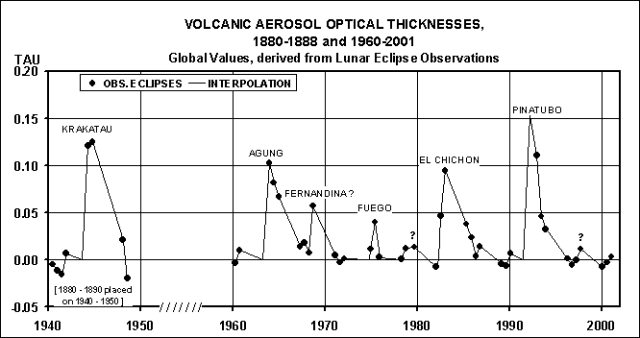 |
Figure 12. Global optical thicknesses derived from 38 total or near-total lunar eclipses during 1880-1888 and 1960-2001. Details about the methodology and data reduction used to construct this figure are in the report text. Courtesy of Richard Keen. |
The time series. The volcanic eruptions probably responsible for the major peaks in the times series are identified, although the identification of Fernandina with the 1968 peak is highly uncertain. Comparative maximum global optical thicknesses are: Pinatubo (1991), 0.15; Krakatau (1883), 0.13; Agung (1963), 0.10; El Chichón (1982), 0.09; Fernandina (1968), 0.06; Fuego (1974), 0.04.
The results indicate that the volcanic aerosol veil from Pinatubo disappeared between the eclipses of November 1993, and April 1996, with optical depth probably reaching zero sometime in 1995. Since 1995, optical depths have stayed near zero ( ± 0.01), indicating no further major injections of volcanic aerosols into the stratosphere. However, slight increases to observed values slightly above 0.01 in 1979 and in late 1997 are close to the noise level due to the uncertainty in the brightness observations; if real, they could indicate aerosols from the eruptions of Soufriere St. Vincent (1979) and Soufriere Hills on Montserrat (1997).
Acknowledgments. Thanks are due to the following observers who supplied observations of the three eclipses in the 2000-2001 series: C. Drescher, F. Farrell, M. Matiazzo, A. Pearce, and D. Seargent (Australia), W. de Souza and J. Aguiar (Brazil), J. Finn (Canada), K. Hornoch (Czech Republic), A. Shahin (Dubai, United Arab Emirates), G. Glitscher (Germany), N. Abanda, S. Abdo, W. Abu Alia, E. Al-Ashi, H. Al-Dalee', A. Al-Niamat,K. Al-Tell, and M. Odeh (Jordan), R. Bouma (Netherlands), B. Granslo and O. Skilbrei (Norway), A. Pereira and C. Vitorino (Portugal), J. Atanackov and J. Kac (Slovenia), T. Cooper (South Africa), T. Karhula and P. Schlyter (Sweden), R. Eberst and A. Pickup (UK), R. Keen, T. Mallama, and J. Marcus (USA).
References. Keen, R., 1983, Volcanic aerosols and lunar eclipses: Science, v. 222, p. 1011-1013.
Information Contacts: Richard A. Keen, Program for Atmospheric and Oceanic Sciences (PAOS) , 311 UCB, University of Colorado, Boulder, CO 80309 USA.
Cite this Report
Multi-year lidar from Hampton, VA, USA shows peaks and current low
Despite their infrequent recent reporting in the Bulletin, lidar measurements remain relevant when discussing the atmospheric impact of volcanic eruptions. As discussed below, following the large-scale atmospheric perturbation caused by Pinatubo, smaller atmospheric perturbations have been infrequent, but the eruption of Shishaldin in April 1999 produced aerosol layers that were detected in North America and Europe (Bulletin v. 24, no. 4).
Reports about atmospheric effects of volcanic activity were last provided as follows: Bulletin v. 26, no. 5, "Volcanic aerosol optical thicknesses derived from lunar eclipse observations;" Bulletin v. 24, no. 4, "Tracing recent ash by satellite-borne sensors and ground-based lidar;" Bulletin v. 23, no. 12, "Lidar data from Garmisch-Partenkirchen, Germany;" and Bulletin v. 23, no. 11, "Lidar data from Hampton, Virginia, USA."
NASA lidar measurements at Virginia, USA. Mary Osborn provided measurements from the 48-inch ground-based lidar system at NASA Langley Research Center (table 18) since May 1999. All measurements were taken at a wavelength of 694 nm. Their 48-inch lidar system was out of commission for ~8 months in late 1999 and early 2000, as they used some of its components to conduct the SAGE III Ozone Loss Validation Experiment (SOLVE). That campaign took place during November 1999-March 2000 based out of Kiruna, Sweden.
Table 18. Lidar data from Virginia, USA, for May 1999-December 2001 showing altitudes of aerosol layers. Backscattering ratios are for the ruby wavelength of 0.69 µm. The integrated values show total backscatter, expressed in steradians-1, integrated over 300-m intervals from the tropopause to 30 km. Courtesy of Mary Osborn.
| DATE | LAYER ALTITUDE (km) (peak) | BACKSCATTERING RATIO | BACKSCATTERING INTEGRATED |
| Hampton, Virginia (37.1°N, 76.3°W) | |||
| 28 May 1999 | 15-26 (11.0) | 1.14 | 5.28 x 10⁻⁵ |
| 24 Sep 1999 | 12-28 (20.3) | 1.09 | 2.93 x 10⁻⁵ |
| 09 May 2000 | 16-27 (20.5) | 1.08 | 2.65 x 10⁻⁵ |
| 08 Sep 2000 | 14-30 (20.5) | 1.08 | 2.06 x 10⁻⁵ |
| 12 Oct 2000 | 15-28 (17.5) | 1.08 | 2.72 x 10⁻⁵ |
| 20 Oct 2000 | 14-30 (17.5) | 1.12 | 5.65 x 10⁻⁵ |
| 30 Oct 2000 | 12-30 (28.6) | 1.12 | 6.31 x 10⁻⁵ |
| 27 Feb 2001 | 12-28 (22.1) | 1.12 | 4.97 x 10⁻⁵ |
| 01 May 2001 | 15-27 (19.4) | 1.09 | 2.26 x 10⁻⁵ |
| 24 May 2001 | 17-28 (21.8) | 1.09 | 3.28 x 10⁻⁵ |
| 07 Sep 2001 | 15-28 (17.0) | 1.11 | 2.88 x 10⁻⁵ |
| 04 Oct 2001 | 15-30 (16.9) | 1.08 | 2.38 x 10⁻⁵ |
| 16 Oct 2001 | 15-30 (17.5) | 1.08 | 2.36 x 10⁻⁵ |
| 07 Nov 2001 | 12-29 (18.5) | 1.08 | 3.56 x 10⁻⁵ |
| 22 Nov 2001 | 13-30 (18.8) | 1.10 | 5.01 x 10⁻⁵ |
| 04 Dec 2001 | 12-28 (24.8) | 1.12 | 4.85 x 10⁻⁵ |
Figure 13 presents an overview of stratospheric integrated aerosol backscatter since 1974. A slight increase in stratospheric integrated backscatter occurred during late 1998-99, at least partly attributed to the Shishaldin event and several smaller eruptions. After that, the stratospheric integrated backscatter returned to the "background" aerosol loading measured in 1978-1979. Although the current level of stratospheric aerosol loading remains low, another major volcanic eruption could change the situation quite suddenly.
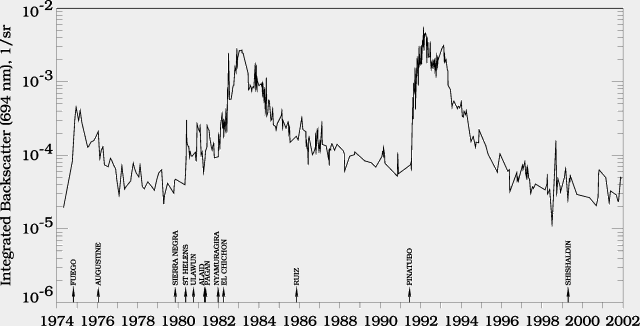 |
Figure 13. A plot of the 48-inch lidar data versus time showing the stratospheric integrated aerosol backscatter measured since 1974. Important volcanic eruptions that may have led to increased northern mid-latitude aerosol loading are noted on the time axis. Courtesy of Mary Osborn. |
Information Contacts: Mary Osborn, NASA Langley Research Center (LaRC), MS 475, Hampton, VA 23681, USA.
Cite this Report
Japan: Possible submarine eruption in March 1974
[A table of possible submarine eruptions based on aerial observations of water discoloration by the Japanese Maritime Safety Agency included an entry for 26.13°N, 144.48°E, in March 1974. There are no known Holocene volcanoes in this area.]
Information Contacts: AFP; U.S. Defense Mapping Agency.
Cite this Report
Kermadec Islands: Pumice in the Tuamoto Archipelago; source unknown
The source of the pumice remains unknown. Analysis of March and April records from the Réseau Sismique Polynésien (RSP) revealed no acoustic waves (T-phase) from eruptions other than that of Macdonald Seamount. However, the numerous small islands in the area of the Kermadecs, Tonga, Samoa, and Fiji interfere with acoustic waves, preventing effective T-phase monitoring of volcanic activity in some parts of the South Pacific. J. Talandier notes that measurements of surface currents in French Polynesia and similar latitudes suggest that pumice from Macdonald should drift eastward, away from the 6 April site.
Pumice came ashore at both the SE and NW ends of the Tuamoto Archipelago, on the Gambier Islands (23.15°S, 134.97°W) and at Rangiroa (15.00°S, 147.67°W), 4,800 km E and 3,900 km ESE of the 6 April observation. No information on the amount of pumice or the date of its arrival at these locations was available. Talandier noted that Rangiroa is very remote from known active volcanoes other than those in the Mehetia region, where eruptions occur at depths that are too great for production of pumice.
Information Contacts: J. Talandier, Lab. de Géophysique, Tahiti.
Cite this Report
United States: Possible eruption cloud in the Aleutian Islands seen on satellite imagery
Polar orbiting weather satellite imagery on 8 May at 0617 showed a distinct very bright plume along the Aleutian chain at 175-180°E. The plume appeared to be below high weather clouds (probably cirrus) and trended in a different direction, moving W to E and fanning out at its distal end. USGS personnel had received no reports of volcanic activity from airplane pilots or other observers. Several volcanoes with historical eruptions are located at the remote W end of the Aleutian Islands, but heavy weather clouds precluded a precise location for the plume's source area.
Information Contacts: W. Gould, NOAA/NESDIS; M.E. Yount, USGS Branch of Alaskan Geology, Anchorage.
Cite this Report
Fiji: Pumice near Lau Island, but no new submarine activity known
The crew of Air Pacific flight FJ 407 (Tonga to Nausori, Fiji) observed a zone of floating pumice ~1.5 km long by 3-4 m wide near 20°S, 178°W (near the S end of the Lau Group, Fiji) on 11 February at 1011. No reports of pumice from ships or island residents [are known to GVN].
Information Contacts: J. Latter, DSIR, Wellington.
Cite this Report
Azores-Gibraltar Fracture Zone: 850 events; tremor near submarine volcano
A seismic swarm began 16 October about 30 km S of Sao Miguel Island. [Several older houses were damaged in Vila Franca do Campo and Povoacao on the S coast of Sao Miguel Island. Most of the epicenters were located along a branch of the Azores-Gibraltar fracture zone. [The strongest shock recorded by the WWSSN was an mb 5.1 event at 0615 on 16 October (37.58°N, 25.37°W, 10 km depth)]. In mid-November, the swarm was ending after 850 events had been recorded by the Azores Univ seismic array.
Since early November, tremor has been registered at the Sao Miguel and Terceira Islands stations of the Univ seismic network [but see 14:3]. This tremor appeared to originate from Don Joao de Castro Bank (38.23°N, 26.63°W, 14 m depth), a shallow submarine volcano that erupted in December 1720. Several earthquakes centered near the volcano reached MM V at Terceira, 80 km away.
Information Contacts: V. Forjaz, Univ of the Azores; NEIC; Lisbon International Service.
Cite this Report
Azores-Gibraltar Fracture Zone: New swarm on another section of fracture zone
The seismic swarm along a branch of the Azores-Gibraltar Fracture Zone was ending in mid-November. No surface evidence of submarine volcanism has been reported.
On 21 November at 1556, a second swarm started with an [Ms 5.6] shock centered 25 km NW of Sao Miguel along the Sete Cidades Fault, a branch of the same fracture zone. The hypocenter was 53 km SE of Don Joao de Castro Bank [preliminary location by WWSSN at 37.97°N, 26.11°W, 10 km depth]. By the next day, the number of seismic events/hour had decreased from 24 to 4; several of the shocks were migrating along the main portion of the Sao Miguel Fault. The swarm caused 30 houses to collapse and damaged hundreds of other buildings. Modified Mercalli intensities were VII-VIII in the NW part of the island and V at the capital.
Information Contacts: V. Forjaz, Univ of the Azores; NEIC; Lisbon International Service.
Cite this Report
Azores-Gibraltar Fracture Zone: Continued earthquakes and tremor
As of 27 December, a total of 1,300 events had been registered since the activity began. Several patterns of epicentral migration had been noted along the Azores-Gibraltar Fracture Zone and the Congro regional fault. Volcanic tremor remained frequent. Fumarole temperatures were about 10°C higher than normal at Furnas Caldera on Sao Miguel Island. Its most recent eruption, in 1630, deposited tephra over most of the island and killed 191 people.
Information Contacts: V. Forjaz, Univ of the Azores; NEIC; Lisbon International Service.
Cite this Report
Azores-Gibraltar Fracture Zone: Seismicity since May 1988 summarized
The following is a summary of significant seismic activity in the E Azores (figure 1) since May 1988 [through January 1989]. "A swarm of microearthquakes, accompanied by weak harmonic tremor, occurred beneath the NE flank of Agua de Pau Volcano on Sao Miguel (epicentral zone 1 on figure 2) 23-24 May 1988. Seismometers recorded 383 earthquakes; the largest had intensities of MM IV-V in villages along the N coast. A similar but smaller swarm occurred in the same area in 1983 and was recorded by USGS seismographs. Numerous, small, normal faults (including some that show scissor-type movement) displace basaltic, tristanitic, and trachytic vent deposits and flows in this area. However, the area has had no eruptions for about 3,000 years and is the least active of the five volcanic zones on Sao Miguel that have erupted during Holocene time.
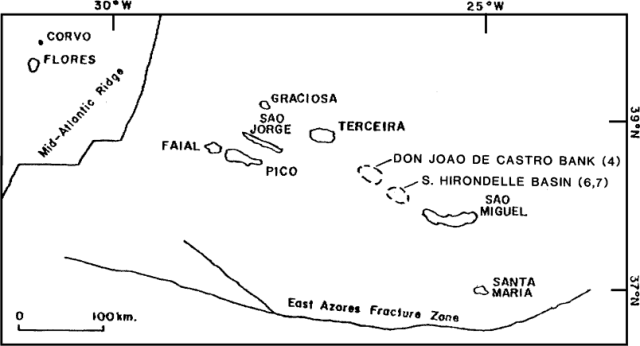 |
Figure 1. Sketch map showing islands in the eastern Azores. Approximate epicenters of the 3-5 October 1988 swarm at the submarine volcano Don Joao de Castro Bank (4) and the 21 November 1988 and 21 January 1989 earthquakes in the Hirondelle Basin (6 and 7) are shown. Courtesy of R. Moore. |
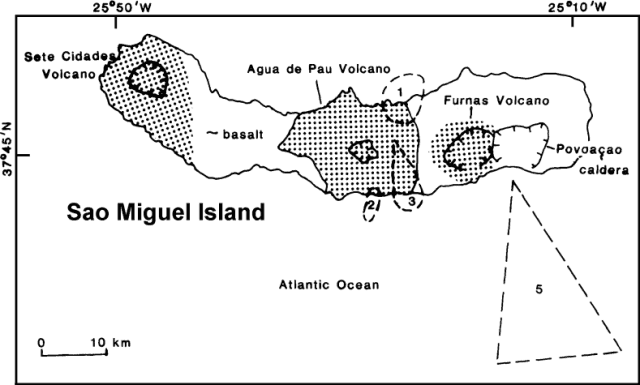 |
Figure 2. Approximate epicenters for earthquakes on and near the island of Sao Miguel, May-October, 1988. Courtesy of R. Moore. |
"A small swarm of microearthquakes occurred 24-26 June on the S flank of Agua de Pau Volcano (zone 2). Sixty-four earthquakes were recorded; the largest had intensities of MM III-IV in nearby villages. No tremor accompanied this episode.
"A small swarm of microearthquakes occurred 6 July near the S coast of Sao Miguel (zone 3). Fifty-one earthquakes were recorded; the largest was felt and had an intensity of MM III-IV. No tremor accompanied this episode.
"A small swarm of earthquakes occurred within the volcano Don Joao de Castro Bank (zone 4) 3-5 October. Sixty-two earthquakes were recorded; no harmonic tremor was detected. A felt earthquake occurred in the same area 23 October; it had intensities of MM IV-V on Terceira and MM III-IV on the N coast of Sao Miguel.
"A swarm of tectonic earthquakes, many of which were felt, occurred beneath the ocean floor about 30 km S of the extinct Povoaçao Volcano (zone 5) 16-20 October 1988. Seismometers recorded 409 earthquakes during this period; the largest had an intensity of MM VI in towns on the S coast of Sao Miguel. Felt aftershocks occurred as recently as late February 1989. No harmonic tremor accompanied this activity. Epicenters were aligned along a N-NW trend; hypocenters generally ranged from 10 km to as shallow as 400 m. Furnas Volcano, which adjoins Povoaçao on its W side and most recently erupted in A.D. 1630, has numerous boiling drowned hot springs and derivative 'fumaroles' that emit only water vapor. Temperatures of the hot springs depend on elevation and range from 98.5° to 100°C. The associated 'fumaroles' are much cooler and are subject to further cooling during periods of heavy rain.
"The largest Azores earthquake of the last year, M 5.8, occurred within the S Hirondelle Basin (zone 6), SE of Don Joao de Castro Bank, on 21 November. The earthquake was widely felt in the E Azores and caused minor damage on the W part of Sao Miguel, where intensities were MM VI-VII. The quake was apparently tectonic in origin as no harmonic tremor occurred during its normal aftershock sequence. An earthquake of MM V (measured near the NW coast of Sao Miguel) occurred 21 January 1989 within the S Hirondelle Basin. The earthquake was probably an aftershock of the 21 November event. No tremor was recorded."
Information Contacts: A. Rodrigues da Silva, Consorcio Geotermico de S. Miguel; R. Moore, USGS; National Institute of Meteorology and Geophysics, Portugal.
Cite this Report
Fiji: 30-km zone of pumice from unknown source
An "underwater explosion" and "pumice swirl" ~30 km wide were reported at 19.10°S, 175.41°E (200 km SW of Nadi, Fiji) on 16 October at 1058 from Air Pacific flight 914 (Nadi to Sydney, Australia). At 1450, the crew of a second Air Pacific flight (enroute from Auckland, New Zealand) noted pumice visible in the sea 130 km from Nadi (on the W coast of Fiji's largest island, Viti Levu) [see also 15:11-12].
Although no historical volcanism has been reported near the observation site, the area is near a spreading center described by Gill and Whelan (1989). Another possible source of the pumice is Monowai Seamount (25.92°S, 177.15°W), 1,100 km to the ESE, where submarine activity was observed from the HMNZS Tui on 13 August. On 30 May-18 June and 5-7 September, the Polynesian Seismic Net recorded T-phase activity, centered in the Monowai area, that had characteristics typical of shallow submarine eruptions.
Reference. Gill, J., and Whelan, P., 1989, Early rifting of an oceanic island arc (Fiji) Produced shoshonitic to tholeiitic basalts: JGR, v. 94, no. B4, p. 4561-4578.
Information Contacts: J. Latter, DSIR Geophysics, Wellington.
Cite this Report
Fiji: Details of aerial pumice observations; pumice washes ashore on one island
The following, from Trevor Jones and Peter Rodda, supplements preliminary reports of pumice sightings near Fiji in 15:10.
"A report of floating pumice was received from Nitin Hiralal, First Officer of Air Pacific flight FJ 914 (Nadi-Sydney) on 16 October. At 1058, he saw a 'pumice swirl' ~15-30 km across, at 19.10°S, 175.41°E, from an altitude of ~10 km. It had a regular circular shape. He saw nothing else, but presumed that there had to be some local volcanological activity because of the regular pattern. He says that it is 'reasonably common' to see streaks of pumice along wave crests on the Vanuatu and Tonga routes (from Fiji). On 17 October, while returning to Fiji, he checked and saw 'only pumice streaks' at about 1330, presumably around the same position. Pumice was also reported 150 km S of Nadi [roughly 19.1°S, 177.5°E] from an Auckland-Nadi flight on 16 October. There have been no reports from ships of pumice in the area, nor have any reports other than the above appeared in the Fiji Times.
"The relative compactness of the first presumed pumice reported suggests an origin in the area, but although submarine volcanoes exist in the vicinity, no peaks are known to rise above ~1,800 m depth in the general area, and it seems unlikely that pumice could form. The two locations from which presumed pumice was reported suggest an origin on the Tonga-Kermadec Ridge, roughly in the latitude of Fonua Fo'ou [20.3°S] or farther S; based on the drift time of Home Reef pumice in 1964, from the first report of the eruption to the first arrival in Fiji and later arrival in Suva, pumice could reach the site in the North Fiji Basin from that part of the Tonga Ridge in ~75-85 days, giving a possible eruption date in late July (or earlier if farther S - if Monowai Seamount, ~95-105 days, or early to mid-July).
"Four reply-paid telegrams sent in late October to the agents at four Postal Agencies in S Fiji brought no replies. The radio-telephone to Vunisea, Post Office for Kadavu Province [about 19°S, 178.5°E] is out of order, so no information about the arrival of pumice there can conveniently be obtained quickly. Questionnaires have been posted." By mid-November, pumice had been reported from Koro Island (about 17.3°S, 179.4°E), and questionnaires were being sent to locations throughout the Lau Group (E of Fiji's largest islands) and elsewhere.
Information Contacts: T. Jones and P. Rodda, Mineral Resources Dept, Suva, Fiji.
Cite this Report
Fiji: No clear evidence of pumice despite aerial observations
Airplane pilots observed what they believed to be floating pumice SW of Fiji 16-17 October, and pumice was initially reported to have come ashore at Koro Island in November. However, careful investigation by Fiji's Mineral Resources Department yielded no evidence of floating pumice in the region (Rodda and Jones, 1991). The "Koro Island" pumice report was in fact from Nacekoro (site of the airport at Savusavu, S-central Vanua Levu), and appears to have been an observation of older pumice, probably from the 1984 eruption of Home Reef. Mineral Resources Department personnel working in the NW (Yasawa Group) and S-central (Toyota Is) parts of Fiji in December saw no new drifting pumice, although a considerable quantity of Home Reef material remained on the backs of beaches. Telegrams requesting information about pumice, sent in late October to each of the four postal agencies in S Fiji, and 38 questionnaires sent to schools, postmasters, and shipping companies in S Fiji, yielded only a single negative response (from Oni-i-Lau, in the southern Lau Group). Responses had been received from 25% of similar inquiries after the arrival of pumice from the Home Reef eruption.
Reference. Rodda, P., and Jones, T.D., 1991, The 1990 reports of drift pumice in Fiji: Mineral Resources Department Note BP1/91, 3 p.
Information Contacts: P. Rodda, Mineral Resources Dept, Suva, Fiji.
Cite this Report
Fiji: Pumice rafts; source unknown
A Fiji Air passenger saw two narrow, elongate rafts of drifting pumice in the Kadavu passage ~30 km SE of Suva (figure 1) on 24 January. Fiji's Maritime Surveillance Centre issued a warning to mariners, published in newspapers on 27 January. Pumice was subsequently reported from ships roughly 50 km SW and 160 km NW of the initial observation.
 |
Figure 1. Map of Fiji, from Baleivanualala, 1992, showing locations of pumice rafts seen in early 1992. |
A search of the Suva Harbour area on 27 January revealed pumice floating in the Suva Passage and stranded at the high-tide line around the Suva Peninsula. The pumice was gravel-sized, with the largest fragment ~4 cm across. The samples were weathered and some included living barnacles up to 9 mm long. After the 1984 Home Reef (Tonga) eruption, barnacles 1.5 cm long were found on pumice that was at most 25 weeks old, so a provisional maximum age of 15 weeks was assigned by Baleivanualala to the barnacles found in January 1992. Given an estimated drift rate of ~12 km/day (Rodda and Jones, 1990), the pumice might have traveled 1,300 km from the eruption site. No reports of eruptions in the Tonga-Kermadec region have been received.
References. Baleivanualala, V., 1992, Drift pumice in Kadavu Passage, January 1992: Fiji Mineral Resources Department Note BP57/1, 3 pp.
Rodda, P., and Jones, T.D., 1990, The 1990 reports of drift pumice in Fiji (Corrigendum): Fiji Mineral Resources Department Note BP1/91.
Information Contacts: V. Baleivanualala and P. Rodda, Mineral Resources Dept, Suva, Fiji.
Cite this Report
Fiji: Aerial pumice sightings; source unknown
S. Chandra, Fiji Meteorological Service, noted that Air Pacific FJ440 bound for Auckland from Nadi (Viti Levu) reported sighting pumice ~220-330 km out of Nadi at about 1530 on 25 November 1992.
On 2 December 1994, Mike Green of the Fiji Meteorological Service reported that the pilot of a flight from Nadi to Melbourne saw what he believed to be pumice ~130 km SSW of Nadi on a bearing of 200°. A lesser amount of pumice was seen to the left of the flight path ~240 km from the airport. The plane had been scheduled to depart at 1145, placing these observations around noon. Reply-paid telegrams were sent on 6 December to postal agents at Ono-i-Lau (southernmost Lau Group), Qalikarua (Matuku), and Daviqele (W Kadavu), asking if any pumice had arrived within the last few weeks. No reply had been received by the Fiji Mineral Resources Dept by 9 December, so it was assumed that none was seen.
Although no historical volcanism has been reported near these observation sites, the area is close to a spreading center.
Information Contacts: P. Rodda and G. Wheller, Mineral Resources Dept, Suva, Fiji.
Cite this Report
Japan: Acoustic signals in late January; source not locatable
The JMA Ocean Bottom Seismograph off the Boso Peninsula (E of Tokyo) detected T-phase-like signals after 22 January, and clear T-phase signals on 27 January (figure 1). According to tentative analyses of arrival times at the detectors, the signals were interpreted to have propagated from the S. As of mid-February, JMA had not determined a specific source for these signals. However, discolored seawater was observed above two submarine volcanoes in the Volcano Islands during January: Minami-Hiyoshi on 12 January, and Fukutoku-okanoba on 12, 22, and 23 January.
 |
Figure 1. Example of T-phase signals (spikes) detected by the Ocean Bottom Seismograph off the Boso Peninsula, Japan, 27 January 1996. Courtesy of JMA. |
Information Contacts: Volcanological Division, Seismological and Volcanological Department, Japan Meteorological Agency (JMA), 1-3-4 Ote-machi, Chiyoda-ku, Tokyo 100 Japan.
Cite this Report
Japan: Hydro-acoustic signals of a possible eruption detected
Robert Dziak at the NOAA/Pacific Marine Environmental Laboratory in Newport, Oregon reported that the large-aperture hydrophone array deployed throughout the north Pacific Ocean basin has been detecting extremely loud, tremor-like signals since May 1998. The best preliminary estimates of the signal sources lie ~1,000 km S of Honshu Island, Japan along the Volcano Island chain (astride the Bonin trench, figure 1).
 |
Figure 1. A sketch map of part of the island of Honshu, and some of the historically active volcanoes of the Izu, Marianas, and Bonin arcs. Data from the NOAA large-aperture hydrophone array indicates a submarine volcano has been erupting in the area within the box shown. Two possible candidate sources for the eruption discussed in the text are Fukutoku-okanoba and Kita-Iwo-jima (Funka-asane). Courtesy of Robert Dziak and Yasuo Otani. |
Dziak believes these tremors to be volcanic in origin. The signals are characterized by a high amplitude fundamental around 10 Hz and the next three harmonics (20, 30, and 40 Hz). Typically signals appear as discrete packets lasting 4-5 minutes, with a brief ~30 second quiescence period, followed by the beginning of the next signal packet. For the duration of each signal packet, the spectral peaks typically increase monotonically by 5-10 Hz while maintaining their harmonic spacing. Similar distinctive characteristics have been previously identified in volcanic tremor records from both seismic and airborne acoustic measurements at Arenal Volcano in Costa Rica (Garces et al., 1998) and at Pavlof Volcano, Alaska (Garces and Hansen, 1998).
Unfortunately, the source of these signals is outside the optimum coverage area for the NOAA array, so the estimated locations are not accurate; the best preliminary estimates place the signal source in a box at 22-27°N and 138-141°E that lies W of the Bonin arc (figure 1).
The tremor has been occurring intermittently since May 1998, and was still being recorded as of late December 1999. During this period, intense tremor activity was recorded on 30 different days. The signals have for the most part been occurring continuously (with quiet times ranging from several days to several weeks) since first detected. Specific periods of peak amplitude and duration in 1998 and 1999 are presented in table 1. Signals measured on 10-12 December 1999 were the loudest yet detected.
Table 1. Dates of the strongest hydro-acoustic signals registered on the NOAA large-aperture hydrophone array compared to observation dates of discolored seawater over Fukutoku-okanoba and the Funka-asane vent of Kita-Iwo-jima. Hydro-acoustic data courtesy of R. Dziak; seawater observations courtesy of Yasuo Otani, Japan Maritime Safety Agency and Japan Meteorological Agency.
| Periods of peak tremors from hydro-acoustic data | Discolored Seawater at Fukutoku-okanoba | Discolored Seawater at Kita-Iwo-jima (Funka-asane) |
| 16-18 Aug 1998 | -- | -- |
| 31 Aug 1998 | -- | -- |
| -- | 16 Oct 1998 | -- |
| -- | 28 Oct 1998 | -- |
| -- | 14 Dec 1998 | -- |
| -- | 16 Dec 1998 | -- |
| -- | 12-13 Jan 1999 | -- |
| 22 Apr 1999 | -- | -- |
| 20-27 Aug 1999 | -- | -- |
| -- | -- | 07 Sep 1999 |
| -- | 08 Sep 1999 | -- |
| 10-11 Oct 1999 | -- | -- |
| -- | 22 Nov 1999 | -- |
| -- | 10-12 Dec 1999 | -- |
Yasuo Otani of the Hydrographic Department of Japan has provided subsequent information (courtesy of Yukio Hayakawa) regarding periods of discolored sea water seen over Fukutoku-okanoba (24.3°N, 141.5°E). The latter is a known volcanic area located S of Iwo-Jima (24.75°N, 141.33°E) on the fringes of the area delineated above by Dziak. These dates are also presented in the second column of table 1; however, there does not appear to be an obvious correlation between the two data sets. On the other hand, what is not yet known is the density of visual observations, in effect, the number of observations of these sites when surface discolorations were absent. Without such details, trying to correlate the two data sets could be biased by sampling density.
Japan Meteorological Agency reports provided one other case of sea surface discoloration, at Funka-asane, but this lone observation also failed to show any temporal correlation and has the same limitations of sampling bias mentioned above. Funka-asane, a submarine vent ~2 km NW of Kita-Iwo-jima (25.43°N, 141.23°E), is just E of the preliminary box delineated by the acoustical data.
Olivier Hyvernaud at the Geophysical Laboratory in Tahiti had found no evidence of volcanic T-waves from the region in question through the end of 1999.
The area of the preliminary box is large, and could include many other volcanic centers. Given all of the uncertainty, anyone having possibly related data or comments is urged to contact Robert Dziak or the Smithsonian's Global Volcanism Network.
References. Garces, M.A., Hagerty, M.T., Schwartz, S.Y., 1998, Magma acoustics and time-varying melt properties at Arenal Volcano, Costa Rica: Geophysical Research Letters, v. 25, no. 13, p. 2293-6.
Garces, M.A., Hansen, R.A., 1998, Wave form analysis of seismoacoustic signals radiated during the fall 1996 eruption of Pavlof volcano, Alaska: Geophysical Research Letters, v. 25, no.7, p. 1051-4.
Information Contacts: Robert P. Dziak, Oregon State University/NOAA, Hatfield Marine Science Center, 2115 SE OSU Drive, Newport, OR 97365 USA (URL: http://newport.pmel.noaa.gov/); Yasuo Otani, Coastal Surveys and Cartography Division, Hydrographic Department, Maritime Safety Agency, 3-1 Tsukiji, 5-Chome, Chuo-ku, Tokyo 104-0045, Japan; Olivier Hyvernaud, Laboratoire de Géophysique, BP 640 Pamatai, Tahiti, French Polynesia.
Cite this Report
Japan: Spectra of hydrophone-detected tremor
Robert Dziak at the NOAA/Pacific Marine Environmental Laboratory noted that loud acoustic signals continue to be detected from an unknown submarine source in or adjacent to the Volcano Islands of Japan (see sketch map in BGVN 24:11). Spectra and representative time series appear in figures 2, 3, and 4. These data were collected near the Galapagos Islands by a NOAA hydrophone (at 8°S, 95°W) roughly 14,000 km from the estimated source.
 |
Figure 2. Hydrophone record showing the acoustic signals detected from an inferred submarine eruption along the Bonin arc. At this time, the exact location of the volcano is uncertain. The diagram shows a ~ 2,500-second interval of the time-series amplitude (bottom) and corresponding frequency spectra (from consecutive 1-second data windows) received on a hydrophone at 10°S, 95°W. The tremor signals typically last 2-5 minutes; they display a 10 Hz fundamental with 20, 30, and 40 Hz overtones. The signals were recorded on 21 March 1999 (2100-22:00 GMT), after propagating across the Pacific through the oceanic-sound (SOFAR) channel. Similar signals were detected at hydrophone arrays in the E and NE Pacific and at remote hydrophones maintained by NOAA located near the Galapagos Islands. Courtesy of R. Dziak. |
 |
Figure 3. This diagram shows an enlargement of the hydrophone record at 10°S, 95°W from an inferred submarine eruption along the Bonin arc. The diagram shows a ~1,000-second interval of the time-series amplitude (bottom) and the corresponding frequency spectra (top). For this interval, only the 20- and 30-Hz overtones are readily apparent (above). The signals shown arrived at the hydrophone at 2100-2200 GMT on 21 March 1999. Courtesy of R. Dziak. |
 |
Figure 4. A spectral plot of hydrophone amplitude versus frequency from an unconfirmed submarine eruption along the Bonin arc. The spectra were produced from one of the 2-minute signal packets shown in figures 3 and 4. The plot shows a fundamental frequency centered near 10 Hz, and lower-amplitude harmonics at 20, 30, and 40 Hz. Courtesy of R. Dziak. |
The extremely high-amplitude tremor signals have been detected since May 1998, and are clearly recorded on hydrophone arrays in the N and E Pacific, and at a NOAA array in the equatorial area near the Galapagos Islands. The signals are larger, for example, than those from the 1993 submarine eruption at Soccoro Island (BGVN 18:01), and consist of a high-amplitude 10-Hz fundamental and three harmonics at 20, 30, and 40 Hz . The signals are unlikely to have come from any easily envisioned synthetic or biological sources (such as whales) because the fundamental wavelengths are substantial, seemingly too long to have been generated by these types of sources.
In general, the hydrophones are deployed within the ocean-sound (SOFAR) channel. The sound channel is a region of low acoustic velocity, and therefore acts much like a waveguide, allowing sound waves in the ocean to propagate over long distances with little loss in signal strength. However, the signal can be small or even absent at some stations due to bathymetry shadowing or other effects.
According to Olivier Hyvernaud, after careful comparison with the hydroacoustical data, the signals were recognized in seismic records at Tahiti, where the French Polynesian Network commonly records the converted seismic waves of ocean-acoustic signals that propagate past the islands. However, the signals have not been recognized on seismic instruments at Iwo Jima. Although it may seem surprising that Iwo Jima would lack a signal, Dziak notes that the difference could be explained by the physics of the situation. Acoustic waves propagating through an ocean-sound channel (2-D) would undergo little attenuation. In contrast, the seismic waves propagating through the Earth's crust (3-D) undergo much greater attenuation with distance. The Bulletin continues to present hydro-acoustical data so that others may compare them with records from local instruments.
The inferred source area of these acoustic signals (see BGVN 24:11) was derived by combining the arrival times of correlated signals throughout the Pacific basin with detailed ocean sound-speed models. Ocean sound-speed is a complex function of temperature, salinity, and pressure (depth). The models are a result of 30 years of direct sampling of these ocean parameters and account for seasonal variations. Unfortunately, the source of these signals is well to the W of the hydrophone arrays; consequently, the source location is not well-constrained. The estimated source area comprises over ~1.4 x 10⁵ km2, and the area of uncertainty (the "box" shown on the sketch map) could extend far enough east to include the known active volcanic areas such as the Bonin arc. It is hoped that as more ancillary information becomes available, it will be possible to derive a better estimate of the source location.
On the topic of volcanism along the volcanic front of the Bonin arc, Yasuo Otani of the Japanese Maritime Safety Agency noted that there are daily commercial air flights to Guam (~1,300 km S of Iwo jima).
Otani conveyed the latest observations at the two known active vents near Iwo Jima. At Fukutoku-okanoba on 25 January observers saw very small changes in water color; on 26 January they noted somewhat larger-scale changes. Around the same time, 25-26 January, Funka-asane was also the scene of discolored water.
Both Fukutoku-okanoba and Funka-asane are sufficiently shallow that the vent's flux changes can be easily seen from the surface. In fact, hydrothermal emanations and small-scale eruptions gain much attention from fishermen, who keep an eye on various local eruptive sites because they believe some eruptive phases affect fishing.
Otani expressed doubt of far-traveled geophysical signals from either of these two sources near Iwo jima. Instead, he noted, enormous acoustical noise must eminate from breakwater construction on the margin of the Bonin Islands (Ogasawara Islands), ~200 km NE of Iwo Jima, where a large-scale blasting and other heavy moving has been occurring.
Information Contacts: Robert P. Dziak, Oregon State University/NOAA, Hatfield Marine Science Center, 2115 SE OSU Drive, Newport, OR 97365 USA (URL: http://newport.pmel.noaa.gov/); Yasuo Otani, Coastal Surveys and Cartography Division, Hydrographic Department, Maritime Safety Agency, 3-1 Tsukiji, 5-Chome, Chuo-ku, Tokyo 104-0045, Japan.
Cite this Report
Japan: After 6 months of quiescence, tremor returns
Robert Dziak at the NOAA/Pacific Marine Environmental Laboratory in Newport, Oregon reported that 10 Hz band-limited tremor was detected from the Volcano Islands area after a 6 month hiatus (BGVN 24:11 and 24:12). The current episode of signals began at 0800 UTC on 13 June, but were loudest at 0100-0200 UTC on 14 June. The tremor tracks to presumed submarine volcanism at an uncertain volcano.
Information Contacts: Robert P. Dziak, Oregon State University/NOAA, Hatfield Marine Science Center, 2115 SE OSU Drive, Newport, OR 97365 USA (URL: http://newport.pmel.noaa.gov/).
Cite this Report
Japan: Hydroacoustic signals detected during 1998-2002 in the Volcano Islands
Robert Dziak and Christopher Fox at the National Oceanic and Atmospheric Administration's Pacific Marine Environmental Laboratory (NOAA PMEL), reported that a continuous series of low-frequency, long-duration signals were recorded beginning on 18 April 1998, and then during the next 3.3 years by omnidirectional hydrophones deployed throughout the Pacific basin (see BGVN 24:11, 24:12, and 25:05). These hydroacoustic signals were detected 21 different times from April 1998 through December 1999. After a 6-month hiatus, the signals were detected 26 more times from June 2000 through August 2001 (figure 5). The authors concluded that the signals came from a source in the Volcano Islands.
 |
Figure 5. Maps showing location of hydrophones and islands of the Izu-Bonin and Volcano Islands groups in the western Pacific S of Japan, and source area of hydroacoustic signals during April 1998-August 2001 from Dziak and Fox (2002). (a) Approximate locations (shaded dots) of SOSUS and NOAA eastern equatorial hydrophones arrays; shaded bar shows the location of the French Polynesian Seismic Network (RSP). (b) Location of the major volcanoes in the Izu and Volcano Islands groups. (c) Location of the tremor waveforms (crossed error bars) estimated using 16 individual hydrophone stations positioned off the W coast of the United States, Hawaii, western Aleutians, and along the East Pacific Rise near the equator. The location error bars indicate the 68% confidence interval. See Dziak and Fox (2002) for additional details. Courtesy of Robert Dziak. |
Dziak and Fox (2002) reported that "The character of the acoustic signals recorded from the Volcano Islands resembles tremor recorded during episodes of magmatic activity at subaerial volcanoes, suggesting that a significant magmatic, and potentially eruptive, process took place in the Volcano Islands between April 1998 and August 2001 and may occur again. To the authors' knowledge, the character of the Volcano Islands harmonic tremor with a 10-Hz fundamental and multiple overtones has not been previously recorded from a submarine volcano. Additionally, detection of harmonic tremor at teleseismic distances (>30°) is a rare occurrence for either a subaerial or submarine volcano."
Matt Fowler (Oregon State University) provided the following information on harmonic tremors from S of Japan from October 2000 to September 2002; all the tremor signals are from the same general area (figure 5) and have roughly the same frequency-time characteristics. Data through August 2001 were also reported by Dziak and Fox (2002). Possible tremors were detected on 18 and 28-31 October, 5, 9, 13, and 19 November 2000. Definite tremors were identified on 17, 22, and 30 December 2000, 13 January 2001, and 15-20 February 2001. During 21-23 February 2001 the tremors became well defined. Over the next few months tremors were only detected during 18-22 March, on 17, 21, and 24 April, and on 16 and 21 June. After another quiet interval, tremor signals were again recorded on 12, 14, 19, 22, and 30 July, and 8-10, 20, and 29 August 2001; tremors on 20 August were "excessively loud." No tremors were detected again until 26 February 2002, followed by a quiet interval until 16-19 and 31 March. Activity increased again during April-May 2002 with tremors recorded on 1, 2, 18, 20, 22, and 23 April, and 2-3, 13-16, and 21 May; "exceptionally loud" tremors occurred on 2-3 May. Additional tremors were detected on 9 June, 6-13 August, 15 August ("exceptionally loud"), and 19 September 2002.
Reference. Dziak, R.P., and Fox, C.G., 2002, Evidence of harmonic tremor from a submarine volcano detected across the Pacific Ocean basin: Journal of Geophysical Research, v. 107, no. B5, p. ESE 1-1 - 1-12.
Information Contacts: Robert P. Dziak and Matt Fowler, Cooperative Institute for Marine Resource Studies, Hatfield Marine Science Center, Oregon State University/NOAA, 2115 SE OSU Drive, Newport, OR 97365 USA (URL: http://www.pmel.noaa.gov/).
Cite this Report
Antarctic Continental Shelf: Newly described submarine volcano (Jun Jaegyu) near the tip of the Antarctic Peninsula
Jun Jaegyu is a young volcano near the Antarctic Peninsula visited in May 2004 by researchers from a group of United States and Canadian universities aboard the U.S. National Science Foundation research vessel Laurence M. Gould (Cruise LMG04-04). The expedition's chief scientist was Eugene Domack of Hamilton College.
Prior to this cruise, bathymetric swath maps from 2002 revealed a symmetrical volcano that had not been scoured by the advance and retreat of glaciers. The 2004 cruise dredged the volcano and found material that included fresh basalt in a flank area devoid of colonizing bottom-dwelling organisms. In contrast, observations suggested that other portions of the volcano were heavily colonized by bottom-dwelling organisms. The discovery of the volcano corroborated mariners' reports of discolored water in the area. These observations, and a thermal anomaly, were all consistent with comparatively recent volcanic activity.
The volcano is located on the Antarctic continental shelf in the southern Antarctic Sound, ~ 9 km N of the easternmost point of Andersson Island and NW of Rosamel Island (figure 1), N of the mapped boundary of Late Cenozoic volcanic rocks. Swath bathymetric mapping indicated that the volcano stands ~ 700 m above the seafloor (at a depth of ~ 1,000 m) and thus extends to within ~ 275 m of the ocean surface. The seamount has an elongate, symmetrical shape and contains ~ 1.5 km3 of volcanic rock.
 |
Figure 1. Jun Jaegyu submarine volcano (J) lies E of the extreme tip of the Antarctic Peninsula (see inset map) in the Antarctic sound, an area sheltered by several islands. Paulet Island, another volcano of probable Holocene age, lies just outside the Antarctic Sound on the SE side of Dundee Island. A better known Holocene volcano, Deception Island, lies to the NW (adjacent to the South Shetland Islands) as indicated by the arrow. Base map copied from Northern Graham Land and South Shetland Island, British Antarctic Territory Geologic Map (1:500,000) from BAS 500 G, sheet 2, edition 1, 1978. Note that map coordinates shown are in degrees and minutes (eg. 57 00', 57 degrees and 0 minutes). |
Two observed positive thermal anomalies (up to 0.052°C), recorded by temperature probes towed over the volcano from S to N, may be associated with two active volcanic centers. The more complex N temperature anomaly may also be associated with what appeared to be fresher lava flows.
The volcano lies along a NW-SE oriented fault scarp. Material dredged from the volcano have not been dated because accurately dating vesicular, partially altered, young submarine basalts is problematic at best. No gas samples were collected during this cruise.
Ashley Hatfield, a participant in the cruise and an undergraduate geology student at Hamilton College, advised by David Bailey and Eugene Domack, analyzed representative samples for whole-rock major and trace elements using XRF (X-ray fluorescence spectroscopy) and ICP-MS (inductively coupled plasma mass spectrometry). The samples are generally angular, glassy, and vesicular, having plagioclase, olivine, and clinopyroxene present as phenocryst phases, and with small rounded xenoliths being common (Hatfield and others, 2004). The samples were classified as alkali basalts and trachybasalts, and their chemical signatures were consistent with other known volcanoes throughout the northern Antarctic Peninsula.
Hatfield noted that the volcano is named in honor of Jun Jaegyu, a young Korean scientist who lost his life during the 2003 field season in the South Shetland islands. He was participating in the Korean Antarctic Program through their geophysical observatory based in the South Shetland Islands (King Sejong Station, established in 1988 on the Barton Peninsula, King George Island at 62°13.4818'S, 58°47.4744'W).
The scientific crew for this cruise included Hatfield, Bailey, and Domack, (Department of Geology, Hamilton College, Clinton, New York); Stefanie Brachfield, (Department of Earth and Environmental Sciences, Montclair State University, Upper Montclair, New Jersey); Robert Gilbert (Department of Geological Sciences, Queen's University, Kingston, Ontario); Scott Ishman (Department of Geology, Southern Illinois University, Carbondale, Illinois); Gerd Krahmann (Lamont-Doherty Earth Observatory of Columbia University, Palisades, New York); and Amy Leventer (Department of Geology, Colgate University, Hamilton, New York).
Reference. Hatfield, A., Bailey, D., Domack, E., Brachfeld, S., Gilbert, R., Ishman, S., Krahmann, G., and Leventer, A., 2004, Jun Jaegyu volcano; A recently discovered alkali basalt volcano in Antarctic Sound, Antarctica: Eos, Transactions, American Geophysical Union, 85(47), Fall Meeting Supplement, Abstract T11A-1248.
Information Contacts: David G. Bailey, Eugene Domack, and Ashley K. Hatfield, Department of Geosciences, Hamilton College, 198 College Hill Rd., Clinton, NY 13323, USA.
Cite this Report
Cayman Trough, Caribbean Sea: Expedition discovers deep undersea volcanic vents
According to a report in ScienceDaily on 12 April 2010, a scientific expedition from the United Kingdom National Oceanography Centre (NOC) discovered the world's deepest undersea volcanic vents, known as 'black smokers.' The vents, seen on 11 April, were located at a depth of 4,960 m in the Mid-Cayman Spreading Centre (MCSC), also known as the Mid-Cayman Rise Spreading Center (Thompson and others, 1980), of the Cayman Trough in the western Caribbean Sea (figure 1).
 |
Figure 1. Bathymetric map showing plate tectonic configuration and location of the Mid-Cayman Spreading Center (MCSC) within the Cayman Trough, south of Cuba in the western Caribbean Sea. Modified from the Smithsonian's "This Dynamic Planet" interactive map. |
Using remote deep-diving vehicles, the scientists found slender spires made of copper and iron ores on the seafloor, erupting water hot enough to melt lead, ~ 800 m deeper than anyone has seen before (figure 2). The deep-diving vehicles included Autosub6000, developed by engineers at the NOC for surveying; TOBI – Towed Ocean Bottom Instrument– towed behind the ship a few hundred meters above the seafloor, mapping it in detail with its sonar system and other instruments such as a magnetometer; HyBIS, developed by expedition member Bramley Murton and Berkshire-based engineering company Hydro-Lek Ltd. for filming. Instruments were remotely controlled from the Royal Research Ship (RRS) James Cook. Daily details of the expedition may be found on the RRS James Cook Voyage 44 website.
 |
Figure 2. Photograph of a 'black smoker' vent erupting hot water at a depth of ~ 5,000 m on the ocean floor in the Cayman Trough, Caribbean Sea. Courtesy of NOC. |
In addition to the scientists from NOC, the team aboard the ship included researchers from the University of Southampton's School of Ocean and Earth Science (SOES), University of Durham in the UK, the University of North Carolina Wilmington, and the University of Texas in the US, and the University of Bergen in Norway. Expedition members also worked with colleagues ashore at Woods Hole Oceanographic Institution and Duke University.
[The Cayman Trough, where the seafloor of the Caribbean is rifting apart, harbors the world's deepest chain of undersea volcanoes,. The Mid-Cayman Spreading Centre (MCSC), the geological name for the chain of volcanoes ~ 80-110 km long that runs N-S across the Cayman Trough in the W Caribbean Sea, S of Cuba and Jamaica and close to the Cayman Islands, is an ultraslow-spreading ridge with a rate of less than 20 mm per year (ultraslow-spreading ridges make up more than 20% of the world's mid-ocean ridges). The MCSC is connected to a group of faults that allow the Caribbean plate to move relative to the North American plate. It has some of the deepest seafloor in a ridge setting, up to 6,500 m below sea level in places.]
Reference. Thompson, G., Bryan, W.B., and Melson, W.G., 1980, Geological and geophysical investigation of the Mid-Cayman Rise Spreading Center: geochemical variation and petrogenesis of basalt glasses: The Journal of Geology, v. 88, no. 1, p. 41-55.
Information Contacts: ScienceDaily (URL: http://www.sciencedaily.com/); United Kingdom National Oceanography Centre (NOC), University of Southampton Waterfront Campus, European Way, Southampton SO14 3ZH, United Kingdom (URL: http://www.noc.soton.ac.uk/); RRS James Cook Voyage 44 (URL: http://www.thesearethevoyages.net/).
Cite this Report
Tonga: Photo from space on 13 April 2011 raises questions about drifting pumice rafts
This report presents a serendipitous observation near Tofua, possibly indicative of volcanism elsewhere (not on Tofua). A photo of Tofua and vicinity from space taken on 13 April 2011 displays significant material on the sea surface - the possible relict of an eruption at some unknown center.
A photo taken from space by Astronaut Paulo Nespoli (figure 1) could suggest an eruption in the Southern Pacific region at an unknown volcano. Nespoli took the photo from the International Space Station on 13 April 2011 (Nespoli, 2011). It shows occasional white clouds over the island's high points, and a thin gray-blue plume indicative of Tofua's volcanic emissions wafting to the SE.
 |
Figure 1. Photo taken 13 April 2011 from the International Space Station with hand-held camera showing Tofua and debris on the sea surface suggestive of pumice. The composition and source of the debris is unknown; however, the shape, distribution, and color of areas of debris are consistent with zones of floating pumice. Image (239B2033) courtesy of Astronaut Paolo Nespoli (European Space Agency and the International Space Station); labels and dashed lines added. |
The elongate and sinuous bands of debris seen in the photo are suggestive of floating pumice seen before in the region (eg., see Home Reef, BGVN 31:09; 31:10; 31:12; 32:04; 33:05; 33:12; Metis Shoal, BGVN 20:06). If this is pumice in elongate strands such as seen from Home Reef's 2006 eruption, it could also be derived from deposits of an older eruption. Debris floating in strands are most conspicuous at upper left of figure 1, where they form a curve cut by the photograph's left edge. Faintly linked to that area is a thinner strand of sinuous debris. Other strands of similar width appear elsewhere.
Reference. Nespoli, P., 2011, Tofua Island, Tonga: Flickr (uploaded 18 April 2011) (URL: http://www.flickr.com/photos/magisstra/5618223635/).
Cite this Report
Tonga: Material of uncertain origin seen on 13 April 2011
Based on inspection of a photo taken on 13 April 2011 from the International Space Station of Tofua volcano (Tonga), it appeared that possible pumice rafts were floating near the island (BGVN 36:09). However, the source of the material was unknown.
The source, extent, and makeup of the material remains uncertain. Inquiries sent to Mark Belvedere and others in Tonga in late 2011 failed to identify any mariners or other observers who recall seeing either an eruption or material floating on the sea surface around March to April 2011.
If the rafts drifted from the Tongan region, as they have often done in the past, they may have originated from an eruption at one of the volcanoes of the Ha'apai and Vava'u Groups. Some of those, such as Late, Home Reef, Metis Shoal, and Falcon Island, have erupted frequently, with pumice rafts and emergent ephemeral islands (figure 2).
 |
Figure 2. Map of the Tonga-Samoa area showing Tofua. Historically active volcanic centers are indicated by crosses. Stippled areas delineate water less than 1 km deep; diagonal and cross-ruled patterns indicate trench areas greater than 6 and 8 km, respectively. After Anonymous, 1979, with map credit to Tom Simkin (GVP). |
Figure 2 came from a similar report in 1979, but in that (very different) case the initial problem was four active eruptive sources, any of which might explain the streaks and rafts of floating pumice drifting NE. The resulting uncertainty then revolved around which of those sources produced the bulk of the floating pumice (SEAN 04:06; Anonymous, 1979). Discovery of a large ephemeral island at Metis Shoal pointed to that as the primary source of the pumice rafts (SEAN 04:07 and 04:12).
NASA initiative and findings. Childs and others (2011), Chojnacki and others (2011), and Honaker and Childs (2011) point out the very practical goal of a "more timely warning system to divert maritime vessels from affected areas." They discussed the spectral signature of several pumice rafts from a remote-sensing perspective. They assessed the date of eruption onset, the volcano's name, coordinates, and the favored satellites to detect and track these rafts in their different environments.
For the limited cases they tested, MODIS best detected large scale pumice rafts and monitored them over time. Landsat 5, 7 and ALI best detected small rafts, especially in closed bodies of water such as lakes. The false-color composite improved the contrast of pumice rafts for visual identification. Thermal anomalies occurred over several large pumice rafts. They found a subpixel classification extremely effective at automatically identifying small areas of pumice.
Note that, for the case at hand, the authors did not know of or analyze the material on the sea surface.
References. Anonymous, 1979, Geophysical Events: Eos, Transactions, American Geophys. Union, 21 Aug 1079, p. 625.
Childs, LM, Chojnacki, PR, Coady, C., Geddes, Q, Honaker, LB, Lyddane, W, McGilloway, J, Scott, J, 2011, Pacific Ocean Disasters - Enhanced Detection and Monitoring of Pumice Rafts Using NASA EOS; Eos, Transaction of the Am. Geophys. Union, V44C-04; (URL: http://www.agu.org/meetings/)
Chojnacki, P, Lyddane, W, McGilloway, J, Geddes, Q, Honaker, L, Coady, C, and Scott, J, 2011, Implementing NASA Remote Sensing to Protect and Monitor our Waterways, [ley DEVELOP Team 5, posted 10 August 2011 in DEVELOP Virtual Poster Session with written transcript] Earthzine (URL: http://www.earthzine.org/2011/08/10/implementing-nasa-remote-sensing-to-protect-and-monitor-our-waterways/, https://www.youtube.com/watch?feature=player_embedded&v=sdTZFq8Kpg4).
Honaker, LB, Childs, L, 2011, Remote Sensing Monitoring of Pumice Rafts in the Pacific Ocean (URL: http://www.nianet.org/NIA/media/photo-gallery/Remote-Sensing-Monitoring-of-Pumice-Rafts-in-the-Pacific-Ocean.pdf).
Information Contacts: Mark Belvedere, Treasure Island Eueiki Eco Resort, Vava'u, Tonga.
Cite this Report
South Sandwich Islands, East Scotia Ridge: Study describes submarine venting and eruption in back-arc setting
Rogers and others (2012) reported on the presence of black smokers, diffuse venting, and associated chemosynthetically-driven ecosystems along the East Scotia Ridge (ESR), a geographically isolated back-arc spreading center in the Atlantic sector of the Southern Ocean, near Antarctica (figure 1). To their best knowledge, this was the first time that these features were observed at this location. Rogers and others (2012) noted that, since the discovery of hydrothermal vents along the Galápagos Ridge in 1977 (Corliss and others, 1979), scientists have detected “numerous vent sites and faunal assemblages at many mid-ocean ridges and back-arc basins...an apparent global biogeography of vent organisms with separate provinces.”
 |
Figure 1. (Inset) Map of the Scotia Sea, showing the ESR in relation to the Scotia plate (SCO), the South Sandwich plate (SAN), the South American plate (SAM), the Antarctic plate (ANT), the Antarctic Peninsula (AP), and the South Sandwich trench (SST). Oceanographic features shown include the Polar front (PF), the Sub-Antarctic front (SAF), and the southern Antarctic Circumpolar Current front (SACCF). The vents sites E2 and E9, locations of the detailed studies discussed here, are indicated by red arrows. (Larger image) Map of the South Sandwich islands showing known active island volcanoes (red triangles) relative to the South Sandwich trench, and the East Scotia ridge (ESR) and submarine vents (E9) and fissure (E2, Dog’s Head) discussed here. Index map after Rogers and others (2012); ocean-floor base map from GEBCO, NOAA National Graphic, DeLorme, and ESRI. |
Vent sites E2 and E9. The vent site E2 lies just S of the segment axial high (called the Mermaid’s Purse), between 56°5.2’ and 56°5.4’S and between 30°19’ and 30°19.35’W at ~2,600 m depth (figures 2A and 2B). Prominent N-trending structural fabric seen on the seafloor defines a series of staircased, terraced features that are divided by W-facing scarps (figures 2B and 2C). A major steep-sided fissure runs N-S through the center of the site, between longitude 30°19.10’W and 30°19.15’W (figure 2C). The main hydrothermal vents are located at the intersection between this main fissure and a W-striking fault or scarp, consistent with the expected location of active venting on back-arc spreading ridges such as the case at hand.
 |
Figure 2. Swath maps of the location and setting of ESR vents. (A) Ship-based swath bathymetry at the location of site E2 showing the axial summit graben. The black circle indicates the sites of main venting. (B) and (C) ROV-based 3-D swath bathymetry of site E2 and high-resolution swath bathymetry of the major steep-sided fissure that runs N-S through the center of the site, between longitude 30°19.10’W and 30°19.15’W. Dog’s Head vent is indicated in panel C. White arrows indicate vents not mentioned in text. (D) Ship-based swath bathymetry at the location of site E9 showing the axial fissures and the collapsed crater called the Devil’s Punchbowl. The black spot indicates the sites of main venting. (E) ROV-based 3-D swath bathymetry of the site E9. The vents Ivory Tower, Car Wash, and Black and White are indicated. Other vents are indicated by white arrows. From Rogers and others (2012). |
Relict (extinct) and actively venting chimneys were both resolvable in the high-resolution multibeam bathymetry obtained by the ROV (remotely operated vehicle) Isis, clustered in a band running approximately NW-SE. Numerous volcanic cones and small volcanic craters are also apparent around the vent field. Chimneys of variable morphology were up to 15 m tall and venting clear fluid with a maximum measured temperature of 352.6°C. These formed focused black smokers on contact with cold seawater (figure 3A).
 |
Figure 3. Photographs of vents and associated biological communities. (A) Active black smoker chimneys at vents site E2 (2,602 m depth). Note the chimneys emitting dark-colored chemical-laden water into the seabed through vents, hitting cold seawater and causing metallic sulfides to precipitate. (B) Vent flange at E2 with trapped high-temperature reflective hydrothermal fluid (2,621 m depth). (C) Microbial mat covering rock surfaces on vent periphery at E2 (2,604 m depth). (D) Active vent chimney at vents site E9 supporting the new species of the anomuran yeti crab Kiwa (2,396 m depth). (E) Dense mass of the anomuran crab (Kiwa n. sp.) at E9 with the stalked barnacle (cf. Vulcanolepas) attached to nearby chimney (2,397 m depth). Scale bars: 10 cm for foreground. Courtesy of Rogers and others (2012). |
Some of the chimneys have expanded tops with hot (above 300°C) vent fluid emanating from the underside (figure 3B), similar to the flanges found at North East Pacific vents. Diffuse vent flow was observed at a variety of locations, with temperatures varying from 3.5 to 19.9°C, compared with a background temperature of ~0.0°C. Around the periphery of the active high-temperature vents and diffuse flow sites are microbial mats that form a halo around the venting area at E2 (figure 3C).
Site E9 is situated between 60°02.5’ and 60°03.00’S and between 29°59’ and 29°58.6’W, at ~2,400 m depth, amongst relatively flat sheet lavas to the N of a major collapse crater named the Devil’s Punchbowl (figure 2D). The ridge axis is heavily crevassed and fissured, with numerous collapse features, lava drain-back features, and broken pillow lava ridges. Major fissures run NNW-SSE through the site, breaking up an otherwise flat and unvaried terrain (figure 2E).
Topographic highs in the center of the study site lack hydrothermal activity and thus are possibly inactive magma domes. Most active venting appears to lie along one of the smaller fissures, W of a main N-trending feature. Diffuse flow and black smokers line the feature intermittently, but activity becomes reduced and dies away farther S, towards the “Punchbowl.” The chimneys were either emitting high-temperature fluids with a maximum temperature of 382.8°C (Ivory Tower; figure 3E) or had lower temperature diffuse flow, between 5 and 19.9°C (Car Wash vent; figure 3E). Low-temperature diffuse flow was associated with fissures and fine cracks in the sheet lava; the background temperature at E9 varied from -0.11 to -1.3°C.
Deep-sea hydrothermal vents. The ESR vents can be seen in the broader context of deep-sea hydrothermal vents. Hydrothermal vents are essentially hot springs on the ocean floor.
Figure 4 shows the locations of many of the Earth’s known deep-sea hydrothermal vent systems. International Cooperation in Ridge-Crest Studies (InterRidge - a non-profit international organization promoting mid-ocean ridge research) created this map for the International Seabed Authority to show locations of vents that should be protected from exploitation.
 |
Figure 4. Deep-sea hydrothermal vent systems that require protection from exploitation, according to InterRidge (Chown, 2012). Vent biogeographic provinces identified by Bachraty and others (2009) are displayed using color, and the two East Scotia Ridge vents sites described by Rogers and others (2012) are indicated with diamonds, just to the east of the Antarctic Peninsula. A full list of vent sites can be found on InterRidge’s web pages (see Information Contacts, below). The base map is the NOAA global relief model. Modified from Chown (2012); figure compiled by Aleks Terauds. |
References. Bachraty C., Legendre, P., and Desbruyères, D., 2009, Biogeographic relationships among deep-sea hydrothermal vent faunas at global scale, Deep Sea Research, Part I, v. 56, no. 8, p. 1371-1378.
Chown, S.L., 2012, Antarctic marine biodiversity and deep-sea hydrothermal vents, PLoS Biology, v. 10, no. 1, e1001232. doi:10.1371/journal.pbio.1001232 (URL: http://www.plosbiology.org/article).
Corliss, J.B.. Dymond, J., Gordon, L.I., Edmond, J.M., von Herzen, R.P., Ballard, R.D., Green, K., Williams, D., Bainbridge, A., Crane, K., and van Andel, T.H., 1979, Submarine thermal springs on the Galapagos Rift, Science, v. 203, no. 4385, p. 1073-1083. doi: 10.1126/science.203.4385.1073.
InterRidge, 2012, InterRidge Vents Database (URL: http://www.interridge.org/irvents).
Rogers, A.D., Tyler, P.A., Connelly, D.P., Copley, J.T., James, R., Larter, R.D., Linse, K., Mills, R.A., Garabato, A.N., Pancost, R.D., Pearce, D.A., Polunin, N.V.C., German, C.R., Shank, T., Boersch-Supan, P.H., Alker, B.J., Aquilina, A., Bennett, S.A., Clarke, A., Dinley, R.J.J., Graham, A.G.C., Green, D.R.H., Hawkes, J.A., Hepburn, L., Hilario, A., Huvenne, V.A.I., Marsh, L., Ramirez-Llodra, E., Reid, W.D.K., Roterman, C.N., Sweeting, C.J., Thatje, S., and Zwirglmaier, K., 2012, The discovery of new deep-sea hydrothermal vent communities in the Southern Ocean and implications for biogeography, PloS Biology, v. 10, no. 1, e1001234. doi: 10.1371/journal.pbio.1001234 (URL: http://www.plosbiology.org/article).
Information Contacts: International Cooperation in Ridge-Crest Studies (InterRidge) (URLs: http://www.interridge.org; http://www.interridge.org/irvents); VENTS Program, Pacific Marine Environmental Laboratory (PMEL), National Oceanographic and Atmospheric Administration (NOAA) (URL: http://www.pmel.noaa.gov/vents/).
Sangihe Islands: News reports of possible activity at four volcanoes
[The following reports of possible volcanic activity were received following the Northern Celebes Earthquake and resulting tsunami on 10 August 1968 that killed many people on the Northern Celebes island of Tuguan. The reports, based mostly on news organizations, are vague and were never substantiated. However, later information from the CSLP and Bulletin of Volcanic Eruptions indicated some level of activity at Banua Wuhu volcano and crater avalanches at Awu during this period that may have been the original events that caused these reports.]
Card 0018 (26 August 1968) News reports of smoking and rumbling from four volcanoes
The following was reported by Reuters News Service on 24 August 1968. "Antara reported today that four volcanoes in the Sangihe Talud island group off the northern tip of the Celebes had begun rumbling and smoking following the earthquakes."
Card 0021 (28 August 1968) News reports of ships asked to help evacuate residents
The following information was reported by the United Press International on 25 August 1968. "Ships in the Celebes Sea have been asked to help evacuate residents from the volcano-threatened Talaud and Sangi island groups. The Antara News Agency reported increased activity by four volcanoes on the area about 100 miles south of the tip of the Philippine island of Mindanao. About 200,000 people live in the island groups."
Information Contacts:
Card 0018 (26 August 1968) Reuters; Antara News Agency, Indonesia.
Card 0021 (28 August 1968) UPI; Antara News Agency, Indonesia.
Sangihe Islands: Scientist who visited the area unable to confirm activity
Card 0037 (06 September 1968) Scientific team sent to confirm volcanic activity
"Sujatno of Institute of Marine Research reports that scientific team, including Soetadi of Geophysics Section, Office of Meteorology and Geophysics, Djakarta, travelled to Celebes to investigate reported subsidence Taguan Island and volcanic activity Sangihe and Talaud islands. Confirmation of island subsidence and volcanic activity must await return of investigating team."
Card 0040 (09 September 1968) Minor seismicity continues three weeks after main shock
"...Volcanoes in the Sangihe-Talaud Island Group off the northern tip of the Celebes Islands had begun rumbling and smoking following the earthquakes. Minor earthquake activity is still being recorded in the area three weeks later, and activity of the volcanoes in the Talaud and Sangihe Island Groups are threatening the 200,000 people who live in the islands. Authorities have asked ships in the area to assist in the evacuation of residents."
Card 0043 (10 September 1968) Scientist who visited area uncertain about activity reports
"Uncertain about volcanic activity Sangihe and Talaud islands. Gunung Awu (Mount Awu) on Sangi Island was active and erupted in 1966. Will attempt obtain further information."
Information Contacts:
Card 0037 (06 September 1968) American Embassy, Djakarta, Indonesia.
Card 0040 (09 September 1968) International Tsunami Information Center, Honolulu, Hawaii, USA.
Card 0043 (10 September 1968) Soetadi, Office of Meteorology and Geophysics, Djakarta, Indonesia.
Cite this Report
Colombia: Evacuation due to possible unconfirmed eruption
A possible volcanic eruption began during the afternoon of 21 October 1976. Forty families were evacuated. No human casualties were reported, but 100 head of cattle have been killed and another 100 trapped by the activity. A lava flow was reported, but it should be noted that La Lorenza is on the Caribbean coast, in an area where mud volcanoes are common.
Information Contacts: AFP.
Cite this Report
Colombia: Previously reported activity confirmed to be a mud volcano
The possible eruption reported from La Lorenza was mud volcano activity, as suspected. At 0800 on 21 October, ambient-temperature gray mud was ejected. At 0900, the petroleum gases (largely methane) emitted by the mud volcano ignited, producing a flame several hundred meters high, which lasted for several days. Contrary to press reports, no lava was emitted. People and cattle fled the area, but there were no deaths. Some livestock were injured.
Information Contacts: E. Ramirez, Univ. Javeriana, Bogotá, Colombia.
Cite this Report
Papua New Guinea: Earthquake swarm; sounds and glow
"An unnamed seamount, 30 km NNE of Cape Gloucester, western New Britain, may have been the site of a short-lived eruption on 15-16 June. A subcontinuous swarm of long-period earthquakes was registered by several seismic stations in Papua New Guinea at 1913-2001 on 15 June and 0427-0450 on 16 June. The swarm was recognized when the records were analyzed at RVO in early July. Preliminary determinations indicated shallow origins over a broad area at the W extremity of New Britain.
"Inquiries with the local people resulted in accounts of sounds like a jet plane coming from the sea, and glow in the sea a long distance from the coast. Northeastward migration of the incandescence was also reported, possibly suggesting a fissure eruption. Airborne observations on 28 July failed to find water discolouration or any other evidence of the 6-week-old event.
"Until further information is obtained, the most likely source for these phenomena is a large seamount mapped in the general area of earthquake locations and visible reports."
Information Contacts: P. de Saint Ours and C. McKee, RVO.
Cite this Report
Kermadec Islands: Violent underwater explosion reported
On 11 November at 0710, the yacht Nutra, traveling from Rarotonga to Auckland, was shaken violently in what was described as an underwater explosion [but see BGVN 11:11]. Disturbed sea conditions preceded the main explosion.
The reported location is ~100 km E of the trend of the Tonga-Kermadec chain, over the W edge of the Tonga Trench at its S end; 570 km NNE of Raoul Island and 380 km S of Tongatapu. We are not aware of previous reports of activity in this area. The Worldwide Standardized Seismic Network recorded no nearby earthquakes at the time, although aftershocks of the M 8.2 Kermadec Islands event of 20 October continued 400 km to the S.
Information Contacts: J. Latter, DSIR Geophysics, Wellington; NEIC.
Cite this Report
Kermadec Islands: Probably an earthquake in the Tonga Trench
The 11 November submarine explosion is now believed to have been an earthquake. To persons on board the yacht Nutra, the event sounded like a dynamite blast followed by a pair of echoes with a total duration of 1 second. Intensities of the blast and echoes were estimated by crewmen at 100, 90, and 80 decibels. No pumice, ash, or water discoloration were observed.
P and S waves, apparently from this event, were recorded at Rarotonga, Cook Islands, and Mangahao, New Zealand; local magnitude was about 4.5-5. The yacht's position at the time of the event, over the W side of the Tonga Trench, was determined by satellite navigation, accurate to within ~1.5 km.
Information Contacts: J. Latter, DSIR Geophysics Division, Wellington; P. Black, Univ of Auckland, Auckland.
Cite this Report
Chile: Press reports of boiling water were apparently fabricated
The press reported that a submarine volcano was suspected to be the cause of an area of boiling water, roughly 500 m in radius, reported by a fishing boat 70 km W of Papudo (60 km NNW of Valparaíso, 32.3°S, 72.30°W). Upon investigation, it was determined that the initial report had never been verified and was apparently a fabricated message. Scientists onboard the Chilean naval vessal Carlos Arevalo found no evidence of a volcano in the area, a seismically active zone on the continental slope far from any known volcanism.
Information Contacts: M. Gardeweg, SERNAGEOMIN, Santiago, Chile.
Cite this Report
Mexico: Rumors of new volcano prove false; methane combustion implicated
Although mid-May speculations suggested that a new volcano might be developing in the SE part of the State of Zacatecas, the incident has been attributed to methane combustion unrelated to volcanism. The event took place near the town of Jerez, ~50 km SW of Zacatecas city. Hugo Delgado received a video made by local residents, asked officials about the event, and provided the following report.
"The place where this phenomena is happening is a flat area (a square area [~20 m on each side]) where the ground is smoking (combustion-like blue smoke). There are several cracks on the ground and inside the cracks the earth looks reddish and hot. The people who sent me the video show how a piece of wood burns [when] they put it inside the crack. The area was isolated from the curious people (crowds of families who want to see what is happening visit the place) [by] digging a furrow around the hot site and posting policemen in order to [prevent] children [from falling] into the hot cracks.
"People from the University of Zacatecas and from the SEMARNAP (Ministry of the Environment, Natural Resources, and Fisheries) have visited the area and concluded that microbial activity on concentrated organic material in the area has produced methane and this started to burn since the beginning of May. Burning of methane has [caused] the ground to glow. According to their report, no deformation of the ground has been detected, nor [were] ashes or sulfuric odors detected during their visit. Samples taken from the ground were chemically analyzed [revealing] mainly organic material in them. This kind of [incident] has occurred before in other [parts] of Zacatecas, according to SEMARNAP.
"[It] seems that somebody (unidentified, but according to the local people, it was a retired scientist [transporting] equipment) came to the region to see the phenomena, and commented that it was the birth of a volcano. Thus, the inhabitants became alarmed. Local newspapers have also published that methane is burning there according to the researchers of the University of Zacatecas.
"Officials from the National Center for Disaster Prevention (CENAPRED) knew about this event, and have received the reports from SEMARNAP and the University of Zacatecas. This has been treated not as a volcanic problem but [an] environmental [one].
"A year ago, there was a similar event in the region. Carlos Gutierrez from CENAPRED visited the zone in order to deploy seismic equipment to observe this event. It was determined that organic material (sedimentary carbon[aceous] deposit[s] in a lacustrine environment during the Pleistocene) was burning underground after the local people incinerated dry grass (a common practice in Mexico to fertilize the land before the rainy season)."
Luca Ferrari provided geological insight into the area. It is on the E flank of the Sierra Madre Occidental, a huge mid-Tertiary volcanic pile related to subduction of the Farallon Plate. Volcanic rocks in the area include extensive silicic ashflow tuffs of late Oligocene to early Miocene age; these are sometimes capped by small volumes of andesitic and basaltic lavas ~20 Ma old. The incident took place more than 200 km N of the active volcanic arc (the Mexican Volcanic Belt, related to the ongoing subduction of the Rivera and Cocos plates). Quaternary intra-plate basalts are absent within a 200 km radius of the site of the incident. From a tectonic point of view, the village of Jerez lies at the N end of the Tlaltenango graben, which formed during Basin and Range extension in the early Miocene. Tectonic activity appears to have slowed since then and no Quaternary faulting is reported in the region.
Information Contacts: Hugo Delgado, Instituto de Geofisica, U.N.A.M.Circuito Cientifico, C.U. 04510, Mexico D.F., Mexico; Luca Ferrari, Instituto de Geologia, UNAM, Apdo. Postal 376, 36000 Guanajuato, Gto., Mexico.
Cite this Report
Philippines: False report of volcanism intended to exclude would-be gold miners
In discussing the week ending on 12 September, "Earthweek" (Newman, 1997) incorrectly claimed that a volcano named "Mount Pinukis" had erupted. Widely read in the US, the dramatic Earthweek report described terrified farmers and a black mushroom cloud that resembled a nuclear explosion. The mountain's location was given as "200 km E of Zamboanga City," a spot well into the sea. The purported eruption had received mention in a Manila Bulletin newspaper report nine days earlier, on 4 September. Their comparatively understated report said that a local police director had disclosed that residents had seen a dormant volcano showing signs of activity.
In response to these news reports Emmanuel Ramos of the Philippine Institute of Volcanology and Seismology (PHIVOLCS) sent a reply on 17 September. PHIVOLCS staff had initially heard that there were some 12 alleged families who fled the mountain and sought shelter in the lowlands. A PHIVOLCS investigation team later found that the reported "families" were actually individuals seeking respite from some politically motivated harassment. The story seems to have stemmed from a local gold rush and an influential politician who wanted to use volcanism as a ploy to exclude residents. PHIVOLCS concluded that no volcanic activity had occurred. They also added that this finding disappointed local politicians but was much welcomed by the residents.
PHIVOLCS spelled the mountain's name as "Pinokis" and from their report it seems that it might be an inactive volcano. There is no known Holocene volcano with a similar name (Simkin and Siebert, 1994). No similar names (Pinokis, Pinukis, Pinakis, etc.) were found listed in the National Imagery and Mapping Agency GEOnet Names Server (http://geonames.nga.mil/gns/html/index.html), a searchable database of 3.3 million non-US geographic-feature names.
The Manila Bulletin report suggested that Pinokis resides on the Zamboanga Peninsula. The Peninsula lies on Mindanao Island's extreme W side where it bounds the Moro Gulf, an arm of the Celebes Sea. The mountainous Peninsula trends NNE-SSW and contains peaks with summit elevations near 1,300 m. Zamboanga City sits at the extreme end of the Peninsula and operates both a major seaport and an international airport.
[Later investigation found that Mt. Pinokis is located in the Lison Valley on the Zamboanga Peninsula, about 170 km NE of Zamboanga City and 30 km NW of Pagadian City. It is adjacent to the two peaks of the Susong Dalaga (Maiden's Breast) and near Mt. Sugarloaf. 7.975°N, 123.23°E; summit elev. 1510 m]
References. Newman, S., 1997, Earthweek, a diary of the planet (week ending 12 September): syndicated newspaper column (URL: http://www.earthweek.com/).
Manila Bulletin, 4 Sept. 1997, Dante's Peak (URL: http://www.mb.com.ph/).
Simkin, T., and Siebert, L., 1994, Volcanoes of the world, 2nd edition: Geoscience Press in association with the Smithsonian Institution Global Volcanism Program, Tucson AZ, 368 p.
Information Contacts: Emmanuel G. Ramos, Deputy Director, Philippine Institute of Volcanology and Seismology, Department of Science and Technology, PHIVOLCS Building, C. P. Garcia Ave., University of the Philippines, Diliman campus, Quezon City, Philippines.
Cite this Report
Vietnam: News report of alleged volcanic subsidence near "Ham Rong"
A 21 February Reuters news report described land subsidence near Ham Rong (Dragon's Mouth) in Gia Lai province in the central highlands of Vietnam. The report stated that several thousand square meters of cropland had subsided up to 3 m beginning between September and November 1996. The ground around the sunken patches, some of which were kilometers apart, was covered with small cracks. The news report stated that movement of underground gases was being investigated as a possible cause of the ground subsidence and that the spot lies near a volcano that has reportedly been extinct for about 1,000 years.
Attempts to corroborate this story with Vietnamese authorities having failed, we tried to ascertain the location of Ham Rong. To do this, we queried the National Imagery and Mapping Agency GEOnet Names Server, a searchable database of 3.3 million non-US geographic-feature names. No feature by the name "Ham Rong" was listed in the Gia Lai province. However, there is a mountain feature by the name "H?drông" near Pleiku-Bantour, a catalogued volcanic area at 14°N, 108°E. Pleiku-Bantour is an area of extensive basaltic lava containing five calderas and two basaltic lava cones (Whitford-Stark, 1987). A second possibility for the location of the volcanic activity is Toroeng Prong, a basaltic volcano at 14.9°N, 108°E (Whitford-Stark, 1987).
Reference. Whitford-Stark, J.L., 1987, A survey of Cenozoic volcanism in mainland Asia: Geological Society of America Special Paper 213, p. 16-19.
Information Contacts: Reuters News Service; National Imagery and Mapping Agency (NIMA), General Help Desk (L-52), 3200 South Second St., St. Louis, MO 63118-3399 USA.
Cite this Report
Somalia: Press reports of Somalia's first historical eruption were likely in error
Xinhua News Agency filed a news report on 27 February under the headline "Volcano erupts in Somalia" but the veracity of the story now appears doubtful. The report disclosed the volcano's location as on the W side of the Gedo region [3.25°N, 41.667°E; summit elev. 500 m], an area along the Ethiopian border just NE of Kenya. The report had relied on the commissioner of the town of Bohol Garas (a settlement described as 40 km NE of the main Al-Itihad headquarters of Luq town) and some or all of the information was relayed by journalists through VHF radio. The report claimed the disaster "wounded six herdsmen" and "claimed the lives of 290 goats grazing near the mountain when the incident took place." Further descriptions included such statements as "the volcano which erupted two days ago [25 February] has melted down the rocks and sand and spread...."
Giday WoldeGabriel returned from three weeks of geological fieldwork in SW Ethiopia, near the Kenyan border, on 25 August. During his time there he inquired of many people, including geologists, if they had heard of a Somalian eruption in the Gedo area; no one had heard of the event. WoldeGabriel stated that he felt the news report could have described an old mine or bomb exploding. Heavy fighting took place in the Gedo region during the Ethio-Somalian war of 1977. Somalia lacks an embassy in Washington DC; when asked during late August, Ayalaw Yiman, an Ethiopian embassy staff member in Washington DC also lacked any knowledge of a Somalian eruption.
A Somalian eruption would be significant since the closest known Holocene volcanoes occur in the central Ethiopian segment of the East African rift system S of Addis Ababa, ~500 km NW of the Gedo area. These Ethiopian rift volcanoes include volcanic fields, shield volcanoes, cinder cones, and stratovolcanoes.
Information Contacts: Xinhua News Agency, 5 Sharp Street West, Wanchai, Hong Kong; Giday WoldeGabriel, EES-1/MS D462, Geology-Geochemistry Group, Los Alamos National Laboratory, Los Alamos, NM 87545, USA; Ayalaw Yiman, Ethiopian Embassy, 2134 Kalorama Rd. NW, Washington DC 20008, USA.
Cite this Report
Turkey: UFO adherent claims new volcano in Sea of Marmara
Following the Ms 7.8 earthquake in Turkey on 17 August (BGVN 24:08) an Email message originating in Turkey was circulated, claiming that volcanic activity was observed coincident with the earthquake and suggesting a new (magmatic) volcano in the Sea of Marmara [40.683°N, 29.1°E]. For reasons outlined below, and in the absence of further evidence, editors of the Bulletin consider this a false report.
The report stated that fishermen near the village of Cinarcik, at the E end of the Sea of Marmara "saw the sea turned red with fireballs" shortly after the onset of the earthquake. They later found dead fish that appeared "fried." Their nets were "burned" while under water and contained samples of rocks alleged to look "magmatic."
No samples of the fish were preserved. A tectonic scientist in Istanbul speculated that hot water released by the earthquake from the many hot springs along the coast in that area may have killed some fish (although they would be boiled rather than fried).
The phenomenon called earthquake lights could explain the "fireballs" reportedly seen by the fishermen. Such effects have been reasonably established associated with large earthquakes, although their origin remains poorly understood. In addition to deformation-triggered piezoelectric effects, earthquake lights have sometimes been explained as due to the release of methane gas in areas of mass wasting (even under water). Omlin and others (1999), for example, found gas hydrate and methane releases associated with mud volcanoes in coastal submarine environments.
The astronomer and author Thomas Gold (Gold, 1998) has a website (Gold, 2000) where he presents a series of alleged quotes from witnesses of earthquakes. We include three such quotes here (along with Gold's dates, attributions, and other comments):
(A) Lima, 30 March 1828. "Water in the bay 'hissed as if hot iron was immersed in it,' bubbles and dead fish rose to the surface, and the anchor chain of HMS Volage was partially fused while lying in the mud on the bottom." (Attributed to Bagnold, 1829; the anchor chain is reported to be on display in the London Navy Museum.)
(B) Romania, 10 November 1940. ". . . a thick layer like a translucid gas above the surface of the soil . . . irregular gas fires . . . flames in rhythm with the movements of the soil . . . flashes like lightning from the floor to the summit of Mt Tampa . . . flames issuing from rocks, which crumbled, with flashes also issuing from non-wooded mountainsides." (Phrases used in eyewitness accounts collected by Demetrescu and Petrescu, 1941).
(C) Sungpan-Pingwu (China), 16, 22, and 23 August 1976. "From March of 1976, various large anomalies were observed over a broad region. . . . At the Wanchia commune of Chungching County, outbursts of natural gas from rock fissures ignited and were difficult to extinguish even by dumping dirt over the fissures. . . . Chu Chieh Cho, of the Provincial Seismological Bureau, related personally seeing a fireball 75 km from the epicenter on the night of 21 July while in the company of three professional seismologists."
Yalciner and others (1999) made a study of coastal areas along the Sea of Marmara after the Izmet earthquake. They found evidence for one or more tsunamis with maximum runups of 2.0-2.5 m. Preliminary modeling of the earthquake's response failed to reproduce the observed runups; the areas of maximum runup instead appeared to correspond most closely with several local mass-failure events. This observation together with the magnitude of the earthquake, and bottom soundings from marine geophysical teams, suggested mass wasting may have been fairly common on the floor of the Sea of Marmara.
Despite a wide range of poorly understood, dramatic processes associated with earthquakes (Izmet 1999 apparently included), there remains little evidence for volcanism around the time of the earthquake. The nearest Holocene volcano lies ~200 km SW of the report location. Neither Turkish geologists nor scientists from other countries in Turkey to study the 17 August earthquake reported any volcanism. The report said the fisherman found "magmatic" rocks; it is unlikely they would be familiar with this term.
The motivation and credibility of the report's originator, Erol Erkmen, are unknown. Certainly, the difficulty in translating from Turkish to English may have caused some problems in understanding. Erkmen is associated with a website devoted to reporting UFO activity in Turkey. Photographs of a "magmatic rock" sample were sent to the Bulletin, but they only showed dark rocks photographed devoid of a scale on a featureless background. The rocks shown did not appear to be vesicular or glassy. What was most significant to Bulletin editors was the report author's progressive reluctance to provide samples or encourage follow-up investigation with local scientists. Without the collaboration of trained scientists on the scene this report cannot be validated.
References. Omlin, A, Damm, E., Mienert, J., and Lukas, D., 1999, In-situ detection of methane releases adjacent to gas hydrate fields on the Norwegian margin: (Abstract) Fall AGU meeting 1999, Eos, American Geophysical Union.
Yalciner, A.C., Borrero, J., Kukano, U., Watts, P., Synolakis, C. E., and Imamura, F., 1999, Field survey of 1999 Izmit tsunami and modeling effort of new tsunami generation mechanism: (Abstract) Fall AGU meeting 1999, Eos, American Geophysical Union.
Gold, T., 1998, The deep hot biosphere: Springer Verlag, 256 p., ISBN: 0387985468.
Gold, T., 2000, Eye-witness accounts of several major earthquakes (URL: http://www.people.cornell.edu/ pages/tg21/eyewit.html).
Information Contacts: Erol Erkmen, Tuvpo Project Alp.
Cite this Report
Mongolia: Fumaroles and minor seismicity since October 2002
In December 2002 information appeared in Mongolian and Russian newspapers and on national TV that a volcano in Central Mongolia, the Har-Togoo volcano, was producing white vapors and constant acoustic noise. Because of the potential hazard posed to two nearby settlements, mainly with regard to potential blocking of rivers, the Director of the Research Center of Astronomy and Geophysics of the Mongolian Academy of Sciences, Dr. Bekhtur, organized a scientific expedition to the volcano on 19-20 March 2003. The scientific team also included M. Ulziibat, seismologist from the same Research Center, M. Ganzorig, the Director of the Institute of Informatics, and A. Ivanov from the Institute of the Earth's Crust, Siberian Branch of the Russian Academy of Sciences.
Geological setting. The Miocene Har-Togoo shield volcano is situated on top of a vast volcanic plateau (figure 1). The 5,000-year-old Khorog (Horog) cone in the Taryatu-Chulutu volcanic field is located 135 km SW and the Quaternary Urun-Dush cone in the Khanuy Gol (Hanuy Gol) volcanic field is 95 km ENE. Pliocene and Quaternary volcanic rocks are also abundant in the vicinity of the Holocene volcanoes (Devyatkin and Smelov, 1979; Logatchev and others, 1982). Analysis of seismic activity recorded by a network of seismic stations across Mongolia shows that earthquakes of magnitude 2-3.5 are scattered around the Har-Togoo volcano at a distance of 10-15 km.
 |
Figure 1. Photograph of the Har-Togoo volcano viewed from west, March 2003. Courtesy of Alexei Ivanov. |
Observations during March 2003. The name of the volcano in the Mongolian language means "black-pot" and through questioning of the local inhabitants, it was learned that there is a local myth that a dragon lived in the volcano. The local inhabitants also mentioned that marmots, previously abundant in the area, began to migrate westwards five years ago; they are now practically absent from the area.
Acoustic noise and venting of colorless warm gas from a small hole near the summit were noticed in October 2002 by local residents. In December 2002, while snow lay on the ground, the hole was clearly visible to local visitors, and a second hole could be seen a few meters away; it is unclear whether or not white vapors were noticed on this occasion. During the inspection in March 2003 a third hole was seen. The second hole is located within a 3 x 3 m outcrop of cinder and pumice (figure 2) whereas the first and the third holes are located within massive basalts. When close to the holes, constant noise resembled a rapid river heard from afar. The second hole was covered with plastic sheeting fixed at the margins, but the plastic was blown off within 2-3 seconds. Gas from the second hole was sampled in a mechanically pumped glass sampler. Analysis by gas chromatography, performed a week later at the Institute of the Earth's Crust, showed that nitrogen and atmospheric air were the major constituents.
 |
Figure 2. Photograph of the second hole sampled at Har-Togoo, with hammer for scale, March 2003. Courtesy of Alexei Ivanov. |
The temperature of the gas at the first, second, and third holes was +1.1, +1.4, and +2.7°C, respectively, while air temperature was -4.6 to -4.7°C (measured on 19 March 2003). Repeated measurements of the temperatures on the next day gave values of +1.1, +0.8, and -6.0°C at the first, second, and third holes, respectively. Air temperature was -9.4°C. To avoid bias due to direct heating from sunlight the measurements were performed under shadow. All measurements were done with Chechtemp2 digital thermometer with precision of ± 0.1°C and accuracy ± 0.3°C.
Inside the mouth of the first hole was 4-10-cm-thick ice with suspended gas bubbles (figure 5). The ice and snow were sampled in plastic bottles, melted, and tested for pH and Eh with digital meters. The pH-meter was calibrated by Horiba Ltd (Kyoto, Japan) standard solutions 4 and 7. Water from melted ice appeared to be slightly acidic (pH 6.52) in comparison to water of melted snow (pH 7.04). Both pH values were within neutral solution values. No prominent difference in Eh (108 and 117 for ice and snow, respectively) was revealed.
Two digital short-period three-component stations were installed on top of Har-Togoo, one 50 m from the degassing holes and one in a remote area on basement rocks, for monitoring during 19-20 March 2003. Every hour 1-3 microseismic events with magnitude
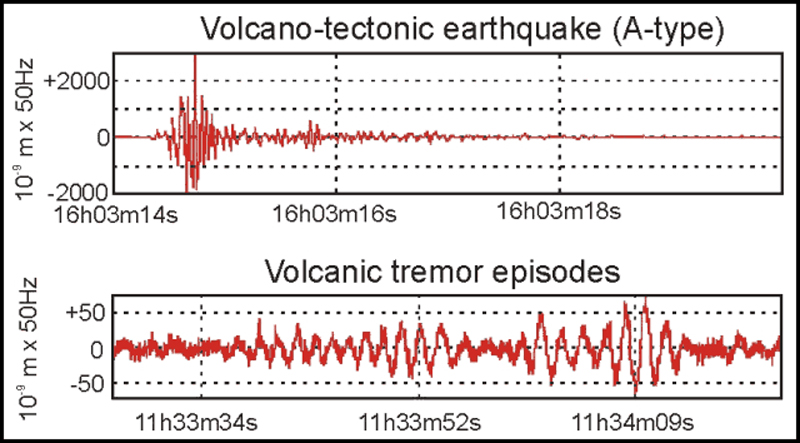 |
Figure 3. Examples of an A-type volcano-tectonic earthquake and volcanic tremor episodes recorded at the Har-Togoo station on 19 March 2003. Courtesy of Alexei Ivanov. |
Conclusions. The abnormal thermal and seismic activities could be the result of either hydrothermal or volcanic processes. This activity could have started in the fall of 2002 when they were directly observed for the first time, or possibly up to five years earlier when marmots started migrating from the area. Further studies are planned to investigate the cause of the fumarolic and seismic activities.
At the end of a second visit in early July, gas venting had stopped, but seismicity was continuing. In August there will be a workshop on Russian-Mongolian cooperation between Institutions of the Russian and Mongolian Academies of Sciences (held in Ulan-Bator, Mongolia), where the work being done on this volcano will be presented.
References. Devyatkin, E.V. and Smelov, S.B., 1979, Position of basalts in sequence of Cenozoic sediments of Mongolia: Izvestiya USSR Academy of Sciences, geological series, no. 1, p. 16-29. (In Russian).
Logatchev, N.A., Devyatkin, E.V., Malaeva, E.M., and others, 1982, Cenozoic deposits of Taryat basin and Chulutu river valley (Central Hangai): Izvestiya USSR Academy of Sciences, geological series, no. 8, p. 76-86. (In Russian).
Information Contacts: Alexei V. Ivanov, Institute of the Earth Crust SB, Russian Academy of Sciences, Irkutsk, Russia; Bekhtur andM. Ulziibat, Research Center of Astronomy and Geophysics, Mongolian Academy of Sciences, Ulan-Bator, Mongolia; M. Ganzorig, Institute of Informatics MAS, Ulan-Bator, Mongolia.
Cite this Report
Andaman Islands: False reports of eruptions and confusion following the M 9 earthquake
False reports of volcanism surfaced describing eruptions at Barren Island and Narcondum volcanoes (figure 1) following the 26 December 2004, M 9 earthquake off the W coast of northern Sumatra. Clarification was provided by Dornadula Chandrasekharam of the Indian Institute of Technology. He reported an absence of volcanic activity at these volcanoes, and at Sumatran volcanoes, as recently as 4 January 2005.
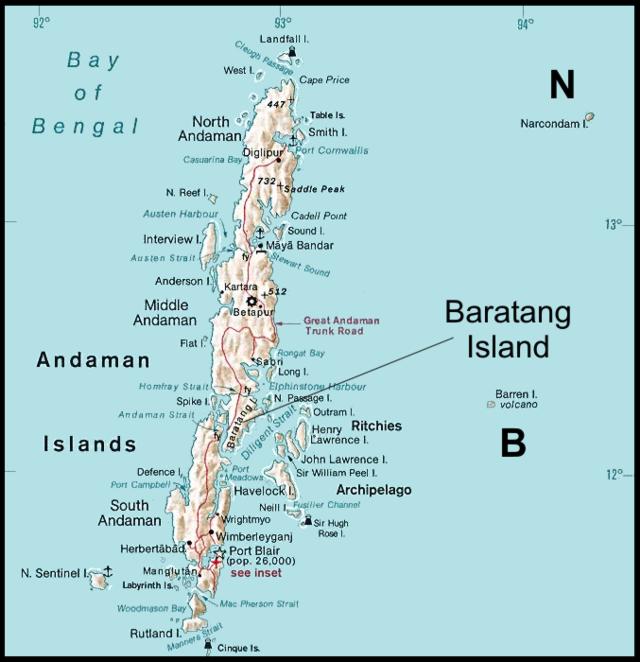 |
Figure 1. A map of the Andaman Islands showing the only volcanoes known to have erupted during the Holocene period (past 10,000 years), Narcondum and Barren Island (N and B, respectively). Note that narrow straits break Andaman island into multiple smaller islands (eg., Middle Andaman and Baratang islands). Baratang Island contains an established, studied, active mud volcano that reactivated after the M 9 earthquake. |
The erroneous accounts were discovered by Chandrasekharam while watching television news. He immediately contacted people in the Andaman region. Upon learning that these reports were incorrect, he contacted media sources and the Global Volcanism Network. Many Indian news sources that proclaimed eruptions at Barren Island later withdrew their reports. The erroneous information prevailed for a day to perhaps a week, although non-Indian news agencies were slower to recognize and acknowledge the error.
Regional tectonic setting. Figure 2 illustrates the rudiments of the regional tectonic setting, including the primary M 9 earthquake and aftershocks for the next 10 days. The tectonic reconstructions are far more complex than shown here, and the details are variously interpreted.
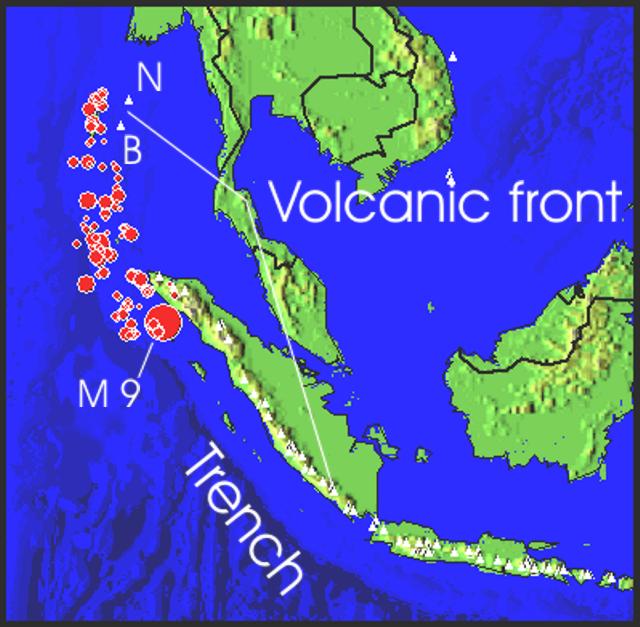 |
Figure 2. Map showing the broad tectonic setting on which Barren Island and Narcondam volcanoes reside. The map began with the main shock of the M 9 earthquake and the earthquakes that followed during the next 11 days. USGS preliminary tabulations computed the main shock as Mw 9.0 with a focus at 30 km depth. |
In terms of local time (in the Andaman Islands and India, i.e. India Standard Time), the epicenters shown occurred during the time interval 06:28:53 on 26 December to about 06:57 on 6 January. (In terms of UTC, this represents the interval 00:58:53 on 25 December to about 19:57 on 5 January 2004). This digital map was extracted by applying a video simulation of epicenters with time (Jones and others, 2002) to the recent seismic data.
The figure shows two prominent curving tectonic features crossing both Java-Sumatra and the Andaman Sea (the Nicobar and Andaman Islands region). One such curving feature is the volcanic front, on which lie all the active volcanoes of Java and Sumatra, and farther N, Barren Island and Narcondam. Outboard of that (to the W) is the second curving feature, the Sunda trench and islands adjacent to it (the Andaman Islands, and islands to the W of northern Sumatra hard-hit by the M 9 earthquake and tsunami). The trench reflects the sea-floor expression of the subduction zone, and represents the region where the M 9 earthquake occurred. The offset, often termed a 'megathrust,' involved 1,200 km of rupture along the subduction zone, and suddenly shifted the Indian Ocean's floor ~15 m towards Sumatra (Hopkin, 2005).
Regarding the M 9 earthquake, according to the USGS, the local time and date in terms of local time in N Sumatra at the epicenter was Sunday, 26 December 2004 at 07:58:53 (i.e., roughly 8 am). The USGS provided a table showing the time of the main shock in a variety of time zones.
Some excellent tutorials have provided background on the tectonic setting, the earthquake, and the tsunami. These have appeared in the press and on the web (eg. Sieh, 2004, 2005; NOAA, http://www.noaa.gov/tsunamis.html). Although large earthquakes may trigger volcanism (Linde and Sacks, 1998), so far this does not appear to be the case, at least at the volcanoes of Barren Island and Narcondum.
Mud volcanoes and ensuing confusion. Post-earthquake reports of active 'mud volcanoes' in the Andaman Islands caused panic and confusion in the region, and came at a particularly bad time. Chandrasekharam pointed out that in Andaman, like many other arc provinces, several mud volcanoes are present. These are not real volcanoes in the usual sense, but because they may build a small, low-profile cone of local extent around the hole through which the mud is thrown out, they are known as mud volcanoes (figure 3).
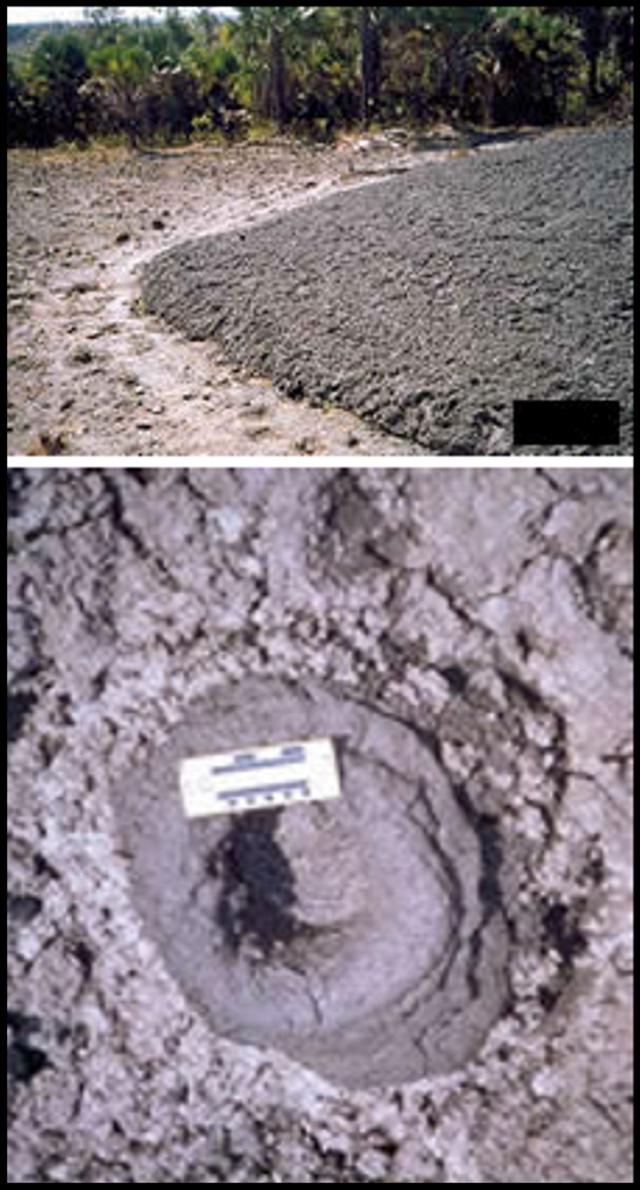 |
Figure 3. A 2003 photograph showing about a quarter to one half of a mud volcano on Baratang island (top) and its largest crater (~20 cm in diameter, ~ 28 cm in depth) (bottom). This site was known as a minor fissure prior to 1983; but in that year the largest outburst occurred, chiefly emitting warm (~ 30°C) mud. Mud again began emerging in February 2003. The dominant feature was a sub-circular mound of mud, ~30 m in diameter with a height of ~2 m at the center. Observers noted a colorless, sulfurous smelling gas. The mud contained angular to sub-rounded rock fragments from underlying strata. No photos nor similarly detailed technical reports have been received showing alleged recent activity that began 27 December 2004 (see text for news report). All photos and data courtesy of the Geological Survey of India, Eastern Region. |
Some of the difficulty with the news reports was that the mud volcanoes' locations, numbers, and impacts remained vague, and that Barren Island became intertwined with story. An extreme example came from an irresponsible report in the tabloid India Daily(2 January 2005), which contained the title "Volcano[es] Barren-1 and Narcondam erupt in Andaman—Seismic disturbance can cause more tsunami." It continued with wild claims such as, "Severe seismic activities are seen in these islands... personnel who have reached these remote areas are facing shattering earth vibrations and high waves," and "Some scientists are predicting severe earthquake again in the North of Andaman Nicobar Islands. The effect can be severe on Myanmar, Andaman, Indi[a]'s east coast, Bangladesh and Sumatra...." They added, "Andaman's tribals strangely are unaffected as most of them somehow went [to] higher ground before the tsunami. So did the animals." Science journalism clearly has a lot to compete with (see Oldenburg, 2005, for more discussion of these topics).
One alleged mud volcano 'Barren-1' has a name so close to the volcano's name (Barren Island) that it was frequently confused. The mud volcano's name (if there is one) appears to be absent from the technical literature at the Geological Survey of India's website.
On a positive note, one mud volcano received consistent mention in a number of news articles and provided coverage generally congruent with geological data posted by the Geological Survey of India. According to an article in India News(with the leader, "Port Blair, 30 December"), "A mud volcano at the inhabited Baratang Island in Middle Andaman has erupted but the administration said there was no cause for concern. 'Mud keeps bubbling in the volcano, but on December 28, the eruption was up to three meters and there was considerable heat,' Inspector General of Police S. B. Deol said here."
"He [also] said the mud volcano was located on one side of the Baratang Island, which was about 100 km from Port Blair. People live on the other side, but there is no cause for concern."
A report in the India Dailywas nearly identical. Details on a Geological Survey of India website noted that the Baratang mud volcano began erupting on 27 December 2003 (figure 3 and caption). Mud volcanoes may have also occurred elsewhere in the region, but the available news reports consistently failed to disclose locations.
Often associated with active faults and with petroleum fields, mud volcanoes on land consist of low-lying surface mud extrusions that vary in size from meters to several kilometers across. They emit mud at temperatures significantly below magmatic, which are typically at least 800°C. Eruptions from mud volcanoes can reach heights of several hundred meters and consist of mud, fluids and gases, and sometimes burning hydrocarbons. Although in submarine environments mud volcanoes can be extensive, deadly mud volcano eruptions are extremely rare because their eruptions seldom move far enough to affect large areas of the land surface. Their greatest danger may be to curious onlookers who venture too close.
References.Jones, A., Siebert, L., Kimberly, P., and Luhr, J.F., 2002, Earthquakes and Eruptions, v. 2.0 (CD-ROM): Smithsonian Institution, Global Volcanism Program, Digital Information Series, GVP-2.
Hopkin, M., 2005, Triple slip of tectonic plates caused seafloor surge: Nature, v. 433, no. 3 (06 Jan 2005).
Linde, A.T., and Sacks, I.S., 1998, Triggering of volcanic eruptions: Nature, v. 395, p. 888-890.
Oldenburg, D., 2005, A sense of doom: Animal instinct for disaster—Scientists investigate wildlife's possible warning systems: The Washington Post (8 January 2005), p. C1, C3 (URL: http://www.washingtonpost.com/).
Sieh, K., 2004, The science behind the Aceh earthquake: Caltech Media Relations (30 December 2004), (URL: http://pr.caltech.edu/media/Press_Releases/PR12628.html).
Sieh, K., 2005, In Sumatra: Notes From a Geologist in the Field: Caltech Today (1 January 2005, URL: http://today.caltech.edu/today/).
U.S. National Earthquake Information Center (NEIC) (URL: https://earthquake.usgs.gov)./
U.S. National Oceanic and Atmospheric Administration (NOAA) (URL: http://www.noaa.gov/tsunamis.html).
Information Contacts: Dornadula Chandrasekharam, Department of Earth Sciences, Indian Institute of Technology, Bombay 400076, India; India News (URL: http://news.newkerala.com/india-news/); India Daily (URL: http://www.indiadaily.com/); The Washington Post, Washington DC, USA (URL: https://www.washingtonpost.com/); Geological Survey of India, 27 Jawaharlal Nehru road, Kolkata (Calcutta) 700016, India.
Cite this Report
Uganda: False report of activity; confusion caused by burning dung in a lava tube
An eruption at Mount Elgon [1.136°N, 34.559°E; summit elev. 3,885 m] was mistakenly inferred when fumes escaped from this otherwise quiet volcano. The fumes were eventually traced to dung burning in a lava-tube cave. The cave is home to, or visited by, wildlife ranging from bats to elephants. Mt. Elgon (Ol Doinyo Ilgoon) is a stratovolcano on the SW margin of a 13 x 16 km caldera that straddles the Uganda-Kenya border 140 km NE of the N shore of Lake Victoria. No eruptions are known in the historical record or in the Holocene.
On 7 September 2004 the web site of the Kenyan newspaper The Daily Nation reported that villagers sighted and smelled noxious fumes from a cave on the flank of Mt. Elgon during August 2005. The villagers' concerns were taken quite seriously by both nations, to the extent that evacuation of nearby villages was considered.
The Daily Nation article added that shortly after the villagers' reports, Moses Masibo, Kenya's Western Province geology officer visited the cave, confirmed the villagers observations, and added that the temperature in the cave was 170°C. He recommended that nearby villagers move to safer locations. Masibo and Silas Simiyu of KenGens geothermal department collected ashes from the cave for testing.
Gerald Ernst reported on 19 September 2004 that he spoke with two local geologists involved with the Elgon crisis from the Geology Department of the University of Nairobi (Jiromo campus): Professor Nyambok and Zacharia Kuria (the former is a senior scientist who was unable to go in the field; the latter is a junior scientist who visited the site). According to Ernst their interpretation is that somebody set fire to bat guano in one of the caves. The fire was intense and probably explains the vigorous fuming, high temperatures, and suffocated animals. The event was also accompanied by emissions of gases with an ammonia odor. Ernst noted that this was not surprising considering the high nitrogen content of guano—ammonia is highly toxic and can also explain the animal deaths. The intense fumes initially caused substantial panic in the area.
It was Ernst's understanding that the authorities ordered evacuations while awaiting a report from local scientists, but that people returned before the report reached the authorities. The fire presumably prompted the response of local authorities who then urged the University geologists to analyze the situation. By the time geologists arrived, the fuming had ceased, or nearly so. The residue left by the fire and other observations led them to conclude that nothing remotely related to a volcanic eruption had occurred.
However, the incident emphasized the problem due to lack of a seismic station to monitor tectonic activity related to a local triple junction associated with the rift valley or volcanic seismicity. In response, one seismic station was moved from S Kenya to the area of Mt. Elgon so that local seismicity can be monitored in the future.
Information Contacts: Gerald Ernst, Univ. of Ghent, Krijgslaan 281/S8, B-9000, Belgium; Chris Newhall, USGS, Univ. of Washington, Dept. of Earth & Space Sciences, Box 351310, Seattle, WA 98195-1310, USA; The Daily Nation (URL: http://www.nationmedia.com/dailynation/); Uganda Tourist Board (URL: http://www.visituganda.com/).
Cite this Report
Pakistan: Peculiar activity emitted less than 5 m3 of frothy basalt
According to a report by Rana and Akhtar (2010) of the Geological Survey of Pakistan (GSP), an M 3.9 earthquake with a focal depth of 60 km occurred on 27 January 2010. It was accompanied by "spewing of molten material, burning of rock fragments, emission of steam, sparks and fumes in Sari (Charri) near Wam (Waam) in Ziarat Valley . . .. The molten material expelled from a small scoria cone and four smaller fissures in Tor Zawar mountain." The village of Wam was devastated on 29 October 2008 when a severe earthquake (M 6.2, focal depth 10 km) hit the city of Ziarat (~28 km ESE from Wam). [Note - Throughout this report we have tried to use the spelling of geographic and geologic features as found in the GSP report, with alternative spellings found in other referenced reports placed in parentheses.]
The frothy basalt emitted at Tor Zawar occurred at a spot located hundreds of kilometers from the nearest known Holocene volcanism. The news and various discussions of the site incorrectly attributed the eruption to activity at a mud volcano, a process common in the region. This may be the smallest volume eruption ever documented at a new locality.
Figure 1 shows a geological sketch map of the area of Balochistan Province, Pakistan, where the eruption occurred. The news of volcanic activity was surprising because volcanism has seemingly been absent here for at least the last 10,000 years. The closest identified Holocene volcanoes occur ~400 km N in Afghanistan (Vakak Group and Dacht-Navar Group) and ~800 km W in Iran (Taftan, Bazman, and unnamed volcanoes; figure 2).
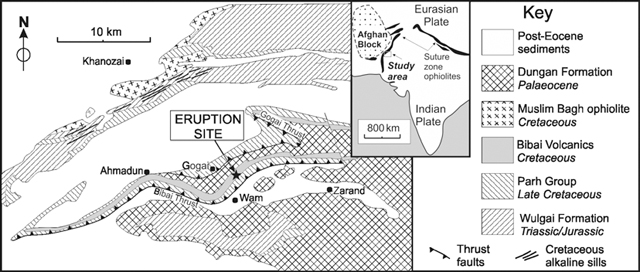 |
Figure 1. Geological sketch map showing the location of the eruption site at Tor Zawar, Pakistan, on 27 January 2010. The site is in the Sari (alternatively Jhari, Charri, or Cherri) area of the Ziarat District of Balochistan Province ~10.6 km N of the village of Wam (Waam). The event took place ~55 km NW of Quetta, Pakistan (~70 km E of the border with Afghanistan) and ~8.1 km E of the town of Gogai. The geological formations on the map are keyed to the stratigraphic section on the right-hand side of the figure. From Kerr, Khan, and McDonald (2010), modified from Khan, Kassi, and Khan (2000). |
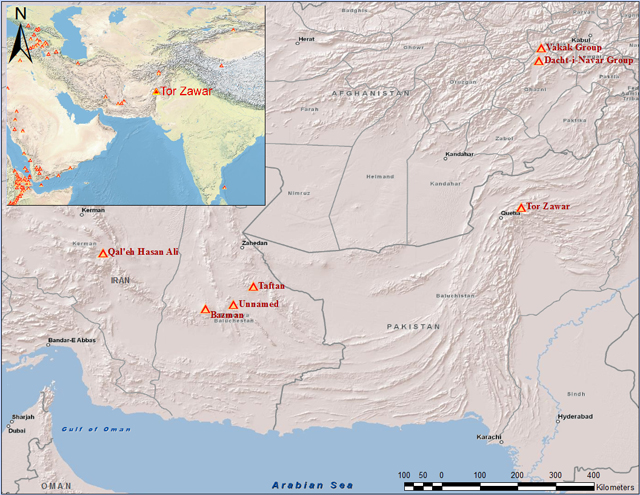 |
Figure 2. Map of the Pakistan-Afghanistan-Iran region showing the relative locations of known Holocene volcanoes with respect to the Tor Zawar event. Of those Holocene volcanoes shown, only Taftan volcano in Iran has possible historically recorded eruptions, which occurred in 1902 and 1993. Locations from Siebert and others (2010); map produced by S. Purcell (GVP). |
News reports from several sources (e.g., The Nation, 3 February 2010; Balochistan Times, 23 February 2010 and 7 March 2010; Ary News, 2 February 2010) noted that residents in nearby areas observed flames at the mountain top for several nights and, on 1 February 2010, the volcano began erupting lava. Explosions followed by smoke emissions were observed. District Coordinator Officer Siddiq Mandokhel confirmed that lava spewed from the volcano. The newspaper Pak Tribune reported on 3 February 2010 that Mandokhel said "he had personally surveyed the site of occurrence, and said that emittance of chemical gases had begun last night, after which it spewed out a molten lava, the size of a meter".
At least two small groups of earth scientists visited the site within 3 to 5 days after the reported 'eruption' event. The field observations by scientists from the GSP were reported in a GSP Information Release (Rana and Akhtar, 2010). Khadim Durrani (2010) issued on his web site an illustrated interview conducted with Din Mohammed Kakar. The two reports mentioned above contain occasional discrepancies within and between the reports, and both include unlabeled figures. During the periods of field observations, no fresh extrusion of volcanic material or sparks was observed. However, heat was still being emitted.
Table 1 contains a brief summary of possible causes and/or production-mechanisms for the molten material that have been suggested by various sources. Additional details are found in sections below.
Table 1. Various explanations for a molten material source and proposed mechanism of erupted surface deposit at Tor Zawar. See original papers for more details.
| Proposed source or mechanism | Comments |
| Melting of existing Bibai volcanics caused by resistive heating due to local power line, lightning, or some combination of surface sources. | Mentioned but dismissed by Rana and Akhtar (2010); 'unsupported' according to Kerr and others (2010; Kakar, in Durrani (2010). |
| Frictionally derived melting along thrust fault. | Rana and Akhtar (2010). |
| Methane gas leakage and flaring with local heating/melting of existing Bibai volcanics. | Bilham (personal communication). |
| Rupture on Gogai Wam fault during 2008 earthquake created chambers from which molten materials rose and eventually erupted through channels in the weak zone. | Rana and Akhtar (2010). |
| Melting from heating of lithosphere either by conduction from below or by advection from an intruding magma. | "It is more likely that a small amount of asthenospheric-derived melt has invaded the lower lithosphere," concluded Kerr and others (2010). |
| 60-80 km deep magma ascended to the surface along Bibai and Gogai thrust faults. | "Eruption represents a geological event of deep origin," according to Kerr and others (2010). |
Field observations by GSP. Two GSP geoscientists, Asif Nazeer Rana and Sardar Saeed Akhtar, visited the site of the molten material (figure 3) on 2 February 2010 and summarized their observations in a GSP report (Rana and Akhtar, 2010). The following information came from that report. Note that most of the figures reproduced below from the GSP report lacked captions.
 |
Figure 3. Photo of the study site (a) and deposit of solidified molten material (b). The circled area in 'a' shows the location of the molten material deposit. The surrounding dark colored rocks are part of the Cretaceous Bibai Volcanics. The village of Wam (Waam) is visible in the upper part of the picture. Note in figure 'b' the shadow of nearby overhead power lines. Photo 'a' by Din Mohammed Kakar in Durrani (2010); photo 'b' courtesy of Rana and Akhtar (2010). |
The investigators were told on 2 February 2010 by locals that emission of black, molten material started along with tremors on the night of 27 January 2010. The locals observed that steam was continuously emitted from six fissures, and rock fragments were too hot to handle with bare hands. The erupted molten material (looking like lava, scoria and volcanic glass) was found to be cold and solidified on the surface (figures 4 and 5), but was still hot in the subsurface. Heat was still rising from the site during the 3 days of observation.
 |
Figure 4. (a) Photo of the ejecta cone seen at the surface in the field. Scale provided by red-handled marker pen. Courtesy of Rana and Akhtar (2010). (b) Photo of the ejecta cone removed from the field; some breaking and/or displacement of parts of the cone is apparent. Coin shown was of unknown diameter. Photo courtesy of Kakar, in Durrani (2010). |
 |
Figure 5. Two photos showing the eruption site and the in situ chilled molten material; geological hammers for scale. Courtesy of Rana and Akhtar (2010). |
The molten material flow solidified in concentric layers on reaching the surface (figure 4). The flow structure was ~15 m2 in area and 15 to 60 cm thick. By 2 February, most of the material had been removed as souvenirs by the locals. Rana and Akhtar (2010) reported that the dimension of the lava structure was "1.9 m x 8.2 m in length and 15 cm to 0.6 m thick." The material remaining on the surface after pilferage "was 2.9 m long and 1.5 m wide," covering a area of ~4.3 m2. The ejecta cone was formed from the molten material; the vent pipe of the cone was 0.9 m deep below the surface, but upon excavation it was observed that the cone widened and became inclined below the surface (figure 6).
 |
Figure 6. Photo of the volcanic pipe from which the ejecta cone in figure 4 was extracted; geological hammer shown for scale. Courtesy of Rana and Akhtar (2010). |
The ejected molten material and ejecta cone were excavated. A ditch was dug along the fissures to find the opening of the vent. The solidified sheet of this molten material was removed from the surface after documentation, measurement, and photography. Samples of various volcanic materials, including volcanic glass, scoria, pumice, and lava, were collected for lab analyses and petrographic studies. The newly erupted material at the surface was removed, and the complete structure of the ejecta cone was preserved and packed for display in the GSP Museum of Earth Sciences (figure 7). Deeper areas were excavated, a pipe-shaped feature was discovered at a depth of 1 m, leading down to a cone-shaped vent.
 |
Figure 7. Lava excavated from vent on display at the GSP Museum of Earth Sciences. On the right is Imran Khan, Director General of GSP; on the left front in green sweater is Imtiaz Kazi, Federal Secretary, Ministry of Petroleum and Natural Resources. From GSP 2010-2011 Annual Report. |
The cone-shaped vent was fused shut by the solidification of the material in the orifice. Under the ejecta cone, a pipe of 1 m length and 5 cm diameter led vertically down to a funnel-shaped structure (i.e., wider at the top). The ejecta cone was found to be hollow on breaking the pipe and edifice; the structure looked like an oven, with a shiny, black, fine coating on the walls all around. The cone was underlain by two chambers oriented in the NW-SE direction; dimensions of these chambers were not disclosed.
The temperature of the chamber walls was still burning hot, and when dry bushes were put on the mouth of these chambers, they caught fire. The team did not carry a device for measuring soil temperature and steam from the chambers. The smaller, deeper chamber, ~4.75 m from the main chamber, led SE towards an electric power line pole. The temperature of the smaller chamber was seemingly higher than that of the main chamber. The walls of the chambers were still too hot to touch even 10 days after the lava eruption.
Two rock samples, one described as glassy and one as spongy, collected from the Tor Zawar formerly molten material were analyzed chemically at the GSP Geoscience Advance Research Laboratories for major and trace elements chemistry. Analysis revealed sample compositions of silica (SiO2) of 48.02 and 48.27 wt % and total Na2O+K2O of 5.18 and 5.23 wt. %. The two samples were classified as alkaline basalt (based on classification of Cox, Bell, and Pankhurst, 1979).
The depth of the 27 January 2010 M 3.9 earthquake was reported by the Pakistan Meteorological Department to be 60 km. The investigators found this depth to be quite unusual, as a majority of the tremors in this region have had their origin at shallow depths, generally 10-12 km. It was inferred from the previous seismotectonic investigations of 29 October 2009 earthquake (Rana, Sardar, and Qadir, 2008) that earthquake intensities and the alignment and location of most of their epicenters in this area indicated that a blind fault might be running between Gogai and Wam, passing in close proximity to this erution. There is a strong possibility that the present eruption might have occurred close to the fault plane. This blind fault, the Gogai-Wam fault, is suspected to run for nearly 40 km NW-SE, but no trace of any surface rupture was recorded either in the previous study or in the present study.
Visit and assessment by Din Mohammad Kakar. Khadim Durrani interviewed Din Muhammad Kakar, a sedimentary geologist from the University of Balochistan, about his visit and impressions of the site (Durrani, 2010). Kakar noted that a new, small volcano began spewing lava on 29 January 2010 in Pakistan (rather than the 27 January start date reported in the GSP report above). He visited the site on "day 5 after the start of the volcanic activity" (from this, one might infer that his observations were made on 3 February). Kakar observed little molten material other than two "volcanic vents," 2-3 m apart, and the 2-m-deep pit that was dug out by the GSP (figures 8 and 9). He discovered that the GSP and the Frontier Corps (figure 10) had earlier removed parts of the newly erupted cone and the remaining debris. Kakar noted that the heat of the presumed volcanic activity could still be felt in the openings.
 |
Figure 8. Photo of the two volcanic vents (pits/holes/chambers) and scattered pumice fragments. Note the presence of electrical cables and the foot of a power pole, with grounding wire and stake. Photo by Din Mohammed Kakar; courtesy of Durrani (2010). |
 |
Figure 9. A close-up view of one of the vents with grounding wire and ground in figure 8. Photo by Din Mohammed Kakar; courtesy of Durrani (2010). |
 |
Figure 10. Photo of Pakistan Frontier Corps soldier taking away a large piece of the solidified molten material. Photo published 3 February by European Press Agency; courtesy of Durrani (2010). |
According to an Email note from Kakar to Bulletin editors, the chemistry indicates the same alkali basaltic lava as is found in the Bibai volcanics. Kakar noted that the eruption took place within the Late Cretaceous Bibai formation volcanics (see figure 1) (Kahn, 1998). Other exposed rocks in the area include the Parh group (Cretaceous), Dungan formation (Paleocene), and the Ghazij formation (Eocene). In the Kach-Ziarat area, the Bibai formation is sandwiched between Dungan limestone (above) and the Parh formation (below).
Eye witnesses said that there were flames coming out from the vent, possibly the result of ignited natural gas. In discussion with Bulletin editors, Roger Bilham of the University of Colorado offered the possible explanation that the eruption may have represented the remelting of pre-existing rocks of Bibai Volcanics due to ignition and combustion of natural gas.
Kakar said that the regional tectonics and the volcano's origin were not clear. However, the volcano was not a mud volcano, common in Pakistan. There is the possibility of a partial melting at shallow depth due to recent earthquake activities. He recalled the area had been hit by thousands of aftershocks since October 2008. He noted that his research had found a rupture in the basement rock below the 15-km sedimentary cover, and suggested that reactivation of the Bibai thrust might have been responsible for the recent volcanic activity. According to Kakar, the area is sparsely populated and the eruption caused no damage except for cables and poles associated with a tube well used for agricultural purposes.
Petrographic analyses.Two rock samples were sent by the GSP to Cardiff University and analyzed by Kerr and others (2010). The samples showed two petrographically distinct basalt types (figure 11). One type (sample P2) consisted of completely fresh, light brown glass with a few (
 |
Figure 11. Photographs of the 2010 Tor Zawar samples analyzed by Kerr and others (2010). (a) devitrified sample (P1); and (b) glassy sample (P2). Courtesy of Kerr and others (2010). |
According to Kerr and others (2010), these two rock types "also have slightly different geochemical signatures that can be partially explained by crustal assimilation. Re-melting of local basaltic rocks by short circuiting of a ruptured high-tension electrical cable is considered unlikely. Mantle melt modeling suggests that the lavas have been largely derived from a source in the garnet-spinel transition zone, i.e. well within the lithosphere [i.e., melt from a depth of 60-80 km]. It is proposed that localized asthenospheric melting resulted in relatively depleted melts which were substantially contaminated by [a] fusible lithospheric mantle en route to the surface. Further small-scale eruptions cannot be ruled out."
Recent geophysical research. In the last week of March 2010, the GSP conducted a geophysical survey in the region of the Tor Zawar vent site (Saeed, Rehman, and Abbas, 2011). According to the report, "The syntheses of the magnetic, resistivity soundings and profiling and ground penetration radar (GPR) survey indicate the presence of highly magnetic dual lobe sources, resistive and prominent reflectors from the radar soundings in and around the vent site. The resistivity pseudo sections delineate the lateral and vertical molten flows which have apparently solidified at shallow depth."
The report concluded that "the radar imaging explicitly shows folding of the overlying fine grained clastics", and that they also saw "fracturing in the compact, hard and brittle rock units of compact gravels/limestone and volcanics due to the pressure exerted by the intrusion."
The presence of older volcanic rocks in the area made it difficult to separate older volcanic rocks and structures from the present eruption activity. The geophysical survey was unable to resolve the source or sources of the molten material that erupted as basalt.
References. Cox, K.G., Bell, J.D., and Pankhurst, R.J., 1979, The interpretation of igneous rocks, George Allen and Unwin, Boston, 450 pp.
Durrani, K., 2010, Ziarat's volcanic coughing - an interview with Din Mohammed Kakar, published by admin, March 2, 2010 in Environment, Geology of Pakistan and Natural Disasters, URL: www.khadimsquetta.com/?p=640. (Note that many of the photos in this website item are not described or labeled.)
Geological Survey of Pakistan (GSP), 2011, GSP Year Book 2010-2011, on GSP web site: http://www.gsp.gov.pk.
Kakar, D.M., Szeliga, W., and Bilham, R., 2010, Seismic Potential of the Pishin/Mach Shear Zone in Northern Baluchistan, Pakistan, Seismological Research Letters, v. 81, no. 2, pp. 324.
Khan, A.T., 1998, Sedimentology and petrology of the volcaniclastic rocks of the Bibai Formation, Ziarat District, Balochistan, Pakiston, Thesis, University of Balochistan, Quetta, 179p.
Khan, A.T., Kassi, M.T. and Khan, A.S., 2000, The Upper Cretaceous Bibai submarine Fan (Bibai Formation), Kach Ziatrat Valley, western Suleiman Thrust-Fold Belt, Pakistan, Acta Mineralogica Pakistanica, v. 11, pp. 1-24.
Kerr, A.C., Khan, M., and McDonald, I., 2010, Eruption of basaltic magma at Tor Zawar, Balochistan, Pakistan on 27 January 2010: geochemical and petrological constraints on petrogenesis, Mineralogical Magazine, v. 74, no. 6, pp. 1027-1036.
MonaLisa, and Jan, M.Q., 2010 (10 January), Geoseismological study of the Ziarat (Balochistan) earthquake (doublet?) Of 28 October 2008, Current Science, v. 98, no. 1, p. 50-57.
Rana, A.N., Sardar, S.A., and Qadir, G.T., 2008, Seismotectonic investigations of October 29, 2008 earthquake of Gogai Ziarat, Balochistan, Information Release No. 874, Geological Survey of Pakistan, Islamabad.
Rana, A.N., and Akhtar, S.S., 2010, Preliminary Report on Eruption of Molten Material in Tor Zawar Mountain, Sari, Ziarat, Balochistan on January 27, 2010, Information Release No. 891, Geological Survey of Pakistan, Islamabad, 24 pp. (Summarized in GSP News. V. 17, no. 1-12, p. 12.) (Note that many of the photos in this website item are not described or labeled.)
Saeed, M., Rehman, M., and Abbas, S.A., 2011, Integrated geophysical modeling of volcanic eruption at Tor Zawar, Ziarat, Balochistan, Information Release No. 920, Geological Survey of Pakistan, Islamabad, 79 pp.
Siebert, L., Simkin, T., and Kimberly, P., 2010, Volcanoes of the World, Third Edition, Smithsonion Institution, Washington, D.C., and University of California Press, Berkeley, CA, 551 pp.
Information Contacts: Imran Khan, Director General, Geological Survey of Pakistan, Sariab Road, Quetta, Pakistan (URL: http://www.gsp.gov.pk); Din Mohammed Kakar, Geology Department, University of Balochistan, Quetta, Pakistan (URL: http://www.uob.edu.pk/); Andrew C. Kerr, Cardiff University, School of Earth and Ocean Sciences, Cardill, Wales, UK (URL: http://www.Cardiff.ac.uk/earth/contactsandpeople/profiles/kerr-andrew.html); Khadim Durrani; Roger Bilham, University of Colorado.

