A 5 July satellite image showed a dark elliptical area of lava on Nyiragongo’s crater floor. Gas-and-steam plumes appeared to be rising from two central vents. Thermal anomalies identified in SWIR images corresponded to the location of the lava area along with a small brighter area at the center.
Source: Copernicus
Ongoing lava lake activity in the summit crater through September 2023
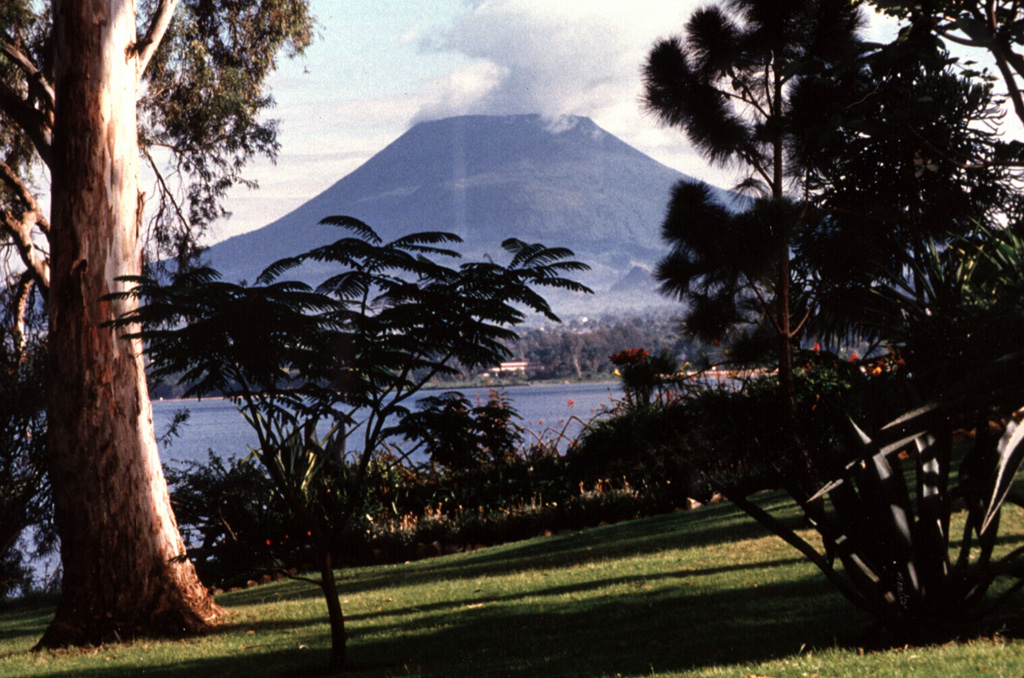
Nyiragongo is within the Albertine Rift Zone along the western branch of the East African Rift System in the Democratic Republic of the Congo. A lava lake inside the 1.2 km summit crater has been active since at least 1971. Eruptions during the last 120 years have been associated primarily with the summit crater, but several flank lava flows have also been observed as recently as 2019 and 2021, with the latter reaching the city of Goma (15 km S) (BGVN 46:06). Besides lava extrusions, activity has included incandescence, gas and steam emissions, and seismicity. The current report summarizes data between April and September 2023 and is based on occasional communications from the Observatoire Volcanologique de Goma (OVG) and satellite data.
During the reporting period, volcanic activity was relatively low and confined to the persistent lava lake. OVG reported that the eruption continued as normal from 27 May to 11 June, with crater incandescence observed at 1900 on 4 June and 1800 on 10 June. SO2 emissions were low. A subsequent OVG report indicated that activity continued low during 17-24 September. A diffuse sulfur dioxide plume with an estimated mass of 20 tons was identified in satellite data on 25 September.
The MIROVA (Middle InfraRed Observation of Volcanic Activity) hotspot system recorded a surge of moderate to high-power hotspots in about the second week of June 2023, and then frequent hotspots throughout July, and a few scattered hotspots in August. The MODIS-MODVOLC thermal alerts system recorded hotspots only on 3 April, 10 July, and 24, 25, and 27 July (two pixels each day in July). Sentinel-2 satellites recorded lava effusion in the summit crater during the few satellite observation days of the reporting period, corresponding to the elevated thermal observations (figure 97).
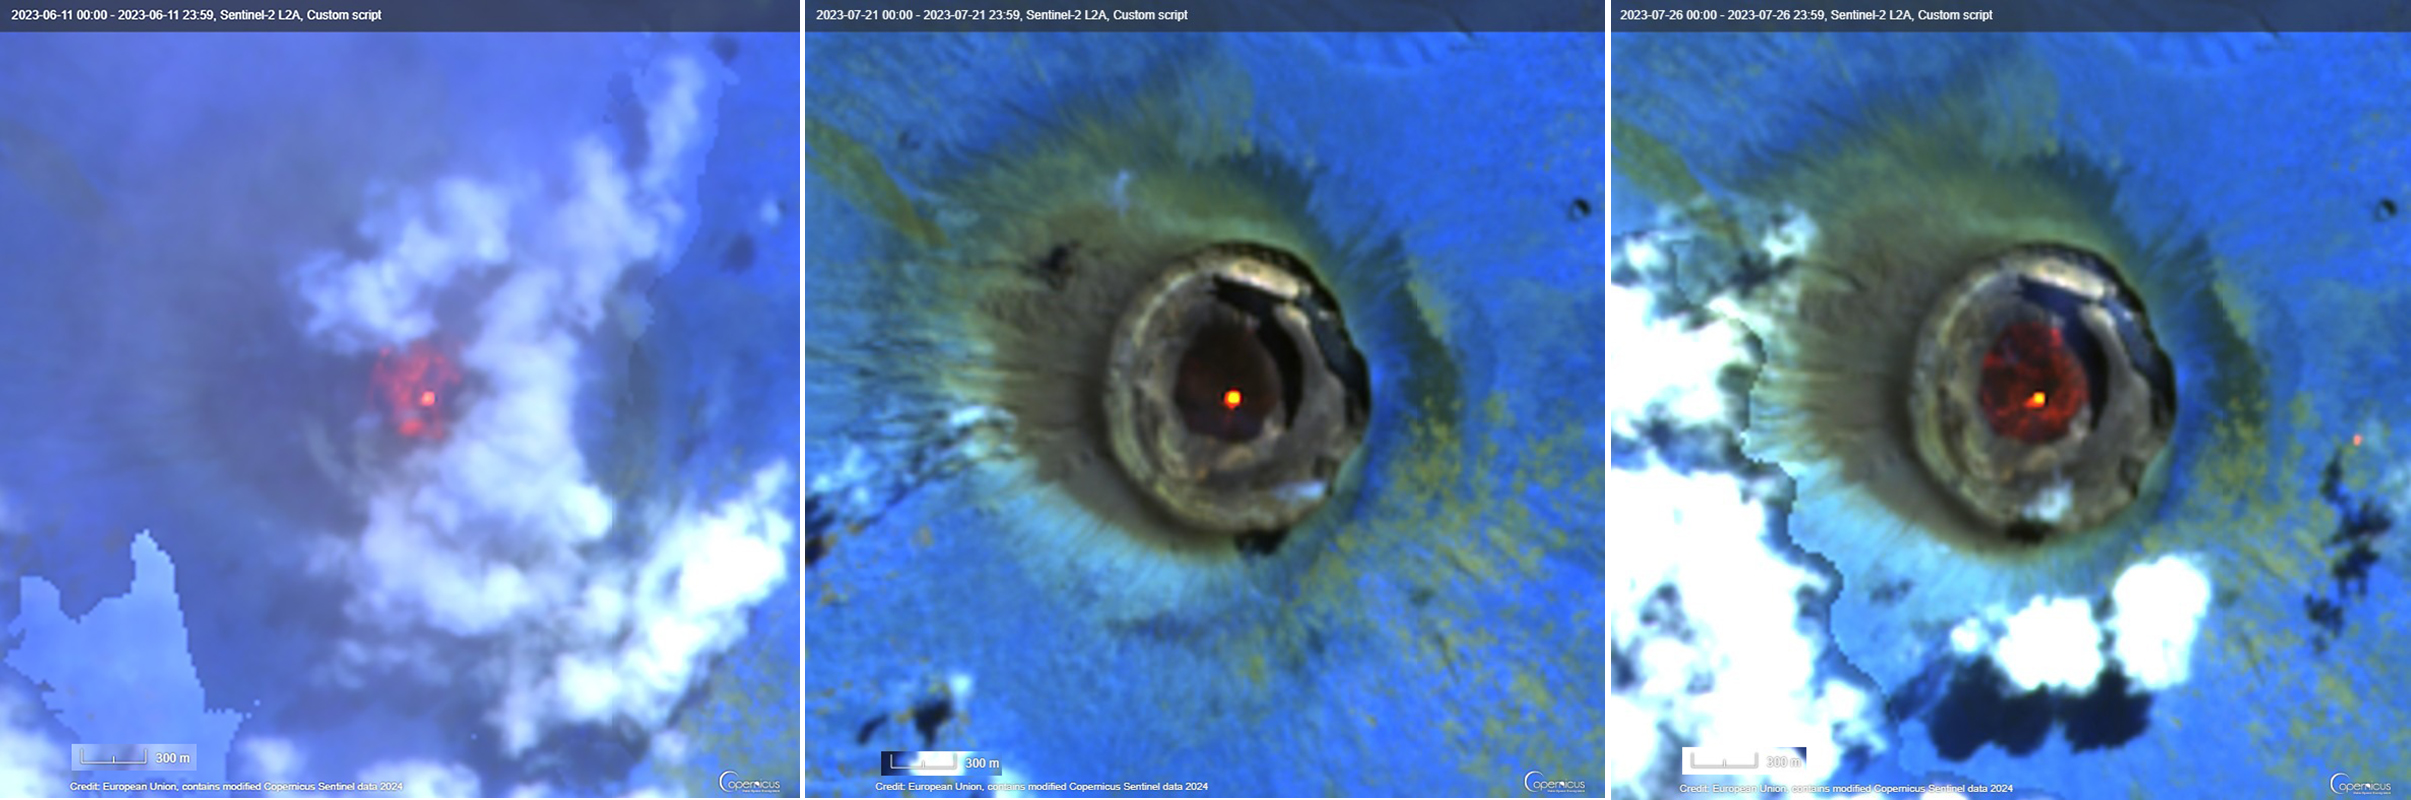 |
Figure 97. Sentinel-2 infrared satellite imagery showed ongoing activity and lava effusion in the Nyiragongo summit crater on 11 June 2023 (left), 21 July 2023 (middle), and 26 July 2023 (right). Images rendered using bands B12, B11, B4. Courtesy of Copernicus Browser. |
Information Contacts: Observatoire Volcanologique de Goma (OVG), Departement de Geophysique, Centre de Recherche en Sciences Naturelles, Lwiro, D.S. Bukavu, DR Congo; MIROVA (Middle InfraRed Observation of Volcanic Activity), a collaborative project between the Universities of Turin and Florence (Italy) supported by the Centre for Volcanic Risk of the Italian Civil Protection Department (URL: http://www.mirovaweb.it/); Hawai'i Institute of Geophysics and Planetology (HIGP) - MODVOLC Thermal Alerts System, School of Ocean and Earth Science and Technology (SOEST), Univ. of Hawai'i, 2525 Correa Road, Honolulu, HI 96822, USA (URL: http://modis.higp.hawaii.edu/); Copernicus Browser, Copernicus Data Space Ecosystem, European Space Agency (URL: https://dataspace.copernicus.eu/browser/).
2024: March
| June
| July
2023: February
| May
| June
| September
2022: March
| July
2021: May
| July
| August
| September
| November
| December
2019: May
| July
2016: March
| April
2014: January
2013: July
2012: October
2011: February
| March
| November
2010: January
2009: April
| May
2008: August
| September
| October
2007: July
2005: September
| October
| November
2004: May
| June
| July
| September
| November
| December
2003: February
| March
| April
| May
| December
2002: January
| May
| July
| October
2001: March
A 5 July satellite image showed a dark elliptical area of lava on Nyiragongo’s crater floor. Gas-and-steam plumes appeared to be rising from two central vents. Thermal anomalies identified in SWIR images corresponded to the location of the lava area along with a small brighter area at the center.
Source: Copernicus
A 25 June satellite image showed a dark elliptical area of lava on Nyiragongo’s crater floor. A central vent produced a gas-and-steam plume the drifted WNW. The lava area was about 560 m E-W and about 690 m N-S. Thermal anomalies identified in SWIR images corresponded to the location of the lava area along with a small area at the central vent.
Source: Copernicus
Thermal anomalies on Nyiragongo’s crater floor were identified in satellite images on 31 May and 5 June.
Source: Copernicus
Observatoire Volcanologique de Goma (OVG) reported that the sulfur dioxide (SO2) flux at Nyiragongo decreased slightly but remained at moderate levels during 18-23 March. The Munigi station measured a small increase in carbon dioxide (CO2) concentrations from fractures in the S area. Additionally, CO2 concentrations in the “mazuku”, or lowland areas located in the W area of the city of Goma, remained lethal. The Alert Level remained at Yellow.
Source: Observatoire Volcanologique de Goma (OVG)
The Observatoire Volcanologique de Goma (OVG) reported that the activity at Nyiragongo continued during 17-24 September at a low level. A diffuse sulfur dioxide plume with an estimated mass of 20 tons was identified in satellite data on 25 September.
Source: Observatoire Volcanologique de Goma (OVG)
The Observatoire Volcanologique de Goma (OVG) reported that the eruption at Nyiragongo continued during 5-11 June and sulfur dioxide levels in the emissions remained low. Crater incandescence and gas emissions were visible at 1800 on 10 June
Source: Observatoire Volcanologique de Goma (OVG)
The Observatoire Volcanologique de Goma (OVG) characterized activity at Nyiragongo during 27 May-4 June as normal. Sulfur dioxide emissions were low. Faint incandescence at the crater was observed at 1900 on 4 June. The Alert Level remained at Yellow.
Source: Observatoire Volcanologique de Goma (OVG)
The Observatoire Volcanologique de Goma (OVG) reported that the lava lake on Nyiragongo’s crater floor continued to be active during 13-19 February; faint glow emanated from the crater on 15 February. Seismicity was generally low, characterized by a few long-period earthquakes located up to 15 km deep along the large fracture connecting the Nyamuragira and Nyiragongo. A seismic station near the volcano registered a minor increase in the intensity of signals on 17 February. High concentrations of carbon dioxide were measured in the Mazuku areas, and in an area to the W of a camp in the Lac Vert district in Bulengo; OVG warned residents to stay away from those areas. The Alert Level remained at Yellow.
Source: Observatoire Volcanologique de Goma (OVG)
Thermal anomalies from lava effusion on Nyiragongo’s crater floor were identified in satellite images on 1, 6, and 11 July.
Sources: Observatoire Volcanologique de Goma (OVG); Sentinel Hub
Lava effusion from vents on Nyiragongo’s crater floor continued during 13-18 March based on satellite images. Significant gas emissions were visible drifting SW on 13 March.
Sources: Observatoire Volcanologique de Goma (OVG); Sentinel Hub
OVG reported that voluminous gas plumes were visible rising from Nyiragongo and crater incandescence was visible during 3-5 January. Lava fountaining and collapses at active vents on the crater floor were observed along with a growing lava lake. Rumbling was sometimes audible.
Source: Observatoire Volcanologique de Goma (OVG)
According to a news article seismic signals at Nyiragongo were dominated by long-period earthquakes during 30 November-5 December. Residents of Goma observed incandescence emanating from the crater on 4 December.
Source: Les Volcans News
OVG reported that active vents on the crater floor of Nyiragongo were seen ejecting spatter on 27 November.
Source: Observatoire Volcanologique de Goma (OVG)
According to a news article the scientific director of GVO stated that lava had returned to Nyiragongo's crater on 18 September. Notable thermal anomalies were visible in Sentinel satellite images on 29 September and 4 October.
Sources: Observatoire Volcanologique de Goma (OVG); Agence France-Presse (AFP)
OVG reported that lava had returned to Nyiragongo’s summit crater based on a 29 September Sentinel satellite image.
Source: Observatoire Volcanologique de Goma (OVG)
Goma Volcano Observatory (GVO) reported that a gas-and-ash plume rose from Nyiragongo at 1420 on 4 August.
Source: Observatoire Volcanologique de Goma (OVG)
Goma Volcano Observatory (GVO) reported that a small area of incandescence from the floor of Nyiragongo’s collapsed crater was visible in a 26 July satellite image.
Source: Observatoire Volcanologique de Goma (OVG)
According to a news article a collapse in Nyiragongo’s main crater on 24 July caused white-colored ash to fall in Goma. The ashfall caused no notable damage, though there were health concerns related to water quality. The director of Volcanological Observatory of Goma (OVG) noted that the collapse was not due to eruptive activity.
Source: Agence France-Presse (AFP)
Satellite data and analysis indicated that the lava flows at Nyiragongo during 22-23 May were the result of a N-S trending dike that had intruded beneath the volcano and Goma, and likely extended beneath Lake Kivu. Though lava effusion ceased, intense seismicity continued afterwards and indicated the dike continued to be active, according to GeoRiskA. Ground cracking in the city and damage to buildings from earthquakes continued to be reported. On 27 May authorities mandated an evacuation of the at least 400,000 residents in higher risk areas (about 10 districts) according to news organizations. The total population of Goma is an estimated 670,000 people. Photos in news articles showed masses of people and cars jammed for kilometers on roads leading out of the city. During 28-29 May GeoRiskA reported that seismicity began to decrease and continued a downward trend at least through 1 June; both the seismic data and GPS data indicated that the dike was no longer propagating. A news article noted that residents had begun returning to their homes within a few days.
Humanitarian organizations noted that within five days after lava flow stopped nearly 700 children had been re-united with their families, and more than 200 were in foster care or other transitional facilities. More than 170 families continued to search for missing children. The eruption had destroyed 3,629 homes, 12 schools, and 3 health facilities. More than 20,000 people were displaced and 31 had died. Goma’s international airport remained closed, though one across the border in Rwanda was operating.
Sources: GeoRiskA; UN News Centre; SCK TV Dans Le Monde; European Commission - Directorate General for Humanitarian Aid and Civil Protection; Actualite.cd
At around 1815 on 22 May seismicity at Nyiragongo spiked, around the same time observers reported at least two fissures opening on the lower S flanks, NW of Kibati (8 km SSE) and Rukoko (10 km S). Lava from the first fissure, originating near the Shaheru crater, flowed E over a major road (N2) and then S. The second fissure produced lava flows that traveled S, overtaking and setting fire to many houses and structures in communities north of Goma, just W of Monigi (12 km S). Video posted on social media showed lava fountaining from the fissures, a glowing red sky, and residents running through the streets. About 1,000 homes and buildings were destroyed and about 25,000 people were displaced. The lava cut off electricity and water supplies to some areas. The flow may have been as wide as 1 km and stopped 1.25 km from the Goma International Airport, in the SE part of the city, during 22-23 May. According to the Toulouse VAAC ash plumes may have initially rose to 13.7 km (45,000 ft) a.s.l., though subsequent estimates put the ash plumes mostly at 6.1-9.1 km (20,000-30,000 ft) a.s.l. during 22-23 May. Satellite images and local scientists indicated that the summit lava lake had drained before the flank fissures had opened, but began refilling afterward; collapses in the summit crater were the likely cause of the ash plumes.
Initial reports indicated that about 32 people had died: about 12 from lava and gas asphyxiation while crossing lava flows, and most of the rest from accidents while fleeing. Several people, including many children, remained missing, though families were continuing to be reunited.
Seismic data during 22-24 May showed events seemingly propagating from the summit area to the S into Lake Kivu. Several strong earthquakes shook buildings in Goma, causing some to collapse and injure people; a news article noted that tremor was felt about every 30 minutes beginning around noon on 23 May. Both airports in Goma closed for security reasons. A M 5.1 earthquake with a hypocenter beneath Lake Kivu was recorded at 1037 on 24 May. The VAAC noted that ashfall around the volcano and in surrounding towns was visible in satellite data. Cracks a few 10s of centimeters wide opened in different parts of the city on 25 May. The cracks stretched for several hundred meters from the northern city limit down to the lake, and were nearly 100 m long near the airport. Some cracks were hot and emitting gasses, and some were flaming. Ash plumes rose to 6.1 km (20,000 ft) a.s.l. and drifted S; ground-based reports indicated ash in the atmosphere above Goma. Seismicity remained intense on 25 May with more than 130 earthquakes between M 2 and 5 recorded in a 24-hour period. News reports indicated hundreds of damaged buildings in neighboring Rwanda.
Sources: Agence France-Presse (AFP); Agence France-Presse (AFP); Agence France-Presse (AFP); Washington Post; Reuters; GeoRiskA; IGIHE; Simon Carn
The Observatoire Volcanologique de Goma (OVG) reported that during 1-31 July the level Nyiragongo’s lava lake had dropped, making it not visible in the daytime. Incandescence from the lake continued to be visible at night. Activity also declined at a small eruptive cone that formed in the crater in 2014.
Source: Observatoire Volcanologique de Goma (OVG)
The Observatoire Volcanologique de Goma (OVG) reported that during 1-28 April Nyiragongo’s lava lake continued to be active, extending the episode of ongoing activity to almost 17 years. A secondary cone which had formed on 29 February 2016 was also active, as well as three other vents surrounding it. Sulfur dioxide emissions reached a high of at least 5,000 tonnes per day, greater than March highs of 2,900 tonnes per day, but still below the alert threshold.
Source: Observatoire Volcanologique de Goma (OVG)
On 12 April the Observatoire Volcanologique de Goma reported that activity at Nyiragongo had declined since 6 April, and that the level of the lava lake had dropped. A report dated 17 April stated that some volcanic earthquakes had been located within 5 km E and 10-15 km N of the crater; continuous volcanic tremor was recorded during 0200-0400 on 17 April. In a photo dated 19 April an incandescent vent atop a spatter cone appears to be in the same location as a lava lake that had been first noted on 1 March.
Source: Observatoire Volcanologique de Goma (OVG)
The Observatoire volcanologique de Goma reported that activity at Nyiragongo intensified on 28 February. On 1 March scientists observed a second lava lake on the E part of the crater floor.
Source: Observatoire volcanologique de Goma
According to NASA's Earth Observatory, a satellite image acquired on 29 January showed a gas-and-steam plume rising from Nyiragongo.
Source: NASA Earth Observatory
According to NASA's Earth Observatory, a satellite image of Nyiragongo acquired on 29 July showed a red glow coming from the active lava lake in the summit crater. A diffuse blue plume drifted N.
Source: NASA Earth Observatory
The Toulouse VAAC reported that, according to a Volcano Observatory Notices for Aviation (VONA) issued by the Goma Volcano Observatory, a gas plume composed mostly of sulfur dioxide rose from Nyiragongo on 1 November.
Source: Toulouse Volcanic Ash Advisory Centre (VAAC)
According to NASA's Earth Observatory, a satellite image of Nyiragongo acquired on 15 November showed heat coming from the active lava lake in the summit crater.
Source: NASA Earth Observatory
The Toulouse VAAC reported that on 13 March a diffuse plume was observed in satellite imagery.
Source: Toulouse Volcanic Ash Advisory Centre (VAAC)
The Toulouse VAAC reported that during 4-5 February diffuse plumes, likely composed primarily of sulfur dioxide gas, were observed in satellite imagery.
Source: Toulouse Volcanic Ash Advisory Centre (VAAC)
During 27 January-2 February, the MODIS sensor aboard the Earth Observing System (EOS) satellite continued to frequently detect thermal anomalies from Nyiragongo, likely from lava lake activity. Based on analyses of satellite imagery, the Toulouse VAAC reported that during 30-31 January a diffuse plume drifted 240 km W.
Sources: Hawai'i Institute of Geophysics and Planetology (HIGP) Thermal Alerts Team; Toulouse Volcanic Ash Advisory Centre (VAAC)
According to a news article on 8 May, the air in the city of Goma, 18 km S of Nyiragongo, was thick with "volcanic dust." Residents reported seeing incandescent lava flowing from the summit crater at night. The article also stated that the scientist-in-charge of Goma Volcano Observatory (GVO) reported that significantly increased temperatures were measured around Nyiragongo and that larger-than-usual plumes of "volcanic dust" were being ejected. The news account did not mention any GVO statements about lava flows.
Source: BBC News
A recent report from Goma Volcano Observatory (GVO) noted a seismic swarm from Nyiragongo and Nyamuragira in January and increased seismicity along the East African Rift since then. Gas plumes from Nyiragongo were frequently emitted and contributed to acid rain that fell on inhabited areas. On 22 March, tremor was detected on nearby seismic networks. Scientists who visited the summit crater on 22 and 24 March observed active fumaroles along a fissure connecting the Shaheru (S flank) and Nyiragongo craters. Strong methane concentrations were detected. The lava lake level had dropped 20 m compared to 27 February. A small area of the lava lake was active and lava fountains were seen. The temperature of some fissures had increased by 4 degrees Celsius since 27 February.
Source: Observatoire Volcanologique de Goma (OVG)
Based on analysis of satellite imagery, the Toulouse VAAC reported a diffuse sulfur plume from Nyiragongo on 17 October. The plume may have contained some ash.
Source: Toulouse Volcanic Ash Advisory Centre (VAAC)
Based on analysis of satellite imagery, the Toulouse VAAC reported a diffuse sulfur plume from Nyiragongo on 9 September. The plume may have contained some ash.
Source: Toulouse Volcanic Ash Advisory Centre (VAAC)
Based on analysis of satellite imagery, the Toulouse VAAC reported that an eruption of unstated character from Nyiragongo occurred before 0300 on 2 September. The activity was not confirmed by ground observations. Nyiragongo's frequently active lava lake is often detected on MODIS satellite thermal imagery.
Source: Toulouse Volcanic Ash Advisory Centre (VAAC)
According to news articles, a tourist climbed over the rim of Nyiragongo on 6 July to photograph the lava lake and died after slipping and falling about 100 m. Intense heat and gas from the active lava lake made the recovery mission difficult.
Sources: Agence France-Presse (AFP); Reuters
On 13 November, a plume that may have contained some ash was emitted from Nyiragongo and seen on satellite imagery.
Source: Toulouse Volcanic Ash Advisory Centre (VAAC)
On 7 November a thin plume that may have contained some ash was emitted from Nyiragongo and seen on satellite imagery.
Source: Toulouse Volcanic Ash Advisory Centre (VAAC)
GVO reported that as of 28 October Nyiragongo remained very active, but stable. There was a permanently active large lava lake in the volcano's crater. A gas plume was emitted from the volcano and incandescence was visible at night several tens of kilometers from Nyiragongo. The Alert Level for the nearby city of Goma remained at Yellow.
Source: Observatoire Volcanologique de Goma (OVG)
A thin plume from Nyiragongo was visible on satellite imagery on 10 October. It was not confirmed by sulfur-dioxide data.
Source: Toulouse Volcanic Ash Advisory Centre (VAAC)
On 7 September, high-resolution satellite imagery showed a thin plume emitted from Nyiragongo. The plume was not confirmed by other types of data.
Source: Toulouse Volcanic Ash Advisory Centre (VAAC)
During 29 November to 12 December, volcanic activity at Nyiragongo remained at relatively high levels. Nearly continuous high-amplitude tremor was recorded at all seismic stations on the volcano. Observations of the crater area on 9 and 10 December revealed that the level of the lava lake remained stable in comparison to previous visits and that strong lava fountaining was present. Pele's hair and scoriae fell in the area around the volcano, gas plumes rose above the volcano, and strong incandescence was visible at night. The Alert Level at Nyiragongo remained at Yellow.
Source: Observatoire Volcanologique de Goma (OVG)
The Toulouse VAAC reported that faint sulfur-dioxide plumes from Nyiragongo were visible on satellite imagery on 8 and 10 December.
Source: Toulouse Volcanic Ash Advisory Centre (VAAC)
The Goma Volcano Observatory reported that during 10-17 November continuous volcanic tremor was recorded at all seismic stations located around Nyiragongo. Visual observation of the volcano's summit on 12 and 13 November revealed that the lava lake surface had widened considerably, with strong lava fountains. Numerous Pele's hairs and scoriae were seen on the cone's S, W, and N sides. A gas plume and incandescence were visible rising above the volcano. All fractures that opened during the 2002 eruption on the volcano's S flank had widened slightly and showed minor temperature increases.
During 18-29 November, continuous banded tremor at high amplitudes occurred beneath the volcano, but the amplitudes seemed to be lower that those recorded during 9-18 November. Visual observations at the summit on 25 and 26 November revealed a slight decrease in the level of the lava lake, although there continued to be strong lava fountains and a high flux in lava and gases. Pele's hair, scoriae, a gas plume, and incandescence were all still present. Measurements of the fractures on the volcano's slopes showed that they remained stable. The Alert Level at Nyiragongo remained at Yellow.
Source: Observatoire Volcanologique de Goma (OVG)
The Toulouse VAAC reported that an eruption began at Nyiragongo sometime earlier than 0700 on 22 November. A narrow SW-drifting plume was discernable on satellite imagery at a height of around 5 km a.s.l. A narrow plume was visible again on satellite imagery on 23 November at 1130, although no ash was identifiable.
Source: Toulouse Volcanic Ash Advisory Centre (VAAC)
The Toulouse VAAC reported that an eruption began at Nyiragongo sometime earlier than 0600 on 3 November. A thin W-drifting plume was visible on satellite imagery on 3 and 4 November at a height around 3.6-4.9 km a.s.l.
Source: Toulouse Volcanic Ash Advisory Centre (VAAC)
The Toulouse VAAC reported that on 28 September a thin, narrow plume emitted from Nyiragongo was visible on satellite imagery.
Source: Toulouse Volcanic Ash Advisory Centre (VAAC)
The Toulouse VAAC reported that satellite imagery showed a narrow and faint plume from Nyiragongo beginning at 0930 on 7 September. The plume may have contained ash, and was estimated to be at a height less than 5.5 km a.s.l. The plume was no longer visible by 1300 that day.
Source: Toulouse Volcanic Ash Advisory Centre (VAAC)
According to the Toulouse VAAC, an eruption began at Nyiragongo sometime before 0700 on 27 July. Satellite imagery showed that the plume produced from the eruption rose to between 3.6 and 4.9 km a.s.l.
Source: Toulouse Volcanic Ash Advisory Centre (VAAC)
According to the Toulouse VAAC, satellite imagery showed new eruptive activity beginning on 12 July that ended by the next day. Activity began again on 18 July around 0930, producing a plume to about ~5.5 km a.s.l. By the next day the plume was no longer visible on satellite imagery.
Source: Toulouse Volcanic Ash Advisory Centre (VAAC)
Satellite imagery showed that ash emissions from Nyiragongo that began on 4 June appeared to have ceased by 22 June.
Source: Toulouse Volcanic Ash Advisory Centre (VAAC)
During 9-15 June, ash from Nyiragongo was sometimes visible on satellite imagery below ~5.5 km a.s.l. drifting WSW.
Source: Toulouse Volcanic Ash Advisory Centre (VAAC)
On 4 June a new eruption began at Nyiragongo, producing a plume that probably contained ash, was under ~6 km a.s.l., and stretched ~150 km SW. By 5 June the plume had extended to 185 km SW and was under ~4 km a.s.l. On 6 June, only a moderate plume stretching to the SW and a disconnected remnant of the earlier plume was observed in satellite imagery. This moderate plume drifting SW remained through 7 June. On 8 June an ash plume extended ~75 km SW at an altitude of ~5.5 km a.s.l.
Source: Toulouse Volcanic Ash Advisory Centre (VAAC)
The Toulouse VAAC reported that during 26 May to 1 June there were weak but steady emissions from Nyiragongo and neighboring Nyamuragira (~13 km NW from Nyiragongo). The Goma volcano observatory confirmed that ash fell within a radius of 60 km of both volcanoes.
Source: Toulouse Volcanic Ash Advisory Centre (VAAC)
The Toulouse VAAC reported that satellite imagery showed a weak eruption of Nyiragongo on 21 May. Activity intensified during the evening of 24 May. By the evening of 25 May, the volcano was no longer visible on satellite imagery due to meteorological clouds in the area.
Source: Toulouse Volcanic Ash Advisory Centre (VAAC)
GVO reported that in December activity at Nyiragongo remained at relatively low levels, with the constant presence of an active lava lake inside the crater. The Alert Level remained at Yellow.
Source: Observatoire Volcanologique de Goma (OVG)
On 2 and 3 May a dense ash plume was visible from the town of Goma rising above Nyiragongo. Continuous ash fall occurred in many villages close to the volcano, and permanent tremor and long-period earthquakes were recorded. During a visit to the volcano during 6 and 7 May scientists saw that the lava pool in the crater was very active, with violent gas outbursts, projection of spatter and surges, and lava splashing the walls of the pit. Occasionally, large (~ 50 m high) flames were hurled from the vents. SO2 emission rates were relatively high during 1-6 May, with the largest emission (~50,000 tons) occurring on 3 May. According to the Toulouse VAAC, a possible ash cloud was visible on satellite imagery on 12 May that remained at a height below 6 km.
Sources: Observatoire Volcanologique de Goma (OVG); Toulouse Volcanic Ash Advisory Centre (VAAC)
UN peace keepers in the Democratic Republic of Congo provided volcanologists an early May helicopter flight. This presented very clear views of Nyiragongo, including the scene inside the active crater. Viewers reported seeing a significant plume containing gas and ash rising high above the volcano. Such activity is typical at Nyiragongo, with its restless lava lake. The lake's molten surface appeared slightly larger than when seen during a field excursion to the crater rim during 22-24 April. The field excursion measured the plume at 5-6 km a.s.l. The also noted 5 distinct vents, almost continuous emissions of scoria, an agitated molten-lake surface that included emerging gas, and splashing lava thrown 50-60 m high. Occasional waves of lava rolled across portions of the crater floor and walls. Excursion members also witnessed crater-wall collapses taking place along the NW and S fracture zones. Widely felt earthquakes also continued in the region, presumably related to extension along the massive East African rift system.
Sources: Observatoire Volcanologique de Goma (OVG); The Open University Volcano Dynamics Group
During a visit to Nyiragongo during 18-19 March, GVO scientists observed a thick plume engulfing the crater. Two possible emission points were noted; one was related to powerful lava and ash emissions, and the other was related to a much weaker white-pink plume. An inner active cone was visible in the crater and was at least 200 m in diameter. The cone morphology seemed to differ from when it was last seen during 26-27 February. Lava fountains rose to maximum heights of 150-200 m and as low as 50 m. Scoria ejection made observations difficult at times. Several permanent fumaroles, also observed during the previous visit, were seen in the crater.
Source: Observatoire Volcanologique de Goma (OVG)
The Toulouse VAAC reported that on 6 March at 0900 a cloud probably containing ash was visible on METEOSAT satellite imagery extending ~185 km W of Nyiragongo. By 1200 ash was no longer visible.
Source: Toulouse Volcanic Ash Advisory Centre (VAAC)
The level of volcanic activity at Nyiragongo as of 27 February was lower than during previous weeks when fine ash and Pele's hair fell in the city of Goma. Winds were no longer blowing ash and Pele's hair to the S, therefore Goma and other cities S of the volcano were no longer affected by tephra fall. Pele's hair and/or ash fell SW of Nyiragongo in the village of Rusayo, affecting the water supply. Residents of villages around the volcano reported seeing incandescence atop Nyiragongo during the evening. While visiting Nyiragongo's crater on 25 and 26 February, scientists found that the interior of the crater had changed since their last visit on 4 and 5 February. Vegetation had died in the main crater and heavy ashfall had occurred on the S flank. During the evening they saw intense lava fountaining, with lava reaching probably more than 100 m high, and a storm of Pele's hair.
Source: Observatoire Volcanologique de Goma (OVG)
Beginning around 10 February volcanic activity increased at Nyiragongo. Fine ash covered cars in the city of Goma and at 1142 a long-period earthquake occurred for more than 2 minutes that was followed by several small events and an increase in tremor amplitude. Residents near the volcano noticed an increase in plume height, a change in plume color from white to black, and a sustained rain of ash and Pele's hair. As of the 14th, Pele's hair continued to fall in Goma and an ash plume was visible rising at least 5 km above the crater. At this time seismicity was probably lower than the previous week. GVO stated that the Pele's hair that fell in Goma was produced by lava fountaining inside Nyiragongo's crater. Residents in Goma and surrounding villages experienced a water shortage due to the contamination of rain water, which is their only source of water.
According to the MODIS Thermal Alerts website, thermal alerts have been visible at Nyiragongo every month since June 2002. Two alert pixels were visible at the volcano on 13 February.
Sources: Observatoire Volcanologique de Goma (OVG); The Open University Volcano Dynamics Group
During a flight over Nyiragongo on 27 September, researchers' views into the crater were obscured by a large gas plume. The plume was present from mid-September through at least 10 October and reached to ~3 km above the volcano. During some nights from late September to 10 October, red glow reflecting off of the cloud was visible from towns near the volcano. The glow was caused by Strombolian explosions and the light emitted by the combustion of gases. While visiting the volcano during this time period, researchers heard loud noises emanating from the crater, and saw that volcanic material was ejected ~150 m vertically and no lava lake was visible. On 6 October they heard a partial wall collapse in the internal crater.
Source: Observatoire Volcanologique de Goma (OVG)
A helicopter flight over Nyiragongo on 1 August revealed a thick, dense plume rising from the crater at a high velocity. The inner crater was completely filled with dispersed gas, preventing visibility of any fresh lava that may be in the crater. No red glow has been seen during recent nights, but the permanent sustained tremor recorded on all stations confirmed that the volcano remained active with magma moving beneath it. Some individual shocks were recorded around the SW flank of Nyiragongo. The Alert Level remained at Yellow.
Source: UN Office for the Coordination of Humanitarian Affairs (OCHA)
Scientists were able to see Nyiragongo's crater on 27 July after 2 weeks without observations. They found that a very large white plume, which rose almost 3 km above the volcano, was being emitted from a small spatter cone inside the main crater. Lava was visible inside the spatter cone. They also noted a very active lava lake inside the main crater that was smaller than they expected it to be based on the size of the plume. While authorities did not order the evacuation of towns near the volcano, news articles reported that aid workers prepared emergency items such as makeshift shelters in case a large eruption occurs.
Sources: UN Office for the Coordination of Humanitarian Affairs (OCHA); Reuters; Associated Press
During the previous several weeks, long and significant episodes of volcanic tremor had been recorded at several seismometers near Nyiragongo. Inclement weather conditions prevented visual observations of the volcano from the city of Goma. A team that climbed the volcano on 16-17 July observed a plume rising above the volcano and smelled SO2. Around 1800 on the 16th, lava fountains were observed rising ~100 m above the crater floor. During the night, large amounts of ash continuously fell on the upper part of the volcano. By morning, ash fall had ceased and a white plume rose above the crater. Observers could not see the bottom of the crater clearly, but due to visible activity on the lower and central parts of the crater they suspected that a new lava lake had formed.
Sources: Observatoire Volcanologique de Goma (OVG); UN Office for the Coordination of Humanitarian Affairs (OCHA)
On 17 January 2002, during the eruption of Nyiragongo, all lava drained from the volcano's summit, leaving a 700-m-deep empty crater. In late April harmonic tremor began to be registered at two seismic stations on Nyiragongo's S flank, and increased irregularly in amplitude until mid-May. Anomalous clouds had been noticed above the crater twice since 1 May, but no incandescence had been visible at night. No eruptive activity was visible 14 May during an overflight, but increasing tremor amplitude suggested that magma was moving within the summit area. On 17-18 May a small lava fountain was seen on the floor of the crater along the same fissure that apparently drained the crater in January. The lava fountain was 12 m high, no lava lake was forming in the crater, and small incandescent vents on the crater floor ejected hot gases. The Goma Volcano Observatory stated,"this is a normal development in Nyiragongo's historical eruptive pattern, and is no cause for immediate concern."
Source: Observatoire Volcanologique de Goma (OVG)
According to the UN Office for the Coordination of Humanitarian Affairs (OCHA), several earthquakes were felt by the population near Nyiragongo on 28 and 29 January. The earthquakes ranged in intensity from small to large. No volcanic tremor, indicating magma movement, was recorded. On 29 January heavy rain caused large amounts of steam to rise from cooling lava. The increase in steaming led to several false reports of renewed volcanism. The pH of Lake Kivu was measured to be the same as prior to the 17 January eruption. The volcano remained at Alert Level Yellow (second lowest on a four-color scale).
Sources: ReliefWeb; UN Office for the Coordination of Humanitarian Affairs (OCHA); US Agency for International Development / Bureau for Humanitarian Assistance
During 23-29 January there was no new volcanic activity at Nyiragongo. During 23 to around 25 January many earthquakes occurred in the region around the volcano; the largest earthquake was M 4.7. Many of the earthquakes were felt in towns near the volcano, including Goma, ~10 km S of the volcano. Several buildings were destroyed by the seismicity in towns near Nyiragongo, including Gisenyi, Rwanda. By 28 January seismicity had decreased and earthquakes were not large enough to be felt by the population.
Volcanologists determined that ash observed in Goma on the 23rd originated from the collapse of Nyiragongo's inner crater and not from a new eruption from neighboring Nyamiragira, as was originally stated in several news reports. During a visit to Nyiragongo's main crater on 28 January, the UN Volcano Surveillance Team found that the crater floor had almost completely collapsed more than 600 m. In addition, they saw neither ongoing volcanism nor fumaroles at the bottom of the crater, although they could smell SO2. A few weak steam vents were visible on the inner crater wall and a small gas plume was seen above the crater rim to the NE. On the 28th the volcano was at Alert Level Yellow (second on a four-color scale). The latest information about the Alert Level can be obtained from the Humanitarian Information Center's telephone hotline (084 84901) during the hours of 0800-2200.
Sources: US Agency for International Development / Bureau for Humanitarian Assistance; UN Office for the Coordination of Humanitarian Affairs (OCHA); Agence France-Presse (AFP); ReliefWeb
According to reports from news and government agencies, the eruption at Nyiragongo that began on 17 January appeared to have stopped by 21 January. During the eruption lava flowed from fissures on the volcano's S and E flanks, moving towards the S. Lava flows cut directly through the city of Goma (~10 km S of the volcano) and continued onward to enter Lake Kivu. A 100-m-wide delta formed where lava entered the lake. Various reports estimated that lava flows had destroyed 25-75% of the city including ~10,000 homes. The buildings at the Goma airport remained intact, but lava covered ~80% of the airstrip rendering the airport inoperable.
Residents of Goma were evacuated after the eruption was underway. Reports of the number of deaths and injuries vary; most reports state ~45 people died, possibly as a result of remaining in their homes which burned or collapsed. In addition, 50-100 people were killed when hot lava caused gas station tanks to explode at 0830 on 21 January. A total of ~400 people suffered from injuries including burns. Beginning around 19 January many Goma residents returned to the city; field reports from USAID/OFDA staff stated that on the morning of the 20th more than 15,000 people per hour returned, while only 3,000 people per hour fled the city. By the 21st there were ~12,000 homeless families in Goma.
Press accounts indicated that volcanologists tentatively suggested that Nyiragongo's volcanism was due to seismicity producing fissures up to several km in length along the E African rift, allowing magma to reach the surface. After observing the volcano on 21 January volcanologists stated, "The current phase of the active eruption is finished. The volcano is quiet." Although no new lava flows were threatening the city, some scientists feared that lava entering the lake or seismic activity could perturb the lake sufficiently to release significant amounts of carbon dioxide and methane gas lying at the bottom of the lake. On the other hand, news interviews quoted Jaques Durieux, a French volcanologist working with the UN, as saying, "There is no reason for the methane and carbon dioxide to rise to the surface."
According to Bruce Presgrave of the USGS, National Earthquake Information Center there have been an unusual number of tectonic earthquakes in the Goma-Nyiragongo region since ~9 hours after Nyiragongo's alleged initial lava flows at 0500 local time on 17 January. The sequence included ~100 earthquakes of M 3.5 or larger. The largest earthquake to date was M 5; it struck around 1.76°S, 29.08°E at 0014 on 20 January. According to news reports, several earthquakes were of sufficient magnitude to have been felt in the Goma region.
As of 22 January, no new lava flows had been reported, although lava slowly flowed into Lake Kivu and seismic activity continued. In addition, analysis of lake chemistry found the city's main water supply had remained potable.
Sources: UN Office for the Coordination of Humanitarian Affairs (OCHA); US Agency for International Development / Bureau for Humanitarian Assistance; ReliefWeb; US Geological Survey Earthquake Hazards Program
18 January Update
The following information is based on preliminary reports from various government and news agencies that were received during the ongoing crisis. An eruption began at Nyiragongo on 17 January and, according to news reports, as of 18 January lava flows had destroyed parts of 14 villages and 45 people had been killed. Some reports state that the eruption began at 0500 local time. Other reports state that probably around mid-day, fissures N of the Goma Airport opened and lava flowed from them at an estimated 2-3 m/min (1.2-1.8 km/hour) towards the town of Goma, ~10 km S of the volcano. Eruptions occurred on the volcano's S and E flanks. By late afternoon, at least one flow had advanced into Goma. At this time tremor with 5-second durations accompanied the lava flows about every 10 minutes. Gas stations exploded as the flows advanced through Goma, cutting a reported 35-70 m swath through the town on its way to Lake Kivu. In places, the lava flows were 2 meters high and 30 m wide.
The lava flows damaged 14 villages as they destroyed everything in their paths including, buildings, homes, and the port in Goma. The population of Goma (~400,000 people) and surrounding areas evacuated with some moving W on the road toward the town of Sake, while the majority of the population reportedly moved E towards Rwanda to the town of Gisenyi. According to news reports, United Nations officials reported that 45 people had been killed by the eruption as of 18 January. A Goma resident stated that by the morning of 18 January tremor had died down to "about one every 40 seconds to one an hour." Also, lava continued to flow, but was no longer a threat to the road linking Goma with Rwanda.
Sources: CNN; US Agency for International Development / Bureau for Humanitarian Assistance; Reuters; Associated Press; Agence France-Presse (AFP)
The Goma Volcanological Observatory reported that there may be renewed volcanic activity at Nyiragongo volcano, ~10 km SE of Nyamuragira volcano. The observatory stated that during the current eruption of Nyamuragira the temperature increased in Nyiragongo's main cone and Shaheru fissure, ~3 km S of the summit. In addition, new fumaroles were observed inside Nyiragongo's main crater and along the fissure connecting the main crater and Shaheru cone. Cracks that were observed in the crater of the main cone suggested that dilatation of the crater had occurred.
Source: Observatoire Volcanologique de Goma (OVG)
Reports are organized chronologically and indexed below by Month/Year (Publication Volume:Number), and include a one-line summary. Click on the index link or scroll down to read the reports.
Red glow seen on 24 December 1970
Card 1127 (11 February 1971) Red glow seen on 24 December 1970
"On 24 December 1970 a red glow could be seen on the top of the Nyiragongo Volcano. This phenomena has been very irregular and nothing more pyrotechnik has ensued.
"On 9 January 1971 at 0745 GMT a mild earth tremor was felt in Gisenyi, on the northern shores of Kivu Lake, western branch of the rift valley in Central Africa."
Information Contacts: Sergio Bottazzi, Gisenyi, Rwanda.
Lava lake remains active and rising; recent seismicity
Card 1163 (30 March 1971) Lava lake remains active and rising; recent seismicity
"The continuing survey of Nyiragongo, carried out by the geophysical and seismological departments of the of the 'Institut pour la Recherche Scientifique en Afrique Centrale' (IRSAC) shows that the lava lake in the interior of the crater has risen with a velocity of about 40 m per year since 1968. A red glow over the volcano was seen several times in Goma and vicinity during the night within the last year, and is caused by small lava flows filling up the lake. The temperature of the outflowing lava (fissures in the northern and western part of an islet in the lava lake) was measured and is 920-950°C. The whole lava mass produced during the past two years is about 27 million cubic meters. The 'crag,' the islet in the lava lake, is already partially molten.
The seismological network of IRSAC, situated along the Western Rift Valley, includes also the volcanic region. On 21 December 1970, 14 volcanic shocks (magnitude about 1) and two volcanic shocks (magnitude about 2) were recorded by these stations. On 24 December 1970, only 10 shocks (magnitude about 1) were recorded. The average number of volcanic shocks is eight per day with a magnitude of about 1.0. No correlation between volcanic seismic activity and the reported activity could be shown."
Information Contacts: K. Bram, Seismological Dept., Institut pour la Recherche Scientifique en Afrique Central, Bukavu, Democratic Republic of the Congo.
Effusive eruption from numerous vents within the summit crater
Card 1361 (02 March 1972) Effusive eruption from numerous vents within the summit crater
"At the volcano Nyiragongo, a new intracrateral eruption took place between 28 January and 1 February 1972. Ten eruption vents were visible on the evening of the 29th, on the new second platform. They are distributed in a circle, 320 m in diameter. This fire circle is vertically above the perimeter of the old third pit. The activity is in the S, W, and NE. The inactive east and southeast region corresponds with the position of the old crag which has been covered since July 1971. The active points consist of six spatter cones of 3-10 m in height, and of four lava fountains, without deposits, one of which is stronger and emits molten lava to a height greater than 20 m. One is of medium size, and two are smaller. The activity is essentially effusive. The lava flows appear to cover all of the lower platform of 640 m., and the lava which flows into the middle of the active circle forms a temporary lava lake.
This eruption is a continuation of those mid-January (1972), the end of December (1971), beginning of December and mid-November (1971), etc. which took place at an average of 20 days. The level of the lower platform, raised with each eruption, has now reached 15 m. below the higher platform. If the rate of activity is maintained, one could expect the lava to cover the first platform by the end of April, or the beginning of May 1972. The volume of lava emitted since 1966 is in the order of 40,000 m3, corresponding, in spite of the sensation of the eruptions, to rather weak activity. The seismological recordings at IRSAC showed no important volcanic shocks at the time of Nyiragongo's eruption period. The weak increase of microseisms is not significant in the present state of our knowledge of the seismicity of the Virunga."
Information Contacts: A. Pouclet, Dept. of Geology, Institut pour la Recherche Scientifique en Afrique Central, D.S. Bukavu, Republic of Zaire.
Intermittent activity through mid-April
Card 1396 (30 May 1972) Intermittent activity through mid-April
"Since the eruption of 28 January 1972, the activity of Nyiragongo was normal with new eruptions on 18-23 February and 5-9 March 1972. During this latest eruption, some overflowing lava reached the upper edge of the first platform for the first time.
"On 3 April, after a new eruption, the level of the lower platform was 4 or 5 m below the upper one. After a brief lull of hardly one week, breaking the usual rhythm, the activity began hotly at three main points of the fire circle: two joined spatter cones to the south, one spatter cone to the W, and four or five spatter and cinder cones to the N and NE forming an elongated edifice.
"The lava was pouring out of the fire circle on the lower platform which was raised to within 3 m of the upper one, and the lava rose up this small wall covering the upper platform almost uniformly with a wide, thick overflow of 20-30 cm. After this, all of the central part of the fire circle sunk by about 20-25 m.
"This important event is the starting point of a new cycle of activity. During the last part of the activity, strong volcanic shocks were recorded in the seismological stations of the IRSAC."
Information Contacts: A. Pouclet, Dept. of Geology, Institut pour la Recherche Scientifique en Afrique Central, D. S. Bukavu, Republic of Zaire.
Effusive eruption towards the SE engulfs two villages; significant number of deaths
Nyiragongo began erupting at about 1000 on 10 January, apparently from several flank craters. The eruption was primarily effusive, but a mushroom cloud was reported by the Brussels Domestic Service. Lava flows, mainly on the volcano's SE flank, are reported to have moved as much as 16 km from the volcano, engulfed two villages, and cut several roads. The eruption had probably ended by 11 January.
Earthquakes were felt in Bukavu, ~125 km SE of Nyiragongo, on 1 and 6 January. Most of the 65,000 residents of Goma, 12 km S of Nyiragongo, fled prior to the eruption because of "incessant" earth tremors. By the night of 10-11 January, many were returning to their homes. The 23 December eruption of Nyamuragira, 14 km NW of Nyiragongo, had apparently ended. Estimates of casualties range from none to 2,000, the latest (26 January) being 50-100.
Information Contacts: Kigali DNS, Rwanda; Reuters; AZAP, Zaire; Brussels DNS; UPI; U.S. Dept. of State.
Additional details about 10 January fissure eruption
Activity at Nyiragongo began in early December 1976, when the lava lake rose and covered half of the first platform. Premonitory seismic activity was noted from December 11 (see above description of Nyamuragira activity, 14 km NW of Nyiragongo). The eruption began from five fissure vents at about 2,200 m elevation on the SE flank. Four lava flows were extruded, to the S, SE, SW, and NE. The latter flow blocked a major road, preventing supplies from reaching the area. About 100-150 hectares of land and 400 houses were destroyed by the flows. Estimates of deaths range from 38-60.
Information Contacts: U.S. Dept. of State; S. Ueki, IRS.
Investigation shows that lava lake drained through flank fissures
At 1015 on 10 January, Nyiragongo's lava lake, present in the main crater since 1928, began to drain rapidly through a system of parallel fissures that opened simultaneously on the N (Baruta) and S (Shaheru and Djoga) flanks of the volcano (figure 1). Within 1 hour, 20-22 x 106 m3 of melilite nephelinite lava poured from the fissures. The flows, which moved downslope at up to 60 km/hour, were pahoehoe type for most of their length, but changed to aa at their distal ends. Mean flow thickness was about 1 m, ranging from a few mm near the fissures to about 2 m at flow fronts (figures 2 and 3). No spatter ramparts or hornitos were observed. About 70 persons were killed and 800 left homeless by the lava, which destroyed about 1,200 hectares of agricultural land.
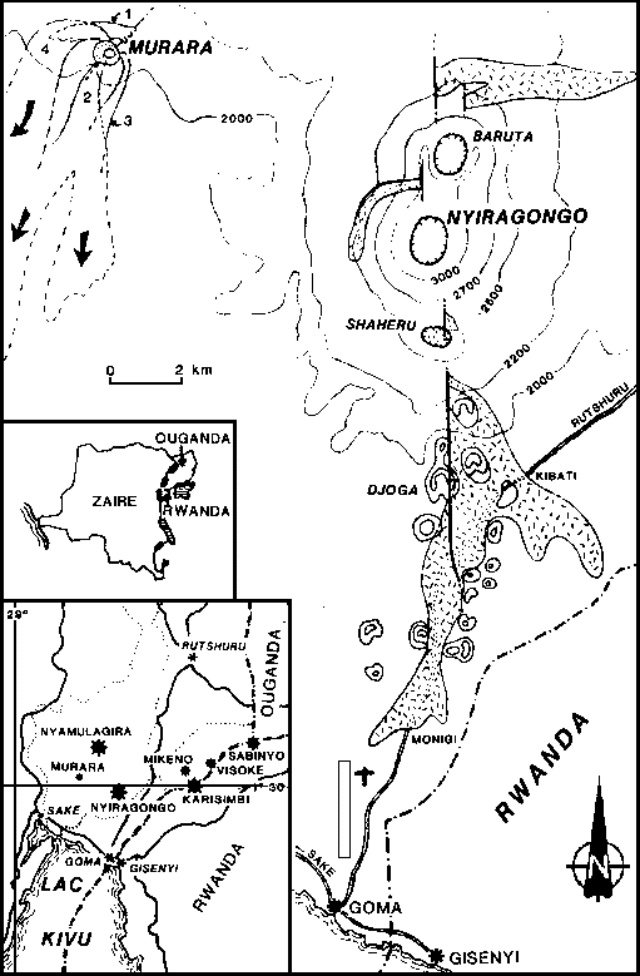 |
Figure 1. Map of eruption sites and lava flows at Nyiragongo and Nyamuragira's 1977 Murara vent. The location of the stippled flow on Nyiragongo was provided by M. Krafft. Courtesy of Y. Pottier. |
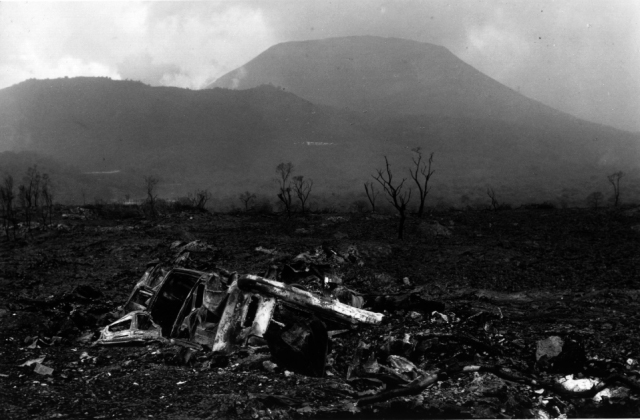 |
Figure 2. Nyiragongo (background) and the 10 January lava flow with destroyed vehicle (VW Combi) in foreground. Photograph by M. Krafft. |
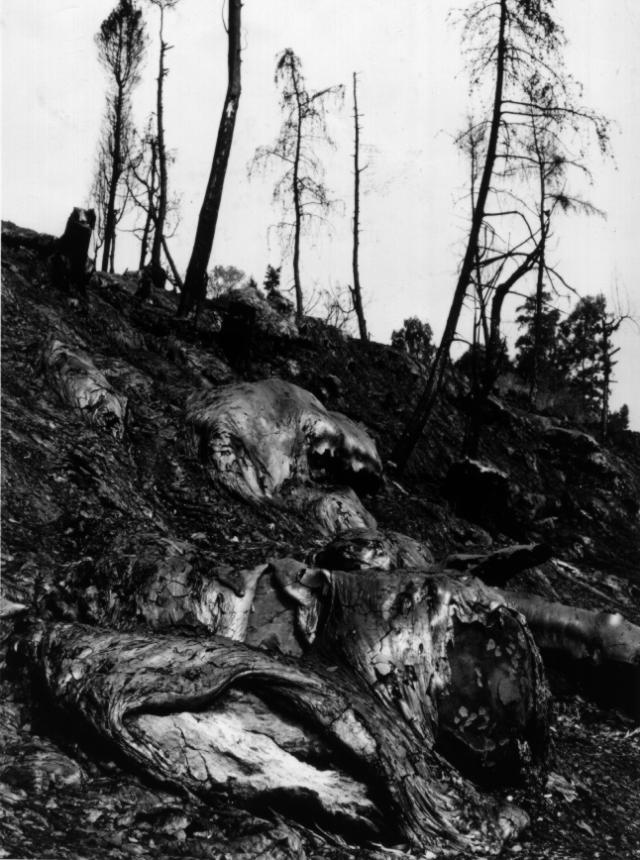 |
Figure 3. January 1977 Nyiragongo pahoehoe lava, with flow texture showing its extreme fluidity. Photograph by M. Krafft. |
Five days before the eruption, the lava lake had risen to its highest recorded level, partially covering the terraces which had surrounded it. The rapid draining of the lava lake caused the partial collapse of the terraces, where groundwater flashed to steam, producing a dark gray cloud that rose more than 1 km before being blown towards Goma. Goma was plunged into semi-darkness and most of its residents fled to neighboring Rwanda.
Seven hours after the eruption began, lava effusion had completely ended, but fumarolic activity continued. At 1500 on 16 January, a strong gas eruption from the main crater projected a cloud containing little or no solid material to about 1 km above the volcano. At 1550, earthquakes felt on the crater rim preceded the collapse of what remained of the terraces, terminating major gas emission. Weak fumarolic activity persisted. The crater, with a bottom filled with debris, was ~1,200 m in diameter and l,000 m deep after the 16 January events.
Further References. Nakamura, Y., and Aoki, K., 1980, The 1977 eruption of Nyiragongo volcano, eastern Africa, and chemical composition of the ejecta: Bulletin of the Volcanological Society of Japan, v. 25, no. 2, p. 17-32.
Pottier, Y., 1978, Première eruption historique du Nyiragongo et manifestations adventives simultanées du Volcan Nyamulagira (Chaine des Virunga-Kivu-Zaire: Decembre 76-Juin 77): Musée Royal de l'Afrique Centrale (Tervuren, Belgium): Rapport Annual du Département de Géologie et de Minéralogie (1977), p. 157-175.
Tazieff, H., 1976/7, An exceptional eruption: Mt. Nyiragongo, January 10th, 1977: BV, v. 40, p. 189-200.
Information Contacts: H. Tazieff, Paris; M. Krafft, Ensisheim; Y. Pottier, IRS.
Photographs of 10 January lavas
[No report accompanied the photographs originally in this issue, so they have been placed in the preceeding report of the 10 January 1977 activity.]
Information Contacts: M. Krafft, Ensisheim, France.
Fountaining feeds new lava lake
Lava fountaining began 26 June in Nyiragongo's central crater and by 7 July a lava lake covered the crater floor. No activity had been reported at Nyiragongo since the lava lake drained on 10 January 1977. On 26 and 27 June, two 5-10 m-high lava fountains were observed at the bottom of the crater. By 30 June, only one fountain was active, feeding a very small lava pool. However, when a geologist climbed to the crater rim 7 July, a lava lake about 1/2 km across covered the crater floor. In the center of the lake was a domical lava fountain 30-50 m high and 150 m in diameter. The fountain and the rim of the lake were bright orange, a color similar to that seen during periods of vigorous fountaining before 1977. About 1/3 of the lake was covered by a fissured black skin. Based on comparisons with known pre-eruption features in the crater, the lake level was estimated to have risen 100-150 m between 26 June and 7 July. Most of the lava seemed to be entering the lake from below, but a very small amount of lava was emerging from a 10-m-diameter vent in the N wall of the crater, about 50 m above the lake surface. This vent had apparently been more active a few days earlier. From Goma, 17 km to the SSW, a glow was still visible over the crater 13 July. Earthquakes felt during the night of 4-5 July shook furniture and formed fissures in old houses in Goma.
Information Contacts: M. Krafft, Ensisheim.
New details on eruption; lava lake rise slows
The eruption began between 0400 and 0430 on 21 June when an explosion was heard. A vent on the NW wall of the crater ~10 m above the floor in a mass of fallen rock (A in figure 4) was fountaining lava to 50 m. Lava was flowing from the vent and forming a small lake in the crater bottom, which had been ~800 m below the rim before the eruption. By 1400 a high, wide, pine-tree-shaped column of white vapor was visible over the crater. The initial period of eruption was apparently phreatic, and was accompanied by continuous explosions.
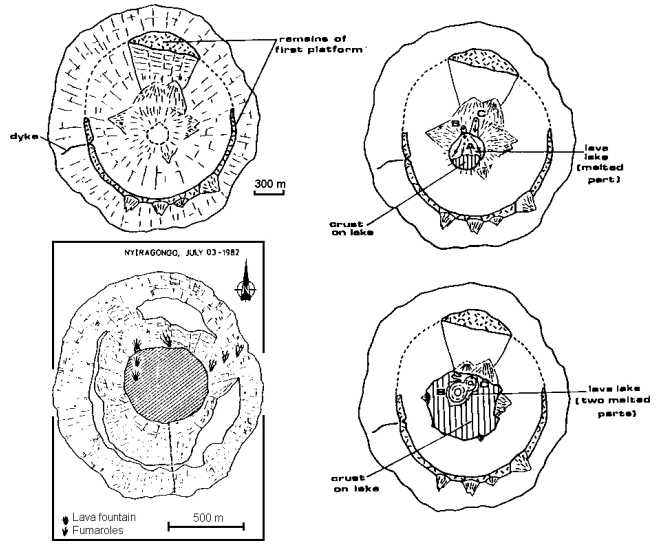 |
Figure 4. Sketch maps of Nyiragongo's crater: top left, May 1982, before the eruption; top right, 26 June, showing the initial vent (A) now submerged, two new vents (B and C) N of it, and the crust on the S part of the lava lake; bottom left, 3 July, with the first of the new vents also submerged by the lava lake (diagonal pattern)- sites of lava fountaining and fumarolic activity are indicated; bottom right, 23 July with all 3 vents submerged- most of the lava lake is crusted over, but there are two upwellings. Map at bottom left is from N. Zana; others are from M. Krafft. |
When observers visited the crater on 26 June (figure 4, top right), the lava lake was ~250 m wide; its surface was 730 m below the crater rim. The initial vent had been submerged, and the lava lake surface was domed 20 m high over it with a 10-m-high fountain in the dome's center. Two new vents were active (B and C, top right), one about 60 m above the lake level and N of the now-submerged vent, the other, bright red inside, 220 m above the lake level and NE of its companion. Both had formed hornitos, and were steaming vigorously and ejecting lumps of fluid lava. A 15-m-wide lava flow descended from the first new vent, a 60-m-wide flow from the second. The flow surfaces were chilled but lava was moving through the tubes into the lava lake. Narrow streams of fluid red lava were running over the surface of the second flow into the lake. The S half of the lake, already chilled, was covered by a fissured black crust. The N half had a moving, striped gray skin, the movements starting where the flow from the first new vent entered the lake.
The lake level continued to rise by several meters per day, and by 30 June was 680 m below the crater rim and ~300 m wide. The bubbling dome of the submerged vent was not visible. All of the central and S parts of the lake were covered by a fissured black crust. The first new vent, now only a few meters above the lake level, was fountaining lava to 50 m and emitting a lava flow that entered the lake from the NE. The second new vent was 170 m above the lake level, still red inside and steaming strongly, but had no lava flow. The edge of the lava lake was molten, and bright orange at night.
The activity of the original vent had ceased by 3 July (figure 4, bottom left). The first new vent had built a cone about 50 m high since it became active. Observers on 4 July found the first new vent submerged and forming a large domical lava upwelling about 100 m in diameter and 10-20 m high in the N-central part of the lake. The rest of the lake surface was covered with a fissured black crust. The second new vent was steaming and sometimes emitting yellow flames; it had no lava flow.
The lava lake surface lay 550 m below the crater rim and was 500 m wide on 7 July. The domical lava upwelling over the submerged first new vent was 160 m in diameter and 30-50 m high. Concentric fluid lava waves traveled from the dome's center to its edge; lava tongues overflowed to the E and S onto the 2/3 of the lake that was covered by crust. The upwelling, the tongues, and a thin line around the edge of the lake were bright orange at night. The second new vent stood 15 m high and was 40 m above the lake level. It was still steaming strongly and was bright orange at night.
During the next 10 days the lake continued to rise. The lava upwelling over the submerged, first new vent flattened and narrowed to about 120 m in diameter. By 15 July the second new vent was only 10 m above the lake level and had breached to the S. A small lava flow from it entered the lake; lumps of fluid lava projected around its cone. By 17 July the lake level was 510 m below the crater rim. The second new vent was submerged and making a second lava upwelling in the lake, about 100 m in diameter with a central fountain 40 m in diameter and about 20 m high. This upwelling had connected with the one over the first new vent.
By 23 July the lake level appeared to have slowed its rise. It was 500 m below the crater rim and 600 m wide. The NW part was occupied by the two active lava upwellings (figure 4, bottom right), the SW one 140 m in diameter with a 40 m-wide, 10-20 m-high bubbling in the center, the NE one 100 m in diameter with a 40-m-wide, 10-30-m-high bubbling in the center. The remaining 2/3 of the lake surface was covered by a fissured black crust. A line of moving red lava was visible along the W edge of the lake. Before the eruption, the crater bottom was about 300 m wide and covered with eroded lava blocks 30-40 m high. Lava had submerged all the blocks by 3 July, by 15 July the crater bottom was completely filled, and by 23 July the lake was 300 m deep. Maurice Krafft estimated the volume of lava emitted 21 June-23 July at 36 x 106 m3. When the volcano's lava lake drained in 1977, 22 x 106 m3 were emitted.
The eruption apparently was not preceded or accompanied by noticeable seismic activity. A seismic observation on 3 July showed continuous harmonic tremor, interpreted as lava rising in the conduit. Precursor events that were observed included fumarole activity in the crater and along showing the initial and the southern fissure, which had increased significantly since January, and an apparent 100-150 m uplift of the crater bottom.
Information Contacts: M. Krafft, Cernay; N. Zana, IRS.
Lava lake level high, but growing at slower rate
By 23 July, lava from several vents had formed a lake about 300 m deep with an estimated volume of 36 x 106 m3. By mid-September, the volume of the lava lake had approximately doubled, but the eruption rate was declining slowly (table 1).
Table 1. Daily eruption rates at Nyiragongo over various time periods between 21 June and 15 September 1982. Calculated by M. Krafft.
| Dates | Eruption Rate (x 106 m3/day) |
| 21-26 Jun 1982 | 0.2 |
| 27-30 Jun 1982 | 0.6 |
| 01-07 Jul 1982 | 2.5 |
| 08-21 Jul 1982 | 1.0 |
| 21-31 Jul 1982 | 0.5 |
| 01 Aug-15 Sep 1982 | 0.4 |
Geologists climbed to the crater rim on 31 July, 4 and 17 August, and 3 and 15 September. Between 24 and 31 July, the level of the lake surface rose about 20 m. On 4 August, however, the domical upwellings of lava that had marked the location of the 2 vents beneath the NW part of the lake on 23 July were not active. The entire surface of the lake was chilled and no glow was visible. On 17 August, an area of upwelling about 100 m in diameter and 10 m high was again active over one of the vents. A geologist descended to the surface of the lava lake 3 September and took samples. In hand specimen, these appeared to have a composition very similar to the melilite nephelinite of the 1928-1977 lake. A glowing red fissure that averaged about 30 cm wide and 20 cm deep ringed the lake ~2 m from its edge, emitting gases.
Between late July and 15 September, the lava lake continued to grow, raising its surface an additional 100 m to about 400 m below the highest point on the crater rim. The lake's average diameter on 15 September was 700 m, its depth was 400 m, and it contained ~70 x 106 m3 of lava. The zone of upwelling over the active vent was 250 m across and lava fountains reached a maximum height of 70 m. At the time of the 1977 eruption, the lava lake volume was ~20 x 106 m3 and the surface stood about 200 m from the crater rim. The surface of the more voluminous 1982 lava lake was roughly 200 m lower than that of the 1977 lake because morphological changes associated with the 1977 eruption considerably increased the volume of the crater.
Further References. Krafft, M. and Krafft, K., 1983, Le reapparition du lac de lave dans le cratère du volcan Nyiragongo de Juin a Septembre 1982 (Kivu-Zaire), histoire, dynamisme, debits et risques volcaniques: C.R. Acad. Sci. Paris, serie II, v. 296, p. 797-802.
Tazieff, H., 1984, Mt. Nyiragongo: Renewed activity of the lava lake: JVGR, v. 20, p. 267-280.
Information Contacts: M. Krafft, Cernay.
Lava lake active again after 11 years
[The following was extracted from a combined Nyiragongo/Nyamuragira report.] After approximately 11 years of quiet, eruptive activity from the summit crater of Nyiragongo began again on 23 June, feeding a new lava lake. This stratovolcano in eastern Zaire is ~18 km N of Goma, the city where the major encampment of Rwandan civil-war refugees is located (figure 5).
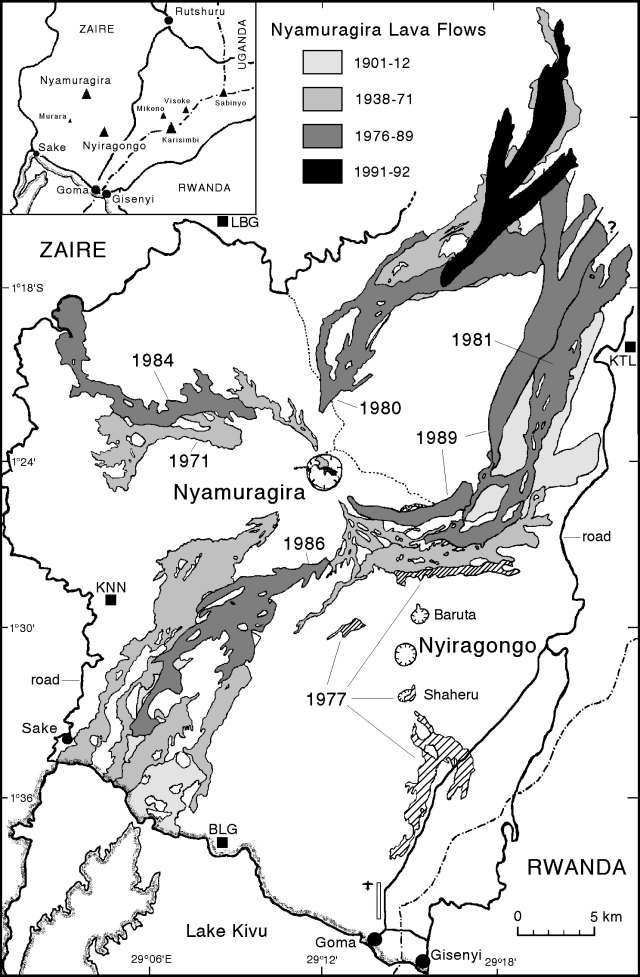 |
Figure 5. Map showing lava flows from Nyiragongo (1977; hatched) and Nyamuragira (1900-1992; shaded). Political boundaries (dash-dot lines) and roads (heavy solid lines) are approximate and not intended to be definitive. Solid squares indicate locations of seismic stations. Dots show cities. Modified from maps provided by N. Zana. |
Several journalists reported red glow above Nyiragongo at night. A Dutch doctor who visited the summit . . . stated that a new crater had formed in the old lava lake and was emitting "black dust" and needle-like crystals that were 5-7 cm long. Another press report on 12 July quoted aid workers who described "spitting fire from parasitic cones and fissures" on Nyiragongo's slopes, but there have been no other reports of lava flows outside of the summit crater at Nyiragongo. Press reports through 24 July continued to mention volcanic "smoke" or "dust" falling in the refugee camps.
[TOMS data showing high SO2 values over the volcanoes was later interpreted to be from a nearly simultaneous eruption at Nyamuragira (see 19:07)]
Reference. Zana, N., Kasahara, M., Kasereka, M., Azangi, M., and Wafula, M., 1993, Surface deformations and seismic activities related to the 1991-1992 Nyamuragira eruption: IAVCEI, Canberra Meeting Abstracts, p. 127.
Information Contacts: H. Hamaguchi and M. Kasereka, Tohoku Univ; M. Akumbi, CRSN, Goma; N. Zana, Centre de Recherche en Géophysique, Kinshasa; J. Durieux, GEVA, Lyon, France; I. Sprod, GSFC; Reuters; AP; Agence France Press.
Lava lake activity produces strong red glow above crater
For four days around 14 July a dense steam-and-gas plume was visible from Goma, and red glow could be seen at night. An amateur video taken on an unknown day between 19 and 24 July included a 6-second partial view of the crater that revealed a large very active lava fountain roughly in the center of the crater. A large, flat spatter cone had been built, with a least three large openings in the walls and lava flows radiating from the openings. The entire lava lake was not active. The background was hidden by gases and clouds, making it impossible to determine the elevation of the lava lake surface. Following the 1982 activity, the surface was 400 m below the crater rim. A very strong red glow was again observed above the crater during the night of 29 July. Very little red glow was reported in early August.
Another eruption within the summit lava lake began at about 1900 on 10 August. Red glow above the summit could be seen from Goma during daylight as well as at night. Press reports also stated that "ash and dust" had been emitted from the volcano. The increased activity on 10-13 August and strong red glow visible from the refugee camps caused some concern among the refugees and relief workers.
Volcanologists from Zaire, Japan, France, and the USGS were all present in Goma from 19 to 23 August. The primary purpose of the USGS scientists was to evaluate the hazards posed to the ongoing relief operations in Goma, which contained more than one million Rwandan refugees and the large Zairian population. Specific hazards addressed included the threat of active lava flows to resettlement camps and infrastructure, the threat of volcanic ash to air relief operations, and the threat of CO2 accumulation to refugees in resettlement camps along the Goma-Sake road.
During the flight to Goma on 19 August, USGS volcanologists flew over and around the crater. Although the crater floor was clearly visible, no signs of activity were observed. However, during the pre-dawn hours on 20 August, strong red glow above the main crater could be seen. Early that morning the French Army flew USGS and French volcanologists to the summit. At that time the lava lake was very active, with fountaining of lava up to 40 m above the surface of the crater floor, estimated to be ~450 m below the crater rim. Seismograms from instruments operated by Zairan scientists clearly showed this eruptive activity. The eruption-related seismicity had ended by 22 August, and no additional red glow was noted. No activity was observed during an aerial inspection the next day, but red glow was again seen early on 24 August.
Information Contacts: H. Hamaguchi, Tohoku Univ; J. Durieux, GEVA; T. Casadevall and J. Lockwood, USGS; AP.
Seismicity associated with June-August activity
On the night of 22-23 June, glow above the central crater [indicated] a reactivation of the lava lake. A seismic station on the S slope of the volcano recorded a low-frequency microearthquake at 0232 on 23 June that may have coincided with the initial lava outburst; there were no felt earthquakes before this event. Long-period tremors recorded at Katale station ceased ~2 hours after the initial lava outburst. However, tremor activity increased significantly at 2355 later that same day.
A National Park team that visited the summit reported three active vents inside the crater, the northern-most of which had formed a small scoria cone. On 1 July, four lava fountains were active. Intense lava emission was accompanied by increasing tremor amplitude recorded at local seismic stations. Continuous activity lasted until about 17 July, but decreased notably after 4 July. Additional episodes of lava lake activity occurred during 13-15 August, 19-21 August, and from about 1920 on 25 August through the 29th. The rate of lava fountaining . . . seemed to be lower than that observed during 1982. Lava fountain heights of 30-40 m were also less than the 80-100 m heights reached in 1982. The level of the fresh lava lake was ~5-10 m below the 1982 lava lake height, and the lake was confined close to the central vent in an area of ~120-150 m.
Renewed lava lake activity was preceded by a general increase in amplitude and frequency of long-period volcanic earthquakes. Volcanic tremor and earthquake swarms were recorded on 5-9 January, 20 January, and 16 May 1994. Records from the S-flank seismic station (Bulengo) indicated increased seismicity in the SW Virunga area; the frequent volcanic tremor and microearthquakes recorded at this station were not recorded at other stations outside the Nyiragongo field. A seismic swarm on 5 January 1993 was dominated by A-type volcanic events with focal depths of <5 km. On 21 November 1990 a M 4.5 earthquake was centered on the S flank. This event, felt in Goma with an intensity of MM V-VI, resulted in cracked walls of several brick houses and the death of one woman caused by a falling concrete platform. There were several aftershocks, and tremor activity was recorded for several days.
Information Contacts: N. Zana, Centre de Recherche en Géophysique, Kinshasa.
Intermittent lava lake activity continues
Lava lake activity has continued . . . with intermittent strong red glow above the summit observed at night. Monitoring is done from a small observatory building located in Goma on the N flank of Mt. Goma, an old scoria cone near Lake Kivu . . . (figure 5). With the financial support of the Japanese government, the observatory has recently been supplied with electricity, furniture, a vehicle, and other items to make it more functional. Zairian technical staff and researchers from CRSN-Lwiro maintain the telemetered seismic system and interpret the data.
Intermittent active periods within the lava lake, observed several times each month, are characterized by a sharp increase in tremor intensity followed by a gradual decline. Tremor recorded from 8 November until 18 January (figure 6) revealed a change in mid-December from active periods of 4-6 days to more frequent active periods lasting 1-2 days. This change in the pattern of active periods is believed by Hamaguchi and others (1995) to reflect a change in the hydraulic pressure difference between the magmatic reservoir at depth and the summit reservoir (lava lake). A-type earthquakes recorded during November and December with clear P-phase onset times and moderate amplitudes were clustered along a NNW-SSE strike (figure 7), parallel to the direction of major fissures in the volcanic system. Focal depths for these events were ~15 km, indicating a relationship to the deeper tectono-magmatic activity (Hamaguchi and others, 1995).
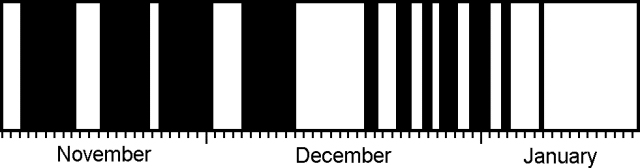 |
Figure 6. Pattern of volcanic tremor at Nyiragongo, 8 November 1994 to 18 January 1995. Solid areas indicate tremor-generating periods when the lava lake was active. Note the change from longer periods of activity in November and early December to shorter but more frequent periods in late December and early January. The tremor pattern for August-October 1994 is similar to November. Modified from Hamaguchi and others (1995). |
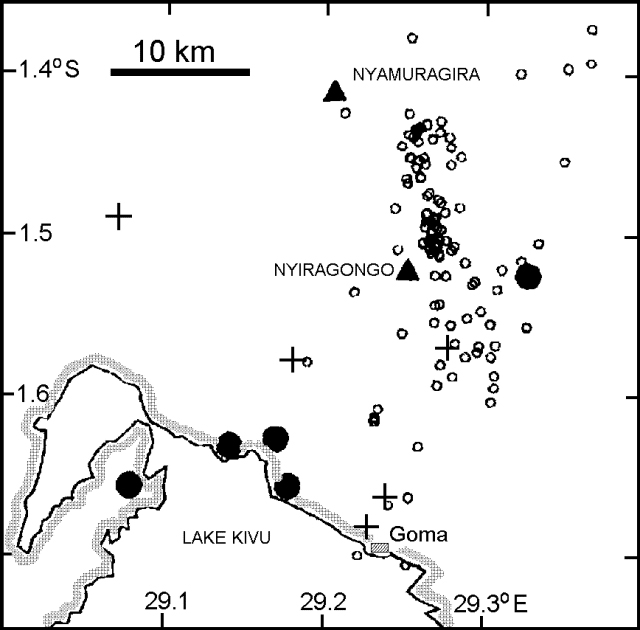 |
Figure 7. Map of the Nyiragongo area showing A-type (tectonic) earthquakes, November-December 1994. Events cluster along a NNW-SSE strike at depths of ~15 km. Crosses mark locations of telemetering seismic stations, and solid circles indicate major refugee camps. Modified from Hamaguchi and others (1995). |
During a UNDHA mission to Zaire on 6-10 February, John Tomblin and consultant Dario Tedesco met with local government officials, made a 24-hour visit to the crater rim of Nyiragongo, and prepared preliminary versions of volcanic hazard maps of both Nyiragongo and Nyamuragira. Future work will include improving the hazard map and preparing detailed descriptions of volcanic eruption scenarios. To better prepare for an event similar to 1977, regular measurements are needed. To establish a baseline for the lava lake, a UN team visited the crater rim on 7-8 February. During this visit precise levelling measurements were made by theodolite of three vertical profiles up the inner crater wall. Careful observations were also made of the 40-m-wide active lava lake, which exhibited frequent minor explosions that ejected spatter bombs within a 60-m radius and sent lava flows across the entire crater floor (800 m in diameter).
Based on eye-witness observations compiled by Hamaguchi and others (1995), the surface of the lava lake rose ~45 m between 23 June and 16 December 1994. Using an average radius of 400 m for the crater, they calculated an average magma-supply rate of 1.3 x 10⁵ m3/day (1.5 m3/s). The estimated maximum rate during the historical period was 2.5 x 10⁵ m3/day ([2.9 m3/s]) during June 1982. This 45 m rise corresponds to ~25 x 106 m3 of new lava. However, it was estimated by the UNDHA team that no more than 10% of his newly emplaced lava remains sufficiently fluid to drain quickly if suitable fractures were to open; the surface of the lava lake is also ~150 m below the level reached prior to the 1977 event.
Reference. Hamaguchi, H., Morita, Y., and Hori, S., 1995, A brief report of volcanic activity at Nyiragongo and Nyamuragira volcanoes in eastern Zaire (November, 1994 - January, 1995): unpublished report on 11 January 1995 of the Observation Center for Prediction of Earthquakes and Volcanic Eruptions, Tohuku University, Japan, 6 p.
Information Contacts: J. Tomblin, UNDHA; H. Hamaguchi, Y. Morita, and S. Hori, Tohuku Univ; Director, CRSN, Bukavu.
High levels of seismicity during September 1995
Volcanic seismicity in the Nyamuragira/Nyiragongo area during 15-30 September was very high (figure 8). This activity was characterized by A-type (high-frequency) and C-type (low-frequency) events. Hypocenters were principally concentrated ESE of the summit of Nyamuragira, NE of Nyiragongo, at depths of 0-20 km. Depths for all of the earthquakes decreased from W to E and from S to N, suggesting a volcanic conduit rising in a generally NE direction towards the surface on the ESE flank of Nyamuragira. The level of volcanic tremor was very low. The low tremor level does not signify an overall reduction in the Nyiragongo lava lake activity, but no fresh lava was apparent in the crater.
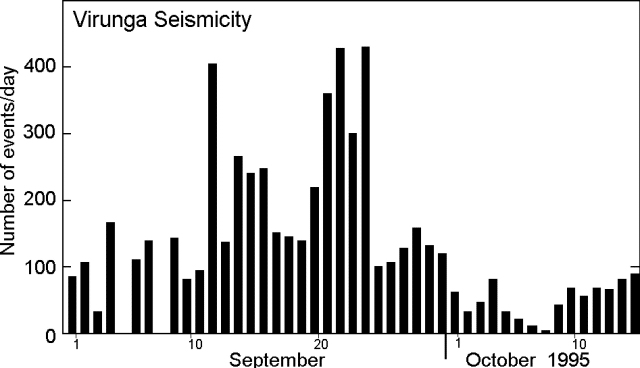 |
Figure 8. Seismicity in the Nyamuragira/Nyiragongo area, 1 September-15 October 1995. Courtesy of the Goma Volcano Observatory. |
Seismic recordings in the first half of October were severely impaired by frequent power disruptions to the observatory and the regular discharge of the batteries. The number of earthquakes decreased significantly compared to September; events were mainly centered at greater depths (5-30 km) SE of Nyiragongo. Problems with the transmitter at the Kunene seismic station prevented acquisition of better data; scientists were unable to visit the station regularly due to a lack of tires for their vehicle.
Seismicity during 15 November-2 December remained high, mainly consisting of A- and C-type earthquakes, and volcanic tremor. The distribution of hypocenters was similar to that observed during September. Each series of earthquakes was followed by up to several hours of tremor. Five seismic stations were operating during this period, four of them (Kibati, Rusayo, Buhimba, and Kunene) telemetered to the Goma observatory, and the fifth (Mt. Goma) connected by cable. However, the transmitter from Kunene was intermittent. Tremor amplitude remained low.
Monitoring of both active Virunga volcanoes is done from a small observatory building located in Goma, ~18 km S of the Nyiragongo crater. Goma is the city where the major encampment of Rwandan civil-war refugees is located. A previous lava lake in the deep summit crater of Nyiragongo, active since 1894, drained suddenly on 10 January 1977, killing about 70 people. Lava lake activity resumed in June 1982, but had ceased by early 1983. The lava lake was again activated after an eruption that began in June 1994 (BGVN 19:06-19:08). Historical eruptions from Nyamuragira (14 km NW of Nyiragongo) have occurred within the summit caldera and from numerous flank fissures and cinder cones. Twentieth century flank lava flows extend >30 km from the summit. Nyamuragira also began erupting in July 1994, producing lava fountaining, lava flows, and ash emission.
Information Contacts: Wafula Mifundi and Mahinda Kasereka, Goma Volcano Observatory, Departement de Geophysique, Centre de Recherche en Sciences Naturelles, Lwiro, D.S. Bukavu, Zaire.
No visible activity in April and August; summary of 1994-95 activity
Members of an SVE excursion who climbed Nyiragongo during the second week of April 1996 found no visible eruptive activity. They heard from local residents that the eruption that began in June 1994 (BGVN 19:06-19:08) had ended in September 1995.
Whether the eruption actually ceased in September 1995 is ambiguous because Dario Tedesco learned that in November 1995 and in February-March 1996 observers saw glow above the crater at night. Also, Tedesco learned that some tourists spending the night near the summit during this same post-September interval allegedly saw minor activity. Some sustained seismic activity was reported in September through early December 1995 (BGVN 21:01).
Observations on 3 August 1996. Christoph Weber visited the volcano on 3 August 1996 and made a rough sketch map (figure 9). Weber also saw no new activity and based on discussions with locals concluded that the last eruptions consisted of the lava fountains and lava lake dynamics that took place in the interval July 1994 to September 1995 (BGVN 20:01 and 21:01).
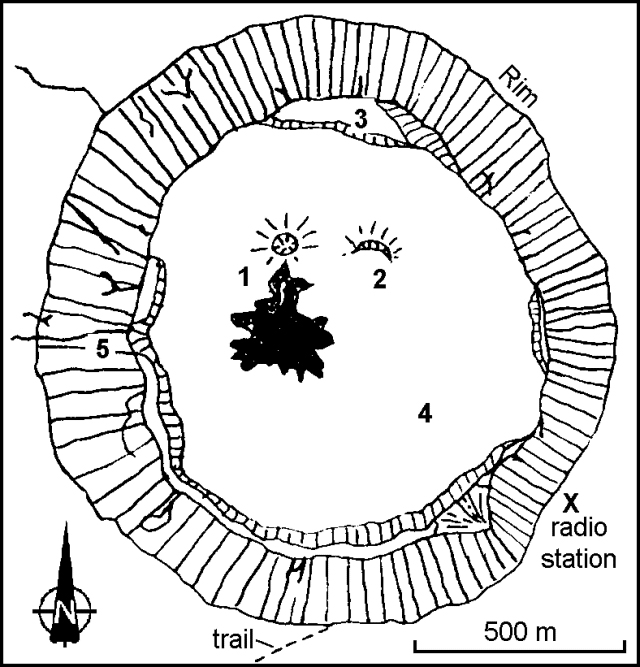 |
Figure 9. Nyiragongo sketch map showing the crater in August 1996. Symbols are as follows: 1) Spatter cone with last lava flows (shaded); 2) spatter half-cone; 3) first platform (or bench, ~175 m below the crater rim); 4) surface of chilled lava lake and associated lava flows (~275 m below the rim); and 5) dikes. Courtesy of Christoph Weber. |
Features in the crater area included a spatter cone, a feature bordered on its S side with a light gray lava flow (dark shading). This flow was apparently the last erupted prior to the visit and it still showed fresh-looking flow channels. Weak fumaroles were located along the SE crater's wall at concentric fractures ~50-150 m below the crater rim. Weber also relayed that seismologist Mahinda Kasereka had seen typical seismicity around this time interval.
Reported activity during November 1994-August 1995. Tedesco elaborated on activity from November 1994 to as late as March 1995, describing almost continuous lava lake activity. The lake lay within the confines of a spatter cone 50 m high and 100 m across. Lava escaping at the spatter cone's base formed two main flows that expanded into an intracrater depression. Theodolite measurements, however, indicated that during this interval the crater floor lacked detectible inflation. During this time period the Goma Observatory seismic system registered tremor and local earthquakes tens of kilometers N and W of the Nyiragongo crater.
Some time around March to early April 1995 activity changed significantly, Tedesco reported. There were seismic swarms and high lava fountains (the latter previously unseen since November 1994), marked effects presumably due to the availability of a fresh batch of undegassed magma. Suddenly, in mid-April the activity ceased for a couple of weeks; the spatter cone disappeared leaving only a much smaller hole located farther towards the N crater wall; inside the hole a solid crust covered the floor.
Tedesco also reported that at the end of April, after a M 5.1 earthquake in the region, there occurred about one eruptive episode/week lasting up to 12 hours. Two spatter cones formed. From the end of April to mid-August 1995 accumulating lavas caused the crater floor to ascend by ~50 m and the estimated erupted lava volume was 56 x 106 m3. This volume was ~3x larger than the volume estimated by Tazieff for the 1977 lava flows. The latter estimates were made from oblique photographs, without aerophotogrammetric maps, and by accepting an overall average flow thickness of 1 m for a flow that ranged from 0 to 3 m thick (Tazieff, 1977, p. 193).
Eruptive history. A previous lava lake in the deep summit crater of Nyiragongo, active intermittently since 1894, drained suddenly on 10 January 1977. Extremely fluid lava escaped from flank fissures and moved downslope at up to 60 km/hour, killing about 70 people. Lava lake activity resumed in June 1982 with phreatic explosions and lava fountaining, but had ceased by early 1983 (Tazieff, 1984; Tazieff, 1979). The lava lake was again active at least into early 1995 (BGVN 20:01) after an eruption that began in June 1994 (BGVN 19:06-19:08). For the past two and a half years this portion of Zaire's border had contained camps with hundreds of thousands of refugees; over a month ago these refugees fled to escape fighting.
References. Tazieff, H., 1977, An exceptional eruption, Mt. Niragongo, Jan. 10th, 1977: Bull. Volcanol., v. 40-3, p. 189-200.
Tazieff, 1979, Nyiragongo, the forbidden volcano (translation from French language text by J.F. Barnard): Barron's Educational Series, Inc., Woodbury New York, 287 p.
Tazieff, H., 1984, Mt. Niragongo: renewed activity of the lava lake: Jour. Volc. Geotherm. Res., v. 20, p. 267- 280
Information Contacts: Patrick Barois, c/o Henry Gaudru, Société Volcanologique Européenne (SVE), C.P. 1, 1211 Geneva 17, Switzerland; Christoph Weber, Kruppstrasse 171, 42113 Wuppertal, Germany; Mahinda Kasereka, Goma Volcano Observatory, Departement de Geophysique, Centre de Recherche en Sciences Naturelles, Lwiro, D.S. Bukavu, Zaire; Dario Tedesco, Universita degli Studi di Napoli Federico II, Dipartimento di Geofisica e Vulcanologia, Napoli, Italy.
Lava lake status unclear; new fumaroles and elevated ground temperatures
During the beginning of March 2001, scientists from the Goma Volcanological Observatory visited Nyiragongo in an effort to determine if the volcano was active. At that time the crater was estimated to be 800-1,000 m in diameter. They reported that the surface level of the lava lake in the summit crater remained the same as in 1996 (the last time it was measured), ~300 m below the crater rim, 120 m below what is considered to be the critical level. Thus, as this issue of the Bulletin goes to press, it remains uncertain whether Nyiragongo's lava lake's surface remained active and molten, or whether its surface was covered by a thick solid crust. GVN will try to clarify this in a future report.
The scientists observed several changes since January 2001. Fumaroles were present on the side of the small central crater. The ambient ground temperature in this area is normally 5-9°C, but was measured to be 28°C. There were also fumaroles with gas temperatures of 70°C. Researchers measured temperatures of ~50°C in cracks upstream of Shahero crater ~2 km S of the summit crater. Cracks observed in the main cone suggested dilatation of the crater area.
TOMS observations. Anomalous, volcanogenic SO2 concentrations over the region were detected by space-borne (TOMS) instruments in February. Since these concentrations were presumably associated with the eruption of Nyamuragira, they were discussed within that report. On the other hand, the large sizes of these concentration anomalies and the uncertainty of the relevant eruption chronologies make it unclear whether Nyiragongo contributed appreciable SO2.
Information Contacts: Wafula Mifundu, Observatore Volcanologie de Goma (RDC-E), Goma, Democratic Republic of Congo; Jim Smith, US Agency for International Development / Office of US Foreign Disaster Assistance, 1300 Pennsylvania Ave., NW, Washington, DC 20523-8602 USA (URL: https://www.usaid.gov/who-we-are/organization/bureaus/bureau-democracy-conflict-and-humanitarian-assistance/office-us); Simon Carn, Joint Center for Earth System Technology (NASA/UMBC), University of Maryland Baltimore County, 1000 Hilltop Circle, Baltimore, MD 21250 USA.
Mid-January 2002 lavas bury ~ 4.5 km2 of Goma's city center
An eruption began at Nyiragongo on 17 January 2002 with some lava flows and possibly their feeding fissure vents entering the city of Goma (~18 km S of the volcano, population ~400,000) in the Democratic Republic of Congo (DRC) and threatening refugee camps (figure 10). Encroaching lava spurred massive evacuations of the city. A great deal of conflicting information exists concerning the numbers of people killed or displaced, the amount of property destroyed, the specific paths of the lava flows, etc.
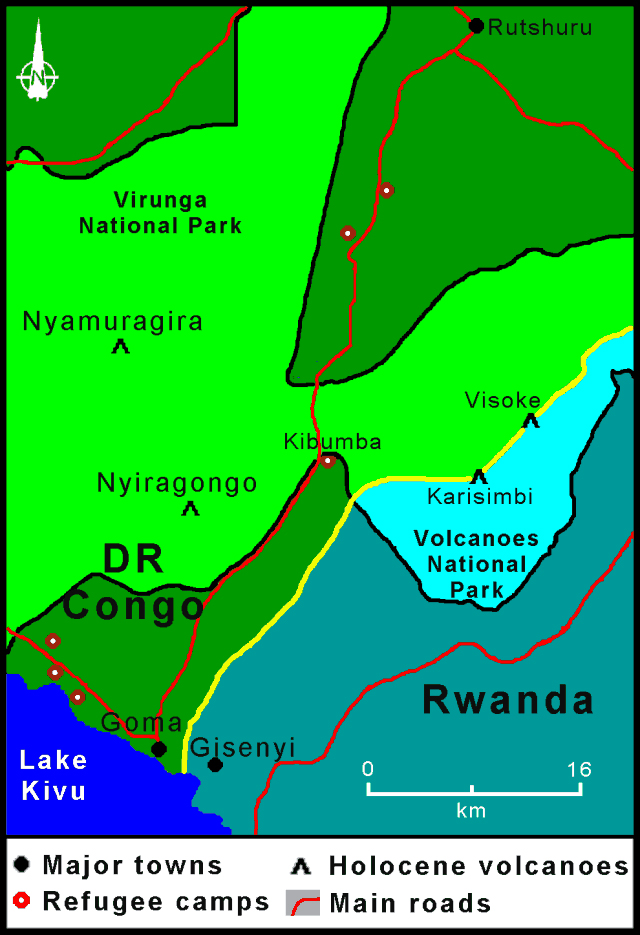 |
Figure 10. Sketch map showing the location of Nyiragongo and other nearby volcanoes. The boundary between the Democratic Republic of Congo (NW) and Rwanda (SE) is shown as a yellow line; roads are red, and the national park boundary is black. National park areas are lighter shades of green (in DR Congo) and blue (in Rwanda). Modified from a base map courtesy of Wheeling Jesuit University/ NASA Classroom of the Future. |
The following is taken primarily from reports by the United Nations Office for the Coordination of Humanitarian Affairs (OCHA), the U.S. Agency for International Development - Office of U.S. Foreign Disaster Assistance (USAID/OFDA), and the aid organization Oxfam International.
Numerous dramatic press reports showed multiple lava flows engulfing Goma; city streets became paths for rough-surfaced lava flows, and numerous buildings collapsed, burned, or both. In the end, one of the flows passed completely through Goma to enter Lake Kivu and proceeded to build a lava delta. The lava flows damaged or destroyed agricultural areas around Goma, covered the N part of the runway at the airport, and cut off access to parts of the town. Lava flows destroyed both residential and business districts as well as a cathedral.
Authorities in Goma reported that more than 150,000 people remained there during the peak of the lava flow activity. A report from the UN and USAID/OFDA on 23 January estimated that 147 people were killed because of lava flows and seismically induced building collapses. According to Oxfam International, ~60,000 people lost their homes.
The UN report stated that up to ~250,000 people were displaced as a result of the eruption. These and possibly other displaced people were concentrated in the following places: Goma, DRC (62,500); Sake, DRC (5,000); Rutshuru, DRC (5,000); in camps along the eastern DRC frontier near Gisenyi, Rwanda (6,000-10,000); in Ruhengeri, Rwanda (4,000); in Bukavu, DRC (15,000); in surrounding areas (30,000), in six sites near the NW shore of Lake Kivu (up to 60,000) and in area villages (60,000).
17-21 January 2002 eruption. The start time of the 17 January eruption is uncertain. According to Agence France-Presse, Nyiragongo began to erupt at about 0500. USAID/OFDA reported that the eruption began at about 0930. Most reports stated that three lava flows moved down the E, W, and S flanks. During a 17 January phone conversation with BGVN editors, Richard McDonald, a missionary in the Congo region, noted that his sources had suggested that lava flows traveled to the E, N, and S. Two flows traveled directly S through Goma and divided the city in three. One of these flows continued into Lake Kivu.
MODIS (Moderate Resolution Imaging Spectroradiometer) images from 17 January at 1050 showed a substantial ash plume moving W from Nyiragongo (figure 11).
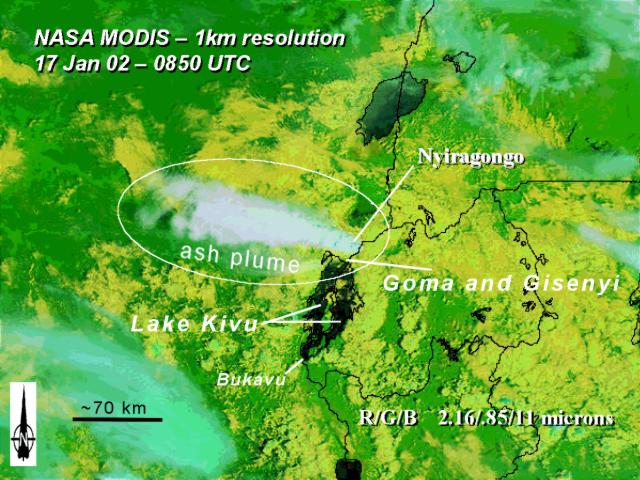 |
Figure 11. An annotated MODIS satellite image showing the region surrounding Nyiragongo as captured at 1050 on 17 January 2002. Lava flows are not yet conspicuous at this stage of the eruption. Instead, a W-trending ash plume is visible extending more than 150 km from the volcano. Courtesy NASA. |
OCHA stated that at 1100 on 17 January observers flew over the volcano in a helicopter and reported a large lava flow approaching Goma. The lava flow cut the road between Goma and Rutshuru (to the N, figure 10). By 1430, with a small hill slowing its progress, the lava flow had reached 2 km N of the airport and was still progressing southward. The lava flow had reached a width of 2 km, and its velocity was estimated at 2-3 m/minute (0.2 km/hour), a very slow flow rate compared to those reported for the very high velocity 1977 eruption which reached up to 60-100 km/hour (see SEAN 02:03). The smaller of the two lava flows heading toward Goma cut the road leading in from the W (figure 12). OCHA reported that a fourth fissure opened during the afternoon of 17 January. A total of 14 neighboring villages were affected by the lava flows.
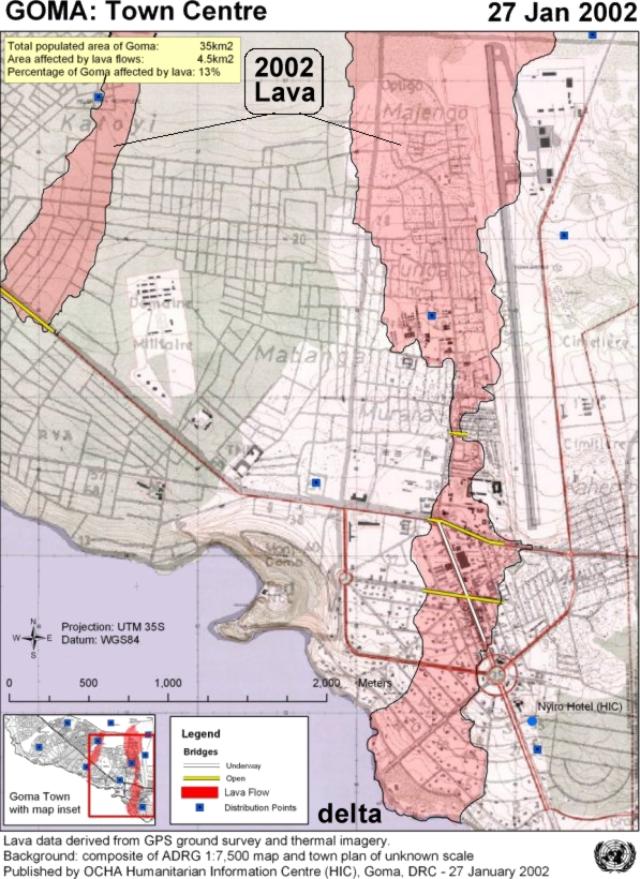 |
Figure 12. Map of Goma showing lavas from the 17-21 January 2002 eruption of Nyiragongo. Lavas from the eruption ultimately trisected Goma and one branch entered Lake Kivu. Courtesy OCHA Humanitarian Information Center (HIC). |
News reports made much about fires in Goma. Fuel depots exploded and kerosene storage facilities at the airport burned. On 21 January a petrol station exploded killing ten's of people (~50 according to news reports). A UN worker in Goma reported that the air was full of ash and dust during the eruption. News reports also emphasized the fires' smoke and soot.
On 18 January, OCHA reported that tremors occurred every hour, and some were strong enough to damage buildings in Gisenyi (figure 10). Several tremors were felt as far away as at the S end of Lake Kivu in Bukavu (~125 km SE). As of 24 January, earthquakes and tremors up to M 4.7 continued in the vicinity of Nyiragongo.
Representatives from OCHA reported on 20 January that a new crater had opened on the NW side of Nyiragongo, and the temperature of some parts of Lake Kivu reached up to 40°C.
By 21 January, the rapid advance of new lava flows appeared to be over, but residual molten lava still slowly seeped into Lake Kivu, where it formed a ~100-m-wide delta. Although no new lava flows threatened the city, some scientists feared that lava entering the lake or seismic activity could disturb the lake sufficiently to release significant amounts of carbon dioxide and methane gas lying at the lake bottom. News and other scientific sources suggested a gas release was unlikely.
OCHA reported that a 22 January a flight over the volcano confirmed a lack of new activity, including the crater where only a few fumaroles were present. A system of fractures was visible along the southern slope of the volcano, starting from the eastern flank of Shaheru crater (close to the main Nyiragongo cone) and propagating down close to the outskirts of Goma. The fractures were generally meters wide, and during the eruption lava poured out from different locations and altitudes along the fracture system. The lowest lava emission point in this fracture system, as estimated from the helicopter, was at least ~2 km from Goma.
According to OCHA, volcanologists determined that ash observed in Goma on 23 January originated from the collapse of Nyiragongo's inner crater and not from a Nyamuragira eruption, as was originally (incorrectly) stated in several news reports. During a visit to Nyiragongo's main crater on 28 January, the UN Volcano Surveillance Team found that the crater floor had collapsed more than 600 m. In addition, they reported no ongoing volcanism nor any fumaroles at the bottom of the crater, although they could smell SO2. A few weak steam vents were visible on the inner crater wall and a small gas plume was seen above the crater rim to the NE. On 28 January the volcano was at Alert Level Yellow (second on a four-color scale).
Regional seismicity. On 4 January 2002, an M 4.8 earthquake occurred near Nyiragongo. Local volcanologists had planned to visit Nyiragongo on 19 January to observe its activity, but the volcano erupted before the visit.
According to Bruce W. Presgrave of the USGS National Earthquake Information Center (NEIC), there was an unusual number of tectonic earthquakes in the Goma-Nyiragongo region starting ~9 hours after Nyiragongo's alleged initial lavas at 0500. The sequence included ~100 earthquakes M 3.5 or larger. Tectonic swarms of this size occasionally appear in conjunction with volcanism. For example, seismologists noted intense protracted swarms during Miyake-jima's intrusions and eruptions during the year 2000 (BGVN 25:05, 25:07, and 25:09).
The largest earthquake to date in the sequence was M 5; it struck at 0214 on 20 January at 1.76°S, 29.08°E. The second largest, M 4.8, struck at 2201 on 17 January at 1.74°S, 29.08°E, about 17 hours after the estimated onset of the lava flows according to news reports. Though imprecisely fixed, these estimated epicenter locations are just a few ten's of kilometers WSW of Goma; and the probable uncertainty could place them closer to Goma and Nyiragongo.
In addition to registering at the two closest stations in Mbarara, Uganda (MBAR, 0.602°S, 30.738°E) and Kilima Mbogo, Kenya (KMBO, 1.127°S, 37.252°E), the earthquakes also left clear signatures on instruments at great distances, for example in China and at the South Pole, Antarctica. The earthquakes contained sharp P- and S-wave arrivals. Also, as would be expected of tectonic events at teleseismic distances, the associated signals at even the closest stations MBAR and KMBO lacked tremor. The signals were not the sort that could be expected to arise from surficial processes like sudden mass wasting, fuel explosions, building collapses, etc. First motion or minimal tensor results are not yet available.
Comparatively few news accounts discussed the seismic activity or seismically induced damage, perhaps because residents were concerned with more pressing aspects of Nyiragongo's eruption. However, NEIC has received email messages indicating that numerous earthquakes were felt near Kigali, Rwanda (~100 km E of Nyiragongo, table 2).
Table 2. Summary of earthquakes felt near Kigali, Rwanda (~ 100 km E of Nyiragongo) during 10-22 January 2002. The earthquakes were all recorded instrumentally as well. Courtesy Bruce Presgrave (NEIC) and Fr. Stephen Yavorsky, S.J.
| Date | Local Time | Estimated Location | Magnitude | Comment |
| ~10 Jan 2002 | ~1530-1600 | -- | 4.0 | -- |
| 17 Jan 2002 | 2201 | 1.75°S, 29.07°E, ~115 km W of Kigali | 4.8 | 15 km depth |
| 18 Jan 2002 | 1008 | -- | 4.0 | -- |
| 18 Jan 2002 | 2309 | -- | 4.0 | -- |
| 19 Jan 2002 | ~1606 | -- | ~4.0 | -- |
| 19 Jan 2002 | ~2233 | -- | ~4.0 | -- |
| 19 Jan 2002 | ~1912 | -- | ~4.0 | -- |
| 20 Jan 2002 | 0214 | 1.76°S, 29.08°E | 5.0 | -- |
| 21 Jan 2002 | ~0130-0530 | -- | ~4.0 | Numerous tremors felt during 4-hour period |
| 21 Jan 2002 | 0640 | -- | ~4.7 | -- |
| 21 Jan 2002 | 1553 | -- | ~4.0 | -- |
| 21 Jan 2002 | 1630 | -- | ~4.0 | -- |
| 22 Jan 2002 | 1732 | 1.72°S, 20.10°W, ~15 km WSW of Gisenyi | 4.9 | -- |
| 22 Jan 2002 | 1822 | -- | 4.4-4.7 | -- |
As a result of the seismicity, many buildings collapsed in Goma. At least 25 buildings in Gisenyi were also destroyed. By 28 January seismicity had decreased and earthquakes were not large enough to be felt by the population.
Humanitarian crisis. According to OCHA and various news reports, refugees began to return to Goma just a few days after the eruption, despite the dangers that still existed in the area. USAID/OFDA reported that on the morning of 20 January, more than 15,000 people per hour were returning to Goma from points E of the city, while simultaneously 3,000 people per hour were fleeing the city to locations W. Aid workers reported that the refugees would rather return to Goma and risk another eruption than stay in displacement camps in Rwanda, which they perceived to be a hostile country. On 21 January, continuing seismic activity caused buildings to collapse, resulting in more deaths.
Poor access to people in affected parts of Goma was a problem for relief efforts. Several humanitarian groups, along with news agencies, reported that aid workers, along with returning refugees, crossed freshly crusted lava flows to access certain areas. On 18 January two out of three water pumping stations were not working.
Eye irritation and breathing difficulties were reported as a result of the ash and fumes in Goma. Health care centers were provided with medication, and all health care has been free thus far. A few suspected cases of cholera have been reported, but OCHA reported that relief agencies felt prepared for possible disease outbreaks.
According to Oxfam International, the major problems facing the people of Goma were water supply and sanitation facilities, shelter, food, medical care, and damage to schools. A qualitative helicopter assessment on 23 January indicated that ~30% of Goma was destroyed by the lava flows and that up to 50,000-60,000 people in the E of the town lost their homes. On the other hand, the 27 January map-based assessment illustrated by figure 12 concluded that lava flows had affected 4.5 km2 of the city's 35 km2 populated area. Thus, this analysis suggested that ~13% of Goma had been affected.
Figure 12 shows that the E portion of Goma had been cut off from the rest of the town by lava. During the first four days of the eruption, speedboats transported relief workers between the E and W parts of Goma.
On 23 January, 11 sites (in Goma and Sake) operated by the World Food Program began to distribute food and non-food items to refugees (several of these sites appear on figure 12). Other NGO's had collaborated to purchase food locally to provide food for refugees prior to this distribution, but many people had not received food since the eruption began.
A report from OCHA on 25 January confirmed that two access roads into Goma had been cut through the hardened lava and that a third would soon be completed. They reported that 50% of the water network in Goma was operational and that aid agencies had positioned bladders in areas not served by the network. Agencies planned to have the entire water network operational by 4 February. On 25 January, Oxfam reported that the operational portion of the water network still mainly serviced the western part of Goma, and that in the eastern part an estimated 100,000 people remained in dire need of drinking water. Water from Lake Kivu was determined to be potable for adults if filtered. About 22 water purification points were established for residents withdrawing lakewater.
The Goma airport reopened to small aircraft on 25 January. However, the tower was considered inoperable due to the risk of gas explosion.
As of 25 January, seismic activity continued, and monitoring in Goma suggested that some epicenters were at shallow depth beneath the city. OCHA warned that further eruptions were still possible near Goma and Lower Gisenyi. Several humanitarian efforts continued to help the people in Goma through the ongoing crisis. Further information will be forthcoming in future Bulletin reports, including more technical information from volcanologists on the scene.
Information Contacts: United Nations Office for the Coordination of Humanitarian Affairs (OCHA), United Nations, New York, NY 10017 USA (URL: https://reliefweb.int/); Oxfam International, Suite 20, 266 Banbury Road, Oxford, OX2 7DL, United Kingdom (URL: https://www.oxfam.org/); Richard McDonald, c/o Independent Missionaries, Box 42, Cyangugu, Rwanda; U.S. Agency for International Development (USAID)/Office of U.S. Foreign Disaster Assistance (OFDA), Ronald Reagan Building, Washington, DC 20523-1000, USA (URL: https://www.usaid.gov/); Bruce Presgrave, USGS National Earthquake Information Center (NEIC), MS 967, Denver Federal Center, Box 25046, Denver, CO 802225, USA (URL: https://earthquake.usgs.gov/); Fr. Stephen Yavorsky, S.J., Maison Régionale Jésuite, B.P. 6039, Kigali, Rwanda; National Aeronautics and Space Administration (NASA), Washington, DC 20456-0001, USA (URL: https://www.nasa.gov/).
Report of field work; MODIS imagery from January 2002 eruption
During 17-18 January 2002 Nyiragongo, located ~18 km N of Lake Kivu in the Democratic Republic of Congo (DRC) close to the border of Rwanda, erupted an estimated 20 x 106 m3 volume of lava (BGVN 26:12). Lava flows originated from the central crater and from several locations along a huge system of fractures that rapidly developed along the entire S flank of the volcano down to the city of Goma (~400,000 people) on the N shore of Lake Kivu. Goma was then invaded by extensive lava flows, which destroyed at least 13% of the surface of the city before reaching the lake. The advancing lava flows caused the spontaneous evacuation of at least 300,000 people, mostly toward the neighboring town of Gisenyi in Rwanda, and left more than 40,000 people homeless. About 100 people died as a consequence (direct or indirect) of the eruption. This disaster required an urgent public health response to evaluate the hazards to life and health. The assessment was especially important because of the humanitarian crisis in the eastern DRC that led many of the people who had fled from the lava flows to return to the city within one or two days, despite the danger of further eruptive activity or the possible risks arising from the proximity of the cooling lava flows (Baxter, 2002).
The following report, with the exception of the Moderate Resolution Imaging Spectroradiometer (MODIS) imagery, was compiled from field visits carried out by the volcanologists representing the United Nations Office for the Coordination of Human Affairs (UN-OCHA): Dario Tedesco, Paolo Papale, Orlando Vaselli, and Jacques Durieux. The team flew over the volcano and Goma in a helicopter on 22 and 24 January, and made field observations during 23 January-4 February. One team member continued studies on Lake Kivu until 13 February. The report provides an initial reconstruction of the main events of the eruption based on reports from local witnesses, observations and reports by researchers at the Goma Volcano Observatory (GVO), a closer inspection of seismograms recorded by GVO seismic stations, and field work by the UN-OCHA team. The UN-OCHA team worked closely with a French-British team of scientists (Patrick Allard, Peter Baxter, Michel Halbwachs, and Jean-Christophe Komorowski), whose report (Allard and others, 2002) will be summarized in a future Bulletin.
Activity during December 2000-January 2002. Since December 2000 the two GVO seismic stations had recorded long-period (LP) earthquake swarms. Commonly, each LP event was shortly followed by volcanic tremor.
On 6 February 2001 Nyamuragira erupted (BGVN 26:01). Following the 2-week eruption, seismicity did not decrease. On the contrary, volcanic tremor and LP earthquakes reappeared at both stations (Bulengo, BSS, S of Nyiragongo and Katale, KSS, NE of Nyiragongo, ~40 km from Bulengo), without showing any particular pattern, from March 2001 through January 2002. During the 10 months that preceded the January 2002 eruption, it was impossible to distinguish which volcano was the source of the seismicity.
In addition to the increased seismic activity, on 5 October strong vibrations were felt and on 7 October a strong tectonic earthquake (M 3.5-4.0), unusual for this region, was felt by the population. This earthquake was followed a few hours later by high-amplitude volcanic tremor.
Field trips by GVO personnel to the summit of Nyiragongo during 29 October-1 November and 8-10 December 2001 revealed several important changes. Immediately after the October tectonic event a white plume was visible inside the 1977 eruptive fracture on top of and inside the Shaheru crater (2 km S of the summit crater) at 2,700 m elevation. A similar plume was emerging from new cracks in the inner wall of the central crater, while a dark plume was visible from the small 1995 spatter cone inside the volcano. The new fumaroles on the side of the small central crater had a temperature of 70°C; the ground temperature, which was normally at 5-9°C, was recorded as 28°C; cracks near Shaheru crater were at ~50°C.
An increase in seismicity similar to that observed during early October occurred beginning on 4 January 2002, when an M > 4 earthquake occurred. On 7 January seismic activity triggered some visible changes, including reactivation of fumarolic activity. Following the 4 January earthquake seismicity remained high until 16 January. The onset of the eruption was preceded by about 8 hours of calm consisting of very low seismicity (without tremor or LP earthquakes).
Eruption during 17-18 January 2002. Early on 17 January a huge system of fractures began to develop on the S flank and eventually extended from high elevations down to Goma and Lake Kivu. The main trend of fractures was N15°W, which is similar to the general trend of the rift valley in the Nyiragongo region. The system of fractures appears to have propagated down from the volcano, starting at 2,800-3,000 m elevation (300-400 m N of the old Shaheru crater), and covering a distance of ~10 km towards Goma in less than 8 hours. The uppermost portion of the fracture started erupting at 0835 on 17 January. A single fracture ~2 m wide was visible above and inside Shaheru. Reactivated during the January event, it corresponded to the eruptive fracture of January 1977. Below the Shaheru crater the fracture was replaced by a more complex system, with two parallel main fractures ~300 m apart, also propagating N15°W. At about 1000 the system of fractures had reached ~1,900 m elevation; they then took ~30 minutes to cross the last system of ancient cones N of Goma, at ~1,700 m. By about 1400 the fractures were in the proximity of the Munigi village on the outskirts of Goma.
As the fractures advanced, several started erupting. Beginning around 1000 and lasting for at least two hours, lava flows escaped at ~1,950-2,000 m elevation S of the ancient Kanyambuzi-Mudjoga tuff cones. Fractures on the gentle slopes N of Goma lacked venting lava along a portion a few kilometers in length, but, at several locations the tips of intruded dykes ascended within only a few ten's of centimeters to a few meters below the ground surface.
At 1610 on 17 January the southernmost system of vents opened S of Munigi village and on the outskirts of Goma at 1,570-1,580 m elevation. Lava flows from these vents affected the Goma airport and destroyed part of the city before reaching the lake. About 10-20 minutes later a new N15°W-oriented fracture began to erupt at 1,950-2,000 m elevation, located ~1.5 km W of the main fracture system. Lava flows from this fracture partially destroyed the western part of Goma without reaching the lake.
Around the same time a fracture a few hundred meters long opened on the NW flank of the cone, at ~2,700-3,000 m elevation as estimated by helicopter, producing a lava flow that did not affect inhabited areas. Unlike the southern fracture system, this fracture had an estimated N30°E to N60°E trend. The eruptive activity at several places along the fracture system on the S flank reportedly lasted through part of the night or even up to daylight on 18 January.
MODIS images on 18, 21, and 27 January showed a hot spot in the vicinity of the volcano (figure 13). The 18 January image showed a single, large hot spot (3-4 pixels wide and ~11 pixels long on the S flank of Nyiragongo. The elongate hot spot had a NNE-SSW orientation. Its proximal section was located about mid-way up the S flank of the volcano (in the vicinity of the Shaheru-Djoga cinder cones and 1977 S-flank fissure) and the distal section was directly over Goma. The hot spot decreased over the following days, and by 27 January was barely visible.
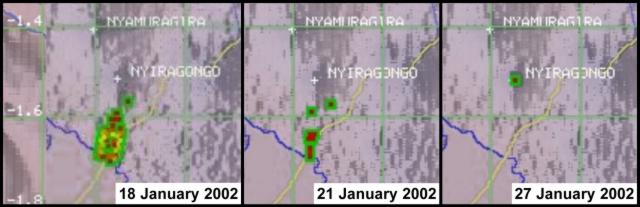 |
Figure 13. Moderate Resolution Imaging Spectroradiometer (MODIS) satellite images on 18, 21, and 27 January showing a hot spot near Nyiragongo during the eruption. The 18 January image shows a single, large hot spot (3-4 pixels wide and ~ 11 pixels long) on the S flank. The hot spot decreased over the following days, and by 27 January was barely visible. Courtesy HIGP/SOEST. |
Activity following the eruption. During the night of 21 January some earthquake swarms created panic in the population. During about 0600-1800 on 22 January no earthquakes were felt. However, at about 1800 a sequence began during which ~20 earthquakes were felt in less than 3 hours. The following days were characterized by periods of intense seismicity, alternating with intervals (~10-15 hours) of lower seismic activity.
Seismic events showed quite a range of magnitude, frequency content, and S-P times, suggesting several different origins. The earthquakes that occurred in the days following the eruption were ~M > 5. During the 5 days following the eruption ~100 tectonic earthquakes (M > 3.5) occurred with epicenters in the Goma-Nyiragongo region. Several houses collapsed or were seriously damaged due to seismic loading in Gisenyi, where nine people died as a direct result of roof collapse. Seismic signals showed a typical sequence of tectonic events, followed within minutes to hours by LP events and volcanic tremor lasting continuously for more than 10 hours. Such a sequence, which is identical to the typical sequence recorded during the year preceding the eruption, suggested rock fracturing followed by the intrusion and ascent of magma.
An estimate of the location of seismic events made by comparing the arrival time differences of P- and S-waves at the three seismic stations of Bulengo, Katale, and Goma (the last one provided by the French-British team) showed that on 27 and 28 January the shocks were concentrated in the area between the Nyiragongo crater and Goma, probably 4-6 km N of Lake Kivu. During the first days of February the epicenters of earthquakes were clustered in two areas. The first was along the system of fractures, stretching a few kilometers N and S of Goma (in part, beneath Lake Kivu). The second cluster lay S of the town of Sake, 15-20 km W of Goma, close to the W border of the rift.
Observations during a helicopter flight over the volcano on 21 January revealed that the crater floor (old surface of the 1994-95 lava lake) was cut by a N-S elongated depression (like a small graben) underlain by steaming cracks. The next day witnesses from villages 6 km SW and ~10 km N of the summit crater reported that at about 2100 an earthquake was felt and immediately followed by a red glow or "flames" above the crater. Later that evening fine ash fell along the road from Goma to Sake. On the morning of 23 January ash fell in Goma and at the airport. A helicopter survey revealed a layer of ash on the volcano's upper S and E flanks and devastated vegetation on the crater's N flank.
On 24 January the inside of the crater appeared as a huge cavity with an estimated depth of 800 m and a grayish-yellow colored floor. The old terraces that represented the remnants of the lava lake at different stages of its long history were nearly totally absent. The interpretation is that either the emptying of the lava lake, the fracturing of the system, or more likely both, destabilized the inner part of the crater. Seismic records showed higher-amplitude tremor, presumably related to the crater-floor collapses, starting on 22 January at 2051 and lasting for ~4 hours. During the same flight on 24 January an explosion or a new collapse at the crater produced a small cloud of steam and ash that reached a few hundred meters above the crater rim.
Gas blasts sporadically occurred, mainly after the eruption, ~100-200 m away from the main path of the lava flow in Goma causing displacement of pavement in small buildings. In a small garage in Goma a thick (~10 cm) concrete pavement was cracked and uplifted up to 50-70 cm by the gas blasts.
Observations and research at Lake Kivu. Interesting phenomena were noted on the shore of Lake Kivu in the area of Himbi. Women who used to wash clothes close to the lake observed that the water level had decreased a few centimeters 3-5 days before the eruption. During the night and early morning of 17-18 January waiters at a restaurant observed crabs and crayfish jumping out of the lake. During 20-21 January dead fish and bubbling spots were observed in the small bay close to the restaurant. Waiters stated that the temperature of the lake in those zones had increased and a brown-black stain appeared from the bottom of the lake in an area of several square meters. At the same time an odor of spoiled eggs (suggesting presence of H2S) was present. A similar phenomenon occurred early in the morning (at about 0230) on 30 January after an M 4.5 earthquake. The owners of the restaurant suddenly awoke due to difficulty breathing and the strong smell of rotten eggs. In both cases, the "normal" conditions were reestablished in a "short" (not well-defined) time. Soil-gas measurements indicated that CO2 concentrations reached values up to 20%.
A geochemical survey of the main fluid manifestations in and around the S part of Nyiragongo was carried out during the days after the 17 January eruption. Sampling included water from Lake Kivu, cold and thermal springs, dry vents, and soil gases. The main conclusions of this survey were: 1) contrary to rumors following the entry of lava flows into the lake, lake water only a few meters away from the lava front was not polluted; 2) the geochemical characteristics of water from the lake and from springs on land are close to those found previously by Tietze and others (1980) and Tuttle and others (1990); and 3) the analyzed gases appear to have a clear magmatic origin as revealed by their isotopic signature. An exception to the final conclusion is that gases from the Rambo sampling point, which sits next to a brewery in Gisenyi, appear to represent mixtures between biogenic (organic) and magmatic sources.
Immediately following the eruption, fishermen reported visible changes in the water level at Lake Kivu. This was confirmed by women who visited the lake shore daily for washing or collecting water. A series of measurements was started in close cooperation with the UN field officer Dominic Garcin, who has a vast knowledge of the lake. The first measurements were obtained on 28 January along the shoreline from Gisenyi to Sake. The results confirmed a significant subsidence of the ground and rise of the water level. The subsidence was highest (37 cm) in Goma, then progressively vanished towards the E (~10 cm in Gisenyi but 0 cm ~2 km farther E) and W (0 cm ~15 km W of Goma). After these first measurements, several others were systematically taken along the N shoreline of Lake Kivu as well as around the lake up to ten's of kilometers S of Goma, and at Idjwi Island, ~30 km S of Goma. The measurements showed that ground subsidence is an ongoing phenomenon in the entire rift area near Lake Kivu. One month after the eruption, maximum measured ground subsidence was 50-60 cm at the Goma harbor and at Idjwi Island (figure 14). Scientists note that the February-March westward shifting of the ground subsidence corresponds to a similar westward shifting of epicenters.
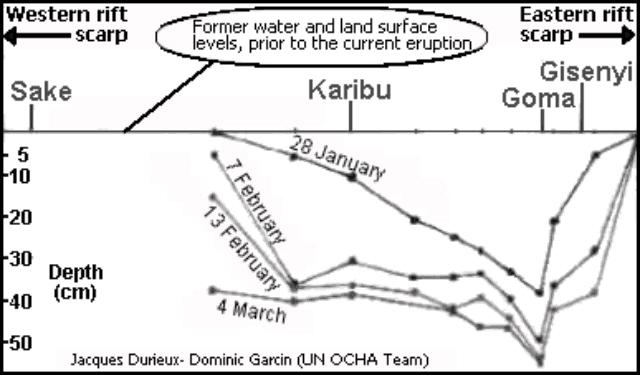 |
Figure 14. Plots showing cumulative, asymmetrical land subsidence in the Goma area across the far S flanks of Nyiragongo. The subsidence was measured with respect to pre-subsidence surface of Lake Kivu, and surveyed along an E-W transect. The four survey dates (all in early 2002) each established the greatest subsidence at Goma, and lesser subsidence towards the East African rift's margins. Courtesy UN-OCHA team. |
Conclusions. The characteristics of the erupted products and associated lava flows, together with the available information on the state of the volcano prior the eruption, suggest different dynamics of magma emission in the upper and lower portions of the fracture system. Two different interpretations have been offered. The "magmatic" hypothesis is that the energy for intense fracturing of the volcanic apparatus came from deep magma pushing from below inside the volcanic system. The "tectonic" hypothesis is that the energy for fracturing came from a non-volcanic source and was due to a rifting event related to regional tectonics. Further discussion of both hypotheses is offered in the report by the UN-OCHA team (Tedesco and others, 2002).
Goma is considered at a very high risk should reactivation of the volcano and rift system occur. The security of its inhabitants cannot be guaranteed even with the most sophisticated instrumental network. Thousands of lives can be saved by increased surveillance, continued scientific investigation, contingency plans, and information campaigns.
An outstanding effort by the UN and several donors allowed for the development of short and long-term aid to the Goma Volcano Observatory (GVO). This effort included support for foreign volcanologists, purchase of new equipment, establishing a new monitoring network, and help with logistics (transportation, communications, salaries, etc.). GVO is now publishing weekly reports on volcano activities.
References. Allard, P., Baxter, P., Halbwachs, M., and Komorowski, J-C, 2002, Final report of the French-British scientific team: submitted to the Ministry for Foreign Affairs, Paris, France, Foreign Office, London, United Kingdom and respective Embassies in Democratic Republic of Congo and Republic of Rwanda, 24 p.
Baxter, P.J., 2002, Eruption at Nyiragongo volcano, Democratic Republic of Congo, 17-18 January 2002: a report on a field visit to assess the initial hazards of the eruption, 15 p.
Tedesco, D., Papale, P., Vaselli, O., and Durieux, J., 2002, The January 17th, 2002 eruption of Nyiragongo, Democratic Republic of Congo: UN-OCHA report, 17 p.
Tietze, K., Geyh, M., Muller, H., Schroder, L. Stahl, W., and Wehner, H., 1980, Geol. Rund., v. 69, p. 452-472.
Tuttle, M.L., Lockwood, J.P., and Evans, W.C., 1990, Natural hazards associated with Lake Kivu in Rwanda and Zaire, central Africa: U.S. Geological Survey, Open File Report 90-691, 47 p.
General Reference. Tazieff, H., 1979, Nyiragongo, the forbidden volcano, translated by J. F. Bernard: Barron's, New York, 287 p. Originally published as Nyiragongo: Flammarion, Paris, 1975.
Information Contacts: Dario Tedesco, Dipartimento Scienze Ambientali, Seconda Universita' di Napoli, Via Vivaldi 43, 81100 Caserta, Italy; Paolo Papale, Istituto Nazionale di Geofisica e Vulcanologia, via S. Maria, 53, I-56126 Pisa, Italy; Orlando Vaselli, Dipartimento Scienze della Terra, via G. La Pira, 4, 50121 Firenze, Italy; Jacques Durieux, Groupe d'Etude des Volcans Actifs, 6, Rue des Razes 69320 Feyzin, France; Dieudonné Wafula, Goma Volcano Observatory, Departement de Geophysique, Centre de Recherche en Sciences Naturelles, Lwiro, D.S. Bukavu, DRC; Andy Harris, Eric Pilger and Luke Flynn, Hawaii Institute of Geophysics and Planetology at the School of Ocean and Earth Science Technology (HIGP/SOEST), University of Hawaii, 2525 Correa Road, Honolulu, HI 96822 USA; Peter Baxter, Department of Community Medicine, Institute of Public Health, University of Cambridge, University Forvie Site, Robinson Way, Cambridge, CB2 2SR, United Kingdom.
French-British scientific team field work report on the 17-18 January eruption
The following was extracted from the 8 March final report of the French-British Scientific Team on the January 2002 Nyiragongo eruption (Allard and others, 2002). On 22 January the team, comprised of Patrick Allard, Peter Baxter, Michel Halbwachs, and Jean-Christophe Komorowski, joined local scientists of the Goma Volcano Observatory (GVO), and the UN-OCHA team (Jacques Durieux, Paolo Papale, Dario Tedesco, and Orlando Vaselli) in Goma.
Precursory signals. The January 2002 eruption of Nyiragongo volcano was heralded by precursory phenomena detected since March 2001 by volcanologists of the GVO. Anomalous seismicity occurred. It included both type-C long-period (LP) events and tremor, which persisted after the February-March 2001 eruption of Nyamuragira (BGVN 26:03), 15 km NW of Nyiragongo, and had increased gently over the rest of the year. LP events and volcanic tremor were mainly registered at the Bulengo seismic station (15 km W of Goma) and were minimal, or absent, at the more remote (40 km) Katale station, located closer to Nyamuragira (Akumbi Mbiligi, GVO, pers. comm.). This observation supported the idea of seismo-magmatic processes occurring at, or closer to, Nyiragongo. This was later confirmed by the registration of earthquake swarms (presumed fracturing events) in the Nyiragongo area: first in October 2001 and then on 4 January 2002, 13 days prior to the eruption's onset. The 4 January earthquakes were accompanied by a darkened plume and rumbling sounds at the summit of Nyiragongo (Akumbi and Kasareka, GVO, pers. comm.).
A fracture from the 1977 eruption runs above Shaheru crater (2,700 m elevation and ~2 km S of the summit, figure 15). A fumarolic vent formed at ~2,800 m elevation along this fracture in October 2001. New cracks and increased fumarolic activity were also detected on the southern inner wall of the summit crater, upslope of Shaheru crater. In November 2001, new fumaroles appeared on the N floor of Shaheru crater itself.
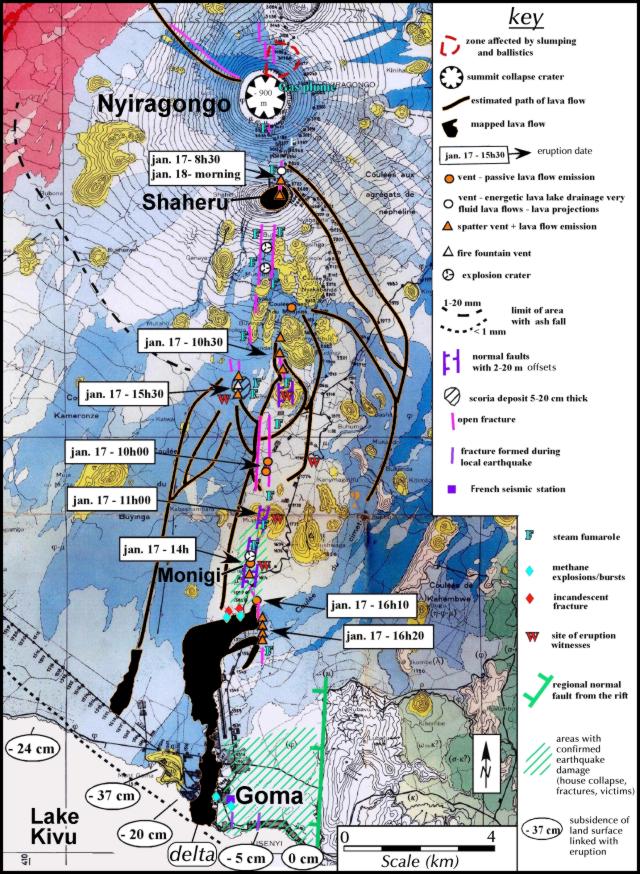 |
Figure 15. Map showing the eruptive chronology, the lava flow field, and phenomena associated with the 17-18 January 2002 eruption of Nyiragongo (geologic base map taken from Thonnard and others, 1965). The map compiles observations of the French-British scientific team, together with the UN volcano surveillance team, the Goma Volcano Observatory, Minerena (Rwanda), UN-OCHA mapping, and includes contributions by D. Garcin and collaborators from the UN, and observers in Goma (subsidence and eyewitness data). Information was preliminary as of 9 February 2002 and subject to change. Courtesy of the French-British team. |
An increase in seismicity during 4-17 January included several felt earthquakes and volcanic tremor. On 16 January, a few hours before the eruption onset, an abnormally strong smell of sulfur dioxide was also noticed by the pilot of a small private aircraft flying N of Nyiragongo (Ted Hoaru, pers. comm.).
Chronology of the eruption. According to GVO, Nyiragongo started erupting at 0825 on 17 January. Earthquakes caused the 1977 fracture system running from 2,800 m elevation into Shaheru crater to open and drain the lava stored in the summit crater. The height and energy of the discharging lava during this initial phase is demonstrated by lava boulders that were perched 6-8 m high in trees at distances up to 30 m from the eruptive fracture above Shaheru. Very fluid lava flows, only 10-15 cm thick at their source, moved across the forested SE slopes of Nyiragongo and rapidly cut the road going N from Goma. The outpouring lava left high-stand marks on trees up to a height of 1.5 m upslope of, and within, Shaheru. The 800-m-wide Shaheru crater was filled with a 3-m-thick lava pond.
Two sets of parallel eruptive fractures, ~300 m apart, further propagated through the S flank of Shaheru cone and extended downslope forming a series of grabens (~5-10 m wide) cutting across banana groves, villages, and older volcanic cones. Between 1000 and 1100, lava flows issued from a series of eruptive vents at ~2,300-1,800 m elevation along this system (figure 16), devastating several villages. Between 1400 and 1620 fractures approached the outskirts of Goma and began to form a line of vents SE of Monigi village only 1.5 km NE of Goma airport (see figure 15, including points labeled 1610 and 1620). These lowest fractures produced intense spattering. This led to the voluminous lava flow that ran through the airport and the heart of Goma, finally entering Lake Kivu during the night. Other eruptive vents that opened higher on the volcano produced voluminous lava flows that also reached Goma. Most of these flows were of aa-type, less fluid, black, and 1-3 m thick. Visible fracturing occurred simultaneously with the onset of lava effusions.
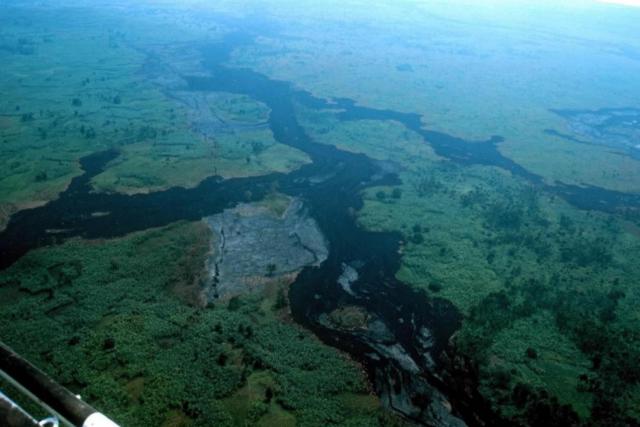 |
Figure 16. Aerial view at Nyiragongo after the January 2002 eruption, showing part of the lava flow field S of Lemera hill and N of Mugara hill. Notice the system of parallel fractures that runs from N (bottom of photo) to S (top of photo), a fissure-vent system that in this instance produced very fluid, pahoehoe lava flows (under 1 m thick). Photo by Jean-Christophe Komorowski. Courtesy of the French-British team. |
Another eruptive fissure opened at 1530 at 2,250 m elevation (figure 15) (2 km W of Kibati). Eyewitnesses reported that this western fissure initially produced passively effusive activity feeding pahoehoe lava flows. However, the presence of a scoria-fall deposit extending over 500 m around the vent indicated at least momentary lava fountaining. Lava flows there were voluminous, aa-type, and 1-2 m thick, that cascaded down a significant sector of the volcano (figure 17). These fed a flow advancing towards Monigi and formed the second main flow that reached Goma on the W, stopping a few kilometers from Lake Kivu.
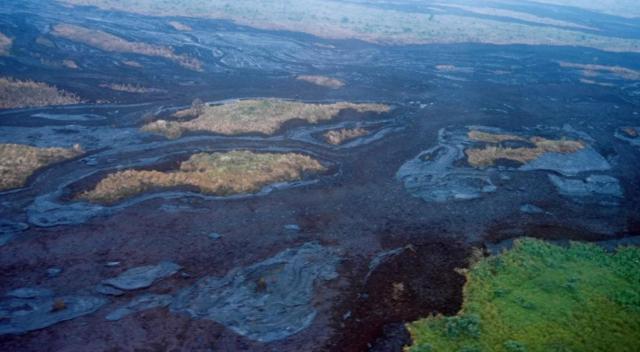 |
Figure 17. Detail of the large pahoehoe and aa lava flows emitted by Nyiragongo during January 2002 from the W vent, which fed a large flow that reached Goma but not Lake Kivu. The two types of lavas were emitted simultaneously and did not exceed 2 m thick. Photo by Jean-Christophe Komorowski. Courtesy of the French-British team. |
From helicopter and ground-based studies of the lava flows the team estimated a total erupted volume of between 20 and 30 x 106 m3, including the lava that flowed into Lake Kivu. First analyses of bulk rock samples (table 3) revealed that lavas erupted from the highest and lowest fractures had very similar compositions, implying their derivation from a single magma batch. These otherwise degassed lavas still contained very high bulk amounts of S, F, and Cl, with slightly higher contents in the products of spattering activity along the Monigi fracture zone. Moreover, the 2002 Nyiragongo lavas are similar to the leucite-bearing nephelinite lavas produced during the 1977 eruption.
Table 3. Chemical analyses of lavas from the January 2002 and January 1977 Nyiragongo eruptions. Analysis at CRPG, CNRS, Vandoeuvre-Les-Nancy, France. All values in wt % (P. Allard, unpublished data, 2002). Courtesy of the French-British team.
| Sample | PA-2 | PA-4 | PA-1 | PA-0 |
| Date | 17 Jan 2002 | 17 Jan 2002 | 17 Jan 2002 | 10 Jan 1977 |
| Site | Upper lava flow | Spatter cone | Main lava flow | 1977 eruption |
| Elev (m) | Shaheru: 2,760 | Munigi: 1,680 | Goma center: 1,540 | Kibati: 2,000 |
| SiO2 | 39.27 | 39.38 | 39.37 | 39.30 |
| Al2O3 | 14.99 | 14.96 | 15.05 | 15.02 |
| Fe2O3 | 13.44 | 13.21 | 13.48 | 13.89 |
| MnO | 0.29 | 0.29 | 0.29 | 0.30 |
| MgO | 4.06 | 4.05 | 4.11 | 4.05 |
| CaO | 12.49 | 12.61 | 12.60 | 12.19 |
| Na2O | 5.94 | 6.10 | 6.01 | 5.57 |
| K2O | 5.69 | 5.72 | 5.70 | 5.65 |
| TiO2 | 2.74 | 2.68 | 2.73 | 2.83 |
| P2O5 | 1.29 | 1.25 | 1.29 | 1.30 |
| Total | 99.79 | 99.83 | 100.17 | 99.69 |
| S tot | 0.18 | 0.22 | 0.19 | 0.15 |
| F | 0.27 | 0.29 | 0.28 | 0.25 |
| Cl | 0.095 | 0.118 | 0.103 | 0.063 |
The UN reported 147 deaths (of whom 60-100 died in an explosion of the Goma central petrol station on 21 January), 30,000 people displaced, and 14,000 homes destroyed by the eruption. Around 470 injured people reportedly suffered burns, fractures, and gas intoxication. However, Peter Baxter reviewed health aspects of the eruption during a visit to Goma in March, and found no evidence for a large number of people injured or killed. He places the number of deaths at about 70, of which 20 occurred as a result of the petrol station explosion; only a few burn injuries needed hospital treatment, and none of those were serious.
As many as 350,000 people fled from the advancing lava, principally towards nearby Rwanda to the E. After two days the majority returned to Goma, despite hazards from hot lava and burning materials. Despite the lack of observers on the scene at the time, it seems that lava emission stopped during the early morning of 18 January, indicating that the entire flank eruption lasted ~24 hours. However, molten lava continued to flow in tunnels and tubes along the main flow that had reached Lake Kivu and spilled into it for a few more days. This created a new fan-shaped lava delta ~800 m across at its widest point along the previous shoreline. Lava flows destroyed part of the airport and Goma's business and commercial center.
Crater collapse and explosive activity. According to Jacques Durieux (UN-OCHA), the solidified lava floor of Nyiragongo summit crater, lying at 320 m below the rim since 1996, was still in place on 21 January, three days after the end of the eruption, but was cut by a N-S steaming graben. It is most likely that this chilled crater floor, although thick enough to initially resist falling, had been weakened by the lava drainage during 17-18 January. Its broad-scale collapse occurred during the night of 22-23 January. A detailed report by eyewitnesses in Rusaya (8 km SW of the summit) indicated that collapse started at 2051 on 22 January, coinciding with a series of felt earthquakes. It was accompanied by roaring sounds and glow above the crater and followed soon after by hot ashfall over Rusaya, that reportedly formed a layer 10 cm thick. GVO registered intense and continuous seismic tremor over the next four hours. Light ashfall also took place over Goma and Gisenyi that night. A helicopter flight on 24 January allowed the team to observe the ash cover on the forested SW flank. They found Nyiragongo's new crater floor ~700 m (instead of 320 m) below the rim, with a blocky and fuming narrow bottom partly covered by remnants of the former crater floor.
Changes in crater morphology correspond to an estimated bulk volume of ~30 x 106 m3 removed during previous lava drainage and subsequent (unquantified but likely secondary) ash emission. This figure compares well with the bulk volume of lava flows, suggesting that these mainly derived from the lava stored in the crater and upper conduit of the volcano. This conclusion is consistent with the identical composition of bulk lava flow samples from the upper and lower fissure vents (table 3).
Intermittent phreatomagmatic explosive activity inside Nyiragongo crater persisted after the collapse. At 0910 on 24 January a dense cloud was visible above the volcano. On 27 January fresh impacts and fresh tree-destructions were discovered in the forest on the upper N flank. Phreatomagmatic activity in the crater was observed directly on 3 February by GVO volcanologist M. Kasareka who had climbed to the summit.
Fracture system. A large fracture system cut the volcano over an elevation range of 1,100 m and extendeed 20 km from N to S, reaching to within 1 km of Goma (figure 15). In some places along the fractures eruptive vents and phreatic (explosion-caused) craters formed. Field observations, combined with eyewitness accounts confirmed the opening of fractures and emission of lava flows either simultaneously or in close succession during the eruption. The overall fissure propagation velocity averaged 2 km/hour. However, massive post-eruptive fracturing was also observed in some places, correlated with intense post-eruptive seismicity. Two weeks after the eruption strong steaming persisted in several sections of the fracture system.
The system of fractures was spectacularly developed in the Monigi area (1,700 m elevation) where it consists of a down-dropped zone ~25-50 m wide with up to 20 m of vertical downward displacement along vertical walls that extend across the topography for ~2 km (figures 18-20). Several fractures opened 1-3 m and ran parallel on either side of the main fault system; they extended out to a distance of 100-300 m from the axis. The fault system passed through several villages (Kasenyi, Buganra). Continuous steaming (60-80°C) was occurring along the faults. Locally, steam vents formed craters 10-15 m deep.
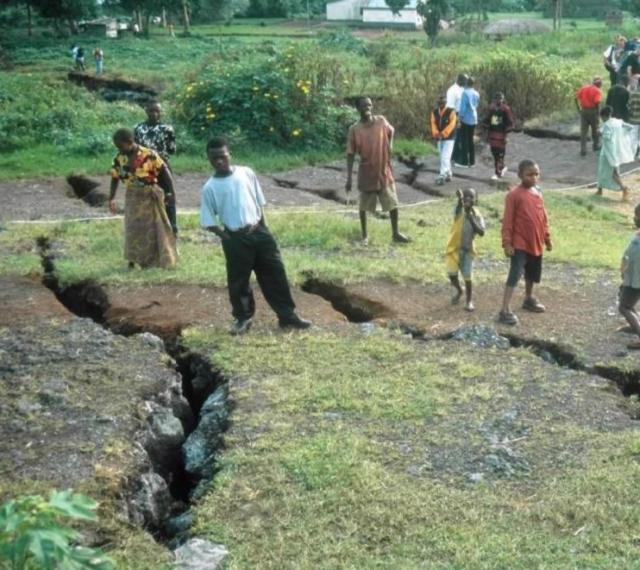 |
Figure 18. Fracture and fault system developed at Nyiragongo on 17 January 2002 in Monigi village. Continuing, strongly felt, post-eruptive seismicity further opened the fractures. Some openings in fissures reached up to 2 m wide and 5-10 m deep. Photo by Jean-Christophe Komorowski. Courtesy French-British team. |
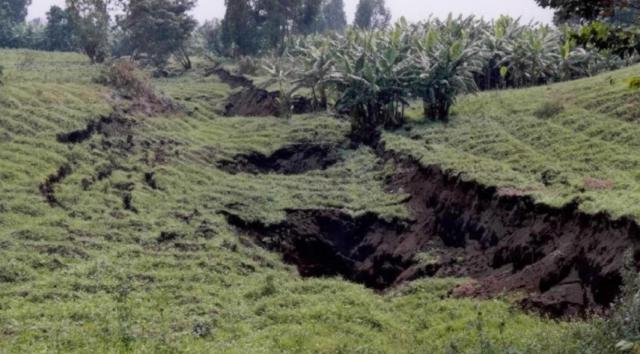 |
Figure 19. Fracture system N of Monigi village at Nyiragongo following the January 2002 eruption. The area between the fractures had dropped by ~ 2 m to form a graben (note leaning trees). Steam vented locally from deep pits (5-10 m). Earth cracks parallel to the main depression extend out to ~ 20-30 m. Photo by Jean-Christophe Komorowski. Courtesy French-British team. |
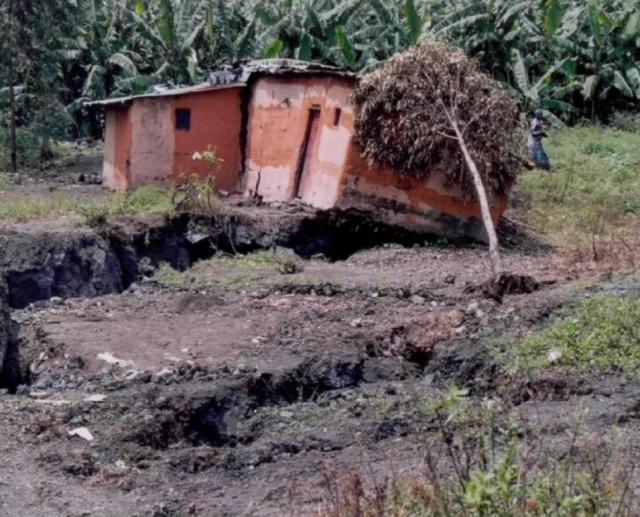 |
Figure 20. A displaced mud-brick house located on the main fracture in Monigi village following the January 2002 eruption of Nyiragongo. The fracture here behaved as a normal fault, with vertical displacement of ~ 0.5 m. Photo by Jean-Christophe Komorowski. Courtesy French-British team. |
A 50- to 80-cm-wide fracture at Monigi village also channeled lava to the surface where it formed a thin chilled margin (figure 21). Withdrawal of magma during the fracture's southward propagation, as confirmed by eyewitness accounts, left a drained lava tube. In a few locations lava spatter was ejected up to 15 m away from the fracture indicating short-lived gas-rich lava venting.
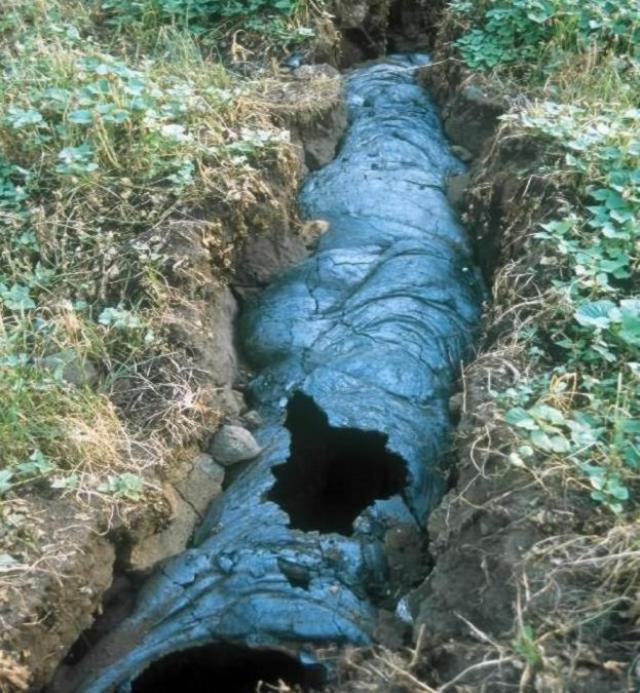 |
Figure 21. The 17-18 January 2002 eruption of Nyiragongo produced this fissure or dike, found near the village of Monigi (figure 15). The dike is ~ 0.6-0.8 m wide and contains a glassy outer envelope of chilled lava (a shell somewhat like a small lava tube). The still-fluid portion of lava drained away southward through the dike conduit towards Goma. Photo by Jean-Christophe Komorowski. Courtesy of the French-British team. |
Fracturing occurred over a short time between 1000 and 1300 from N to S, cutting through thick scoria-cone deposits (figure 22) as well as lava flows several meters thick. Fractures left openings 5-10 m deep. The system transected the W flanks of the Mubara cinder cone, where fractures spread over an area of 100-200 m forming several sub-parallel strands with 0.2-3 m of vertical displacement. This area could present future slope stability problems.
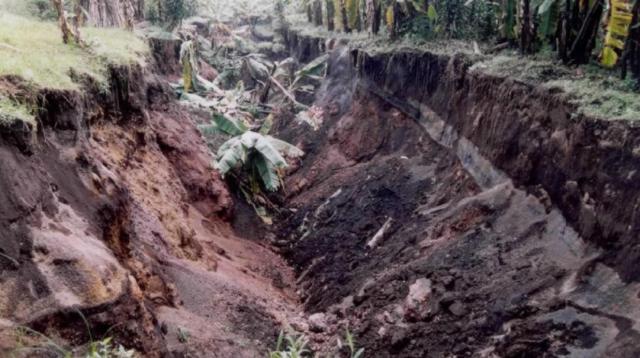 |
Figure 22. Photo following the January 2002 Nyiragongo eruption of the central depression in the Monigi fracture-graben system through old scoria fall deposits from Mugara cinder cone located just N. Width is about 25 m and depth 10-15 m. Local steaming indicated that a dike was near the surface and was involved in the formation of this feature. Photo by Jean-Christophe Komorowski. Courtesy French-British team. |
Seismicity. Intense felt seismic activity occurred during but mainly after the eruption, including tectonic earthquakes M 3.5 or larger. The number of earthquakes gradually declined with time but has remained abnormally high. As of early March 2002, earthquakes were still felt intermittently.
The seismic network that operated during the eruption and up until 30 January did not allow an accurate assessment of the location and depth of earthquakes. However, the short time intervals between the arrival of P and S waves as measured on seismograms indicated local sources. The persistence of numerous LP events and sequences of tremor after the eruption raised concerns about the possibility of continuing magma intrusions and phreato-magmatic eruptions inside the summit crater. This intense post-eruptive seismicity, combined with widespread ground subsidence in the Kivu rift (BGVN 27:03), as well as the synchronism of the eruption with 20-km-long fractures and the broadly consistent volumes of bulk lava flows and summit crater collapse, led the team to propose that the 2002 Nyiragongo eruption was most likely triggered by tectonic spreading of the Kivu rift.
Gas emanations. During and after the eruption people in Goma confronted a variety of gas emissions. Abnormal odors of hydrocarbons were reported in many parts of the city, prompting the use of a portable infrared spectrometer allowing in-situ gas analysis. The team found that the smells were due to hydrocarbon-bearing methane- and CO2-rich gas emanations from the ground, which occurred in areas separated by 300-800 m from the lava flows and which, therefore, had no relationship with organic matter fired or heated by the flows. These emanations, with methane concentrations of a few percent and sometimes approaching the 5% flammability threshold in air were found both outdoors diffusing up through pavements along streets, in gardens, and in buildings. At a school, methane measured under 1%. Near a drain system for rainwater ~200 m from a lava flow's edge methane was found in the air along the ground but at less than 1%. However, at a nearby concrete roof over a drain the methane content was 2%, together with 2% CO2.
A long fissure passed under a church in the center of Goma. CO2 emissions caused two women cleaning the church to faint. According to GVO, similar fractures are scattered throughout the area. Heat from engulfing lava flows led to the combustion of both plants and a wide variety of dissimilar materials (houses, cars, petrol tanks, etc.).
Flames of burning gas and vegetation were observed and analyzed in different parts of the flows, both inside and outside the city. On 23 January the team measured a temperature of 500°C for blue flames burning on a still-hot lava flow. The air in cracks near the flames contained about 2% methane, the smell of which was readily detectable in the area. According to witnesses, on the previous day these flames had been orange in color and 1.5 m high, suggesting that the fire was originally caused by the burning of organic matter inside the flow and that the flames resulted from the combustion of distillates of vegetation. Slow combustion of vegetation and organic matter was widespread after the eruption in all the areas affected by Nyiragongo lava flows.
Numerous gas bursts were reported to have occurred during-but mostly after-the eruption, principally during 20-22 January when the most intense seismicity occurred. No one was injured by the explosions. Eyewitnesses to these events saw that the gas bursts shortly followed strongly felt earthquakes and were accompanied by strong smells of hydrocarbon gas. In several places 300-400 m distant from lava flows, these gas bursts ripped through cement and stone pavement in Goma's houses and streets. Gas concentrations stood at 5% CO2 and 3-4% methane in one case, and at 1% CO2 and 2.6% methane in an office. Not far away in a garage a 21 January explosion had blown apart a concrete floor 10 cm thick. But when visited 4 days later, a measurable gas anomaly was absent.
Most of the gas bursts occurred at places or in areas that are broadly aligned with the N-S fracture system cutting the volcano and where ground gas emanations were persisting. Although these explosions occurred at the time of felt earthquakes, the associated seismically induced ground movement was not severe enough to have been responsible for the observed localized type of damages. The strong gas smells and the elevated methane concentrations were taken as evidence of a methane-driven origin for the explosions. Sub-surface methane concentrations must have been locally high enough to allow spontaneous ignition of the methane upon contact with oxygen during and following seismic loading. Further study will be necessary to elucidate the origin of that methane. The team emphasized that methane is weakly abundant in permanent gas vents (locally called "mazukus") that occur in the area, emanating through old lava flows, such as those to the W of Goma (CO2: 93.2 %; methane, CH4: 0.07% by volume).
The team witnessed a small methane burst on 27 January while inspecting ground fractures in Monigi that displayed persistent incandescence and very high temperatures (970°C on 24 January). These sites are located in the middle of a small village and constitute a major attraction for cooking and for children who play nearby. The fracture, through which no lava had erupted, was formed parallel to the main eruptive fractures but there crosses through thick old lava flows. The team inferred that incandescence was caused by the presence at depth of relict heat from the magma body (dike) that fed the nearby lava flows that covered Goma (within 1 km). The gas burst occurred at ~2 m from the site where maximum incandescence had persisted for a week and where scientists were measuring temperatures and collecting gases. Most likely, the scientific fieldwork brought air in contact with a pocket of methane, which then spontaneously burst. A few fist-sized blocks of old lava were popped up to a distance under 1 m, without causing any injuries to the numerous bystanders. At another site, minor bursts occured every few minutes as wind blew through the fractures.
In contrast, minor explosions of phreatic origin also occasionally occurred in different places. For example, at the lava delta, when molten lava entered Lake Kivu, and at Goma when bulldozing the lava flows suddenly depressurized steam produced by the high temperature of lava flows along the ground.
Gas hazard of Lake Kivu. Lake Kivu (485 m deep) is known to contain an immense amount of both CO2 (1,000 times that in Lake Nyos, Cameroon) and methane stored in solution in its waters. In the case of a major disturbance of the density stratification of gas-charged water in this lake, a huge gas release could occur. Concerns about such a hazard were raised when the lava flowed into the lake, together with the opening of new fractures, strong seismicity, and the poorly understood possibility of an underwater extension of the eruption.
A variety of manifestations were observed at the surface of the lake after the eruption. During 20-21 January, coincident with felt earthquakes, the lake water was seen uprising along the shore 9 km to the W of Goma and, in three separate areas, the water became dark and warm, with gas bubbles and an associated odor (hydrogen sulfide). Many dead fish were seen in and around these areas. Similar phenomena were reported along other sectors of the lake's shore. Additionally, yellow flames were reported to have been seen on occasion at the surface of Lake Kivu well away from the lava flows, suggesting methane burning. Unpleasant odors and experiences were reported by swimmers in Lake Kivu before the eruption, again ascribed to gas emissions. These reports need to be followed up by a survey of gas concentrations at the lake surface.
The hazard of lava flows entering and disturbing the lake waters has not been extensively studied previously. The hot lava could disturb the lake stability by starting lake-water convection. This might trigger a gas burst resulting in a lethal cloud of CO2 and methane flowing over an unknown area around the lake. In order to assess the problem, Halbwachs organized underwater investigations, first with the help of scuba divers from UN-OCHA and, in a second stage (7-10 February), using a submersible sent from France with the support of EC-ECHO.
Local divers reported the presence of hot water (40-60°C) surrounding the lava delta. Gas bubbling could be observed locally, but its limited extent suggested that neither the gases, nor the solidified lava presented a risk for the local water supplies. In contrast, potential hazard from submarine lava tubes required investigations at greater depth. Despite the poor visibility due to abundant particles in suspension, the surveys with the submersible revealed that the lava flow and tubes had descended to ~80 m depth in the lake by the shore at Goma. Fortunately, such a depth is much smaller than the critical depths of 200-300 m at which Lake Kivu's waters contain more abundant dissolved carbon dioxide, closer to the saturation limit.
In order to evaluate the influence of the hot mass of lava that entered into Lake Kivu on its physico-chemical stratification, during early February a series of samples were collected at varying depths, and 40 vertical lake soundings were undertaken. In collaboration with Halbwachs, these measurements were performed by two limnologists: Klaus Tietze (PDT GmbH, Celle, Germany) and Andreas Lorke (EAWAG Laboratory, Lucerne, Switzerland). They measured depth, temperature, pH, electrical conductivity, turbidity (transparency to white light), and dissolved-oxygen content. Preliminary results suggested a change in the water stratification since the last measurements by Klaus Tietze 20 years ago. A new homogenous water layer was found at depths between 200 and 250 m. Near the lava delta the temperature and turbidity profiles showed some perturbations between 50 and 120 m depth. Away from the delta, a thin (3 m) layer of slightly warmer water lay at ~80 m depth. The turbidity was rather low close to the lava flows but increased rapidly away from it. More synthesis and analytical work continues in order to assess fundamental questions on the stability of Lake Kivu stratification.
References. Allard, P., Baxter, P., Halbwachs, M., and Komorowski, J-C, 2002, Final report of the French-British scientific team: submitted to the Ministry for Foreign Affairs, Paris, France, Foreign Office, London, United Kingdom and respective Embassies in Democratic Republic of Congo and Republic of Rwanda, 24 p.
Thonnard, R.L.G., Denaeyer, M-E., and Antun, P., 1965, Carte volcanologique des Virunga (1/50000), Afrique Central, Feuile No. 1: Centre National de Volcanologie (Belgique), Missions Gèologiques et Gèophysiques aux Virunga, Ministère de L'Education et de la Culture, Bruxelles, Belgium.
Information Contacts: Patrick Allard, Laboratoire Pierre Süe, CNRS-CEA, Saclay, France; Peter Baxter, University of Cambridge, United Kingdom; Michel Halbwachs, Université de Savoie, Chambéry, France; Jean-Christophe Komorowski, Institut de Physique du Globe de Paris, France.
Increased tremor during April-May; lava fountain observed in crater
During the catastrophic eruption of Nyiragongo on 17 January 2002 all lava drained from the summit, leaving an empty crater more than 700 m deep. Harmonic tremor that was registered at two seismic stations on Nyiragongo's S flank beginning in late April continued to increase irregularly in amplitude through at least May 2002. Anomalous clouds were noticed above the crater on two occasions since 1 May, but no glow was noted at night. A brief flight over the summit during daylight on 14 May failed to disclose eruptive activity. That day, increasing tremor amplitude (including many hours of banded tremor with a one-hour period), suggested that magma was moving within the summit area.
During 17-18 May an expedition traveled to the summit to look for any possible extrusive activity, and a small lava fountain was observed on the floor of the crater. It vented along the same NW-SE-trending fissure that apparently drained the crater in January. The lone fountain ejected incandescent spatter to a height of ~12 m and built a low spatter rampart, but no lake formed. Several small incandescent vents on the rubble-filled crater floor ejected hot gases. This observation indicated that magma had risen high within the edifice. A long period of extrusive activity could prevail in the years ahead, assuming the typical pattern of development in Nyiragongo's historical eruptions, and this was interpreted as no cause for immediate concerns. A similar pattern followed the January 1977 eruption, when in June 1982 activity resumed in Nyiragongo's main crater, beginning with a lava fountain that fed a new lava lake in less than two weeks. It remained active until September 1982.
Information Contacts: Celestin Kasereka, Jean-Pierre Bajope, and Mathieu Yalire, Goma Volcano Observatory, Departement de Geophysique, Centre de Recherche en Sciences Naturelles, Lwiro, D.S. Bukavu, Zaire; Jacques Durieux, Dario Tedesco, and Jack Lockwood, Groupe d'Etude des Volcans Actifs, 6, rue des Razes, 69320 Feyzin, France.
New fissure vents and lava fountains; largest regional earthquake in 30 years
An expedition visited the summit of Nyiragongo during 17-18 May 2002 to look for possible extrusive activity (BGVN 27:05). During the visit, a small lava fountain was observed on the floor of the crater.
A team ascended to the summit by foot during 16-17 July 2002. As they climbed the team first observed a gray-black plume at 2,700 m elevation, and began to clearly smell SO2 at 3,100 m. From the crater rim (3,425 m) the inner crater was only partially visible because of dense fog and the dark plume. Sounds of molten lava (fountains and spatters) falling on rocks were heard. Despite the extremely poor visibility, it was possible, around 0600, to witness some lava fountaining. The height was estimated as 100 m above the crater floor. During the night, a continuous and strong ashfall affected the upper part of the volcano. On the morning of 17 July the ashfall had ended and only a white plume exited the crater. It was clear that the lower and central part of the crater was extremely active and the presence of a new lava lake was suspected.
On 20 July, the Goma Volcano Observatory (GVO) reported that during the previous weeks, episodes of tremor (some lasting for 23 hours per day) were recorded on several seismic stations around the volcano. Because of poor atmospheric conditions, no helicopter flights were organized. From very limited views through clouds, a white to gray plume was suspected to rise above the crater.
A series of Nyiragongo crater observations were made in September and October of 2002. During 29-30 September the level of the bottom of the crater was stable and occupied by accumulated debris. The crater also contained several vents, the largest of which continued to eject gases at very high pressure. The red coloration of the plume at night was attributed by the GVO to Strombolian explosions and combustion of gases. Burned plants were seen on the crater's E side. An 8 October flight found the crater to be entirely filled by visible vapor as a result of magma degassing. An 11 October flight revealed a new crack at the top of Nyiragongo (at 01°36.840' S and 029°14.505' E), trending in an E-W direction. Scientists conducted gas measurements on 12 October on the ground at Kibunga (Binza); the sampled gases lacked indications of deep origin.
Dario Tedesco indicated that during the two nights preceding a large earthquake on 24 October (see "Regional seismicity" below), incandescence was visible above Nyiragongo's crater from Goma. Witnesses also reported that around this time they saw projections of incandescent lava rising above the crater's confines (perhaps signifying a particularly intense episode of lava fountaining).
Regional seismicity. During 29 September-5 October, GVO noted a slight decrease in high-frequency (HF) and a strong increase in long-period (LP) seismicity compared to mid-August. Specifically, a total of 260 HF and 1,024 LP earthquakes occurred during the week (compared to 290 HF and 287 LP events during 18-24 August). Volcanic tremor was registered at all seismic stations (except in Lwiro), consistent with the eruption at Nyamuragira and a gas plume at Nyiragongo. The tremor was slightly less significant at Nyamuragira (Katale station) than at Nyiragongo (Rusayo station). The spatial distribution of the epicenters revealed that the LP earthquakes were mostly located in the vicinity of Nyamuragira. In contrast, HF epicenters were dispersed, occurring both in the N, at Virunga and Masisi, and in the S, at Lake Kivu. Located magmatic and HF earthquakes tended to be distributed to the E of Nyamuragira and Nyiragongo, at depths of 5-15 km. Tremor, practically constant in amplitude, duration (several hours per day), and temporal distribution, registered at Katale and Rusayo stations. The tremor was taken to indicate great activity at Nyamuragira and Nyiragongo. At each volcano, there was a negative correlation between the abundance of tremor and presence of LP swarms.
During 6-12 October, GVO noted a total of 342 HF and 996 LP earthquakes. Magmatic and HF earthquakes at Nyamuragira and Nyiragongo yielded hypocenters at 5-20 km depths. Other observations of seismicity were similar to the previous week.
A tectonic earthquake was felt in Goma and surrounding areas on 8 October 2002. The region had been the scene of an unusual number of recent earthquakes (table 4). The U.S. Geological Survey's National Earthquake Information Center (NEIC) catalog for 2002 included an anomalously large swarm of tectonic earthquakes in the area, including many events over M 4 during January 2002. Epicenters in the January swarm were commonly within 50 km, and in one case 6 km, of Nyiragongo. The 8 October earthquake mentioned above is absent from table 4, perhaps because of insufficient magnitude or depth.
Table 4. A list containing all earthquakes of M 2 or greater within 200 km of Nyiragongo during 1 January 2002-26 November 2002. Data courtesy of US Geological Survey, National Earthquake Information Center (NEIC) catalog of historical and preliminary data; Bruce Presgrave (NEIC) first noted the anomalously large number of earthquakes in January 2002. Magnitudes include mb, Ms, Mw, and Mn; all are computed magnitudes (where available). Moment magnitude (Mw) is a preferred magnitude scale for large earthquakes; it is in common use, computed from a long-period body- and mantle-wave moment tensor-inversion method. Surface-wave magnitude (Ms) is computed from the vertical component of surface waves of 20-second period; Ms does not increase beyond magnitude 8, and thus indicates smaller values than some other magnitude scales for large earthquakes (not a big factor here). Body-wave magnitude (mb) is computed using short-period P waves; for large natural earthquakes it is generally less uniform and reliable than the moment magnitude. The Mn magnitude, sometimes labeled MbLg, is computed from the vertical component of 1-second Lg seismic-waves (short-period surface waves).
| Date | Coordinates (decimal degrees) | mb | Ms | Other magnitude | Radial distance (km) |
| 04 Jan 2002 | 0.136°S, 29.758°E | 4.8 | 4.5 | -- | 162 |
| 17 Jan 2002 | 1.629°S, 29.152°E | 4.3 | -- | 4.30 Mn | 16 |
| 17 Jan 2002 | 1.684°S, 29.077°E | 4.7 | -- | 4.90 Mn | 26 |
| 18 Jan 2002 | 1.578°S, 29.031°E | 4.2 | -- | 4.70 Mn | 25 |
| 18 Jan 2002 | 1.780°S, 29.076°E | 4.3 | -- | 4.70 Mn | 34 |
| 18 Jan 2002 | 1.662°S, 28.866°E | 4.2 | -- | -- | 45 |
| 19 Jan 2002 | 1.761°S, 28.969°E | 3.9 | -- | 4.40 Mn | 41 |
| 19 Jan 2002 | 1.931°S, 29.579°E | 4.6 | -- | 4.70 Mn | 58 |
| 19 Jan 2002 | 1.879°S, 29.059°E | 4.2 | -- | 4.40 Mn | 44 |
| 20 Jan 2002 | 1.681°S, 28.981°E | 4.9 | 4.6 | 5.20 Mn | 34 |
| 20 Jan 2002 | 1.641°S, 29.042°E | 3.9 | -- | 4.40 Mn | 26 |
| 20 Jan 2002 | 1.599°S, 29.050°E | 4.2 | -- | 4.60 Mn | 23 |
| 20 Jan 2002 | 1.726°S, 29.168°E | 3.8 | -- | 4.20 Mn | 24 |
| 21 Jan 2002 | 1.726°S, 28.854°E | 4.6 | -- | 4.90 Mn | 49 |
| 21 Jan 2002 | 1.505°S, 28.941°E | 4.2 | -- | 4.50 Mn | 34 |
| 21 Jan 2002 | 1.776°S, 29.041°E | 4.9 | 4.5 | 5.10 Mn | 36 |
| 21 Jan 2002 | 1.903°S, 29.117°E | 4.7 | -- | 5.10 Mn | 44 |
| 22 Jan 2002 | 1.787°S, 28.971°E | 4.0 | -- | 4.30 Mn | 42 |
| 22 Jan 2002 | 1.746°S, 29.095°E | 3.9 | -- | 4.50 Mn | 30 |
| 22 Jan 2002 | 1.515°S, 28.993°E | 4.9 | 4.7 | 5.20 Mn | 28 |
| 22 Jan 2002 | 1.551°S, 28.995°E | 4.4 | -- | 4.70 Mn | 28 |
| 22 Jan 2002 | 1.461°S, 29.249°E | 4.2 | -- | 4.60 Mn | 6 |
| 30 Jan 2002 | 1.633°S, 28.886°E | -- | -- | 4.60 Mn | 42 |
| 11 Feb 2002 | 1.386°S, 29.010°E | 4.4 | -- | -- | 30 |
| 09 Sep 2002 | 2.567°S, 28.867°E | 4.5 | -- | -- | 123 |
| 24 Oct 2002 | 1.899°S, 28.904°E | 5.8 | 6.3 | 6.10-6.20 Mw | 56 |
| 24 Oct 2002 | 1.988°S, 28.875°E | 5.3 | 5.5 | 5.50 Mw | 66 |
A violent earthquake (Mw 6.1-6.2), one of the two largest in at least 30 years in this area, occurred at 0808 on 24 October (table 4). GVO reported that it was felt in surrounding areas, including Rutshuru, Goma, Bukavu, Butare, Kigali, and Bujumbura. GVO's seven operating seismic stations (Lwiro, Goma, Kunene, Katale, Kubumba, Rusayo, and Bulengo) recorded the earthquake but the high amplitude of the signals caused saturations, thwarting attempts to use local data to obtain rapid, meaningful solutions for seismic parameters. A second large-magnitude event (Mw 5.5) occurred about an hour later. Both earthquakes struck SW of Nyiragongo, at distances of 56 and 66 km (tables 4 and 5).
Table 5. A list containing earthquakes of M 5 or greater located within 300 km of Nyiragongo during 1 January 1973-26 November 2002. Earthquake depths were typically ~10-33 km. Data courtesy of US Geological Survey, National Earthquake Information Center (NEIC) catalog of historical and preliminary data. See the previous table caption for a discussion of the magnitude types.
| Date | Coordinates (decimal degrees) | mb | Ms | Other magnitude | Radial distance (km) |
| 21 Nov 1973 | 3.607°S, 28.186°E | 5.1 | -- | -- | 258 |
| 25 Apr 1974 | 0.995°N, 30.091°E | 5.0 | -- | -- | 292 |
| 06 Jan 1977 | 2.509°S, 28.702°E | 5.3 | -- | -- | 124 |
| 14 Apr 1977 | 2.456°S, 28.940°E | 5.2 | -- | -- | 108 |
| 29 Dec 1977 | 0.013°S, 29.683°E | 4.8 | 5.4 | -- | 175 |
| 29 Jan 1978 | 3.929°S, 29.350°E | 5.3 | -- | -- | 266 |
| 25 Oct 1979 | 3.412°S, 29.070°E | 5.2 | -- | -- | 209 |
| 09 Jan 1980 | 3.445°S, 27.442°E | 5.0 | 4.6 | -- | 292 |
| 21 May 1981 | 2.698°S, 28.661°E | 5.0 | -- | -- | 145 |
| 20 Jul 1981 | 2.709°S, 28.461°E | 5.0 | 4.0 | -- | 157 |
| 09 Jan 1982 | 1.671°S, 28.338°E | 5.0 | -- | -- | 102 |
| 03 Jul 1982 | 3.737°S, 28.951°E | 5.2 | -- | -- | 246 |
| 04 Jul 1982 | 3.778°S, 28.917°E | 5.0 | -- | -- | 251 |
| 15 Jan 1983 | 0.513°N, 30.199°E | 5.2 | 4.1 | -- | 247 |
| 24 Sep 1983 | 1.563°S, 28.381°E | 5.2 | -- | -- | 96 |
| 04 Sep 1990 | 0.479°S, 29.085°E | 5.0 | 5.0 | -- | 116 |
| 18 Sep 1990 | 4.060°S, 29.483°E | 5.0 | 4.3 | -- | 281 |
| 05 Feb 1994 | 0.593°S, 30.037°E | 5.8 | 6.0 | 6.20 Mw | 249 |
| 29 Apr 1995 | 1.315°S, 28.605°E | 5.1 | 4.9 | -- | 75 |
| 24 Mar 1996 | 0.565°N, 30.169°E | 5.0 | -- | 5.40 Mw | 251 |
| 02 Mar 2000 | 2.582°S, 27.826°E | 5.4 | 4.5 | -- | 196 |
| 02 Mar 2000 | 2.371°S, 28.026°E | 5.0 | 4.1 | -- | 165 |
| 29 Jun 2001 | 0.292°N, 29.972°E | 5.0 | 4.4 | 5.30 Mw | 215 |
| 20 Jan 2002 | 1.681°S, 28.981°E | 4.9 | 4.6 | -- | 34 |
| 21 Jan 2002 | 1.776°S, 29.041°E | 4.9 | 4.5 | 5.10 Mn | 36 |
| 21 Jan 2002 | 1.903°S, 29.117°E | 4.7 | -- | 5.10 Mn | 44 |
| 22 Jan 2002 | 1.515°S, 28.993°E | 4.9 | 4.7 | 5.20 Mn | 28 |
| 24 Oct 2002 | 1.899°S, 28.904°E | 5.8 | 6.3 | 6.10-6.20 Mw | 56 |
| 24 Oct 2002 | 1.988°S, 28.875°E | 5.3 | 5.5 | 5.50 Mw | 66 |
Soon after the earthquakes, a GVO team measured the temperature and composition of gas released from fractures on the S flank of Nyiragongo and along the N shore of Lake Kivu. No significant changes were found with respect to the measurements taken in the previous days.
Damage was reported at Bukavu (fissures in house walls), Lwiro (some houses destroyed, roof of the seismic station collapsed, and walls of laboratories fissured), Mugeri (a church destroyed), Goma (several house walls fissured, and a truck accident killed two people), and Kigali (walls of several houses fissured, and a school wall collapsed, causing panic).
Since earthquakes commonly occur and are expected to occur again in the future in the active rift, GVO recommended an education campaign discussing seismic hazards and response related to Africa's Great Lakes region.
Information Contacts: Kavotha Kalendi Sadaka, Celestin Kasereka, Jean-Pierre Bajope, Mathieu Yalire, and Paolo Papale, Goma Volcano Observatory, Departement de Geophysique, Centre de Recherche en Sciences Naturelles, Lwiro, D.S. Bukavu, DR Congo; Jacques Durieux, Dario Tedesco, and Jack Lockwood, Groupe d'Etude des Volcans Actifs, 6, rue des Razes, 69320 Feyzin, France; Bruce Presgrave, National Earthquake Information Center, P.O. Box 25046, MS 966, Lakewood, CO 80225, USA (URL: https://earthquake.usgs.gov/); United Nations Office for the Coordination of Humanitarian Affairs (OCHA), United Nations, New York, NY 10017, USA (URL: https://reliefweb.int/).
Aftershocks, lava lake, SO2 fumes, acidic rains, and highly fluorinated water
Nyiragongo was last reported on through late October 2002 (BGVN 27:10). This report covers through 21 December, an interval in which the hazard status remained high, with the population asked to exercise vigilance (code Yellow). Included here are reports from the Goma Volcano Observatory (GVO), and from Dario Tedesco and Simon Carn on geochemistry and atmospheric SO2. Several episodes of strong SO2 outgassing and unfavorable wind directions caused elevated concentrations of the gas to enter cities and acid rain to damage vegetation and water supplies. High fluorine was found in some rainwater samples. The 24 October 2002 earthquake's aftershocks and the state of the volcano led to significant stress on the regional inhabitants, including those in Goma.
During the October-December reporting interval, the GVO reports noted that their roughly weekly Nyiragongo observational climbs disclosed considerable changes on the crater's floor, a spot ~700 m down inside the summit crater. Comparisons between photos taken on 24 November and 9 December 2002 revealed the merging of two adjacent molten-surfaced lakes and the birth of another similar, though smaller, lava lake at a point well over 100 m away from the merged ones. The deep crater is often filled with fumes too dense to clearly see the crater floor, and in the above-mentioned cases photographers had just 5 to 10 seconds of moderate visibility to capture their photos. This helps explain why the status and behavior of the lava lakes is often ambiguous (see BGVN 26:03). Adequate visibility during a climb on 18 December revealed that the sole lava lake seen then stood ~45 m in diameter, its surface restless and agitated.
In accord with one or more dynamic and molten-surfaced lava lakes on 20 December, SO2 gas blew into Goma, causing residents to panic. Scoria falls were noted in late October, and in one particular case by residents of the SW-flank settlement of Rusayo at around 1100 on 15 November. It was noted in October that vegetation surrounding the crater's perimeter, particularly on the W flank, had sustained acid burns from abundant degassing. During October-21 December vapors over the crater frequently glimmered red at night. The 15 November visit disclosed the escape of high-temperature gases and the existence of fissures cutting across the residual platform of 17 January 2002 deposits. Fumaroles along fissures discharged gases. SW-flank fissures were also seen.
GVO summarized the volcano observations for the interval 15-28 December 2002, noting a permanent strong gas plume at 4,200-6,000 m altitudes. They again confirmed a permanent small lava lake, about 50 m in diameter with a central active lava fountain sending molten material to ~40 m heights. Minor amounts of Pelé's-hair ash fell in both Rusayo and Kibati villages. Residents of those villages and Kibumba reported seeing incandescence in the crater.
Residents of Kibati and Kibumba were greatly concerned the night of 27-28 November due to visible glimmer that appeared be coming toward them from Nyiragongo. The glimmer was benign activity in the crater rather than lava flows descending the flanks. This behavior was associated with lava-lake degassing.
Other observatory projects in late October to late December included the installation and maintenance of lake-level sensors on Lake Kivu, installation of thermal sensors at selected spots, and improved seismic telemetry.
Deformation surveys on 31 October, 2 November, and 13 November 2002 measured the distance between cross-fracture survey points (nails) along the scarps of Monigi, Lemera, and Shaheru. The results indicated that offsets remained comparatively stable, with little change compared to previous measurements (table 6). New cross-fracture measurements were also initiated at the Mapendo station. Data collected in late December continued to lack evidence of new deformation.
Table 6. Nyiragongo deformation measured along scarps on 2 and 13 November. These reportedly showed strong consistency with preceding measurements. New measurements were initiated at newly established survey points on 13 November. These were in the Mapendo neighborhood (a site towards Gift Bosco) on a revived fracture there. Courtesy of OVG.
| Date | Monigi | Lemera | Virunga | Shaheru | Mapendo |
| 02 Nov 2002 | 8.31 m | 7.55 m | 93.4 cm | 14.72 m | -- |
| 13 Nov 2002 | 8.31 m | 7.55 m | 93.4 cm | -- | 15.4 cm |
Geochemistry. SO2 fluxes increased during October and November 2002, rising from below detection limits to a few thousands metric tons per day (t/d), then to up to ~20,000 t/d. Dario Tedesco suggested that the increase might be due to a more efficient conduit geometry allowing gases access to the surface. The process may have accompanied upward movement of magma or its arrival at the surface.
During the last half of November through 2 December the TOMS SO2 estimates were under reliable detection limits due low concentrations. After that, on 7 and 11 December, respectively, TOMS data measured considerable SO2, ~12,000 and ~11,000 metric tons per day (t/d) (table 7).
Table 7. SO2 fluxes at Nyiragongo based on the TOMS instrument. Courtesy of Simon Carn.
| Date | Daily SO2 flux (t/d) |
| 16 Nov-02 Dec 2002 | Not significant |
| 03 Dec 2002 | Less than 5,000 (weak signal) |
| 04 Dec 2002 | Data gap - no data over Nyiragongo |
| 05 Dec 2002 | ~6,000 |
| 06 Dec 2002 | Data gap - no data over Nyiragongo |
| 07 Dec 2002 | ~12,000 |
| 08 Dec 2002 | Data gap - no data over Nyiragongo |
| 09 Dec 2002 | Less than 5,000 (weak signal) |
| 10 Dec 2002 | Data gap - no data over Nyiragongo |
| 11 Dec 2002 | Less than 5,000 (very weak signal) |
| 12 Dec 2002 | Data gap - no data over Nyiragongo |
| 13 Dec 2002 | ~11,000 |
Thus the degassing had not risen to peak October-November levels, but increased since early December, either in terms of plume altitude, SO2 concentration, or both. Simon Carn noted that "We are also sometimes seeing discrete SO2 clouds to the W of the volcano, rather than SO2 plumes emerging from the volcano, perhaps suggesting discontinuous degassing."
Tedesco also pointed out that the higher SO2 fluxes accompanied acid rain falling on Goma and surroundings, with some rain samples also containing up to 15 parts per million (ppm) fluorine ion. (For comparison, the U.S. Centers for Disease Control and Prevention recommended a standard in drinking water at 0.7-1.2 ppm, a level that provides a means of preventing tooth decay without compromising public safety.) In December 2002, Goma residents complained about the acid rain, which besides affecting drinking water, put area crops in danger. Accordingly, scientists began collecting rainwater samples with the intent of carrying out regular analyses.
SO2 blew towards the S on 4 and 5 November exposing people on the upper S flanks. Researchers measured gas concentrations in Goma on 20 November at 20 selected points. They found CO2 concentrations of 0-4%, and much lower concentrations of CH4, H2S, and CO. On 4-5 December the wind carried SO2 gas into S-flank settlements. During the December, analysis of fumaroles at Sake, Mupambiro, Bulengo, and Himbi revealed similar concentrations to those seen in earlier visits (including the elevated values at Sake/Birere, which in October 2002 measured 35.1% CO2, and Mupambiro, which on 7 December measured 63.1% CO2). It was expected that the current rainy season favored enhanced CO2 flow from the ground.
Nyiragongo summit geochemical surveys in mid-November found temperature elevations of 1°C (except one summit site with a 5.7°C rise). CO2 concentrations had then risen to 3%. In a fissure called Shaheru, CO2 concentrations stood at 53%. Methane was found at all sites in dilute concentrations, ~0.1 %. H2S was below the limit of detection at all the visited sites.
The human side of January 2002 volcanism and the 24 October earthquake. Aftershocks to the unusually large earthquake of 24 October 2002 continued to be felt in the epicentral area through December. For example, Goma residents felt an M 4 tectonic earthquake with a 13 km focal depth on 13 December.
Field excursions in the reporting period revealed that the 24 October 2002 earthquake and aftershocks damaged towns in the Kitembo and Minova areas (including the towns Lwiro and Nyabibwe). The visits suggested that no lives were lost but about ten houses sustained cracks. Residents there still remained in need of humanitarian assistance, including safe housing, food, and medicine.
The December aftershocks were not reported to have caused significant damage; however, an earlier Reuters news article, published on 24 January 2002, described how about six days after the volcanism ceased in Goma, residents there had "flocked to receive aid" at distribution points, many having then gone about a week without food supplies. The news article went on to say, "the UN aims to distribute about 260 tonnes of food, which it says is enough to feed 70,000 people for a week. Each family-of an assumed seven people on average-will receive 26 kg of highly nutritious supplies including maize meal, beans, vegetable oil, and corn soya blend." The aid groups also distributed clean drinking water. The intensity of the volcanic and earthquake disasters had clearly left residents weakened and with reduced food security.
Previous Bulletin reports have included relatively few photographs of the scene in Goma due to the January 2002 eruption when lava flows overran the city. Figures 23-26, all sent to us by Wafula Mifundi, are intended to help make up for this deficiency. In many cases within Goma intense fires accompanied the lava flows. Several of the photos provided by Wafula captured these fires, including a devastating fire at a fuel depot, which accompanied an explosion that was widely discussed in the news. The photos presented here omit those of the larger fires and instead illustrate other important aspects of the crisis and its aftermath.
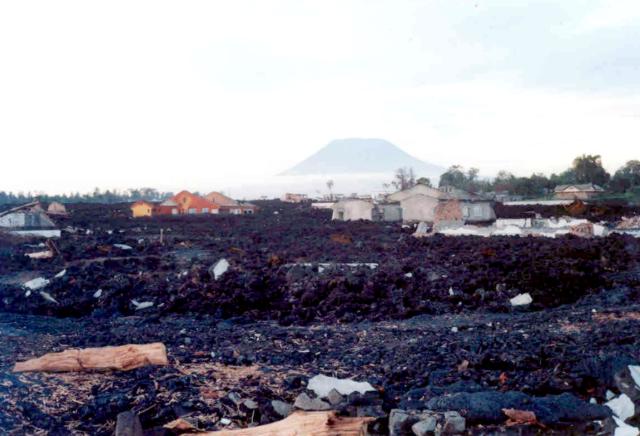 |
Figure 23. During Nyiragongo's January 2002 eruption lavas transected Goma, a city of about a half-million people. The summit of Nyiragongo lies ~ 20 km to the N. In the foreground, middle-ground, and central background lie destroyed buildings and gardens, and what has now become a field of rubble atop the rapidly cooled, thin lava flows of the January eruption. Note that the rubble contains abundant light-colored building material, such as concrete chunks dispersed from downed buildings. Unburned wood and some leaves may represent unburned portions of trees that came into contact with cooler lava surfaces at temperatures below their kindling point. Leaves and other fallen and wind-blown plant debris may have accumulated later. Date of photo is undisclosed. Courtesy of Wafula. |
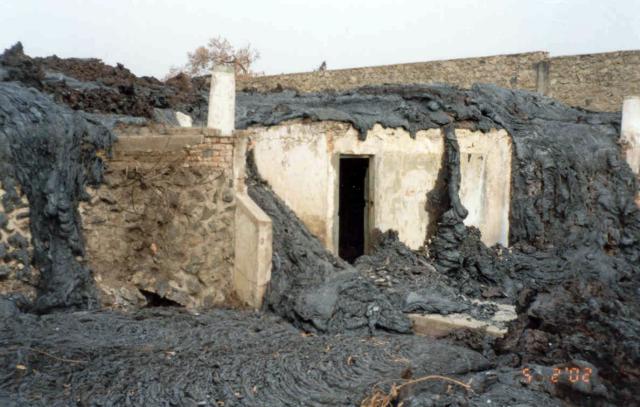 |
Figure 24. Nyiragongo lavas inundated these structures on 17 January 2002. A family took refuge in the lower portion of the building in the center. Trapped there by lava flows, one or more people died, including an infant. Provided courtesy of Wafula. |
 |
Figure 25. This photo shows some of the remarkably thin and mobile lava flows pouring through a narrow chute (behind the car and in line with the left-most opening in the low structure's wall). Below that, the lava spreads and descends across a lawn. Provided courtesy of Wafula. |
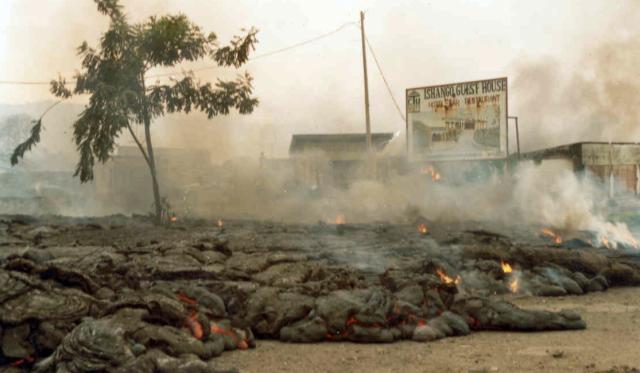 |
Figure 26. Nyiragongo's January 2002 lavas slowly advancing across a road at an intersection. This area of Goma is called Signers rotary point. The sign advertises the Ishango Guest House. Note the lava-immersed but still-standing tree, which at this stage, may have only had substantial burns near the base of its trunk. Provided courtesy of Wafula. |
Seismicity. The late October-early November 2002 earthquakes that were interpreted as magmatic, were relatively deep, at 10-25 km. Most of these earthquakes occurred in an elliptical area, although some struck ten's of kilometers W of Goma beneath the Bay of Sake in Lake Kivu, an area where previous earthquakes have sometimes occurred.
During the first half of November seismicity dropped significantly. It was noted that the operational seismic network then consisted of seven stations (table 8); an eighth station was not functioning. During November tectonic seismicity returned to normal; however, magmatic seismicity continued. In the week ending on the 9th, magmatic seismicity centered on the N side of Nyamuragira, a zone adjacent its recent eruption. In contrast, during this same interval earthquakes were rare at Nyiragongo, although gas escaping the crater remained visible from Goma, certifying ongoing intra-crater activity. During the week ending on the 16th, some earthquakes were centered about Nyiragongo. During the latter half of December most of the region's high-frequency and volcano- tectonic earthquakes were associated with an epicentral zone stretching from the 24 October major earthquake near Kalehe to W of Nyamuragira. Some HF events also occurred in the Nyiragongo vicinity too.
Table 8. Nyiragongo and Nyamuragira earthquakes and tremor recorded at Katale and Rusayo stations during November-December 2002. The Katale station sits on the E flank of Nyamuragira; the Rusayo station, on the SW flank of Nyiragongo. The dates on the left are for weekly intervals, except the last entry, which is for a 2-week interval (a fortnight). In the last entry, the elevated high-frequency earthquake count at Katale station was due to a swarm to N of Nyamuragira on 27-28 December. Courtesy of GVO.
| End of week (or fortnight) | Type A High-Freq | Type C Low-Freq | Total | Tremor - described or minutes with amplitude >= 1 mm |
| Rusayo seismic station | ||||
| 09 Nov 2002 | 86 | 178 | 264 | 5838 |
| 16 Nov 2002 | 78 | 185 | 263 | 3956 |
| 23 Nov 2002 | 79 | 207 | 286 | 1435 |
| 30 Nov 2002 | 33 | 160 | 193 | 2508 |
| 07 Dec 2002 | 42 | 137 | 179 | -- |
| 14 Dec 2002 | 57 | 124 | 181 | -- |
| (28 Dec 2002) | (88) | (270) | (358) | ("Several hours per day") |
| Katale seismic station | ||||
| 09 Nov 2002 | 137 | 231 | 368 | 3998 |
| 16 Nov 2002 | 114 | 328 | 442 | 7713 |
| 23 Nov 2002 | 118 | 356 | 474 | Feeble (1 mm) |
| 30 Nov 2002 | 92 | 239 | 331 | 2248 |
| 07 Dec 2002 | 107 | 348 | 455 | -- |
| 14 Dec 2002 | 120 | 169 | 289 | -- |
| (28 Dec 2002) | (253) | (513) | (766) | ("Several hours per day") Type A swarm to N of Nyamuragira |
The seismic reference stations Katale and Rusayo both registered sub-continuous volcanic tremor during much of the reporting interval (table 8). Rusayo station's tremor was attributed primarily to Nyiragongo, and except for one week in November, it registered the larger share of tremor.
During the week ending 23 November seismicity stayed about the same and tremor dropped considerably, particularly at neighboring volcano Nyamuragira where it was described as feeble (table 8). Banded tremor registered 29 November at the stations of Kunene, Rusayo, Bulengo, Kibumba, and Katale (during 0630-0745 UTC), with the highest amplitude at Katale station, implying Nyamuragira as their source, plausibly a reactivation associated with the 24 October earthquake. Many epicenters also concentrated in the vicinity of that neighboring volcano. On the other hand, epicenters for long-period earthquakes appeared to come from Nyiragongo. The epicenters were determined to a margin of error of ± 2 km.
Information Contacts: Kasereka Mahinda, Kavotha Kalendi Sadaka, Celestin Kasereka, Jean-Pierre Bajope, Mathieu Yalire, Arnaud Lemarchand, Jean-Christophe Komorowski, and Paolo Papale, Goma Volcano Observatory (GVO), Departement de Geophysique, Centre de Recherche en Sciences Naturelles, Lwiro, D.S. Bukavu, DR Congo; Dario Tedesco, Environmental Sciences Department, Via Vivaldi 43, 81100 Caserta, Italy; Jacques Durieux, Groupe d'Etude des Volcans Actifs (GEVA), 6, Rue des Razes 69320 Feyzin, France; Simon Carn, TOMS Volcanic Emissions Group, Joint Center for Earth Systems Technology (NASA/UMBC), University of Maryland Baltimore County, 1000 Hilltop Circle, Baltimore, MD 21250 USA (URL: https://so2.gsfc.nasa.gov/); Reuters News Service; BBC News (URL: http://news.bbc.co.uk/).
2002-2003 lava lake activity, thermal radiation, and CO2 and SO2 emissions
Nyiragongo, located along the East African Rift (figure 27), ceased generating flank lava flows following its January 2002 eruption, but remained active inside its summit crater where it hosts a restless lava lake. Observations made by staff from the Goma Volcano Observatory (GVO) in August 2002 included the opening of a new sinkhole, and measurements of CO2 and O2 gas concentrations at three fumarolic areas (locally termed mazukus). For context, handbook values for CO2 concentrations and their resulting symptoms in humans are discussed. The GVO has also brought to light reports from local residents of abnormally rapid ripening of picked bananas (and in some cases yams) prior to the January 2002 eruption.
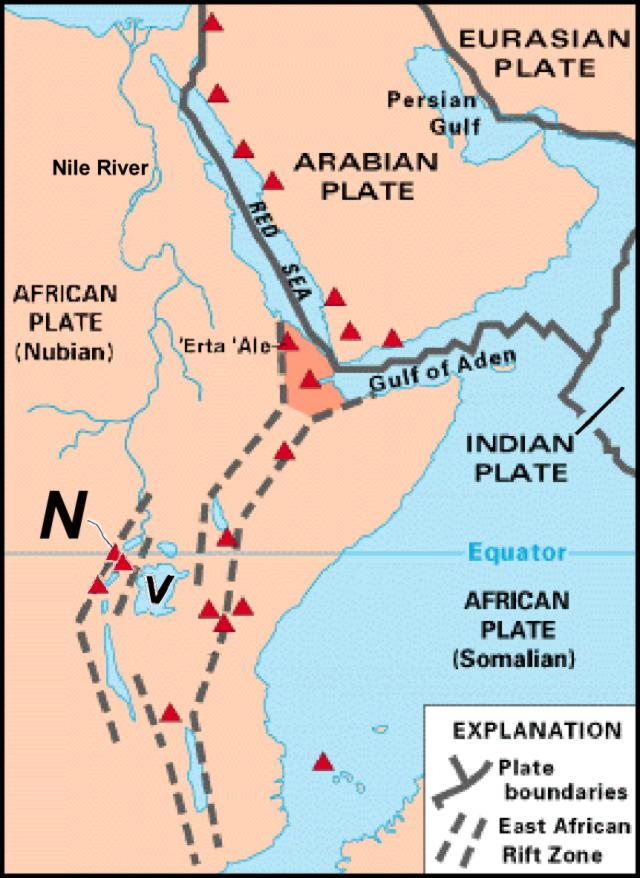 |
Figure 27. Schematic map illustrating the trend of the East African rift. The rift's overall shape is curved, concave towards the E, and it contains a central segment composed of two branches passing on the E and W sides of Lake Victoria (V). The overlapping triangles labeled N at the N end of the rift's Western segment identify the approximate location of Nyamuragira and Nyiragongo volcanoes N of Lake Kivu. The latter volcano sits to the E and closer Lake Kivu. This figure is based on one in an online book by W.J. Klius and R.I. Tilling of the US Geological Survey. A smaller scale map showing some often mentioned local features appeared in BGVN 26:03 (Nyamuragira report). |
This report also discusses GVO and resident volcanologist summit crater visits during late November 2002-early May 2003. In all cases the lava lake within the summit crater remained dynamic, with one or more windows on the crater floor exposing agitated molten lava. During this interval, degassing continued and tephra fell on the upper flanks. A summary of some ancillary observations such as seismicity measured on the GVO network is also provided.
A later section discusses ash plumes as described in aviation reports. Ash clouds extended as visible swaths on satellite imagery for up to ~100 km from the volcano. These reports include some as recent as 15 May 2003. The final section discusses MODIS thermal imagery during late 2002 through early 2003. The 2003 MODIS data reflect the lava lake seen deep within the summit crater. Finally, satellite data show atmospheric SO2 burdens for the Nyiragongo-Nyamuragira region during 13 December 2002 to 15 June 2003.
GVO's August 2002 field observations. On 12 August 2002 GVO was called to Bugarura village upslope from Munigi on the S flank. A new sinkhole had developed that morning, leaving a steaming opening ~3-4 m in diameter. Scientists could not see the opening's bottom through the steam, but they timed falling stones and estimated the sinkhole's depth at ~15 m. The odorless gas being emitted led them to believe that the steam chiefly represented vaporized groundwater.
GVO staff and collaborators hoped to advance gas monitoring efforts by measuring CO2 and other escaping gases at multiple sites in the region. They continued to make spot-checks with hand-held devices, but also sought a more-nearly continuous record from dedicated monitoring instruments. Although noxious gases are a familiar problem in volcanic areas, some of the gas concentrations in the rift are surprisingly high for areas adjacent human habitation. The Swahili word mazuku allegedly connotes places associated with "evil winds," and the term is currently used to describe fumarolic areas, which have also been described as dry gas vents.
Possible precursors to January 2002 eruption. In the weeks before the 17 January 2002 eruption, there were widespread reports of picked crops ripening at unusually rapid rates. From the settlements of Rusayo (8 km SW of the summit) and Katale (~18 km NNE of the summit and ~10 km NE of Nyamuragira's summit) people reported in early January that the normal 5-day ripening processes of bananas placed in the ground decreased to only 2 days. From Rusayo, people also reported that sweet potatoes, which are normally sun-dried on the ground surface, dried even without sun. GVO observers saw this first-hand and, as a result sought funds to hire porters and observe Nyiragongo directly, but the eruption began before the expedition started.
Although radiant or conductive heat may have been a factor (since heat speeds up the ripening process), heat's transport to broad areas on the surface by conduction through rocks would be comparatively slow. Heat at depth may have more rapidly reached the surface in the form of heated, liberated gases (such as steam). Discussions with gas chemist Vern Brown and a scan of the literature also revealed that the release of certain gases could conceivably have played another role as well. Both acetylene (C2H2, a colorless, flammable gas with an odor similar to garlic and slightly less dense than air) and C2H4 (ethylene, a colorless, faintly odorous gas less dense than air) speed up the ripening process in many agricultural products (including bananas and yams). Ethylene can cause banana peels to shift from green to yellow at low (ppm) concentrations. These gases occur naturally and may form or escape in association with heating organic material. In contrast, CO2 generally slows the ripening process. For the interval prior to the January 2002 eruption, observers lack documentation of increases in degassing or heating.
Seismicity and crater visits, November 2002-May 2003. Multiple GVO crater visits were documented: 23-25 November 2002; 9-10 and 21-22 January 2003; 4-5 and 25-26 February 2003; 18-19 March 2003; 22-24 April 2003; 6 May 2003. GVO also sent out occasional updates discussing seismicity and other observations.
During 23-25 November 2002, GVO team members Kasereka Mahinda, Ciraba Mateso, Arnaud Lemarchand, and Jacques Durieux watched the active lava lake on the crater floor. The lake was then located within the southern crater in the 16 November collapsed area. Two broad openings lay at the bottom of this new depression; both permitted viewers to see the lava lake's surface. A third, smaller opening ejected only high-temperature gases. The great quantity of gas occupying the bottom of the crater thwarted efforts to carry out a precise laser-based measurement of the depth to the lava-lake surface. The visual estimate for this depth from the summit was ~700 m.
The lava lake was very active, as it was before 1977. The lava surface was disturbed by the rise of abundant large gas bubbles. Breaking bubbles threw molten fragments onto the margins of the two openings. Consistent with the bubbles and constant degassing, a gas plume was visible at night from Goma. Occasionally, light dustings of tephra and Pele's hair came from the crater and fell on the surrounding areas. Although the current lake was impressive, the observers pointed out that the crater has contained a dynamic lava lake for nearly 50 years. The earlier lake's surface was much larger and stood nearly 500 m higher.
Jean-Christophe Komorowski accompanied GVO staff on a climb up Nyiragongo on 9-10 January 2003. While on the upper slopes, the climbers heard a few detonations associated with more energetic gas plumes. From the rim they saw a deep pit in the SW part of the inner crater. There were two vents on the crater floor separated by a thin rocky ridge. The SW vent (vent A) was characterized by a high-pressure fluctuating gas jet that gave off very loud roaring noises, along with flames of incandescent and combusting gases. Condensing steam clouds here were dense, rendering visual observations difficult. The other active vent (vent B) was just to the NE and consisted of an area of stable incandescence at least 100 m in diameter with an active lava fountain. Projections of lava spatter there took place every 30-60 seconds and typically reached 40-60 m in height.
The large area of incandescence indicated that a small lava lake must have been present deep in the pit, although the observers never saw the moving lava surface. Peak high-pressure degassing in vent A did not necessarily correlate with peak lava fountaining activity at vent B. Observations were conducted for several hours at night and during the day. Laser binocular measurements established the crater floor's depth at ~800 m. Very light ash consisting of Pele's hair and tears, and millimeter-sized vitric scoria fragments fell continuously on the rim. Conditions were made difficult at times when the SO2-rich gas plume blew towards the W.
Acid rain that flushed the volcano's SO2 gas plume, sampled at elevation 2,600 m, had a pH of 2.26. In contrast, rain collected in Kibati (below 2,000 m on the SSE flank) on 6 January had a pH of 6.15. Damage to about two-thirds of the vegetation by acid plume condensates was evident above 2,900 m on the SW and S flanks.
Compared to the last visit by GVO staff, 30-31 December 2002, degassing had increased significantly. However the level of the lava in the crater and/or lake had not risen and might have dropped lower in the conduit. The gas-plume height, measured regularly by the GVO, reached 4,500-5,000 m altitude. At times, although the very loud roaring sound remained unchanged, the entire crater became gas-filled to an extent that incandescence was entirely blocked, even from the vantage of surrounding villages. Information brought regularly to the attention of the GVO by the populations of Kibati, Mudja, Mutaho, and Rusayo villages attested to their exposure to the gas and ash plumes from Nyiragongo. Through at least early May 2003 the volcano's hazard status remained at yellow ("vigilance," the second lowest level on a 4-step scale).
Another climb enabled observers to peer into the crater during 21-22 January 2003 (figure 28). Compared to the 9-10 January observations, only one opening remained active inside the crater. The former vent A probably disappeared following a collapse. The active opening had about the same diameter and its lava fountain attained similar heights compared to earlier vent B observations. The level of the lava had not changed in the crater, remaining deep in the volcanic conduit. Degassing had increased significantly. Periodically more vigorous lava fountains sent smaller fragments to higher elevation that cooled to black scoria fragments. A small scoria cone had started to build around the active vent. Recent small lake overflows formed thin lobate lava sheets around the vent. The ascent velocity of individual gas plumes within the crater varied between 7 and 12 m/s.
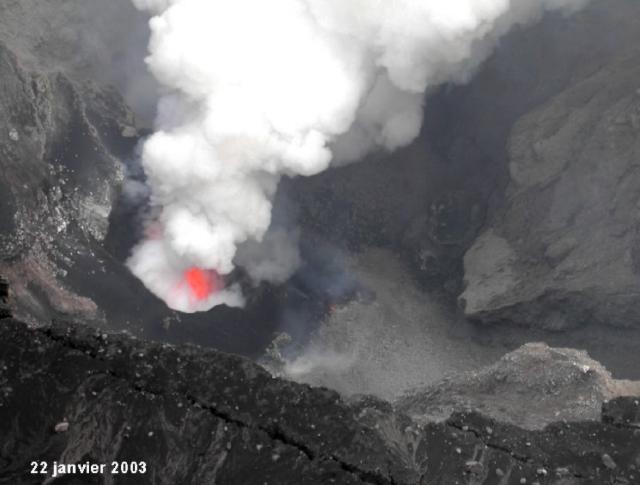 |
Figure 28. A photo of Nyiragongo's crater and the one opening in the lava lake visible on 22 January 2003. Copyrighted photo used with permission of GVO. |
A series of incandescent pits extended to the SE of the active pit along a line that corresponds to a major pre-existing fault-fracture system trending N25°W. This system transected the crater from NW to SE and linked with the upper Shaheru fracture and 1977 vent network that reactivated in 2002. A hot fracture zone trended N10°E-N20°E in the NE part of the crater wall. This zone had extended into the active deep crater forming a conspicuous, elongate, vertical-walled canyon. Observers frequently heard and saw rockfalls, and noted that those events often generated plumes that spread and deposited ash over local vegetation. Intra-crater ash reached 5 mm in thickness. The gas plume remained rich in SO2. Rain water collected at the top of Nyiragongo had a pH of 2.84.
The late-January plume height estimated during favorable atmospheric conditions by GVO members varied from 4,500 to 5,500 m altitude. Often, the prevailing wind carried ash, cinder, and Pele's hair S towards Kibati, Rusayo, Mudja, and Mutaho villages.
A 13 February GVO report said that for four consecutive days, Pele's hair fell in Goma, 17 km SSW. Although cloudy and foggy due to the start of the rainy season, Nyiragongo's plume reached at least 5 km above the crater. Between Goma and the Nyiragongo stood heavy gray-to-black ash-rich clouds. The fall of Pele's hair was due to lava fountains inside the crater.
The same report noted that seismicity was probably lower than the previous week and consisted of low tremor, few long-period earthquakes, and almost no tectonic earthquakes. Very small-amplitude seismic noise (small earthquakes) occurred, presumably due to collapses and perhaps intra-crater explosions.
GVO went on to say that one side effect of the ash falls was that villages around Goma had serious water shortages, since they rely on collecting rainfall. All UN agencies and NGOs were informed and asked to start potable water distribution around Goma. A few more physical problems might arise because of the Pele's hair, including stress on people's eyes and breathing. Crops around the volcano in some cases have been burned by acid rains and ash, while cattle might also suffer from ingestion of ash-polluted grass.
The 25-26 February ascent revealed more robust activity than observers had seen on their 4-5 February visit. By the latter date, all vegetation had died near the main crater. Approaching the rim in the upper 220 m of the ascent, tephra falls had accumulated to form deposits several centimeters thick; those, along with acidic plumes, had killed plants. The flora and fauna at lower elevations were still surviving, although they showed signs of serious stress. Loud sounds were audible several kilometers from the central crater. Intra-crater activity seemed intense, but thick fumes in the crater area thwarted day-time visibility. On 25 February views from the W rim revealed that a spatter cone had begun to grow on the crater floor. Lava fountaining occurred all night; discharging lava probably rose more than 100 m high, but it was difficult to assess the maximum rise height. Lava fountains chiefly came out at one spot, although a second, much smaller point of emission gave off mainly flames and sometimes scoria. Pele's hair fell all night long.
An update disseminated on 27 February 2003 noted that compared to previous weeks, during 21-27 February Nyiragongo's activity had decreased, although seismicity measured on the S flanks continued to contain low-amplitude tremor. S-flank seismicity also contained comparatively few long-period (LP) earthquakes. The update also said that local winds had begun to blow predominantly from the ENE, thus sweeping plumes and associated tephra falls clear of Goma. A 22 February visit to the SW-flank settlement of Rusayo revealed conspicuous tephra deposits on roofs and trapped in the crevices of banana trees.
During a visit to Nyiragongo on 18-19 March, GVO scientists observed a thick plume engulfing the crater. Two possible emission points were noted; one was related to powerful lava and ash emissions, and the other was related to a much weaker white-pink plume. An inner active cone was visible in the crater and was at least 200 m in diameter. Lava fountains rose to maximum heights of 150-200 m and as low as 50 m. Scoria ejection made observations difficult at times. Several permanent fumaroles, also observed during the previous visit, were seen in the crater.
Dario Tedesco noted that the cone morphology seemed slightly different from the trip 3 weeks earlier. He observed that on the N side of the crater a new platform had been formed, probably due to the continuous accumulation of ejecta, scoria, and ash. The team saw a huge lava fountain of at least 150-200 m in height. In contrast, when viewed in late February, fountains seemed to remain below ~100 m in height. The lava fountains generated abundant falling ash of millimeter size at the observation point, a process that lasted all night long.
Stronger and higher lava fountains, reaching almost 300 m high, were witnessed at 0230 on 19 March. The eruptive vigor as well as the intensity of the falling tephra declined at 0530. The last witnessed activity was of 50-m-high fountains. A second pit was noted on the E side of the crater that had been hidden during the night by the very thick plume.
For many days prior to visits on 22-24 April the seismic stations considered most representative of the Nyiragongo activity only registered very weak and steady continuous tremor. Although other types of seismicity were absent in the, A-type and C-type earthquakes occurred near the volcano. Despite the comparative seismic quiet, a prominent gas plume rose from the volcano. When weather conditions permitted, the plume top was measured at 5-6 km altitude.
The 22-24 April field excursion noted five distinct vents on the crater floor, almost continuous emissions of tephra, an agitated molten-lake surface that included emerging gas, and lava splashing 50-60 m high. Occasional waves of lava rolled across portions of the crater floor and walls. Excursion members also witnessed crater-wall collapses taking place along the NW and S fracture zones.
Widely felt earthquakes also continued in the region, presumably related to extension along the massive East African rift system. For example, three C-type events occurred on 23 April below Nyiragongo at a depth of ~15 km. During the whole day of 24 April, sustained tremor plus C-type events registered. On 25 April a few seismic events occurred amid sustained tremor. A main volcano-tectonic shock had been recorded and later a series of A-type events in the Nyiragongo field, between the S flank and Lake Kivu. Increasing tremor followed. For the rest of the week, the seismic network recorded a concentration of volcanic events to the NW and the S of the volcano, along the preferential fracture axis.
On 2-3 May unusually dense ash plumes were visible from Goma. Continuous ashfall occurred in many villages close to the volcano, and permanent tremor and long-period earthquakes were recorded. SO2 emission rates were relatively high during 1-6 May, with the largest emission on 3 May (~50,000 tons, see TOMS data below). UN peace keepers provided a 3 May helicopter flight that gave volcanologists clear views of the crater. The lava lake's molten surface appeared slightly larger than during a visit to the crater rim on 22-24 April. At that time a significant plume containing gas and ash rose high above the volcano.
On 6 May GVO climbers entered the village of Kibati, the usual departure point for the ascent, ~8 km from the crater rim. Kibati residents told how ash falls and acid rains had negatively affected local crops. For example, bean leaves had been burnt in many places. Along the ascent, at 2,260 m elevation, Pele's hair was found, including some intact individual strands 30 cm long. At 2,700 m elevation, thin ash grains completely covered the vegetation. At 3,200 m elevation on the S flank (~270 m below the summit), all vegetation had died.
Atmospheric conditions initially allowed quite clear views from the crater rim. The lava lake underwent violent outbursts from bursting of gas bubbles estimated at up to 40 m wide. The resulting projections of spatters and surges splashed on the walls of the pit. The lake had regained its former dimensions (~60 m across). The wider lake, recently seen from helicopter, had shrunken, leaving a solid platform on its side. Pressure of the escaping gases seemed very high and yielded a continuous roaring. GVO climbers again witnessed intermittent pale yellow-green flames hurling from the vents up to 50 m high.
At 0644 on 6 May a seismic shock was felt by the team on top of the volcano. It was recorded by the whole network as a low-amplitude long-period earthquake. Then, fog and gases halted further sightings into the crater. The fog lifted around 0100 on 7 May; at this time viewers saw a small narrow lava flow in the southern inner wall adjacent the active pit's margin ~200 m above the crater floor. The lava escaped out of what looked like a tunnel or tube. Although the lava descended at a steep angle and appeared to escape from the tube at a constant rate, its rate of advance remained slow. The lava front had not made it to the crater center. Below the tube, however, intricate individual lava flows had formed a long delta.
Aviation reports. A Volcanic Ash Advisory (VAA) for Nyiragongo was issued by the Toulouse Volcanic Ash Advisory Center (VAAC) on 6 March 2003. That advisory stated, "A cloud probably containing ash can be seen on [visible wavelength] METEOSAT imagery extending 100 NM [(nautical miles, 185 km)] westward from the volcano. "Several hours later the ash cloud was no longer visible. Advisories were also issue on 9, 12, 14, and 15 May 2003. The one for 9 May noted "Renewed activity since early May. Ash plume witnessed during a helicopter flight around early May up to 5-6 km above sea level. Many ash falls and acid rains all around the volcano." No cloud was observable due to convective weather clouds. The reports on 14 and 15 May stated, "According to Goma observatory [GVO], a plume of steam and ash is often emitted since early May. It may rise 1,500-2,500 m above the volcano's summit. No new message from Goma observatory since early May." Meteorological satellite (METEOSAT) imagery was unable to detect an ash cloud on 14 May due to weather clouds around the volcano.
MODVOLC Thermal Alerts. During early 2002 to early 2003 Nyiragongo was monitored on a daily basis with thermal satellite imagery (1-km pixel size). Investigators Matt Patrick, Luke Flynn, Harold Garbeil, Andy Harris, Eric Pilger, Glyn Williams-Jones, and Rob Wright used NASA's Moderate Resolution Imaging Spectroradiometer (MODIS) instrument and processed these data using the automated MODIS thermal alert system at the University of Hawaii, Manoa.
Prior to the January 2002 eruption, Nyiragongo activity appeared insignificant; anomalies were absent from the start of the MODIS-based alert system in April 2000, and through all of 2001. Anomalous pixels remained absent during 24 February-12 June 2002. The absence of anomalies could be explained either by a lack of exposure of the lava lake or by cloud cover obscuring the heat source from the satellite's view.
Nyiragongo's major effusive eruption in mid-January 2002 caused strong initial thermal anomalies (figure 29). Lava flows extending down the S flank to Lake Kivu resulted in anomalies as large as 45 pixels. Afterwards, the anomalies diminished quickly. Small intermittent anomalies (1-3 pixels) occurred near the summit for the remainder of 2002 and into early 2003, consistent with the kind of lava-lake activity described above.
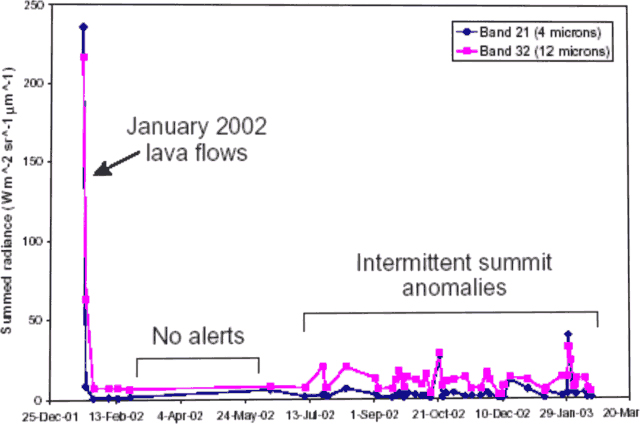 |
Figure 29. A plot illustrating MODIS data for Nyiragongo with the sum for short-wave (4 micron, band 21) radiance as well as the sum for long-wave (12 micron, band 32) radiance for all anomalous pixels in each image. The x-axis (time axis) starts before the eruption in December 2001 and ends in early 2003. Courtesy of Hawaii Institute of Geophysics and Planetology, University of Hawaii, Manoa. |
Atmospheric SO2. The Earth Probe Total Ozone Mapping Spectrometer (EP TOMS) SO2 data presented in figure 30 are preliminary. The bars indicated as "TOMS SO2" plotted on the lower axis of the chart represent EP TOMS measurements on days when the signal was large enough to allow retrieval of the SO2 mass. The height of these bars corresponds with the y-axis scale. Note that these values represent the SO2 mass in a satellite 'snapshot' of the volcanic cloud taken around local noon, and not an SO2 flux. The bars indicated as "Inferred SO2" on the lower axis denote days on which the presence of SO2 could be inferred from EP TOMS data, but the signal was too weak to allow retrieval of an atmospheric SO2 mass. Hence these bars are non-quantitative, but they indicate that non-trivial SO2 emissions probably occurred.
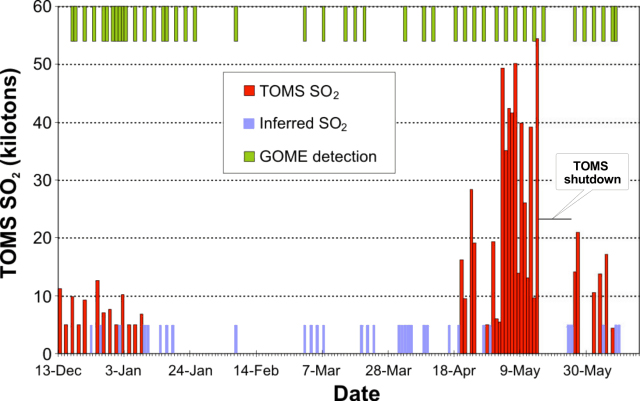 |
Figure 30. Preliminary atmospheric SO2 data taken from satellite measurements of the Nyiragongo-Nyamuragira region during 13 December 2002 to 15 June 2003. The data along the lower axis are from the EP TOMS instrument; the data on the upper axis are from the GOME instrument on the European satellite ERS-2. Only the data described as "TOMS SO2" are quantitative (see text). Blank spaces for certain days and time intervals on the chart imply that either a data gap occurred over the region, or that no SO2 was detected. One of these blank intervals in the EP TOMS data took place during 15-23 May 2003, in this case due to the one instrument shutdown during the data-collection period. Courtesy of Simon Carn. |
More, non-quantitative data appear as bars indicated as "GOME detection" along the upper axis of figure 30; in this case, showing dates when another instrument detected SO2 emissions in the region. These emission dates denote SO2 detection over central Africa by the European GOME (Global Ozone Monitoring Experiment) instrument aboard the ERS-2 satellite. GOME measurements are based on scans by a visible- and ultraviolet-wavelength spectrometer. GOME has inferior spatial and temporal resolution to EP TOMS, but is more sensitive to atmospheric SO2.
TOMS SO2 mass retrievals are dependent on the altitude of the volcanic plume and are also affected by meteorological cloud cover, and therefore may be adjusted as more information becomes available. The largest of these preliminary estimates during this interval was in excess of 50 kilotons (kt) SO2. These peaks in the first half of May 2003 were truncated by an instrument shutdown during 15-23 May. Given the crater and plume observations by GVO, and other data discussed above, the vast majority of the SO2 shown on figure 30 was probably emitted by Nyiragongo.
CO2 gas concentrations at three mazukus on the flanks of Nyiragongo in vicinity of Lac Vert at the ground surface measured up to ~40% by volume, but concentrations of the heavier-than-air gas dropped quickly with height above the ground surface. Spot measurements were made with a Geotechnical Instruments multi-gas landfill analyzer. Field notes reported CH4 concentrations consistently at zero and O2 concentrations at only one site where it was 22 vol. % at the ground surface and 16-17 vol. % nearby. The 15 August 2002 field excursion was led by GVO scientists Mathieu Yalire, Ciraba Mateso, and Kasereka Mahinda, with Chris Newhall present.
Effects of carbon dioxide. People in the region apparently understand the hazard of escaping CO2 gas, and in the past several years CO2 gas exposure has not led to reported human fatalities. CO2 gas, which is more dense than air at equivalent temperature and pressure, can be lethal to humans at 9-12 vol. % concentrations in as little as 5 minutes. The US standards for indoor air quality suggest that long-term human exposures remain below 0.1-0.2 vol. %, and that short-term (10- to 15-minute) exposures remain below 3 vol. %. The odor of CO2 is too weak to warn of dangerous concentrations. Table 9 lists some symptoms associated with the inhalation of air containing progressively higher levels of CO2.
Table 9. The AGA Gas Handbook included these CO2 gas concentrations (in volume percent) and accompanying symptoms for adults in good health (after Ahlberg, 1985).
| Volume % CO2 | Physical Symptoms |
| 2% | 50% increase in breathing rate. |
| 3% | 10-minute exposure limit; 100% increase in breathing rate. |
| 5% | 300% increase in breathing rate, headache and sweating may begin after about an hour. |
| 8% | Short-term exposure limit. |
| 8-10% | Headache after 10 or 15 minutes. Dizziness, buzzing in the ears, blood-pressure increase, high pulse rate, excitation, and nausea. |
| 10-18% | After a few minutes, cramps similar to epileptic fits loss of consciousness, and a sharp drop in blood pressure. The victims recover very quickly in fresh air. |
| 18-20% | Symptoms similar to those of a stroke. |
Reference. Ahlberg, K., 1985, AGA Gas Handbook: Properties & Uses of Industrial Gases, AB, Lidingo/Sweden, ISBN 91-970061-1-4 (out of print).
Information Contacts: Celestin Kasereka Mahinda, Kavotha Kalendi Sadaka, Jean-Pierre Bajope, Ciraba Mateso, and Mathieu Yalire, Goma Volcano Observatory (GVO), Departement de Geophysique, Centre de Recherche en Sciences Naturelles, Lwiro, D.S. Bukavu, D.R. Congo; Dario Tedesco, Jacques Durieux, Jean-Christophe Komorowski, Jack Lockwood, Chris Newhall, Paolo Papale, Arnaud LeMarchand, and Orlando Vaselli, UN-OCHA resident volcanologists, c/o UN Office for the Coordination of Humanitarian Affairs, United Nations Geneva , Palais des Nations,1211 Geneva 10, Switzerland (URL: http://www.unog.ch); Tolouse Volcanic Ash Advisory Center (VAAC), Toulouse, Météo-France, 42 Avenue G. Coriolis, 31057 Toulouse Cedex, France (URL: http://www.meteo.fr/vaac/); Matt Patrick, Luke Flynn, Harold Garbeil, Andy Harris, Eric Pilger, Glyn Williams-Jones, and Rob Wright, Hawaii Institute of Geophysics and Planetology, University of Hawaii, Manoa (URL: http://modis.higp.hawaii.edu/); Vern Brown, President, ENMET Corporation, P.O. Box 979, Ann Arbor, Michigan 48106-0979 (URL: http://www.enmet.com/); Simon A. Carn, TOMS Volcanic Emissions Group, Joint Center for Earth Systems Technology (NASA/UMBC), University of Maryland Baltimore County, 1000 Hilltop Circle, Baltimore, MD 21250 USA (URL: https://so2.gsfc.nasa.gov/).
Continued lava lake activity during May-June; ashfall in local villages
Reports from the staff of the Goma Volcano Observatory (GVO) during May to 5 July 2003 noted that the hazard status remained at Yellow ("Vigilance"). Seismicity was characterized by tectonic, long-period, and short-period earthquakes. Deformation across the majority of fractures lacked significant extensional displacements, but the fractures in the S of Shaheru had compressional displacements. In spite of significant crater activity, geochemical and deformation measurements did not suggest any danger to the inhabited zones on the S flank.
During 4-24 May there was ashfall at Kibati (below 2,000 m on the SSE flank, ~8 km from the summit), Rusayo (~8 km from the summit on the SW flank), and Goma (~18 km S). Nightly red glows and degassing were observed each day. Crater observations revealed two pits containing lava fountains, with a NE-SW lengthening of the principal pit. An active lava flow was observed on 7 May inside the crater. During 18-24 May volcanic ash, including Pele's hair, continued to fall in villages around the volcano, including Goma. During 8-28 June the lava lake continued to emit a gas-and-ash plume. The lake was ~700 m below the edge of the crater. Collapses in the crater were observed during 13-14 and 18-20 June.
Seismicity. During 4-24 May 2003, seismic activity was dominated by persistent volcanic tremor. During 4-10 May, only two long-period earthquakes and a short-period fracture earthquake were recorded, although during 11-17 May an increased number of long-period earthquakes were distributed on the N flank along the fracture trending from Nyiragongo to Nyamuragira. A small number of short-period earthquakes occurred to the WSW along the Nyiragongo-Sake axis (Sake is ~24 km NW of Goma). During 18-24 May long-period earthquakes continued to appear in the NE-SE direction; some isolated long-period events were observed ENE towards Kibumba.
During 8-21 June persistent tremor continued, and six long-period earthquakes were reported. These tremors suggested intense activity in the crater. Weaker seismicity during the following week, 22-28 June, remained dominated by tremors caused by lava lake activity.
All earthquakes were recorded at the Kibumba, Rusayo, and Bulengo seismic stations and occurred at depths of 0-27 km, with an aseismic zone at 3-7 km.
Deformation and temperature. During 4-10 May 2003, measurements of deformation along the cracks in the S flank indicated neither contraction nor extension when compared with the previous week. During the next two weeks, no deformation occurred along the cracks at numerous other S-flank sites.
Contraction during 8-14 June along the Shaheru fractures (~2 km S of the crater) was 8 mm in Lower Shaheru and 29 mm in Higher Shaheru, suggesting that magma in the fractures S of Nyiragongo had not moved. During 15-21 June, temperature measurements in fractures at Nyiragongo, Shaheru, and Monigi (~1.5 km NE of the Goma airport) varied less than those measured in April-May. Average temperatures were in the range of 14.6-63.1°C.
During 22-28 June deformation measurements of fractures did not reveal any notable variation compared to previous measurements at Monigi, Mugara, and Nyiragongo Cants. Temperatures measured in the Monigi and Lemera fractures did not vary, while those at Mugara showed a slight increase of 3.6°C between 21 May and 28 June.
Crater observations, 22-23 May 2003. Kasereka and Yalire (GVO) remained at the summit of Nyiragongo during 22-23 May. During their SSE-flank ascent, vegetation was covered with slag and ash from Kibati (2,000 m) to the summit (3,470 m). Two types of Pele's hair were observed: those with a length of 20-40 cm were present from Shaheru (2,200 m) to the huts (3,250 m), and those shorter than 15 cm were present from the huts to the summit.
Upon arrival at the summit they observed a gas plume that covered the entire crater. The crater could only be seen for a few seconds at a time. However, the bottom of the crater was entirely occupied by the lava lake, and not by separate lava-filled pits; the crater bottom had an elliptical form elongated in a NE-SW direction. This lava lake was, when calm, characterized by undulatory movements of low amplitude, and, when agitated, projected materials 40-60 m high. A collapse in the crater was not recorded by the seismic network. For three hours that evening there were explosions in the crater, followed by ashfall on the summit.
For one hour on the morning of 23 May there was a total lull, with no growls or explosions, that corresponded to a decline of volcanic tremor recorded at the Bulengo, Kibumba, and Rusayo stations. The atmosphere immediately above the crater then cleared for at least 10 minutes, and photos were taken of the crater floor showing the single lava lake at the bottom of the crater (figure 31). Measurements could not be taken of the depth of the lava lake surface because the atmosphere was clouded by the gas plume. Analyses by the GVO showed that the pH of rainwater from the air was 4.13 and its conductivity was 2.08 ms/cm.
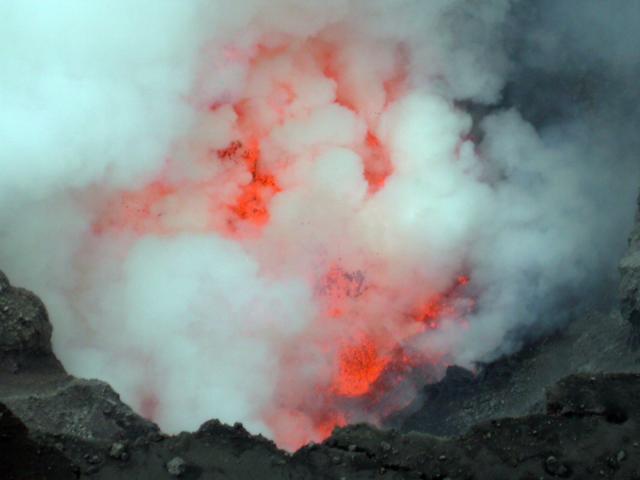 |
Figure 31. Photograph of the lava lake (seen through the gas plume) occupying the bottom of the Nyiragongo crater, 23 May 2003. Courtesy of the Goma Volcano Observatory. |
Information Contacts: Goma Volcano Observatory, Departement de Geophysique, Centre de Recherche en Sciences Naturelles, Lwiro, D.S. Bukavu, DR Congo.
Continuing lava lake activity through mid-August
New reports of activity at Nyiragongo include observations from visits on 12-13 July and 14-15 August 2003. Seismicity was low during the report period, but tremor related to the lava lake continued to characterize volcanic activity. Staff at the Goma observatory have kept the hazard status for Nyiragongo at Yellow (Vigilance).
During 6-12 July two long-period earthquakes were detected. Four tectonic earthquakes registered to the S and beneath Lake Kivu; none of these were felt by area residents. Fracture measurements at Monigi, Mugara, and the Nyiragongo hut did not show any significant change from previous measurements, but at Lemera fracture spacing increased from 7.537 to 7.550 m, and there was an extension of 8 mm at Shaheru. Also during the visit, Pele's hair as long as 10-15 cm was observed between Shaheru and the crater; gas plumes were noted in the S, SW, and W, along with large scoriae. Crater observations indicated the possible formation of a third platform at 650 m depth. Two small vents formed NE of the main lava lake and there was significant degassing along the S base of the internal wall.
Between 13 and 19 July, seismic activity remained low, with four long-period earthquakes beneath the NE flank. No earthquakes were felt and only seven tectonic earthquakes were recorded to the S and beneath Lake Kivu. Volcanic tremor persisted, indicating activity in the lava lake. Fracture spacing measurements were taken at Shaheru and the Nyiragongo hut, but without noticeable changes (14.778 m at Shaheru 1, 29.602 m at Shaheru 2, and 0.942 m at Nyiragongo hut). Observations of fumarole openings had been reported by residents in the Mutwanga district. Also on 18 July investigations at Kiziba revealed a recent tongue of lava infiltrating older lava layers, found in a hole dug as a septic tank.
Volcanic tremors continued between 20 July and 2 August; no earthquakes were reported. Fracture measurements at Busholoza and Kabutembo did not indicate significant changes; temperature and deformation measurements at the top of Nyiragongo, the Nyiragongo hut, Shaheru, Mugara, and Monigi also did not reveal any notable changes. However, local CH4 (methane) was present at concentrations of 35.5%.
Between 1 and 3 August the lava lake appeared very active, with lava fountains up to 10 m high, projecting large but light scoriae into the atmosphere. Pele's hair was observed at Shaheru (2,200 m elevation) and heat radiating from the lake could be felt at the observation camp on the edge of the crater. Because of the considerable projection of volcanic products, pilots were advised to avoid the area.
Following a magnitude 5.2 earthquake in the Virunga region on 5 August, scientists from the Goma observatory visited Nyiragongo on 14-15 August. Measurements included deformation and gas geochemistry in fractures, and the lava lake was monitored. No significant deformation was observed at cracks on the S side of Nyiragongo. Gas measurements at Shaheru showed that local CO2 concentrations had increased by 1.7%, while methane there had doubled. At the top of Nyiragongo, however, measurements on 15 August were half those on 14 August. Late on 14 August a "swirl" of air caused gas to fill the crater, and ~ 2 hours later scientists as well as residents west of Virunga felt an earthquake. Another earthquake was felt in Kibati and at the crater on 15 August.
The lava lake appeared calm on 14 August, and two small vents were visible; only one was visible the next day. The lava lake was measured to be 260 m in diameter, nearly the same as on 2 August. Also during the visit scientists installed a scorimeter: Two hours worth of scoria, weighing 236.2 g per square meter, were sampled.
Information Contacts: Goma Volcano Observatory, Departement de Geophysique, Centre de Recherche en Sciences Naturelles, Lwiro, D.S. Bukavu, DR Congo.
Lava lake growing through pit-wall collapses; environmental damage
During the 3-month period from 2 August to 8 November 2003, volcanic activity was concentrated inside the Nyiragongo crater. An almost permanently boiling lava lake occupies the crater at the depth of 700 m. Although the level of the lake inside the crater seems to remain constant, its size is slowly growing due to collapses of the pit walls. Degassing has been significant, marked by a large gas plume above the crater which is generally blown W by the prevailing winds and extends several tens of kilometers. The impact of this activity on the environment is growing; inside the National Park, a 50 km2 area of forest was totally destroyed by volcanic gases and acid rains, and a zone with 50% destruction covers more than 700 km2, affecting crops such as potatoes, corn, beans, and bananas. In the same areas significant fluoride pollution has been detected, and tanks collecting rain water are showing fluoride concentrations up to 23 mg/l (WHO tolerance = 1.5 mg/l).
In the Nyiragongo area, long-period events are commonly detected but at reduced number and are mainly located NW and SW of the volcano. Seismicity is largely dominated by permanent tremor generated by the activity of the lava lake. Earthquakes related to fracturing continue, mainly S of Nyiragongo and NE of Nyamuragira (~ 15 km NW of Nyiragongo). No noticeable deformation change has been recorded along the fracture system between the two volcanoes.
Information Contacts: Observatoire Volcanologique de Goma, Departement de Geophysique, Centre de Recherche en Sciences Naturelles, Lwiro, D.S. Bukavu, DR Congo.
Lava lake present and providing gas plumes and night glow in December
In December 2003 activity at Nyiragongo remained at relatively low levels, with the constant presence of an active lava lake inside the crater. Goma residents saw voluminous gas plume and intense red glow at night; however, activity was considered normal and the alert level remained at yellow.
Information Contacts: Baluku Bajope and Kasereka Mahinda, Observatoire Volcanologique de Goma, Departement de Geophysique, Centre de Recherche en Sciences Naturelles, Lwiro, D.S. Bukavu, DR Congo; Jacques Durieux, UN-OCHA resident volcanologist, c/o UN Office for the Coordination of Humanitarian Affairs, United Nations Geneva , Palais des Nations,1211 Geneva 10, Switzerland (URL: http://www.unog.ch).
Significant ash plumes up to 6 km altitude and extending 185 km
When last reported on, activity at Nyiragongo remained at relatively low levels, with the continued presence of an active lava lake inside the crater (BGVN 28:12). Continued activity in May and June 2004 was characterized by weak emissions that produced ash plumes to various heights.
Activity during May 2004. The Toulouse VAAC reported that satellite imagery showed a weak eruption of Nyiragongo on 21 May. Activity intensified during the evening of 24 May, with thermal anomolies and aerosol plumes visible in true- and false-color satellite imagery on 25 May (figure 32). By the evening of 25 May, the plume was no longer visible on satellite imagery due to meteorological clouds in the area. The Toulouse VAAC reported that during 26 May to 1 June there were weak but steady emissions from both Nyiragongo and neighboring Nyamuragira (~ 13 km NW of Nyiragongo). The Goma Volcano Observatory confirmed that ash fell within a radius of 60 km of both volcanoes.
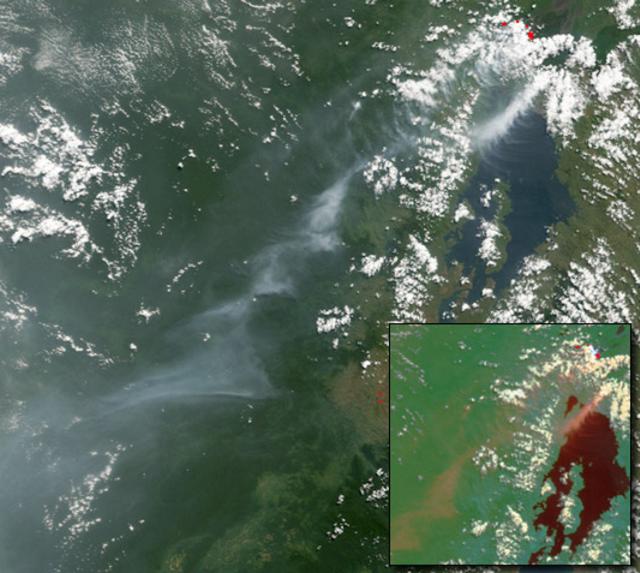 |
Figure 32. The Moderate Resolution Imaging Spectroradiometer (MODIS) on NASA's Terra satellite captured these images of the Nyriagongo eruptions of 25 May 2004. The volcano lies above (~ 20 km N of) the water body (Lake Kivu) on the right. The large image shows the scene in true color at MODIS' maximum resolution of 250 m per pixel. Red dots around Nyiragongo indicate pixels with thermal anomalies and may result from flowing lava or fires. The inset shows the area around the volcanoes in false color adjusted to enhance the difference between meteoric clouds and the aerosol plumes. The latter are a darker color and may contain ash and steam or smoke from fires. Courtesy of Jesse Allen, based on data from the MODIS Rapid Response Team at GSFC. |
Activity during June 2004. A series of plumes were noted, several to estimated altitudes of over 5 km. On 4 June a new eruption began at Nyiragongo, producing a plume that probably contained ash. It rose to ~ 6 km altitude and stretched ~ 150 km SW. By 5 June the plume extended 185 km SW and was under ~ 4 km altitude. On 6 June, satellite imagery showed only a moderate plume stretching to the SW and a disconnected remnant of the earlier plume. The moderate plume, drifting SW, remained through 7 June. An ash plume extended ~ 75 km SW at ~ 5.5 km altitude on 8 June. During 9-15 June, ash from Nyiragongo was sometimes visible on satellite imagery below ~ 5.5 km altitude drifting WSW. Satellite imagery suggested that the ash emissions that began on 4 June ceased by 22 June.
Information Contacts: Tolouse Volcanic Ash Advisory Center (VAAC), Toulouse, Météo-France, 42 Avenue G. Coriolis, 31057 Toulouse Cedex, France (URL: http://www.meteo.fr/vaac/); Goma Volcano Observatory, Departement de Geophysique, Centre de Recherche en Sciences Naturelles, Lwiro, D.S. Bukavu, DR Congo.
Continuous ash plumes and active lava lake
During May and June 2004, eruptions of Nyiragongo produced ash plumes that rose to a maximum of 6 km altitude (BGVN 29:06). According to the Toulouse VAAC, eruptions continued through July, producing plumes to a maximum of 5.5 km altitude. On 7 and 28 September 2004, short-lived plumes that may have contained ash were visible on satellite imagery. The Alert Level for the nearby city of Goma remained at Yellow.
An eruption on 3 November 2004 produced a thin W-drifting plume to 3.6-4.9 km altitude that was visible on satellite imagery. On 22 November a narrow SW-drifting plume was discerned on satellite imagery at 5 km altitude. A narrow plume was seen again on satellite imagery on 23 November at 1130, although no ash was identifiable.
The Goma Volcano Observatory (GVO) reported that during 10-17 November 2004 continuous volcanic tremor was recorded at all seismic stations around Nyiragongo. Visual observation on 12 and 13 November revealed that the lava lake surface had widened considerably, with strong lava fountains. Numerous Pele's hair and scoriae were seen on the cone's S, W, and N sides. A gas plume and incandescence were visible above the volcano. All fractures that opened during the 2002 eruption on the S flank had widened slightly and showed minor temperature increases.
During 18-29 November 2004, continuous banded tremor at high amplitudes occurred beneath the volcano, but the amplitudes seemed to be lower than during 9-18 November. Visual observations on 25-26 November revealed a slight decrease in the level of the lava lake, although strong lava fountains and a high flux of lava and gases continued. Pele's hair, scoriae, a gas plume, and incandescence were still present. Measurements of the fractures on the slopes showed that they remained stable.
The Toulouse VAAC reported faint SO2 plumes from Nyiragongo visible on satellite imagery on 8 and 10 December. During 29 November to 12 December, volcanic activity remained at relatively high levels. Nearly continuous high-amplitude tremor was recorded at all seismic stations on the volcano. Observations of the crater area on 9 and 10 December revealed that the level of the lava lake remained stable compared to previous visits and that strong lava fountaining was present. Pele's hair and scoriae fell in the area around the volcano, gas plumes rose above the volcano, and strong incandescence was visible at night.
In May 2005 a visiting group from Société de Volcanologie Genève (SVG) estimated that the lava lake was approximately 200 x 150 m across. They observed lava fountaining in the lake to tens of meters high (figure 33).
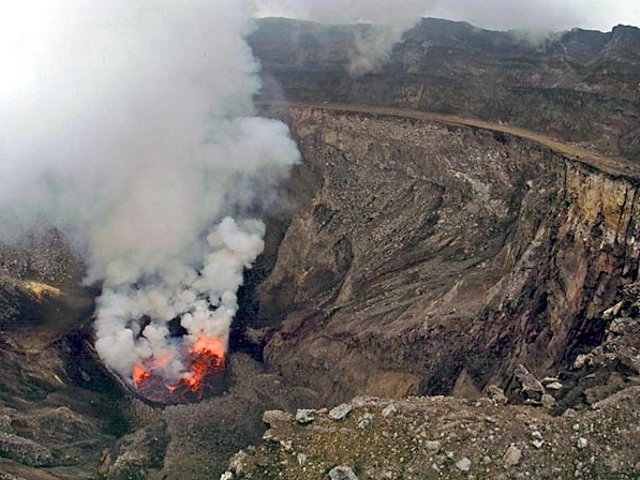 |
Figure 33. This photo presents Nyiragongo's lava lake in a view from a point on the second platform, which lies ~250 m below the summit. The inner pit with the new lava lake formed after the 2002 lateral eruption. The exact date when the photo was taken in January 2006 is unknown. Photo copyright Marc Caillet and provided courtesy of Pierre Vetsch, SVG. |
On 7 September 2005, high-resolution satellite imagery showed a thin plume emitted from Nyiragongo. The plume was not confirmed by other data. Another thin plume visible on satellite imagery on 10 October; it was not confirmed by SO2 data.
As of 28 October 2005 Nyiragongo remained very active, but stable, with a large active lava lake in the crater. A gas plume was emitted and incandescence was visible at night from several tens of kilometers away. On 7 and 13 November thin plumes from Nyiragongo that may have contained some ash were observed on satellite imagery.
In January 2006 a group from Stromboli Online undertook an expedition to Nyiragongo and photographed the lava lake (figure 34).
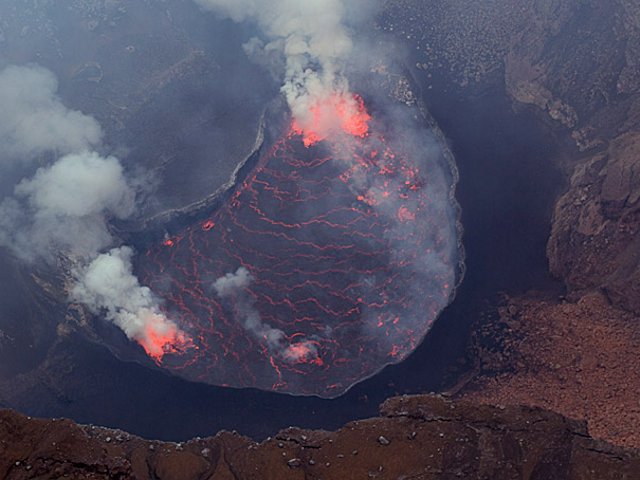 |
Figure 34. This photo of Nyiragongo's lava lake was taken from the Belvedere (Bastion) on the crater's W rim. The lake is ~ 300 m wide and its surface sat ~585 m below the rim. The second platform cuts across the bottom foreground. The exact date when the photo was taken in January 2006 is unknown. Photo courtesy of Marco Fulle. |
Information Contacts: Baluku Bajope and Kasereka Mahinda, Observatoire Volcanologique de Goma, Departement de Geophysique, Centre de Recherche en Sciences Naturelles, Lwiro, D.S. Bukavu, DR Congo; J?rg Alean, Roberto Carniel, and Marco Fulle, Stromboli Online, Rheinstrasse 6, CH-8193 Eglisau, Switzerland (URL: http://www.swisseduc.ch/stromboli/); Pierre Vetsch and Marc Caillet, Société de Volcanologie Genève (SVG), PO Box 6423, CH-1211 Geneva 6, Switzerland (URL: http://www.volcan.ch/); Toulouse Volcanic Ash Advisory Center (VAAC), Météo-France, 42 Avenue Gaspard Coriolis, F-31057 Toulouse cedex, France (URL: http://www.meteo.fr/vaac/).
Activity within the crater lake due to lava bubbles and fountain
Due to political turmoil and civil unrest, expeditions to Nyiragongo's summit lava lake are rare. Two expeditions to the summit were successful in January and July 2006. Photos of the lava lake provided by expedition leader Marco Fulle and crew are posted on the Stromboli Online website. These photos document the changes in the lake over a six-month period. Thermal anomalies measured with the MODIS satellite and associated with this volcano were nearly continuous at this time due to the lava lake within the summit crater.
Two terraces created from a 1977 (upper) lake and a 2002 (lower) lake are evident in photos from January 2006. Closer views of the lava lake showed bubbles breaking through the very dynamic lake surface. Bubbles continuously bursted through the lake's surface. Near the SW shore line, white sulfur deposits and fumaroles were observed. Lava from fountains at the N shoreline splashed on the E lake shore. By July 2006, the lava lake was smaller and seemingly more crusted over. A large fountain was continuously active on the lake's N shore, generating waves up to 10 m high (figure 35).
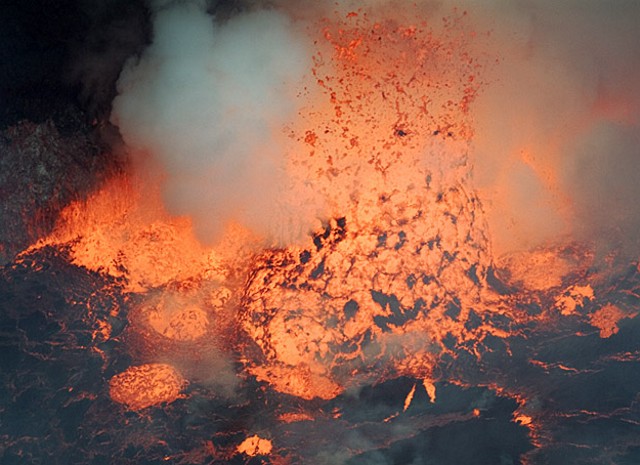 |
Figure 35. Photo of the Nyiragongo lava lake showing a chimney-like fountain agitating the surface and generating waves on the shore at left, 23 July 2006. Courtesy of Stromboli Online. |
Information Contacts: Marco Fulle, Stromboli Online and Department of Astronomy, Triste University, Trieste, Italy (URL: http://www.swisseduc.ch/stromboli/perm/nyiragongo/lake-en.html).
Summit lava lake persists; studies on volcano, and Lake Kivu gases
Nearly daily thermal anomalies seen from satellites over the crater of Nyiragongo through early 2007 confirm the presence of the lava lake there. These anomalies were acquired from MODIS satellites and are available on the University of Hawai'i Institute of Geophysics and Planetology (HIGP) MODIS Hotspot Alert website. A separate report in this issue discusses MODIS thermal anomalies measured during the 27 November 2006 eruption of Nyamuragira (BGVN 32:01), located about 10 km NW of Nyiragongo.
The consistent anomalies from the Nyiragongo crater are the result of the lava lake that formed in May 2002 within the volcano's main crater after the January 2002 eruption (BGVN 31:12; Tedesco and others, 2007). Below are brief discussions of several recent articles relevant to risks associated with new efforts in risk monitoring and mitigation at Nyiragongo that have come to our attention.
Giordano and others (2007) describe a multi-disciplinary study involving textural and rheological measurements and numerical simulations of heat transfer during magma ascent for the January 2002 eruption. This study attempted to understand the different behavior of lava flows and their threat to the local population.
Tedesco and others (2007) described activities for monitoring both volcanoes to enhance the capabilities of the Goma Volcanological Observatory (GVO). Owing to difficult security conditions caused by ongoing conflict within the Democratic Republic of Congo, scientists could only install the instruments in seven 'safe havens' that had been established by GVO. To obtain a suitable seismic network geometry (figure 36), three sites (Katale-KTL, Kibumba-KBB, and Kibati-KBT) were located on the eastern side of Nyiragongo. The array of sites allows scientists to distinguish seismic activity at Nyiragongo and Nyamuragira.
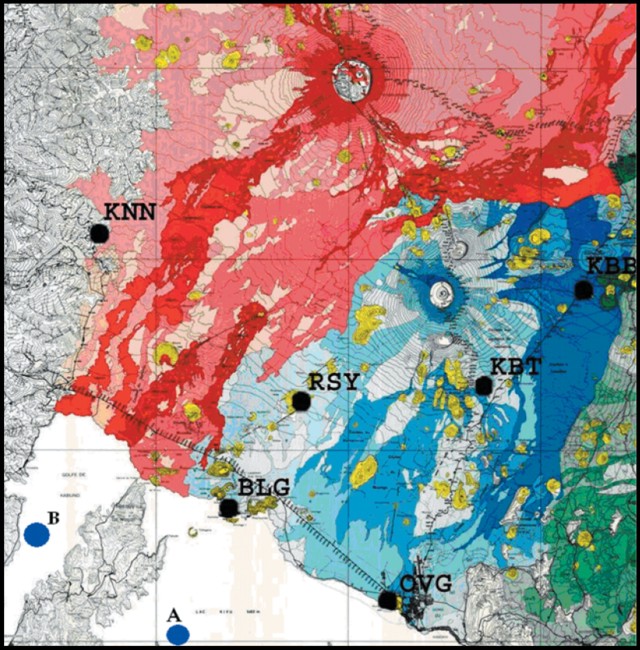 |
Figure 36. Geologic map of Nyiragongo and Nyamuragira, with respective lava flows shaded. Seven seismic stations are shown (KTL, KNN, RSY, KBB, KBT, BLG, and OVG). The points labeled A and B in Lake Kivu indicate the locations of profiles used to monitor the dissolved methane and carbon dioxide found at depth in the lake. According to Schmid and others (2005) the release of a fraction of these gases, which could be triggered by a magma eruption within the lake, would have catastrophic consequences for the two million people living on its shore. Courtesy of Tedesco and others, 2007. |
In detail, the seismic network incorporates a 24-bit analog-to-digital converting unit, GPS synchronization at the remote station, a radio-modem link on the 444-447 megahertz frequency band, solar panels, and batteries. The network uses broadband seismometers manufactured by Lennartz and Nanometrics. Seismic stations can transmit a 19.2 kilobits per second flow using 25 kHz of bandwidth.
Another article, by Chirico and others (2007), reported on a systematic study of the mitigating effects of the construction of artificial barriers to protect Goma and nearby Gisenyi, Rwanda, based on the Nyiragongo lava flow of 17 January 2002. That eruption stands as a prime example of lava flows impacting a large town (BGVN 26:12, 27:03, 27:04, and 31:12). Major lava flows on the S flank entered the town of Goma and devastated a significant portion of it, leaving more than 50,000 homeless and forcing the spontaneous exodus of nearly all of the residents, mainly into neighboring Rwanda. The study included a computer simulation of the effects of such barriers and found that, depending on the size, shape and orientation of the barriers, their protective effects can be optimized, and the local probability of lava flow invasion into the town can be reduced. The study further indicated that barriers will fail to protect the Goma international airport, an area of maximum flow hazard because of its vulnerable location with respect to the peculiar characteristics of the morphology of the terrain.
References. Chirico, G.D., Favalli, M., Papale, P., and Pareschi, M.T., 2007, Lava flow hazard map and mitigation from artificial barriers at Nyiragongo volcano through numerical simulations of lava flow paths: Geophysical Research Abstracts, European Geosciences Union, v. 9, 02238, SRef-ID: 1607-7962/gra/EGU2007-A-02238.
Giordano, D., Polacci, M., Longo, A., Papale, P., Dingwell, D.B., Boschi, E., and Kasereka, M., 2007, Thermo-rheological magma control on the impact of highly fluid lava flows at Mt. Nyiragongo: Geophysical Research Letters, American Geophysical Union, v. 34, L06301, doi:10.1029/2006GL028459.
Schmid, M., Halbwachs, M., Wehrli, B., and W?est, A., 2005, Weak mixing in Lake Kivu: New insights indicate increasing risk of uncontrolled gas eruption: Geochemistry, Geophysics, Geosystems, v. 6, Q07009, doi:10.1029/2004GC000892.
Tedesco, D., Badiali, L., Boschi, E., Papale, P., Tassi, F., Vaselli, O., Kasereka, C., Durieux, J., Denatale, G., Amato, A., Cattaneo, M., Ciraba, H., Chirico, G., Delladio, A., Demartin, M., Favalli, G., Franceschi, D., Lauciani, V., Mavonga, G., Onachesi, G., Pagliuca, N.M., Sorrentino, D., and Yalire, M., 2007, Cooperation on Congo Volcanic and Environmental Risks, Eos, Transactions, American Geophysical Union, v. 88, no. 16, p. 177, 181.
Information Contacts: Hawai'i Institute of Geophysics and Planetology, MODIS Thermal Alert System, School of Ocean and Earth Sciences and Technology (SOEST), University of Hawai'i, 2525 Correa Road, Honolulu, HI, USA (URL: http://modis.higp.hawaii.edu/).
During 2007 the lava lake persists; one death; daily SO2 data stream begins
As has been the case since July 2002, nearly daily thermal anomalies detected by satellite instruments continued through August 2007, confirming the presence of a lava lake in the summit crater. These anomalies were acquired from MODIS satellites and are available on the University of Hawai'i Institute of Geophysics and Planetology (HIGP) MODIS Hotspot Alert website.
The Moderate Resolution Imaging Spectroradiometer (MODIS) aboard NASA's Terra satellite recorded a light-colored plume on 19 June 2007 that extended SE over Lake Kivu. NASA suggested that it consisted primarily of water vapor.
Almost daily SO2 concentration-pathlengths for Nyiragongo (figure 37) have been reported online starting in May 2007 by the OMI Sulfur Dioxide Group. The SO2 concentrations are spectroscopically determined primarily by the Ozone Monitoring Instrument (OMI) aboard NASA's Earth Observing System AURA spacecraft. The highest measured amounts were ~ 2.0 Dobson Units or greater on about 20 days during June-September 2007. A Dobson Unit, DU, the product of concentration and pathlength, is a function of the number of SO2 molecules in a unit area of the atmospheric column.
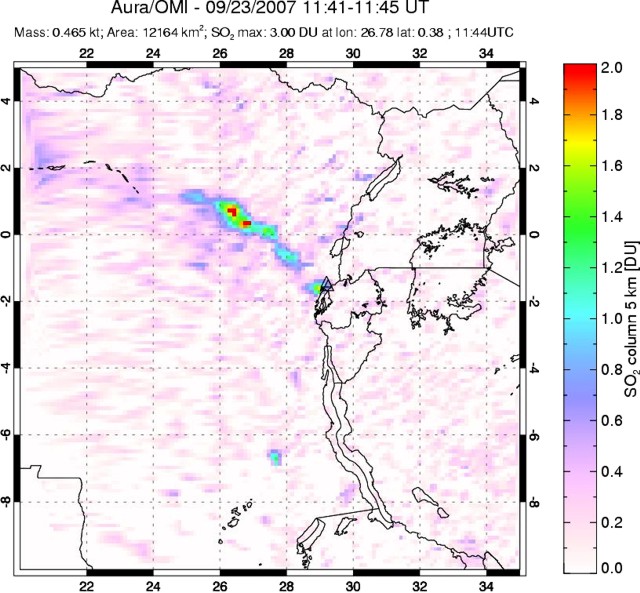 |
Figure 37. A profile of SO2 concentration-pathlength seen on 23 September 2007 in the Nyiragongo-Nyamuragira area. In this case the plume covered an area of 12,164 km2. Darker (or redder) areas represent greater SO2, as indicated by the legend on the right. The total atmospheric SO2 detected was 465 x 103 kg. Courtesy OMI Sulfur Dioxide Group. |
A photo of the summit taken from a fixed-wing aircraft in early July 2007 disclosed that a substantial portion of the outer crater wall on the W flank had collapsed, forming a large slump with an arcuate headwall (figure 38). The implication in the pilot report was that this was a recent event.
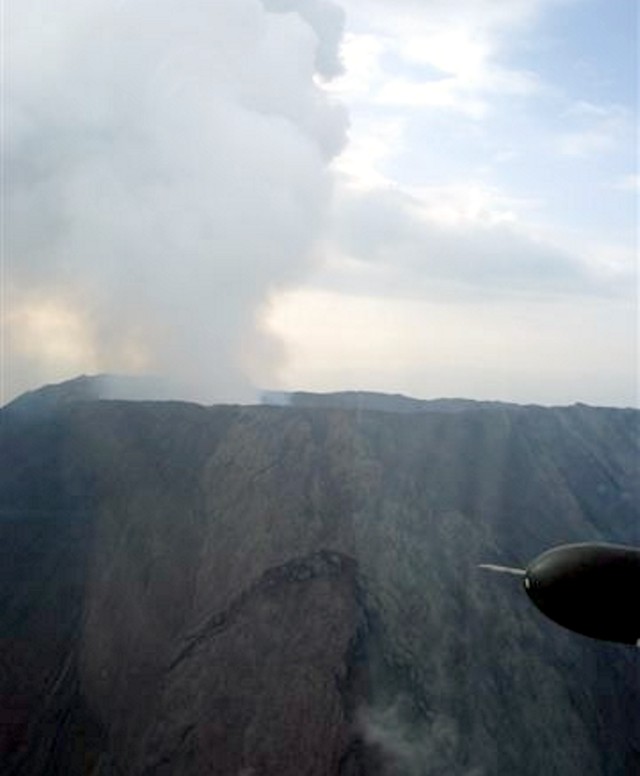 |
Figure 38. A photo taken in early July 2007 by pilot Sean O'Conner as he flew past the W slope of Nyiragongo. The scarp mentioned in the text apparently lies in the center of the field of view. A steam-and-gas plume rises vertically above the crater opening. One of the aircraft's wings juts across the right margin of the photo. Courtesy of Sean O'Conner (ECHO Flight). |
According to news media accounts, on 6 July 2007 a female Chinese tourist climbed over the crater rim of Nyiragongo for a photograph of the crater's interior. She slipped and fell more than 100 m down the steep wall of the crater to her death.
Information Contacts: NASA Earth Observatory (URL: http://earthobservatory.nasa.gov); OMI Sulfur Dioxide Group, based in the Joint Center for Earth Systems Technology at the University of Maryland Baltimore County (UMBC), and atNASA Goddard Space Flight Center (URL: https://so2.gsfc.nasa.gov/); Hawai'i Institute of Geophysics and Planetology, MODIS Thermal Alert System, School of Ocean and Earth Sciences and Technology (SOEST), University of Hawai'i, 2525 Correa Road, Honolulu, HI, USA (URL: http://modis.higp.hawaii.edu/); Reuters (URL: http://www.reuters.com/); Agence France-Presse (URL: http://www.afp.com/); Sean O'Conner, ECHO (European Commission's Humanitarian Aid Office) Flight, Goma, Democratic Republic of Congo; Tom Pfeiffer, Volcano Discovery (URL: http://www.decadevolcano.net/).
Lava lake and seismicity elevated in October 2008; lava lake persists into 2009
Previous evidence and observations indicated continued activity at Nyiragongo's summit crater lava lake through August 2007 (BGVN 32:08). MODVOLC thermal alerts have been detected over Nyiragongo nearly daily for at least the past 5 years, as late as January 2009, an indication of the persistence of the summit crater's lava lake.
John Seach climbed to the summit crater in August 2008 and saw the active lava lake, including surface currents and fountaining.
In a Die Welt news story, Kasereka Mahinda, director of the the Goma Geophysical Observatory, stated that during a visit to the crater in October 2008, a noticeable rise in the magma level of the lava lake was observed, and recent earthquakes had been felt. Much of the observatory's monitoring equipment has been looted by local civil war combatants, Mahinda explained. The war thus made instrument-based assessments impossible and prevents new instrument installations.
Gas analyses. Sawyer and others (2008) discuss the composition and flux of gas from Nyiragongo by ground-based remote-sensing techniques during mid-2005 through mid-2007. Ultraviolet spectroscopic measurements in May/June 2005 and January 2006 indicated respective average SO2 emission rates of 38 and 23 kg/s. Open-path Fourier transform infrared spectroscopic measurements obtained in May/June 2005, January 2006, and June 2007 indicated respective average molar proportions of 70, 24, 4.6, 0.87, 0.26, 0.11, and 0.0016% for H2O, CO2, SO2, CO, HCl, HF, and OCS (carbonyl sulfide). The plume compositions were similar in a 24-month span during 2005-2007, with little temporal variation in CO2, SO2, and CO proportions. This stability persisted despite variable degassing from the lava lake, including Strombolian bursts and lava fountains, and variations in the SO2 emission rate.
Reference. Sawyer, G. M., Carn, S. A., Tsanev, V.I., C. Oppenheimer, C., and Burton, M., 2008, Investigation into magma degassing at Nyiragongo volcano, Democratic Republic of the Congo: Geochem. Geophys. Geosyst., v. 9, Q02017, doi:10.1029/2007GC001829.
Information Contacts: John Seach, New South Wales, Australia (URL: http://www.volcanolive.com/); Observatoire Volcanologique de Goma, Departement de Geophysique, Centre de Recherche en Sciences Naturelles, Lwiro, D.S. Bukavu, DR Congo; Hawai'i Institute of Geophysics and Planetology (HIGP) Thermal Alerts System, School of Ocean and Earth Science and Technology (SOEST), Univ. of Hawai'i, 2525 Correa Road, Honolulu, HI 96822, USA (URL: http://modis.higp.hawaii.edu/); Die Welt (URL: http://www.welt.de/welt_print/article2721874/Ein-Vulkan-kurz-vor-dem-Ausbruch.html).
Lava fountaining, gas plumes, and tremor during January-May 2009
The last major eruption from Nyiragongo, in January 2002, sent lava flows into the city of Goma (BGVN 26:12). Prior to that eruption the status of the lava lake in the summit crater, active almost continuously since 1894, had been uncertain. However, fieldworkers in mid-May 2002 noted lava fountaining on the crater floor (BGVN 27:05), and the lava lake has been active since that time. Our most recent report on Nyiragongo in January 2009 (BGVN 34:01) discussed the persistent lava lake, which at the time was visually observed to be rising.
This report is an abridgment of three separate reports to the Governor of the North Kivu Province of Democratic Republic of the Congo which were produced by the Goma Volcano Observatory (GVO). These reports cover January-March, 1-15 April, and 16 April-5 May 2009. Direct observations of the summit crater and the S-flank Shaheru crater, were also carried out in late March.
Seismicity. During January through 5 May, volcanic earthquake swarms and intermittent volcanic tremors were observed at the Bulengo and Rusayo stations (figure 39). Earthquakes generated high-amplitude tremor in March and April, as recorded at the Rusayu seismic station (figure 40). Approximately 80-190 long-period seismic events were recorded daily at the Rusayu station between January and April 2009. Long-period seismicity, which prevailed at the beginning of April, declined toward the end of the month, when long-duration tremor appeared.
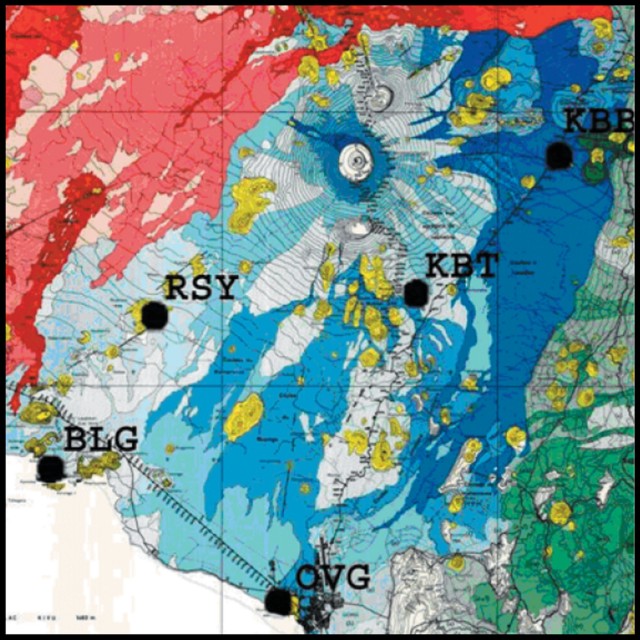 |
Figure 39. Geologic map of the Nyiragongo area, with historical lava flows (shaded blue). Lava flows from Nyamurgira are shown to the NW (shaded red). Six seismic stations are shown: Katale (KTL), Rusayo (RSY), Kibumba (KBB), Kibati (KBT), Bulengo (BLG), and Goma (OVG). Courtesy of Tedesco and others (2007). |
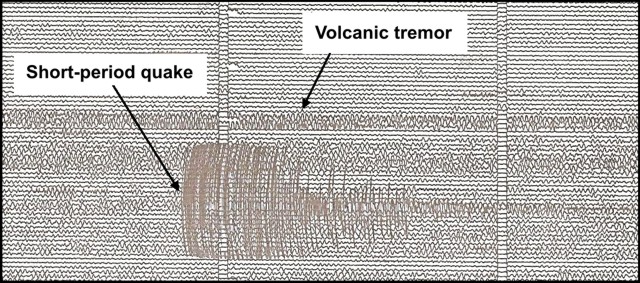 |
Figure 40. Example of volcanic tremor and a short-period earthquake recorded at Rusayu Station on 19 April 2009. Courtesy of GVO. |
During 1 April-5 May, five seismic stations were operational: Bulengo, Goma, Kibumba, Luboga, and Rusayu. Volcanic activity remained very intense (figure 41) and was characterized by long-period earthquakes (average of 140 per day). Several swarms were registered at Bulengo and at Kibumba. Intense activity was recorded at the Bulengo station during 16 April-5 May included tremor that lasted for days. At the Rusayu station, bands of tremors and short-period seismic events (tectonic-volcanic seismic events) were recorded. Short duration (seismic-tectonic) events were observed at the Luboga station, situated N of the Virunga region, which produced a 5.2-magnitude seismic event in October 2008.
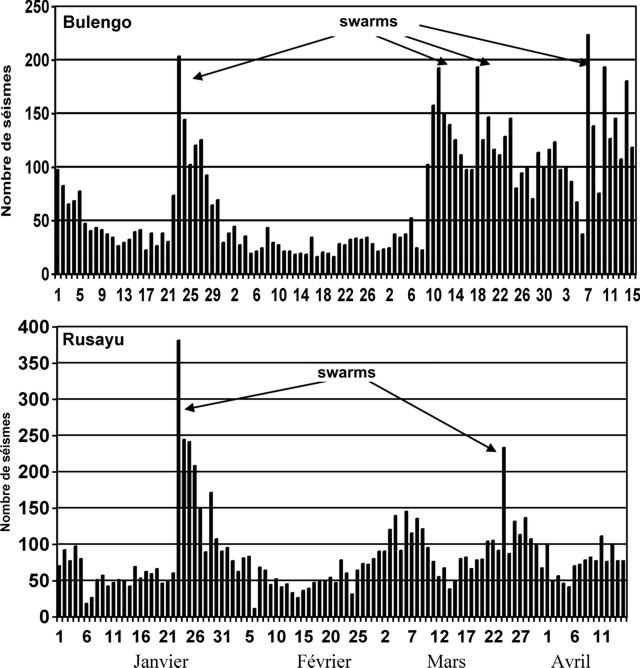 |
Figure 41. Long-period volcanic seismicity recorded S of Nyiragongo at the Bulengo (top) and Rusaya (bottom) stations, 1 January-15 April 2009. The increased swarms recorded at Bulengo in March and April may have been due to activity below Nyamuragira. Courtesy of the GVO. |
Lava lake. Activity in the lava lake during January-March 2009 was characterized by large lava fountains, gas emissions, and ejections of scoria and Pele's hair. In late March, observers noted that the lake level had dropped by ~ 20 m since 27 February, and it remained 600 m below the summit through the rest of the reporting period. Typically the lake remained crusted over in its depression (figure 42), but significant lava fountaining occurred that was consistent with the night glow that was observed at times. Fountaining during 1-15 April increased in intensity along with the incandescence at the summit. Observers during 16 April-5 May noted that the lava lake overflowed from the current pit at several points along the NW and SW rims, and lava fountaining continued.
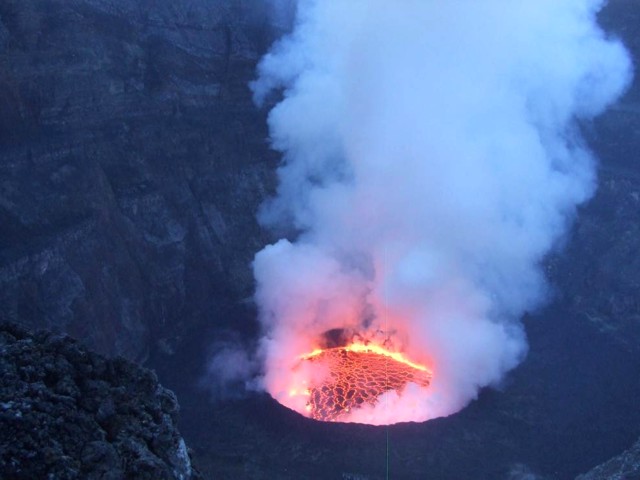 |
Figure 42. Photo of the active lava lake in the summit crater of Nyiragongo, 22 March 2009. Courtesy of the GVO. |
Gas plume. During January-March a large, almost permanent, gas plume above the volcano mixed with atmospheric clouds to produce acid rain that fell on nearby inhabited zones. On 1 April 2009, the gas plume changed direction toward the E (figure 43) and then toward the SE, while normally it blows W. The plume later became denser and at times appeared very black. Also visible at this time was the reflection of the lava fountains on the gas plume above the crater. The dense plume caused by the lava fountaining in the crater continued through 5 May (figure 44).
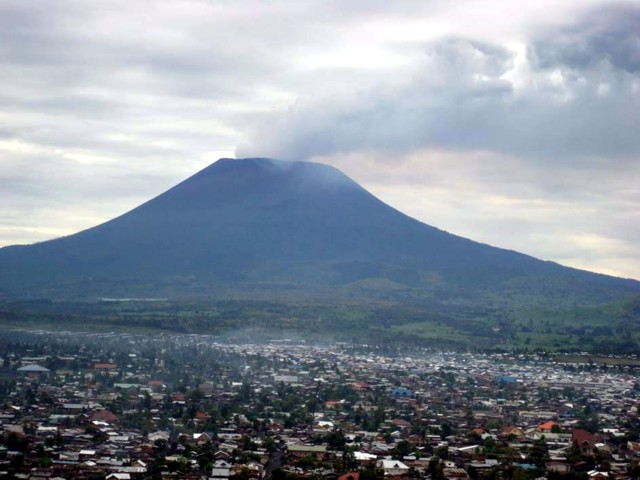 |
Figure 43. Large gas plume blowing E from the summit of Nyiragongo, 1 April 2009, as seen from Goma. Courtesy of the GVO. |
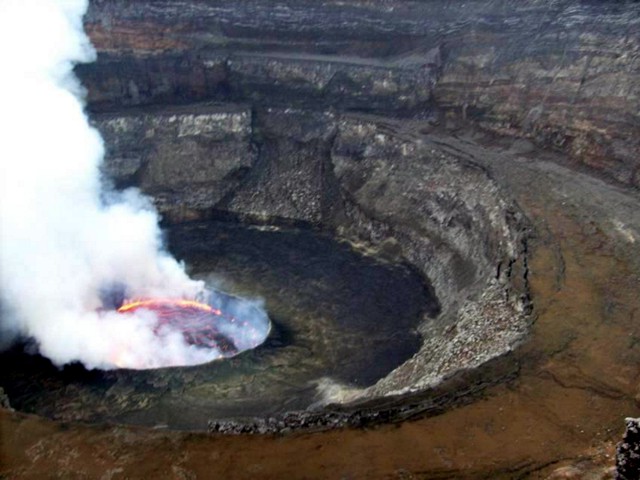 |
Figure 44. Gas plume rising from the active lava lake in the summit crater of Nyiragongo sometime during 16 April-5 May 2009. Courtesy of the GVO. |
Additional observations. During the reporting period, observers noted that the edges of the crater were becoming more unstable. During late March, some collapse of material was seen toward the E part of the crater, and during 16 April-5 May collapse was reported to the SW. A team of scientists from the Goma Volcano Observatory conducted fieldwork from 22 to 24 March 2009.
Measurements at the summit taken on 27 March 2009 revealed a dilation (extension) of approximately 1 mm relative to October 2008. The Mugara fissure underwent a slight compression since that time. Additional measurements through 5 May showed no more than a 0.02 mm change.
Significant fumarolic activity was observed at the S-flank Shaheru crater on 24 March, along the fissures linking Shaheru to the central crater. Shaheru is one of three cones that make up the volcanic complex; the other cones are Baruta and Nyiragongo Central. During 16 April-5 May intermittent but abundant fumaroles along the length of the Shaheru fissure were observed. Also during this period, despite bad weather which obscured visibility, fumarolic columns were observed from the summit.
References. Tedesco, D., Badiali, L., Boschi, E., Papale, P., Tassi, F., Vaselli, O., Kasereka, C., Durieux, J., Denatale, G., Amato, A., Cattaneo, M., Ciraba, H., Chirico, G., Delladio, A., Demartin, M., Favalli, G., Franceschi, D., Lauciani, V., Mavonga, G., Onachesi, G., Pagliuca, N.M., Sorrentino, D., and Yalire, M., 2007, Cooperation on Congo Volcanic and Environmental Risks, Eos, Transactions, American Geophysical Union, v. 88, no. 16, p. 177, 181.
Information Contacts: Dieudonné Wafula Mifundu and Célestin Kasereka Mahinda, Observatoire Volcanologique de Goma, Departement de Geophysique, Centre de Recherche en Sciences Naturelles, Lwiro, D.S. Bukavu, DR Congo.
June 2010 crater expedition reveals continuously active lava lake
The following is based on a report of a field expedition to Nyiragongo's summit crater (visits to the summit are infrequent) during June 2010 and satellite observations through September 2010. Lava fountaining, gas plumes, and tremor were detected at Nyiragongo during January-May 2009 (BGVN 35:04).
Crater expedition during 14-24 June. Field observations during a 14-24 June expedition into the crater showed the lava lake to be continuously active, with rapid movement of cooled plates of fresh rock.
The expedition team included members from the Société de Volcanologie Geneve (SEG, Geneva, Switzerland), the Second University of Naples (Naples, Italy), the University of Massachusetts-Boston, l'Observatoire Volcanologique de Goma (D.R. Congo), and the United Nations Office of Project Services (UNOPS) (Copenhagen, Denmark).
Sample collection areas included exterior flows from previous eruptions on the edifice flanks (1977 and 2002 flows) and within the crater, where the team labeled key features with Greek symbols (figure 45). The team recognized three lava terraces: 1) β (pre-1977 eruption), 2) γ (post-1977 eruption-2002 eruption), and 3) ε, a newly formed (post-2002) terrace.
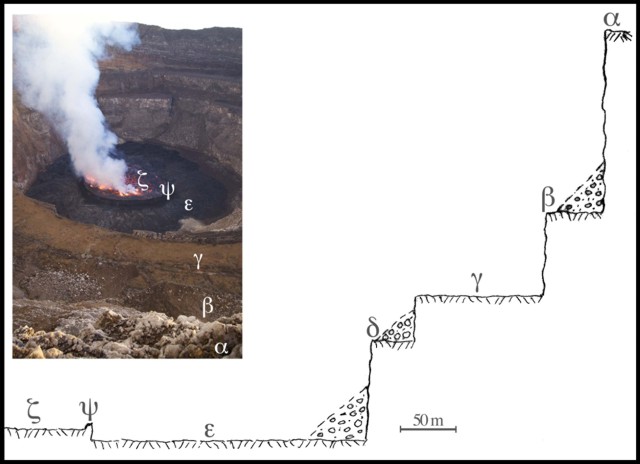 |
Figure 45. Topography of the interior of the Nyiragongo summit crater, shown in the photo looking N and in the sketch trending from the S rim radially inward to the molten lake (ζ). The total elevation change from the rim (α, at elevation 3,425 m) to the crater floor (ε) is ~400 m. The structures shown here are absent from portions of the circumference due to the collapsing of some parts of the terrace. Part δ is not a true terrace, but rather a small flat area, due to the collapsing of parts of the second terrace (not visible in the inset image). The team's base camp was located on the second terrace, γ. The lava lake rim or levee (ζ) was 15-20 m above the crater floor (ε) and is confined within an almost circular scoria wall (ψ). The whole crater floor declines slightly E and overflows the lake more frequently in that direction. Both the vertical and horizontal scales are equivalent. Courtesy Burgi and others (in preparation). |
Burgi and others (in preparation) devised a schematic to illustrate some of the key issues in Nyiragongo's magma storage and feeding systems at depth. Tentatively, the lower estimate of magma volume is ~10 x 106 m3. The morphology of the lava lake at depth is little-known, but it may be partly or completed filled by molten material. In this latter case, Burgi and others tentatively estimated the total volume of molten material inside the volcano to be ~50 x 106 m3.
Field collections included samples from each terrace, fresh lava samples from the lake (19-22 June 2010), and various samples from fumaroles. Samples collected at selected fumaroles included fumarolic gases, steam condensates, soils, and weathered volcanic clays.
Nyiragongo lavas generally display a distinctly alkaline-rich (ultra-potassic), low-silica, mafic foiditic basalt composition that results in the lowest recorded viscosity among terrestrial lavas. The major element chemistry of the 2010 lava samples was reasonably similar to the data reported for the 2002 eruption (e.g., Chakrabarti and others, 2008).
The team found the most intense zones of fumarolic activity along a N- and NNE-trending fracture set on the southern side of the edifice. Those fumaroles sit between Nyiragongo and the northern margin of Lake Kivu (including the city of Goma). Almost all of the observed fumarolic activity occurred in the crater on both the crater walls and on portions of terraces.
On terrace 3, fumaroles were mainly present in the E (E-NE quadrant) part of the crater floor, on a much smaller area than terraces 1 and 2.
The temperature of the fumaroles ranged to a maximum of over ~300°C. Fumaroles approximately in the center of terrace 2 showed high temperatures (up to 300°C) and high sulfur concentrations (~100-400 ppm S), as compared with consistently decreasing temperatures and sulfur contents towards the E (80-100°C and 7-40 ppm S). The team reported that this lineament was in line with fractures that produced lava flows during the 2002 eruption and with the Shaheru flank sub-edifice. The team noted that the observations of fumarolic activity and chemical composition may have been biased by their point of observation.
For the fumarolic samples, the team analyzed the composition of the condensates (table 10). In general, the condensates from each terrace can be characterized as acidic (pH 2.18-3.21), with widely variable chemistry.
Table 10. Chemical data determined at Nyiragongo crater fumaroles at terraces 1, 2, and 3 ("--" = not determined). Courtesy Burgi and others (in preparation).
| Location | Sample | Temp. (°C) | pH | EC (µs) | F- (mg/L) | Cl- (mg/L) | Br- (mg/L) | NO3- (mg/L) | PO43- (mg/L) | SO42- (mg/L) |
| Terrace 1 | PT 2-1 | 85 | -- | -- | 1.4 | 3.7 | 6.2 | 0 | 0 | 97.2 |
| Terrace 2 - SSW | LT3-PT2 | 105 | -- | -- | 7.7 | 6.2 | 0 | 0 | 175.2 | 24 |
| Terrace 2 - Central (south) | S1-PT2 | ~300 | -- | -- | 6.5 | 41.9 | 0 | 2 | 344.1 | 412.8 |
| Terrace 2 - Central (south) | S2-PT2 | 115 | 2.18 | 1842 | 24.5 | 77 | 0 | 0 | 95.9 | 107.5 |
| Terrace 2 - Central (south) | S3-PT2 | 110 | 2.46 | 882 | 15.6 | 9 | 0 | 0 | 0 | 332.7 |
| Terrace 2 - East | PT2-LT1 | 80 | 2.57 | 322 | 0.1 | 0.2 | 0 | 0 | 0 | 42.5 |
| Terrace 2 - East | PT2-LT2 | 90 | 2.28 | 1520 | 0.8 | 19 | 0 | 0 | 0 | 190.6 |
| Terrace 2 - East | PT2-LT3 | 90 | 2.19 | 2359 | 1.1 | 3.9 | 0 | 0 | 0 | 365.3 |
| Terrace 2 - East | PT2-F | 100 | 2.79 | 48 | 0 | 0 | 0 | 0 | 0 | 6.9 |
| Terrace 3 | PT3-2 | ~100 | 3.21 | 464 | 14.2 | 18.4 | less than 0.03 | 0.1 | 15.3 | 301.4 |
| Terrace 3 | PT3-1 | ~100 | 2.88 | 380 | 1.7 | 1.2 | 0 | 0.1 | 0 | 99.9 |
The team found that the lava lake's E-W axis was ~230 m across. In those instances where a proper cross-lake measurement was achieved, the team found the N-S distance to be ~220 m. Thus, the approximately circular lava lake's surface was ~40,000 m2 in area.
If the lava lake were ~500 m deep and in the shape of an inverted cone, with 40 m and 225 m for bottom and top diameters, respectively, the team conservatively estimated its volume as approximately 7.5-10 x 106 m3.
Since the last eruption (January 2002), the surface of the lava lake has risen regularly (figure 46). The surface ascends towards the crater rim due to a constant influx of magma at an approximate average rate of ~4.8 m per month (~57 m/year).
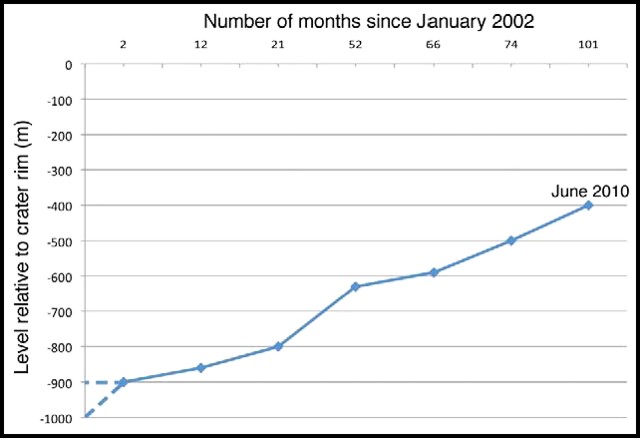 |
Figure 46. A plot showing the rise of Nyiragongo's crater floor, in meters below the crater rim, during January 2002 to June 2010. The January 2002 level is not known with precision, but was probably between 900 and 1000 m below the rim. Adapted from Tedesco and others (2007) and Durieux (2008). Courtesy Burgi and others (in preparation). |
Satellite observations. A 5 May 2009 report by UNOSAT showed thermal anomalies, which defined a 1.5 x 3 km band centered over the crater during 10 April-4 May 2009. UNOSAT analysts considered the anomalies as "likely to represent active fires and/or volcanic material on the surface." Because of thermal radiance from its lava lake, MODVOLC alerts were frequent for years, through October 2010, centered over the crater. The number of alerts at Nyiragongo were dwarfed during January 2010 due to 17.65 ? 5.98 x 10⁶ m2 of lavas erupted at Nyamuragira (as discussed in BGVN 35:08) and flowing in the area between the two volcanoes.
A small area of satellite-detected thermal anomalies located over the main crater of Nyiragongo was detected on the evening of 4 January 2010 by the MODIS on the Aqua satellite. In their 7 January 2010 report on this and a much larger anomaly over the Nyamuragira volcano area, UNOSAT analysts noted that it is likely that not all anomalies were detected in the area because of dense cloud cover or gaps in satellite coverage.
The Washington VAAC reported a large sulfur dioxide plume in the vicinity of Nyamuragira and Nyiragongo during 10-11 January 2010. Based on analyses of satellite imagery, the Toulouse VAAC reported that, during 30-31 January, a diffuse plume drifted 240 km W. The plume could have come from one or both of these volcanoes, but, given the known vigorous lava outpourings at Nyamuragira, that volcano would seem the dominant source.
The Advanced Land Imager (ALI) on NASA's Earth Observing-1 (EO-1) satellite captured images of a plume from the summit of Nyiragongo on 27 June and 28 July 2009 and again on 28 May (figure 47), 24 July, and 3 August 2010. The plume appeared pale blue-gray, suggesting it was rich in sulfur dioxide, and generally drifted S-SW.
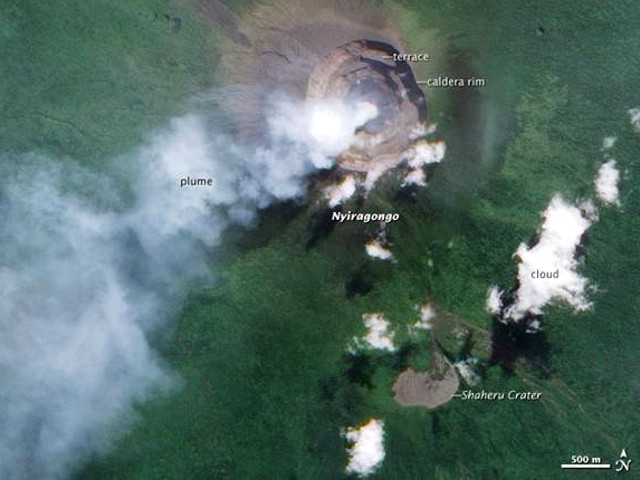 |
Figure 47. Nyiragongo's steam and volcanic gases were visible rising from the surface of the lava lake on 28 May 2010. This image was acquired by the ALI imager aboard NASA's EO-1 satellite. According to NASA Earth Observatory analysts, the plume was emanating from the molten surface of the lake. The analysts interpreted the dark gray/black area on the caldera floor as a crust of solidified lava. Shaheru crater, ~2 km S of the summit, was the site of active fissures in both 1977 and 2002. Courtesy Jesse Allen and Robert Simmon, NASA Earth Observatory. |
References. Burgi, P.-Y., Darrah, T., Balagizi, C., Karume, K., Campbell, M. E., Poreda, R. J., Tedesco, D., [in preparation], Assessment of Eruptive Activity and Lava Chemistry at Mount Nyiragongo, DRC, June 2010.
Chakrabarti , R., Sims, R. W. W., Basu, A.R., Reagan , M. and Durieux, J., 2008, Timescales of Magmatic Processes and Eruption Ages of the Nyiragongo volcanics from 238U-230Th-226Ra-210Pb disequilibria: Earth and Planetary Science Letters, v. 288, 1-2, 30 October 2009, p. 149-157. doi:10.1016/j.epsl.2009.09.017.
Durieux, J., 2008, Rapport de mission de terrain au volcan Nyiragongo: UNOPS: Copenhagen, Denmark, 2 April 2008, 3 p.
Tedesco, D., Vaselli, O., Papale, P., Carn, S. A., Voltaggio, M., Sawyer, G. M., Durieux, J., Kasareka, M., Tassi, F., 2007, January 2002 Volcano-Tectonic Eruption of Nyiragongo Volcano, Democratic Republic of Congo: J. Geophys. Res., v. 112, B09202, doi:10.1029/2006JB004762.
Information Contacts: Pierre-Yves Burgi, Université de Genève, 24 rue du Général-Dufour, CH-1211 Genéve 4, Switzerland (URL: http://www.unige.ch/); Thomas Darrah, University of Massachusetts Boston, Boston, MA 02125, USA; Charles Balagizi, Goma Volcano Observatory, Departement de Geophysique, Centre de Recherche en Sciences Naturelles, Lwiro, D.S. Bukavu, DR Congo; Dario Tedesco, University of Napoli 2, Dipartimento di Scienze Ambientali, via Vivaldi 43, 81100 Caserta, Italy and AFO CDOC, Goma, DR Congo (URL: http://www.unops.org/); Jesse Allen and Robert Simmon, NASA Earth Observatory (URL: http://earthobservatory.nasa.gov/); UNOSAT/UNITAR, Palais des Nations CH-1211 Geneva 10, Switzerland (URL: https://unitar.org/unosat/); Toulouse Volcanic Ash Advisory Center (VAAC), Météo-France, 42 Avenue Gaspard Coriolis, F-31057 Toulouse cedex, France (URL: http://www.meteo.fr/vaac/); Washington Volcanic Ash Advisory Center, Satellite Analysis Branch (SAB), NOAA/NESDIS E/SP23, NOAA Science Center Room 401, 5200 Auth Rd, Camp Springs, MD 20746, USA (URL: http://www.ospo.noaa.gov/Products/atmosphere/vaac/).
Bubbling lava lake visited by three groups during January 2011
This report discusses observations of Nyiragongo made in January 2011. As noted in BGVN 35:09, a 14-24 June 2010 expedition into the crater showed that Nyiragongo's lava lake was continuously active and had risen since the last extensive eruption that inundated central Goma in January 2002.
Similar activity was confirmed during visits by three groups to the crater during 9-12 January, 16-26 January, and 20-23 January 2011, with observations of a continuously active lava lake, lava fountains reaching several meters high, and gas emissions (figures 48 and 49; dozens more images appear on the websites noted in the Information Contacts subsection). One group described the lava lake as "boiling so lively and quick-tempered, like cream of wheat in a pot at the highest heat setting."
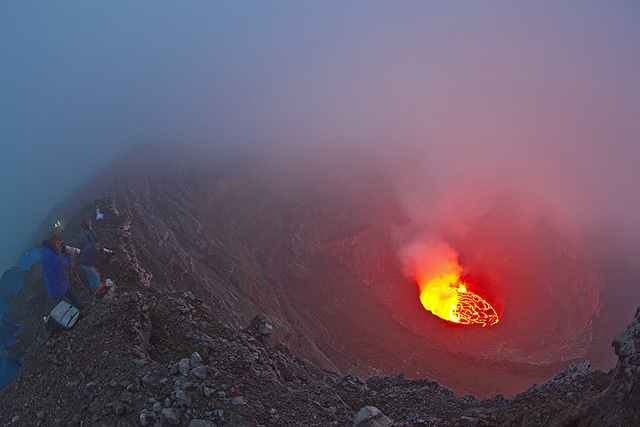 |
Figure 48. Photographers watched Nyiragongo's lava lake from an undisclosed point on the rim; this photo was taken in low-light conditions sometime during 9-12 January 2011. Disrupted portions of the lava lake surface (described by observers as "degassing fountains") often formed clusters that shifted position as the lava lake underwent convection. Fumes emitted through the disruptions rose vertically and were illuminated by the intense glow of the lava. Courtesy of Tom Pfeiffer (Volcano Discovery). |
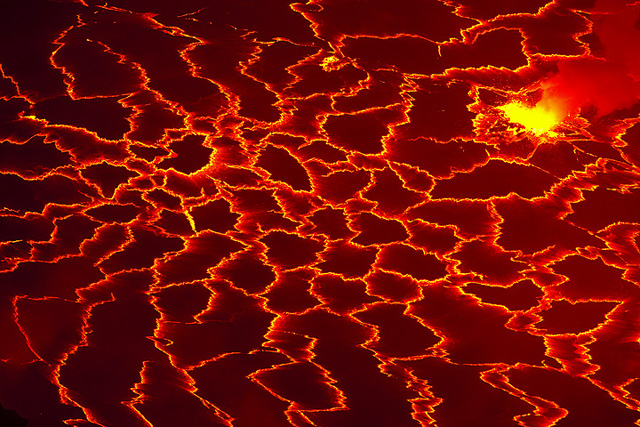 |
Figure 49. A photo taken at night sometime during 9-12 January 2011 showing an isolated disruption in the crust of Nyiragongo's lava lake (a surface composed of numerous interlocking polygonal plates) and spatter. The plates were drawn towards the disruption, rather than pushed away. The lake's cooling crust was thin and easily torn apart, exposing hot lava, which in turn quickly cooled to form new plates. Photo courtesy of Tom Pfeiffer (Volcano Discovery). |
On 20 January 2011, the topography of the interior of the crater remained the same as in mid-June 2010 (figure 50). The surface of the lava lake was then between 3,010 m and 3,020 m elevation. Convection of the lava lake surface and disruptions in the cooled surface that produced fountains and gas emissions were observed at differing intensities. The symbols in figure 50 correspond to those of figure 45 in our previous report, thus preserving terminology (BGVN 35:09). The observers recognized three upper terraces from the previous figure (α, β, and γ) but not all are visible in figure 50.
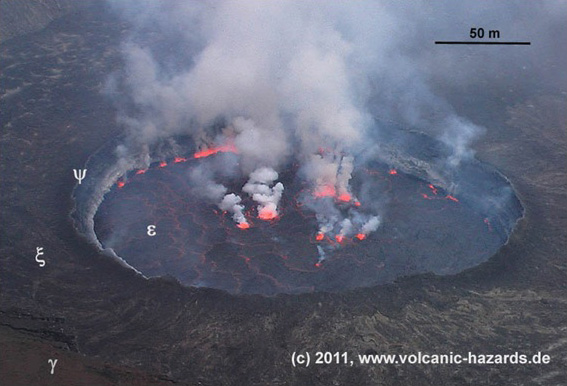 |
Figure 50. Image of the lava lake inside the crater of Nyiragongo on 20 January 2011. The central crater contains the lava lake (ε), which oscillated. A ring wall (ψ) confined the lake and led to the lower terrace (ξ). The rim of the ring wall is several meters higher than the lower terrace. The photo is taken at some elevation above the post 1977-2002 eruption terrace (γ). The team noted variations in both the lake's convection and degassing fountains. Courtesy of Christoph Weber. |
Information Contacts: Tom Pfeiffer, Volcano Discovery (URL: http://www.volcanodiscovery.com/); Marc Szeglat, Vulkane.net (URL: http://vulkane.net/); Christoph Weber, VHDL, Muehlweg 11, 74199 Untergruppenbach, Germany (URL: http://www.volcanic-hazards.de/).
Lava lake dynamic but largely at low levels during mid-2011
Information from observers monitoring Nyiragongo is intermittent and difficult to obtain because of ongoing difficulties related to securing funding for the observatory in Goma. A team of scientists visited Nyiragongo during 30 May-9 June 2011; this report is based on two published reports describing that visit. The first report (Burgi, 2011) originally appeared in French. The report said the expedition included team members from the Société de Volcanologie Geneve (SVG, Geneva, Switzerland), the Second University of Naples (Naples, Italy), INGV Catania (Catania, Italy), l'Observatoire Volcanologique de Goma (D.R. Congo), and the United Nations Office of Project Services (UNOPS) (Copenhagen, Denmark). The second report consisted of an article (Burgi and others, 2014) published in May 2014 in the Journal of Geophysical Research. Information from observers monitoring Nyiragongo is intermittent and difficult to obtain because of ongoing difficulties related to securing funding for the observatory in Goma.
In BGVN 35:09, in the caption for figure 45, we reported that during June 2010 Nyiragongo's lava lake rim or levee (labeled z) was 15-20 m above the crater floor (e) and was confined within an almost circular scoria wall (y). In the SVG report covering the June 2011 visit, it was reported in a caption for the same figure that "The lava lake rim or levee (z) was 6 m above the crater floor (e) in June 2010, which was not the case in May 2011, since the edge W had collapsed in the meantime."
The team employed a hand-held portable infrared-laser rangefinder with integral tilt meter. Surveying from the second terrace (y) allowed the team to estimate the lava lake's E-W axis, 260 m; and the N-S axis, 228 m. Those diameters enabled the team to estimate the lake surface area to be 46,000 m2, an increase of 6,000 m2 since June 2010.
The measurements during 30 May-9 June 2011 also indicated that the level of the chilled lava on the crater floor, 128-130 m below the second terrace, had not changed since 2010 (last two points at right in figure 51). This defied a simple linear extrapolation of the curve for the previous few years, which projected the crater floor would undergo continued rise in 2011. The team concluded that the activity of the lava lake must have declined. The team found a lack of evidence for lava overflow leaving deposits on the crater floor for almost a year, again consistent with no increase in lava lake level.
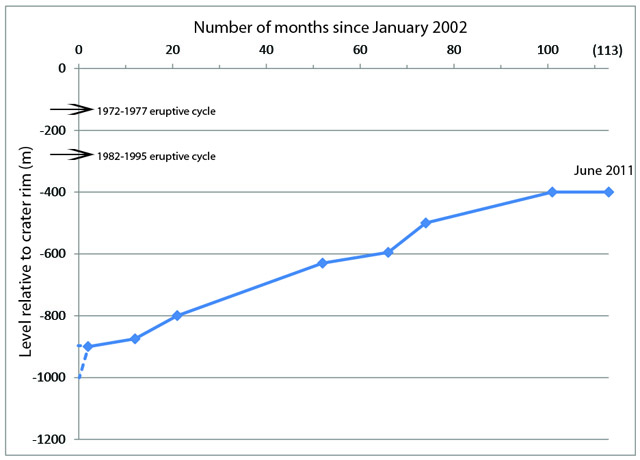 |
Figure 51. A diagram showing the level (comparative elevation) of Nyiragongo's active crater floor, in meters below the crater rim, during January 2002 to June 2011. The last data point is from the field visit discussed here. The January 2002 level of the crater floor is not known with precision, but was probably between 900 and 1000 m below the rim. This plot is a continuation of the one presented as figure 46 in BGVN 35:09. Burgi and others (2014) discuss the absolute elevation of the crater floor during the visit, 3,025 m (a.s.l). High levels from eruptions during 1972-1977 and 1982-1995 are noted with arrows. Taken from Burgi (2011). |
The team first found that the level of the lava lake had receded to an elevation ~15 m below the edge of the pit crater. The lava lake's elevation was stable until late afternoon on 3 June, when a loud noise and a "large burst" occurred within the lava lake. Lava drained from the lava lake, lowering its surface by 25-30 m in less than 1 minute. The team estimated that overall this drainage swept away more than 1 x 10⁶ m3 of magma within a few minutes. In the subsequent hours, the convective motion of the lava lake ceased and was followed by strong strombolian eruptions in the northern part of the lava lake. In this phase, material from the lake sprayed to heights of ~50 m above the lake.
Compared to the edge of the pit crater, the lava lake level continued to drop during 4 June-6 June, with a total drop (including the first major pulse) of ~33 m, placing the lava lake surface to almost 45 m below the edge of the pit crater by 8 June (figure 52). By the end of the team's crater visit, the level had reached ~55 below the edge of the pit crater.
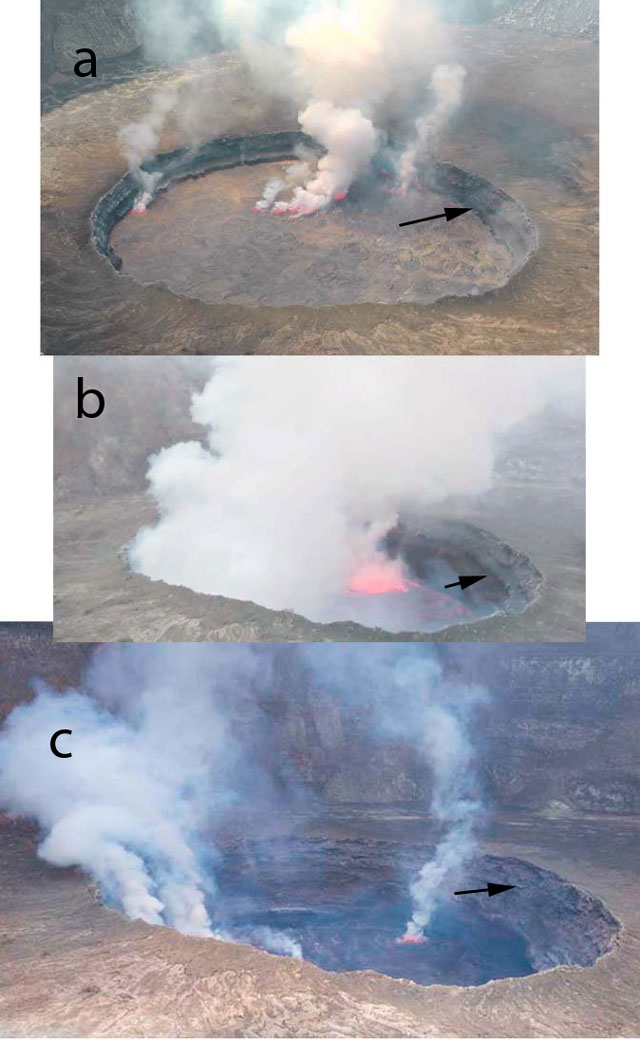 |
Figure 52. Photos of Nyiragongo's crater floor and the pit crater within it, documenting the rapid drop in the level of the lava lake seen during 2-8 June 2011. The white arrow in each photo is showing the same datum on the wall of the pit crater, 12 m below the pit crater's rim. For the specified times and dates, the following values represent the vertical distance of the lava lake below the edge of the pit crater: (A) 1400 on 2 June, 12 m; (B) 0815 on 4 June, 37 m; and (C) 0945 on 8 June, 45 m. Photos courtesy of Patrick Marcel, published in Burgi and others (2014). |
Based on their measurements and the assumption that the deeper edifice takes the shape of an inverted cone, the team concluded that the volume of magma contained in the lava lake during their June 2011 visit was approximately 10 x 106 m3. Small but repeated movements of the edifice produced by the fluctuating level of the lava lake were interpreted as sufficient to weaken the edifice, which had already fissured during previous eruptions.
Satellite data and imagery during July 2012. The Toulouse Volcanic Ash Advisory Center (VAAC) reported that beginning on 3 July 2012 Nyiragongo emitted a series of ash plumes up to an altitude of 5.5 km, or approximately 2 km above the summit. They noted that sulfur dioxide emissions from Nyiragongo are common, but ash emissions are unusual.
Figure 53 shows MODIS imagery of Nyiragongo discussed by the NASA Earth Observatory. They commented on the absence of signs of increased activity and that activity at the volcano appeared similar to that during the previous 10 years.
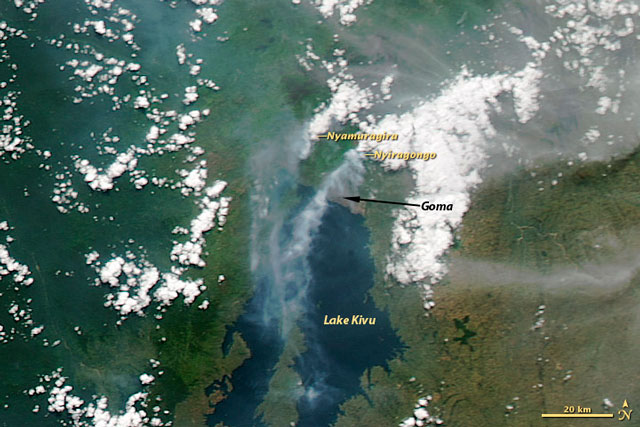 |
Figure 53. MODIS Aqua satellite image on 5 July 2012 showing emissions streaming SW from Nyiragongo, with a plume emitting from nearby Nyamuragira also visible. Courtesy NASA Earth Observatory. |
References. Burgi, P.-Y. (2011), Rapport de L'activité éruptive du Nyiragongo, MaiJuin, 2011, Societe de Volcanologie Geneve, 110 Bulletin Mensuel, pp. 3-8.
Burgi, P.-Y., T. H. Darrah, D. Tedesco, and W. K. Eymold, 2014, Dynamics of the Mount Nyiragongo lava lake, J. Geophys. Res., Solid Earth, 119, pp. 4106-4122, doi:10.1002/2013JB010895.
Information Contacts: Pierre Vetsch, Société de Volcanologie Genève (SVG), PO Box 6423, CH-1211 Geneva 6, Switzerland (URL: http://www.volcan.ch/); Jeff Schmaltz, LANCE MODIS Rapid Response Team, Goddard Space Flight Center, NASA Earth Observatory (URL: http://earthobservatory.nasa.gov); and Toulouse Volcanic Ash Advisory Center (VAAC), Météo-France, 42 Avenue Gaspard Coriolis, F-31057 Toulouse cedex, France (URL: http://www.meteo.fr/vaac/).
New vent in the summit crater during February-April 2016; lava lake active throughout 2011-2016
Nyiragongo holds one of the world's largest lava lakes, having been observed since at least 1971 (CSLP 21-71). Lava flows in 1977 and 2002 had deadly consequences for the city of Goma, which lies about 15 km S of the summit. The last Bulletin (BGVN 39:04) summarized observations made by a team of scientists that visited the volcano during 30 May-9 June 2011, and Toulouse Volcanic Ash Advisory Center (VAAC) notices posted in July 2012. This report covers activity from November 2011 through December 2016. Ground reports of activity are infrequent, though there are intermittent tourist expeditions, and a visit by scientists in March 2016 provided visual observations detailing changes in the crater and vent morphology.
Excellent pictures of the lava lake within the crater were taken in June 2010 by photographer Olivier Grunewald, while on an expedition to the volcano with observatory scientists doing fieldwork. These images, 28 total, were provided by Nelson (2011) for a news article; three are shown below (figures 54-56).
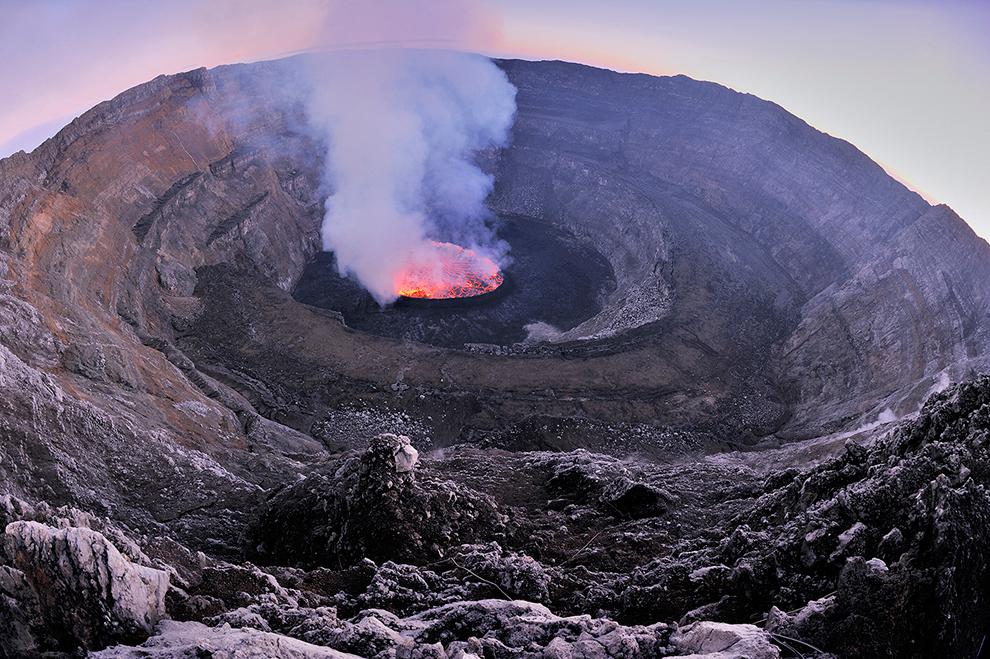 |
Figure 54. The lava lake within the Nyiragongo crater, June 2010. Photo by Olivier Grunewald in Nelson (2011). |
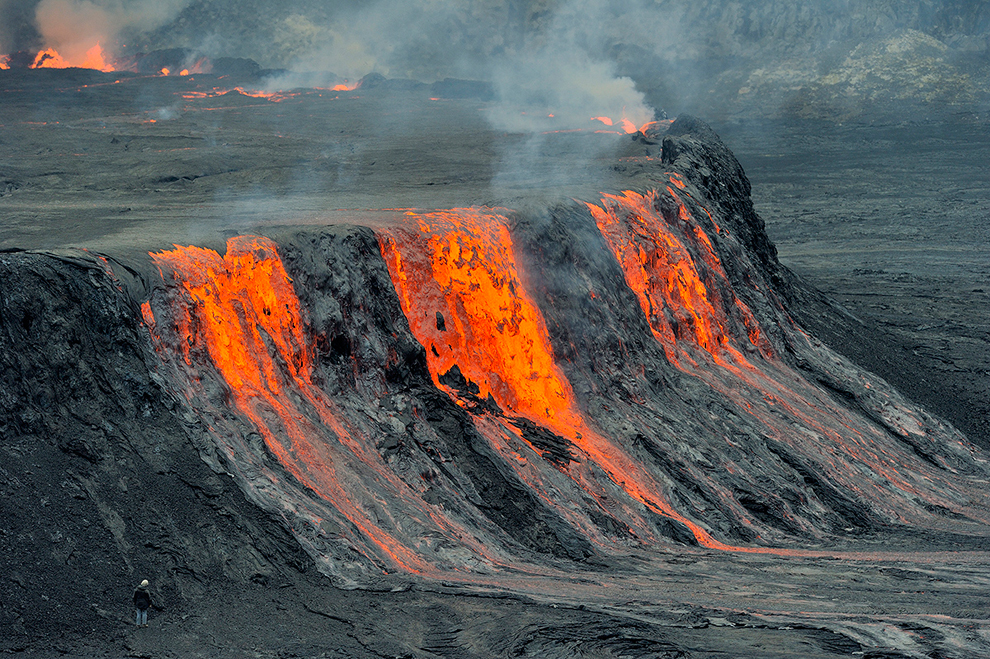 |
Figure 55. Close-up daytime view of lava overflowing from the elevated active pit within the summit crater, June 2010. Note person for scale at lower left. Photo by Olivier Grunewald in Nelson (2011). |
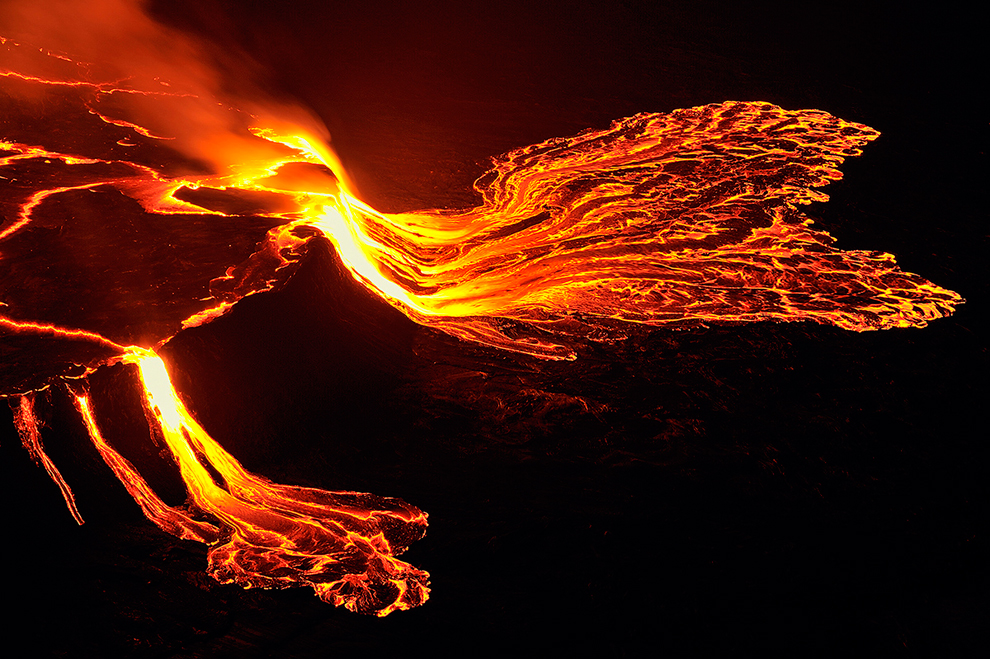 |
Figure 56. Night view from the crater rim of lava overflowing from the elevated active pit within the summit crater, June 2010. Photo by Olivier Grunewald in Nelson (2011). |
Emissions and thermal anomalies. A nearly daily record of thermal alerts identified from the MODIS Agua and Terra satellite sensors has been generated by MODVOLC since 2002; the MODVOLC and MIROVA systems recorded nearly daily thermal anomalies during 2015 and at least through December 2016.
According to NASA's Earth Observatory, a satellite image acquired on 15 November 2011 showed heat coming from the active lava lake. The Toulouse VAAC reported that, according to a Volcano Observatory Notices for Aviation (VONA) issued by OVG (Observatoire Volcanologique de Goma), a gas plume composed mostly of sulfur dioxide rose from the crater on 1 November 2012. Another satellite image, acquired on 29 July 2013 and analyzed by NASA's Earth Observatory, again showed incandescence coming from the active lava lake in the summit crater; a diffuse blue plume drifted N.
A satellite image from 29 January 2014 showed a gas-and-steam plume rising from Nyiragongo. On 9 February 2015, clear skies permitted a view from space of plumes venting from Nyamuragira (figure 57, top) and Nyiragongo (figure 57, bottom) volcanoes.
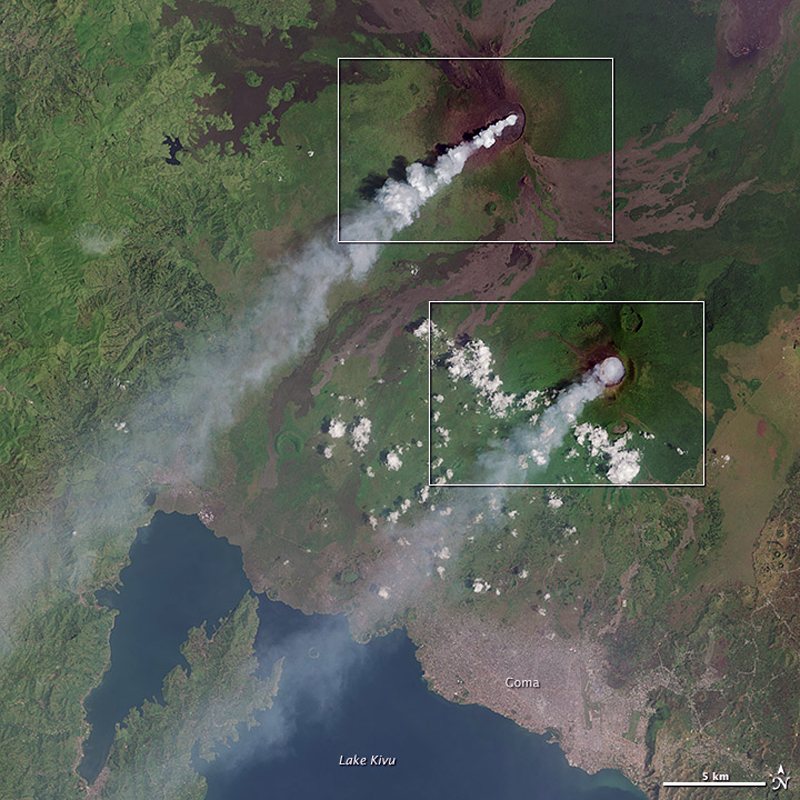 |
Figure 57. The natural-color satellite image above was acquired on 9 February 2015 by the Operational Land Imager (OLI) instrument on Landsat 8, showing a broad view of the region, with Nyamuragira to the N and Nyiragongo to the S, separated by a distance of about 15 km. Courtesy of NASA Earth Observatory. |
New vent in crater, February 2016. Activity intensified on 28 February 2016, prompting OVG to dispatch a team of scientists to the crater. Starting at 0400 on 29 February, local residents began to hear frequent rumblings coming from the volcano almost every minute. These were likely caused by the opening of a new vent (observed the next day) and associated rockfalls inside the crater. During a 1-2 March field expedition, the scientists observed the new eruptive vent (figure 58), located at the NE end of the lowest crater terrace, outside the active lava lake (which had been in place since 2002) and just at the base of the near-vertical crater walls. The vent sits on the E-trending fracture zone that connects the summit vent with the prominent flank cone Baruta to the NE of the main edifice, near the village of Kibumba. Photos in the report suggest that the new vent sits atop a small spatter cone. Fresh lava flows had pooled onto the crater floor around the cone.
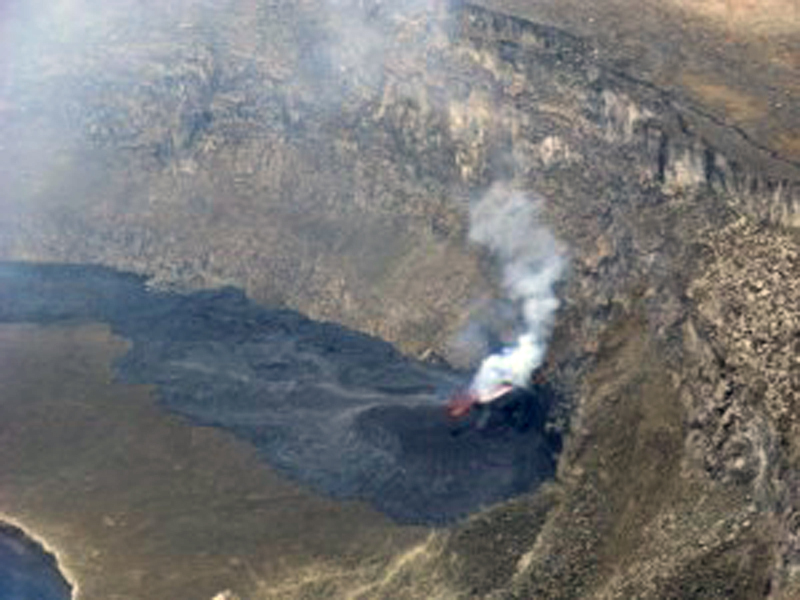 |
Figure 58. A new vent that had recently emerged on the E part of Nyiragongo's floor (terrace three) was first observed by OVG scientists on 1 March 2016. Photo courtesy of OVG. |
Observers during a 10-11 March field expedition noted that activity in the new vent consisted in pulsating lava fountains and Strombolian bursts which ejected material of a few tens of meters high. Lava flows from the new vent extended around the central pit on 11 March (figure 59). Activity in the lava lake was intense; lava fountains were active in the N and E parts of the lake. Both the lava lake and crater vent were producing gas emissions (figure 60).
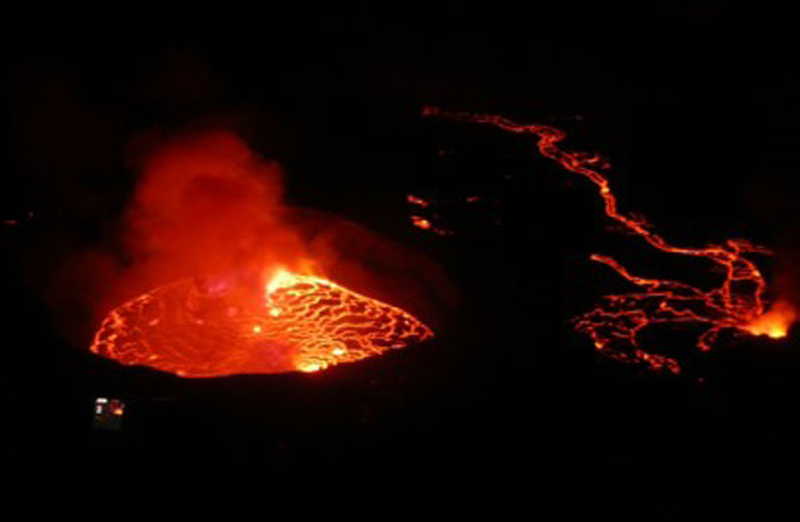 |
Figure 59. A view of the Nyiragongo summit crater on the night of 11-12 March 2016. The new vent on the E crater floor (right) produced lava flows that extended around the main lava lake. |
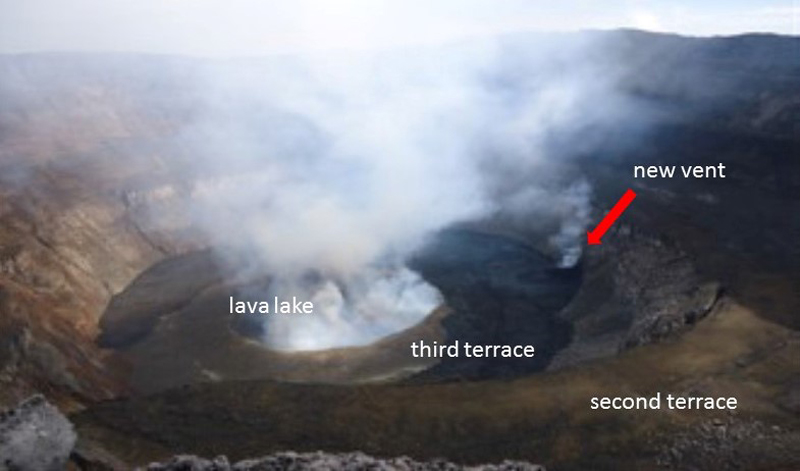 |
Figure 60. A daytime view of the Nyiragongo summit crater during 11-12 March 2016. Gas emissions from the new vent on the E crater floor (right) and from the lava lake were visible. The second and third terraces are visible in this wider view. |
On 26 March and 8 April 2016, the mainly effusive activity from the new vent continued with little change. Lava flows had surrounded the central pit (containing the main lava lake), covered most of the third terrace, and cascaded into the central vent at multiple locations.
A report from OVG on 12 April 2016 noted that activity had declined since 6 April 2016, and that the level of the lava lake had dropped. A report dated 17 April stated that some volcanic earthquakes had been located within 5 km E and 10-15 km N of the crater; continuous volcanic tremor was recorded during 0200-0400 on 17 April. In a photo dated 19 April the incandescent vent atop a spatter cone was visible. According to Volcano Discovery, local mountain guides reported that as of 30 May, no more lava flows were being produced from the vent, although bubbling lava was visible.
Ongoing activity through December 2016. Social media accounts and photos from a few tourist expeditions showed that the lava lake within the summit crater remained active during August-November 2016. Infrared data from MODIS instruments confirmed this persistent activity, with almost daily anomalies, through the end of December 2016.
Information from a weekly bulletin produced by the Goma Volcano Observatory, not available online, was reported by Radio Kivu. That report, for 27 December-2 January 2017, noted there was incandescence visible during 30-31 December, and that lava flows had overflowed the lake into the rest of the crater, accompanied by explosions and fountaining. A persistent gas plume can be seen during the day, which typically blows to the west.
Research on January 2002 eruption. In a recent article by Wauthier and others (2012), and summarized by Morton (2016), researchers reported finding evidence for linkage between the deadly January 2002 eruption (BGVN 26:12 and later) and a magnitude-6.2 earthquake eight months afterwards, centered 20 km S in the Lake Kivu region, partially destroying the town of Kalehe. Using satellite radar data (InSAR – Interferometric Synthetic Aperature Radar) to analyze ground deformation between the volcano and the lake before and after both the eruption and the earthquake, they inferred the formation of 20-km-long dike intrusion (figure 61, along the pink line between Nyiragongo and Lake Kivu).
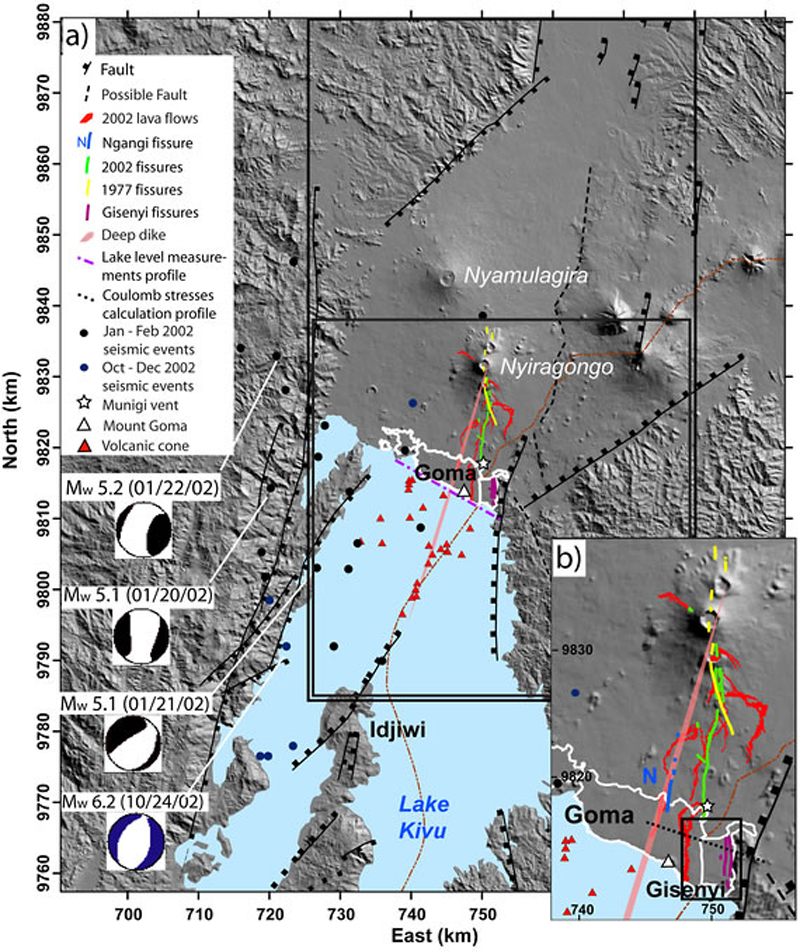 |
Figure 61. (a) Shaded relief topographic map of the Goma area and Lake Kivu. (b) Inset shows the region between Nyiragongo and Lake Kivu; the Goma and Gisenyi urban areas highlighted in white. From Wauthier and others (2012). |
References: Morton, M. C., 2016 (May/June), Double trouble: Volcanic eruption leads to strong earthquake eight months later, Earth, American Geosciences Institute, v.61, no. 5&6, p. 33 (www.earthmagazine.org).
Nelson, P., 2011 (28 February), Nyiragongo Crater: Journey to the Center of the World, boston.Com (URL: http://archive.boston.com/bigpicture/2011/02/nyiragongo_crater_journey_to_t.html). Photos by Olivier Grunewald.
Wauthier, C., Cayol, V., Kervyn, F., and d'Oreye, N., 2012 (May), Magma sources involved in the 2002 Nyiragongo eruption, as inferred from an InSAR analysis, Journal of Geophysical Research, Solid Earth, Geodesy and Gravity/Tectonophysics, v. 117, issue B5, 36 p.
Information Contacts: Observatoire Volcanologique de Goma (Goma Volcano Observatory), Goma, North Kivu, DR Congo; Hawai'i Institute of Geophysics and Planetology (HIGP), MODVOLC Thermal Alerts System, School of Ocean and Earth Science and Technology (SOEST), Univ. of Hawai'i, 2525 Correa Road, Honolulu, HI 96822, USA (URL: http://modis.higp.hawaii.edu/); MIROVA - Middle InfraRed Observation of Volcanic Activity, A near real time volcanic hot-spot detection system based on the analysis of MODIS ( Moderate Resolution Imaging Spectroradiometer) data, a collaborative project between the Universities of Turin and Florence (Italy) (URL: http://www.mirovaweb.it/); Tom Pfeiffer, Volcano Discovery (URL: https://www.volcanodiscovery.com/nyiragongo/news); NASA Earth Observatory, EOS Project Science Office, NASA Goddard Space Flight Center, Goddard, Maryland, USA (URL: http://earthobservatory.nasa.gov/); Radio Kivu, Goma, North Kivu, DR Congo (URL: http://www.radiokivu1.org/page/article.php?action=articleread&tokena=1432).
Lava lake persists through October 2017
The lava lake in Nyiragongo's main crater has been observed since 1971, and might have been present even before then. There is no regular ground monitoring of the volcano, but occasional field visits by scientific teams and tourist expeditions provide some information about its activity. Two teams of scientists that visited the volcano during March 2016 provided observations of a new vent (BGVN 42:01). This report describes activity during January-October 2017.
Volcano Discovery reported that on 6 June 2017 a team visited the summit (figure 62) and stayed for three days. They noted that the surface of the lava lake (about 220 m across was continuously in motion as exploding gas bubbles created small degassing fountains that recycled the cold black crust back into the incandescent liquid lava. Strong degassing also occurred from the edges of the lava lake, the 2016 hornito, and along the southern fracture zone.
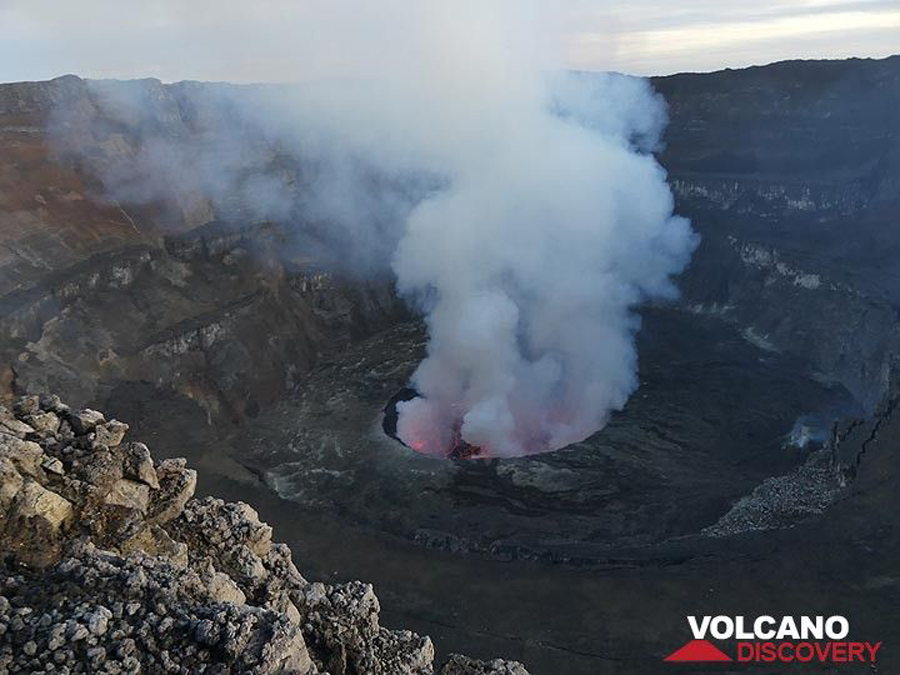 |
Figure 62. Photo of the summit caldera at Nyiragongo showing its terraces and lava lake in early June 2016. Courtesy of Ingrid Smet. |
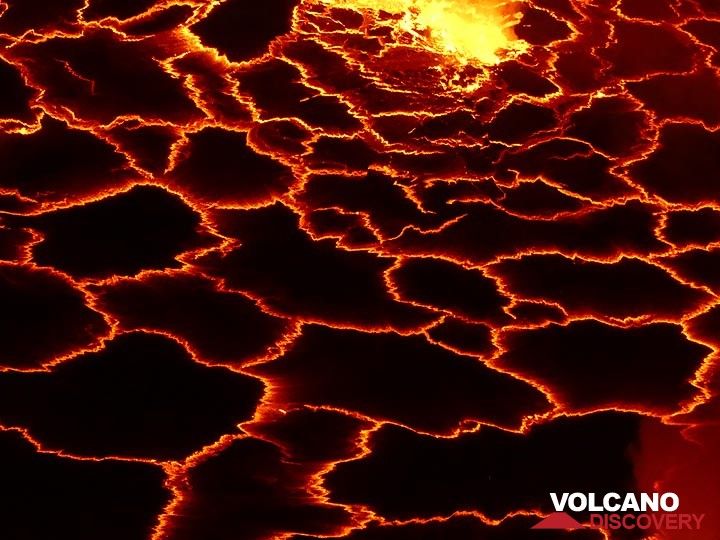 |
Figure 63. Photo of the lava lake surface at Nyiragongo, early June 2017. The thin black crust is continuously broken apart by heat and degassing from the underlying liquid lava, creating the fractured surface. Courtesy of Ingrid Smet. |
According to a news account (Metro) that cited a statement issued by the Goma Volcanic Observatory, Nyiragongo and nearby Nyamulagira volcanoes experienced intense seismic activity in their respective craters around 17-18 October 2017, before decreasing. Consistent with the presence of the active lava lake, thermal anomalies in satellite-based MODIS data identified by the MODVOLC and MIROVA systems were recorded almost daily during the reporting period.
Information Contacts: Tom Pfeiffer, Volcano Discovery (URL: http://www.volcanodiscovery.com/); Observatoire Volcanologique de Goma (OVG), Goma, North Kivu, DR Congo (URL: https://www.facebook.com/Observatoire-Volcanologique-de-Goma-OVG-180016145663568/); Hawai'i Institute of Geophysics and Planetology (HIGP) - MODVOLC Thermal Alerts System, School of Ocean and Earth Science and Technology (SOEST), Univ. of Hawai'i, 2525 Correa Road, Honolulu, HI 96822, USA (URL: http://modis.higp.hawaii.edu/); MIROVA (Middle InfraRed Observation of Volcanic Activity), a collaborative project between the Universities of Turin and Florence (Italy) supported by the Centre for Volcanic Risk of the Italian Civil Protection Department (URL: http://www.mirovaweb.it/); Metro, Mass Transit Media, Gallery Ravenstein 4, 1000 Brussels, Belgium (URL: https://fr.metrotime.be/).
Thermal anomalies show that lava lake remains active through May 2018
As has been the case since at least 1971, the active lava lake in the summit crater of Nyiragongo was present during a tourist visit in June 2017, and seismicity was recorded in the crater in October 2017 (BGVN 42:11). Thermal data from satellite-based instruments shows that an open lava lake remained through 23 May 2018. MIROVA analysis of MODIS satellite thermal data (figure 64) shows nearly daily strong thermal anomalies. Similarly, MODVOLC alerts for the same time period shows a consistently frequent number of anomalies (figure 65).
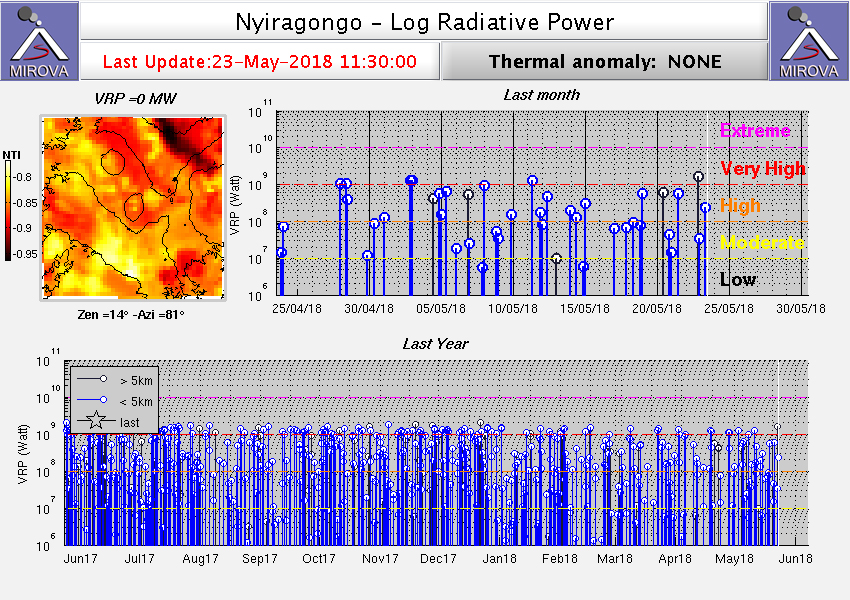 |
Figure 64. Thermal anomaly MIROVA plot of log radiative power at Nyiragongo for the year ending 23 May 2018. Courtesy of MIROVA. |
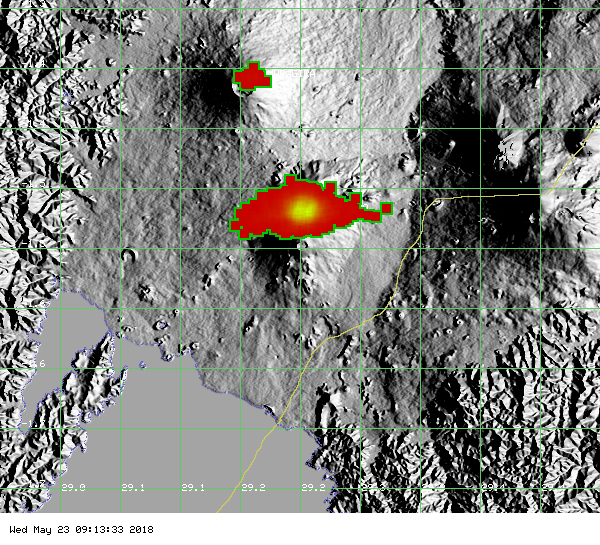 |
Figure 65. Map showing MODVOLC alert pixels at Nyiragongo, reflecting MODIS satellite thermal data, for the year ending 23 May 2018. Each pixel shows a thermal alert for a ground area of about 1.5 km2. Nyiragongo (many pixels) is in the center of the map, and Nyamuragira volcano (fewer pixels) is about 13 km to the NNW. Courtesy of HIGP - MODVOLC Thermal Alerts System. |
Information Contacts: Hawai'i Institute of Geophysics and Planetology (HIGP) - MODVOLC Thermal Alerts System, School of Ocean and Earth Science and Technology (SOEST), Univ. of Hawai'i, 2525 Correa Road, Honolulu, HI 96822, USA (URL: http://modis.higp.hawaii.edu/); MIROVA (Middle InfraRed Observation of Volcanic Activity), a collaborative project between the Universities of Turin and Florence (Italy) supported by the Centre for Volcanic Risk of the Italian Civil Protection Department (URL: http://www.mirovaweb.it/).
Lava lake remains active through May 2019; three new vents around the secondary cone
Since at least 1971 scientists and tourists have observed a lava lake within the Nyiragongo summit crater. Lava flows have been a hazard in the past for the nearby city of Goma (15 km S). The previous report (BGVN 43:06) of activity between November 2017 and May 2018 described nearly daily record of thermal anomalies due to the active lava lake and lava fountaining, gas-and-steam plumes, and the opening of a new vent within the crater in February 2016. Monthly reports from the Observatoire Volcanologique de Goma (OVG) disseminate information regarding the volcano's activity. This report updates the activity during June 2018-May 2019.
OVG noted that the level of the lava lake changes frequently, and was lower when observed on October 2018, 12 April 2019, and 12 May 2019. According to data from the OVG, on 15 April 2019 the secondary cone that formed in February 2016 produced lava flows and ejecta. In addition, at least three other vents formed surrounding this secondary cone. During most of April 2019 the lava lake was still active; however, beginning on 12 April 2019, seismic and lava lake activity both declined.
MIROVA (Middle InfraRed Observation of Volcanic Activity) analysis of MODIS satellite data continues to show almost daily, strong thermal anomalies every month from June 2018 through 24 May 2019 (figure 66). Similarly, the MODVOLC algorithm reports a majority of the hotspot pixels (2,406) occurring within the lava lake at the summit crater (figure 67).
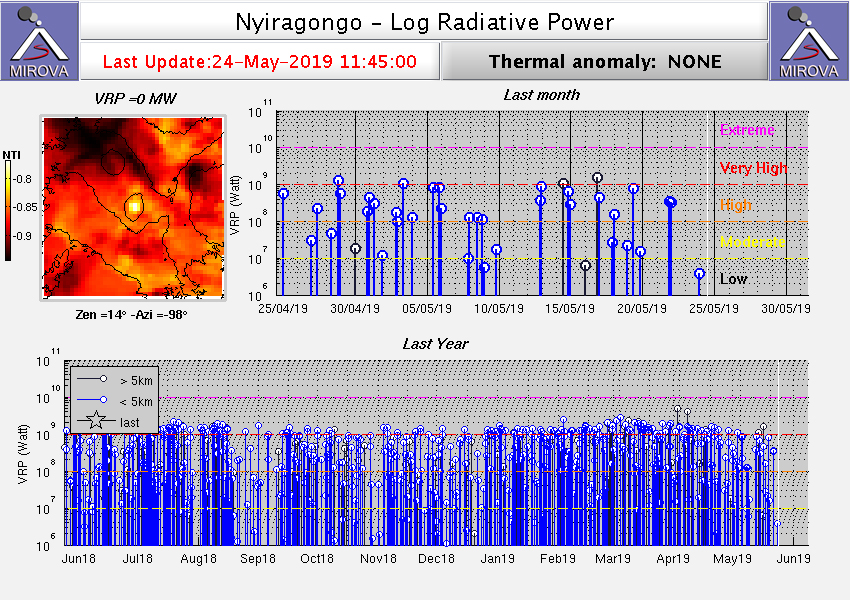 |
Figure 66. Thermal anomalies at Nyiragongo for June 2018 through 24 May 2019 as recorded by the MIROVA system (Log Radiative Power) were frequent and strong. Courtesy of MIROVA. |
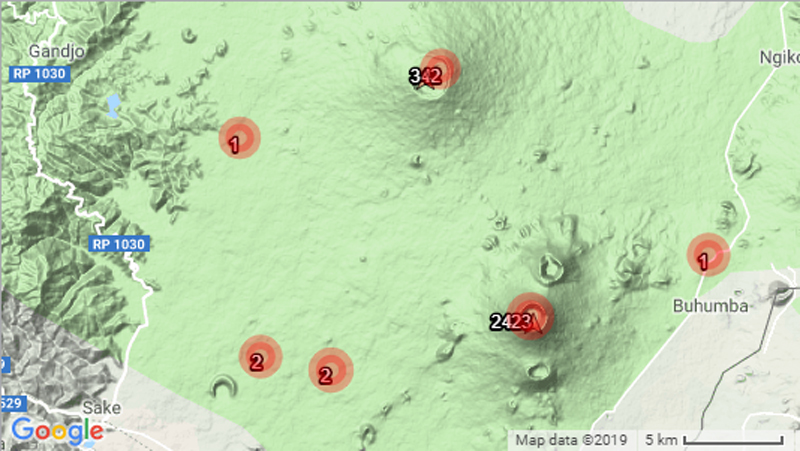 |
Figure 67. Map showing the number of MODVOLC hotspot pixels at Nyiragongo from 1 June 2018 to 31 May 2019. Nyiragongo (2,423 pixels) is at the bottom center; Nyamuragira volcano (342 pixels) is about 13 km NW. Courtesy of HIGP-MODVOLC Thermal Alerts System. |
Information Contacts: Observatoire Volcanologique de Goma (OVG), Goma, North Kivu, DR Congo (URL: https://www.facebook.com/Observatoire-Volcanologique-de-Goma-OVG-180016145663568/); Hawai'i Institute of Geophysics and Planetology (HIGP) - MODVOLC Thermal Alerts System, School of Ocean and Earth Science and Technology (SOEST), Univ. of Hawai'i, 2525 Correa Road, Honolulu, HI 96822, USA (URL: http://modis.higp.hawaii.edu/); MIROVA (Middle InfraRed Observation of Volcanic Activity), a collaborative project between the Universities of Turin and Florence (Italy) supported by the Centre for Volcanic Risk of the Italian Civil Protection Department (URL: http://www.mirovaweb.it/).
Lava lake persists during June-November 2019
Nyiragongo is a stratovolcano with a 1.2 km-wide summit crater containing an active lava lake that has been present since at least 1971. It is located the Virunga Volcanic Province (VVP) in the Democratic Republic of the Congo, part of the western branch of the East African Rift System. Typical volcanism includes strong and frequent thermal anomalies, primarily due to the lava lake, incandescence, gas-and-steam plumes, and seismicity. This report updates activity during June through November 2019 with the primary source information from monthly reports by the Observatoire Volcanologique de Goma (OVG) and satellite data.
In the July 2019 monthly report, OVG stated that the lava lake level had dropped during the month, with incandescence only visible at night (figure 68). In addition, the small eruptive cone within the crater, which has been active since 2014, decreased in activity during this timeframe. A MONUSCO (United Nations Stabilization Mission in the Democratic Republic of the Congo) helicopter overflight took photos of the lava lake and observed that the level had begun to rise on 27 July. Seismicity was relatively moderate throughout this reporting period; however, on 9-16 July and 21 August strong seismic swarms were recorded.
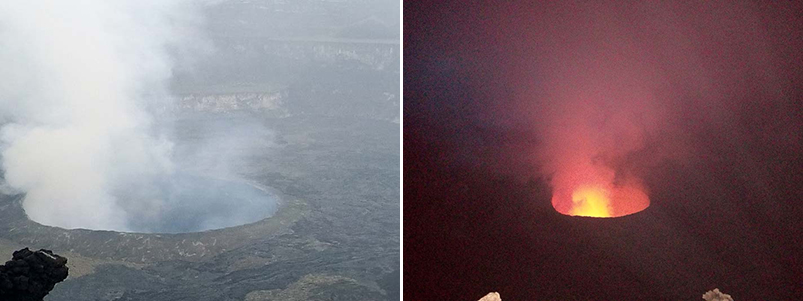 |
Figure 68. Webcam images of Nyiragongo on 20 July 2019 where incandescence is not visible during the day (left) but is observed at night (right). Incandescence is accompanied by gas-and-steam emissions. Courtesy of OVG. |
MIROVA (Middle InfraRed Observation of Volcanic Activity) analysis of MODIS satellite data continued to show frequent and strong thermal anomalies within 5 km of the crater summit through November 2019 (figure 69). Similarly, the MODVOLC algorithm reported almost daily thermal hotspots (more than 600) within the summit crater between June 2019 through November. These data are corroborated with Sentinel-2 thermal satellite imagery and a photo from OVG on 19 December 2019 showing the active lava lake (figures 70 and 71).
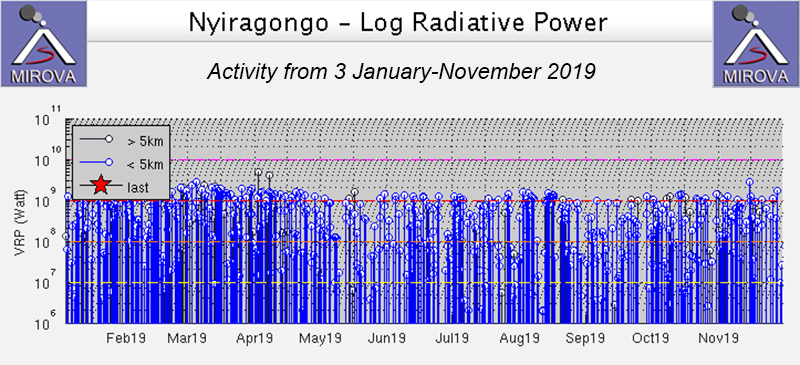 |
Figure 69. Thermal anomalies at Nyiragongo from 3 January through November 2019 as recorded by the MIROVA system (Log Radiative Power) were frequent and strong. Courtesy of MIROVA. |
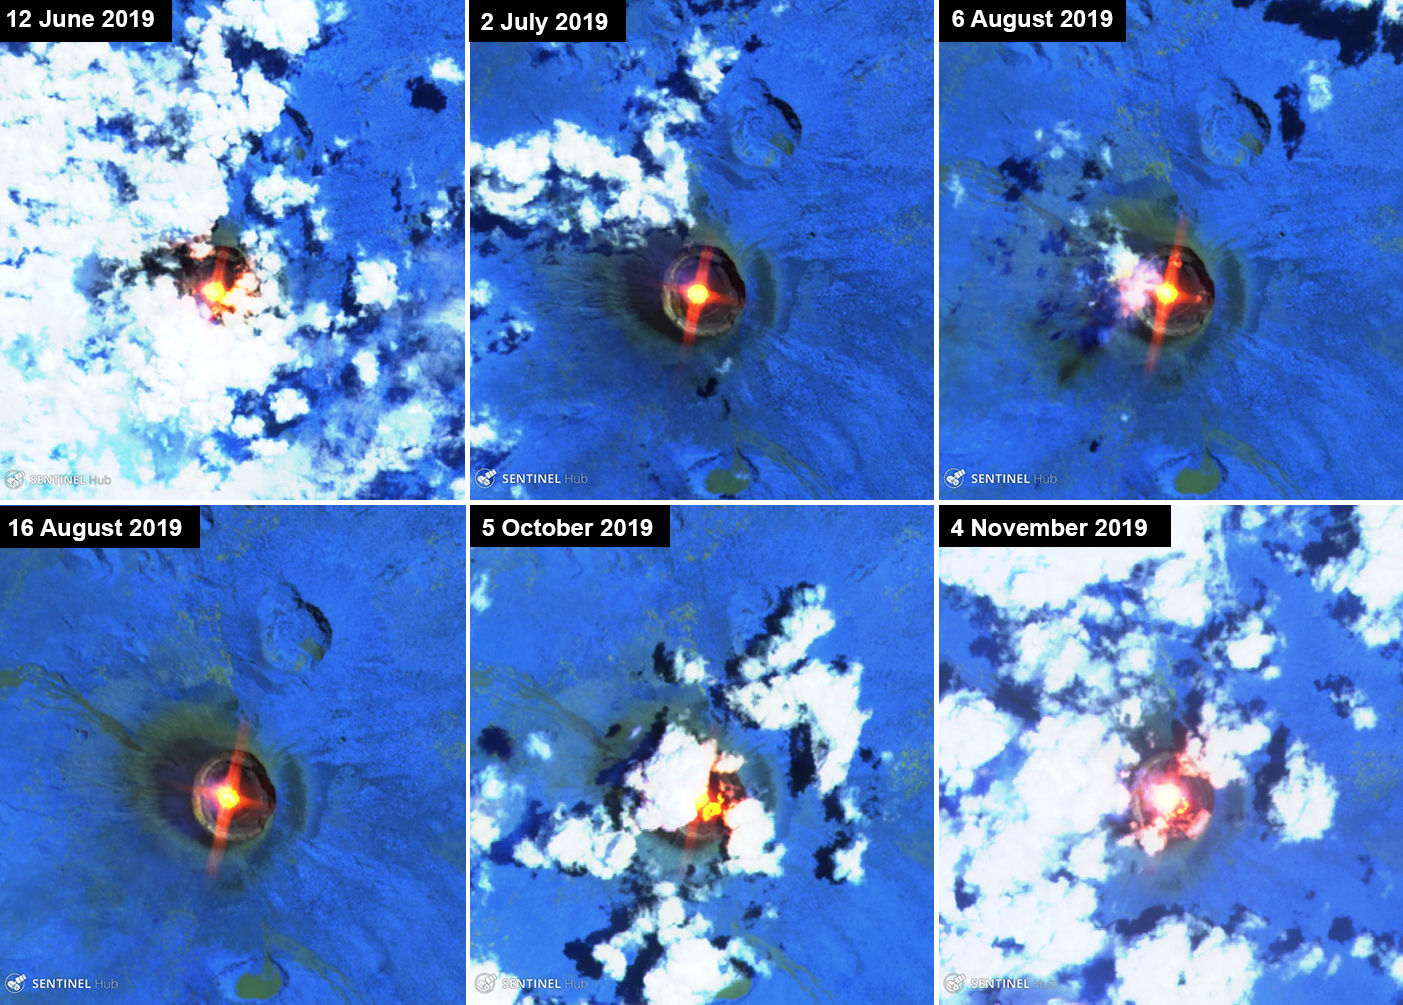 |
Figure 70. Sentinel-2 thermal satellite imagery (bands 12, 11, 8A) showed ongoing thermal activity (bright yellow-orange) at Nyiragongo during June through November 2019. Courtesy of Sentinel Hub Playground. |
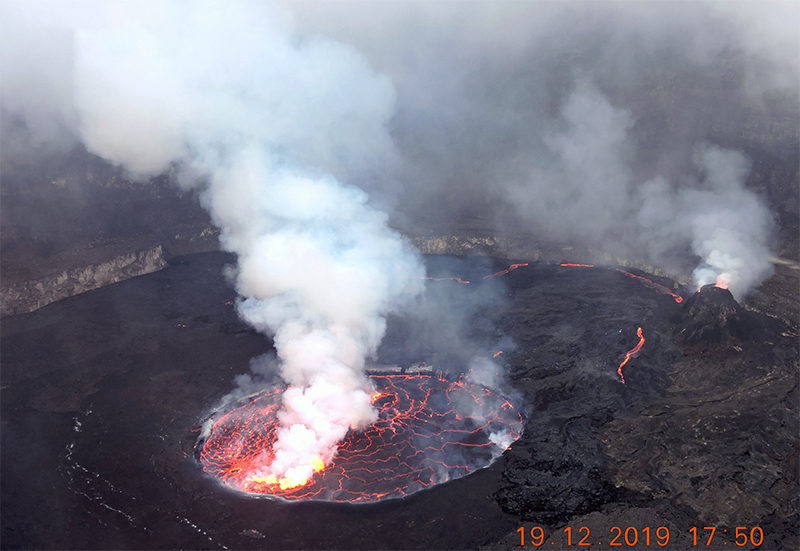 |
Figure 71. Photo of the active lava lake in the summit crater at Nyiragongo on 19 December 2019. Incandescence is accompanied by a gas-and-steam plume. Courtesy of OVG via Charles Balagizi. |
Information Contacts: Observatoire Volcanologique de Goma (OVG), Departement de Geophysique, Centre de Recherche en Sciences Naturelles, Lwiro, D.S. Bukavu, DR Congo; MIROVA (Middle InfraRed Observation of Volcanic Activity), a collaborative project between the Universities of Turin and Florence (Italy) supported by the Centre for Volcanic Risk of the Italian Civil Protection Department (URL: http://www.mirovaweb.it/); Hawai'i Institute of Geophysics and Planetology (HIGP) - MODVOLC Thermal Alerts System, School of Ocean and Earth Science and Technology (SOEST), Univ. of Hawai'i, 2525 Correa Road, Honolulu, HI 96822, USA (URL: http://modis.higp.hawaii.edu/); Sentinel Hub Playground (URL: https://www.sentinel-hub.com/explore/sentinel-playground); Charles Balagizi (Twitter: @CharlesBalagizi, https://twitter.com/CharlesBalagizi).
Activity in the lava lake and small eruptive cone persists during December 2019-May 2020
Nyiragongo is located in the Virunga Volcanic Province (VVP) in the Democratic Republic of the Congo, part of the western branch of the East African Rift System and contains a 1.2 km-wide summit crater with a lava lake that has been active since at least 1971. Volcanism has been characterized by strong and frequent thermal anomalies, incandescence, gas-and-steam emissions, and seismicity. This report summarizes activity during December 2019 through May 2020 using information from monthly reports by the Observatoire Volcanologique de Goma (OVG) and satellite data.
In the December 2019 monthly report, OVG stated that the level of the lava lake had increased. This level of the lava lake was maintained for the duration of the reporting period, according to later OVG monthly reports. Seismicity increased starting in November 2019 and was detected in the NE part of the crater, but it decreased by mid-April 2020. SO2 emissions increased in January 2020 to roughly 7,000 tons/day but decreased again near the end of the month. OVG reported that SO2 emissions rose again in February to roughly 8,500 tons/day before declining to about 6,000 tons/day. Unlike in the previous report (BGVN 44:12), incandescence was visible during the day in the active lava lake and activity at the small eruptive cone within the 1.2-km-wide summit crater has since increased, consisting of incandescence and some lava fountaining (figure 72). A field survey was conducted on 3-4 March where an OVG team observed active lava fountains and ejecta that produced Pele’s hair from the small eruptive cone (figure 73). During this survey, OVG reported that the level of the lava lake had reached the second terrace, which was formed on 17 January 2002 and represents remnants of the lava lake at different eruption stages. There, the open surface lava lake was observed; gas-and-steam emissions accompanied both the active lava lake and the small eruptive cone (figures 72 and 73).
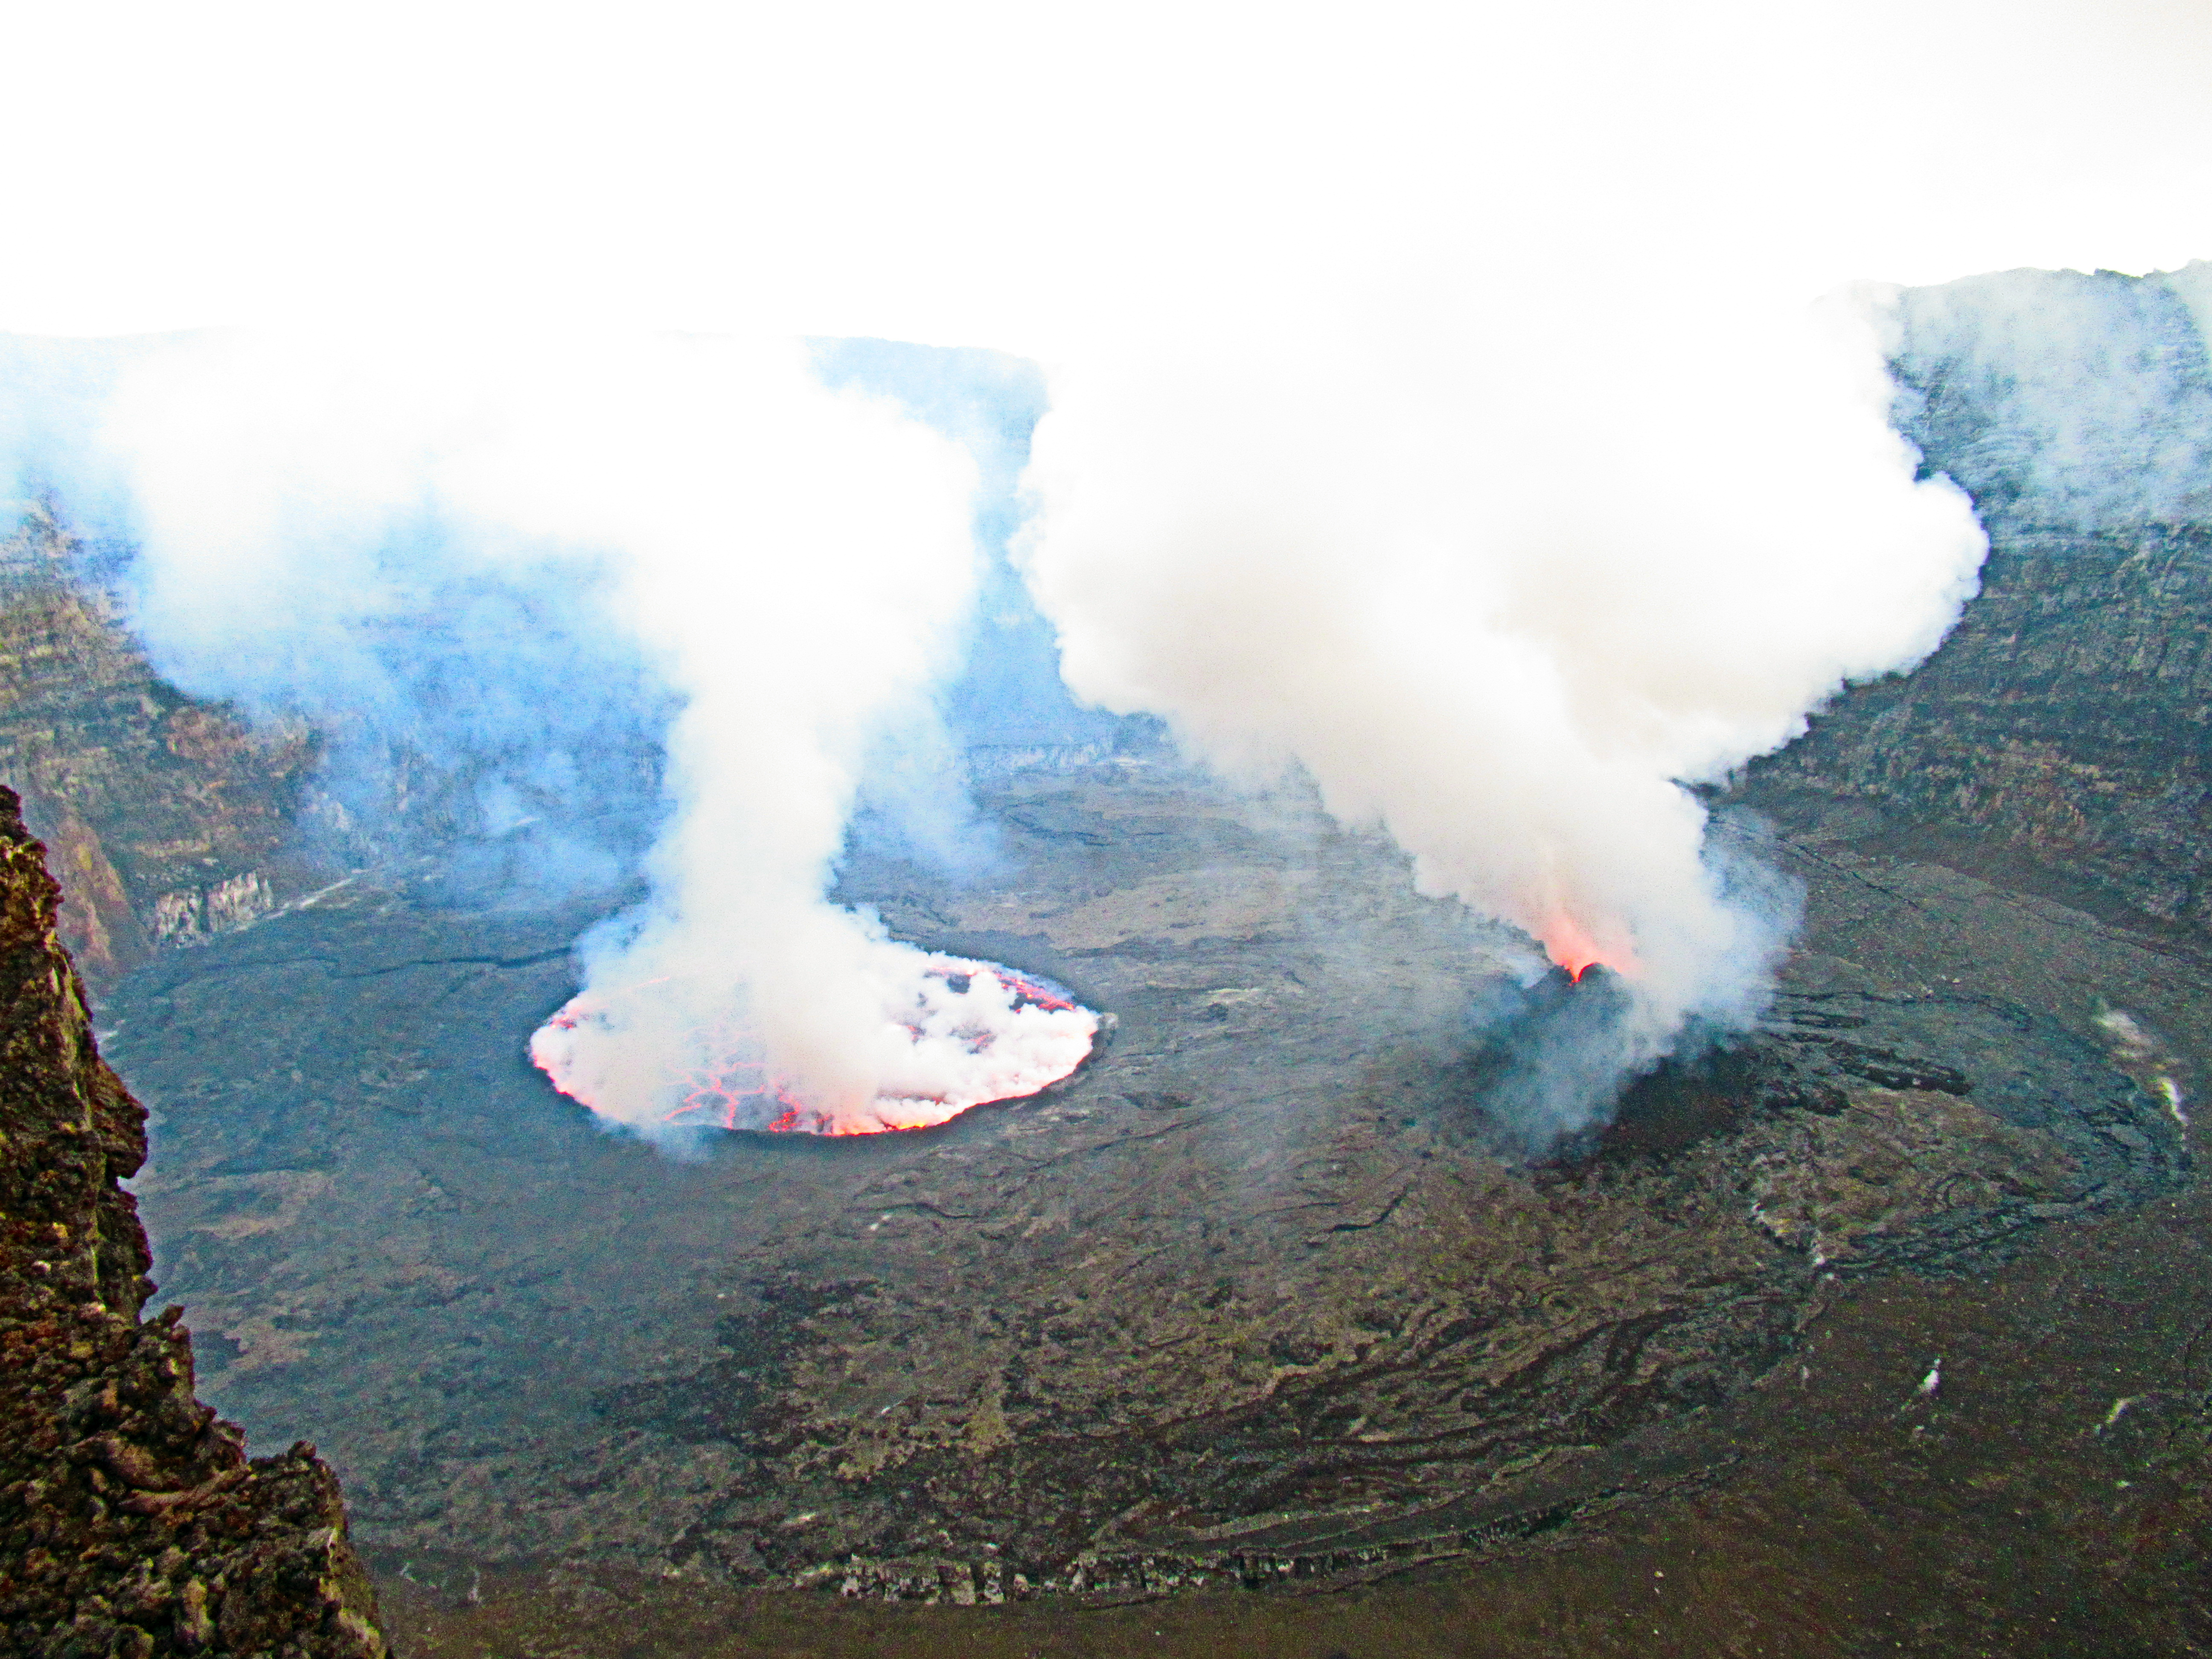 |
Figure 72. Webcam image of Nyiragongo in February 2020 showing an open lava lake surface and incandescence from the active crater cone within the 1.2 km-wide summit crater visible during the day, accompanied by white gas-and-steam emissions. Courtesy of OVG (Rapport OVG February 2020). |
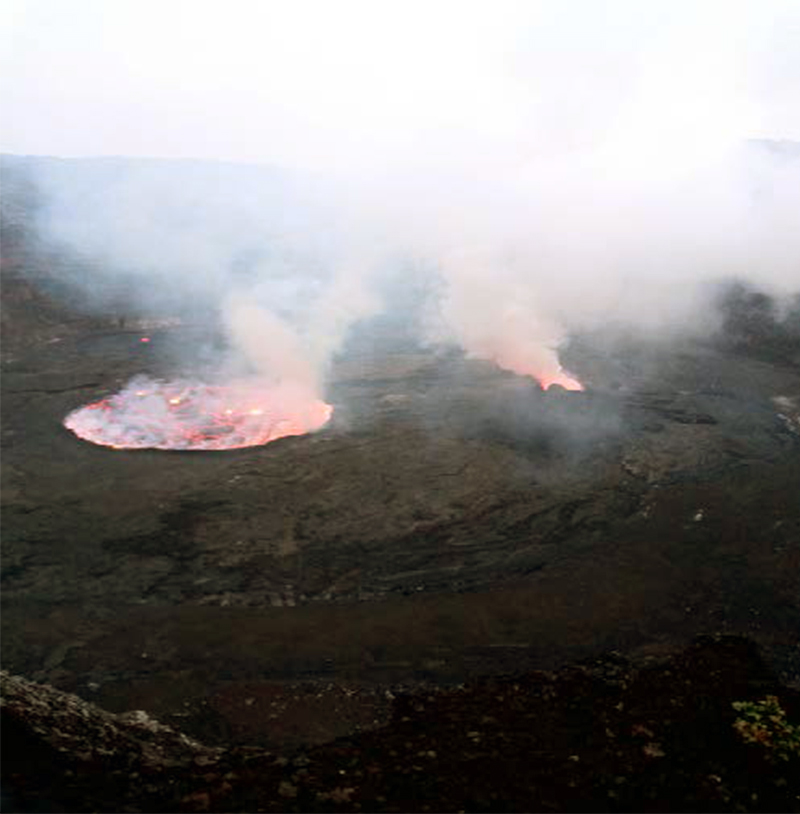 |
Figure 73. Webcam image of Nyiragongo on 4 March 2020 showing an open lava lake surface and incandescence from the active crater cone within the 1.2 km-wide summit crater visible during the day, accompanied by white gas-and-steam emissions. Courtesy of OVG (Rapport OVG Mars 2020). |
MIROVA (Middle InfraRed Observation of Volcanic Activity) analysis of MODIS satellite data continued to show frequent strong thermal anomalies within 5 km of the summit crater through May 2020 (figure 74). Similarly, the MODVOLC algorithm reported multiple thermal hotspots almost daily within the summit crater between December 2019 and May 2020. These thermal signatures were also observed in Sentinel-2 thermal satellite imagery within the summit crater (figure 75).
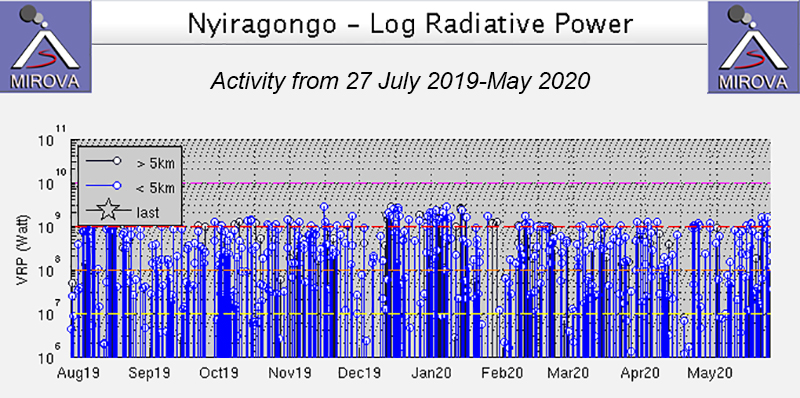 |
Figure 74. Thermal anomalies at Nyiragongo from 27 July through May 2020 as recorded by the MIROVA system (Log Radiative Power) were frequent and strong. Courtesy of MIROVA. |
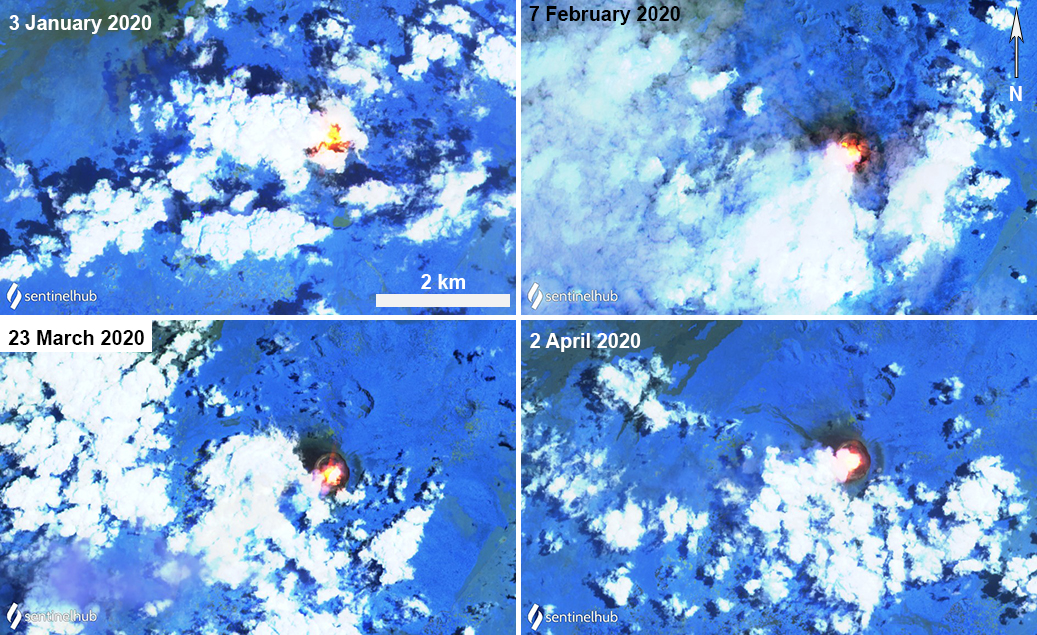 |
Figure 75. Sentinel-2 thermal satellite imagery (bands 12, 11, 8A) showed ongoing thermal activity (bright yellow-orange) in the summit crater at Nyiragongo during January through April 2020. Courtesy of Sentinel Hub Playground. |
Information Contacts: Observatoire Volcanologique de Goma (OVG), Departement de Geophysique, Centre de Recherche en Sciences Naturelles, Lwiro, D.S. Bukavu, DR Congo; MIROVA (Middle InfraRed Observation of Volcanic Activity), a collaborative project between the Universities of Turin and Florence (Italy) supported by the Centre for Volcanic Risk of the Italian Civil Protection Department (URL: http://www.mirovaweb.it/); Hawai'i Institute of Geophysics and Planetology (HIGP) - MODVOLC Thermal Alerts System, School of Ocean and Earth Science and Technology (SOEST), Univ. of Hawai'i, 2525 Correa Road, Honolulu, HI 96822, USA (URL: http://modis.higp.hawaii.edu/); Sentinel Hub Playground (URL: https://www.sentinel-hub.com/explore/sentinel-playground).
Strong thermal anomalies and gas emission from lava lake through November 2020
Nyiragongo is a stratovolcano in the DR Congo with a deep summit crater containing a lava lake and a small active cone. During June 2018-May 2020, the volcano exhibited strong thermal signals primarily due to the lava lake, along with incandescence, seismicity, and gas-and-steam plumes (BGVN 44:05, 44:12, 45:06). The volcano is monitored by the Observatoire Volcanologique de Goma (OVG). This report summarizes activity during June-November 2020, based on satellite data.
Infrared MODIS satellite data showed almost daily strong thermal activity during June-November 2020 from MIROVA (Middle InfraRed Observation of Volcanic Activity), consistent with a large lava lake. Numerous hotspots were also identified every month by MODVOLC. Although clouds frequently obscured the view from space, a clear Sentinel-2 image in early June showed a gas-and-steam plume as well as a strong thermal anomaly (figure 76).
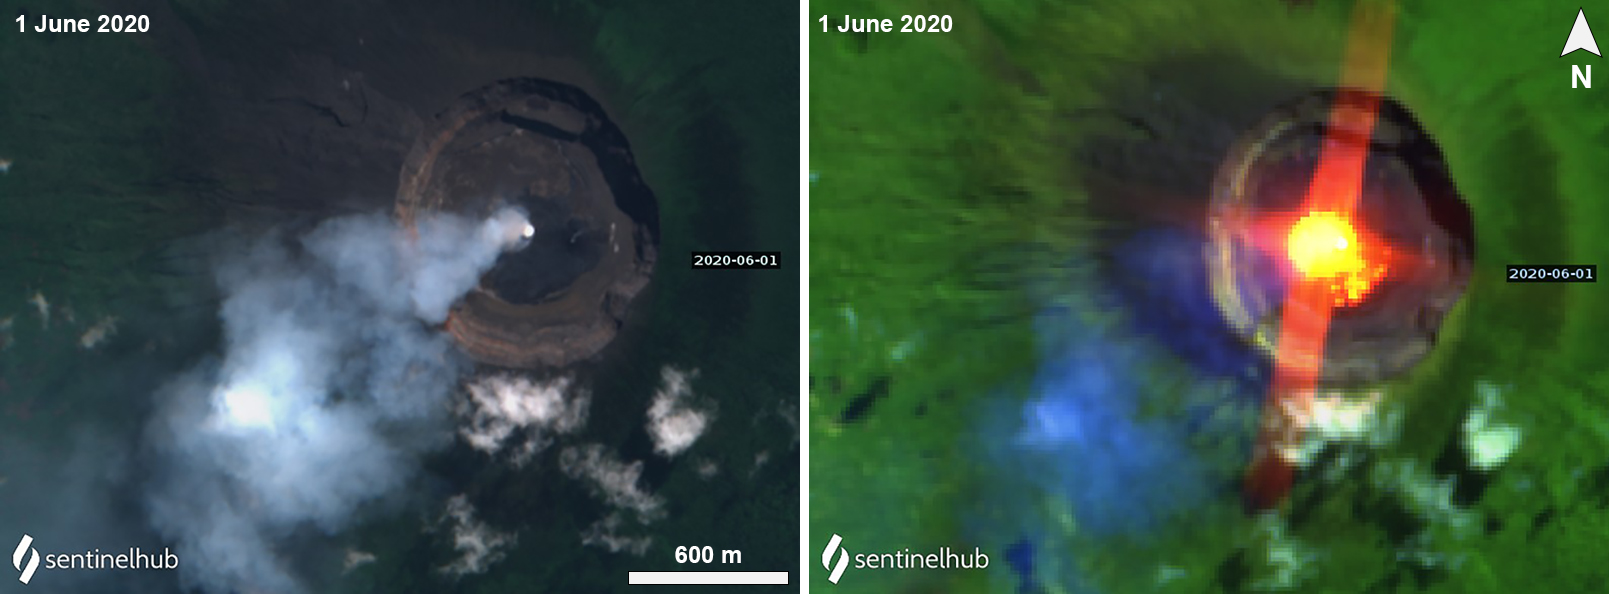 |
Figure 76. Sentinel-2 satellite imagery of Nyiragongo on 1 June 2020. A gas-and-steam is visible in the natural color image (bands 4, 3, 2) rising from a pit in the center of the crater (left), while the false color image (bands 12, 11, 4) reveals a strong thermal signal from a lava lake (right). Courtesy of Sentinel Hub Playground. |
During the first half of June 2020, OVG reported that SO2 levels had decreased compared to levels in May (7,000 tons/day); during the second half of June the SO2 flux began to increase again. High levels of sulfur dioxide were recorded almost every day in the region above or near the volcano by the TROPOspheric Monitoring Instrument (TROPOMI) aboard the Copernicus Sentinel-5 Precursor satellite (figure 77). According to OVG, SO2 flux ranged from 819-5,819 tons/day during June. The number of days with a high SO2 flux decreased somewhat in July and August, with high levels recorded during about half of the days. The volume of SO2 emissions slightly increased in early July, based on data from the DOAS station in Rusayo, measuring 6,787 tons/day on 8 July (the highest value reported during this reporting period), and then declined to 509 tons/day by 20 July. The SO2 flux continued to gradually decline, with high values of 5,153 tons/day in August and 4,468 tons/day in September. The number of days with high SO2 decreased further in September and October but returned to about half of the days in November.
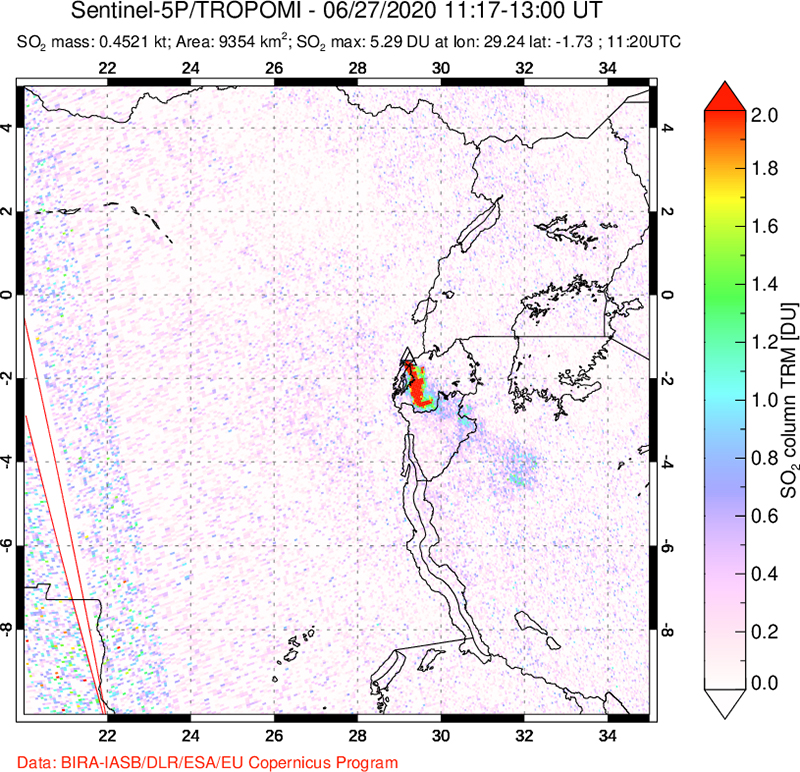 |
Figure 77. TROPOMI image of SO2 plume on 27 June 2020 in the Nyiragongo-Nyamulagira area. The plume drifted SSE. Courtesy of NASA Global Sulfur Dioxide Monitoring Page. |
During 12-13 July a multidisciplinary team of OVG scientists visited the volcano to take measurements of the crater using a TCRM1102 Plus2 laser. They noted that the crater had expanded by 47.3 mm in the SW area, due to the rise in the lava lake level since early 2020. The OVG team took photos of the small cone in the lava lake that has been active since 2014, recently characterized by white gas-and-steam emissions (figure 78). OVG noted that the active lava lake had subsided roughly 20 m (figure78).
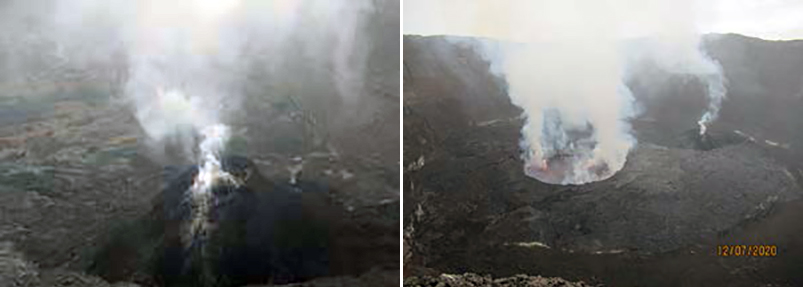 |
Figure 78. Photos (color corrected) of the crater at Nyiragongo showing the small active cone generating gas-and-steam emissions (left) and the active lava lake also characterized by white gas-and-steam emissions on 12 July 2020 (right). Courtesy of OVG (Rapport OVG Juillet 2020). |
Information Contacts: Observatoire Volcanologique de Goma (OVG), Departement de Geophysique, Centre de Recherche en Sciences Naturelles, Lwiro, D.S. Bukavu, DR Congo; MIROVA (Middle InfraRed Observation of Volcanic Activity), a collaborative project between the Universities of Turin and Florence (Italy) supported by the Centre for Volcanic Risk of the Italian Civil Protection Department (URL: http://www.mirovaweb.it/); Hawai'i Institute of Geophysics and Planetology (HIGP) - MODVOLC Thermal Alerts System, School of Ocean and Earth Science and Technology (SOEST), Univ. of Hawai'i, 2525 Correa Road, Honolulu, HI 96822, USA (URL: http://modis.higp.hawaii.edu/); Sentinel Hub Playground (URL: https://www.sentinel-hub.com/explore/sentinel-playground); NASA Global Sulfur Dioxide Monitoring Page, Atmospheric Chemistry and Dynamics Laboratory, NASA Goddard Space Flight Center (NASA/GSFC), 8800 Greenbelt Road, Goddard, Maryland, USA (URL: https://so2.gsfc.nasa.gov/).
Intense seismicity, lava flows into Goma, strong incandescence, and ash plumes during late May 2021
Nyiragongo, in the Democratic Republic of the Congo, is part of the Virunga Volcanic Province (VVP) along the western branch of the East African Rift System. It contains a 1.2 km-wide summit crater with a lava lake that has been active since at least 1971. Lava flows have been a hazard in the past for the nearby city of Goma (15 km S); the most recent documented lava flows occurred in April 2019 from a secondary cone that had formed in February 2016, accompanied by ejecta (BGVN 44:05). These flows, along with those that were reported during February and March 2016 (BGVN 42:01), were confined to the crater lake. Significant lava flows on the S flank during the 2002 eruption reached the city of Goma and Lake Kivu, destroying several thousands of buildings and homes, damaging agriculture, and displacing more than 250,000 people (BGVN 26:12 and 27:04). Volcanism has more recently and typically consisted of lava lake activity (evidenced by strong thermal anomalies), incandescence, and gas-and-steam emissions (BGVN 45:12). This report covers December 2020 through May 2021 and describes a notable flank fissure eruption characterized by new intense seismicity, lava lake drainage, lava flows reaching Goma, and ash plumes that increased in late May 2021. As a result, more than 400,000 people were evacuated, about 3,600 homes and buildings were destroyed, and at least 32 people died. The volcano is monitored by the Observatoire Volcanologique de Goma (OVG).
Strong thermal activity was consistent at the lava lake during December 2020 through May 2021, according to satellite data. MIROVA (Middle InfraRed Observation of Volcanic Activity) analysis of MODIS satellite data showed frequent and strong thermal anomalies into late May 2021 before significantly decreasing (figure 79). These strong summit anomalies were also observed in Sentinel-2 infrared satellite imagery during each month of the reporting period, though cloud cover was frequent (figure 80).
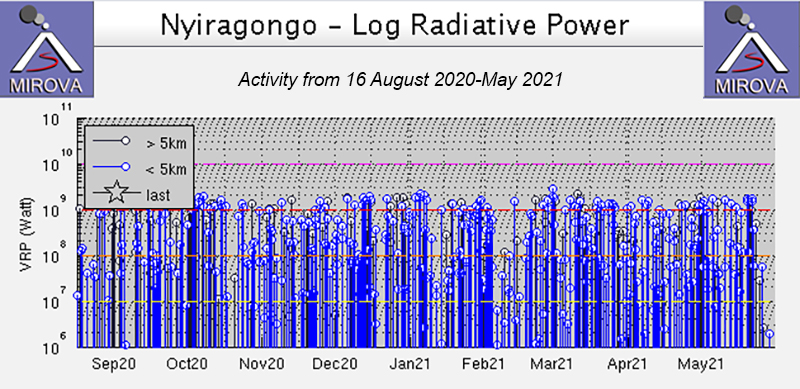 |
Figure 79. Thermal anomalies at Nyiragongo from 16 August 2020 through May 2021 as recorded by the MIROVA system (Log Radiative Power) were frequent and strong. A sharp decrease in thermal activity was noted at the end of May. Courtesy of MIROVA. |
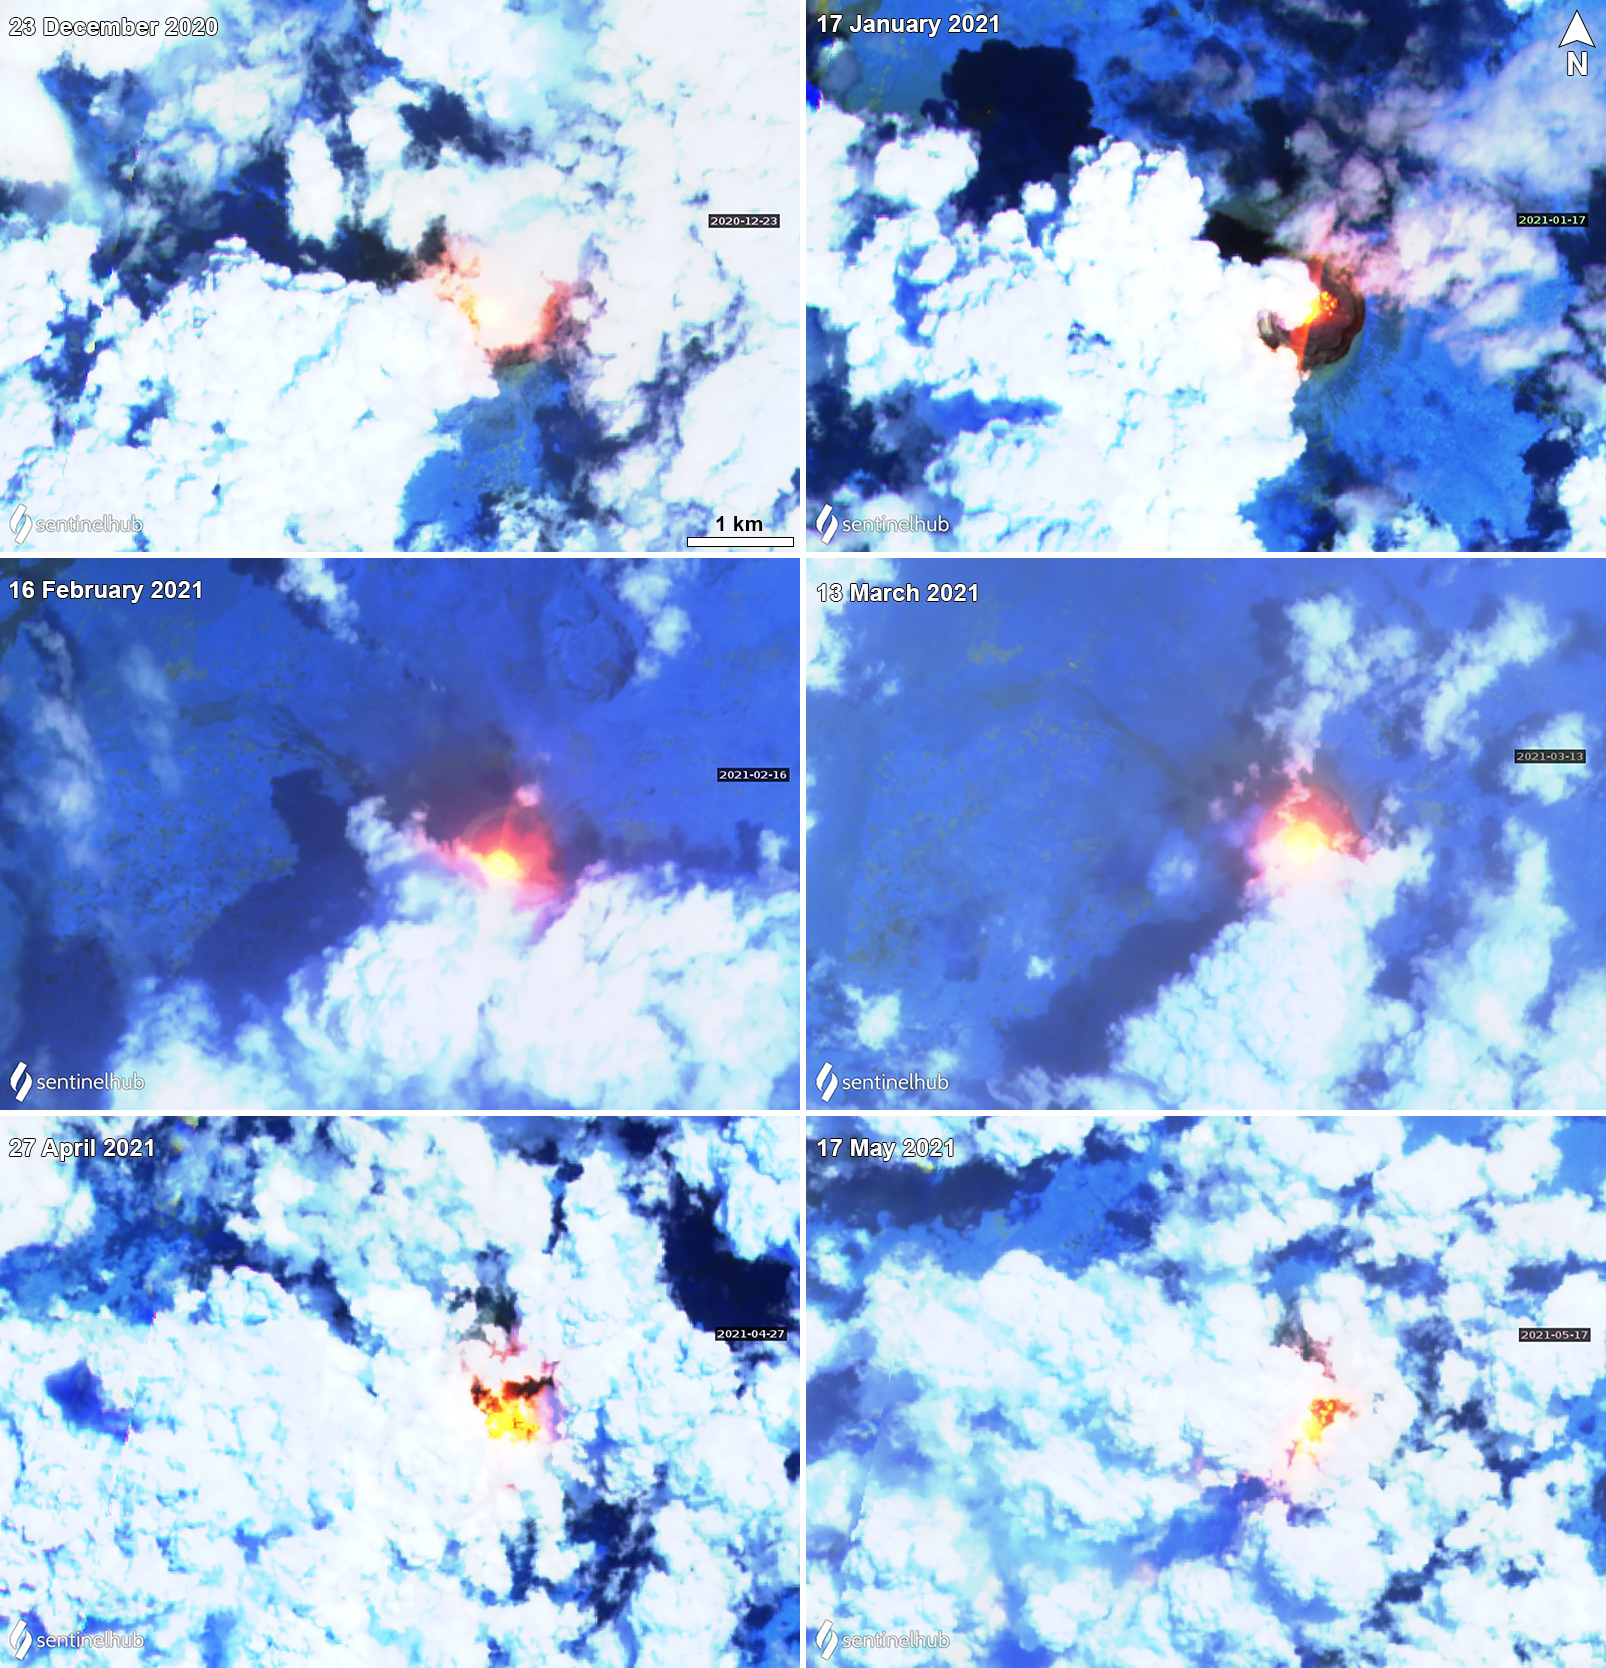 |
Figure 80. Sentinel-2 infrared satellite imagery showed strong thermal anomalies (bright yellow-orange) in the summit crater of Nyiragongo each month during December 2020 through May 2021. Images using “Atmospheric penetration” rendering (bands 12, 11, 8a). Courtesy of Sentinel Hub Playground. |
On the evening of 22 May the active lava lake drained, and around the same time observers reported that at least two fissures had opened on the lower S flanks NW of Kibati (8 km SSE of the summit) and Rukoko (10 km S) (figure 81). Seismicity and infrasound data showed the change in activity with strong increases starting at 1815 that night (figure 82). Lava from the first fissure originated near the Shaheru crater, flowed over a major road (N2), and then moved S. The second fissure produced lava flows that also traveled S, setting fire to many houses and structures in communities N of Goma, just W of Monigi (12 km S). Video posted on social media showed lava fountaining from the fissure and an incandescent red sky (figure 83). During 22-23 May the lava flow may have been as wide as 1 km and stopped 1.25 km from the Goma International Airport in the NE part of the city (figures 83, 84, and 85).
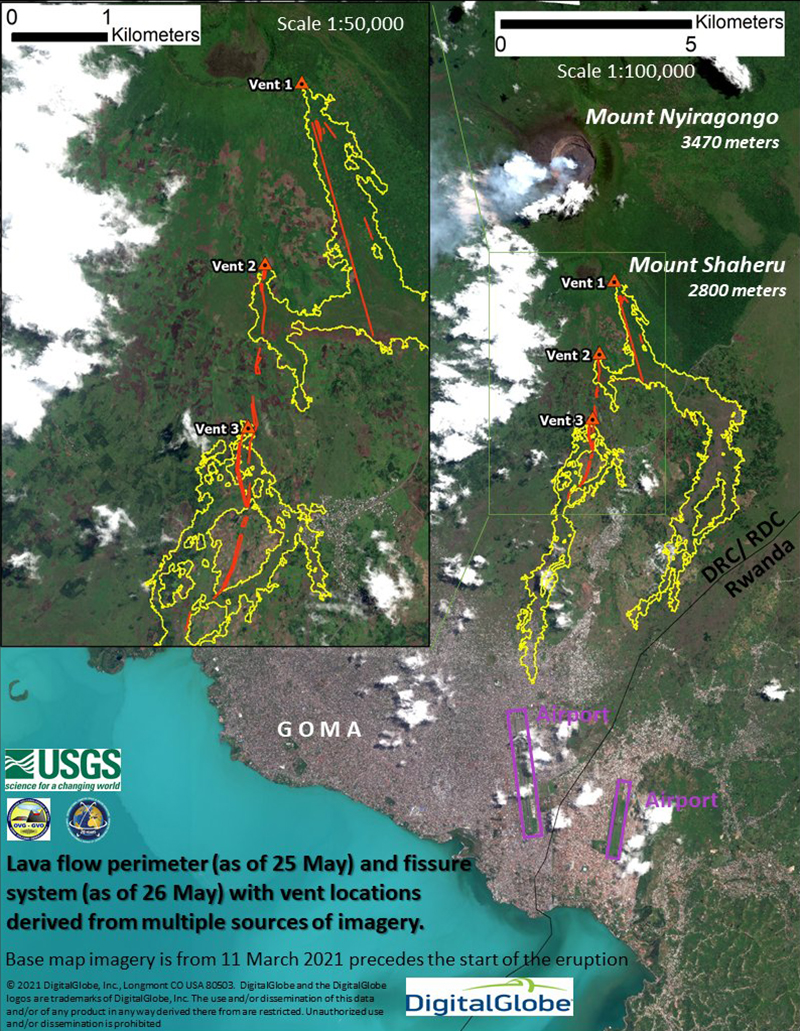 |
Figure 81. Map showing the lava flows (yellow) from the opened fissures (red) at Nyiragongo during 22-26 May 2021. The lava flows had traveled generally S and SE. The two nearby airports are boxed in purple. The base map was last updated on 11 March 2021. Courtesy of VDAP USGS. |
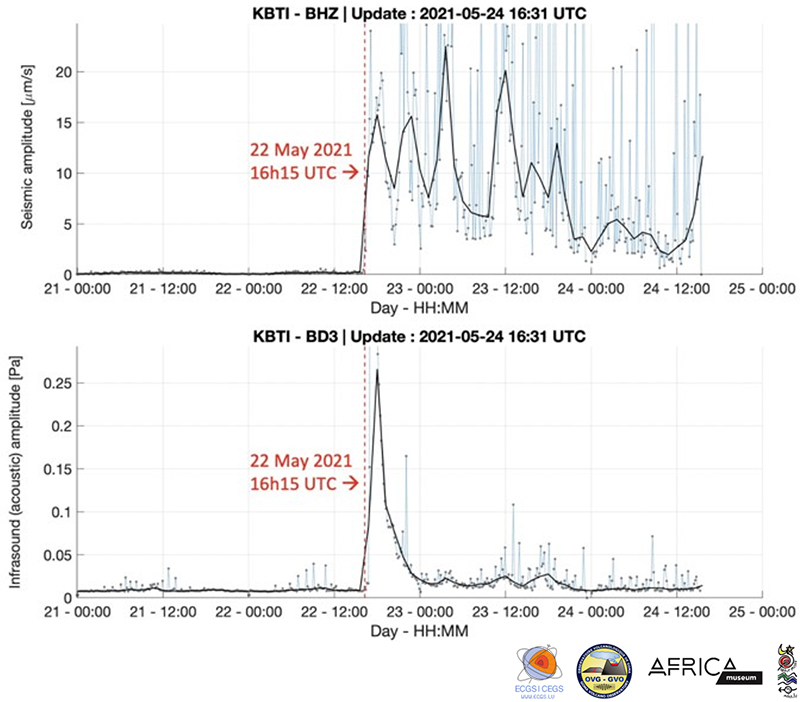 |
Figure 82. Seismic and infrasound amplitude measurements at Nyiragongo recorded during 21-24 May 2021 at the Kibati station (6 km E). A significant spike in seismic and infrasound amplitude occurred on 22 May 2021 at 1815 local time, indicating the start of new activity. Courtesy of GeoRiskA. |
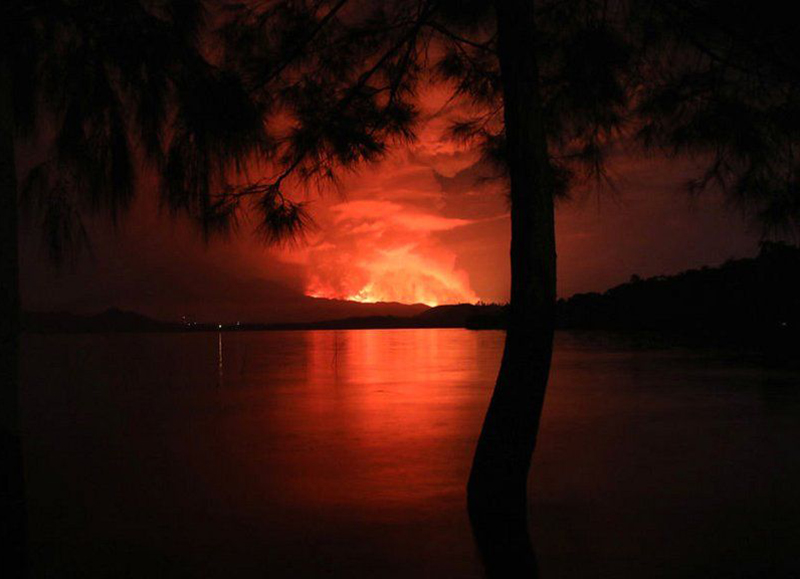 |
Figure 83. Photo of strong incandescence and an accompanying ash plume above Nyiragongo as seen from Tchegera Island on Lake Kivu outside Goma. Photo was published on 23 May 2021. Courtesy of AFP via BBC News. |
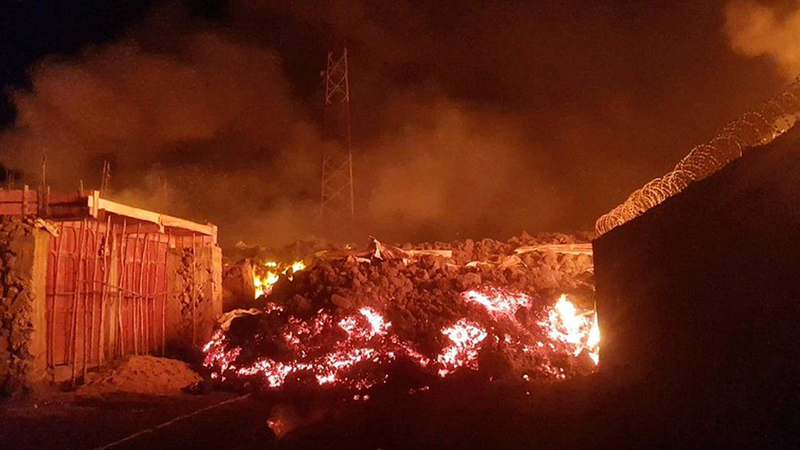 |
Figure 84. Photo showing the active lava flow from Nyiragongo destroying infrastructure as it traveled toward nearby villages on 22 May 2021. Courtesy of Enoch David, Reuters via BBC News. |
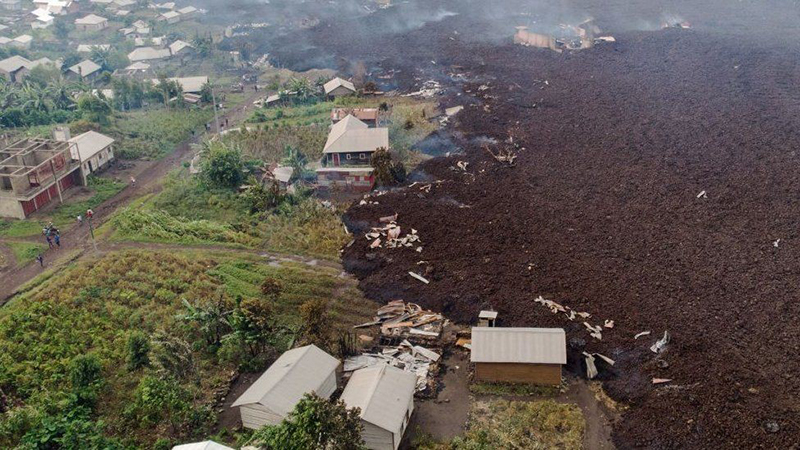 |
Figure 85. Aerial photo from 23 May 2021 showing a lava flow from Nyiragongo that traveled to the edge of Goma and destroyed nearby villages. Courtesy of AFP via BBC News. |
According to the Toulouse VAAC, ash plumes rose to 6.1-9.1 km during 22-23 May. Satellite images and local scientists indicated that the summit lava lake had drained before the flank fissures had opened but began refilling afterward; collapses in the summit crater were the likely cause of the ash plumes. MONUSCO (United Nations Stabilization Mission in the Democratic Republic of the Congo) carried out eight helicopter and two drone overflights during 22-25 May and captured an ash plume that rose to 6.1 km altitude above the volcano and drifted S; ground-based observers reported ash in the atmosphere above Goma (figure 86). Satellite data and analysis indicated that the lava flows around the crater during 22-23 May were the result of a N-S trending dike that had intruded beneath the volcano and Goma that likely extended below Lake Kivu. Seismic data during 22-24 May also showed events that propagated from the summit area to the S under Lake Kivu. Several strong earthquakes shook buildings in Goma, causing some to collapse and result in injuries. A news article reported that tremor was felt about every 30 minutes beginning around 1200 on 23 May.
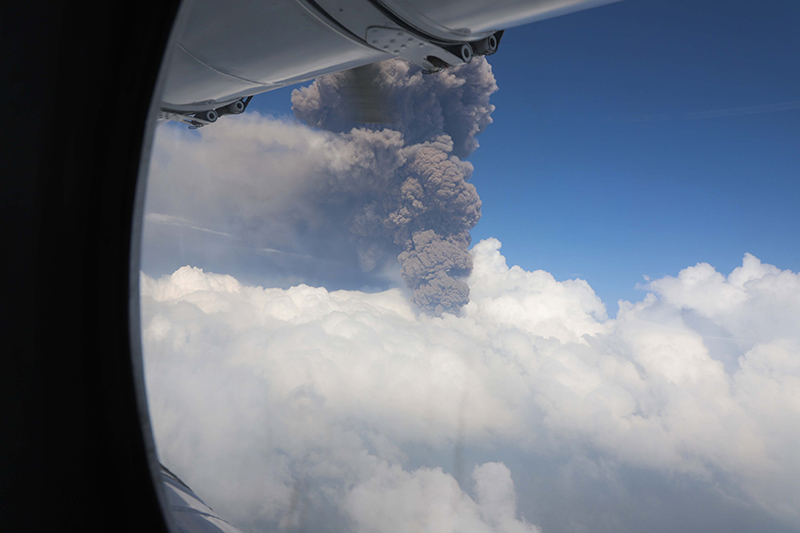 |
Figure 86. Photo of a strong ash plume rising above Nyiragongo taken from a helicopter overflight by MONUSCO. Photo was posted on 25 May 2021. Courtesy of MONUSCO. |
Two notable sulfur dioxide plumes that exceeded 2 Dobson Units (DUs) were detected by the TROPOMI instrument on the Sentinel-5P satellite on 23 and 24 May that drifted W (figure 87). On 24 May at 1037 an Mw 5.1 earthquake was detected beneath Lake Kivu. The VAAC noted that ashfall around the volcano and in surrounding towns was visible in satellite data, though it was difficult to detect due to clouds. According to a news article published on 24 May, the lava lake had refilled since the beginning of significant activity.
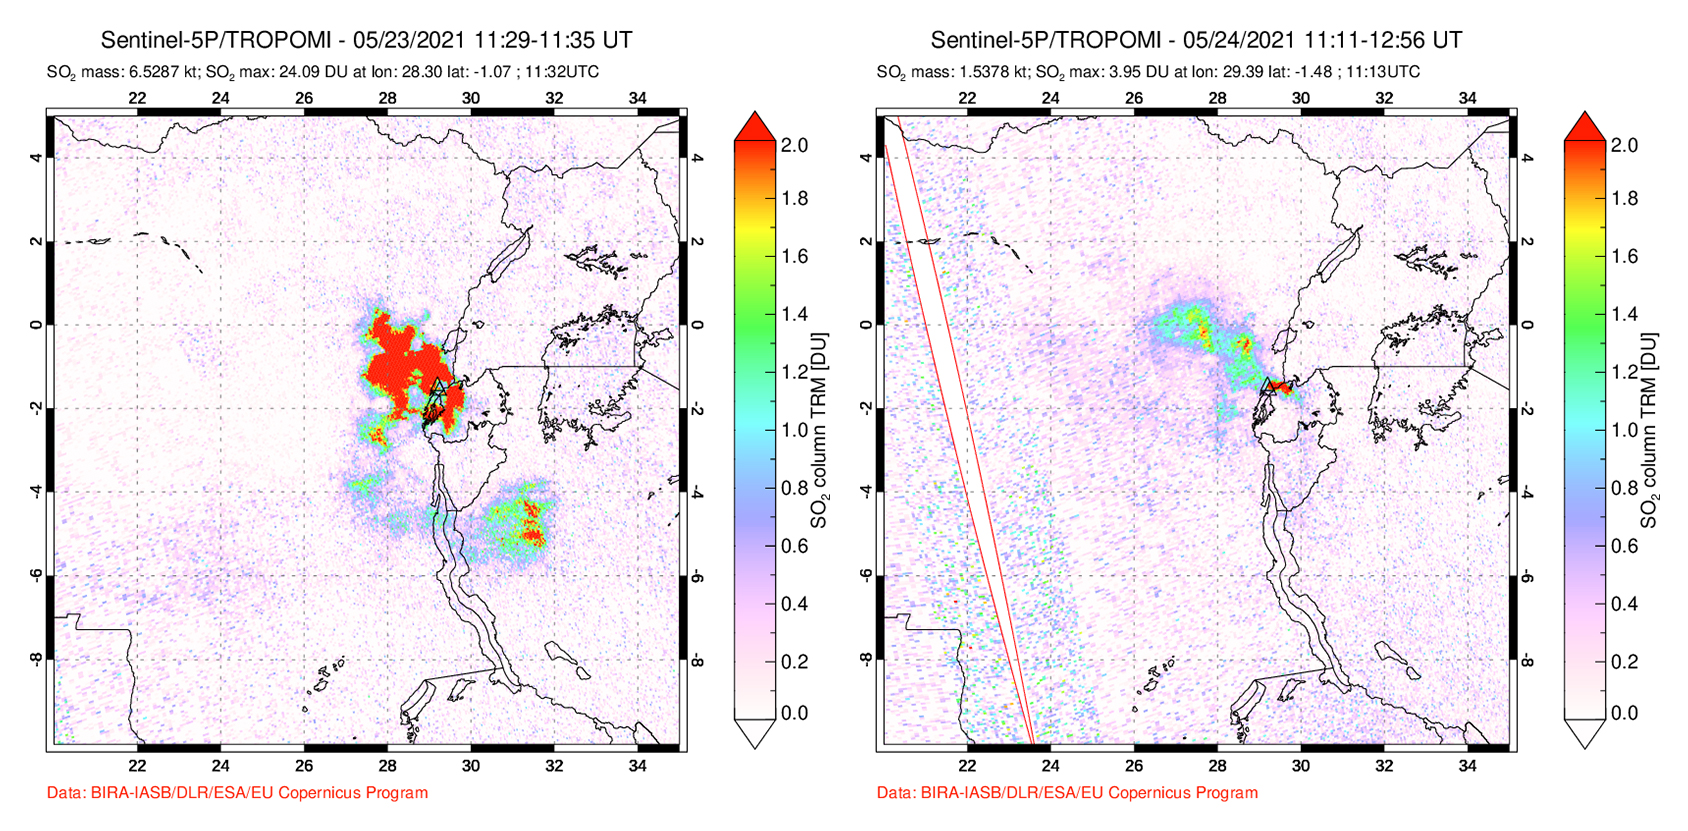 |
Figure 87. Two strong and distinct SO2 plumes from the Nyiragongo-Nyamulagira area were detected by the TROPOMI instrument on the Sentinel-5P satellite during 23 (left) and 24 (right) May 2021 on the days with strong explosive activity and ash plumes. The plumes drifted W. Courtesy of NASA Global Sulfur Dioxide Monitoring Page. |
Cracks a few tens of centimeters wide opened in different parts of the city on 25 May. The cracks measured several hundreds of meters long from the N city limit toward the lake and were nearly 100 m long near the airport. Some of these cracks were hot and emitted gas and others were flaming. Seismicity remained elevated on 25 May with more than 130 earthquakes between Mw 2 and 5 recorded in a 24-hour period, as well as a large number of smaller earthquakes. News reports indicated hundreds of damaged buildings in neighboring Rwanda (84 km SE). On 26 May 140 earthquakes were recorded with magnitudes ranging from 2.1-4.8 that had migrated S. A comparison of satellite radar images acquired on 23, 24, 25, and 26 May showed that the summit crater continued to widen after the partial drainage of the lava lake.
Intense seismicity continued to be reported even after lava effusion had stopped, which indicated that the dike continued to be active, according to GeoRiskA. Ground cracking in the city and damage to buildings from earthquakes continued to be reported. On 27 May authorities issued an evacuation of at least 400,000 residents in higher risk areas (about 10 districts) according to news organizations. Another strong ash plume drifting SW was visible that day in a Sentinel-2 satellite image (figure 88). During 28-29 May GeoRiskA reported that seismicity began to decrease and continued to decline through 1 June; both the seismic data and GPS data indicated that the dike was no longer propagating. Residents were able to start returning to their homes within a few days, according to a news article. The eruption had destroyed 3,629 homes, 12 schools, and 3 health facilities. More than 20,000 people were displaced, and at least 32 people had died.
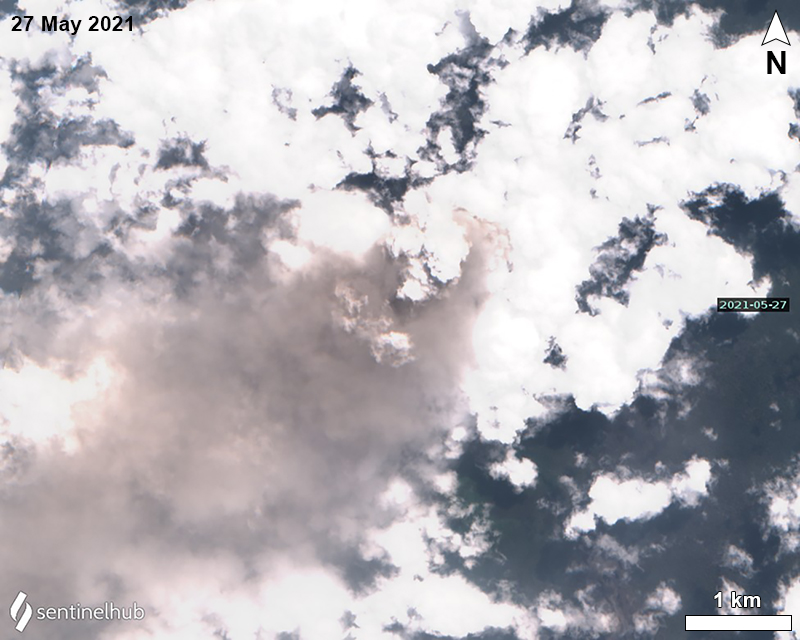 |
Figure 88. Sentinel-2 satellite image showed a strong ash plume (gray) rising from Nyiragongo on 27 May 2021 and drifted SW. Image using “Natural color” rendering (bands 4, 3, 2). Courtesy of Sentinel Hub Playground. |
Information Contacts: Observatoire Volcanologique de Goma (OVG), Departement de Geophysique, Centre de Recherche en Sciences Naturelles, Lwiro, D.S. Bukavu, DR Congo; Georiska, Royal Museum for Central Africa, Leuvensesteenweg 13, 3080 Tervuren, Belgium (URL: http://www.africamuseum.be, https://georiska.africamuseum.be/en/news/nyiragongo_eruption); Le Parisien Libéré, 10, boulevard de Grenelle 75738 Paris Cedex 15 (URL: https://www.leparisien.fr/, https://www.leparisien.fr/international/volcan-nyiragongo-deux-longues-fissures-apparaissent-a-goma-25-05-2021-MQWNN2GXP5B7DEVMNUTTKHFACI.php); Euronews, 56, quai Rambaud, 69002 Lyon (URL: https://fr.africanews.com/, https://fr.africanews.com/2021/05/24/volcan-nyiragongo-un-seisme-de-magnitude-5-1-ressenti-au-rwanda/?utm_term=Autofeed&utm_medium=AfricanewsFR&utm_source=Twitter#Echobox=1621869737); BBC News (URL: https://www.bbc.com/news); Mission de l’Organisation des Nations Unies pour la Stabilisation en Rd Congo (MONUSCO), Kinshasa, DR Congo (URL: https://monusco.unmissions.org/); Reuters, Canary Wharf, London, United Kingdom (URL: https://www.reuters.com/, https://www.reuters.com/business/environment/tremors-shake-congo-city-close-schools-shops-after-volcanic-eruption-2021-05-24/); Volcano Disaster Assistance Program (VDAP), US Geological Survey (USGS), 1300 SE Cardinal Court, Bldg. 10, Suite 100, Vancouver, WA 98683; MIROVA (Middle InfraRed Observation of Volcanic Activity), a collaborative project between the Universities of Turin and Florence (Italy) supported by the Centre for Volcanic Risk of the Italian Civil Protection Department (URL: http://www.mirovaweb.it/); Toulouse Volcanic Ash Advisory Center (VAAC), Météo-France, 42 Avenue Gaspard Coriolis, F-31057 Toulouse cedex, France (URL: http://www.meteo.fr/aeroweb/info/vaac/); NASA Global Sulfur Dioxide Monitoring Page, Atmospheric Chemistry and Dynamics Laboratory, NASA Goddard Space Flight Center (NASA/GSFC), 8800 Greenbelt Road, Goddard, Maryland, USA (URL: https://so2.gsfc.nasa.gov/); Sentinel Hub Playground (URL: https://www.sentinel-hub.com/explore/sentinel-playground).
Active lava on the crater floor creates thermal anomalies and spatter after mid-September 2021
Nyiragongo, in the Democratic Republic of the Congo, is part of the Virunga Volcanic Province (VVP) along the western branch of the East African Rift System. It contains a 1.2 km-wide summit crater with a lava lake that has been active since at least 1971. Lava flows have been a hazard in the past for the nearby city of Goma (15 km S); with recent documented lava flows occurring in April 2019 from a secondary cone that had formed in February 2016, accompanied by ejecta (BGVN 44:05). These flows, along with those that were reported during February and March 2016 (BGVN 42:01), were confined to the crater lake. Volcanism has typically consisted of lava lake activity (evidenced by strong thermal anomalies), incandescence, and gas-and-steam emissions (BGVN 45:12). During May 2021, however, a notable flank fissure eruption consisted of intense seismicity, lava lake drainage, lava flows reaching Goma, and ash plumes (BGVN 46:06). This report covers activity during June through November 2021 and describes lower-power thermal anomalies. The volcano is monitored by the Observatoire Volcanologique de Goma (OVG) and various satellite instruments.
A small area of incandescence was observed from the crater floor on 1 June and 26 July in Sentinel-2 infrared satellite imagery (figure 89). OVG reported that on 4 August a gas-and-ash plume was visible at 1420. On 18 September OVG reported that lava had returned to the summit crater, according to a Sentinel satellite image. Notable thermal anomalies were also visible on 29 September and 4 October in infrared satellite imagery, despite cloud cover (figure 89). On 27 November the active vents on the crater floor were observed ejecting spatter (figure 90).
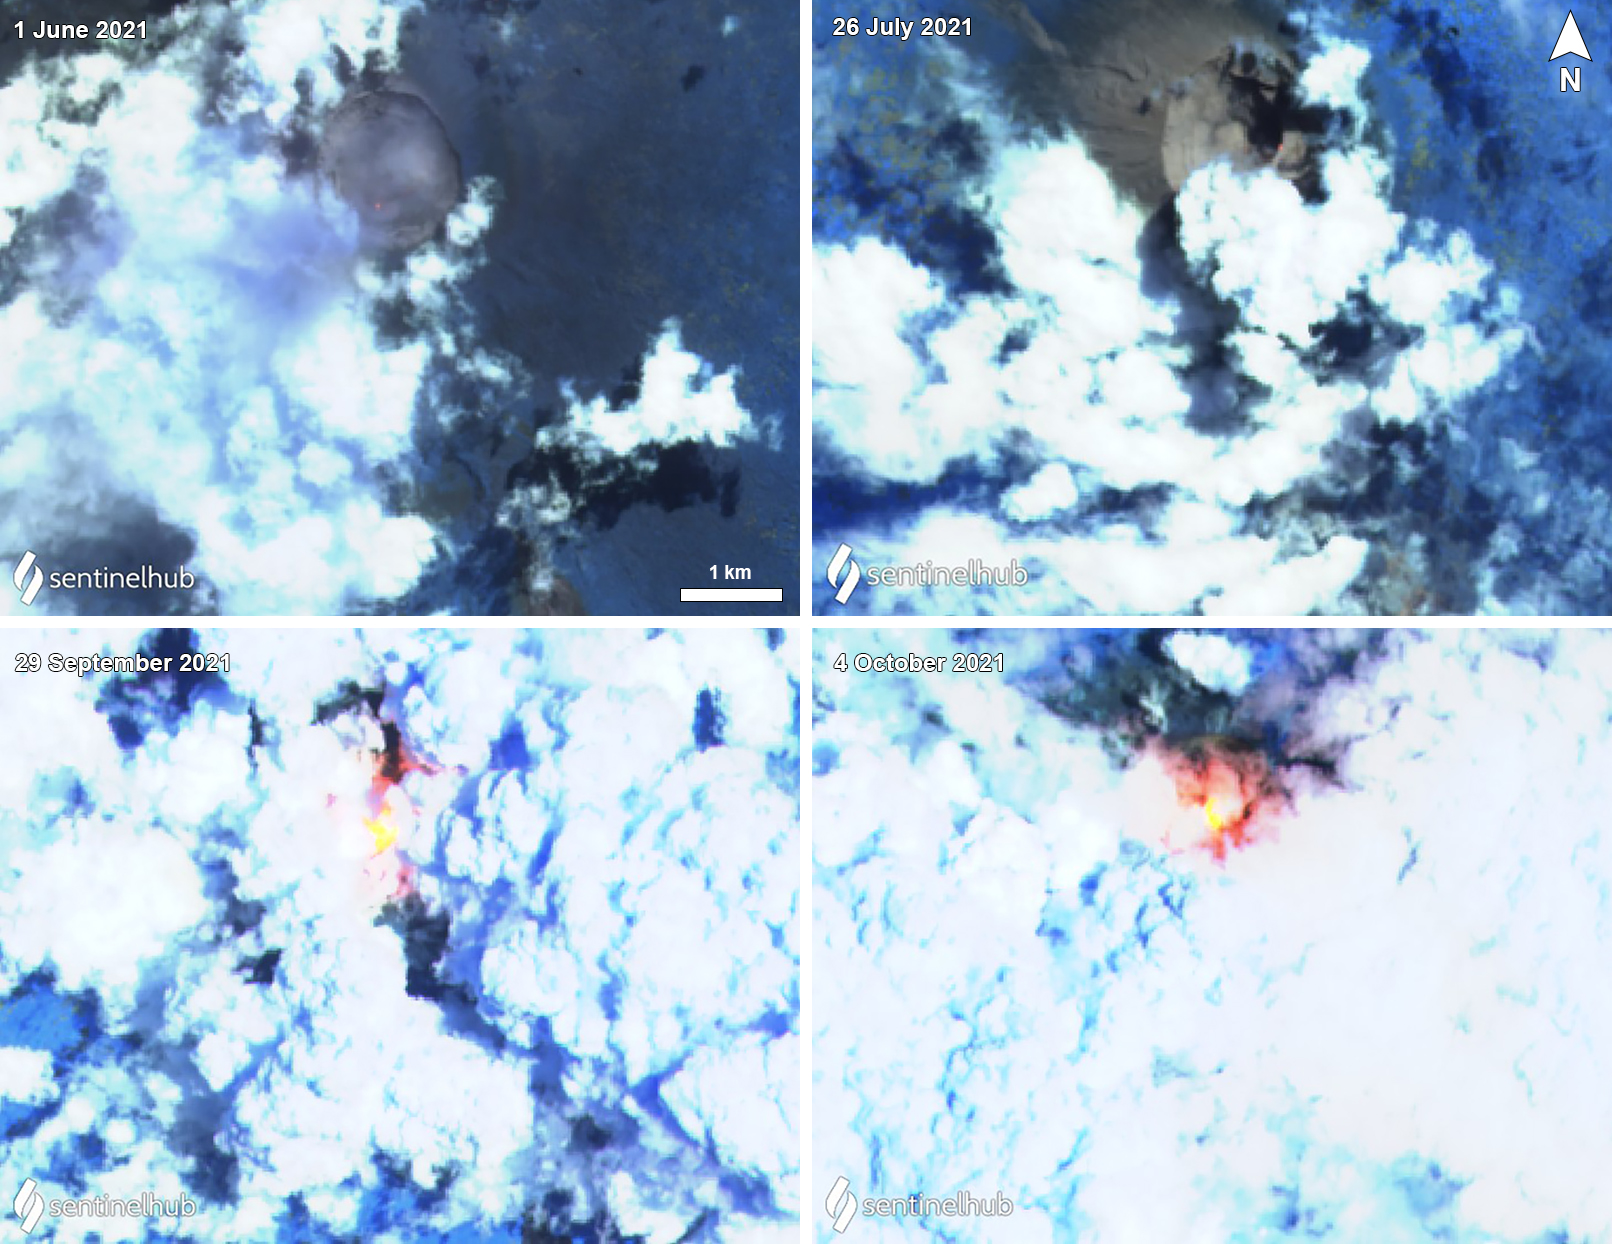 |
Figure 89. Sentinel-2 infrared satellite imagery showed very weak thermal anomalies during 1 June (top left) and 26 July (top right) 2021 in the summit crater of Nyiragongo. Activity remained relatively low or covered by clouds until a strong thermal anomaly (bright yellow-orange) was detected during 29 September (bottom left) and 4 October (bottom right) 2021. This increase in activity, observed despite obscuring clouds, is also reflected in MIROVA data. Images using “Atmospheric penetration” rendering (bands 12, 11, 8a). Courtesy of Sentinel Hub Playground. |
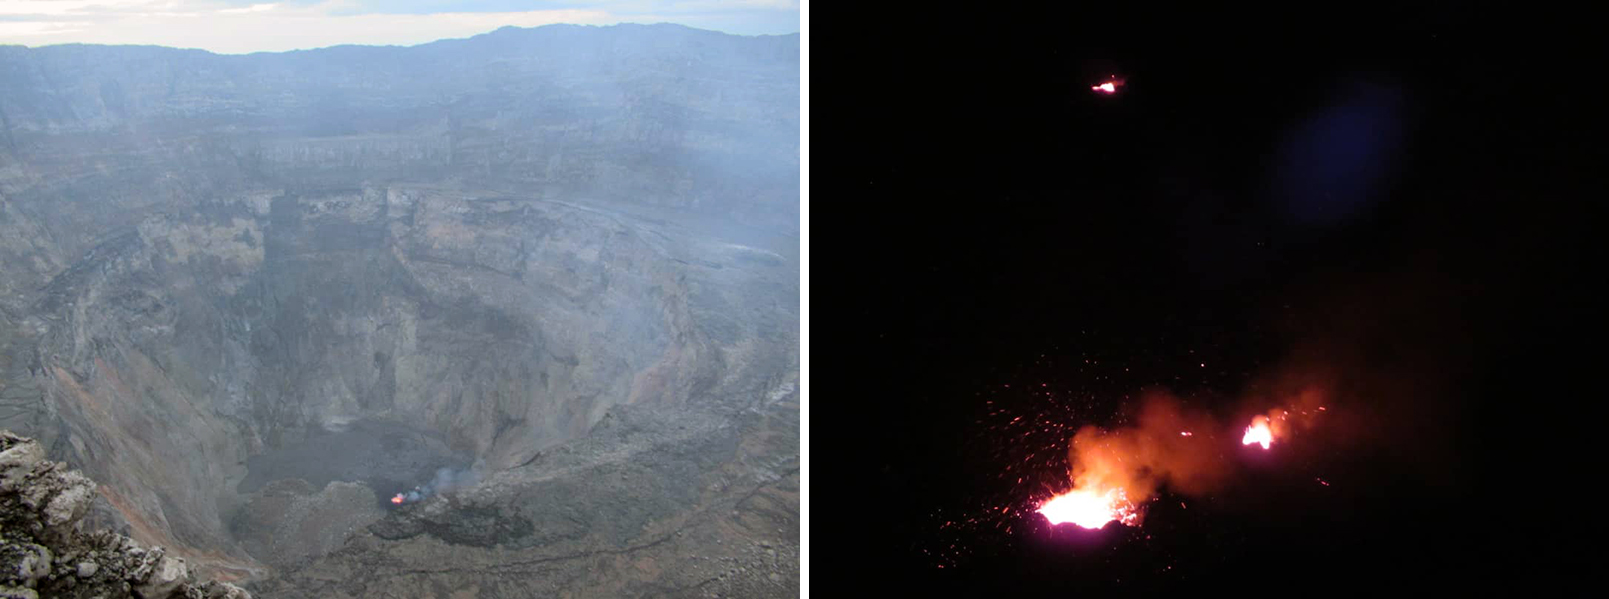 |
Figure 90. Photos of the main crater floor of Nyiragongo showing ongoing incandescence, spatter, and minor gas-and-steam emissions on 27 November 2021. Courtesy of Charles Balagizi, OVG. |
MIROVA (Middle InfraRed Observation of Volcanic Activity) analysis of MODIS satellite data showed a significant decrease in the power of the thermal anomalies after the notable eruption in May 2021. Though anomalies continued to be detected in the summit crater, they were also less frequently detected compared to the previous months (figure 91). A pulse in activity was observed during late September through mid-October, which was also reflected in Sentinel-2 infrared satellite images, despite the cloud cover (figure 89), and in the MODVOLC data. According to the MODVOLC thermal algorithm, a total of 24 thermal alerts were issued during the reporting period: one on 27 June, one on 12 September, 7 on 28 September, 6 on 29 September, one on 3 October, two on 6 October, two on 12 October, two on 27 November, and two on 29 November.
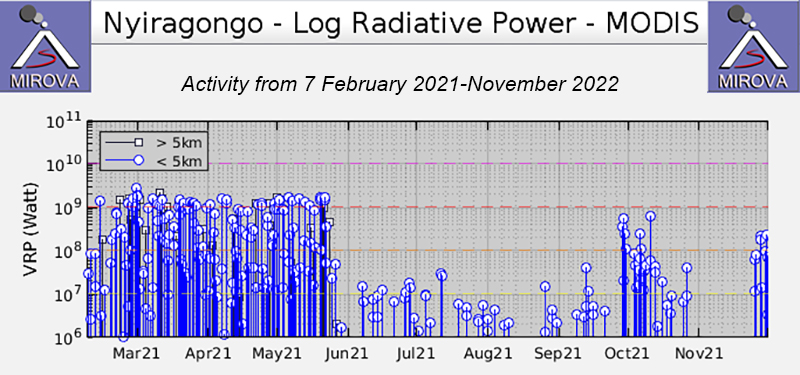 |
Figure 91. Thermal anomalies at Nyiragongo from June through November 2021 as recorded by the MIROVA system (Log Radiative Power) were notably weaker compared to the strong activity during February through May. Anomalies continued to be detected intermittently, with a marked pulse during late September through mid-October. Courtesy of MIROVA. |
Information Contacts: Observatoire Volcanologique de Goma (OVG), Departement de Geophysique, Centre de Recherche en Sciences Naturelles, Lwiro, D.S. Bukavu, DR Congo; MIROVA (Middle InfraRed Observation of Volcanic Activity), a collaborative project between the Universities of Turin and Florence (Italy) supported by the Centre for Volcanic Risk of the Italian Civil Protection Department (URL: http://www.mirovaweb.it/); Hawai'i Institute of Geophysics and Planetology (HIGP) - MODVOLC Thermal Alerts System, School of Ocean and Earth Science and Technology (SOEST), Univ. of Hawai'i, 2525 Correa Road, Honolulu, HI 96822, USA (URL: http://modis.higp.hawaii.edu/); Sentinel Hub Playground (URL: https://www.sentinel-hub.com/explore/sentinel-playground); Charles Balagizi, Observatoire Volcanologique de Goma (OVG), Departement de Geophysique, Centre de Recherche en Sciences Naturelles, Lwiro, D.S. Bukavu, DR Congo; (Twitter: @CharlesBalagizi, https://twitter.com/CharlesBalagizi).
Strong thermal activity in the summit crater during December 2021 and June 2022
Nyiragongo, part of the Virunga Volcanic Province (VVP), is located in the Democratic Republic of the Congo along the western branch of the East African Rift system. It contains a 1.2 km-wide summit crater with a lava lake that has been active since at least 1971. Lava flows have been a hazard in the past for the nearby city of Goma (15 km S). During May 2021 a notable flank fissure eruption consisted of intense seismicity, lava lake drainage, lava flows reaching Goma, and ash plumes (BGVN 46:06). The current eruption has been ongoing since 2002 and has recently been characterized by active lava on the crater floor and some spatter, as evidenced by strong thermal anomalies and occasional photos (BGVN 46:12). This report updates information from December 2021 through June 2022 and describes lava effusions along the crater floor during January and March 2022, lava fountaining, and persistent gas-and-steam emissions. The volcano is monitored by the Observatoire Volcanologique de Goma (OVG) and various satellite instruments.
Activity was relatively low during December 2021; according to a news article, notable long-period (LP) earthquakes were detected during 30 November through 5 December and residents of Goma observed crater incandescence on 4 December. OVG reported gas-and-steam plumes and visible incandescence from the crater during 3-5 January 2022. In addition, lava fountaining and collapses at active vents on the crater floor were observed. A growing lava lake was reported, which was also reflected in a 12 January 2022 infrared satellite image of lava effusions covering much of the crater floor. During 13-18 March lava effusion from vents along the crater floor was detected in satellite images. Significant gas-and-steam emissions were visible drifting SW on 13 March.
MIROVA (Middle InfraRed Observation of Volcanic Activity) analysis of MODIS satellite data showed a gradual increase in thermal activity during late November through mid-December 2021 (figure 92). Thermal activity remained relatively high through mid-January 2022 and was followed by a gradual decrease in both power and frequency, which was relatively low during late January through February. Activity gradually increased again in both power and frequency during early March; relatively lower peaks of anomalies were also noted in late April and mid-June. The MODVOLC thermal algorithm detected a total of 97 anomalies in the summit crater, a majority of which were detected during January. Sentinel-2 infrared satellite images intermittently showed a consistent thermal anomaly in the summit crater, with a notably strong anomaly on 12 January and 13 March, representing lava effusions covering much of the crater floor (figure 93). These stronger anomalies were also represented in the MIROVA graph as the stronger peaks during January and March.
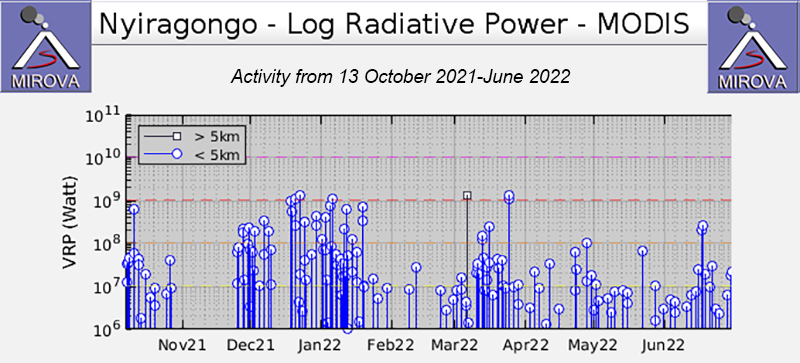 |
Figure 92. Thermal anomalies at Nyiragongo from 13 October 2021 through June 2022 as recorded by the MIROVA system (Log Radiative Power) spiked in activity during late November to mid-December. Thermal activity remained relatively high through mid-January, followed by a gradual decrease in power. During late January through February, thermal anomalies were low in power and less frequent. Then, during early March, there was a gradual increase in both power and frequency. Lower-power peaks of thermal anomalies also occurred in late April and mid-June. Courtesy of MIROVA. |
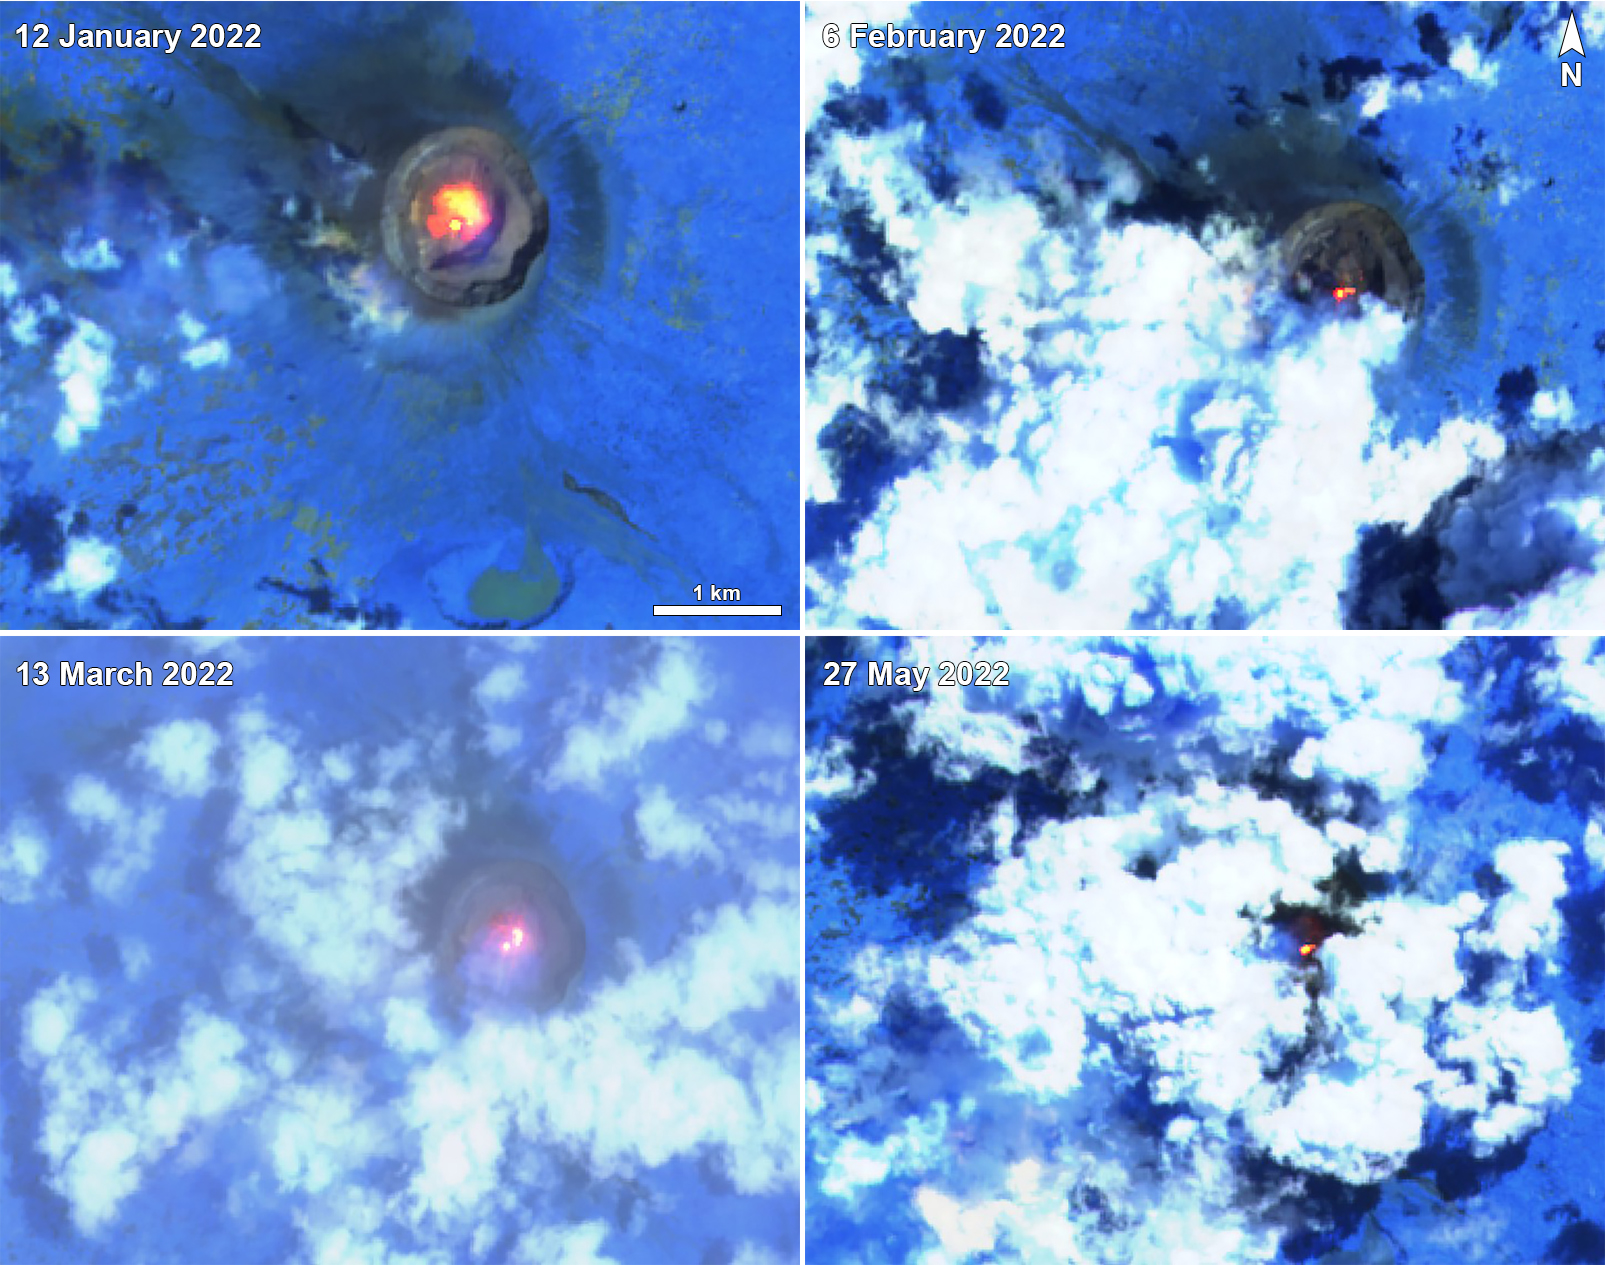 |
Figure 93. Sentinel-2 infrared satellite imagery showed intermittent thermal anomalies during January through May 2022 when not obscured by clouds. On 12 January 2022 (top left) and 13 March 2022 (bottom left) showed lava effusions covering the crater floor. Gas-and-steam emissions also accompanied the stronger anomalies. Smaller thermal anomalies were also observed on 6 February 2022 (top right) and 27 May 2022 (bottom right), with possible smaller lava effusions to the E and NE, respectively from the point of origin. Images using “Atmospheric penetration” rendering (bands 12, 11, 8a). Courtesy of Sentinel Hub Playground. |
Information Contacts: Observatoire Volcanologique de Goma (OVG), Departement de Geophysique, Centre de Recherche en Sciences Naturelles, Lwiro, D.S. Bukavu, DR Congo; MIROVA (Middle InfraRed Observation of Volcanic Activity), a collaborative project between the Universities of Turin and Florence (Italy) supported by the Centre for Volcanic Risk of the Italian Civil Protection Department (URL: http://www.mirovaweb.it/); Hawai'i Institute of Geophysics and Planetology (HIGP) - MODVOLC Thermal Alerts System, School of Ocean and Earth Science and Technology (SOEST), Univ. of Hawai'i, 2525 Correa Road, Honolulu, HI 96822, USA (URL: http://modis.higp.hawaii.edu/); Sentinel Hub Playground (URL: https://www.sentinel-hub.com/explore/sentinel-playground); Isabelle Kasoki, Les Volcans News, (URL: https://lesvolcansnews.net/2021/12/07/surveillance-du-nyiragongo-lovg-note-une-baisse-considerable-du-nombre-de-seismes-tectoniques-dans-le-lac-kivu/).
Ongoing lava lake activity in the summit crater through March 2023
Nyiragongo, in the Democratic Republic of the Congo, is part of the Virunga Volcanic Province along the western branch of the East African Rift System near the Rwanda border. It contains a 1.2-km-wide summit crater with a lava lake that has been active since at least 1971. Eruptions during the last 120 years have been associated within the summit crater; several flank lava flows have also been observed, sometimes reaching and causing destruction in the city of Goma (15 km S) (BGVN 27:04, 42:01, 46:06). The current report summarizes data between July 2022 and March 2023 and is based on information from the Observatoire Volcanologique de Goma (OVG) and satellite data.
The MIROVA (Middle InfraRed Observation of Volcanic Activity) system recorded numerous hotspots during June-July 2022 (figure 94), with additional stronger activity detected in mid-October, December, and February-March 2023 (figure 95). Thermal anomaly data from Sentinel-2 for the previous two years (figure 96) shows the intermittent lava activity in the summit crater since the lava flows from S-flank fissures reached Goma in late May 2021 (BGVN 46:06). According to OVG, several earthquakes along the fault between the summit and Shaheru (~2 km S) craters occurred on 9 October, and strong incandescence at night was seen above the crater on 11 October. High concentrations of carbon dioxide were measured by OVG in some areas near the volcano during mid-February 2023 and residents were warned to stay away from those areas.
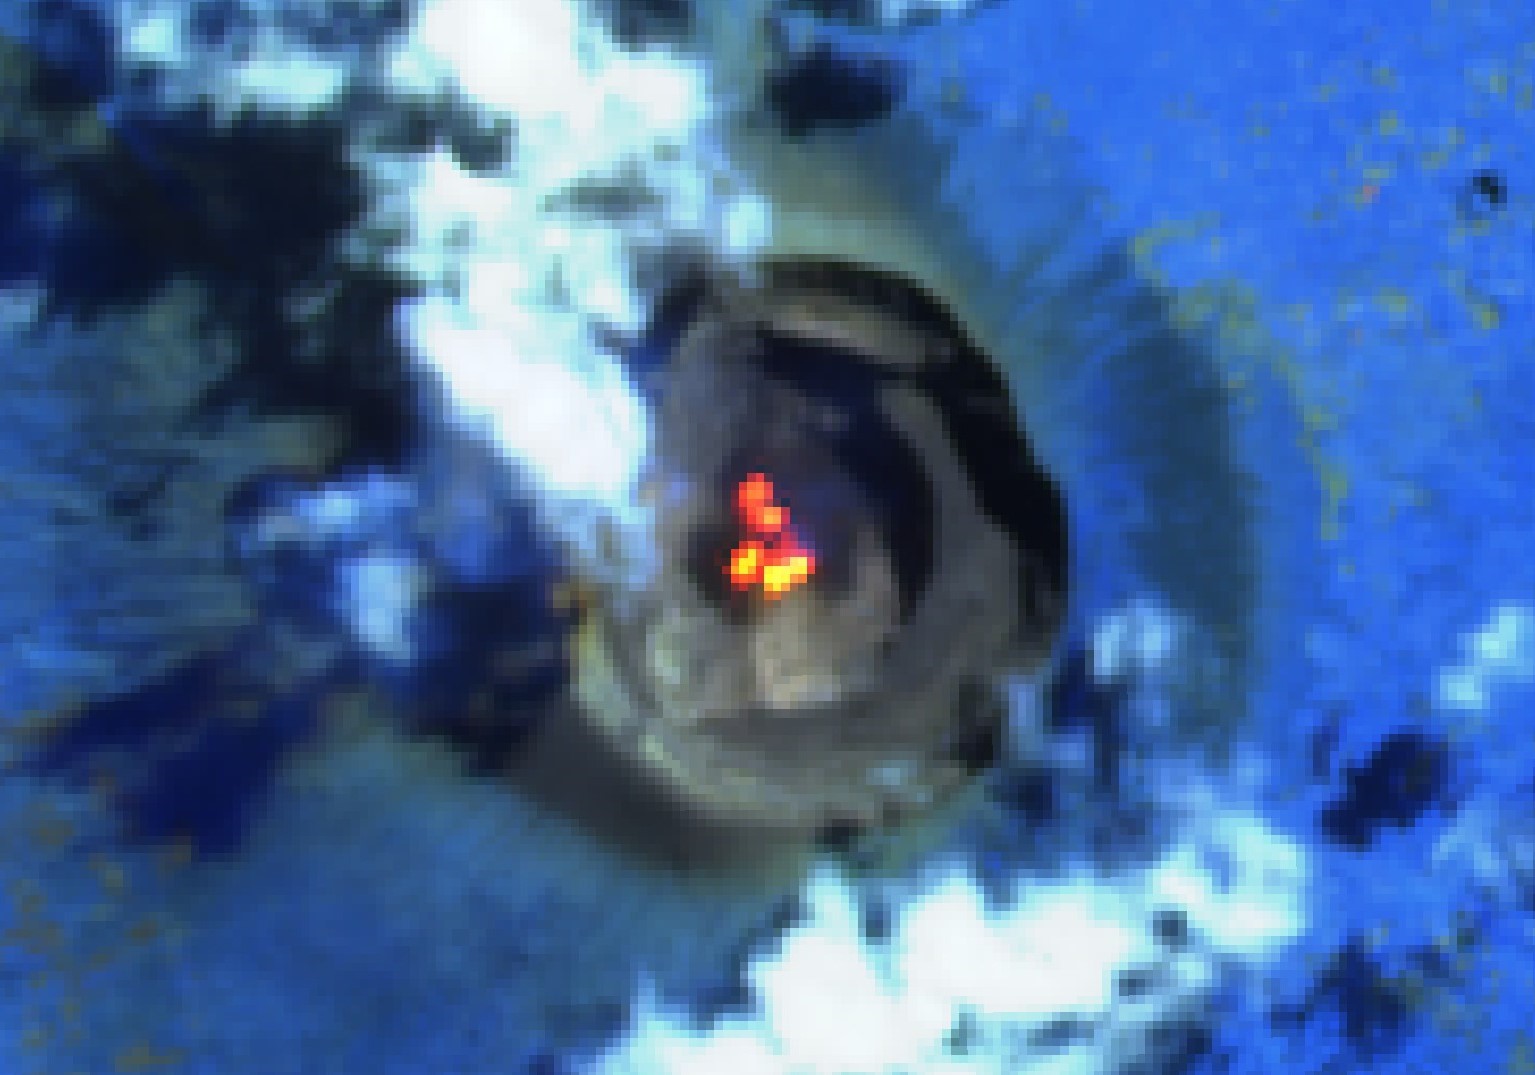 |
Figure 94. Sentinel-2 infrared satellite imagery from 21 July 2022 showed multiple hotspots within the Nyiragongo summit crater. Image used “Atmospheric penetration” rendering (bands 12, 11, 8a). Courtesy of Sentinel Hub Playground. |
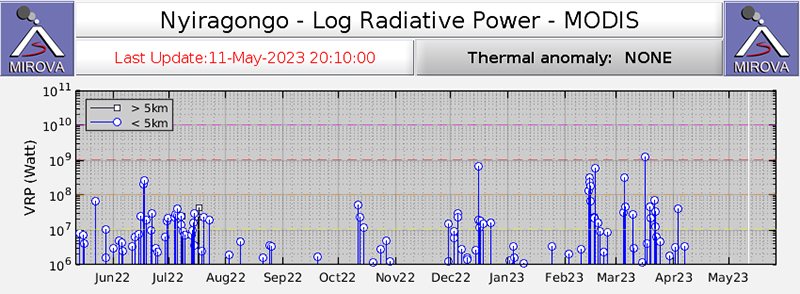 |
Figure 95. MIROVA graph of thermal activity in the summit crater for the year beginning on 10 May 2022. Frequent strong thermal anomalies were prevalent in July and December 2022, and again during February-March 2023. Courtesy of MIROVA. |
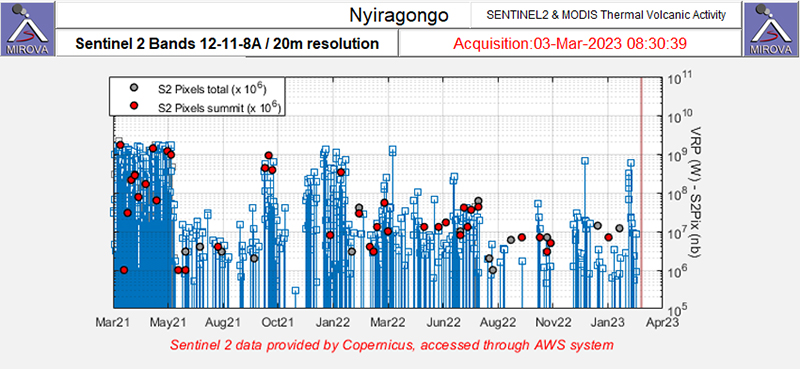 |
Figure 96. Infrared satellite data from Sentinel-2, as shown on this MIROVA graph, shows thermal anomalies at Nyiragongo for the two years prior to 3 March 2023. Activity has been intermittent in the summit crater since late May 2021 when there were lava flows from S-flank fissures. Courtesy of MIROVA. |
Information Contacts: Observatoire Volcanologique de Goma (OVG), Departement de Geophysique, Centre de Recherche en Sciences Naturelles, Lwiro, D.S. Bukavu, DR Congo; MIROVA (Middle InfraRed Observation of Volcanic Activity), a collaborative project between the Universities of Turin and Florence (Italy) supported by the Centre for Volcanic Risk of the Italian Civil Protection Department (URL: http://www.mirovaweb.it/); Sentinel Hub Playground (URL: https://www.sentinel-hub.com/explore/sentinel-playground).
Ongoing lava lake activity in the summit crater through September 2023
Nyiragongo is within the Albertine Rift Zone along the western branch of the East African Rift System in the Democratic Republic of the Congo. A lava lake inside the 1.2 km summit crater has been active since at least 1971. Eruptions during the last 120 years have been associated primarily with the summit crater, but several flank lava flows have also been observed as recently as 2019 and 2021, with the latter reaching the city of Goma (15 km S) (BGVN 46:06). Besides lava extrusions, activity has included incandescence, gas and steam emissions, and seismicity. The current report summarizes data between April and September 2023 and is based on occasional communications from the Observatoire Volcanologique de Goma (OVG) and satellite data.
During the reporting period, volcanic activity was relatively low and confined to the persistent lava lake. OVG reported that the eruption continued as normal from 27 May to 11 June, with crater incandescence observed at 1900 on 4 June and 1800 on 10 June. SO2 emissions were low. A subsequent OVG report indicated that activity continued low during 17-24 September. A diffuse sulfur dioxide plume with an estimated mass of 20 tons was identified in satellite data on 25 September.
The MIROVA (Middle InfraRed Observation of Volcanic Activity) hotspot system recorded a surge of moderate to high-power hotspots in about the second week of June 2023, and then frequent hotspots throughout July, and a few scattered hotspots in August. The MODIS-MODVOLC thermal alerts system recorded hotspots only on 3 April, 10 July, and 24, 25, and 27 July (two pixels each day in July). Sentinel-2 satellites recorded lava effusion in the summit crater during the few satellite observation days of the reporting period, corresponding to the elevated thermal observations (figure 97).
|
Figure 97. Sentinel-2 infrared satellite imagery showed ongoing activity and lava effusion in the Nyiragongo summit crater on 11 June 2023 (left), 21 July 2023 (middle), and 26 July 2023 (right). Images rendered using bands B12, B11, B4. Courtesy of Copernicus Browser. |
Information Contacts: Observatoire Volcanologique de Goma (OVG), Departement de Geophysique, Centre de Recherche en Sciences Naturelles, Lwiro, D.S. Bukavu, DR Congo; MIROVA (Middle InfraRed Observation of Volcanic Activity), a collaborative project between the Universities of Turin and Florence (Italy) supported by the Centre for Volcanic Risk of the Italian Civil Protection Department (URL: http://www.mirovaweb.it/); Hawai'i Institute of Geophysics and Planetology (HIGP) - MODVOLC Thermal Alerts System, School of Ocean and Earth Science and Technology (SOEST), Univ. of Hawai'i, 2525 Correa Road, Honolulu, HI 96822, USA (URL: http://modis.higp.hawaii.edu/); Copernicus Browser, Copernicus Data Space Ecosystem, European Space Agency (URL: https://dataspace.copernicus.eu/browser/).
|
|
||||||||||||||||||||||||||||
There is data available for 19 confirmed eruptive periods.
2002 May 17 (?) - 2025 Sep 19 (continuing) Confirmed Eruption (Lava Lake) VEI: 2
| Episode 1 | Eruption (Explosive / Effusive) | ||||||||||||||||||||||||||||||||||||||||||||||||||||||||||||||||
|---|---|---|---|---|---|---|---|---|---|---|---|---|---|---|---|---|---|---|---|---|---|---|---|---|---|---|---|---|---|---|---|---|---|---|---|---|---|---|---|---|---|---|---|---|---|---|---|---|---|---|---|---|---|---|---|---|---|---|---|---|---|---|---|---|
| 2002 May 17 (?) - 2023 Aug 17 (continuing) | Evidence from Observations: Reported | |||||||||||||||||||||||||||||||||||||||||||||||||||||||||||||||
|
List of 11 Events for Episode 1
|
||||||||||||||||||||||||||||||||||||||||||||||||||||||||||||||||
| Episode 2 | Eruption (Lava Lake) | Summit crater | |||
|---|---|---|---|---|
| 2021 Sep 18 - 2023 Oct 24 | Evidence from Observations: Reported | |||
| Episode 3 | Eruption (Lava Lake) | ||||||||||||||||||||||||||||||||||
|---|---|---|---|---|---|---|---|---|---|---|---|---|---|---|---|---|---|---|---|---|---|---|---|---|---|---|---|---|---|---|---|---|---|---|
| 2024 Mar 1 ± 1 days - 2025 Sep 19 (continuing) | Evidence from Observations: Satellite (infrared) | |||||||||||||||||||||||||||||||||
|
List of 5 Events for Episode 3
|
||||||||||||||||||||||||||||||||||
2002 Jan 17 - 2002 Feb 3 (on or after) Confirmed Eruption (Explosive / Effusive) VEI: 1
| Episode 1 | Eruption (Explosive / Effusive) | South flank (2800-1570 m), summit crater | |||||||||||||||||||||||||||||||||||||||||||||||||||||
|---|---|---|---|---|---|---|---|---|---|---|---|---|---|---|---|---|---|---|---|---|---|---|---|---|---|---|---|---|---|---|---|---|---|---|---|---|---|---|---|---|---|---|---|---|---|---|---|---|---|---|---|---|---|---|
| 2002 Jan 17 - 2002 Feb 3 (on or after) | Evidence from Observations: Reported | |||||||||||||||||||||||||||||||||||||||||||||||||||||
|
List of 9 Events for Episode 1 at South flank (2800-1570 m), summit crater
|
||||||||||||||||||||||||||||||||||||||||||||||||||||||
1994 Jun 23 - 1996 Mar 16 (?) ± 15 days Confirmed Eruption (Explosive / Effusive) VEI: 1
| Episode 1 | Eruption (Explosive / Effusive) | ||||||||||||||||||||||||||||||||||||||||||||
|---|---|---|---|---|---|---|---|---|---|---|---|---|---|---|---|---|---|---|---|---|---|---|---|---|---|---|---|---|---|---|---|---|---|---|---|---|---|---|---|---|---|---|---|---|
| 1994 Jun 23 - 1996 Mar 16 (?) ± 15 days | Evidence from Observations: Reported | |||||||||||||||||||||||||||||||||||||||||||
|
List of 7 Events for Episode 1
|
||||||||||||||||||||||||||||||||||||||||||||
1982 Jun 21 - 1982 Oct 17 ± 15 days Confirmed Eruption (Explosive / Effusive) VEI: 1
| Episode 1 | Eruption (Explosive / Effusive) | |||||||||||||||||||||||||||||||||||||||
|---|---|---|---|---|---|---|---|---|---|---|---|---|---|---|---|---|---|---|---|---|---|---|---|---|---|---|---|---|---|---|---|---|---|---|---|---|---|---|---|
| 1982 Jun 21 - 1982 Oct 17 ± 15 days | Evidence from Observations: Reported | ||||||||||||||||||||||||||||||||||||||
|
List of 6 Events for Episode 1
|
|||||||||||||||||||||||||||||||||||||||
1977 Jan 10 - 1977 Jan 10 Confirmed Eruption (Explosive / Effusive) VEI: 1
| Episode 1 | Eruption (Explosive / Effusive) | North, south, and west flanks | ||||||||||||||||||||||||||||||||||||||||||||||||
|---|---|---|---|---|---|---|---|---|---|---|---|---|---|---|---|---|---|---|---|---|---|---|---|---|---|---|---|---|---|---|---|---|---|---|---|---|---|---|---|---|---|---|---|---|---|---|---|---|---|
| 1977 Jan 10 - 1977 Jan 10 | Evidence from Observations: Reported | ||||||||||||||||||||||||||||||||||||||||||||||||
| Nyiragongo's first reported flank fissure eruption took place over a period of hours on 10 January 1977, when extremely fluid lava from fissures on the N, S, and W flanks drained the summit crater lava lake. The rapidly-moving flows killed 70 people and left 800 homeless. The two largest flows issued from the S flank of Shaheru and traveled ~8 km to within 2 km of Goma, and from the N flank of Baruta from where it was deflected E by older deposits. The crater of Shaheru was partially filled by a small flow that issued from an upslope fissure. Draining of the lava lake left a nearly vertical hole crater 800 m deep. Conversion of ground water to steam when lava lake terraces collapsed produced a dark gray ash cloud that rose 1 km and caused partial darkness in Goma. | |||||||||||||||||||||||||||||||||||||||||||||||||
|
List of 8 Events for Episode 1 at North, south, and west flanks
|
|||||||||||||||||||||||||||||||||||||||||||||||||
1927 Mar 16 ± 15 days - 1977 Jan 10 Confirmed Eruption (Lava Lake) VEI: 1
| Episode 1 | Eruption (Lava Lake) | ||||||||||||||||||||||||||||||||||
|---|---|---|---|---|---|---|---|---|---|---|---|---|---|---|---|---|---|---|---|---|---|---|---|---|---|---|---|---|---|---|---|---|---|---|
| 1927 Mar 16 ± 15 days - 1977 Jan 10 | Evidence from Observations: Reported | |||||||||||||||||||||||||||||||||
| A lava lake was present in the summit crater from at least 1927 until 1977. Lake levels and vigor of fountaining varied. The lake drained suddenly on 10 January 1977. | ||||||||||||||||||||||||||||||||||
|
List of 5 Events for Episode 1
|
||||||||||||||||||||||||||||||||||
1920 - 1921 Confirmed Eruption (Lava Lake) VEI: 1
| Episode 1 | Eruption (Lava Lake) | |||||||||||||||||||
|---|---|---|---|---|---|---|---|---|---|---|---|---|---|---|---|---|---|---|---|
| 1920 - 1921 | Evidence from Observations: Reported | ||||||||||||||||||
|
List of 2 Events for Episode 1
|
|||||||||||||||||||
1918 Confirmed Eruption (Lava Lake) VEI: 1
| Episode 1 | Eruption (Lava Lake) | |||||||||||||||||||
|---|---|---|---|---|---|---|---|---|---|---|---|---|---|---|---|---|---|---|---|
| 1918 - Unknown | Evidence from Observations: Reported | ||||||||||||||||||
| In 1918 the two craters with lava lakes had formed a single lava lake and steam was being emitted (Krafft, 1990). | |||||||||||||||||||
|
List of 2 Events for Episode 1
|
|||||||||||||||||||
1911 Aug - 1911 Oct Confirmed Eruption (Lava Lake) VEI: 1
| Episode 1 | Eruption (Lava Lake) | Southern pit | |||||||||||||
|---|---|---|---|---|---|---|---|---|---|---|---|---|---|---|
| 1911 Aug - 1911 Oct | Evidence from Observations: Reported | |||||||||||||
| Activity in the southern pit crater. | ||||||||||||||
|
List of 1 Events for Episode 1 at Southern pit
|
||||||||||||||
[ 1908 Dec 1 ± 30 days ] Uncertain Eruption
| Episode 1 | Uncertain | Southern craters | |||||||||||||
|---|---|---|---|---|---|---|---|---|---|---|---|---|---|---|
| 1908 Dec 1 ± 30 days - Unknown | Evidence from Unknown | |||||||||||||
| The southern craters "smoked" at the end of 1908 (Krafft, 1990). | ||||||||||||||
|
List of 1 Events for Episode 1 at Southern craters
|
||||||||||||||
1906 Confirmed Eruption (Lava Lake) VEI: 1
| Episode 1 | Eruption (Lava Lake) | ||||||||||||||
|---|---|---|---|---|---|---|---|---|---|---|---|---|---|---|
| 1906 - Unknown | Evidence from Observations: Reported | |||||||||||||
|
List of 1 Events for Episode 1
|
||||||||||||||
1905 Confirmed Eruption (Lava Lake) VEI: 1
| Episode 1 | Eruption (Lava Lake) | |||||||||||||||||||
|---|---|---|---|---|---|---|---|---|---|---|---|---|---|---|---|---|---|---|---|
| 1905 - Unknown | Evidence from Observations: Reported | ||||||||||||||||||
| The two craters with lava lakes, reported in 1894, still existed in 1905, but the wall separating them was no longer present (Krafft, 1990). | |||||||||||||||||||
|
List of 2 Events for Episode 1
|
|||||||||||||||||||
1902 Confirmed Eruption (Lava Lake) VEI: 1
| Episode 1 | Eruption (Lava Lake) | ||||||||||||||
|---|---|---|---|---|---|---|---|---|---|---|---|---|---|---|
| 1902 - Unknown | Evidence from Observations: Reported | |||||||||||||
|
List of 1 Events for Episode 1
|
||||||||||||||
1901 Confirmed Eruption (Lava Lake) VEI: 1
| Episode 1 | Eruption (Lava Lake) | |||||||||||||||||||
|---|---|---|---|---|---|---|---|---|---|---|---|---|---|---|---|---|---|---|---|
| 1901 - Unknown | Evidence from Observations: Reported | ||||||||||||||||||
|
List of 2 Events for Episode 1
|
|||||||||||||||||||
1900 Confirmed Eruption (Lava Lake) VEI: 1
| Episode 1 | Eruption (Lava Lake) | ||||||||||||||||||||||||
|---|---|---|---|---|---|---|---|---|---|---|---|---|---|---|---|---|---|---|---|---|---|---|---|---|
| 1900 - Unknown | Evidence from Observations: Reported | |||||||||||||||||||||||
| Lapilli was ejected from the crater in 1900 (Sapper, 1917). | ||||||||||||||||||||||||
|
List of 3 Events for Episode 1
|
||||||||||||||||||||||||
1899 Confirmed Eruption (Lava Lake) VEI: 1
| Episode 1 | Eruption (Lava Lake) | ||||||||||||||||||||||||
|---|---|---|---|---|---|---|---|---|---|---|---|---|---|---|---|---|---|---|---|---|---|---|---|---|
| 1899 - Unknown | Evidence from Observations: Reported | |||||||||||||||||||||||
| Lapilli was ejected from the crater in 1899 (Sapper, 1917). | ||||||||||||||||||||||||
|
List of 3 Events for Episode 1
|
||||||||||||||||||||||||
1898 Confirmed Eruption (Lava Lake) VEI: 1
| Episode 1 | Eruption (Lava Lake) | ||||||||||||||
|---|---|---|---|---|---|---|---|---|---|---|---|---|---|---|
| 1898 - Unknown | Evidence from Observations: Reported | |||||||||||||
|
List of 1 Events for Episode 1
|
||||||||||||||
1894 Confirmed Eruption (Lava Lake) VEI: 1
| Episode 1 | Eruption (Lava Lake) | |||||||||||||||||||
|---|---|---|---|---|---|---|---|---|---|---|---|---|---|---|---|---|---|---|---|
| 1894 - Unknown | Evidence from Observations: Reported | ||||||||||||||||||
| Two craters with lava lakes were seen, separated by a thin wall (Krafft, 1990). | |||||||||||||||||||
|
List of 2 Events for Episode 1
|
|||||||||||||||||||
1891 (in or before) Confirmed Eruption (Lava Lake)
| Episode 1 | Eruption (Lava Lake) | Volcano Uncertain: probably Nyiragongo | |||||||||||||
|---|---|---|---|---|---|---|---|---|---|---|---|---|---|---|
| 1891 (in or before) - Unknown | Evidence from Unknown | |||||||||||||
| Local residents told Stuhlman at the time of his 1891 expedition that a mountain named Virunga-Vagongo (probably Nyiragongo) often glowed during the night. "Fire" or "smoke" was not seen by Stuhlman (Krafft, 1990). | ||||||||||||||
|
List of 1 Events for Episode 1 at Volcano Uncertain: probably Nyiragongo
|
||||||||||||||
1884 Confirmed Eruption (Lava Lake) VEI: 1
| Episode 1 | Eruption (Lava Lake) | Southern pit | ||||||||||||||||||
|---|---|---|---|---|---|---|---|---|---|---|---|---|---|---|---|---|---|---|---|
| 1884 - Unknown | Evidence from Observations: Reported | ||||||||||||||||||
| Activity in the southern pit crater. | |||||||||||||||||||
|
List of 2 Events for Episode 1 at Southern pit
|
|||||||||||||||||||
This compilation of synonyms and subsidiary features may not be comprehensive. Features are organized into four major categories: Cones, Craters, Domes, and Thermal Features. Synonyms of features appear indented below the primary name. In some cases additional feature type, elevation, or location details are provided.
Synonyms |
||||
| Niragongo | Ninagongo | Kirunge Cha Niragongo | Kirunge Ya Gongo | Kirungu Tscha Gongo | Kirungu Tscha Gongwe | Kirungo Cha Gongo | Revire Nganga | Graf Gotzen Krater | Kirunga Cha Nina Gongo | Niragonwe | ||||
Cones |
||||
| Feature Name | Feature Type | Elevation | Latitude | Longitude |
| Baruta | Stratovolcano | 3148 m | 1° 30' 0.00" S | 29° 14' 0.00" E |
| Bugogo | Cone | 2200 m | 1° 29' 0.00" S | 29° 18' 0.00" E |
| Buhuma | Cone | 1° 36' 0.00" S | 29° 16' 0.00" E | |
| Bulengo | Cone | 1569 m | 1° 37' 0.00" S | 29° 8' 0.00" E |
| Bushenye | Cone | 1° 33' 0.00" S | 29° 12' 0.00" E | |
| Bushwaga | Cone | 1850 m | 1° 38' 0.00" S | 29° 16' 0.00" E |
| Ganaya | Cone | 1° 33' 0.00" S | 29° 14' 0.00" E | |
| Gisi | Cone | 2222 m | 1° 30' 0.00" S | 29° 18' 0.00" E |
| Goma, Mont | Cone | 1591 m | 1° 41' 0.00" S | 29° 13' 0.00" E |
| Guberabia | Cone | 2464 m | 1° 30' 0.00" S | 29° 18' 0.00" E |
| Kanyambuzi | Cone | 1° 34' 0.00" S | 29° 15' 0.00" E | |
| Kanymagashu | Cone | 1° 37' 0.00" S | 29° 16' 0.00" E | |
| Kashaka | Cone | 1° 36' 0.00" S | 29° 9' 0.00" E | |
| Kibati | Cone | 1° 35' 0.00" S | 29° 15' 0.00" E | |
| Kiniha | Cone | 1° 31' 0.00" S | 29° 17' 0.00" E | |
| Kinyambatsha | Cone | 1° 34' 0.00" S | 29° 17' 0.00" E | |
| Kirunga I | Cone | 1° 38' 0.00" S | 29° 8' 0.00" E | |
| Mbati | Cone | 1° 34' 0.00" S | 29° 11' 0.00" E | |
| Mugara | Cone | 1° 37' 0.00" S | 29° 15' 0.00" E | |
| Muja
Mutsa |
Cone | 1° 37' 0.00" S | 29° 13' 0.00" E | |
| Mushushwe | Cone | 2197 m | 1° 28' 0.00" S | 29° 20' 0.00" E |
| Muti | Cone | 1° 37' 0.00" S | 29° 18' 0.00" E | |
| Ndamukoro | Cone | 1° 35' 0.00" S | 29° 9' 0.00" E | |
| Nyabusa | Cone | 1° 35' 0.00" S | 29° 10' 0.00" E | |
| Nyamushwa | Cone | 2475 m | 1° 30' 0.00" S | 29° 17' 0.00" E |
| Nyamutsibu | Cone | 1° 37' 0.00" S | 29° 8' 0.00" E | |
| Nyarutshiru | Cone | 1° 38' 0.00" S | 29° 10' 0.00" E | |
| Rubona | Cone | 1° 32' 0.00" S | 29° 12' 0.00" E | |
| Rushayo | Cone | 1892 m | 1° 34' 0.00" S | 29° 10' 0.00" E |
| Rutoke | Cone | 1° 33' 0.00" S | 29° 11' 0.00" E | |
| Shaheru | Stratovolcano | 2800 m | 1° 33' 0.00" S | 29° 14' 0.00" E |
| Tshabwato | Cone | 1932 m | 1° 36' 0.00" S | 29° 17' 0.00" E |
| Tshegere, Ile | Cone | 1° 39' 0.00" S | 29° 7' 0.00" E | |
| Washungwe | Cone | 1° 37' 0.00" S | 29° 17' 0.00" E | |
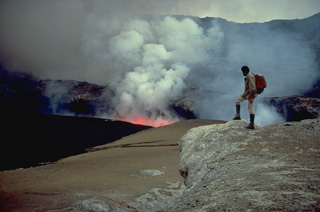 Smoke rises above a lava fountain in the lava lake at the summit of Nyiragongo volcano in June 1973. Long-term lava lake activity had been occurring since at least 1927. The observer is standing on one of several terraces left by collapse of solidified lava lakes at higher levels. Rapid fluctations of the level of the lava lake have occurred since it was first scientifically documented in the 1950's. The century-long lava lake drained suddenly in 1977.
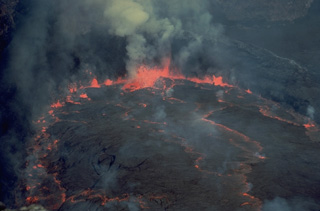 Lava fountains rise along the circular margin of a lava lake in the summit crater of Nyiragongo volcano in June 1973. Incandescence is visible through fractures in cooled slabs of lava on the surface of the convecting lava lake. Nyiragongo is renowned for its long-term lava lakes. A half century of continuous lava-lake activity ended suddenly on January 10, 1977, when the lava lake drained rapidly through flank fissures. Prior to draining, the lava lake rose to an elevation of 3300 m, its highest recorded level, only 170-m below the crater rim.
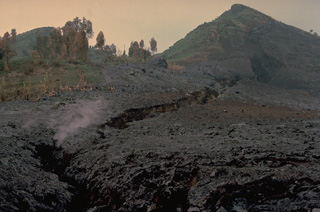 Part of the 6-km-long 10 January 1977 eruptive fissure on the south flank of Nyiragongo is seen in this February 1977 photo. Extremely fluid lava from fissures on the north and south flanks suddenly drained Nyiragongo's summit-crater lava lake. The rapidly moving flows killed 70 people and 800 were left homeless. The dramatic eruption was over in a matter of hours. Conversion of ground water to steam when lava lake terraces collapsed produced a dark gray ash cloud that rose 1 km and caused partial darkness in the city of Goma.
 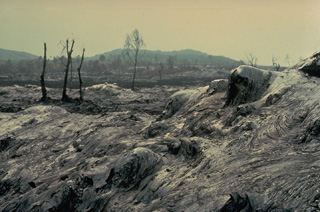 Lava flows produced by the sudden draining of a lava lake at Nyiragongo were extremely fluid. The thin, rapidly moving lava flows issued from fissures on the north and south flanks, and drained the lava lake in less than an hour. The initial velocity of these unusually fluid lava flows may have been as high as 100 km/hour. They maintained an average velocity of 30 km/hour over a distance of 10 km. The high-velocity flows overran several villages and killed 70 people, leaving 800 homeless.
 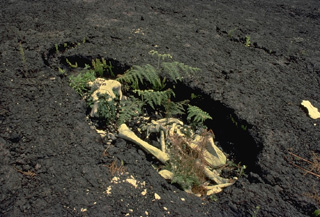 The unusually fluid, high-velocity lava flows produced by the sudden draining of the summit crater lava lake of Nyiragongo volcano in 1977 took their toll on humans and wildlife. The bones of an elephant trapped by the lava flow are contained within the lava-chilled mold of its body. The linear extension at the top left was formed by the animal's trunk. The 1977 lava flows swept down the flanks of the volcano at initial velocities of more than 100 km/hr. The flows killed 70 people and left 800 homeless.
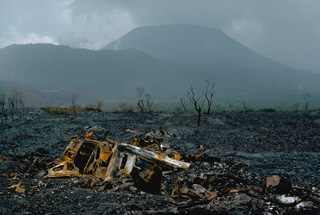 In contrast to the low profile of its neighboring shield volcano, Nyamuragira, 3470-m-high Nyiragongo displays the steep slopes of a stratovolcano. One of Africa's most notable volcanoes, Nyiragongo contained a lava lake in its deep summit crater that was active for half a century before draining suddenly in 1977. This January 1977 photo on the SSE flank shows a vehicle that was overrun by the extremely fluid 1977 lava flows from the draining of the summit lava lake. The older Shaheru stratovolcano appears on the left horizon.
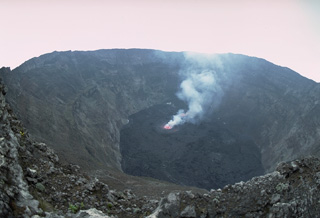 One of Africa's most notable volcanoes, Nyiragongo contained a lava lake in its deep summit crater that was active for half a century before draining suddenly in 1977. This July 23, 1982 photo from the south crater rim shows a small active lava lake surrounded by black lava flows from the new June 1982 lava lake. Narrow benches halfway up the steep-walled, 1.2-km-wide summit crater mark former lava lake levels.
 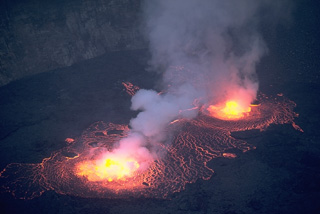 Incandescent lava flows spill across the crater floor from two fountains in an active lava lake on the crater floor of Nyiragongo on 23 July 1982. The lava lake had reappeared on 21 June for the first time since draining suddenly in 1977, leaving a steep-walled, 800-m-deep crater. Nyiragongo is renowned for its long-term lava lakes. Prior to 1977, a lava lake had persisted in the 1.2-km-wide crater for half a century. By the time of this photo, a month after its return to the crater, the lava lake had risen 300 m. It rose another 100 m by 15 September.
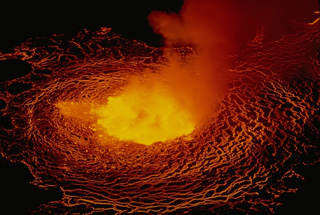 Lava lake activity resumed at the summit crater of Nyiragongo on June 21, 1982, the first eruptive activity since the dramatic draining of the lava lake in 1977. Initial phreatic eruptions were followed by lava flow emission from two vents on the inner crater wall that rapidly formed a lava lake. The lava lake level rose 300 m by July 23 and rose another 100 m by September 15. The lava lake was continuing to expand in October, but no activity was seen at the beginning of November.
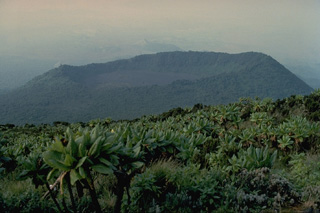 Shaheru is one of two large satellitic volcanoes of Nyiragongo. The summit of the south-flank volcano is capped by a roughly 800-m wide crater. A larger stratovolcano, Baruta, was constructed on the northern flank. These two volcanoes give Nyiragongo a double-shouldered profile.
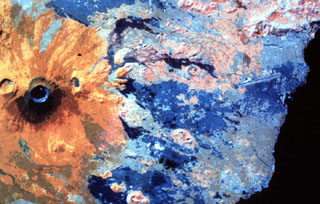 This false-color infrared image shows orange-colored Nyiragongo volcano at the left (north). The crater of the flank cone of Baruta can be seen to the left of the 1-km-wide summit crater. Darker-colored lava flows that mostly erupted from flank fissures extend south (right) to Lake Kivu, and several prominent orange-colored SW-flank scoria cones are visible.
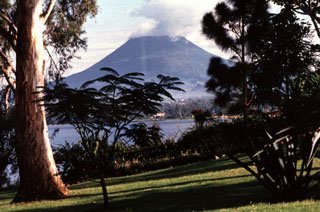 Nyiragongo is seen here from the S across Lake Kivu at Peyer Yard in Rwanda. It contained a lava lake in its deep summit crater that was active for half a century before draining suddenly in 1977. In contrast to the low profile of the nearby Nyamuragira shield volcano, Nyiragongo displays the steep slopes of a stratovolcano. About 100 smaller cones are located primarily along radial fissures east of the summit and along a NE-SW zone extending as far as Lake Kivu.
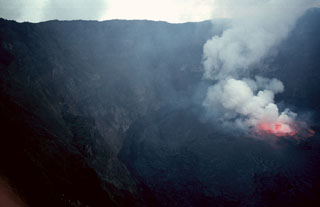 A gas plume rises above lava fountains in a lava lake in the summit crater of Nyiragongo volcano on 20 August 1994. Renewed lava-lake activity began the night of 23-24 June 1994 and continued into the fall of 1996. By August 1995 the surface of the lava lake had risen 50 m.
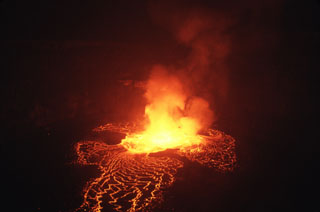 Lava lake activity seen here on 21 August, began the night of 22-23 June 1994. Lava fountain height reached 30-40 m and the lava lake level was 5-10 m below the height of the 1982 lava lake. Lava lake activity continued until at least September 1995, with accumulation of lava on the crater floor from the end of April to mid-August 1995 causing the crater floor level to rise about 50 m. Observers saw nighttime glow from the crater in November 1995 and February-March 1996.
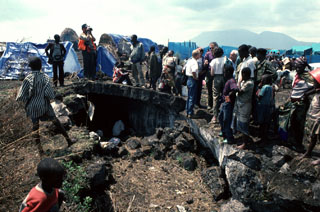 Major humanitarian crises in eastern Africa played out in areas near Nyiragongo and Nyamuragira volcanoes. This August 1994 photo of the Kitumba refugee camp shows a Rwandan family living in a lava tube on a flow on the SW flank of Nyamuragira volcano with tarps of other shelters in the densely occupied refugee camp beyond. Nyiragongo volcano appears on the right skyline.
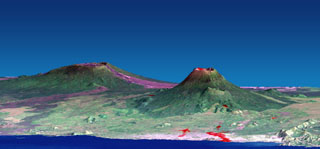 This combined NASA Landsat and Shuttle Radar Topography Mission image shows Nyamuragira (left) and Nyiragongo (right) volcanoes rising north of Lake Kivu in the East African Rift Valley. Red areas on Nyiragongo mark the locations of January 2002 flank-vent lava flows, some of which descended through the city of Goma into Lake Kivu. Historical lavas descend from Nyamuragira shield volcano, some of which also reached the lake. Both volcanoes are truncated by small calderas.
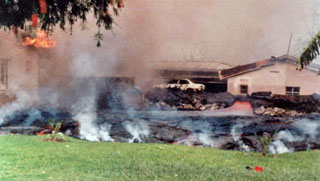 A major effusive eruption from vents on the S flank of Nyiragongo volcano in the Democratic Republic of Congo on 17-18 January 2002 produced lava flows that partially inundated the city of Goma, flowing through city streets before entering into Lake Kivu. This photo shows some of the thin and fast lava flows pouring through a narrow chute (behind the car and in line with the left-most opening in the low wall). An incandescent channel is visible at the right, and gas and steam rise from the advancing front of the lava in the foreground.
The following 35 samples associated with this volcano can be found in the Smithsonian's NMNH Department of Mineral Sciences collections, and may be availble for research (contact the Rock and Ore Collections Manager). Catalog number links will open a window with more information.
| Catalog Number | Sample Description | Lava Source | Collection Date |
|---|---|---|---|
| NMNH 113057-1 | Lava | -- | -- |
| NMNH 113057-2 | Lava | -- | -- |
| NMNH 113057-3 | Lava | -- | -- |
| NMNH 113057-4 | Lava | -- | -- |
| NMNH 113057-5 | Lava | -- | -- |
| NMNH 113057-6 | Lava | -- | -- |
| NMNH 115693 | Volcanic Glass | -- | -- |
| NMNH 116623 | Glassy Lava | -- | 20 Aug 1994 |
| NMNH 116624 | Glassy Lava | SUHERU CONE VENT | 10 Jan 1977 |
| NMNH 116691-20 | Melilite Nephelinite | -- | 1 Jul 1982 |
| NMNH 116691-22 | Melilite Nephelinite | -- | -- |
| NMNH 116691-28 | Melilite Nephelinite | -- | 1 Jul 1982 |
| NMNH 117251-184 | Bergalite | -- | -- |
| NMNH 117251-196 | Rushayite | Rutoke Cone | -- |
| NMNH 117251-197 | Rushayite | Rushayo Cone | -- |
| NMNH 117251-250 | Melilite-Nephelinite | Main Vent | -- |
| NMNH 117251-251 | Melilite-Nephelinite | Main Vent | -- |
| NMNH 117251-372 | Kalsilite-Melilite Basalt | -- | -- |
| NMNH 117251-373 | Kalsilite-Melilite Basalt | -- | -- |
| NMNH 117251-94 | Melilite | -- | -- |
| NMNH 117578-1 | Basalt | Kinyunzo | -- |
| NMNH 117578-11 | Lava | -- | -- |
| NMNH 117578-2 | Basalt | Muya Cone | -- |
| NMNH 117578-3 | Basalt | Nyamushwa | -- |
| NMNH 117578-4 | Basalt | Nyamushwa cone | -- |
| NMNH 117578-6 | Scoria | Nyira | -- |
| NMNH 117578-7 | Scoria | Nyira | -- |
| NMNH 117578-8 | Scoria | Nyira | -- |
| NMNH 117578-9 | Basalt | -- | -- |
| NMNH 118148-34 | Olivine-Melilite Nephelinite | -- | -- |
| NMNH 118148-35 | Olivine Leucitite | -- | -- |
| NMNH 118148-36 | Olivine-Melilite Nephelinite | -- | -- |
| NMNH 118148-37 | Olivine-Nephelinite | -- | -- |
| NMNH 118148-38 | Olivine-Leucite Nephelinite | -- | -- |
| NMNH 134766-00 | Melilite | -- | -- |
| Copernicus Browser | The Copernicus Browser replaced the Sentinel Hub Playground browser in 2023, to provide access to Earth observation archives from the Copernicus Data Space Ecosystem, the main distribution platform for data from the EU Copernicus missions. |
| MIROVA | Middle InfraRed Observation of Volcanic Activity (MIROVA) is a near real time volcanic hot-spot detection system based on the analysis of MODIS (Moderate Resolution Imaging Spectroradiometer) data. In particular, MIROVA uses the Middle InfraRed Radiation (MIR), measured over target volcanoes, in order to detect, locate and measure the heat radiation sourced from volcanic activity. |
| MODVOLC Thermal Alerts | Using infrared satellite Moderate Resolution Imaging Spectroradiometer (MODIS) data, scientists at the Hawai'i Institute of Geophysics and Planetology, University of Hawai'i, developed an automated system called MODVOLC to map thermal hot-spots in near real time. For each MODIS image, the algorithm automatically scans each 1 km pixel within it to check for high-temperature hot-spots. When one is found the date, time, location, and intensity are recorded. MODIS looks at every square km of the Earth every 48 hours, once during the day and once during the night, and the presence of two MODIS sensors in space allows at least four hot-spot observations every two days. Each day updated global maps are compiled to display the locations of all hot spots detected in the previous 24 hours. There is a drop-down list with volcano names which allow users to 'zoom-in' and examine the distribution of hot-spots at a variety of spatial scales. |
|
WOVOdat
Single Volcano View Temporal Evolution of Unrest Side by Side Volcanoes |
WOVOdat is a database of volcanic unrest; instrumentally and visually recorded changes in seismicity, ground deformation, gas emission, and other parameters from their normal baselines. It is sponsored by the World Organization of Volcano Observatories (WOVO) and presently hosted at the Earth Observatory of Singapore.
GVMID Data on Volcano Monitoring Infrastructure The Global Volcano Monitoring Infrastructure Database GVMID, is aimed at documenting and improving capabilities of volcano monitoring from the ground and space. GVMID should provide a snapshot and baseline view of the techniques and instrumentation that are in place at various volcanoes, which can be use by volcano observatories as reference to setup new monitoring system or improving networks at a specific volcano. These data will allow identification of what monitoring gaps exist, which can be then targeted by remote sensing infrastructure and future instrument deployments. |
| Volcanic Hazard Maps | The IAVCEI Commission on Volcanic Hazards and Risk has a Volcanic Hazard Maps database designed to serve as a resource for hazard mappers (or other interested parties) to explore how common issues in hazard map development have been addressed at different volcanoes, in different countries, for different hazards, and for different intended audiences. In addition to the comprehensive, searchable Volcanic Hazard Maps Database, this website contains information about diversity of volcanic hazard maps, illustrated using examples from the database. This site is for educational purposes related to volcanic hazard maps. Hazard maps found on this website should not be used for emergency purposes. For the most recent, official hazard map for a particular volcano, please seek out the proper institutional authorities on the matter. |
| IRIS seismic stations/networks | Incorporated Research Institutions for Seismology (IRIS) Data Services map showing the location of seismic stations from all available networks (permanent or temporary) within a radius of 0.18° (about 20 km at mid-latitudes) from the given location of Nyiragongo. Users can customize a variety of filters and options in the left panel. Note that if there are no stations are known the map will default to show the entire world with a "No data matched request" error notice. |
| UNAVCO GPS/GNSS stations | Geodetic Data Services map from UNAVCO showing the location of GPS/GNSS stations from all available networks (permanent or temporary) within a radius of 20 km from the given location of Nyiragongo. Users can customize the data search based on station or network names, location, and time window. Requires Adobe Flash Player. |
| DECADE Data | The DECADE portal, still in the developmental stage, serves as an example of the proposed interoperability between The Smithsonian Institution's Global Volcanism Program, the Mapping Gas Emissions (MaGa) Database, and the EarthChem Geochemical Portal. The Deep Earth Carbon Degassing (DECADE) initiative seeks to use new and established technologies to determine accurate global fluxes of volcanic CO2 to the atmosphere, but installing CO2 monitoring networks on 20 of the world's 150 most actively degassing volcanoes. The group uses related laboratory-based studies (direct gas sampling and analysis, melt inclusions) to provide new data for direct degassing of deep earth carbon to the atmosphere. |
| Large Eruptions of Nyiragongo | Information about large Quaternary eruptions (VEI >= 4) is cataloged in the Large Magnitude Explosive Volcanic Eruptions (LaMEVE) database of the Volcano Global Risk Identification and Analysis Project (VOGRIPA). |
| EarthChem | EarthChem develops and maintains databases, software, and services that support the preservation, discovery, access and analysis of geochemical data, and facilitate their integration with the broad array of other available earth science parameters. EarthChem is operated by a joint team of disciplinary scientists, data scientists, data managers and information technology developers who are part of the NSF-funded data facility Integrated Earth Data Applications (IEDA). IEDA is a collaborative effort of EarthChem and the Marine Geoscience Data System (MGDS). |

