Based on analyses of satellite imagery and wind data, the Darwin VAAC reported that during 26-27 March ash plumes from Karkar rose to an altitude of 2.4 km (8,000 ft) a.s.l. and drifted almost 50 km ENE and NW.
Source: Darwin Volcanic Ash Advisory Centre (VAAC)
Ash plumes observed by satellites during 2012-2014
Plumes were recognized from Karkar volcano in early December 2009 and during February 2010, but it was ambiguous whether these were ash-bearing plumes (BGVN 35:05). Based on analyses of satellite imagery and wind data, the Darwin VAAC reported at least three periods with ash plumes during February 2012, January-March 2013, and March 2014 (table 1).
The 2012 plume noted during the early morning of 1 February (31 January UTC) was described as a "possible" ash plume as high as 10.7 km altitude by the VAAC, but was still seen in imagery about 6 hours later before being obscured by meteorological clouds. The 2013 activity consisted of plumes on three days across about six weeks, with the highest reaching 9.1 km altitude in late February. A low-level plume erupted mid-day on 26 March 2014 was also noted in imagery the following day. No other activity had been reported through May 2015.
Table 1. Volcanic plumes at Karkar observed in satellite imagery by Darwin VAAC, 2012-2015.
| Date | Event | Altitude (km) | Height (km) | Drift |
| 1 Feb 2012 | Ash plume (possible) | 7.6-10.7 | 5.8-8.9 | NE, E |
| 29 Jan 2013 | Ash plume | 4.3 | 2.5 | 40 km NE |
| 26 Feb 2013 | Ash plume | 9.1 | 7.3 | Not reported |
| 15 Mar 2013 | Ash plume | 8.5 | 6.7 | 75 km N, 130 km E |
| 26-27 Mar 2014 | Ash plumes | 2.4 | 0.6 | ~50 km ENE to NW |
Information Contacts: Darwin Volcanic Ash Advisory Centre (VAAC), Bureau of Meteorology, Northern Territory Regional Office, PO Box 40050, Casuarina, NT 0811, Australia (URL: http://www.bom.gov.au/info/vaac/).
2014: March
2013: January
| February
| March
2012: February
2009: November
2008: January
Based on analyses of satellite imagery and wind data, the Darwin VAAC reported that during 26-27 March ash plumes from Karkar rose to an altitude of 2.4 km (8,000 ft) a.s.l. and drifted almost 50 km ENE and NW.
Source: Darwin Volcanic Ash Advisory Centre (VAAC)
Based on analyses of satellite imagery and wind data, the Darwin VAAC reported that on [15 March] an ash plume from Karkar rose to an altitude of 8.5 km (28,000 ft) a.s.l. and drifted 75 km N and 130 km E.
Source: Darwin Volcanic Ash Advisory Centre (VAAC)
Based on analyses of satellite imagery and wind data, the Darwin VAAC reported that on 26 February an ash plume from Karkar rose to an altitude of 9.1 km (30,000 ft) a.s.l.
Source: Darwin Volcanic Ash Advisory Centre (VAAC)
Based on analyses of satellite imagery and wind data analyses, the Darwin VAAC reported that on 29 January an ash plume from Karkar rose to an altitude of 4.3 km (14,000 ft) a.s.l. and drifted less than 40 km NE.
Source: Darwin Volcanic Ash Advisory Centre (VAAC)
Based on analyses of satellite imagery, the Darwin VAAC reported that a possible ash plume from Karkar rose to altitudes of 7.6-10.7 km (25,000-35,000 ft) a.s.l. and drifted NE and E on 1 February.
Source: Darwin Volcanic Ash Advisory Centre (VAAC)
Based on analyses of satellite imagery, the Darwin VAAC reported that an eruption from Karkar on 25 November produced a plume that rose to an altitude of 13.7 km (45,000 ft) a.s.l. The report also stated that ash had merged with a thunderstorm cloud and had become unidentifiable. Another ash plume identified on 26 November rose to an altitude of 9.1 km (30,000 ft) a.s.l. Confirmation of ash emissions was not available from RVO at the time of the posting of this report. [Note: Further analyses revealed that an eruption had not occurred. Additional information received by RVO indicated dead vegetation S of the active crater (similar observations were made in 2007) and a few new "holes" in the crater area.]
Source: Darwin Volcanic Ash Advisory Centre (VAAC)
RVO reported that white vapor emissions from the Bagiai cone in Karkar's inner caldera were observed by a visiting field team during 27-31 December. The resultant white vapor plume was also visible from the mainland. Communities to the W and SW reported hearing roaring noises associated with gas emissions. Images sent to RVO on 11 December indicated that the vegetation on the SE flank was completely withered.
Source: Rabaul Volcano Observatory (RVO)
Reports are organized chronologically and indexed below by Month/Year (Publication Volume:Number), and include a one-line summary. Click on the index link or scroll down to read the reports.
Mild Strombolian eruption is the first since 1895
Card 1801 (19 February 1974) Mild Strombolian eruption is the first since 1895
R. Cooke reported the following . . . via cable. "Bagiai cone . . . has commenced a mild Strombolian eruption. This is the first known activity since 1895. The earliest known eruptive phenomena occurred on . . . 14 February. Aerial examination by volcanologists on . . . 17 February showed small-scale jetting of glowing lava fragments from a small vent between the two main Bagiai craters. Sluggish grey lava, glowing near the source, issued near the base of the cone. Minor ejections of black ash accompanied some lava jets. There is no present of likely future danger to populations. Volcanological parties are expected to have established an observation post at the caldera rim by . . . 19 February." [Activity continued until 8 August 1974.]
Information Contacts: R.S.J. Cooke, Volcanological Observatory, Rabaul, Papua New Guinea.
Moderate ash ejections and lava flows from Bagiai Cone
Card 2056 (21 January 1975) Moderate ash ejections and lava flows from Bagiai Cone
Renewal of activity from Bagiai cone . . . was reported to the Volcanological Observatory on 5 January 1975. An aerial inspection confirmed that the activity consisted of moderate ejections of ash up to 60 m above the summit of the cone. A few days later the pattern of activity developed towards a mild Strombolian mode with lava jetting from a new vent on the W side of the cone and a small lava stream emerging from a fissure at the base of the cone. The type of activity to date is similar to that observed during 1974. In 1974 the Bagiai cone erupted on 19 February and activity continued until 8 August.
Information Contacts: D.A. Wallace, Volcanological Observatory, Rabaul, Papua New Guinea.
Volcanic tremor and new thermal activity; explosion sounds and glow
"Unusual periodic bands of seismic noise were first recorded at Karkar Observatory on 10 July, and continued virtually unchanged until mid-August, when the amplitude began to increase slowly (figure 1). A strong increase in amplitude took place on 28 August, but after a time of relatively steady level a slight decline has occurred since mid-September. The volcanic tremor at its peak was almost as strong as during the peaks of the 1974 and 1975 eruptions.
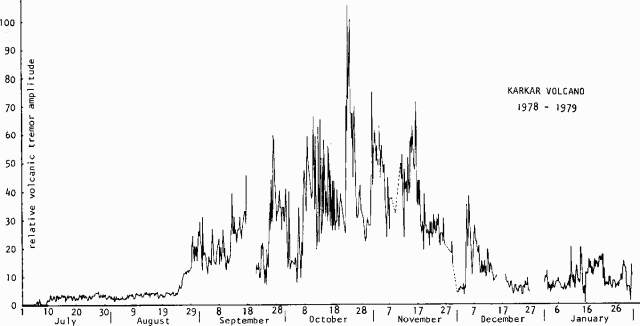 |
Figure 1. Graph showing the relative amplitude of volcanic tremor at Karkar, 1 July 1978-31 January 1979. For the most part, the amplitude is from the periodic stronger bands of tremor. Courtesy of C.O. McKee. |
"Investigations with a portable seismograph during August determined that the seismicity originated near the center of the island. Minor explosive sounds may have been heard on 25 August and possible minor ash was observed in the normal vapor column on 30 August. An extensive new area of thermal activity was noted on 31 August, but it is not clear when this commenced. Karkar residents were first advised on 4 September that an eruption was forecast. On 27 September, Karkar's activity increased. Red glow was observed and explosion sounds were heard, but no major eruption occurred."
Information Contacts: R. Cooke, RVO.
Explosion sounds; new incandescent area; increasing seismicity
Activity continued to increase, but no major eruption had occurred by 30 October. Incandescence, first observed 27 September, has been visible each night since then in an area about 20 m in diameter at the SE foot on Bagiai Cone (in the W part of the caldera). Temperatures of 750-850°C in the incandescent area were measured by optical pyrometer (figure 2). The nature of the incandescent area was uncertain, but it did not appear to be newly extruded lava.
 |
Figure 2. Map of Karkar Island after C.O. McKee and others (1979) showing recording stations. |
The explosion sounds reported on 27 September are of uncertain origin, but volcanic explosions were frequently heard in mid-October. At the end of October, a voluminous column of white vapor was rising from the flank of Bagiai Cone and from the SE part of the caldera floor, and some blue vapor was issuing from the incandescent area. After 27 September, periods of nearly continuous tremor were felt on many occasions at an observation post 2 km from the volcano. Recorded seismic activity reached its highest level at the end of October.
Information Contacts: R. Cooke, RVO.
Seismicity declines slightly; incandescence and strong vapor emission persist
Strong seismic activity persisted through November. Strongly marked periodic bands on the seismograph records were again evident between the lst and 17th. Tremor was felt at the observation post, 2 km from the volcano, throughout the month. Seismicity began to increase on 10 July (03:9-10), peaked 23 and 24 October, then remained steady or declined slightly 29 October-29 November. Incandescence (first observed 27 September) and strong vapor emission also continued through November.
Information Contacts: R. Cooke, RVO.
Seismicity declines, but incandescence and strong vapor emission continue
Strong volcano-seismic activity persisted in December, but with lower intensity than in November. After 19 November, periodic banding of stronger and weaker seismicity became indistinct and at times almost nonexistent. Incandescence and strong vapor emission continued, and brief sharp explosion sounds were heard on several days.
Information Contacts: C. McKee, RVO.
10-day ash eruption, after 6 months of seismicity
"An eruption commenced from a new crater late 12 or early 13 January. The crater was on the floor of the inner caldera, SE of Bagiai cone, very close to but not precisely at the previously reported incandescent zone. Thick but fairly light-colored ash clouds were erupted continuously for about 10 days from the new crater, which was 100-150 m in diameter. Eruptive activity ceased about 22-23 January and a voluminous column of white vapour has been emitted from the new crater since then, although possible very light ash content was reported on the 30th. A temporary observation post (established in early September and occupied continuously since then in expectation of the eruption) was in operation throughout the month, but observations have been severely hampered by heavy monsoon weather and the precise times of commencement and cessation are not known.
"The commencement of the eruption was not marked by any unusual events, audible or instrumental. Volcano-seismic activity continued at a moderately high level throughout January, although it was considerably weaker than the peak activity of October-November. The eruption was not marked by any distinctive volcano-seismic features. Periodic stronger and weaker phases of ash emission corresponded with banding on seismic records, similar to that previously reported. At times of stronger ash ejection, flashing arcs were often seen at a rate of several per second, but noises were not prominent.
"Heavy ashfall blanketed the upper levels of forest on Karkar Island, downwind from the volcano, but ashfall was light in inhabited and cultivated areas and there was no significant damage reported. Fouling of streams by ash has affected water supply in some villages."
Information Contacts: C. McKee, RVO.
Intermittent explosions and steady seismicity continue
During February, four additional phases of heightened eruptive activity took place. Audible explosions ejected ash and rock fragments on 1, 8, 15-16, and 24 February, accompanied by felt earthquakes or periods of felt tremor. Frequent flashing arcs, associated with strong ejections of ash and blocks, were observed 7-9 February. Between the phases of strong activity, Karkar usually emitted moderately dense white vapor with intermittent light ash content, usually accompanied by weak rumbling and roaring.
Since the eruption began on 12 or 13 January, seismic activity has been generally steady, at levels much lower than during the peak of pre-eruptive seismicity in October 1978 (figure 1). Banding of periodic stronger and weaker tremor had been sporadically evident. Discrete (B-type) seismic events began to be recorded in greater numbers during the second half of February.
Information Contacts: C. McKee, RVO.
Two volcanologists killed by explosion
We are saddened to report that R.J.S. Cooke, 40, and Elias Ravian, 34, were killed on 8 March by a directed blast of debris from Karkar volcano. Robin Cooke came to Rabaul Volcanological Observatory in 1971 and was named Senior Volcanologist two years later. His contributions to volcanology were many, particularly in seismic monitoring and in generously sharing his reports of local volcanism with scientists of the world. Elias Ravian had been a highly respected worker at the Observatory for 9 years. Both men devoted much of themselves to better understanding of the volcanism that took their lives.
The following is from a report by Richard Almond. Seismic activity at the caldera rim camp, about 1.2 km from the vent (figure 2), decreased slightly 1-2 March, then remained at a relatively low level through the 4th. Dense billows of white vapor from the vent were accompanied by occasional mild ash ejections on 1 March, but there was little or no ash emission 2-4 March. Seismicity increased gradually 5-7 March, but only one weak ash ejection, on the 5th, accompanied the continuing dense vapor emission.
At 0125 on 8 March, most of Karkar Island's 23,000 residents were awakened by the sound of a strong eruption. Continuous ejections of dense ash blanketed the W side of the island, where there were heavy ash and scoria falls for 45-60 minutes. Ash and blocks were scattered over the caldera floor. Accompanying the vertical eruption was a blast of hot gas and ejecta directed towards the SE. The blast devastated the entire SE quadrant of the caldera rim, killing Cooke and Ravian, who were camped near the S rim. Ash ejection, as observed from the coast, continued at a reduced level throughout 8 and 9 March. Seismic activity increased slightly during the major eruption, then decreased markedly.
Poor weather prevented observations on 10 and 11 March. From 12 to 16 March, aerial inspections revealed continuous emission of light brown ash from the NW portion of the vent, which had been enlarged by the 8 March eruption from 75 m to 300 m in diameter, and was about 150 m deep. Density of ash emission increased towards the end of the period,
On the 17th, emissions had changed to white vapor containing very little ash. Background seismicity was relatively low, but there were numerous discrete events, probably B-type. These had ceased by 0200 on the 18th and there was little or no vapor or ash. The source of previous emissions was then clearly visible; a cavern at the bottom of the crater extending in a NW direction beneath Bagiai Cone. There was a strong H2S smell when flying downwind of the volcano, even several kilometers from the vent. On 19 and 20 March, helicopter inspection revealed strong jets of vapor being emitted from the cavern with an extremely loud, continuous roaring noise. The angle of ejection was about 30° from the horizontal and toward the SE. These conditions continued until the morning of the 23rd, when a grey ash column was observed rising vertically from the vent. The ash cloud streamed to about 15 km SW of the island. Moderate ash emission continued through the end of March, accompanied by a moderately high level of harmonic tremor and periods of occasional B-type events.
McKee and others (1976) note that Bagiai "seems to have been the main source of recent activity, and was the source of the 1974 and 1975 eruptions".
Reference. McKee, C.O., Cooke, R.J.S., and Wallace, D.A., 1976, The 1974-75 eruptions of Karkar volcano, Papua New Guinea, in Johnson, R.W. (ed.), Volcanism in Australasia: Elsevier, p. 173-190.
Information Contacts: R. Almond and C. McKee, RVO.
New crater lake; ash eruptions continue
"Activity fluctuated during April, but was generally weaker than in March. Strong grey ash emission occurred more or less continuously 7-18 April. Tightly convoluted ash clouds rose to several hundred meters above the vent. The ash plume reached as much as 30 km downwind (mainly eastward) on some days. Ashfalls early in the month were heavy enough at times to prevent work on plantations and village gardens on the E side of the island. The ash changed in dominant color from grey and brownish-grey to black around 18 April. [Patches of incandescent rocks] were observed inside the crater on 10 April and intermittently since that time.
"A churning, steaming, brown-colored lake was first observed 23 April in the bottom of the new explosion crater, which opened on 12 or 13 January to about 75 m in diameter and greatly enlarged, to about 300-400 m in diameter, in the fatal explosions of 8 March. Eruptions occurred through this lake, producing black ash ejections reminiscent of shallow marine volcanic explosions. Most had insufficient energy to leave the estimated 150-200 m-deep crater except on rare occasions, when a few blocks fell near but outside the crater. Lake level appeared to fluctuate greatly. Although clearly visible on 23 April, the lake was not visible the next day, following a period of heavy black ash emission, probably during the night, that deposited about a centimeter of ash on the SW side of the crater. Sounds at the crater edge during subaqueous explosions were like those of some geysers, and were accompanied by a tinkling noise probably produced by fallback. Aerial inspection on 28 April revealed very large black ash emissions to 200 m above the crater rim, with some blocks falling outside the crater. Frequency of explosions was nearly continuous, every second or less.
"Seismic activity consisted of irregular distinct periods of strong tremor l-14 April. From 15 April, seismic activity consisted of steady low-amplitude tremor, with a few distinct B-type shocks on most days. Gravity stations were established on 13 April [in an effort to detect any possible subsurface mass changes or elevation changes]. Twelve remeasurements were made during the month. Three stations are on the caldera floor, two on the rim, three on the mid-flanks, and four along the coast. The measurements indicated that no major [subsurface mass changes], rapid uplift, or subsidence of the caldera floor was occurring. The sensitivity of these measurements is estimated at ±10 cm [for elevation changes]. Between 18 and 22 April, four dry tilt stations were installed, one on the caldera rim, one on the coast, and two at intermediate points. As of the end of April, relevelling of these had not revealed significant changes in tilt."
Information Contacts: C. McKee, RVO; W. Melson, SI, Washington DC.
Strong ash eruption deposits 1 cm of ash on W coast
"The eruption continued through May, strengthening considerably at the end of the month. At 1900 on the 30th, following reports of heavy ash eruption during the day, Civil Defence and government authorities were informed that activity had intensified by the declaration of an alert. No other action is to be taken at this stage.
"A trend of increasing activity began on 6 May, and from the 16th, significantly stronger activity persisted. White vapours crowned the summit until 22 May, forming a column about 1 km high. Grey emissions began to color the base of this column on the 7th. Much stronger activity occurred on the 16th and 17th when heavy ashfalls took place in the summit region and light ash deposits (less than 1 mm) were registered at the NW coast. At this time, convoluted grey ash clouds were rising from the crater.
"During the evening of 19 May a period of about 30 minutes of strong volcanic tremor was recorded. It was discovered during an aerial inspection of the crater on the 20th that 5 new vents had opened. Mixed activity was observed, ranging from steady, convoluted, pale grey ash and vapour emission, to continuous black ash jets, to frequent Surtseyan ash and vapour projections from vents in a shallow lake. Activity continued in a similar fashion over the next few days with variable numbers of vents active.
"On the 24th, a new higher level of activity commenced. Ash emissions were markedly more voluminous, resulting at times in the formation of an ash haze in the caldera. A plume of ash driven by the wind stretched out about 10-15 km from the summit. Ashfalls were heavy in the summit region but only light at the W and NW coasts.
"Similar activity persisted through the remainder of the month, but on 30 May much denser ash emission took place, resulting in moderate to heavy ashfalls on the lower W flanks. An ash plume 50-60 km long formed W of Karkar. At one village 2 km from the W coast an ash deposit 1 cm thick was measured on the morning of the 31st. Severe damage to vegetation was reported from W coast areas.
"During the last week of May the stronger ash eruptions were accompanied by a higher level of seismic activity, and explosive sounds were heard at villages on the lower W flanks. However, levels of volcanic tremor remained relatively low compared with pre-eruptive seismic activity in 1978. Discrete volcanic earthquakes were registered on most days in May.
"The crater lake, which had been observed intermittently since 23 April, has not been seen since 22 May. Rapid infilling of the crater with ejecta began on 24 May. On 31 May part of Bagiai Cone collapsed into the crater, reducing its depth by about 60 m to an estimated 50-80 m.
"A program of gravity measurements which commenced on 13 April has shown a trend of steadily increasing gravity values at the three stations on the caldera floor. The gravity change averaged 0.03 mgal. None of the other stations, situated at coastal, mid-flank, and summit locations, showed any trends. This suggests that the causative agent is spatially restricted to the environs of the inner caldera. Levelling measurements at four dry tilt stations spread from the coast to the inner caldera rim showed no evidence of flank deformation. It is uncertain at present whether gravity effects are caused by elevation changes of the caldera floor relative to the rest of the volcano, or to a change in the density structure of the volcano.
"Copious volumes of muddy water have been observed flowing off the slopes of Bagiai on several days since 13 May, and mudflows on parts of the caldera floor have blanketed underlying lava flows. When smaller, similar streams of water were running off Bagiai in April, it was considered that this was condensation from the emission cloud. However, the large volume of liquid observed on several days in late May suggests that the source in this case may be springs."
Information Contacts: C. McKee, RVO.
Heavy ashfall in W summit area; seismicity reaches highest level of 1979
"Through most of June, a moderate-sized white vapour plume stood over the summit. This plume was usually 1-2 km long and rose 0.5 km above the crater. Surtseyan-like explosions of dark ejecta and vapours were seen from several vents in the crater floor on most days. These explosions were mainly contained within the 1979 crater, which now has horizontal dimensions of 450 x 300 m and is 300 m deep. The crater was significantly enlarged by the strong explosions at the end of May and beginning of June. Other periods of moderate to strong activity occurred on 8, 17, and 23 June. At these times continuous grey ash emissions formed an ash plume stretching for several kilometers, and heavy ashfall occurred on the W part of the summit region. Explosive sounds from the summit were heard on the W flank and coast during the stronger activity. Flashing arcs were seen on 16, 18, and 22 June. Horizontally moving ground-hugging clouds were seen advancing slowly from the crater rim in late May and early June, and on 23 June. Thin lobe-shaped deposits of ash about 100-200 m long were formed by the ash clouds on the W rim of the crater on 23 June. A pond of grey water was briefly visible in the bottom of the crater after the strong explosions. Sulfur deposits were present for several days after 20 June on the N and S walls of the 1979 crater, on the summit of Bagiai Cone, and on a small part of the W floor of the caldera, but these were obliterated by the strong ash eruptions of 23 June.
"A significant intensification of seismic activity commenced in mid- or late May and reached the highest sustained level for the year at mid-June."
Information Contacts: C. McKee, RVO.
Explosive phases follow heavy rainfall; seismicity declines slightly
"For most of July the eruption remained at low intensity. Characteristically, a white vapour plume several kilometers long trailed away from the summit. A sulphurous odour was detected downwind from the new crater during early and late July. A haze of pale blue vapour was formed in the W part of the summit caldera on several days late in July.
"Ponds of grey water occupied the base of the new crater, and dark, Surtseyan-like explosions of solid ejecta, vapour, and water occurred at high frequency. Numerous different explosion sites were observed, although at some only mild intermittent bubbling was taking place.
"Stronger explosive activity occurred on 6, 9, and 15-16 July, when dark clouds of ash and rocks were ejected above the crater rim. Fields of impact craters were formed on the caldera floor to distances of several hundred meters from the rim of the crater. Most of the ash in these ejections fell in the W summit region, but weak ashfalls at the coast on 15 and 16 July were reported. An association between these explosive phases and prior heavy rainfalls is evident.
"The intensity of volcano-seismic activity declined slightly from the higher June level. Discrete volcanic earthquakes were recorded on many days, and bands of strong tremor were evident on a few days.
"Gravity and tilt measurements are continuing. Several caldera floor gravity stations have been irretrievably lost because of ashfalls and mudflows. A trend towards increasing gravity values on the caldera floor seems to have ceased, and two stations on the caldera rim are now showing values lower by a few hundredths of a mgal. Of the four tilt stations, only the two caldera rim ones are showing definite trends. These stations, on the S part of the summit, are showing downwards tilting in an approximately NW direction."
Information Contacts: C. McKee, RVO.
Explosions continue
"During the first nine days of August, moderate explosive activity occurred. The heavier solid fragments in dark ejections were contained mainly within the crater, but on the lst blocks rose about 200 m above the crater rim, and some landed on the crater rim. Several vents were active but the most productive were those at the centre and the W extremity of the crater floor. Types of explosive activity, which varied from one vent to another, included frequent dense black convoluting ejections, grey ash-laden vapour emission, streaky black and white jets, and weaker grey-brown ash and vapour emission. Eruption sounds were not loud and ranged from low roaring and rumbling to banging. The emission cloud was usually grey, and sometimes brown, between the lst and 9th. Occasionally it rose to 500-800 m above the crater rim. Ashfalls in this period were largely restricted to the summit and were heaviest on the lst.
"Grey water was seen in a pond in the W extremity of the crater floor on the 4th, and from the 10th a lake covered most of the crater floor. Profuse steaming at the surface of the lake partly obscured the explosive activity. Ejections through the lake occasionally resembled surtseyan blasts, but commonly they only rose several tens of meters above the lake surface and had the appearance of water fountains.
"After the 9th the emission cloud consisted of white vapour in small to moderate volume. Sulphurous odours were noticed around and downwind from the crater for most of the month.
"Direct measurements of the crater on the 24th showed it to be 700 m long and 440 m wide, elongated in the E-W direction. No depth measurement was made but depth is estimated to be 300-400 m."
Further Reference. McKee, C.O., Wallace, D.A., Almond, R.A., and Talai, B., 1981, Fatal hydro-eruption of Karkar volcano in 1979: development of a maar-like crater, in Johnson, R.W. (ed.), Cooke-Ravian Volume of Volcanological Papers: Geological Survey of Papua New Guinea Memoir 10, p. 63-84.
Information Contacts: C. McKee, RVO.
Small explosions through crater lake continue
"The relatively low level of activity at the end of August continued until the end of September. Daily observations by helicopter took place until 12 September. The activity continued to consist of small, black, Surtseyan-like bursts breaking through the surface of the small crater lake. Seismic activity continued at a low level, although slight increases in activity appeared as faint bands in the records, a characteristic of this eruption. Several discrete A-type events occurred. Tilt and gravity observations until 12 September showed no significant changes.
"Continuous surveillance using a helicopter will no longer take place unless activity increases again. Instead, a helicopter will be chartered once every 2 weeks to enable detailed visual observations, and tilt and gravity measurements to be made. Seismic monitoring via the permanent surveillance station and two temporary stations will continue as before."
Information Contacts: R. Almond, RVO.
Small explosions through crater lake continue
"Observations from the Kinim Observatory at the NW coast of Karkar, 11 km from the 1979 crater (figure 2), indicated that no strong explosive activity occurred during October. Usually a small to moderate white vapour cloud crowned the summit.
"Inspection trips were made 12-15 and 26-29 October. Activity in the 1979 crater continued to consist of small, fountain-like ejections of dark material through the crater lake. The sources of ejections define an approximately E-W zone across the centre of the crater floor. Most ejections rose to a maximum of 30 m above the lake surface. Vent diameters are estimated to be 10-20 m. The entire surface of the lake 'steamed' profusely during both inspection visits, and a small to moderate white vapour cloud was produced. Occasionally the vapour cloud rose to 600-800 m above the crater rim. H2S and SO2 gases were detected.
"White and pale yellow sublimates have been deposited strongly on the N crater wall, and areas of mainly white deposits were scattered on the S and W walls. A pink tint was present in some deposits on the N wall. Temperatures in a fumarolic area on the W part of the caldera floor have dropped to 75-83°C, after remaining at 85-96°C between April and August.
"Seismic activity consisted of discrete volcanic events and one or two periods of tremor per hour. The tremor bursts usually lasted 3-4 minutes. Tilt and gravity observations showed no significant changes."
Information Contacts: C. McKee, RVO.
No strong explosions; crater morphology described
"As observed from the Kinim Observatory, no strong explosive activity occurred during November. During inspections of the summit and the crater lake floor on 17 and 18 November, it was found that fountaining of dark muddy water has virtually ceased and that several islands have been formed. The main island was [at the end of a peninsula] joined to the base of the S wall of the crater, and the other island was near the E edge of the lake. Several large boulders were present on the main island and it was bordered by narrow, smooth shores. Orange-brown discolouration was present over the central part of the island. At its N edge a vigorous geyser continuously jetted yellow-tinged water to heights of several tens of meters. The E half of the lake was green and the W half retained the same grey-brown colour seen previously."
Information Contacts: C. McKee, RVO.
Minor activity continues
Minor activity continued through December. No ash explosions have been observed since early August.
Information Contacts: R. Almond, RVO.
Possible weak ash emissions
"Observations from the Kinim Observatory at the NW coast of Karkar indicated that no strong explosive activity occurred during January. Unconfirmed reports were received of weak ash emissions on 7 and 17 January.
"During a summit inspection 28 January, the lake was of a uniform light grey/brown colour, and there was no sign of the peninsula reported in November and December. Convection was occurring in the lake. Fumarolic activity on Bagiai Cone and on the SE part of the caldera floor was extensive but fumaroles were not strong and vapour was emitted under low pressure.
"Gravity observations on 27 and 28 January indicated increased values at stations on the flanks and summit, a reversal of previous trends. Tilt observations for the same period are incomplete. The new gravity trend may be interpreted as deflation, and an indication that the eruption is over. However, a further round of measurements will be required to confirm this."
Information Contacts: B. Scott and C. McKee, RVO.
Phreatic explosions followed by shrinking crater lake
"Observations from Kinim Observatory indicated only weak white vapour emission during March. Inspections of crater activity on 11, 12, and 24 March indicated that phreatic explosions were continuing from several sources in the lake occupying the 1979 crater. These events, occurring at intervals of a few minutes on 11 March, involved updoming of the lake surface and projection of spear-headed columns of dark crater-floor mud to heights of about 20 m. The lake, occupying the W half of the crater floor, was a uniform pale brown colour, and steam emission from the lake surface was profuse. Fumarolic activity from the walls of the crater continued unchanged, but fumaroles on Bagiai Cone and the caldera floor were weaker. The E crater margin had migrated 3-5 m by collapse of the crater wall, leaving a near-vertical escarpment.
"No changes were observed in summit emissions in April. An aerial inspection on 26 April revealed that only a small pond remained in the base of the 1979 crater, on its W side. About 6 closely spaced vents on the crater floor were releasing white emissions under low to moderate pressure. The floor of the crater was flat and smooth. From the air, white sublimates on the E wall of the crater appeared quite conspicuous. Fumaroles on the caldera floor continued to show weak activity, but those on Bagiai may have strengthened since late March.
"Gravity measurements in March suggested that a deflationary trend indicated in January had eased. Seismic activity continued to show discrete events and traces of tremor recorded as irregular bands through April.
Information Contacts: C. McKee, RVO.
Weak eruptions through crater lake; inflation ends
"Summit observations 10 May revealed that a small lake of brown water occupied the NW part of the 1979 crater. Silting had formed a flat crater floor some 300 m square. Near the centre of the crater floor was a circular pool of brown water about 25 m in diameter. Continuous upheavals of vapour, water, and dark crater floor material were observed rising only slightly above the level of the water surface. A line of fumaroles stretched W from this pool. Extensive weak fumarolic activity had deposited white and yellow sublimates over the lower 2/3 of the E crater wall, and diffuse vapour emission on the W side of the crater was slightly stronger. Vapour emission continued from sources on Bagiai Cone. Weak fumaroles extended in a line from the crater to the S caldera wall, and several others on the SW caldera floor were also observed.
"Gravity observations between 9 and 11 May were similar to previous sets in 1980, and suggested a cessation of inflation of the upper part of the volcano. Dry tilt observations seemed to agree with this trend. Seismic activity remained unchanged."
Information Contacts: C. McKee, RVO.
Fumarolic activity continues
"An aerial inspection on 28 June indicated that conditions in the 1979 crater were similar to those during the previous inspection on 10 May. Fumarolic activity on Bagiai Cone may have strengthened since the May inspection, while fumarolic activity on the caldera floor appeared to have weakened over the same time interval. Seismic activity remained unchanged."
Information Contacts: C. McKee, RVO.
Possible ash emission
"Possible ash emissions were reported on 13, 14, and 15 July. However, an aerial inspection on 29 July did not detect any morphological changes to the crater that might have accompanied the reported ash emissions. Fumarolic activity inside the 1979 crater may have increased. Fumaroles on the E part of the caldera floor may have weakened while those on the W side may have intensified. White sublimates were conspicuous on Bagiai Cone. The seismic recording level was unchanged, and the seismic activity continued to consist of small, probably B-type, shocks, and periods of tremor."
Information Contacts: C. McKee, RVO.
Gas emission strengthens
"White vapour continued to be emitted from summit sources. An aerial inspection on 12 August, and aerial and ground inspections on the 14th and 15th, revealed copious white vapour emissions from the E side of Bagiai Cone and from sources on the E part of the caldera floor. These sources are believed to be stronger than they were at the time of the previous inspections (May 1980). Conditions inside the 1979 crater were similar to those in May. A descent was made into the crater and its depth was measured at 150 m. Silting of the crater floor has resulted in a flat floor consisting of coarse sandy sediment and some small boulders. Ejections of dark, sediment-rich water to heights of about 0.4 m were taking place over the entire surface of a pool of water at the centre of the crater floor. Vigorous gas ebullition was occurring from the muddy area immediately surrounding the pool. Numerous fumaroles on the E wall of the crater released vapour under low pressure. No unusual seismic activity was recorded in August and the intensity of the seismicity was unchanged."
Information Contacts: C. McKee, RVO.
New fumarolic vents; seismicity intensifies
"Local observers made four inspections of the summit area 8-13 September. They observed small ejections of crater floor material and water from scattered sources in the previously inactive W pool of water at the base of 1979 crater. Small dark ejections continued from the central pool, but a new gas vent was present on the crater floor nearby. The water in the pools was reported to be yellow on 13 September. Vapours rising from 1979 crater were white, and small to moderate in volume. Seismic activity intensified during September. Single volcanic earthquakes became more numerous early in the month and the tremor level showed a general strengthening at mid-month."
Information Contacts: C. McKee, RVO.
Fumarolic activity
"A transient increase in hydrothermal and fumarolic activity for 2-3 days at the beginning of December coincided with the onset of seasonal heavy rains. Minor geysers were observed on the floor of 1979 crater. There were voluminous emissions of white vapour from a landslide on the Bagiai side of 1979 crater floor. Fumarolic activity was strong on the W side of Bagiai Cone and on the E side of the caldera floor right up to the caldera wall. Weak to moderate vapour emissions at these localities continued for the rest of the month."
Information Contacts: B. Talai and P. Lowenstein, RVO.
Fumarolic activity continues; possible minor deflation
"Aerial and ground inspections were made 6-8 March and other aerial inspections were carried out on 19 and 26 March. Conditions in the caldera appeared similar to those during inspections in November and December 1980. Hydrothermal activity was continuing at the base of the 1979 crater and maximum measured temperatures were 97.5°C. The other main source was on the W part of Bagiai Cone. During the 26 March aerial inspection the volume of emission was reportedly greater than previously observed.
"Gravity measurements and levelling were carried out 6-8 March. The gravity measurements were consistent with previous sets in 1980, and might indicate summit deflation. Levelling up to the end of 1980 showed possible small deflationary trends of several µrad at the 3 mid- and upper-flank tilt arrays. However the changes were very small and similar in size to the limits of error in making the measurements."
Information Contacts: C. McKee, RVO.
New fumaroles and hot springs
"Aerial and ground inspections by volcanologists 18-20 July confirmed local reports that significant development of fumaroles on the W flank of Bagiai Cone has taken place. H2S and SO2 gases were identified in the fumarolic emissions. New hot water springs have been created near Bagiai's summit and on its W flanks. Temperatures in the fumaroles and springs were about 97°C.
"Hydrothermal activity in 1979 Crater has declined. No active mud or water pools were seen in the crater, and only tenuous vapour emission was taking place from sources on the crater floor and walls. Temperatures in fumaroles were about 97°C. Gravity and levelling measurements showed no significant changes. Seismic activity remained steady."
Information Contacts: C. McKee, RVO.
Vegetation returns after 1979 eruption
"Aerial and ground inspections and ground deformation measurements were conducted on 24 and 25 July. Aerial inspection involved photography of the summit calderas while the ground inspection covered the 1979 crater and temperature measurements of fumaroles on Bagiai Cone.
"The 1979 crater presently contains a small, shallow, muddy pool and the base of the crater wall is obscured by talus from rockslides. Erosion of the talus has formed a series of channels radial to the centre of the crater. Although no landing was made on the crater floor, observation from the crater rim, and the presence of rapidly advancing vegetation on most parts of the crater wall and on the crater floor, indicated that there were no active fumaroles in the 1979 crater. Temperatures of 74-85°C were measured at the summit of Bagiai, now almost completely revegetated following denudation during the 1974 and 1979 eruptions. The part of the inner caldera wall that was deforested during the 1979 eruption is now completely covered by regrowth, with some trees as much as 6 m tall. Vegetation is also being re-established on the caldera floor.
"The ground deformation measurements involved reoccupation of four dry tilt stations at the summit and three stations near the coast, relevelling on a 1.3-km line on the inner caldera floor, and measurements on the inner caldera EDM network. In general, the tilt and levelling results indicated deflation of the summit area."
Information Contacts: B. Talai and C. McKee, RVO.
Summit deflation continues
"Ground deformation data obtained in July suggest continuing deflation of the summit area. Deflationary tilt changes of 35-75 µrad are indicated for the period November 1986-July 1989 by a group of stations at Karkar's summit. Data from the levelling line on the floor of the inner caldera indicate subsidence of the central part of the caldera floor relative to the E edge at a rate of ~5 mm/year since 1984.
"Eleven EDM lines were measured on the inner caldera network in July. Comparing these distances with November 1987 values, only four lines showed significant change (>20 ppm). All measurements from E Rim station are shorter than the 1987 values, indicating movement of this station toward the centre of the caldera (average movement ~40 mm NW). S rim station appears also to have moved inwards (by ~44 mm). These changes may be consistent with the subsidence and deflation indicated by levelling and dry tilt measurements."
Information Contacts: I. Itikarai and C. McKee, RVO.
No vapor emission; vegetation re-established
"Karkar was inspected from the air on 3 September. There was no sign of vapour emission from Bagiai cone (the focus of the 1974 and 1975 eruptions), or from the 1979 crater. Vegetation now covers a large proportion of the floor of Karkar's inner caldera (almost completely denuded in the 1979 eruption), and also extends into the 1979 crater."
Information Contacts: C. McKee, RVO.
Weak fumarolic activity; deflation of inner caldera floor
"An inspection and ground deformation measurement were carried out between 2 and 6 November. Weakly active fumaroles were noted at the summit and on the SW flank of Bagiai cone, and at the top of the 1979 crater's W wall. Temperatures at Bagiai's summit ranged between 64.8 and 79.7°C. When last measured (July 1989) the temperature range was 74-84°C. Considerable vegetation regrowth was noted on Bagiai and on the caldera floor and walls.
"The results of dry tilt measurements, compared with results from July 1989, suggest deflation (9-30 µrad) of the floor of the inner caldera. The results from stations on the upper S flank are inconsistent, with one station showing a small component of deflation and the other station showing 20 µrad of inflation. The station on the lower SW flank showed negligible change while the station at the NW coast showed a moderate (but somewhat doubtful) component of deflation. Levelling measurements showed a continuation of progressive deflation of the inner caldera floor. EDM results also indicated deflation of the summit area."
Information Contacts: B. Talai, RVO.
Thermal areas shrink; continued deflation
"An inspection of Karkar was carried out on 8-11 November. Over the last few years, the areas of fumarolic activity have been in recession; the maximum temperature measured during the 1991 survey was 84°C. Cracks up to 10 cm wide had developed across Bagiai cone and seemed related to gravitational instability. This was most noticeable on Bagiai's SE flank, which borders on the 1979 crater.
"EDM and levelling lines and tilt arrays were re-surveyed. The clearest change since the last survey (in November 1990) was shown by the levelling measurements, which indicated a slight (-12 mm) but consistent subsidence in the center of the caldera floor relative to its outer margin. Steady subsidence of the central caldera floor has been recorded over the last 7 years by both levelling measurements and radial tilt vectors (typically -20 µrad/year). Changes along the EDM lines across the summit caldera were inconclusive, as they were within the uncertainty range of the measuring instrument.
"The overall picture gained over the last few years of measurement at Karkar is of a gradual progression into dormancy. As in previous years, vegetation was rapidly being re-established on the caldera floor and walls, on Bagiai cone, and in the crater produced by the 1979 eruption."
Information Contacts: B. Talai and C. McKee, RVO.
Sharp increase in seismicity from mid-May to mid-June
"Minor unrest in May-June affected the pattern of activity recorded at Karkar since the end of its last eruption in 1979. However, there was no visual change in the condition of the caldera (which is now mostly covered with vegetation), and no significant change in the temperatures (<100°C) of the thermal areas remaining on the central cone, Bagiai.
"The local seismograph . . . recorded a large number of emergent low-frequency earthquakes starting on 17 May. This activity was highest during 22-25 May, with >30 events/day, and decayed progressively until mid-June (figure 3). Records from two portable seismographs, deployed in the summit caldera and on the NW flank on 1-2 June, indicated that these events originated from the summit area.
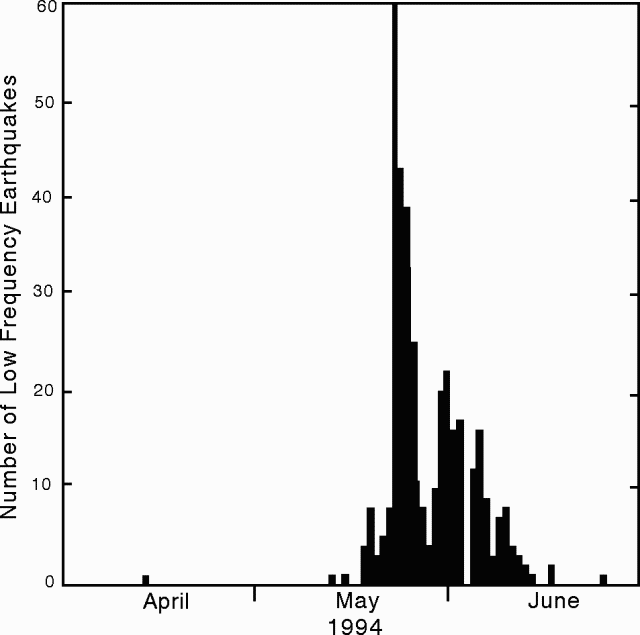 |
Figure 3. Low-frequency earthquakes at Karkar, April-June 1994. Courtesy of RVO. |
"Re-occupation of the leveling and tilt arrays on the floor of the summit caldera showed an interruption in the steady deflationary pattern recorded since 1983 (figure 4). The stations closest to the sites of eruptions in 1974, 1975, and 1979 had been subsiding at a rate of ~10 mm/year. The subsidence appears to have ceased sometime since the previous survey, in November 1993, or to have reversed on the occasion of this recent swarm."
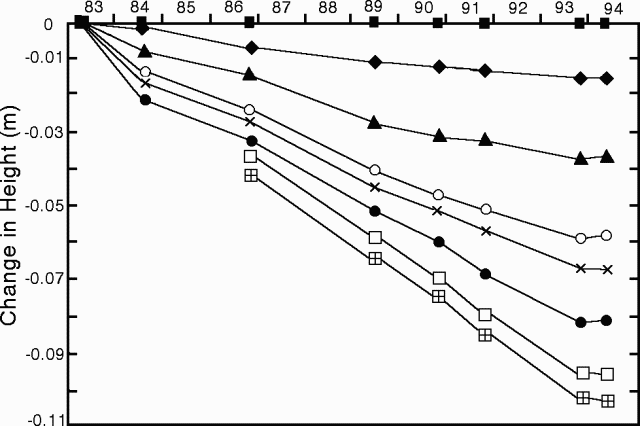 |
Figure 4. Leveling on the inner summit caldera floor at Karkar, 1983-94. Symbols represent benchmarks on a radial leveling line on the E caldera floor. The station indicated by a solid square is near the caldera wall; the open square with a cross represents the station nearest to the center of the caldera. Courtesy of RVO. |
Information Contacts: D. Lolok, R. Stewart, I. Itikarai, P. de Saint-Ours, and C. McKee, RVO.
Second seismic swarm of 1994
"A minor seismic unrest occurred on the morning of 18 October, the second one this year, after 15 years of dormancy at this caldera. The local seismograph recorded a large number of low-frequency events starting at about 0200 on 18 October. Events occurred at a rate of up to 2-4/minute. The activity waned after 0930. Although of short duration, this swarm of events was similar to the unrest recorded between 17 May and mid-June 1994, when the long-term deflation of the caldera floor was interrupted."
Information Contacts: C. McKee and P. de Saint-Ours, RVO.
Fumarolic gas kills downwind vegetation
At the end of September, two level lines and a drytilt array re-established on the floor of the inner caldera of Karkar and two restored drytilt sites at different altitudes on the western flank of the island indicated that no significant deformation had taken place since November 1993.
A small fumarole on the SE of the summit of Bagiai Cone near the rim of the head wall of the 1979 explosion pit has caused vegetation to die in a well-defined downwind swath to the W.
Information Contacts: B. Talai and H. Patia, Rabaul Volcano Observatory (RVO), P.O. Box 386, Rabaul, Papua New Guinea.
Rumored eruption on 29 September believed to stem from Ulawun's ash fall
On 29 September there were reports of light ash fall on the NE coast of Karkar island, and fine sand deposits were found at the bottom of a swimming pool. The ash fall led to the rumor that Karkar volcano had erupted. However, an aerial inspection of the central caldera and Bagiai cone on 1 October showed that no eruptive activity had taken place. Volcanologists believe that the ash most likely originated from an eruption at Ulawun, which, at its peak on 29 September, had an eruption column to 12-15 km altitude. Ash erupted to those heights would have been taken well into the jet stream and could have been transported to Karkar, which is located 600 km to the W (downwind at high altitudes) of Ulawun. There have been no reports of anomalous activity at Karkar since fumarolic gases killed vegetation in September 1997 (BGVN 22:09).
Information Contacts: Ima Itikarai, David Lolok, Herman Patia, and Steve Saunders, Rabaul Volcano Observatory (RVO), P.O. Box 386, Rabaul, Papua New Guinea.
Seismic monitoring of increased fumarolic activity
During late 2007 and continuing into 2008, it became clear the Karkar's vegetation had suffered and seismicity was significant (tens of earthquakes per day). Herman Patia of the Rabaul Volcano Observatory (RVO) reported that the Bagiai cone situated in the inner caldera of Karkar volcano continued to release thin to moderate white vapor while a RVO team was at the volcano from 27-31 December 2007. The white vapor plume was also visible from the mainland. Prior to the visit, communities on the W and SW had heard occasional roaring noises associated with the gas emission from the Bagiai cone. The last Bulletin (BGVN 25:11) discussed light ashfall ultimately attributed to Ulawun. In early November 2007, RVO had reported vegetation die-back and increased fumarolic activity at Bagiai cone on the floor of the inner caldera (figure 5). Latest images sent to RVO by Sir Peter Barter on 11 December 2007 indicated that vegetation on the SE flank had withered completely. According to RVO, the last eruption of Karkar was in 1979.
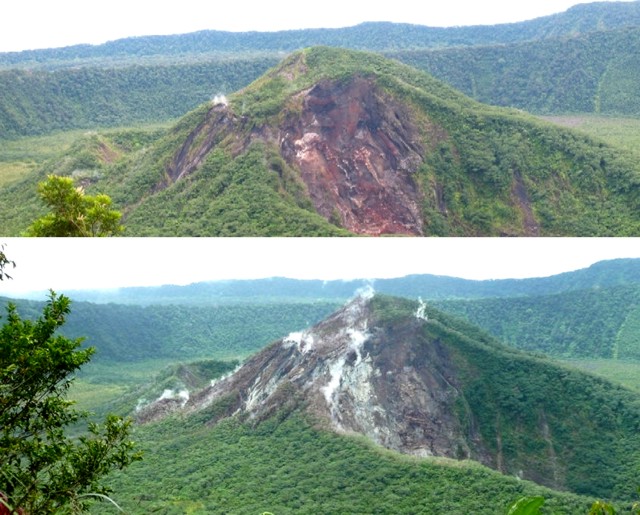 |
Figure 5. Vegetation die-back and increased fumarolic activity on Bagiai cone at Karkar; (top) photo taken early in 2007, (bottom) photo taken during the last week of October 2007. Courtesy of RVO; photos by Paul Goodyear. |
During the team's December visit, they deployed three portable seismic recorders on the NW, SW, and E sides of the island (figure 6, open triangles). Preliminary results indicated a total of 30 high-frequency (HF) earthquakes recorded during the 3 days of deployment. These events were interpreted as indicative of rock-breaking due to magma movement under the volcano. The overall seismicity was low.
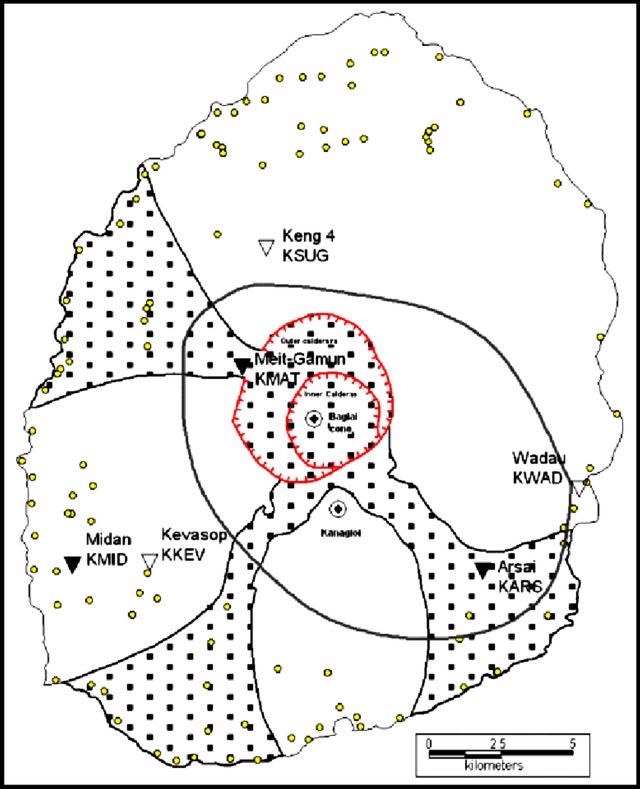 |
Figure 6. A map of the island of Karkar showing morphology. Open triangles indicate seismograph stations during 28-31 December 2007 (KSUG, KWAD, and KKEV). The filled triangles indicate seismograph stations during 24 January-3 February 2008 (KMAT, KARS, and KMID). The outlined oval-shaped region endorses the approximate area where the high-frequency earthquakes had epicenters. The regions decorated with square dots indicate channels, which provide possible pathways for mudflows and pyroclastic flows. Small dots villages, some of which lie within these channels. Courtesy of RVO. |
Bagiai cone continued to release variable volumes of white vapor towards the end of January 2008. A second phase of seismic monitoring at Karkar was carried on from 24 January to 3 February 2008. (figure 6, filled triangles). The closest seismometer to the cone was placed ~ 3 km away Seismic activity was low, dominated by high-frequency earthquakes, but low-frequency earthquakes also occurred. About 15?20 earthquakes were recorded daily during the first 3 days of recording (24-28 January), the earthquakes occurring near Bagiai cone in the center of the inner caldera.
The two phases of seismic monitoring detected both high-frequency volcano-tectonic (VT) earthquakes and low-frequency earthquakes. VT earthquakes were taken to indicate magma intrusion underneath or near Karkar volcano and were detected during the December 2007 deployment by two of the three stations (KWAD and KKEV) on the E and SE side. Station KSUG did not record the HF earthquakes.
The seismic monitor installed about 3 km from Bagiai cone (KMAT), at a spot adjacent to the thermal activity, recorded LF earthquakes as well. LF earthquakes were presumed to be associated with movement of steam and gas and the hydrothermal activity at Bagiai cone.
To provide continuous seismic monitoring at Karkar, on 3 February 2008 a portable seismic recorder was installed 9 km N of the cone. RVO intends to download and analyze the data every 2 months.
For several weeks during late February into early March 2008, RVO scientists visited Karkar to monitor the increased seismic activity first monitored during December 2007. Once again, the group reported that thermal activity from within the cone had caused the vegetation to die and turn brown. On this visit, withered and dry vegetation could be observed on Bagiai's flanks. Seismicity was continuing, but at low levels. On this visit, three portable seismic recorders were deployed close to the summit area on the outer caldera, 3.5 km from Bagiai. They recorded 15-20 volcanic earthquakes per day.
There have been no thermal anomalies measured over Karkar by MODIS instruments since at least the beginning of 2007 through mid-April 2008.
Information Contacts: Herman Patia, Rabaul Volcanological Observatory (RVO), P.O. Box 3386, Kokopo, Papua New Guinea; MODVOLC Hawai'i Institute of Geophysics and Planetology (HIGP) Thermal Alerts System, School of Ocean and Earth Science and Technology (SOEST), Univ. of Hawai'i, 2525 Correa Road, Honolulu, HI 96822, USA (URL: http://modis.higp.hawaii.edu/).
Tall November 2009 plumes from meteorological effects
No information about activity at Karkar has been included in reports from the Rabaul Volcano Observatory (RVO) since December 2007 (BGVN 33:03) when there were roaring noises and gas emissions from the Bagai cone. Ash advisories were issued to aviators on 25-26 November 2009 based on satellite analyses, but ground observers did not see any activity. Later interpretations were that some increased activity from the volcano, but not an explosive eruption, caused the plume formation seen in satellite imagery. Such reports do occur at times due to the limited ability to rapidly communicate with some remote locations, and where operational agencies must issue warnings on short notice for safety reasons.
Satellite observations. The Darwin Volcanic Ash Advisory Center (VAAC) interpreted satellite imagery taken at 1132 (0132 UTC) on 25 November 2009 as showing an ash plume rising to an altitude of 13.7 km before merging with a thunderstorm to the W an hour later (figure 7). Although this activity was not noticed immediately, it was seen during an imagery review later in the day; an ash advisory was issued at 1839 (0839 UTC) and RVO was notified. Another eruption was reported the next morning at 0832 (2232 UTC, 25 November), with an ash plume to 9.1 km altitude, based on analysis of MTSAT-1R satellite data. Meteorological clouds prevented additional observations.
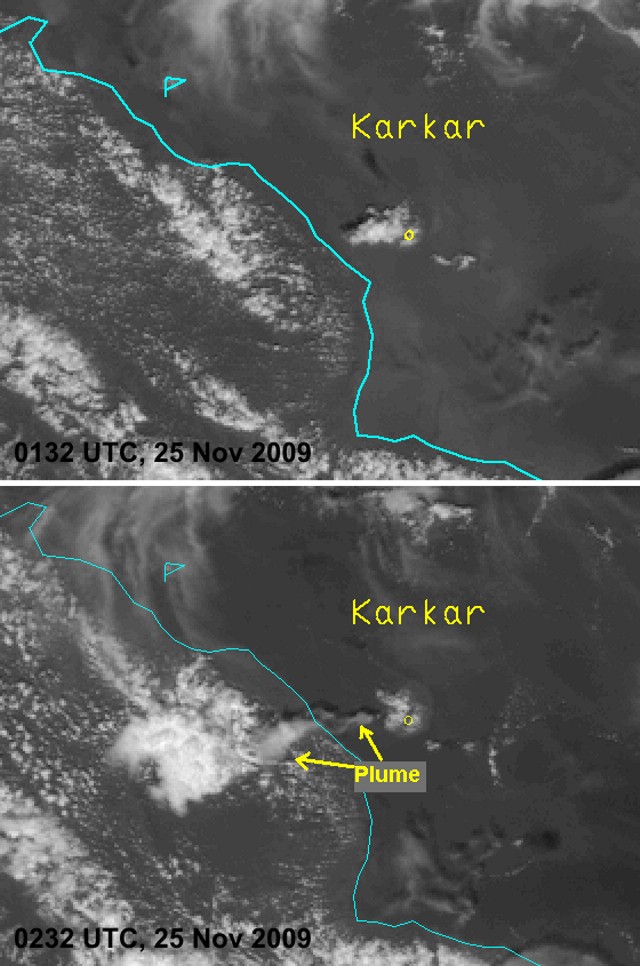 |
Figure 7. Visible satellite imagery of Karkar on 25 November 2009 showing a convective cloud over the volcano at 1132 (0132 UTC), and a plume-like structure W of the island at 1232 (0232 UTC). Satellite image originally processed by the Australian Bureau of Meteorology from the geostationary satellite MTSAT-1R, operated by the Japan Meteorological Agency. Courtesy of the Darwin VAAC. |
Rebecca Patrick and Andrew Tupper provided the following as context for the issuance of an ash advisory in situations like this, as follows: "Explosive eruptions have often occurred in the region with virtually identical satellite signatures, so it is difficult to change VAAC practice and we apologise for any false alarms of highly explosive eruptions. The only way to reduce these without also reducing the probability of detection is to effectively link ground-based monitoring with remote sensing observations, and Darwin and Rabaul have been working cooperatively towards that [end].
"One of the scenarios that Darwin VAAC often deals with is that lower-level volcanic activity is thought to be able to trigger deep meteorological convection in the right moist and conditionally unstable environment, which is present for much of the year in our part of the tropics (deep meteorological convection in the tropics regularly ascends to 15-18 km). The 'volcanic thunderstorms' described by Oswalt and others (1994) following the Pinatubo eruption [where rising heat from the vent and deposits created vertical instability to trigger local storms after the eruption] are the best known example of this and were examined further by Tupper and others (2005, 2009). Depending on the size of the eruption, such clouds may or may not contain measurable amounts of volcanic material.
"Based on the repeated genesis of convection from the summit of Karkar, resulting in the plume-like structure seen on the imagery, the observations kindly relayed by Rabaul Volcano Observatory suggesting mild volcanic activity but no eruption, and analysis of the remote sensing data, we believe the most likely explanation on this occasion is that deep meteorological convection was generated by mild volcanic activity at Karkar, and the clouds created had no measurable ash content."
Ground observations reported by government officials. After being informed by a telephone call from the Darwin VAAC of a possible eruption at Karkar, the Rabaul Volcano Observatory attempted, without success, to obtain confirmation from people on Karkar Island. Communication was established with the District Administrator (DA), who was visiting Madang Town. The DA reported that his family had described no unusual events when he talked to them around 1800 that evening, and instructed one of his officers to inspect around the island later that night.
When reports were received between 0800 and 0900 on the morning of 26 November there was no indication of an eruption; there was no glow, no audible noises, and no reported ashfall. However, that morning a villager in Mom did report seeing dense white to gray vapor in the active crater area. Apparently the volume of vapor had increased almost a week earlier, following a felt earthquake. Additional information received by RVO a couple of days later indicated dead vegetation S of the active crater; similar observations had been made in late 2007. The only unusual observation was a couple of new 'holes' in the crater area, but no clear descriptions of the holes were given.
Ground observations reported by local residents. In a 4 December posting on his blog site, as well as commentary on "The Volcanism Blog" and the "Eruptions" blog, Jan Messersmith provided valuable eye-witness observations from his vantage point in Madang, ~ 60 km SSW of Karkar, where he had a direct view of the volcano from his home. Messersmith had seen no activity, though the volcano was slightly obscured by clouds, after being notified by a friend in Port Moresby that a large ash eruption was reportedly underway. He spoke with friends on the island by telephone on 26 November and they reported no activity. On 28 November Messersmith viewed Karkar from a boat located ~ 50 km from the volcano, but also saw no signs of activity. Nobody in the area was reporting an eruption, despite boats traveling to and from the island.
However, during several weeks in either April or May 2009, Messersmith had seen what appeared to be steam emissions, along with a brownish atmospheric stratification of gas or very fine ash that stretched for many kilometers downwind.
References. Oswalt, J. S., Nichols, W., and O'Hara, J.F., 1996, Meteorological observations of the 1991 Mount Pinatubo eruption, in Fire and Mud: eruptions and lahars of Mount Pinatubo, Philippines, C. G. Newhall and R. S. Punongbayan (eds.): Philippines Institute of Volcanology and Seismology & University of Washington Press, p. 625-636.
Tupper, A., Oswalt, J.S., and Rosenfeld, D., 2005, Satellite and radar analysis of the volcanic-cumulonimbi at Mt Pinatubo, Philippines, 1991: Journal of Geophysical Research, v. 110, doi:10.1029/2004JD005499.
Tupper, A., Textor, C., Herzog, M., Graf, H.-F., and Richards, M., 2009, Tall clouds from small eruptions: the sensitivity of eruption height and fine ash content to tropospheric instability: Natural Hazards, v. 51, p. 375-401.
Information Contacts: Ima Itikarai, Rabaul Volcano Observatory (RVO), P.O. Box 386, Rabaul, Papua New Guinea; Rebecca Patrick and Andrew Tupper, Darwin Volcanic Ash Advisory Centre (VAAC), Bureau of Meteorology, Northern Territory Regional Office, PO Box 40050, Casuarina, NT 0811, Australia (URL: http://www.bom.gov.au/info/vaac/); Jan Messersmith, Madang - Ples Bilong Mi (URL: http://www.messersmith.name/wordpress/); The Volcanism Blog (URL: http://volcanism.wordpress.com/); Eruptions (URL: http://scienceblogs.com/eruptions/).
A plume in December 2009 and plumes on 26-27 February 2010
Plumes were reported from Karkar on 25-26 November 2009 (BGVN 34:11). Additional plumes were recognized in early December 2009 and during February 2010, but it was ambiguous whether these were ash-bearing plumes.
Rabaul Volcano Observatory (RVO) was unable to confirm that an eruption during 25 November to early December had occurred. In later fieldwork RVO found dead vegetation and noted that a few "holes" (small depressions) had developed in the crater area.
According to RVO, on 25-26 February local residents observed steam rising from inside the caldera and heard low roaring noises. Lightning was also observed above the summit area. The Darwin Volcanic Ash Advisory Center (VAAC) issued aviation reports on those dates noting that an ash plume rose to ~ 2.4 km and was blown as far as ~ 74 km NE and SE. Ultimately the plume was hidden by meteorological clouds.
Inferred debris-avalanche deposits and tsunami hazards. In a recent publication by Silver and others (2009), 12 debris avalanches were mapped in the Bismarck volcanic arc, including at Karkar (figure 8).
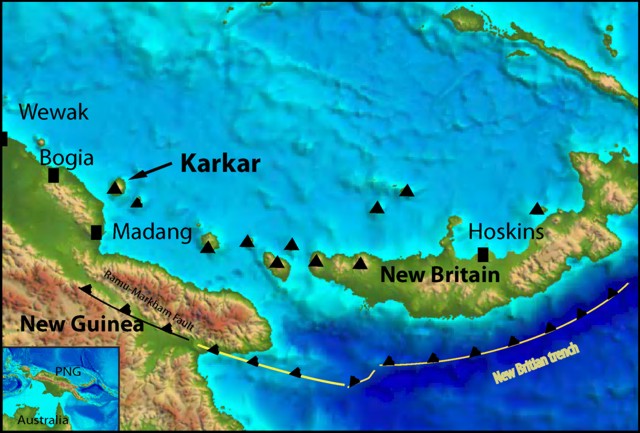 |
Figure 8. Location of Karkar and the broad-scale bathymetry of the Papua New Guinea region, showing the New Britain trench and its impingement on the main island of New Guinea as the Ramu-Markham fault. Index map appears at lower left. Map created using ERMapper. |
The authors used sidescan sonar (figure 9) and around Karkar found very high-amplitude reflectivity to the SW, indicating young lava flows. Adjacent to these flows are small regions of blocky backscatter, which the authors suggested were debris-avalanche deposits. Although these deposits are small, it is possible that they coalesce beneath the lava flows and have been buried by the younger activity. High-amplitude reflectivity also occurs on the N side of the volcano. Individual blocks are scattered, and the reflectivity pattern appears to result from both lava flows and small debris avalanches.
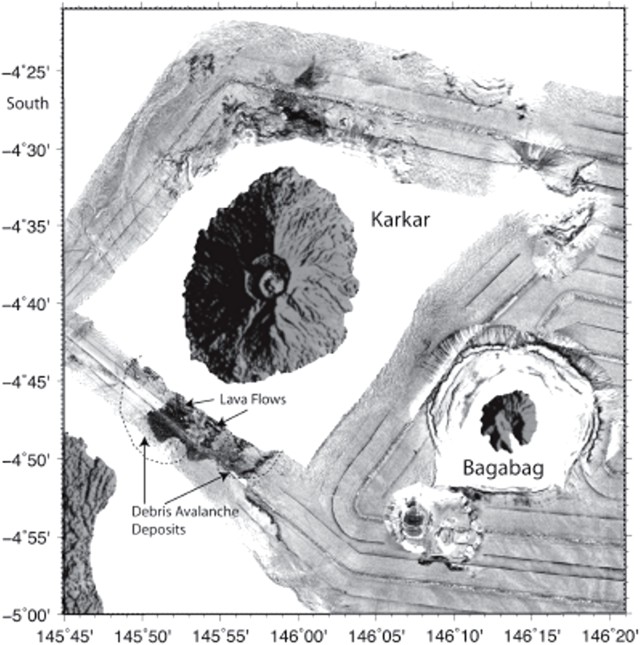 |
Figure 9. Detailed side-scan imagery of the seafloor around Karkar and nearby Bagabag. Dotted line surrounds the author's inferred debris avalanche deposit. 5' of latitude = 9.3 km. Bagabag, a Pleistocene-age volcano that lacks documented Holocene eruptions, sits ~ 20 km SE of Karkar. After Silver and others (2009). |
A subaerial landslide scar lies on Karkar's S side (figure 9). It could be associated with some of the debris imaged S of the volcano, although the available data came largely from transit lines and is incomplete. The authors state that, although the mapped extent of the debris avalanche deposit is small, it is still large enough to have produced a potentially significant tsunami in the Madang area.
Reference. Silver, E., Day, S., Ward, S., Hoffmann, G., Llanes, P., Driscoll, N., Appelgate, B., and Saunders, S., 2009, Volcano collapse and tsunami generation in the Bismarck Volcanic Arc, Papua New Guinea, J. of Volcanology and Geothermal Research, 186, 3-4, 210-222.
Information Contacts: Rabaul Volcano Observatory (RVO), PO Box 386, Rabaul, Papua New Guinea; Department of Mineral Policy & Geohazards Management, P.O. Box 3386, Kokopo, East New Britain Province, Papua New Guinea, Volcanological Observatory Geohazards Management Division; Darwin Volcanic Ash Advisory Centre (VAAC), Bureau of Meteorology, Northern Territory Regional Office, PO Box 40050, Casuarina, NT 0811, Australia (URL: http://www.bom.gov.au/info/vaac/).
Ash plumes observed by satellites during 2012-2014
Plumes were recognized from Karkar volcano in early December 2009 and during February 2010, but it was ambiguous whether these were ash-bearing plumes (BGVN 35:05). Based on analyses of satellite imagery and wind data, the Darwin VAAC reported at least three periods with ash plumes during February 2012, January-March 2013, and March 2014 (table 1).
The 2012 plume noted during the early morning of 1 February (31 January UTC) was described as a "possible" ash plume as high as 10.7 km altitude by the VAAC, but was still seen in imagery about 6 hours later before being obscured by meteorological clouds. The 2013 activity consisted of plumes on three days across about six weeks, with the highest reaching 9.1 km altitude in late February. A low-level plume erupted mid-day on 26 March 2014 was also noted in imagery the following day. No other activity had been reported through May 2015.
Table 1. Volcanic plumes at Karkar observed in satellite imagery by Darwin VAAC, 2012-2015.
| Date | Event | Altitude (km) | Height (km) | Drift |
| 1 Feb 2012 | Ash plume (possible) | 7.6-10.7 | 5.8-8.9 | NE, E |
| 29 Jan 2013 | Ash plume | 4.3 | 2.5 | 40 km NE |
| 26 Feb 2013 | Ash plume | 9.1 | 7.3 | Not reported |
| 15 Mar 2013 | Ash plume | 8.5 | 6.7 | 75 km N, 130 km E |
| 26-27 Mar 2014 | Ash plumes | 2.4 | 0.6 | ~50 km ENE to NW |
Information Contacts: Darwin Volcanic Ash Advisory Centre (VAAC), Bureau of Meteorology, Northern Territory Regional Office, PO Box 40050, Casuarina, NT 0811, Australia (URL: http://www.bom.gov.au/info/vaac/).
|
|
||||||||||||||||||||||||||
There is data available for 11 confirmed eruptive periods.
[ 2014 Mar 26 - 2014 Mar 27 ] Uncertain Eruption
| Episode 1 | Uncertain | Uncertain | ||||||||||||||||||
|---|---|---|---|---|---|---|---|---|---|---|---|---|---|---|---|---|---|---|---|
| 2014 Mar 26 - 2014 Mar 27 | Evidence from Observations: Reported | ||||||||||||||||||
|
List of 2 Events for Episode 1 at Uncertain
|
|||||||||||||||||||
[ 2013 Jan 29 - 2013 Mar 15 ] Uncertain Eruption
| Episode 1 | Uncertain | Bagiai cone | |||||||||||||||||||||||||||||||||
|---|---|---|---|---|---|---|---|---|---|---|---|---|---|---|---|---|---|---|---|---|---|---|---|---|---|---|---|---|---|---|---|---|---|---|
| 2013 Jan 29 - 2013 Mar 15 | Evidence from Observations: Reported | |||||||||||||||||||||||||||||||||
| Based on analyses of satellite imagery and wind data analyses, the Darwin VAAC reported that on 29 January 2013 an ash plume rose to an altitude of 4.3 km and drifted less than 40 km NE; on 26 February an ash plume rose to an altitude of 9.1 km, and a plume on 15 March rose to 8.5 km drifted 75 km N and 130 km E. | ||||||||||||||||||||||||||||||||||
|
List of 5 Events for Episode 1 at Bagiai cone
|
||||||||||||||||||||||||||||||||||
[ 2012 Feb 1 - 2012 Feb 1 ] Uncertain Eruption
| Episode 1 | Uncertain | Unknown | ||||||||||||||||||
|---|---|---|---|---|---|---|---|---|---|---|---|---|---|---|---|---|---|---|---|
| 2012 Feb 1 - 2012 Feb 1 | Evidence from Observations: Reported | ||||||||||||||||||
|
List of 2 Events for Episode 1 at Unknown
|
|||||||||||||||||||
[ 2010 Feb 25 - 2010 Feb 26 ] Uncertain Eruption
| Episode 1 | Eruption (Explosive / Effusive) | Uncertain | ||||||||||||||||||||||||||||
|---|---|---|---|---|---|---|---|---|---|---|---|---|---|---|---|---|---|---|---|---|---|---|---|---|---|---|---|---|---|
| 2010 Feb 25 - 2010 Feb 26 | Evidence from Observations: Reported | ||||||||||||||||||||||||||||
|
List of 4 Events for Episode 1 at Uncertain
|
|||||||||||||||||||||||||||||
[ 2009 Nov 25 - 2009 Nov 26 ] Discredited Eruption
[ 2009 May 1 ± 30 days ] Uncertain Eruption
| Episode 1 | Eruption (Explosive / Effusive) | |||||||||||||||||||
|---|---|---|---|---|---|---|---|---|---|---|---|---|---|---|---|---|---|---|---|
| 2009 May 1 ± 30 days - Unknown | Evidence from Unknown | ||||||||||||||||||
|
List of 2 Events for Episode 1
|
|||||||||||||||||||
[ 1980 Jan 7 - 1980 Jan 17 ] Uncertain Eruption
| Episode 1 | Eruption (Explosive / Effusive) | |||||||||||||||||||
|---|---|---|---|---|---|---|---|---|---|---|---|---|---|---|---|---|---|---|---|
| 1980 Jan 7 - 1980 Jan 17 | Evidence from Unknown | ||||||||||||||||||
|
List of 2 Events for Episode 1
|
|||||||||||||||||||
1979 Jan 12 (?) - 1979 Aug 9 Confirmed Eruption (Explosive / Effusive) VEI: 2
| Episode 1 | Eruption (Explosive / Effusive) | SE foot of Bagiai | |||||||||||||||||||||||||||||||||||||||||||||||||||||||||||||||||||||||||||||||||||
|---|---|---|---|---|---|---|---|---|---|---|---|---|---|---|---|---|---|---|---|---|---|---|---|---|---|---|---|---|---|---|---|---|---|---|---|---|---|---|---|---|---|---|---|---|---|---|---|---|---|---|---|---|---|---|---|---|---|---|---|---|---|---|---|---|---|---|---|---|---|---|---|---|---|---|---|---|---|---|---|---|---|---|---|---|
| 1979 Jan 12 (?) - 1979 Aug 9 | Evidence from Observations: Reported | |||||||||||||||||||||||||||||||||||||||||||||||||||||||||||||||||||||||||||||||||||
|
List of 15 Events for Episode 1 at SE foot of Bagiai
|
||||||||||||||||||||||||||||||||||||||||||||||||||||||||||||||||||||||||||||||||||||
1974 Dec 30 (?) - 1975 Jun 26 Confirmed Eruption (Explosive / Effusive) VEI: 2
| Episode 1 | Eruption (Explosive / Effusive) | Bagiai | ||||||||||||||||||||||||||||||||||||||||||||||||
|---|---|---|---|---|---|---|---|---|---|---|---|---|---|---|---|---|---|---|---|---|---|---|---|---|---|---|---|---|---|---|---|---|---|---|---|---|---|---|---|---|---|---|---|---|---|---|---|---|---|
| 1974 Dec 30 (?) - 1975 Jun 26 | Evidence from Observations: Reported | ||||||||||||||||||||||||||||||||||||||||||||||||
|
List of 8 Events for Episode 1 at Bagiai
|
|||||||||||||||||||||||||||||||||||||||||||||||||
1974 Feb 14 - 1974 Aug 8 Confirmed Eruption (Explosive / Effusive) VEI: 2
| Episode 1 | Eruption (Explosive / Effusive) | Bagiai | ||||||||||||||||||||||||||||||||||||||||||||||||||||||||||
|---|---|---|---|---|---|---|---|---|---|---|---|---|---|---|---|---|---|---|---|---|---|---|---|---|---|---|---|---|---|---|---|---|---|---|---|---|---|---|---|---|---|---|---|---|---|---|---|---|---|---|---|---|---|---|---|---|---|---|---|
| 1974 Feb 14 - 1974 Aug 8 | Evidence from Observations: Reported | ||||||||||||||||||||||||||||||||||||||||||||||||||||||||||
|
List of 10 Events for Episode 1 at Bagiai
|
|||||||||||||||||||||||||||||||||||||||||||||||||||||||||||
[ 1962 Jul 2 (?) ± 182 days ] Uncertain Eruption
| Episode 1 | Eruption (Explosive / Effusive) | Ulumam | ||||||||||||||||||
|---|---|---|---|---|---|---|---|---|---|---|---|---|---|---|---|---|---|---|---|
| 1962 Jul 2 (?) ± 182 days - Unknown | Evidence from Unknown | ||||||||||||||||||
|
List of 2 Events for Episode 1 at Ulumam
|
|||||||||||||||||||
1895 Jun 17 - 1895 Aug Confirmed Eruption (Explosive / Effusive) VEI: 2
| Episode 1 | Eruption (Explosive / Effusive) | ||||||||||||||||||||||||||||||||||||||||||||||||||||||
|---|---|---|---|---|---|---|---|---|---|---|---|---|---|---|---|---|---|---|---|---|---|---|---|---|---|---|---|---|---|---|---|---|---|---|---|---|---|---|---|---|---|---|---|---|---|---|---|---|---|---|---|---|---|---|
| 1895 Jun 17 - 1895 Aug | Evidence from Observations: Reported | |||||||||||||||||||||||||||||||||||||||||||||||||||||
| An explosive eruption beginning 17 June 1895 deposited large quantities of ash on the N and NW sides of the island, damaging gardens and resulting in fatalities from starvation. A mudflow caused at least one fatality (Johnson et al., 1972). Terrace F lava flows on the SE side of the caldera are considered to have originated during the 1895 eruption (McKee and Wallace, 1981). | ||||||||||||||||||||||||||||||||||||||||||||||||||||||
|
List of 9 Events for Episode 1
|
||||||||||||||||||||||||||||||||||||||||||||||||||||||
1885 Confirmed Eruption (Explosive / Effusive) VEI: 2 (?)
| Episode 1 | Eruption (Explosive / Effusive) | ||||||||||||||||||||||||
|---|---|---|---|---|---|---|---|---|---|---|---|---|---|---|---|---|---|---|---|---|---|---|---|---|
| 1885 - Unknown | Evidence from Observations: Reported | |||||||||||||||||||||||
|
List of 3 Events for Episode 1
|
||||||||||||||||||||||||
[ 1830 ] Uncertain Eruption
| Episode 1 | Eruption (Explosive / Effusive) | ||||||||||||||
|---|---|---|---|---|---|---|---|---|---|---|---|---|---|---|
| 1830 - Unknown | Evidence from Unknown | |||||||||||||
|
List of 1 Events for Episode 1
|
||||||||||||||
1643 Apr 20 Confirmed Eruption (Explosive / Effusive) VEI: 3
| Episode 1 | Eruption (Explosive / Effusive) | ||||||||||||||||||||||||
|---|---|---|---|---|---|---|---|---|---|---|---|---|---|---|---|---|---|---|---|---|---|---|---|---|
| 1643 Apr 20 - Unknown | Evidence from Observations: Reported | |||||||||||||||||||||||
|
List of 3 Events for Episode 1
|
||||||||||||||||||||||||
1070 ± 200 years Confirmed Eruption (Explosive / Effusive)
| Episode 1 | Eruption (Explosive / Effusive) | South flank (Patilo Cone) | |||||||||||||
|---|---|---|---|---|---|---|---|---|---|---|---|---|---|---|
| 1070 ± 200 years - Unknown | Evidence from Isotopic: 14C (uncalibrated) | |||||||||||||
|
List of 1 Events for Episode 1 at South flank (Patilo Cone)
|
||||||||||||||
0730 (?) Confirmed Eruption (Explosive / Effusive) VEI: 4
| Episode 1 | Eruption (Explosive / Effusive) | ||||||||||||||||||||||||||||||||||
|---|---|---|---|---|---|---|---|---|---|---|---|---|---|---|---|---|---|---|---|---|---|---|---|---|---|---|---|---|---|---|---|---|---|---|
| 0730 (?) - Unknown | Evidence from Isotopic: 14C (uncalibrated) | |||||||||||||||||||||||||||||||||
|
List of 5 Events for Episode 1
|
||||||||||||||||||||||||||||||||||
0520 ± 100 years Confirmed Eruption (Explosive / Effusive) VEI: 4
| Episode 1 | Eruption (Explosive / Effusive) | |||||||||||||||||||||||||||||||||||||||||||||||||
|---|---|---|---|---|---|---|---|---|---|---|---|---|---|---|---|---|---|---|---|---|---|---|---|---|---|---|---|---|---|---|---|---|---|---|---|---|---|---|---|---|---|---|---|---|---|---|---|---|---|
| 0520 ± 100 years - Unknown | Evidence from Isotopic: 14C (uncalibrated) | ||||||||||||||||||||||||||||||||||||||||||||||||
|
List of 8 Events for Episode 1
|
|||||||||||||||||||||||||||||||||||||||||||||||||
0870 BCE ± 75 years Confirmed Eruption (Explosive / Effusive)
| Episode 1 | Eruption (Explosive / Effusive) | ||||||||||||||||||||||||||||||||||||||||||||
|---|---|---|---|---|---|---|---|---|---|---|---|---|---|---|---|---|---|---|---|---|---|---|---|---|---|---|---|---|---|---|---|---|---|---|---|---|---|---|---|---|---|---|---|---|
| 0870 BCE ± 75 years - Unknown | Evidence from Isotopic: 14C (uncalibrated) | |||||||||||||||||||||||||||||||||||||||||||
|
List of 7 Events for Episode 1
|
||||||||||||||||||||||||||||||||||||||||||||
7140 BCE ± 150 years Confirmed Eruption (Explosive / Effusive) VEI: 4
| Episode 1 | Eruption (Explosive / Effusive) | ||||||||||||||||||||||||||||||||||||||||||||
|---|---|---|---|---|---|---|---|---|---|---|---|---|---|---|---|---|---|---|---|---|---|---|---|---|---|---|---|---|---|---|---|---|---|---|---|---|---|---|---|---|---|---|---|---|
| 7140 BCE ± 150 years - Unknown | Evidence from Isotopic: 14C (uncalibrated) | |||||||||||||||||||||||||||||||||||||||||||
| The Wadau deposit, 14C dated at 9,090 ± 150 BP, represents products of eruptions associated with the final collapse of Karkar's outer caldera (Pain and McKee, 1981). | ||||||||||||||||||||||||||||||||||||||||||||
|
List of 7 Events for Episode 1
|
||||||||||||||||||||||||||||||||||||||||||||
This compilation of synonyms and subsidiary features may not be comprehensive. Features are organized into four major categories: Cones, Craters, Domes, and Thermal Features. Synonyms of features appear indented below the primary name. In some cases additional feature type, elevation, or location details are provided.
Synonyms |
||||
| Dampier Island | Krakar | ||||
Cones |
||||
| Feature Name | Feature Type | Elevation | Latitude | Longitude |
| Bagiai | Cone - Crater | 1282 m | 4° 38' 54.00" S | 145° 58' 24.00" E |
| Kunugui
Kanagioi |
Stratovolcano | 1809 m | 4° 40' 39.00" S | 145° 58' 39.00" E |
| Ulumam
Uluman |
Former cone | |||
Craters |
||||
| Feature Name | Feature Type | Elevation | Latitude | Longitude |
| Kurum | Crater - Cone | 179 m | 4° 44' 20.00" S | 145° 56' 16.00" E |
| Patilo | Crater - Cone | 148 m | 4° 44' 56.00" S | 145° 57' 37.00" E |
 An ash plume rises above the summit of Karkar volcano in 1979. There are two nested summit calderas at the summit of the forested volcano resulting in a broad, low profile. The 5.5-km-wide outer caldera was formed during one or more eruptions, the last of which occurred 9,000 years ago. The 3.2-km-wide inner caldera was formed sometime between 1,500 and 800 years ago. Most historical eruptions, like this one in 1979, have originated from Bagiai cone within the 300-m-deep inner caldera.
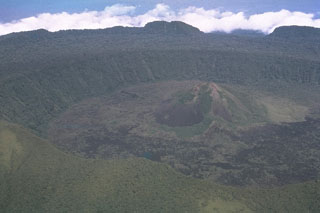 Two nested calderas are visible in this aerial view from the E of the Karkar summit, taken before the 1974 eruption. The 5.5-km-wide outer caldera formed during one or more eruptions, the last of which occurred 9,000 years ago, and the rim forms the horizon. The 3.2-km-wide inner caldera was formed sometime between 1,500 and 800 years ago and its floor is covered by young lava flows. Bagiai cone (right center) has been the source of most eruptions dating back to 1643.
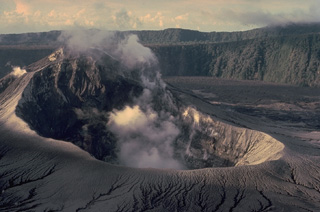 Steam rises from the summit crater of Bagiai cone in the inner caldera of Karkar volcano in September 1979, shortly after an eruption that ended in August. Fresh pyroclastic-fall deposits that mantle the slopes of the cone originated from a new vent on the caldera floor at the SE base of Bagiai. This view from the south caldera rim looks across Bagiai cone to the wall of the inner caldera. The outer caldera wall forms the horizon.
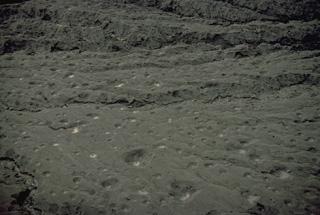 A strong directed explosion on March 8, 1979 from a vent on the floor of Karkar's inner caldera ejected large blocks that produced these impact craters on the southern rim of the caldera. The craters, photographed here in September 1979, measured up to about 7-m wide and over 2-m deep. The thin tephra deposit ranged from about 10-40 cm in thickness. The directed explosions, estimated to be at an angle of 30-60 degrees above the horizontal, destroyed a formerly dense rainforest over a crescent-shaped area extending up to 900 m from the caldera rim.
 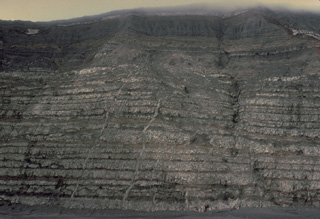 A strong explosive eruption at Karkar volcano in Papua New Guinea in 1979 stripped the southern caldera wall of vegetation, exposing a cross-section of the interior of the stratovolcano. The 300-m-high caldera wall shows thin layers of light-colored lava flows separated by intervening pyroclastic layers, reflecting the repetitive effusive and explosive eruptions that built the volcano. Narrow vertical dikes, the feeder conduits for lava flows, are visible at several locations in the caldera wall.
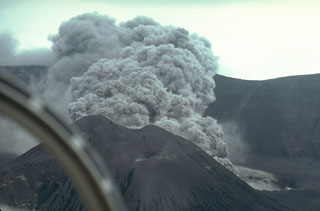 An ash plume rises above a new vent behind Bagiai cone on the floor of Karkar's summit caldera on 17 April 1979. Phreatic eruptions had begun during the night of 12-13 January after six months of increasing seismicity and incandescence. Major phreatic explosions from the new vent on 8 March devastated the caldera rim area, killing two volcanologists who were monitoring the eruption. A new crater formed and intermittent moderate-to-strong explosive activity continued until 9 August.
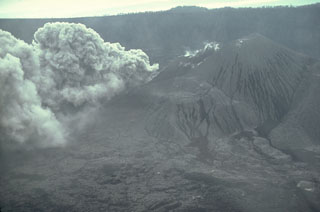 A new vent on the floor of Karkar's inner caldera began erupting on 12 January 1979. On 8 March a major phreatic eruption from the vent produced a directed explosion that devastated an area on the southern caldera rim. The explosion enlarged the January crater to a diameter of 300 m and a depth of 200 m. This 17 April view from the NE shows a low ash plume rising from the new crater.
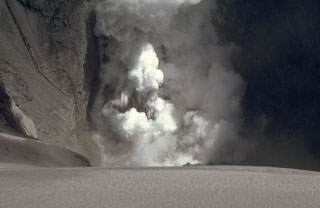 An ash plume from a phreatic explosion rises above a small crater lake at Karkar volcano on 22 April 1979. Following a major explosion from a new vent on the floor of the caldera on 8 March, minor explosions took place until May, after which activity intensified. A lake was briefly seen the day after this photo was taken. The lake disappeared after a strong explosion that night, which deposited ash on the SW caldera floor.
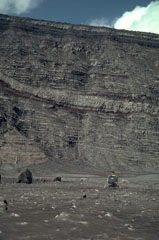 A helicopter on the floor of the inner caldera of Karkar volcano with the 300-m-high caldera wall behind it. The wall was stripped of vegetation by a powerful phreatic explosion on 8 March, revealing the stratigraphy of lighter-colored lava flows and darker pyroclastic deposits that form the edifice. This location is covered by ash and blocks from the March 8 explosion that occurred one month earlier.
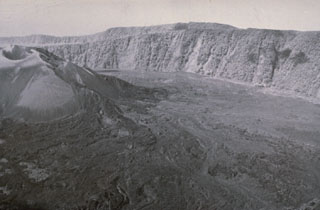 A dominantly effusive eruption with Strombolian activity took place from the Bagiai cone (upper left) in the central caldera during February to August 1974. Lava flows were produced throughout the eruption, except for a 25-day period in July, and covered much of the inner caldera floor. This view from the S caldera rim on 13 September 1974 shows lava flows that were erupted during a period of increased lava effusion on 22 July to 8 August, from a new vent on the SE side of Bagiai.
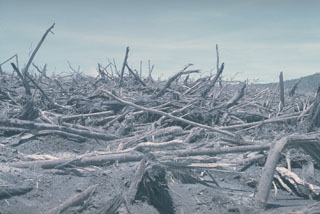 A strong lateral explosion on 8 March 1979 from a vent on the floor of Karkar's inner caldera destroyed vegetation on the southern caldera rim. Trees such as these near the outer margin of the devastated area were snapped off at ground level and were oriented towards the SSE. Foliage was stripped from the trees, branches were torn off, and tree trunks had a sand-blasted appearance.
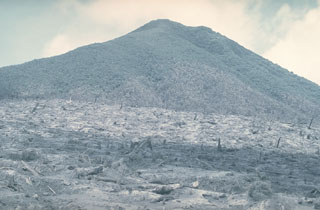 This September 1979 view looks S towards Kanagioi peak across the devastated zone of the 8 March 1979 explosion. Trees in the foreground, on the southern rim of the caldera, were blown down and removed by a lateral explosion from a new vent on the caldera floor 300 m below. An area of standing singed trees extends up the slopes of Kanagioi. A crescent-shaped area extending up to 900 m from the caldera was devastated by the explosion, which killed volcanologists Robin Cooke and Elias Ravian who were monitoring the eruption.
The following 19 samples associated with this volcano can be found in the Smithsonian's NMNH Department of Mineral Sciences collections, and may be availble for research (contact the Rock and Ore Collections Manager). Catalog number links will open a window with more information.
| Catalog Number | Sample Description | Lava Source | Collection Date |
|---|---|---|---|
| NMNH 114300 | Tephra | -- | -- |
| NMNH 114301 | Tephra | -- | -- |
| NMNH 114302 | Tephra | -- | -- |
| NMNH 114303 | Basaltic Andesite | -- | -- |
| NMNH 114304 | Tephra | -- | -- |
| NMNH 114305 | Basaltic Andesite | -- | -- |
| NMNH 114306 | Tephra | -- | -- |
| NMNH 114307 | Tephra | -- | -- |
| NMNH 114308 | Tephra | -- | -- |
| NMNH 114309 | Tephra | -- | -- |
| NMNH 114310 | Red Tephra | -- | -- |
| NMNH 114311 | Tephra | -- | -- |
| NMNH 114312 | Tephra | -- | -- |
| NMNH 114313 | Dolerite | -- | -- |
| NMNH 114314 | Basaltic Andesite | -- | -- |
| NMNH 114315 | Basaltic Andesite | -- | -- |
| NMNH 114316 | Carbonized Wood | -- | -- |
| NMNH 114317 | Carbonized Wood | -- | -- |
| NMNH 114318 | Basaltic Andesite | -- | -- |
| Copernicus Browser | The Copernicus Browser replaced the Sentinel Hub Playground browser in 2023, to provide access to Earth observation archives from the Copernicus Data Space Ecosystem, the main distribution platform for data from the EU Copernicus missions. |
| MIROVA | Middle InfraRed Observation of Volcanic Activity (MIROVA) is a near real time volcanic hot-spot detection system based on the analysis of MODIS (Moderate Resolution Imaging Spectroradiometer) data. In particular, MIROVA uses the Middle InfraRed Radiation (MIR), measured over target volcanoes, in order to detect, locate and measure the heat radiation sourced from volcanic activity. |
| MODVOLC Thermal Alerts | Using infrared satellite Moderate Resolution Imaging Spectroradiometer (MODIS) data, scientists at the Hawai'i Institute of Geophysics and Planetology, University of Hawai'i, developed an automated system called MODVOLC to map thermal hot-spots in near real time. For each MODIS image, the algorithm automatically scans each 1 km pixel within it to check for high-temperature hot-spots. When one is found the date, time, location, and intensity are recorded. MODIS looks at every square km of the Earth every 48 hours, once during the day and once during the night, and the presence of two MODIS sensors in space allows at least four hot-spot observations every two days. Each day updated global maps are compiled to display the locations of all hot spots detected in the previous 24 hours. There is a drop-down list with volcano names which allow users to 'zoom-in' and examine the distribution of hot-spots at a variety of spatial scales. |
|
WOVOdat
Single Volcano View Temporal Evolution of Unrest Side by Side Volcanoes |
WOVOdat is a database of volcanic unrest; instrumentally and visually recorded changes in seismicity, ground deformation, gas emission, and other parameters from their normal baselines. It is sponsored by the World Organization of Volcano Observatories (WOVO) and presently hosted at the Earth Observatory of Singapore.
GVMID Data on Volcano Monitoring Infrastructure The Global Volcano Monitoring Infrastructure Database GVMID, is aimed at documenting and improving capabilities of volcano monitoring from the ground and space. GVMID should provide a snapshot and baseline view of the techniques and instrumentation that are in place at various volcanoes, which can be use by volcano observatories as reference to setup new monitoring system or improving networks at a specific volcano. These data will allow identification of what monitoring gaps exist, which can be then targeted by remote sensing infrastructure and future instrument deployments. |
| Volcanic Hazard Maps | The IAVCEI Commission on Volcanic Hazards and Risk has a Volcanic Hazard Maps database designed to serve as a resource for hazard mappers (or other interested parties) to explore how common issues in hazard map development have been addressed at different volcanoes, in different countries, for different hazards, and for different intended audiences. In addition to the comprehensive, searchable Volcanic Hazard Maps Database, this website contains information about diversity of volcanic hazard maps, illustrated using examples from the database. This site is for educational purposes related to volcanic hazard maps. Hazard maps found on this website should not be used for emergency purposes. For the most recent, official hazard map for a particular volcano, please seek out the proper institutional authorities on the matter. |
| IRIS seismic stations/networks | Incorporated Research Institutions for Seismology (IRIS) Data Services map showing the location of seismic stations from all available networks (permanent or temporary) within a radius of 0.18° (about 20 km at mid-latitudes) from the given location of Karkar. Users can customize a variety of filters and options in the left panel. Note that if there are no stations are known the map will default to show the entire world with a "No data matched request" error notice. |
| UNAVCO GPS/GNSS stations | Geodetic Data Services map from UNAVCO showing the location of GPS/GNSS stations from all available networks (permanent or temporary) within a radius of 20 km from the given location of Karkar. Users can customize the data search based on station or network names, location, and time window. Requires Adobe Flash Player. |
| DECADE Data | The DECADE portal, still in the developmental stage, serves as an example of the proposed interoperability between The Smithsonian Institution's Global Volcanism Program, the Mapping Gas Emissions (MaGa) Database, and the EarthChem Geochemical Portal. The Deep Earth Carbon Degassing (DECADE) initiative seeks to use new and established technologies to determine accurate global fluxes of volcanic CO2 to the atmosphere, but installing CO2 monitoring networks on 20 of the world's 150 most actively degassing volcanoes. The group uses related laboratory-based studies (direct gas sampling and analysis, melt inclusions) to provide new data for direct degassing of deep earth carbon to the atmosphere. |
| Large Eruptions of Karkar | Information about large Quaternary eruptions (VEI >= 4) is cataloged in the Large Magnitude Explosive Volcanic Eruptions (LaMEVE) database of the Volcano Global Risk Identification and Analysis Project (VOGRIPA). |
| EarthChem | EarthChem develops and maintains databases, software, and services that support the preservation, discovery, access and analysis of geochemical data, and facilitate their integration with the broad array of other available earth science parameters. EarthChem is operated by a joint team of disciplinary scientists, data scientists, data managers and information technology developers who are part of the NSF-funded data facility Integrated Earth Data Applications (IEDA). IEDA is a collaborative effort of EarthChem and the Marine Geoscience Data System (MGDS). |

