HVO reported that Mauna Loa had been quiet since the eruption ended on 13 December 2022 and the number of earthquakes beneath the summit had returned to background levels. Inflation continued as magma replenished the summit reservoir. On 16 March HVO lowered the Volcano Alert Level to Normal (the lowest level on a four-level scale) and the Aviation Color Code to Green (the lowest level on a four-color scale).
Source: US Geological Survey Hawaiian Volcano Observatory (HVO)
New eruption with lava flows and fountains during November-December 2022
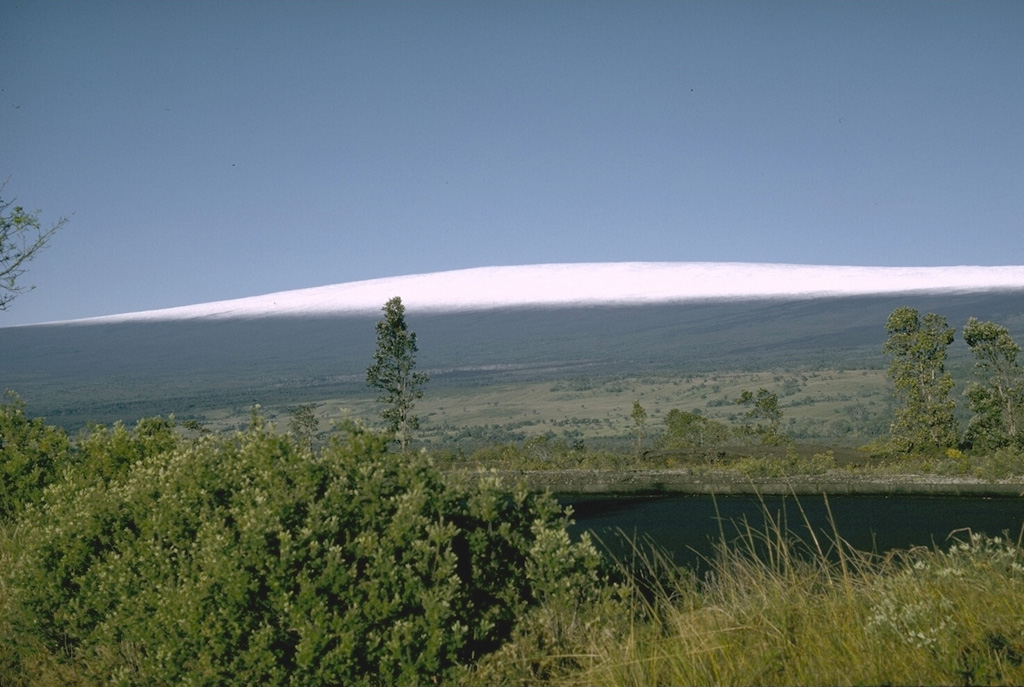
Mauna Loa is a basaltic shield volcano that rises almost 9 km from the ocean floor in Hawaii. Flank eruptions typically occur from NE and SW rift zones, and from the Moku?aweoweo summit caldera. About 1,500 years ago a series of voluminous overflows from a summit lava lake covered about 25% of the volcano’s surface. An eruption during March-April 1984 produced lava flows and fountains (SEAN 09:03). A new eruption during 27 November-10 December 2022 was characterized by lava flows, fountains, and strong sulfur dioxide emissions, based on information from daily reports and volcanic activity notices from the US Geological Survey's (USGS) Hawaiian Volcano Observatory (HVO).
Heightened unrest began at about 0200 on 23 September, when shallow earthquakes increased from 10-20 per day during July-August to 40-50 per day, located underneath Moku?aweoweo caldera (2-5 km below the surface) and in an area NW of the caldera (6-8 km below the surface). Both regions have historically been seismically active during periods of unrest, according to HVO, and this activity was attributed to magma movement. GPS (Global Positioning System) instruments at the summit and on the flanks also measured elevated rates of inflation since mid-September. Peaks in the number of earthquakes were as high as 100 per day on 23 and 29 September. Two Mw 4.6 and Mw 5 earthquakes were recorded at 0907 on 14 October. The former was located S of Pahala at a depth of about 13 km. The second earthquake, 24 seconds later, was located S of Pahala at a depth of 7.4 km. These were followed by more than 150 aftershocks in the Pahala region over the next two days. HVO noted that this unrest was likely driven by the accumulation of new magma 3-8 km below the summit.
HVO reported that a new eruption began in Moku?aweoweo caldera at 2330 on 27 November, which prompted them to raise the Aviation Color Code (ACC) to Red (the highest level on a four-color scale) and the Volcano Alert Level (VAL) to Warning (the highest level on a four-level scale). A thermal anomaly and a plume of sulfur dioxide gas were identified in satellite images at the onset of the eruption, according to NOAA’s National Environmental Satellite, Data, and Information Service (NESDIS). Lava erupted from a fissure in the caldera (figure 27) and by 0127 on 28 November lava had overflowed the low NE caldera wall. During an overflight at about 0630, scientists confirmed that the fissure in the caldera had stopped and several fissures on the upper flank in the Northeast Rift Zone opened and fed active lava flows. The flows were active in the “saddle” area between Mauna Loa and Mauna Kea and several traveled N and NE. Lava flows from Fissures 1 and 2 (F1 and F2, respectively) traveled downslope and stalled about 18 km from Saddle Road; both flows were inactive by 1330 on 28 November. The longest lava flow originated from Fissure 3 (F3), the lowest elevation of the NE fissures at 3.5 km elevation, and crossed the Mauna Loa Weather Observatory Road at approximately 2000 on 28 November; by 0700 on 29 November the flow was about 10 km from Saddle Road. Lava fountains from Fissure 4 (F4), downslope from F3, formed at approximately 1930 on 28 November and rose 5-10 m high. Fountains from F3 were visible during the morning of 29 November and rose 25 m high (figure 28), increasing to 40-50 m high that afternoon. The average sulfur dioxide emission rate measured was 250,000 tons per day (t/d) on 28 November.
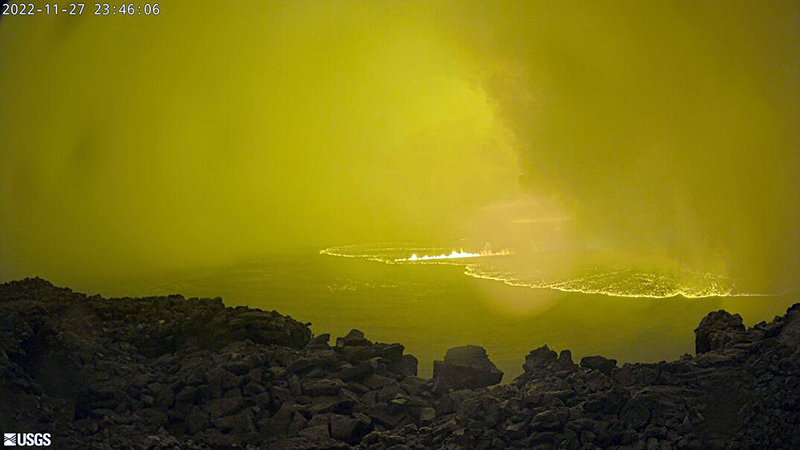 |
Figure 27. Webcam image showing new lava effusion originating from a fissure in the Moku?aweoweo caldera at Mauna Loa at 2346 on 27 November 2022. Courtesy of USGS Hawaiian Volcano Observatory. |
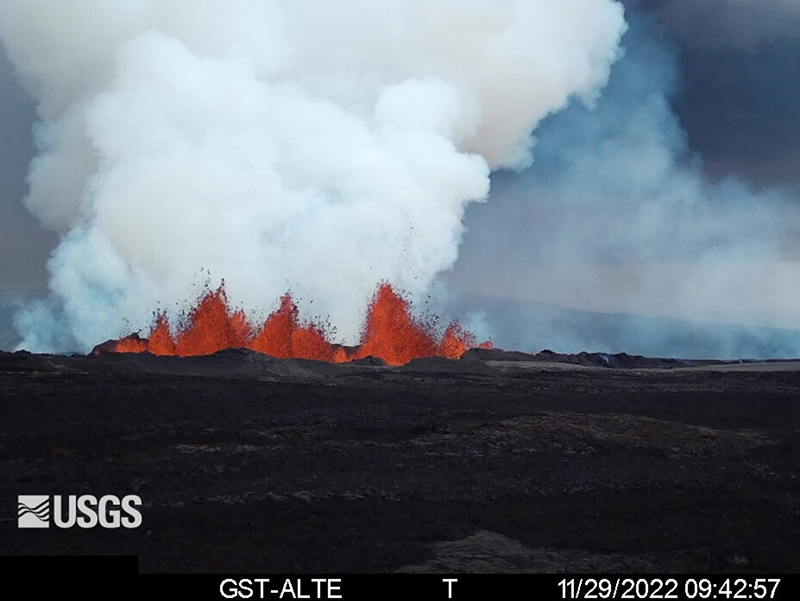 |
Figure 28. Webcam image showing lava fountains at Mauna Loa rising as high as 25 m from Fissure 3 at 0942 on 29 November 2022. Courtesy of USGS Hawaiian Volcano Observatory. |
On 30 November the two active fissures fed lava flows downslope; F3 lava flow traveled NE and during the night of 29-30 November shifted slightly to the W (figure 29). HVO reported that F3 was the dominant source of the main lava flow and that the flow front was about 5.8 km from Saddle Road as of 0700 on 30 November (figure 30). The flows were advancing at a rate of 130 m/hour during 29-30 November. Lava fountains at F3 rose 20-25 m high on 30 November. The F4 flow moved NE at a rate of 50 m/hour; a smaller, branched lobe traveled E from the fissure at a slower rate. Pele’s hair fell in the Saddle Road area. No active lava was reported in Moku?aweoweo caldera or along the Southwest Rift Zone. Gas-and-steam plumes from the activity drifted N.
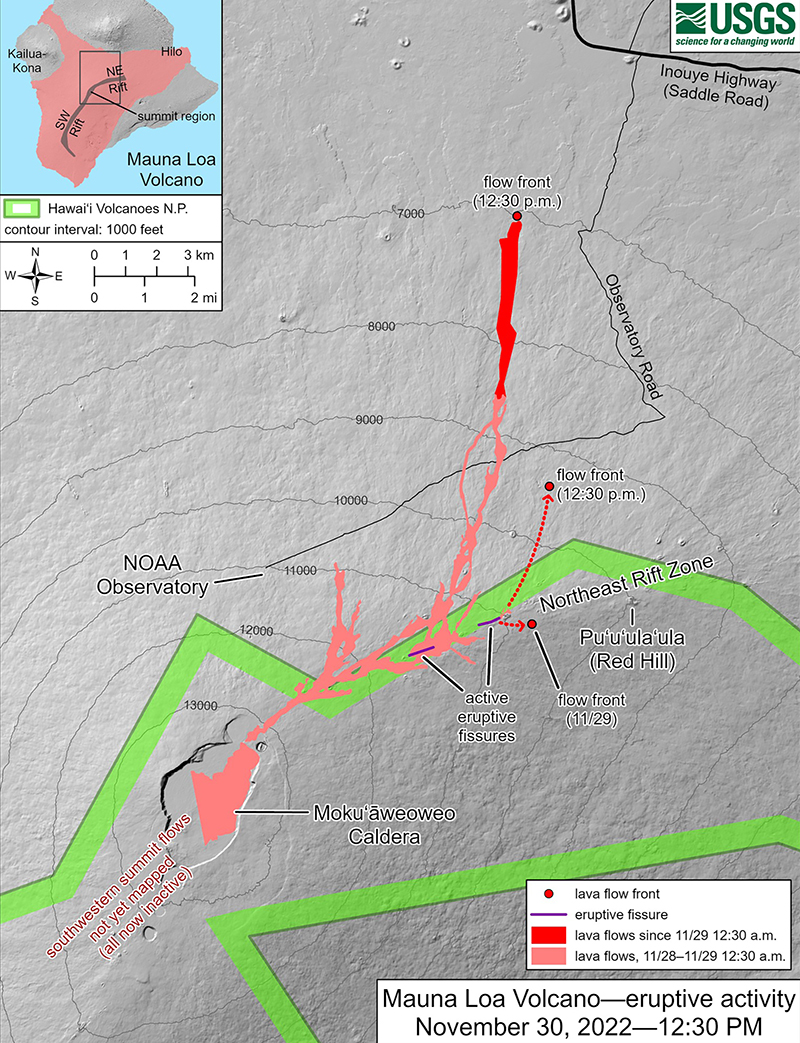 |
Figure 29. Map showing the Mauna Loa lava flow advances during 28-30 November 2022. Fissure 3 is the dominant fissure, feeding flows to the N. The light red color shows lava flows during 28-29 November and the darker red color shows lava flows emplaced from 0030 on 29 November to 1230 on 30 November. The dotted lines indicate flows from Fissure 4, which were moving NE. A smaller lobe from Fissure 4 was moving E. The purple line shows the location of the two active fissures. Courtesy of USGS Hawaiian Volcano Observatory. |
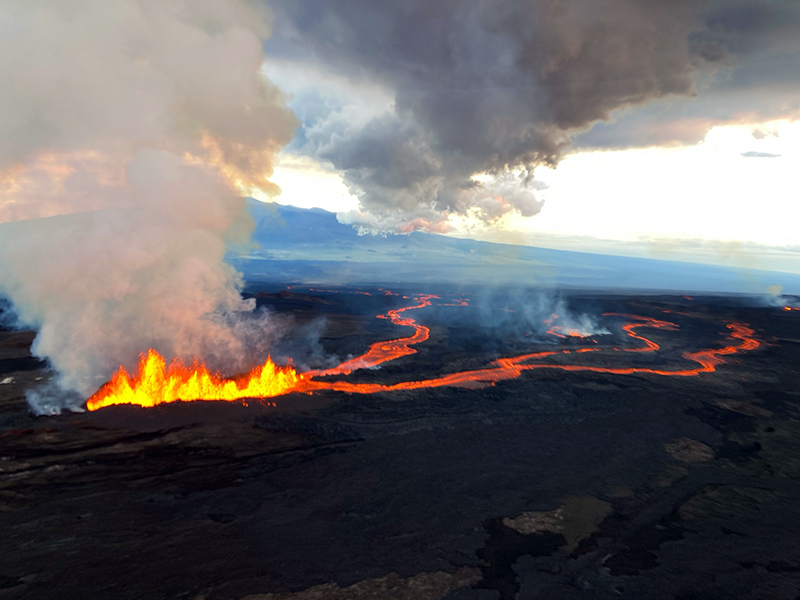 |
Figure 30. Photo of Fissure 3 at Mauna Loa showing strong lava fountains rising 20-25 m high and lava flows that are moving NE at about 130 m/hour. Photo was taken during an overflight during the morning of 30 November 2022. Courtesy of USGS Hawaiian Volcano Observatory. |
On 1 December the F3 lava flows traveled N toward Saddle Road, also referred to as the Daniel K. Inouye Highway, and lava fountaining continued (figure 31); the rate of the largest flow had slowed down during 30 November-1 December to a rate of 40 m/hour. The main flow branched almost halfway down the flow field, but coalesced downslope and advanced along a single flow front that reached about 5.4 km from Saddle Road by 0700 on 1 December. As the flow rate slowed, the flow front widened and became thicker. The F4 flow moved to the NE at a rate of 60 m/hour; the branched lobe that traveled E had stalled by the afternoon of 1 December. Pele’s hair continued to fall in the Humu‘ula Saddle area. During 2 December the F3 lava flow increased to a rate of 45 m/hour and by 0700 the flow front was 4.3 km from Saddle Road. Sulfur dioxide rates measured on 1 December were 180,000 t/d. By 3 December only F3 was active; HVO scientists confirmed that the flow from F4 was no longer active during an overflight during the morning of 3 December. Only incandescent cracks were visible from F4.
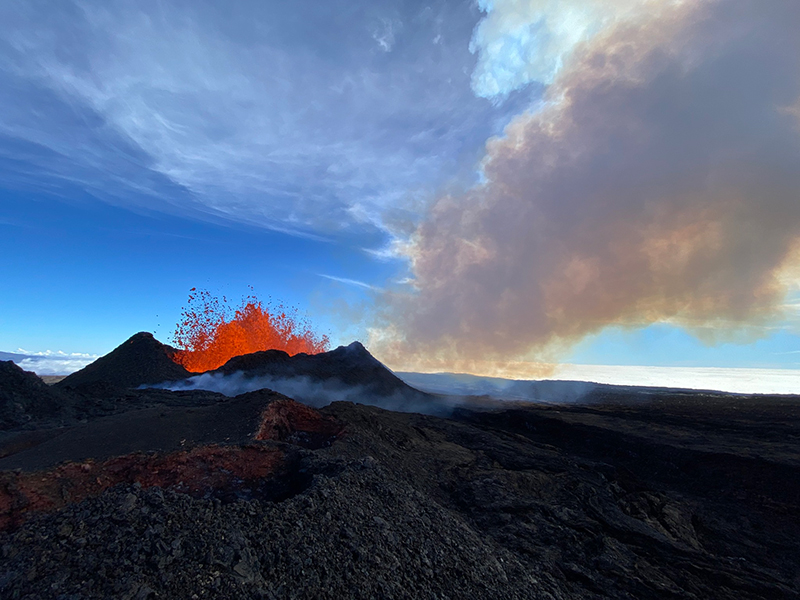 |
Figure 31. Photo of low lava fountains erupting from Fissure 3 at Mauna Loa during the morning of 1 December 2022. Courtesy of USGS Hawaiian Volcano Observatory. |
The active lava flow from F3 continued to move N; by 0700 during the morning of 3 December the flow front was about 4 km from the Saddle Road. The flow had advanced at a rate of about 13 m/hour. Several small overflows near where the main lava flow branched, on the steeper slopes of the NE flank about halfway down the lava flow, were seen during 3-6 December. Lava fountains during 3-4 December rose 33 m high, increasing to 40-100 m on 6 December; fragments of volcanic material were deposited in the area near the vent. Molten lava bombs were sometimes ejected during the fountaining, which cooled at the base of the fissure and built a significant spatter cone. Pele’s hair fragments were blown to distances as far as Laupahoehoe (59 km NW of F3) during 3-7 December. The F3 lava flow front had advanced to 3.6 km from Saddle Road when measured at 0700 on 4 December, and the average flow rate was 12 m/hour. On 4 December the sulfur dioxide emission rate was approximately 120,000 t/d. The ACC was lowered to Orange (the second highest level on a four-color scale) at 0810 on 4 December; the VAL remained at Warning, which reflected the ongoing lava flow hazards.
The active lava flow front that originated from F3 was about 3.5 km from Saddle Road at 0630 on 5 December. Around this time the lava flow rate was about 8 m/hour; a brief surge at the flow front was recorded during the morning. The average flow rate during 5-6 December was 21 m/hour, but for short periods increased up to 27.4 m/hour. By 0500 on 6 December the flow front was about 3.1 km from Saddle Road. The flow front was 2.9 km from Saddle Road at 0600 on 7 December; the flow advanced only a short distance since 0000, likely because a significant breakout had occurred about 4.5 km upslope of the flow front on the E side. The main flow averaged a rate of 6 m/hour during 6-7 December. HVO crews installed a new webcam to observe the front of the main flow during this time.
Though F3 continued to erupt during the morning of 8 December, HVO reported that the volume of lava had notably decreased. Lava overflowed some channels near the vent, which extended no farther than 4-4.4 km. By 0530 on 8 December the main active flow front was stalled about 2.8 km from Saddle Road; the lower part of the flow was inactive. Sulfur dioxide measurements declined to an emission rate of 30,000 t/d. The inactive main flow remained stagnant at 2.8 km from Saddle Road, as measured during the afternoon of 8 December, though HVO reported that as the flow front settled it moved slowly N about 2 m/hour. At 0700 on 9 December activity at the F3 vent was significantly reduced and by 1130 low fountains fed lava flows that extended as far as 2.65 km NE from the vent.
HVO reported that the eruption stopped on 10 December as lava supply to F3 on the Northeast Rift Zone had stopped and sulfur dioxide emissions had decreased to pre-eruption background levels (figure 32). Volcanic tremor and earthquakes associated with the eruption had also greatly decreased. A lava pond replaced the fountaining at the F3 vent at 0700 on 10 December. The pond fed short lava flows that extended 2.6 km from the vent, but then quickly began to stagnate. Lava was confined to the small pond by 1435. The main flow front was inactive but still showed nighttime incandescence. HVO lowered the VAL to Watch (the second highest level on a four-level scale) on 10 December at 1435 and the ACC remained at Orange.
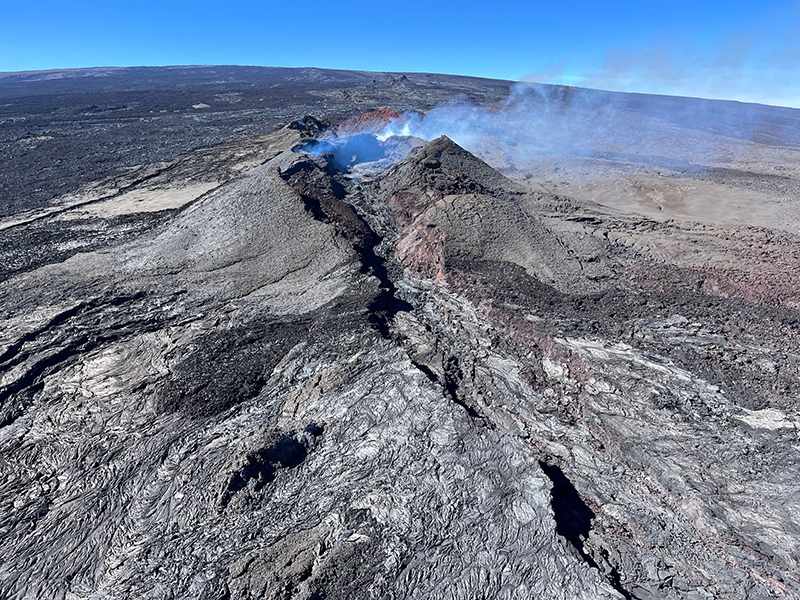 |
Figure 32. Photo of Fissure 3 at Mauna Loa taken during the morning of 10 December 2022 showing an inactive lava flow and weak gas-and-steam emissions. Courtesy of USGS Hawaiian Volcano Observatory. |
Webcam views showed little incandescence and no lava movement in the F3 vent by 0700 on 11 December. Incandescence was restricted to the cone that had formed around the F3 vent. Sulfur dioxide emission rates on 9 December were 20,000 t/d, but when measured the next day had decreased to 2,000 t/d. During an early morning overflight on 12 December scientists heard a small explosion that accompanied a spray of spatter from the W end of F3. On 13 December the ACC was lowered to Yellow. On 14 December HVO reported that the volcano was no longer erupting; webcams only captured residual incandescence and there was no lava movement in the F3 vent. The inactive main flow remained 2.8 km from Saddle Road when last measured during the morning of 10 December.
Information Contacts: Hawaiian Volcano Observatory (HVO), U.S. Geological Survey, PO Box 51, Hawai'i National Park, HI 96718, USA (URL: http://hvo.wr.usgs.gov/); National Environmental Satellite, Data, and Information Service (NESDIS), NOAA, 1335 East-West Highway, SSMC1, 8th Floor Suite 8300, Silver Spring, MD 20910 (URL: https://www.nesdis.noaa.gov/, https://twitter.com/NOAASatellites/status/1597231244060004352).
2023: March
2022: October
| November
| December
2019: June
2018: June
2016: March
2015: September
2010: March
2005: August
2004: September
| October
2003: January
| March
| May
2002: May
| September
| October
HVO reported that Mauna Loa had been quiet since the eruption ended on 13 December 2022 and the number of earthquakes beneath the summit had returned to background levels. Inflation continued as magma replenished the summit reservoir. On 16 March HVO lowered the Volcano Alert Level to Normal (the lowest level on a four-level scale) and the Aviation Color Code to Green (the lowest level on a four-color scale).
Source: US Geological Survey Hawaiian Volcano Observatory (HVO)
HVO reported that activity at Mauna Loa’s Fissure 3 declined during 7-9 December and then ceased on 10 December. The main lava flow had only advanced a small distance during 6-7 December, at a rate of about 6 m per hour, possibly due to a significant breakout that had occurred about 4.5 km upslope of the flow front. Lava erupting from Fissure 3 was greatly reduced by the morning of 8 December. Lava overtopped channels near the vent but had not advanced farther than 4.4 km from the vent by 0930. The channel at lower elevations appeared to be drained and was likely no longer feeding the main flow which had stalled about 2.8 km from the Daniel K. Inouye Highway (Saddle Road). The sulfur dioxide emission rate had declined to 30,000 tonnes per day. By 1130 on 9 December low lava fountains at Fissure 3 fed flows that traveled as far as 2.65 km NE. By 0700 on 10 December a lava pond in the Fissure 3 vent was visible and fed short lava flows that stagnated at 2.6 km. Tremor levels were slowly declining and the sulfur dioxide emission rate was about 2,000 tonnnes per day. Lava was confined to the small pond by 1435 and gas emissions had significantly declined. HVO lowered the Volcano Alert Level to Watch (the second highest level on a four-level scale); the Aviation Color Code remained at Orange (the second highest level on a four-color scale).
No activity was visible on the flow field overnight during 10-11 December, and by 0700 on 11 December the Fissure 3 vent was barely incandescent. Scientists observed no lava movement and only minor incandescence at the vent during an overflight in the early morning of 12 December. They heard a small explosion that accompanied a spray of spatter from the W end of the fissure. On 13 December HVO lowered the Volcano Alert Level to Watch and the Aviation Color Code to Yellow and noted that lava effusion at Fissure 3 had ceased on 10 December, sulfur dioxide emissions had decreased to near pre-eruption background levels, and volcanic tremor and earthquakes associated with the eruption were greatly diminished.
Source: US Geological Survey Hawaiian Volcano Observatory (HVO)
HVO reported that the Northeast Rift Zone eruption at Mauna Loa continued during 30 November-6 December. Fissure 4, at the lowest elevation, produced lava flows that moved NE at a rate of about 60 m per hour during 30 November-1 December and crossed the Mauna Loa Weather Observatory Road overnight. A smaller slower lobe of lava traveled E but had stalled by the afternoon of 1 December. Fissure 4 was not very active during the morning of 2 December, and during an overflight on 3 December HVO geologists confirmed that it was no longer erupting and observed only glowing cracks in the vicinity.
Fissure 3, at 3,510 m elevation, was the dominant source of the largest lava flow that continued to advance mainly N towards the Daniel K. Inouye Highway (Saddle Road) during the week. The main flow branched almost halfway down the flow field, but coalesced downslope an advanced as a single front. Lava fountains at the fissure were 20-25 m tall on 30 November, about 33 m tall during 3-4 December, and 40-100 m on 6 December. Molten lava bombs were sometimes ejected, which cooled at the base of the fissure and built a significant spatter rampart around the lava fountains.
The rate of lava flow advancement was variable but generally trended down early in the week from 24-45 m per hour during 30 November-2 December to 6-13 m per hour during 3-5 December, as the lava-flow front reached flatter ground. As the flow rate slowed the flow front was widened and thickened. There were surges in the rate during 5-6 December with the lava flow typically advancing at 21 m per hour but moving up to 27.4 m per hour for shorter periods. Several small overflows were visible during 3-6 December near where the main lava flow branched, on the steeper slopes of the NE flank about halfway down the lava flow. By 0500 on 6 December the flow front was about 3.5 km from the highway; weather conditions hampered views of the eruption most of the day.
The eruption produced volcanic gas plumes that rose to high altitudes and drifted W, generating vog in areas downwind. Pele's hair (strands of volcanic glass) fell in the Humu‘ula Saddle area, and were also blown great distances, as far as far Laupahoehoe (59 km NW of Fissure 3), and the Mauna Kea Visitor Information Station. Hawai‘i Volcanoes National Park had closed the Mauna Loa Road from Kipukapuaulu, and the closure extended to the summit caldera. Sulfur dioxide emission rates were high through the week with approximate rates of 180,000 tonnes per day on 1 December and 120,000 tonnes per day on 4 December. At 0180 on 4 December the Aviation Color Code was lowered to Orange (the second highest level on a four-color scale) because there was no current threat to aviation from significant volcanic ash emissions. The Federal Aviation Administration issued a temporary flight restriction extending from the surface to 1,500 ft (457 m) above ground level in the eruption area. The Volcano Alert Level remained at Warning (the highest level on a four-level scale) reflecting the ongoing lava-flow hazards.
Source: US Geological Survey Hawaiian Volcano Observatory (HVO)
An eruption at Mauna Loa began at about 2330 on 27 November in Moku‘aweoweo, the summit caldera, prompting HVO to raise the Aviation Color Code to Red (the highest level on a four-color scale) and the Volcano Alert Level to Warning (the highest level on a four-level scale). A thermal anomaly and a plume of sulfur dioxide gas were identified in satellite images at the onset of the eruption, according to NOAA’s National Environmental Satellite, Data, and Information Service (NESDIS). Hawai‘i Volcanoes National Park closed the summit area to visitors. Lava erupted from a fissure in the caldera and by 0127 on 28 November lava had overflowed the caldera walls. During an overflight at about 0630 scientists confirmed that the eruption had moved from the summit to the Northeast Rift Zone, where three fissures opened at a high elevation. The fissures fed several lava flows that traveled N and NE; the flows were active in the “saddle” area between Mauna Loa and Mauna Kea and were not threatening any populated areas. Lava fountains along the fissures were as tall as 30-60 m, though most were only a few meters tall. Lava flows from fissures 1 and 2 traveled downslope and stalled about 18 km from the Saddle Road; the two fissures were inactive by 1330. Sulfur dioxide emissions were approximately 250,000 tonnes per day.
Fissure 3, at the lowest elevation of the NE fissures, issued the longest lava flows. Lava flows crossed the Mauna Loa Weather Observatory Road at about 2000 on 28 November; by 0700 on 29 November the flow front was about 10 km from the Saddle Road. Lava fountains at Fissure 3 were 25 m high in the morning on 29 November but had grown to 40-50 m tall in the afternoon. Fissure 4, downslope of Fissure 3, opened at about 1930 and produced lava fountains that rose 5-10 m high. There was no activity in the summit caldera, nor along the Southwest Rift Zone. Gas plumes from the activity drifted N.
Sources: US Geological Survey Hawaiian Volcano Observatory (HVO); National Environmental Satellite, Data, and Information Service (NESDIS)
HVO reported continuing unrest at Mauna Loa during 9-15 November. The seismic network detected 27-74 daily small-magnitude (below M 3) earthquakes 2-5 km beneath Mokua’weoweo caldera and 6-8 km beneath the upper NW flank of Mauna Loa. An M 3.6 earthquake occurred NW of the summit on 9 November at 0621. Data from Global Positioning System (GPS) instruments at the summit and flanks showed continuing inflation, though data from tiltmeters at the summit did not show significant surface deformation over the past week. The Volcano Alert Level remained at Advisory (the second lowest level on a four-level scale) and the Aviation Color Code remained at Yellow (the second lowest level on a four-color scale).
Source: US Geological Survey Hawaiian Volcano Observatory (HVO)
HVO reported continuing unrest at Mauna Loa during 1-8 November. The seismic network detected 13-50 daily small-magnitude (below M 3) earthquakes 2-5 km beneath Mokua’weoweo caldera and 6-8 km beneath the upper NW flank of Mauna Loa. Data from Global Positioning System (GPS) instruments at the summit and flanks showed continuing inflation, though data from tiltmeters at the summit did not show significant surface deformation over the past week. The Volcano Alert Level remained at Advisory (the second lowest level on a four-level scale) and the Aviation Color Code remained at Yellow (the second lowest level on a four-color scale).
Source: US Geological Survey Hawaiian Volcano Observatory (HVO)
HVO reported continuing unrest at Mauna Loa during 25 October-1 November. The seismic network detected 19-41 daily small-magnitude (below M 3) earthquakes 3-5 km beneath Mokua’weoweo caldera and 1-8 km beneath the upper NW flank of Mauna Loa. Data from Global Positioning System (GPS) instruments at the summit and flanks showed continuing inflation, though data from tiltmeters at the summit did not show significant surface deformation over the past week. The Volcano Alert Level remained at Advisory (the second lowest level on a four-level scale) and the Aviation Color Code remained at Yellow (the second lowest level on a four-color scale).
Source: US Geological Survey Hawaiian Volcano Observatory (HVO)
HVO reported continuing unrest at Mauna Loa during 19-25 October. The seismic network detected 10-46 daily small-magnitude (below M 3) earthquakes 3-5 km beneath Mokua’weoweo caldera and 6-8 km beneath the upper NW flank of Mauna Loa. Data from Global Positioning System (GPS) instruments at the summit and flanks showed continuing inflation, though data from tiltmeters at the summit did not show significant surface deformation over the past week. A M 3.1 earthquake was recorded at 2035 on 23 October at a depth of 4 km beneath Mokua’weoweo caldera. The Volcano Alert Level remained at Advisory (the second lowest level on a four-level scale) and the Aviation Color Code remained at Yellow (the second lowest level on a four-color scale).
Source: US Geological Survey Hawaiian Volcano Observatory (HVO)
HVO reported continuing unrest at Mauna Loa during 12-18 October. The seismic network detected 22-65 daily small-magnitude (below M 3) earthquakes 3-5 km beneath Mokua?weoweo caldera and 6-8 km beneath the upper NW flank of Mauna Loa. Data from Global Positioning System (GPS) instruments at the summit and flanks showed continuing inflation, though data from tiltmeters at the summit did not show significant surface deformation over the past week. A pair of earthquakes, M 4.6 and M 5, were recorded at 0907 on 14 October. The first one was located S of Pahala, just offshore, at a depth of about 13 km. The second earthquake followed 24 seconds later and was located S of Pahala (beneath Highway 11) at a depth of 7.4 km. The earthquakes were followed by more than 150 aftershocks in the Pahala region over the next two days. Twenty of the aftershocks were greater than M 2.5 and four were M 3-4. HVO noted that the unrest was likely driven by accumulation of new magma 3-8 km beneath the summit. The Volcano Alert Level remained at Advisory (the second lowest level on a four-level scale) and the Aviation Color Code remained at Yellow (the second lowest level on a four-color scale).
Source: US Geological Survey Hawaiian Volcano Observatory (HVO)
On 5 October HVO noted recent increases in seismicity and deformation at Mauna Loa. The number of earthquakes increased from 5-10 per day in June to 10-20 per day during July-August. The number of daily earthquakes again intensified, to 40-50 per day, starting at about 0200 on 23 September, and peaks as high as 100 per day were recorded on 23 and 29 September. The small-magnitude (less than M3) earthquakes occurred beneath Moku‘aweoweo, the summit caldera, at depths of 2-3 km. Inflation accompanied the swarm and had also increased during the past two weeks.
Daily earthquake counts were relatively unchanged during 6-12 October. Data from Global Positioning System (GPS) instruments at the summit and flanks showed continuing inflation, though data from tiltmeters at the summit did not show significant surface deformation over the past week. Earthquakes were clustered beneath the summit caldera at depths of 3-5 km and below the NW flank at depths of 6-8 km. The Volcano Alert Level remained at Advisory (the second lowest level on a four-level scale) and the Aviation Color Code remained at Yellow (the second lowest level on a four-color scale).
Source: US Geological Survey Hawaiian Volcano Observatory (HVO)
HVO reported that during the previous several months earthquake and ground deformation rates at Mauna Loa were elevated above background levels. During the first half of 2018 the seismic network recorded fewer than 20 shallow, small-magnitude earthquakes per week. Following a significant earthquake swarm in October, the rate increased to at least 50 events per week beneath the summit, upper Southwest Rift Zone, and upper west flank. These locations were similar to those that preceded eruptions in 1975 and 1984. GPS and satellite RADAR data detected deformation consistent with recharge of the shallow magma storage system. The increased seismicity and deformation indicated that Mauna Loa is no longer at background levels, prompting HVO to raise the Aviation Color Code to Yellow and the Volcano Alert Level to Advisory. HVO noted that an eruption was not imminent.
Source: US Geological Survey Hawaiian Volcano Observatory (HVO)
On 21 June HVO reported that seismicity and deformation at Mauna Loa had been at near-background levels for at least the previous six months. The Aviation Color Code was lowered to Green and the Volcano Alert Level was lowered to Normal. During 2014 through most of 2017 seismicity was variable but elevated, and ground deformation was consistent with an influx of magma in the shallow reservoir.
Source: US Geological Survey Hawaiian Volcano Observatory (HVO)
On 17 March HVO reported that seismicity at Mauna Loa remained above long-term background levels and was characterized by shallow earthquakes occurring beneath the Southwest Rift Zone (SRZ) at depths of less than 5 km. GPS data showed continuing deformation related to inflation of a magma reservoir beneath the summit and upper SRZ, with inflation recently detected in the SW part of the magma storage complex. The Aviation Color Code remained at Yellow and the Volcano Alert Level remained at Advisory.
Source: US Geological Survey Hawaiian Volcano Observatory (HVO)
On 18 September HVO reported that for at least the previous year the seismic network at Mauna Loa detected elevated seismicity beneath the summit, upper Southwest Rift Zone, and W flank; the rate of these shallow earthquakes varied but overall had remained above the long-term average. The earthquakes locations were similar to those preceding recent eruptions in 1975 and 1984, although the magnitudes were comparatively low. In addition, ground deformation consistent with recharge of the volcano’s shallow magma storage system was also detected during the previous year. The rate and pattern of the deformation was similar to that measured during a period of inflation 2005, unrest that did not lead to an eruption. However, since the observations indicated that Mauna Loa is no longer at background levels, HVO raised the Aviation Color Code to Yellow and the Volcano Alert Level to Advisory.
Source: US Geological Survey Hawaiian Volcano Observatory (HVO)
On 30 March, HVO reported that the Aviation Color Code and the Volcano Alert Level for Mauna Loa were both lowered to Green and Normal, respectively. Deformation had not been noted since mid-2009 and seismicity was at normal levels.
Source: US Geological Survey Hawaiian Volcano Observatory (HVO)
HVO reported on 21 August that extension across Mauna Loa's summit had resumed over the previous few weeks after pausing for much of July. Seismicity remained at low levels at the volcano.
Source: US Geological Survey Hawaiian Volcano Observatory (HVO)
According to HVO, since early July 2004 an increased number of earthquakes had been recorded from beneath Mauna Loa. From week to week, the numbers fluctuated but remained well above the norm. During the week ending 13 October, 110 earthquakes were located under the summit, up from 47 for the week ending 6 October. Through 13 October, more than 730 earthquakes related to the ongoing seismic activity have been centered beneath Mauna Loa's summit caldera and the adjacent part of the southwest rift zone.
Source: US Geological Survey Hawaiian Volcano Observatory (HVO)
According to HVO, since early July 2004 an increased number of earthquakes had been recorded from beneath Mauna Loa. From week to week, the numbers fluctuated but remained well above the norm. Through September, more than 580 earthquakes were centered beneath Mauna Loa's summit caldera and the adjacent part of the southwest rift zone. Most of these earthquakes were quite deep, from 35 to 50 km below the ground surface and small, less than M 3. They were "long-period" (LP) earthquakes, which means that their signals gradually rise out of the background rather than appearing abruptly. Such a concentrated number of deep LP earthquakes from this part of Mauna Loa is unprecedented, at least in the modern earthquake record dating back to the 1960s. During about 4-11 October, however, only 23 earthquakes were located under the summit.
Source: US Geological Survey Hawaiian Volcano Observatory (HVO)
No changes were noted by HVO at Mauna Loa through 27 September. Since early July 2004, an increasing number of earthquakes had been recorded from beneath Mauna Loa. From week to week the numbers fluctuated but remained well above the earlier established norm. Through the third week of September, more than 560 earthquakes were centered beneath Mauna Loa's summit caldera and the adjacent part of the southwest rift zone. Most of these earthquakes were quite deep, 35-50 km below the surface, and less than M 3. Inflation continued at the summit and showed no change during the increased seismic activity.
Source: US Geological Survey Hawaiian Volcano Observatory (HVO)
No changes have been noted by HVO at Mauna Loa through 21 September. Since early July 2004, an increasing number of earthquakes has been recorded from beneath Mauna Loa. From week to week the numbers fluctuate but remain well above the earlier established norm. Through the second week of September, more than 500 earthquakes were centered beneath the summit caldera and the adjacent part of the southwest rift zone. Most of these earthquakes were quite deep, 35-50 km below the surface, and less than M 3. Inflation was continuing at the summit and has so far shown no change during the increased seismic activity.
Source: US Geological Survey Hawaiian Volcano Observatory (HVO)
HVO reported that beginning in early July 2004 an increasing number of earthquakes had been recorded beneath Mauna Loa. From week to week, the numbers fluctuated but remained well above the norm. Through the first week of September, more than 350 earthquakes were centered beneath Mauna Loa's summit caldera and the adjacent part of the southwest rift zone. Most of these earthquakes were quite deep, from 35 to 50 km below the ground surface. They were "long-period" (LP) earthquakes, which means that their signals gradually rise out of the ambient seismic background. Such a concentrated number of deep LP earthquakes from this part of Mauna Loa is unprecedented, at least in the modern earthquake catalog dating back to the 1960s. Inflation continued at the summit and as of 12 September showed no change during the increased seismic activity.
Source: US Geological Survey Hawaiian Volcano Observatory (HVO)
HVO reported on 18 May that inflation may have resumed at Mauna Loa's summit during the week, after slackening off following an increase in mid-February. Seismicity, however, remained low. Inflation was noted where the GPS network first showed definite lengthening of the lines across the summit caldera in late April or May 2002, after nearly 10 years of slight deflation. HVO interpreted the lengthening, uplift, and tilting to indicate resumed swelling of the magma reservoir within the volcano.
Source: US Geological Survey Hawaiian Volcano Observatory (HVO)
HVO reported on 16 March 2003 that renewed inflation at Mauna Loa's Moku`aweoweo summit caldera began in late February 2003. The GPS network first showed inflation in late April or May 2002, which tailed off and perhaps stopped in mid-winter. The lengthening, uplift, and tilting were interpreted to indicate resumed swelling of the magma reservoir within Mauna Loa. Seismicity remained at low levels.
Source: US Geological Survey Hawaiian Volcano Observatory (HVO)
HVO reported on 27 January that during the previous couple of months the rate of lengthening across Mauna Loa's summit caldera (Moku`aweoweo) slowed significantly. The lengthening started in late April or May, as did uplift measured by GPS and ground tilt measured by several dry-tilt stations. As of the 27th, seismicity remained at low levels.
Source: US Geological Survey Hawaiian Volcano Observatory (HVO)
On the afternoon of 1 November volcanic tremor, centered low on Mauna Loa's SE flank, occurred for 30 minutes. HVO stated that this is a common occurrence, taking place several times a year in the same general region. The permanent, continuous GPS network indicated ongoing lengthening across Moku`aweoweo summit caldera, as it has since late April or May 2002.
Source: US Geological Survey Hawaiian Volcano Observatory (HVO)
As of 28 October Mauna Loa continued to inflate, but seismicity remained at low levels. The permanent, continuous GPS network indicated ongoing lengthening across Moku`aweoweo summit caldera, as it has since late April or May 2002.
Source: US Geological Survey Hawaiian Volcano Observatory (HVO)
A brief period of low-amplitude tremor occurred at Mauna Loa's summit on 7 October, lasting several minutes. It apparently was triggered by, or at least quickly followed, a small earthquake. The following day, several more small earthquakes took place. By the 10th, seismicity had returned to low levels. During 8-15 October, the permanent continuous global positioning system network indicated that ongoing lengthening occurred across Moku`aweoweo summit caldera as it has since late April or May.
Source: US Geological Survey Hawaiian Volcano Observatory (HVO)
HVO reported on 30 September that a pattern of slow deflation occurring at Mauna Loa for the past 9 years abruptly changed in mid-May when the summit area began to slowly swell and stretch. Global Positioning System measurements revealed that distances across the summit caldera (Moku`aweoweo) have been lengthening at a rate of 5-6 cm per year, and the caldera has widened about 2 cm since 12 May. The summit area was slightly higher than before mid-May, consistent with swelling. In addition, the upper part of the SE flank showed outward movement. Seismicity remained low at Mauna Loa, although it may have been slightly higher level than during the pre-inflation interval.
Sources: Associated Press; US Geological Survey Hawaiian Volcano Observatory (HVO); US Geological Survey Hawaiian Volcano Observatory (HVO)
A small earthquake cluster event, with magnitudes between 1.1-1.7, occurred at Mauna Loa during 19-26 April. There were no signs indicating that an eruptive event was imminent and no significant deformation was recorded.
Source: US Geological Survey Hawaiian Volcano Observatory (HVO)
Reports are organized chronologically and indexed below by Month/Year (Publication Volume:Number), and include a one-line summary. Click on the index link or scroll down to read the reports.
Lava fountains in the summit caldera and along two rift zones
Card 2212 (07 July 1975) Lava fountains in the summit caldera and along two rift zones
Mauna Loa volcano began erupting at 2344 hours HST, 5 July 1975 (0944 GMT 6 July). By 0200 July 6th a line of fountains extended the length of the summit caldera in a N30°E direction through the cones of 1940 and 1949. Fresh lava covered most of the caldera floor, and overflowed from both South Pit and North Pit. Fountains extended for about 2 km beyond the caldera margin into the southwest rift zone, and new flows traveled as much as 3 km down the flanks of the volcano both southward and westward and partly filled the pit craters Lua Honhonu and Lua Hou. Fountains also extended into the northeast rift zone and ultimately reached 3 km beyond the margin of North Pit.
Caldera activity stopped between 0400 and 0500, soutwest rift zone activity stopped about 0600, and activity concentrated in the northeast rift zone along two en echelon fissures 1 km long at an elevation of about 3,780 m. Major flows from these fountains traveled 5 km ENE along the rift zone and 6 km NNE down the N flank. Activity continued through the morning, declined in the afternoon, and all fountains ended by early evening.
Frequent earthquakes centered along the northeast rift zone and harmonic tremor are continuing as of 0300 on 7 July.
Information Contacts: Robert Tilling and Donald W. Peterson, Hawaiian Volcano Observatory, USGS.
Increased seismicity during 20-24 November
A substantial increase in the number of earthquakes beneath Mauna Loa was recorded 20-24 November (table 1). On the morning of 25 November, only one earthquake was recorded (beneath the NE rift). The USGS predicts a major eruption of Mauna Loa within the next 18 months.
Table 1. Earthquakes recorded at Mauna Loa during 20-24 November 1976.
| Date | Event Totals |
| 20 Nov 1976 | 350 |
| 21 Nov 1976 | 200-300 |
| 22 Nov 1976 | 200-300 |
| 23 Nov 1976 | more than 300 |
| 24 Nov 1976 | less than 100 |
Information Contacts: UPI
New fumarolic activity and increased inflation rate
The July 1975 eruption of Mauna Loa has been described by Lockwood and others (1976). Soon after this eruption, Mauna Loa began to inflate, and, chiefly on the basis of the historic patterns of activity, the USGS predicted that a second eruption, followed soon thereafter by a larger eruption from the NE rift, was likely to occur before July 1978. During the first half of 1977, however, local seismicity and inflation rates declined considerably, and in July 1977 the USGS issued a press release withdrawing the "before July 1978" date for the predicted eruption. Seismicity beneath the summit region has remained low, but measurements made in December 1977 indicate that the inflation rate for June-December 1977 had increased to that recorded during 1976. Furthermore, dense fume clouds have been emitted from the 1975 eruptive fissures since October 1977. The USGS has installed gas monitoring devices on one of these fumaroles and is continuing to monitor the volcano closely.
Reference. Lockwood, J., Koyanagi, R., Tilling, R., Holcomb, R., and Peterson, D., 1976, Mauna Loa threatening: Geotimes, v. 21, no. 6, p. 12-15.
Information Contacts: G. Eaton, HVO, Hawaii.
Seismicity and summit caldera deformation increase
"Mauna Loa last erupted in July 1975. That eruption was preceded by an increase in both shallow and intermediate-depth earthquakes, and by extension of survey lines across the caldera (figure 1, left). Since 1980, and especially since early 1983, the number of shallow earthquakes beneath Mauna Loa has been increasing again. Intermediate-depth earthquakes have continued at a higher rate during the period from 1978 to present than during 1971-73, but have not shown the same pattern of increase as they did in 1974 (figure 1, right). Figure 1 also shows a recent increase in the rate of extension of survey lines across the summit caldera.
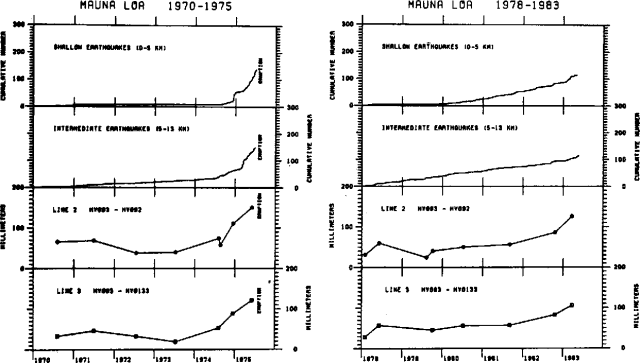 |
Figure 1. Plot of cumulative number of local earthquakes at shallow (0-5 km) and intermediate (5-13 km) depths, and extension (in mm) on two survey lines across the summit caldera, for 1970-75 (left), and 1978-83 (right). |
"The recent rate of strain from apparent intrusion of magma beneath the summit region shows an increasing trend from both seismic and ground surface deformation data. The present strength of the summit region is not known, so no precise forecast of the next eruption can be made. However, the present seismic and deformation data indicate a significantly increased probability of eruption of Mauna Loa during 1983 or 1984."
Information Contacts: R. Decker, R. Koyanagi, and J. Dvorak, HVO, Hawaii.
Fissure eruption produces voluminous lava flows from NE rift vents; SO2-rich tropospheric plume reduces visibilities 7,000 km away
The following (except for the plume data) is from HVO. Times noted below are preliminary and subject to slight revision after later analysis. "A long-expected flank eruption of Mauna Loa began on 25 March, and had ended by 14 April.
Background. "When summit seismic activity increased sharply in April 1974, Mauna Loa had not erupted since June 1950. Measurement of EDM lines across the summit caldera (Mokuaweoweo) in the summer of 1974 revealed significant extensions, monitoring capabilities were increased, and a forecast of renewed activity was issued (Koyanagi and others, 1975). The summit eruption of 5-6 July, 1975 lasted for less than 20 hours, and only about 30 x 106 m3 of lava were erupted. The eruption was identical to numerous other Mauna Loa summit eruptions that had been followed within 3 years by large flank eruptions. Given the historic record and continuing inflation, a forecast was made for renewed eruptive activity sometime before the summer of 1978 (Lockwood and others, 1976). The 1976 forecast was rescinded in 1977 but slow inflation continued and another forecast (based on an increase in the rate of geodetic change and seismic activity) was issued in 1983. This called attention to the increased probability of a Mauna Loa eruption within the next two years' (Decker and others, 1983), but see SEAN 08:05 in which the forecast was more specific: 'a significantly increased probability of eruption of Mauna Loa during 1983 or 1984.'
Premonitory activity. "The 25 March outbreak gave almost no short-term instrumental warning. Seismic activity had been increasing gradually through March (figure 2), but was relatively low immediately preceding the outbreak; only 29 microearthquakes were recorded beneath the summit caldera during the preceding 24 hours (in contrast to 700 microearthquakes/day in September 1983).
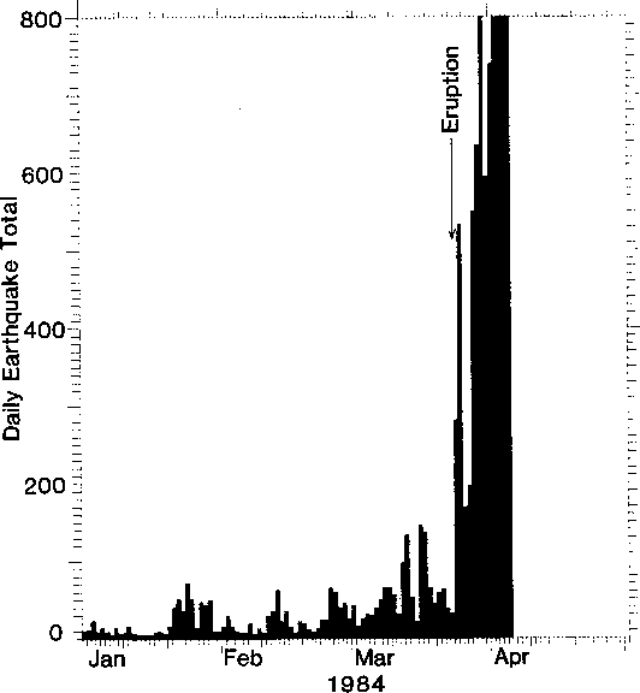 |
Figure 2. Number of earthquakes per day at Mauna Loa, 1 January-5 April. The start of the eruption is indicated by an arrow. |
"Several people saw probable fume clouds from the summit caldera and a camper at the summit noted small explosions from the 1975 eruptive fissures on 23 March. One hiker had reported seeing 'glowing cracks' near the 1940 cone on 18 March, but no anomalous activity was detected on a thermal probe in the 1975 fumaroles. Oxidation state and temperatures of fumarolic gases remained essentially unchanged prior to the last satellite transmission about midnight on 24 March.
Eruption narrative. "At 2255 on 24 March, a small earthquake swarm began directly beneath the summit. Weak harmonic tremor with an amplitude of about 1 mm was recorded at the summit station (WIL, figure 3) at 2330. The number of small summit earthquakes increased at 2350. Tremor amplitude recorded at the summit increased to about 5 mm at 0015 on 25 March, remained high at 0051, and was recorded on all Mauna Loa and Kīlauea summit area stations.
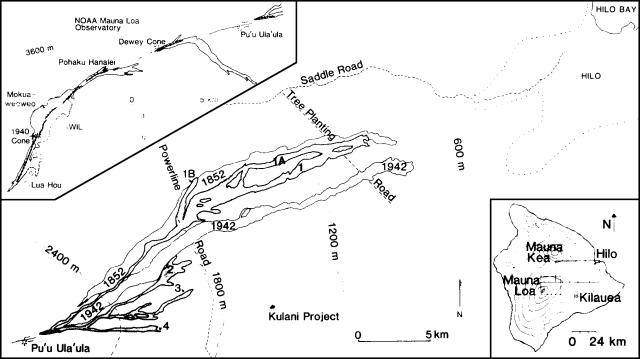 |
Figure 3. Sketch maps of the NE rift zone and summit of Mauna Loa, showing positions of 1984 lava flows (stippled) as of 5 April. Eruption fissures are indicated by hachured lines. The edge of the suburbs of Hilo is shown by a dotted line on the NE rift zone map. The areas covered are shown by the index map (inset). |
"At 0055 a magnitude 4.0 earthquake beneath the summit awoke geologists (from the University of Massachusetts) camped at Pu'u Ula'ula on the NE Rift Zone. At 0056, the telescope at the summit of Mauna Kea (42 km NNW of Mauna Loa) began high-amplitude oscillation, preventing astronomical observations for the next few hours. Between 0051 and 0210, 11 earthquakes with magnitudes between 2.0 and 4.1 were recorded beneath the summit. At 0100 borehole tiltmeters recorded the onset of rapid summit inflation.
"A military satellite detected a strong infrared signal from the summit at 0125. Glow was sighted in the SW portion (1940 cone area) of the summit caldera by an observer on the summit of Mauna Kea at 0129, by the geologists at Pu'u Ula'ula at 0130, and from Kīlauea at 0140. At 0146, fountain reflection on fume clouds observed from HVO suggested that fountaining extended across much of SW Mokuaweoweo and was migrating down the SW Rift Zone.
"At 0232 the tops of fountains within Mokuaweoweo were seen from Pu`u Ula`ula, suggesting a height greater than 100 m. At approximately 0340, fountaining ceased on the SW Rift Zone. At 0357, 30-m-high fountains migrated out of Mokuaweoweo, down the upper NE Rift Zone. Lava flowed downrift and onto the SE flank.
"At approximately 0600, fountaining in the caldera gradually ended. At 0632, a new vent opened about 700 m E of Pohaku Hanalei and 8 minutes later another en echelon fissure began to erupt about 600 m downrift. Lava appearance was preceded by 3 minutes of copious white steam emission from the fissure. For the next 2.5 hours, activity waned.
"At 0905, profuse steaming appeared on a fracture at about 3,510 m altitude, and at 0910 fountaining 15-40 m high began at 3,410 m and migrated downrift. At 0930, fountains above Pohaku Hanalei died down as lava production increased to approximately 1-2 x 10⁶ m3/hour along a 2 km-long curtain of fire between about 3,400 and 3,470 m. The loci of most vigorous fountaining alternated along the 2-km fountain length. Much of the production from these vents was consumed by an open fissure parallel to and S of the principal fissure upslope, although an aa flow did move 5 km SE, S of an 1880 flow. During activity of these vents, episodic turbulent emissions of red and brown `dust' from the eruptive fissures sent clouds to about 500 m height. At 1030, steaming was noted along a 1-km-long crack system extending from about 3,260-3,170 m, but there was no further downrift migration of eruptive vents for several hours. At about 1550, ground cracking extended below 3,000 m, and at 1641 eruptive vents opened at about 2,800 m and migrated both up- and downrift. At 1830 an eruptive vent extended about 1.7 km from about 2,770-2,930 m elevation. Fountains to 50 m height fed fast-moving flows to the E and NE. Activity waned at the 3,400-m vents.
"By 0640 the next day, all lava production had ceased above 3000 m. Fountains (to 30 m height) were localized along a 500-m segment of the fissure that had opened the previous afternoon. The fastest moving flow cut the power line to the NOAA Mauna Loa Observatory shortly before dawn. At 0845, the E flows were spread out over a wide area above 1,900 m elevation, but their advance slowed during the day. Four principal eruptive vents then developed along this fissure system. Two vents fed the NE flow (1), while the other two fed the S (2-4) flows. Flow 1 steadily advanced downslope 27-28 March (figure 4), between the 1852 and 1942 lava flows. Approximately 80% of the lava production fed flow 1. Flows 2-4 ceased significant advance by 28 March. The terminus of flow 1 stopped significant advance by early 29 March, while production at the vents remained essentially constant. This suggested that a new branch flow had developed upslope. Bad weather prevented confirmation of the new branch until 30 March. This new flow (1A) moved rapidly downslope, N of flow 1.
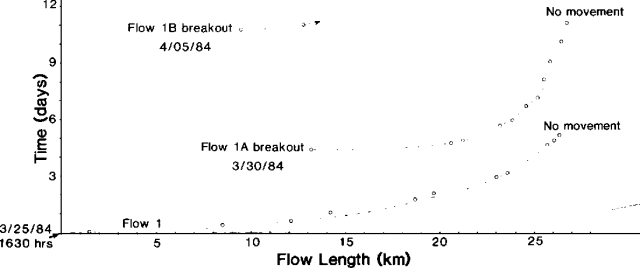 |
Figure 4. Rates of movement of flows 1, 1A, and 1B in kilometers per day. Small circles represnet observations of flow positions. Courtesy of J.P. Lockwood. |
"Phase 17 of Kīlauea's E Rift Zone eruption began that morning but had no apparent effect on Mauna Loa activity. Likewise Kīlauea tilt showed no deflection at the time of the Mauna Loa outbreak on 25 March.
"Flow 1A slowed on 31 March as the feeding channel became sluggish, and the flow thickened and widened upstream. At 1215 on 5 April, the flow was moving very slowly (18 m/hour) slightly below 900 m elevation. A major overflow at about 2,000 m shut off most of its lava supply and created a fast-moving flow (lB), which advanced 3 km NE to about 1,800 m elevation by 1700.
Deformation. "Much of the NE rift zone geodetic monitoring network was measured shortly before the 25 March outbreak, and EDM, tilt, and gravity stations were re-measured several times during the eruption. Although continuously recording tiltmeters at the summit showed sharp inflation (dike emplacement) immediately preceding the outbreak, major subsidence of the summit region accompanied eruptive activity along the NE rift. The center of subsidence, near the S edge of the summit caldera (figure 5), was coincident with the center of uplift identified from repeated geodetic surveys between 1977 and 1983. The amount of summit deflation recorded by tilt and horizontal distance measurements exceeded the amount of gradual inflation of the volcano since the July 1975 summit eruption, suggesting substantial injection of magma into the summit area prior to this eruption, and possibly prior to the first EDM line across the summit caldera in 1964. Maximum vertical elevation change, inferred from repeated gravity measurements, is 500 mm.
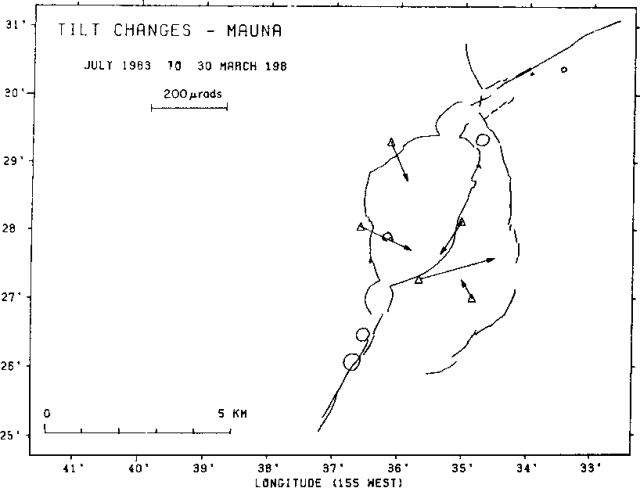 |
Figure 5. Tilt changes near the summit of Mauna Loa, July 1983-30 March 1984. |
"Large extensions occurred across the middle NE rift zone during dike emplacement on 25 March, but EDM monitor lines across this zone showed no significant change after the initial dilation. The rate of summit subsidence initially followed an exponential decay, similar to subsidence episodes in the summit region of Kīlauea. Since 30 March, tilt and horizontal distance measurements have indicated a steady rate of deflation (figures 6 and 7), although measurements on 6 April suggest decreasing deflation rates.
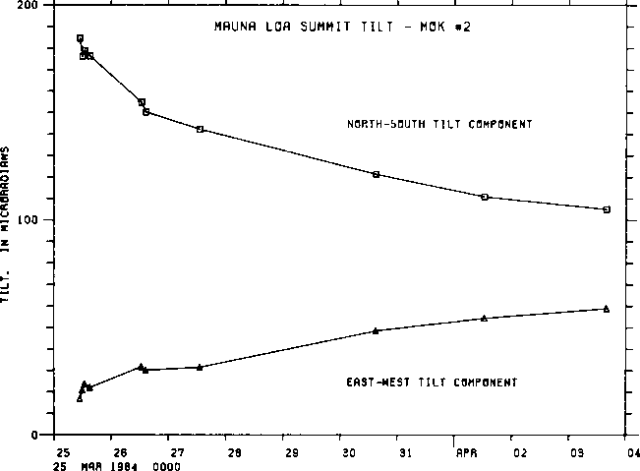 |
Figure 6. Plot of summit tilt vs. time, 25 March-3 April 1984. |
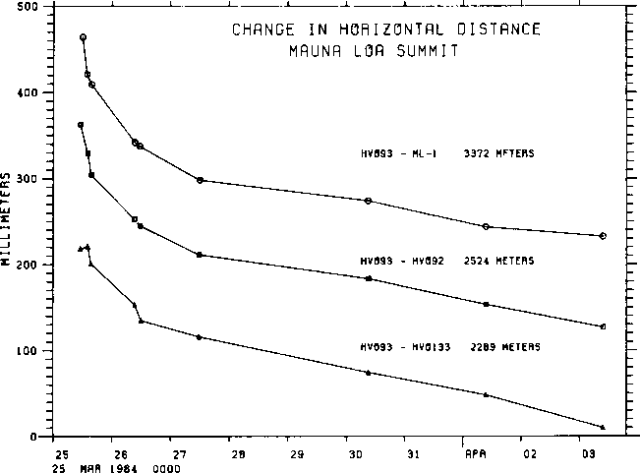 |
Figure 7. Change in horizontal distance across the summit of Mauna Loa vs. time, 25 March-3 April 1984. |
Dike propagation. "All dikes were emplaced within the first 15 hours of the eruption. The eruptive fissure (surface expression of dikes) extended discontinuously along a 25-km zone from 3,890 m on the SW rift zone to about 2,770 m on the NE rift zone. Ground cracking along most of this zone demonstrates the continuity of the dike at shallow levels. Lateral propagation rates vary from >2,500 m/hour down the SW rift zone to about 1,200 m/hour in lower parts of the NE rift zone (figure 8).
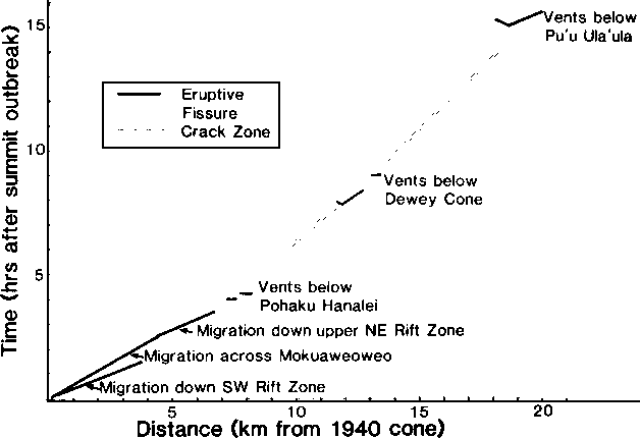 |
Figure 8. Rate of propagation of eruption fissures, shown as distance from the 1940 cone (in the SW part of the summit caldera) vs. hours after the start of the eruption. |
Petrography, lava temperatures, and gas measurements. "Hand specimens of the 1984 basalt are very fine-grained with widely scattered (<1%) phenocrysts of olivine <3 mm in diameter and sparse microphenocrysts of plagioclase and clinopyroxene. Most olivines are anhedral, resorbed, commonly kinked, and surprisingly forsteritic (Fo88-90). Plagioclase and clinopyroxene are barely resolvable in the groundmass. Maximum temperatures determined repeatedly by thermocouple and radiometer ranged from 1,137 to 1,141°C and had not changed as of 5 April.
"Eruptive gases have been extensively sampled and analyzed. Observed C/S ratios are much lower than expected in primitive Hawaiian tholeiite, suggesting extensive degassing in a shallow (<4 km deep) magma reservoir.
Geoelectric studies. "One self-potential (SP) profile, first measured in July 1983, exists across the NE Rift Zone about 1 km W of the main erupting vents. The first complete reoccupation of the SP line 3 days after the eruption's start showed an amplitude increase slightly > l00 mV centered over a zone about 300 m wide across the 1.5 km-long crack zone N of Pu'u Ula'ula. VLF measurements show that the dike is located nearly in the center of the cracked zone, directly beneath the pre-existing SP maximum, at a very approximate depth of 150 m.
Areal extent and volume of lava. "As of 5 April, 25-30 km2 of area was covered. The lava is mostly pahoehoe near the vents, but is mostly aa more than 2 km from the vents. The volume was estimated to be about 150 x 106 m3 by 5 April."
Eruption plume. The eruption produced a large gas plume that was carried thousands of kilometers to the W. The plume from the summit caldera activity was clearly visible from HVO. An airline pilot approaching Honolulu at dawn 25 March reported that the top of the plume was between 10.7 and 11 km altitude and was drifting SW. Observers at Honolulu airport tower (300 km NW of Mauna Loa) reported that the top of a tall cumulus-like cloud became visible S of the airport just before dawn.
There was no evidence that the plume reached the stratosphere; the tropopause on 25 March was at about 18 km altitude. The plume was carried W by trade winds. By 30 March, a haze layer was detected at Wake and Johnston Islands (3,900 km W and 1,400 km WSW of Mauna Loa; table 2). Haze reached Kwajalein (4,000 km WSW of Mauna Loa) the next day and had reached Guam (6,300 km WSW of Mauna Loa) by 2 April.
Table 2. Visibilities at airports on several islands affected by the plume from Mauna Loa (distances are from Mauna Loa). All times are Hawaiian Standard Time. Note that all except Johnston Island are across the International Date Line from Hawaii. Data courtesy of NOAA.
| Island | Distance | Visibility | Date and Time (1984) |
| Johnston | 1,400 km WSW | 6 km | 2200 on 2 April - 0200 on 3 April |
| Wake | 3,900 km W | 1.6 km | 1200 on 2 April - 1700 on 2 April |
| Ponape | 5,000 km WSW | 3.2 km | 1000 on 2 April - 1400 on 2 April |
SO2 emitted by Mauna Loa was detected by the TOMS instrument on the Nimbus 7 polar orbiting satellite, which passed over Hawaii daily at about local noon (figure 9). Although the TOMS instrument was designed to measure ozone, it is also sensitive to SO2. An algorithm has been developed to isolate SO2 values and calculate its approximate concentration within pixels (picture elements) roughly 50 km in diameter. Preliminary estimates of the total SO2 in the Mauna Loa plume, using TOMS data, were roughly 130,000 metric tons on 26 March and 190,000 metric tons on 27 March.
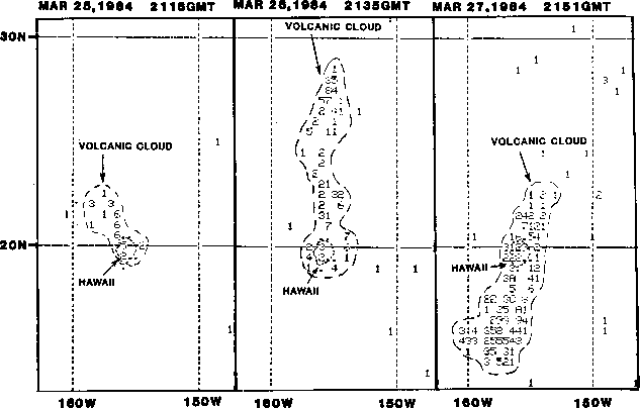 |
Figure 9. Preliminary SO2 data from the TOMS instrument on the Nimbus-7 satellite. All values less than 10 milliatmosphere-cm (100 ppm-meters) have been supressed. Each number or letter represents the average SO2 value within an area 50 km across. 1 = 11-15 matm-cm = 101-150 ppm-m, 2 = 16-20 matm-cm = 151-200s ppm-m, etc; 9 is followed by A, B, C, etc. Courtesy of Arlin Krueger. |
References. Decker, R.W., Koyanagi, R.Y., Dvorak, J.J., Lockwood, J.P. Okamura, A.T. Yamashita, K.M., and Tanigawa, W.R., 1983, Seismicity and surface deformation of Mauna Loa volcano, Hawaii: EOS, v. 64, no. 37, p. 545-547.
Koyanagi, R.Y., Endo, E.T., and Ebisu, J.S., 1975, Reawakening of Mauna Loa volcano, Hawaii; a preliminary evaluation of seismic evidence: Geophys. Res. Letters, v. 2, no. 9, p. 405-408.
Information Contacts: J. Lockwood and HVO staff, Hawaii; M. Rhodes, Univ. of Massachusetts; M. Garcia, Univ. of Hawaii; T. Casadevall, CVO, Vancouver, WA; A. Krueger, NASA/GSFC; M. Matson, NOAA/NESDIS.
Major NE Rift Zone eruption ends; total eruption volume
"The NE Rift Zone eruption, which began on 25 March, ended early on the morning of 15 April. Lava output and fountain vigor steadily decreased during the last week of the eruption. As flow channels became blocked (by sluggish aa and channel collapse breccias) progressively farther upslope, flows terminated higher on Mauna Loa's NE flank. Many short overflows of viscous aa, up to 15 m thick, moved less than a few hundred meters from these points of channel blockage. By 10 April, no lava flowed below 2,400 m. The total area covered by new lavas increased very little after 5 April, as multiple flows mostly piled on top of older flows. Total volume for this eruption was estimated at 180-250 x 106 m3."
Information Contacts: J. Lockwood and T. Wright, HVO, Hawaii.
Steady post-1984 reinflation eruption but seismicity low
"Mauna Loa's latest eruption was in March-April 1984 on the Northeast rift zone. The eruption was associated with a large collapse (figure 10) and seismicity that peaked during and following the eruption (figure 11). Since 1984 the volcano has begun to reinflate, as shown by outward tilt and horizontal extension of Mauna Loa's summit area.
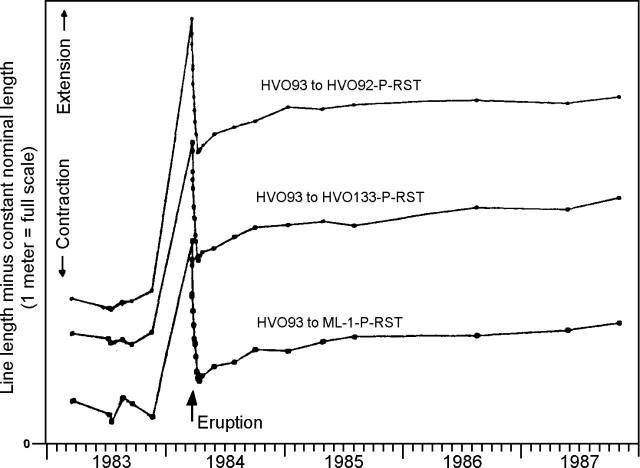 |
Figure 10. EDM data along three lines across Mauna Loa's summit caldera, January 1983-4 November 1987. HVO 93 is on the NW rim of the caldera, and the three lines cross the caldera in ESE, SE, and S directions, respectively, to the SE rim. Courtesy of HVO. |
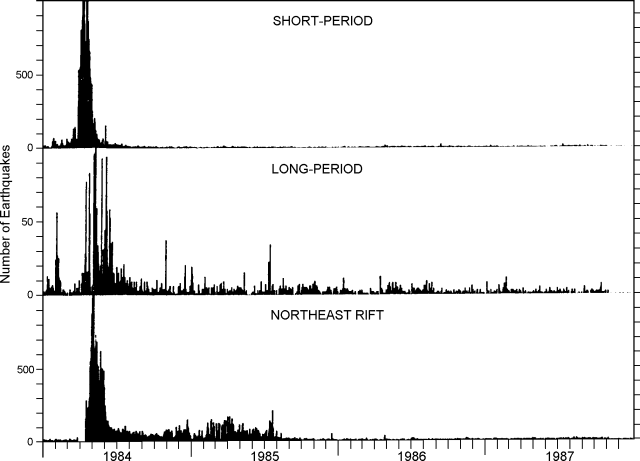 |
Figure 11. Daily number of recorded short-period (top) and long-period (middle) summit microearthquakes, and NE rift events (bottom) at Mauna Loa, January 1984-4 November 1987. Courtesy of HVO. |
Seismicity. "Following the increase and peak in seismicity of the last eruption in Mar-Apr 1984, the number of shallow microearthquakes had slowly decreased (figure 11). Most of the post-eruption events were attributed to the gradual structural adjustments from the major deflation at the summit (resulting from the voluminous magma withdrawal) and the principal eruptive vent near Pu'u Ulaula on the Northeast rift zone. The post-eruption pattern of decreasing seismicity is indicated by the daily number of summit microearthquakes and Northeast rift events.
"There has been no significant seismic activity beneath the summit and rift zones of Mauna Loa since the 1984 eruption, and the present level of shallow seismicity is relatively low. There has been some increase in intermediate-depth events beneath the volcano noticed over the past year. Most of the events are very small, recorded only on a few summit and rift stations, and essentially < 0.5 in magnitude.
Ground deformation. "Deformation studies show that Mauna Loa reinflation has been steady; at this writing the summit has recovered over 1/3 of the amount of subsidence that took place during the eruption, as measured by both dry tilt and cross-caldera EDM (figure 10).
"A forecast of the next Mauna Loa eruption will depend on two things: an increase in shallow earthquakes and tilt recovery. The last two eruptions showed a precursory period of 1 year (July 1975 eruption) and 4 years (March 1984 eruption) respectively from the time of increased seismicity to the onset of eruption. There is no absolute level of tilt recovery at which we can specify that Mauna Loa will erupt. However, we would consider roughly 90% recovery from the 1984 deflation would indicate a state of readiness to erupt. On the basis of the data shown here we would not expect a Mauna Loa eruption for at least five years. We will update this estimate as we continue to monitor tilt and seismicity . . . ."
Information Contacts: T. Wright, R. Koyanagi, and A. Okamura, HVO.
50% of 1984 deflation recovered; no shallow seismicity
By 17 November 1988, when Mauna Loa's summit tilt network was relevelled, the summit region had recovered ~50% of the deflation associated with the 1984 eruption (figures 12 and 13). Intermediate-depth microearthquakes have occurred at a moderate rate in the summit region. However, the abundant shallow seismicity that originated beneath the summit crater during the year before the 1975 eruption and for 4 years before the 1984 eruption has not been observed. The absence of such precursory shallow seismicity suggests to HVO geophysicists that the next eruption . . . is several years away.
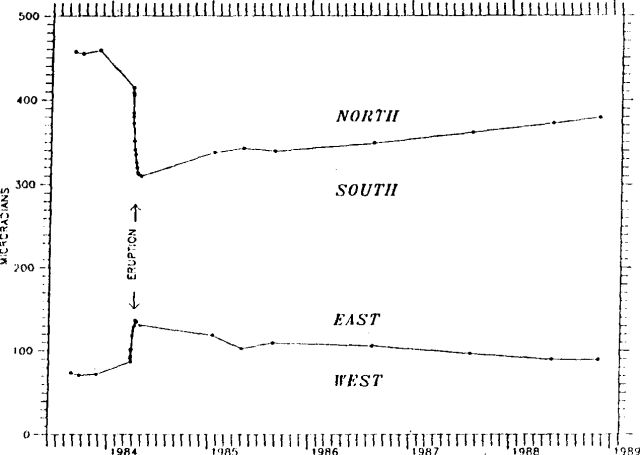 |
Figure 12. Changes in N-S and E-W components of tilt at Mauna Loa, measured by station NEW MOK 2 on the NW rim of the caldera, 1 June 1983-17 November 1988. |
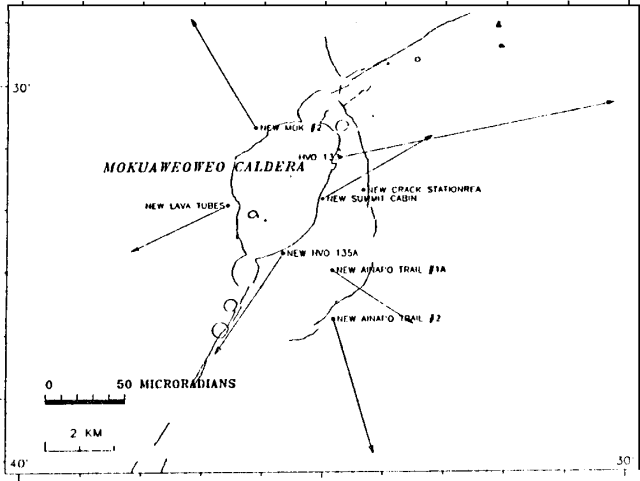 |
Figure 13. Dry tilt changes near the summit of Mauna Loa from 23-27 April 1984 to 8-17 November 1988. Courtesy of T. Wright. |
Information Contacts: T. Wright, HVO.
Summit earthquake swarm
Surface deformation measurements indicate gradual reinflation of Mauna Loa's summit since its 1984 eruption. Earthquake counts have fluctuated, but have apparently increased since late 1990.
Two bursts of intermediate-depth volcanic tremor, beginning at about 1200 on 13 July, preceded a swarm of long-period earthquakes that continued for ~14 hours. Activity peaked between 2300 on 13 July and 0100 the next morning. As the long-period events gradually declined, shallow microearthquake activity increased, and continued for about 6 hours. All of the events were too small for precise location.
The 13 July activity began ~2 hours before an earthquake swarm under the summit of Kīlauea. Seismicity at Mauna Loa has apparently returned to average background levels since mid-July.
Information Contacts: P. Okubo, HVO.
Following 9 years of slow deflation, quicker inflation since mid-May 2002
Mauna Loa is the southern-most volcano on the island of Hawaii. Following the last eruption of Mauna Loa, during March-April 1984 (SEAN 09:03), there have been several periods of inflation and deflation at the volcano's summit caldera, Moku`aweoweo. As of September 2002, Mauna Loa has remained non-eruptive (figure 14) for 18.5 years. The pattern of deformation at Moku`aweoweo abruptly changed in mid-May 2002 from deflation to inflation, lasting until at least September 2002. An archive of deformation and seismic data from Mauna Loa dating back to the 1970s provides an example of the volcano's pre-eruptive and precursory behavior.
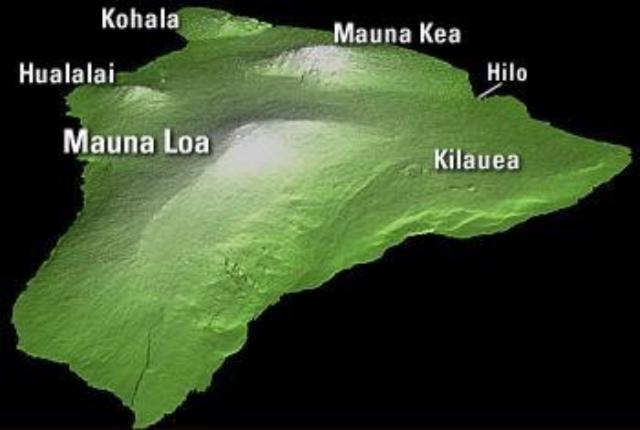 |
Figure 14. Oblique shaded-relief map (N at top) showing the location of the city of Hilo and the five volcanoes that built the island of Hawaii. The young growing submarine volcano Lōʻihi is not shown. When including the submarine portions of Hawaii attributed to Mauna Loa, it ranks as Earth's largest active volcano, encompassing 51 percent of the island's surface area and comprising a volume over ~ 65,000 km3. Courtesy HVO. |
After the last Bulletin report about Mauna Loa in July 1991(BGVN 16:07) the volcano's summit continued to gradually inflate as it had since the 1984 eruption. This trend reversed in 1993-1994 when distances across the caldera shortened by as much as 7 cm, and leveling surveys in 1996 and 2000 measured more than 7 cm of subsidence SE of the caldera.
Beginning on 24 April 2002 at 0645 a notable cluster of deep earthquakes (darkest circles in figure 15) occurred in a 52-hour period. The earthquakes ended on 26 April at 1045. Many of the epicenters plotted within or close to the caldera's SW margin. The earthquakes ranged in depth from 26 to 43 km and in magnitude from 1.1 to 1.7. Several shallow earthquakes preceded this cluster; the largest, a magnitude 2.5 event on 21 April at 1931, was located ~3 km beneath the SW rift zone. After the cluster, several deep long-period events were recorded beneath the SW rift zone. At that time data from the continuous tiltmeter, dilatometer, and nearly continuous global positioning system (GPS) stations failed to suggest significant deformation of Moku`aweoweo caldera, upper-rift zones, or outer flanks.
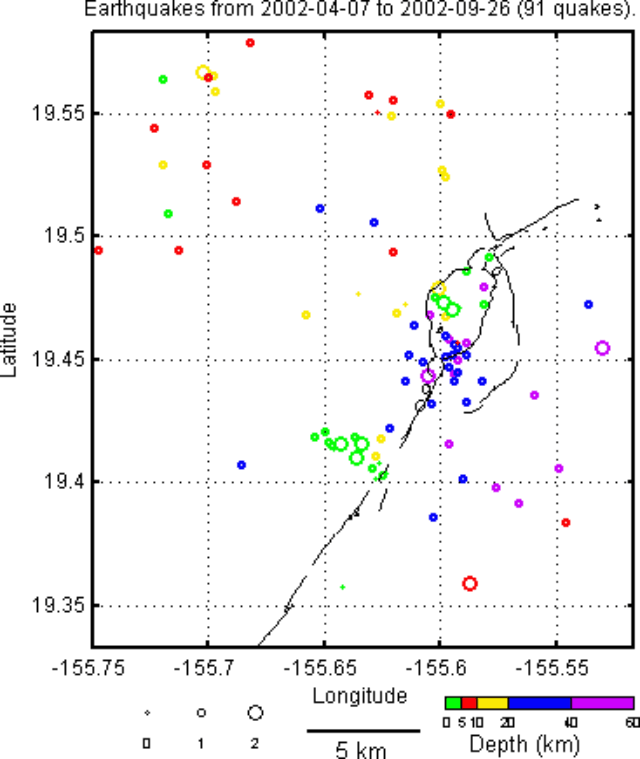 |
Figure 15. Plot showing the magnitudes, locations, and depths of earthquakes registered at Mauna Loa during 7 April- 26 September 2002. Following the swarm of deep earthquakes during 24-26 April (dark circles), seismicity was somewhat elevated. |
Inflation. HVO maintains several continuously recording GPS stations installed in 1999 (figure 16). Beginning in late April or early May 2002, deformation data began to show signs of renewed activity.
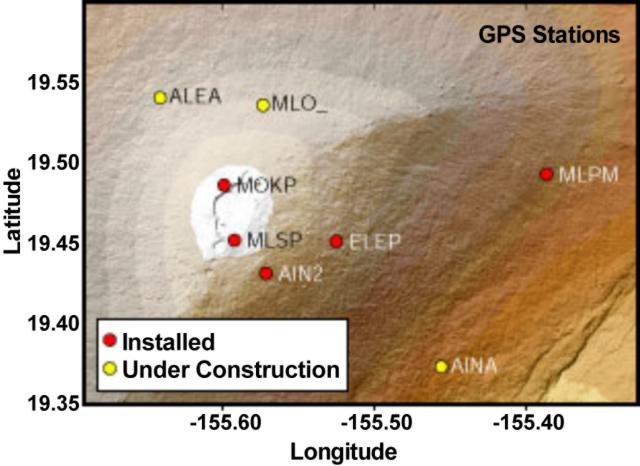 |
Figure 16. Map showing the several GPS stations HVO maintains on Mauna Loa as of September 2002. HVO plans to install several additional stations (white dots), on indefinite loan from Stanford University. Courtesy HVO. |
Figure 17 shows the change in distance between MOKP and MLSP GPS stations, located on opposite sides of Moku`aweoweo. The increased distance between the two stations was interpreted to represent inflation of the summit magma reservoir, centered ~5 km below the caldera. The small amount of extension marks a noticeable change from the pattern of deflation during the preceding 9 years. GPS measurements also revealed that the summit area had inflated about 2 cm, consistent with swelling.
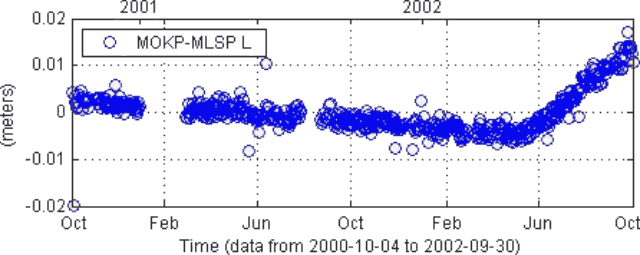 |
Figure 17. Graph showing the change in distance between GPS stations MOKP and MLSP, located on opposite sides of Moku'aweoweo caldera, as seen during 4 October 2000-30 September 2002. Distance across Moku'aweoweo began to increase by 5-6 cm/year starting in late April-May 2002. Courtesy HVO. |
The switch from slow deflation to more rapid inflation occurred around 12 May. GPS data indicated lengthening at a rate of 5-6 cm per year. Therefore, as of 26 September the caldera had widened about 2 cm since 12 May. Measurements at GPS stations farther out on the flanks showed that swelling occurred at more than the summit, in particular, the upper part of the SE flank was moving outward.
In order to test the precision of the GPS measurements, HVO compared the GPS data against dry-tilt method data at the summit, an independent means to measure ground deformation using land-surveying instruments, deployed at regularly visited stations. These confirmed the GPS results, though with less precision.
Electronic-tiltmeter data obtained at the Moku'aweoweo tiltmeter were also analyzed for changes in tilt direction. No significant volcanic tilt was recorded that deviated from the diurnal signal corresponding to daily temperature fluctuations, or an annual signal corresponding to seasonal temperature changes.
During the inflationary period, seismicity at Mauna Loa was at a somewhat elevated level following the 24-26 April earthquake cluster. But, it remained far lower than it was the months prior to the 1975 and 1984 eruptions.
May-September 2002 unrest in comparison to activity since 1974. For Mauna Loa these data sets are available: electric distance meter (EDM) measurements since about 1975, GPS observations since 1999, dry-tilt observations since 1975, and seismicity since 1974. The capability to detect unrest at Mauna Loa has increased in the past few years with the installation of many new, continuously recording electronic tiltmeters, GPS receivers, and strainmeters (figure 18).
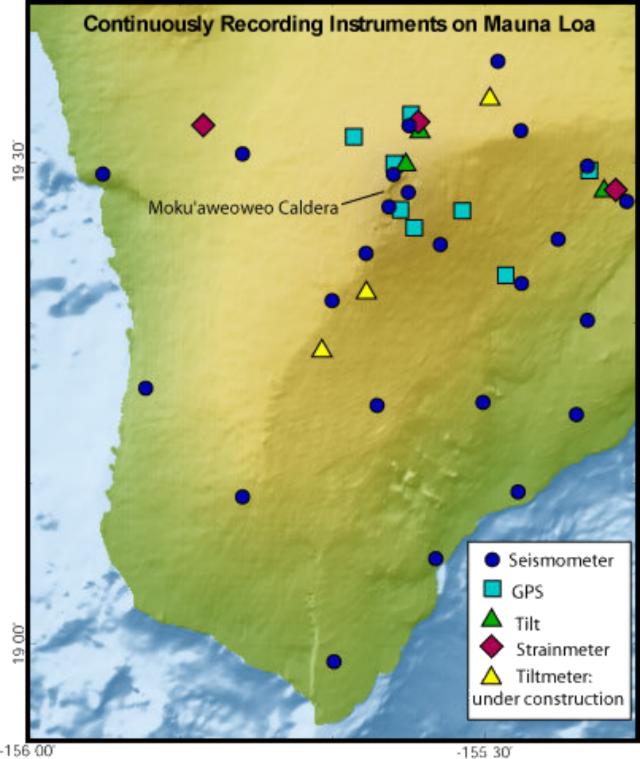 |
Figure 18. Map showing locations of continuously recording instruments for measuring deformation and seismicity at Mauna Loa as of September 2002. This map omits many additional benchmarks used in various deformation surveys. Courtesy HVO. |
Figure 19 shows the distance measured across Moku`aweoweo caldera between MOKP and MSLP benchmarks by EDM during 1975 to September 2002, and by GPS beginning in 1999. Abrupt extensions associated with the 1975 and 1984 eruptions were caused by the rise of magma from the summit reservoir to the surface. During the 1984 eruption, the summit area subsided rapidly as lava erupted. When the eruption stopped, the summit reservoir again began to inflate in response to the influx of magma, as indicated by the increasing distance between the two benchmarks until about1993. Inflation did not occur again until early May 2002 when the slow contraction across the summit changed abruptly to extension. This extension rate is the highest since immediately after the 1984 eruption.
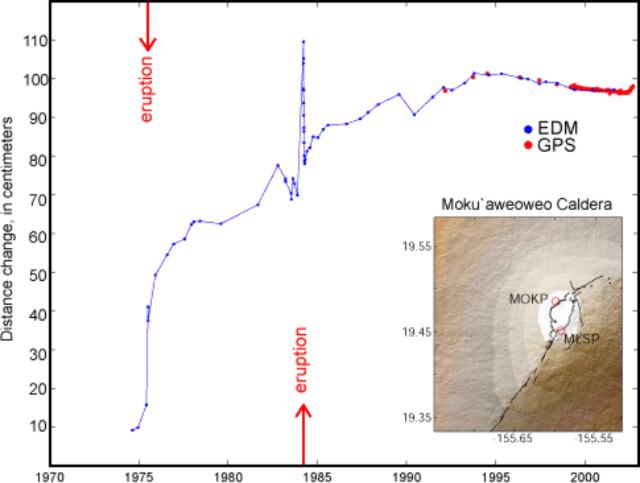 |
Figure 19. The change in distances across Moku`aweoweo caldera at Mauna Loa, between MOKP and MSLP benchmarks (see map inset) as measured by electronic distance meter since about 1975 to September 2002 and by GPS receivers since 1999. Note the abrupt change from contraction to extension in May 2002. Courtesy HVO. |
GPS measurements have only been made at Mauna Loa since 1999, but in that relatively short time an abrupt change in ground movement has been recorded (figure 20). Measurements made during January 1999-May 2002 show small velocities of ground displacement towards the SW. In contrast, during May-September 2002 the direction of ground motion changed from a fairly uniform, southeastward movement to a predominately radial pattern. In addition, the rate of ground motion increased by 5 to 10 times.
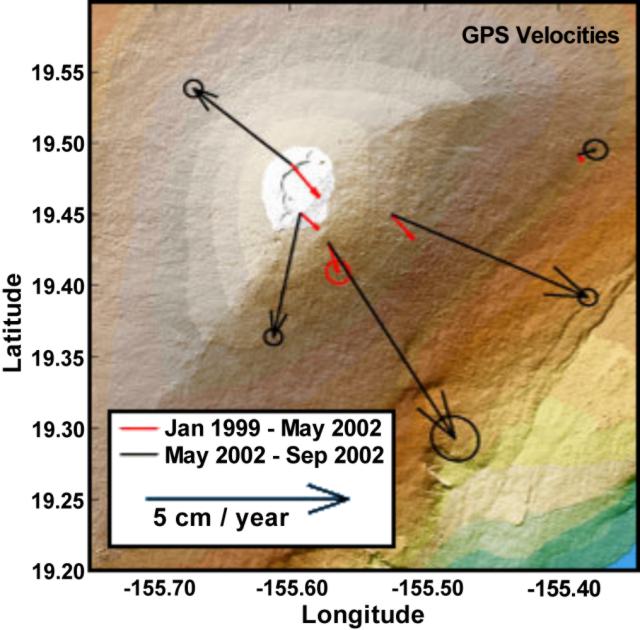 |
Figure 20. Velocities of ground displacement measured by GPS stations on Mauna Loa during 1999 to 12 May 2002 (light lines) and 12 May to 21 September 2002 (black lines). The arrows represent the speed and direction of motion. The tips of the arrows representing the actual motion point lie somewhere within the uncertainty ellipses. Courtesy HVO. |
Ground tilt away from the caldera occurs when magma accumulates beneath the surface. Although electronic measurements provide much more precise readings, the dry-tilt method remains in use at HVO after 35 years for several reasons. First, the measurements can be made nearly anywhere at any time. Second, they are not subject to long-term instrument drift. Lastly, they provide an independent corroboration of measurements made by more sophisticated modern instruments. Dry-tilt measurements revealed the following: inflation between the 1975 and 1984 eruptions (figure 21a), inflation after the 1984 eruption, continuing until 1993 (figure 21b), and deflation from 1993 through March (probably May) 2002 (figure 21c). After March (probably May), the tilt returned to an inflationary pattern (figure 21d). The most recent pattern of inflation is based on only two sets of measurements, and the tilt varies, with some smaller arrows pointing inward, so it is much less certain than the past patterns. Still, the radial pattern strongly suggests that inflation is occurring.
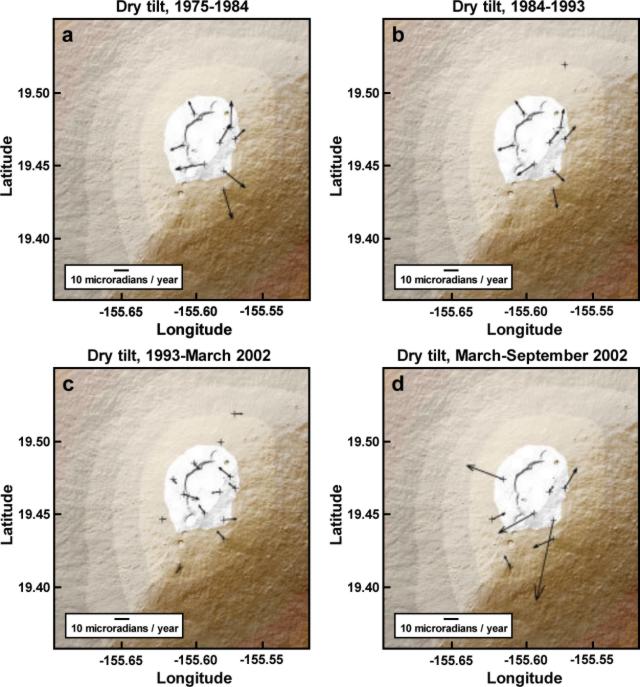 |
Figure 21. Rates of ground tilt measured in the summit region of Mauna Loa during 1975 to September 2002. Arrows point in the direction of downward tilt rate of the ground surface; arrow lengths show the amount of tilt in microradians (note scale bars). A) inflation during 1975-1984, between the last two eruptions at Mauna Loa; b) inflation after the 1984 eruption to 1993; c) deflation during 1993 to March (probably May) 2002; and d) a general return to inflation until at least September 2002. Courtesy HVO. |
HVO's telemetered seismographic network recorded significant changes in seismicity before the Mauna Loa eruptions in 1975 and 1984 (figure 22). The short-term forecasts of these eruptions were based in large part on precursory activity. Both eruptions were preceded by an increase in earthquakes at intermediate depths NE of Moku`aweoweo, and then by an increase in shallower earthquakes beneath Mauna Loa's summit. From the 1984 eruption until late April 2002, approximately 30 earthquakes were located per year beneath Mauna Loa's summit and upper flanks. Rates of seismicity moderately increased beginning in late April 2002, particularly at depths greater than 15 km (figure 22d). As of 29 September 2002, 100 earthquakes were recorded in 2002 below the summit and upper flanks of the volcano, 83 of which occurred after mid-April. This rate is markedly higher than those of previous years, but it is still well below the rates seen prior to the last two eruptions. Before an eruption becomes imminent, HVO scientists expect that rates of shallow seismicity will elevate to levels much higher than those observed in late September 2002.
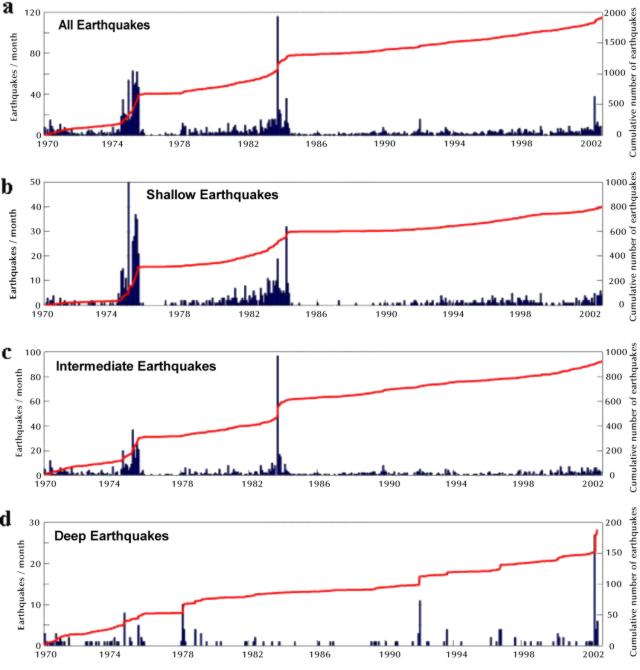 |
Figure 22. Monthly earthquakes (bars, scales at left) and cumulative numbers of located earthquakes (curves, scales at right), separated into three depth ranges, within or beneath Mauna Loa between 1974 and 29 September 2002. The earthquakes shown occurred beneath Mauna Loa's summit and upper flanks and had magnitudes greater than 1.0. Part "a" shows all earthquakes; "b", shallow earthquakes (0 to 5 km deep); "c", intermediate earthquakes (5 to 15 km deep); and "d", deep earthquakes (greater than 15 km deep). Courtesy HVO. |
References. Moore J G, Clague D A, Holcomb R T, Lipman P W, Normark W R, Torresan M E, 1989. Prodigous submarine landslides on the Hawaiian Ridge. J Geophys Res, 94: 17,465-17,484; Lockwood J P, Lipman P W, 1987. Holocene eruptive history of Mauna Loa volcano. U S Geol Surv Prof Pap, 1350: 509-535.
Information Contacts: Hawaiian Volcano Observatory (HVO), U.S. Geological Survey, PO Box 51, Hawaii National Park, HI 96718, USA (URL: https://volcanoes.usgs.gov/observatories/hvo/).
Deep, long-period earthquake swarm and contraction in July and August 2004
After a swarm of deep earthquakes centered just S of Mauna Loa's summit caldera in late April 2002, seismicity remained barely elevated until July 2004. In other words, seismicity during late April 2002-July 2004 stood far lower than it did in the months prior to the 1975 and 1984 eruptions.
Starting in July 2004, a swarm of small (M < 3), deep (> 40 km), mostly long-period (LP) earthquakes occurred just S of the caldera and adjacent areas. Neither the depth nor the magnitude of the earthquakes changed significantly. Through 13 October 2004 more than 730 related earthquakes occurred beneath the summit caldera and the adjacent part of the SW rift zone.
The location and magnitude of earthquakes making up the recent swarm (seismicity from 24 April-15 October 2004, a 6-month interval) are shown in figure 23. Such a concentration of deep LP earthquakes from this part of Mauna Loa was unprecedented in the modern earthquake record dating back to the 1960s. In contrast, more typical seismicity over a 6-month period at Mauna Loa is shown in a figure in a previous issue (BGVN 27:09). By comparison to the interval 24 April-15 October 2004, earthquakes in a typical 6 month interval are relatively sparse.
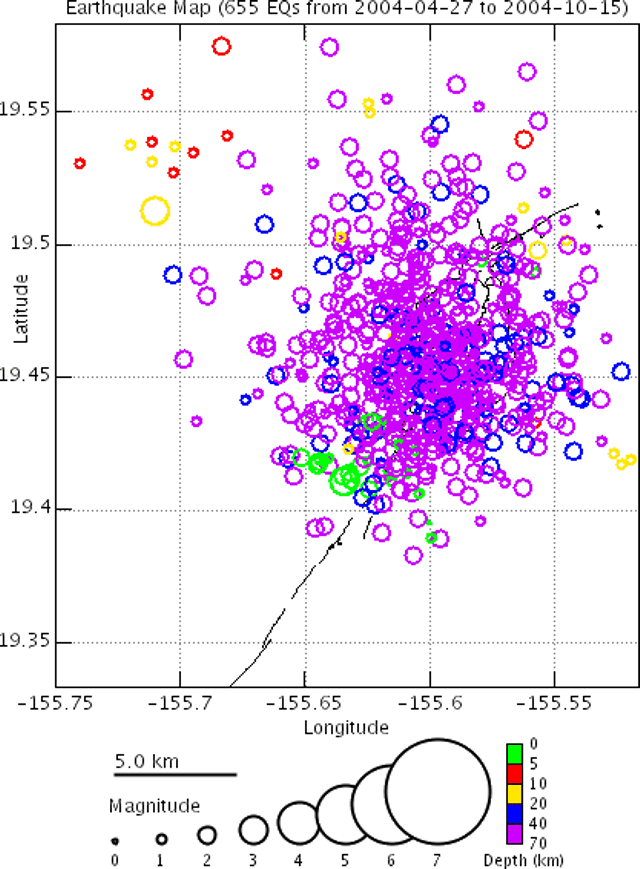 |
Figure 23. Seismicity for Mauna Loa for the 6-month period 24 April-15 October 2004. Courtesy of the U.S. Geological Survey, Hawaiian Volcano Observatory. |
Inflation continued at the summit through the start of the earthquake swarm. In late August 2004, however, distances across the summit caldera began to contract significantly, apparently caused by the center of inflation shifting slightly to the S, rather than by deflation. This was the first contraction since inflation started in late April or early May 2002. Toward the end of September, the contraction ended and the line once again began to lengthen. During 2004, the inflation had been at a fairly steady to slightly increasing rate until the contraction in late August. When present, the lengthening, uplift, and tilting were taken to indicate swelling of the magma reservoir within the volcano.
Information Contacts: Hawaiian Volcano Observatory (HVO), U.S. Geological Survey, PO Box 51, Hawaii National Park, HI 96718, USA (URL: https://volcanoes.usgs.gov/observatories/hvo/).
2004-2010 deformation trends; intrusive bodies modeled
Mauna Loa has remained non-eruptive since April 1984. We previously reported on an April-October 2004, deep, long-period (LP) earthquake swarm and associated brief period of contraction (BGVN 29:09). After that and through 2010, deformation continued at variable rates and with brief pauses. During 2004-2010, HVO reported little variation in gas emissions at Mauna Loa.
The material in this report is drawn from monitoring data collected by the USGS Hawaiian Volcano Observatory (HVO) and, in particular, Interferometric Synthetic Aperture Radar (InSAR) data provided by HVO's Mike Poland. A subsection below discusses the use of deformation data as a basis for modeling inferred magma bodies in the subsurface at Mauna Loa (Amelung and others, 2007).
Slowed edifice inflation. Increased rates of inflation following the April-October 2004 deep LP earthquake swarm continued through 2007, when HVO reported that GPS and InSAR-based inflation rates had slowed substantially. Comparison of radar interferograms covering two intervals (11 October 2003-19 November 2005 and 24 March 2007-17 April 2010) highlights the slowed deformation rates during the latter interval (figure 24). To better understand the technique used to observe the slowed rate of deformation at Mauna Loa, see the next section.
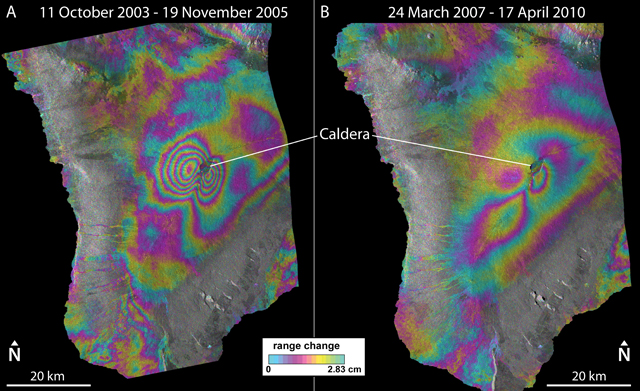 |
Figure 24. Radar interferograms of Mauna Loa covering the time intervals of (a) 11 October 2003-19 November 2005 and (b) 24 March 2007-17 April 2010. These interferograms highlight the slowing of inflation during the latter interval. The large number of color bands ('fringes') in (a) indicates an increased rate of inflation compared to the fewer number of fringes in (b). As depicted in the scale bar (bottom center), concentric and cyclical sets of fringes indicate a ground movement of 2.83 cm towards the satellite's line-of-sight during the time interval shown in each image. The images were produced from data acquired by the European Space Agency's Environmental Satellite (ENVISAT), with an incidence angle of 25° from the ground, looking W to E. Courtesy of Michael Poland, USGS-HVO. |
InSAR technique to monitor deformation. A technique has emerged that enables scientists to create an image of where and how much displacement occurred over a ground or glacial (ice) surface (e.g., Rosen and others, 2000). The technique's spatial coverage is variable from hundreds of square meters to hundreds of square kilometers. Measurements of the component of deformation along the instrument's line-of-sight typically have centimeter-scale precision. While the precision may be less than some other deformation techniques (i.e., GPS monitoring or tilt measurements), the broad coverage can pinpoint particularly interesting patterns and help define areas for collateral studies, including further modeling of the causes of deformation (see next section).
The image, which is called a radar interferogram, compares two separate 'snapshots' acquired at distinct points in time. The snapshots are radar images of the topography of the ground surface in the area of interest (figure 25) acquired by an instrument mounted on an airplane or satellite. The images are generated by transmitting radar waves to the earth's surface; the radar waves then reflect (backscatter) and are measured upon their return to the instrument. To make one interferogram, two such images taken at different times are compared. Variations in the phase of the coherent radar signal in the two snapshots disclose areas where displacement occurred along the instrument's line-of-sight (example radar waves A-E, figure 25). In some cases scientists collect and process enough data to enable them to make a time series of interferograms, for example, annual interferograms that enable yearly comparisons of the ground surface over a decade of time.
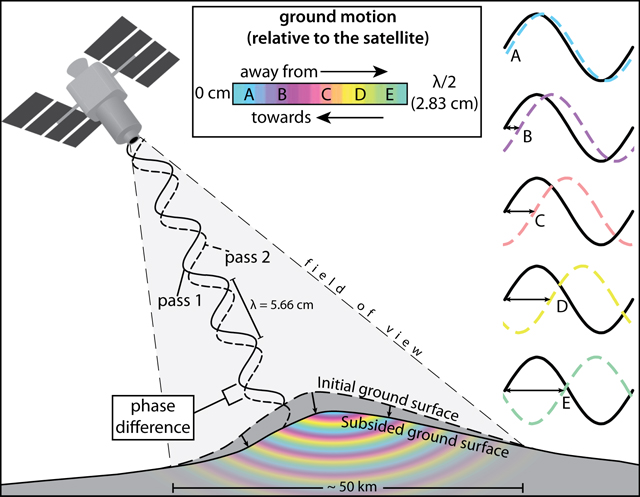 |
Figure 25. A cartoon representation of the basic principles of radar interferometry. As the satellite makes its first pass over a ground surface ('Initial ground surface'), it collects radar waves reflected off of the ground surface (solid wave, 'pass 1'). During a subsequent orbit (often months to years later), when the satellite again passes over the same ground surface, another collection is made from very nearly the same orbital location (dashed wave, 'pass 2'). If the ground surface deformed during the time between data collections (e.g., 'Subsided ground surface'), then the collected radar waves of the second pass will be out of phase compared to those collected during the first pass (example waves A-E, at right). The phase difference of the waves is then converted into the component of ground motion along the line-of-sight of the satellite (either towards or away from the satellite), and is represented by a color as part of a full color cycle. Since the technique is based on the phase difference of multiple waves, the accuracy is constrained by detectable fractions of the radar wave's wavelength. In figure 24, C-band radar (wavelength = 5.6 cm) was used. Image not drawn to scale. Image created by GVP staff. |
On the interferograms, interference patterns appear as full color cycles, or 'fringes', indicating how far out of phase the radar waves are when they return to the satellite (figure 25); one fringe indicates a line-of-sight ground offset equivalent to one half of the radar waves' wavelength. An increased number of fringes at a specific area within an image thus indicates increased deformation during the time between images, allowing estimation of deformation rates over the time period analyzed. Our discussion of this technique has omitted various assumptions, sources of error, and corrections used to process and interpret the data.
Magma chamber and dike modeling. Amelung and others (2007) assessed measured ground deformation at Mauna Loa from InSAR data. They modeled the size, location, and geometry of inferred intrusive bodies beneath Mauna Loa that led to the observed surface deformation. Their modeling suggested a spherical magma chamber of 1.1 km radius, centered under the SE caldera margin at 4.7 km depth below the summit (0.5 km below sea level), and a vertical dike with most of its inflation occurring along an 8-km-long zone at depths of 4-8 km (Figure 26). The dike's direction of opening was normal to its inferred planar orientation. An HVO model, fit to ground-based GPS measurements, agrees with the model of Amelung and others (2007).
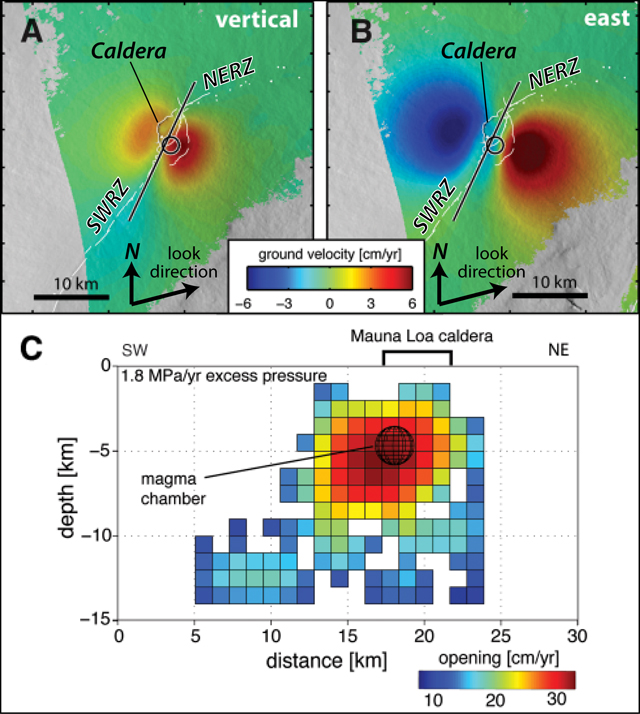 |
Figure 26. (a) Vertical and (b) East components of ground-velocity measured at Mauna Loa during 2002-2005, determined from RADARSAT-1 InSAR data, and (c) the resultant model of the subsurface along a vertical cross-section oriented NE-SW. The satellite looked towards the E ('look direction') and had an incidence angle of ~45° from the ground. The white lines indicate the NE and SW rift zones (NERZ and SWRZ, respectively) that branch off of the caldera. The black line and circle in (a) and (b) indicate the map location of the modeled dike and magma chamber, respectively, also shown in cross-section view in (c). The location and span of Mauna Loa's summit caldera is indicated at the top of (c). The modeled spherical magma chamber and dike beneath the summit are shown in (c), indicating modeled opening rates of the dike (shown by the colored squares, with scale at bottom right). The dike opening rates are based on a uniform excess-magma pressure model of 1.8 Mpa/year, and are modeled to fit the measured ground-velocities shown in (a) and (b). Modified from Amelung and others (2007). |
References. Amelung, F., Yun, S.H., Walter, T.R., Segall, P., and Kim, S.W. (2007) Stress Control of Deep Rift Intrusion at Mauna Loa Volcano, Hawaii. Science, 316 (5827), pg. 1026-1030 (DOI: 10.1126/science.1140035).
Rosen, P.A., Hensley, S., Joughin, I.R., Li, F.K., Madsen, S.N., Rodriguez, E., and Goldstein, R.M. (2000) Synthetic aperture radar interferometry, Proc. IEEE, 88, 333- 382.
Information Contacts: Michael Poland, Hawaiian Volcano Observatory (HVO), U.S. Geological Survey, PO Box 51, Hawai'i National Park, HI 96718, USA (URL: https://volcanoes.usgs.gov/observatories/hvo/); Christelle Wauthier, Department of Terrestrial Magnetism, Carnegie Institute of Washington, Washington, DC.
New eruption with lava flows and fountains during November-December 2022
Mauna Loa is a basaltic shield volcano that rises almost 9 km from the ocean floor in Hawaii. Flank eruptions typically occur from NE and SW rift zones, and from the Moku?aweoweo summit caldera. About 1,500 years ago a series of voluminous overflows from a summit lava lake covered about 25% of the volcano’s surface. An eruption during March-April 1984 produced lava flows and fountains (SEAN 09:03). A new eruption during 27 November-10 December 2022 was characterized by lava flows, fountains, and strong sulfur dioxide emissions, based on information from daily reports and volcanic activity notices from the US Geological Survey's (USGS) Hawaiian Volcano Observatory (HVO).
Heightened unrest began at about 0200 on 23 September, when shallow earthquakes increased from 10-20 per day during July-August to 40-50 per day, located underneath Moku?aweoweo caldera (2-5 km below the surface) and in an area NW of the caldera (6-8 km below the surface). Both regions have historically been seismically active during periods of unrest, according to HVO, and this activity was attributed to magma movement. GPS (Global Positioning System) instruments at the summit and on the flanks also measured elevated rates of inflation since mid-September. Peaks in the number of earthquakes were as high as 100 per day on 23 and 29 September. Two Mw 4.6 and Mw 5 earthquakes were recorded at 0907 on 14 October. The former was located S of Pahala at a depth of about 13 km. The second earthquake, 24 seconds later, was located S of Pahala at a depth of 7.4 km. These were followed by more than 150 aftershocks in the Pahala region over the next two days. HVO noted that this unrest was likely driven by the accumulation of new magma 3-8 km below the summit.
HVO reported that a new eruption began in Moku?aweoweo caldera at 2330 on 27 November, which prompted them to raise the Aviation Color Code (ACC) to Red (the highest level on a four-color scale) and the Volcano Alert Level (VAL) to Warning (the highest level on a four-level scale). A thermal anomaly and a plume of sulfur dioxide gas were identified in satellite images at the onset of the eruption, according to NOAA’s National Environmental Satellite, Data, and Information Service (NESDIS). Lava erupted from a fissure in the caldera (figure 27) and by 0127 on 28 November lava had overflowed the low NE caldera wall. During an overflight at about 0630, scientists confirmed that the fissure in the caldera had stopped and several fissures on the upper flank in the Northeast Rift Zone opened and fed active lava flows. The flows were active in the “saddle” area between Mauna Loa and Mauna Kea and several traveled N and NE. Lava flows from Fissures 1 and 2 (F1 and F2, respectively) traveled downslope and stalled about 18 km from Saddle Road; both flows were inactive by 1330 on 28 November. The longest lava flow originated from Fissure 3 (F3), the lowest elevation of the NE fissures at 3.5 km elevation, and crossed the Mauna Loa Weather Observatory Road at approximately 2000 on 28 November; by 0700 on 29 November the flow was about 10 km from Saddle Road. Lava fountains from Fissure 4 (F4), downslope from F3, formed at approximately 1930 on 28 November and rose 5-10 m high. Fountains from F3 were visible during the morning of 29 November and rose 25 m high (figure 28), increasing to 40-50 m high that afternoon. The average sulfur dioxide emission rate measured was 250,000 tons per day (t/d) on 28 November.
|
Figure 27. Webcam image showing new lava effusion originating from a fissure in the Moku?aweoweo caldera at Mauna Loa at 2346 on 27 November 2022. Courtesy of USGS Hawaiian Volcano Observatory. |
|
Figure 28. Webcam image showing lava fountains at Mauna Loa rising as high as 25 m from Fissure 3 at 0942 on 29 November 2022. Courtesy of USGS Hawaiian Volcano Observatory. |
On 30 November the two active fissures fed lava flows downslope; F3 lava flow traveled NE and during the night of 29-30 November shifted slightly to the W (figure 29). HVO reported that F3 was the dominant source of the main lava flow and that the flow front was about 5.8 km from Saddle Road as of 0700 on 30 November (figure 30). The flows were advancing at a rate of 130 m/hour during 29-30 November. Lava fountains at F3 rose 20-25 m high on 30 November. The F4 flow moved NE at a rate of 50 m/hour; a smaller, branched lobe traveled E from the fissure at a slower rate. Pele’s hair fell in the Saddle Road area. No active lava was reported in Moku?aweoweo caldera or along the Southwest Rift Zone. Gas-and-steam plumes from the activity drifted N.
|
Figure 29. Map showing the Mauna Loa lava flow advances during 28-30 November 2022. Fissure 3 is the dominant fissure, feeding flows to the N. The light red color shows lava flows during 28-29 November and the darker red color shows lava flows emplaced from 0030 on 29 November to 1230 on 30 November. The dotted lines indicate flows from Fissure 4, which were moving NE. A smaller lobe from Fissure 4 was moving E. The purple line shows the location of the two active fissures. Courtesy of USGS Hawaiian Volcano Observatory. |
|
Figure 30. Photo of Fissure 3 at Mauna Loa showing strong lava fountains rising 20-25 m high and lava flows that are moving NE at about 130 m/hour. Photo was taken during an overflight during the morning of 30 November 2022. Courtesy of USGS Hawaiian Volcano Observatory. |
On 1 December the F3 lava flows traveled N toward Saddle Road, also referred to as the Daniel K. Inouye Highway, and lava fountaining continued (figure 31); the rate of the largest flow had slowed down during 30 November-1 December to a rate of 40 m/hour. The main flow branched almost halfway down the flow field, but coalesced downslope and advanced along a single flow front that reached about 5.4 km from Saddle Road by 0700 on 1 December. As the flow rate slowed, the flow front widened and became thicker. The F4 flow moved to the NE at a rate of 60 m/hour; the branched lobe that traveled E had stalled by the afternoon of 1 December. Pele’s hair continued to fall in the Humu‘ula Saddle area. During 2 December the F3 lava flow increased to a rate of 45 m/hour and by 0700 the flow front was 4.3 km from Saddle Road. Sulfur dioxide rates measured on 1 December were 180,000 t/d. By 3 December only F3 was active; HVO scientists confirmed that the flow from F4 was no longer active during an overflight during the morning of 3 December. Only incandescent cracks were visible from F4.
|
Figure 31. Photo of low lava fountains erupting from Fissure 3 at Mauna Loa during the morning of 1 December 2022. Courtesy of USGS Hawaiian Volcano Observatory. |
The active lava flow from F3 continued to move N; by 0700 during the morning of 3 December the flow front was about 4 km from the Saddle Road. The flow had advanced at a rate of about 13 m/hour. Several small overflows near where the main lava flow branched, on the steeper slopes of the NE flank about halfway down the lava flow, were seen during 3-6 December. Lava fountains during 3-4 December rose 33 m high, increasing to 40-100 m on 6 December; fragments of volcanic material were deposited in the area near the vent. Molten lava bombs were sometimes ejected during the fountaining, which cooled at the base of the fissure and built a significant spatter cone. Pele’s hair fragments were blown to distances as far as Laupahoehoe (59 km NW of F3) during 3-7 December. The F3 lava flow front had advanced to 3.6 km from Saddle Road when measured at 0700 on 4 December, and the average flow rate was 12 m/hour. On 4 December the sulfur dioxide emission rate was approximately 120,000 t/d. The ACC was lowered to Orange (the second highest level on a four-color scale) at 0810 on 4 December; the VAL remained at Warning, which reflected the ongoing lava flow hazards.
The active lava flow front that originated from F3 was about 3.5 km from Saddle Road at 0630 on 5 December. Around this time the lava flow rate was about 8 m/hour; a brief surge at the flow front was recorded during the morning. The average flow rate during 5-6 December was 21 m/hour, but for short periods increased up to 27.4 m/hour. By 0500 on 6 December the flow front was about 3.1 km from Saddle Road. The flow front was 2.9 km from Saddle Road at 0600 on 7 December; the flow advanced only a short distance since 0000, likely because a significant breakout had occurred about 4.5 km upslope of the flow front on the E side. The main flow averaged a rate of 6 m/hour during 6-7 December. HVO crews installed a new webcam to observe the front of the main flow during this time.
Though F3 continued to erupt during the morning of 8 December, HVO reported that the volume of lava had notably decreased. Lava overflowed some channels near the vent, which extended no farther than 4-4.4 km. By 0530 on 8 December the main active flow front was stalled about 2.8 km from Saddle Road; the lower part of the flow was inactive. Sulfur dioxide measurements declined to an emission rate of 30,000 t/d. The inactive main flow remained stagnant at 2.8 km from Saddle Road, as measured during the afternoon of 8 December, though HVO reported that as the flow front settled it moved slowly N about 2 m/hour. At 0700 on 9 December activity at the F3 vent was significantly reduced and by 1130 low fountains fed lava flows that extended as far as 2.65 km NE from the vent.
HVO reported that the eruption stopped on 10 December as lava supply to F3 on the Northeast Rift Zone had stopped and sulfur dioxide emissions had decreased to pre-eruption background levels (figure 32). Volcanic tremor and earthquakes associated with the eruption had also greatly decreased. A lava pond replaced the fountaining at the F3 vent at 0700 on 10 December. The pond fed short lava flows that extended 2.6 km from the vent, but then quickly began to stagnate. Lava was confined to the small pond by 1435. The main flow front was inactive but still showed nighttime incandescence. HVO lowered the VAL to Watch (the second highest level on a four-level scale) on 10 December at 1435 and the ACC remained at Orange.
|
Figure 32. Photo of Fissure 3 at Mauna Loa taken during the morning of 10 December 2022 showing an inactive lava flow and weak gas-and-steam emissions. Courtesy of USGS Hawaiian Volcano Observatory. |
Webcam views showed little incandescence and no lava movement in the F3 vent by 0700 on 11 December. Incandescence was restricted to the cone that had formed around the F3 vent. Sulfur dioxide emission rates on 9 December were 20,000 t/d, but when measured the next day had decreased to 2,000 t/d. During an early morning overflight on 12 December scientists heard a small explosion that accompanied a spray of spatter from the W end of F3. On 13 December the ACC was lowered to Yellow. On 14 December HVO reported that the volcano was no longer erupting; webcams only captured residual incandescence and there was no lava movement in the F3 vent. The inactive main flow remained 2.8 km from Saddle Road when last measured during the morning of 10 December.
Information Contacts: Hawaiian Volcano Observatory (HVO), U.S. Geological Survey, PO Box 51, Hawai'i National Park, HI 96718, USA (URL: http://hvo.wr.usgs.gov/); National Environmental Satellite, Data, and Information Service (NESDIS), NOAA, 1335 East-West Highway, SSMC1, 8th Floor Suite 8300, Silver Spring, MD 20910 (URL: https://www.nesdis.noaa.gov/, https://twitter.com/NOAASatellites/status/1597231244060004352).
|
|
||||||||||||||||||||||||||
There is data available for 110 confirmed Holocene eruptive periods.
2022 Nov 27 - 2022 Dec 10 Confirmed Eruption (Explosive / Effusive) VEI: 0
| Episode 1 | Eruption (Explosive / Effusive) | Moku‘aweoweo, Northeast Rift Zone | ||||||||||||||||||||||||
|---|---|---|---|---|---|---|---|---|---|---|---|---|---|---|---|---|---|---|---|---|---|---|---|---|---|
| 2022 Nov 27 - 2022 Dec 10 | Evidence from Observations: Reported | ||||||||||||||||||||||||
|
List of 3 Events for Episode 1 at Moku‘aweoweo, Northeast Rift Zone
|
|||||||||||||||||||||||||
1984 Mar 25 - 1984 Apr 15 Confirmed Eruption (Explosive / Effusive) VEI: 0
| Episode 1 | Eruption (Explosive / Effusive) | Moku'aweoweo, SW and NE rift zones | |||||||||||||||||||||||||||||||||||||||||||||||||||||||||||||||||||||||||||||||||||||||||||||||||||||||||||||||||||||||||||||||||||||||||||||||||||||
|---|---|---|---|---|---|---|---|---|---|---|---|---|---|---|---|---|---|---|---|---|---|---|---|---|---|---|---|---|---|---|---|---|---|---|---|---|---|---|---|---|---|---|---|---|---|---|---|---|---|---|---|---|---|---|---|---|---|---|---|---|---|---|---|---|---|---|---|---|---|---|---|---|---|---|---|---|---|---|---|---|---|---|---|---|---|---|---|---|---|---|---|---|---|---|---|---|---|---|---|---|---|---|---|---|---|---|---|---|---|---|---|---|---|---|---|---|---|---|---|---|---|---|---|---|---|---|---|---|---|---|---|---|---|---|---|---|---|---|---|---|---|---|---|---|---|---|---|---|---|---|
| 1984 Mar 25 - 1984 Apr 15 | Evidence from Observations: Reported | |||||||||||||||||||||||||||||||||||||||||||||||||||||||||||||||||||||||||||||||||||||||||||||||||||||||||||||||||||||||||||||||||||||||||||||||||||||
| A seismic swarm began directly beneath the summit late on 24 March 1984, with a M 4.0 at 0055 on 25 March, followed immediately by rapid inflation at the summit. About an hour incandescence was observed in the SW portion of the summit caldera; other observations suggested that fountaining extended across much of SW Mokuaweoweo and was migrating down the Southwest Rift Zone (SWRZ), with fountains as much as 100 m high. About two hours later fountaining ceased on the SWRZ and 30-m-high fountains migrated over to the upper NE Rift Zone. At 0930, fountains above Pohaku Hanalei died down as lava production increased to approximately 1-2 x 10⁶ m3/hour along a 2-km-long fissure between about 3,400 and 3,470 m elevation. New vents continued to open downrift throughout the day. By late afternoon the active flow-producing vents were all below 3,000 m elevation along a 1.7-km-long fissure vent. Fast-moving flows traveled E and NE, spreading out the next morning over a wide area above 1,900 m elevation. Four principal effusive vents developed along this fissure system. By 28 March only one flow was active; it split into a new branch on 30 March and continued downslope for the next several days. At 1215 on 5 April the flow was moving very slowly (18 m/hour) slightly below 900 m elevation. A major overflow at about 2,000 m elevation shut off most of its lava supply and created a fast-moving flow which advanced 3 km NE to about 1,800 m elevation by 1700. Lava output and fountain vigor steadily decreased after this. Many short overflows of viscous aa, up to 15 m thick, moved less than a few hundred meters from points of channel blockage. By 10 April, no lava flowed below 2,400 m, and activity ended by 15 April. Total volume for this eruption was estimated at 180-250 x 106 m3. | ||||||||||||||||||||||||||||||||||||||||||||||||||||||||||||||||||||||||||||||||||||||||||||||||||||||||||||||||||||||||||||||||||||||||||||||||||||||
|
List of 28 Events for Episode 1 at Moku'aweoweo, SW and NE rift zones
|
||||||||||||||||||||||||||||||||||||||||||||||||||||||||||||||||||||||||||||||||||||||||||||||||||||||||||||||||||||||||||||||||||||||||||||||||||||||
1975 Jul 5 - 1975 Jul 6 Confirmed Eruption (Explosive / Effusive) VEI: 0
| Episode 1 | Eruption (Explosive / Effusive) | Mokuaweoweo and NE and SW rift zones, | |||||||||||||||||||||||||||||||||||||||||||||||||||||||||||
|---|---|---|---|---|---|---|---|---|---|---|---|---|---|---|---|---|---|---|---|---|---|---|---|---|---|---|---|---|---|---|---|---|---|---|---|---|---|---|---|---|---|---|---|---|---|---|---|---|---|---|---|---|---|---|---|---|---|---|---|---|
| 1975 Jul 5 - 1975 Jul 6 | Evidence from Observations: Reported | |||||||||||||||||||||||||||||||||||||||||||||||||||||||||||
|
List of 10 Events for Episode 1 at Mokuaweoweo and NE and SW rift zones,
|
||||||||||||||||||||||||||||||||||||||||||||||||||||||||||||
1950 Jun 1 - 1950 Jun 23 Confirmed Eruption (Explosive / Effusive) VEI: 0
| Episode 1 | Eruption (Explosive / Effusive) | SW rift zone (2440 m) | ||||||||||||||||||||||||||||||||||||||||||||||||||||||
|---|---|---|---|---|---|---|---|---|---|---|---|---|---|---|---|---|---|---|---|---|---|---|---|---|---|---|---|---|---|---|---|---|---|---|---|---|---|---|---|---|---|---|---|---|---|---|---|---|---|---|---|---|---|---|---|
| 1950 Jun 1 - 1950 Jun 23 | Evidence from Observations: Reported | ||||||||||||||||||||||||||||||||||||||||||||||||||||||
|
List of 9 Events for Episode 1 at SW rift zone (2440 m)
|
|||||||||||||||||||||||||||||||||||||||||||||||||||||||
1949 Jan 6 - 1949 May 31 Confirmed Eruption (Explosive / Effusive) VEI: 0
| Episode 1 | Eruption (Explosive / Effusive) | Mokuaweoweo and SW rift zone | |||||||||||||||||||||||||||||||||||||||||||||||||||||||||||||||||||||
|---|---|---|---|---|---|---|---|---|---|---|---|---|---|---|---|---|---|---|---|---|---|---|---|---|---|---|---|---|---|---|---|---|---|---|---|---|---|---|---|---|---|---|---|---|---|---|---|---|---|---|---|---|---|---|---|---|---|---|---|---|---|---|---|---|---|---|---|---|---|---|
| 1949 Jan 6 - 1949 May 31 | Evidence from Observations: Reported | |||||||||||||||||||||||||||||||||||||||||||||||||||||||||||||||||||||
|
List of 12 Events for Episode 1 at Mokuaweoweo and SW rift zone
|
||||||||||||||||||||||||||||||||||||||||||||||||||||||||||||||||||||||
1942 Apr 26 - 1942 May 10 Confirmed Eruption (Explosive / Effusive) VEI: 0
| Episode 1 | Eruption (Explosive / Effusive) | NE rift zone (2800 m) and Mokuaweoweo | ||||||||||||||||||||||||||||||||||||||||||||||||||||||
|---|---|---|---|---|---|---|---|---|---|---|---|---|---|---|---|---|---|---|---|---|---|---|---|---|---|---|---|---|---|---|---|---|---|---|---|---|---|---|---|---|---|---|---|---|---|---|---|---|---|---|---|---|---|---|---|
| 1942 Apr 26 - 1942 May 10 | Evidence from Observations: Reported | ||||||||||||||||||||||||||||||||||||||||||||||||||||||
|
List of 9 Events for Episode 1 at NE rift zone (2800 m) and Mokuaweoweo
|
|||||||||||||||||||||||||||||||||||||||||||||||||||||||
1940 Apr 7 - 1940 Aug 18 Confirmed Eruption (Explosive / Effusive) VEI: 0
| Episode 1 | Eruption (Explosive / Effusive) | Mokuaweoweo and SW rift zone | ||||||||||||||||||||||||||||||||||||||||||||||||||||||
|---|---|---|---|---|---|---|---|---|---|---|---|---|---|---|---|---|---|---|---|---|---|---|---|---|---|---|---|---|---|---|---|---|---|---|---|---|---|---|---|---|---|---|---|---|---|---|---|---|---|---|---|---|---|---|---|
| 1940 Apr 7 - 1940 Aug 18 | Evidence from Observations: Reported | ||||||||||||||||||||||||||||||||||||||||||||||||||||||
|
List of 9 Events for Episode 1 at Mokuaweoweo and SW rift zone
|
|||||||||||||||||||||||||||||||||||||||||||||||||||||||
1935 Nov 21 - 1936 Jan 2 Confirmed Eruption (Explosive / Effusive) VEI: 0
| Episode 1 | Eruption (Explosive / Effusive) | NE rift zone (3690 m) and Mokuaweoweo | ||||||||||||||||||||||||||||||||||
|---|---|---|---|---|---|---|---|---|---|---|---|---|---|---|---|---|---|---|---|---|---|---|---|---|---|---|---|---|---|---|---|---|---|---|---|
| 1935 Nov 21 - 1936 Jan 2 | Evidence from Observations: Reported | ||||||||||||||||||||||||||||||||||
|
List of 5 Events for Episode 1 at NE rift zone (3690 m) and Mokuaweoweo
|
|||||||||||||||||||||||||||||||||||
1933 Dec 2 - 1933 Dec 18 Confirmed Eruption (Explosive / Effusive) VEI: 0
| Episode 1 | Eruption (Explosive / Effusive) | Mokuaweoweo | |||||||||||||||||||||||||||||
|---|---|---|---|---|---|---|---|---|---|---|---|---|---|---|---|---|---|---|---|---|---|---|---|---|---|---|---|---|---|---|
| 1933 Dec 2 - 1933 Dec 18 | Evidence from Observations: Reported | |||||||||||||||||||||||||||||
|
List of 4 Events for Episode 1 at Mokuaweoweo
|
||||||||||||||||||||||||||||||
1926 Apr 10 - 1926 Apr 28 (?) Confirmed Eruption (Explosive / Effusive) VEI: 0
| Episode 1 | Eruption (Explosive / Effusive) | SW rift (2320 m) | |||||||||||||||||||||||||||||||||||||||
|---|---|---|---|---|---|---|---|---|---|---|---|---|---|---|---|---|---|---|---|---|---|---|---|---|---|---|---|---|---|---|---|---|---|---|---|---|---|---|---|---|
| 1926 Apr 10 - 1926 Apr 28 (?) | Evidence from Observations: Reported | |||||||||||||||||||||||||||||||||||||||
|
List of 6 Events for Episode 1 at SW rift (2320 m)
|
||||||||||||||||||||||||||||||||||||||||
1919 Sep 26 - 1919 Nov 5 (?) Confirmed Eruption (Explosive / Effusive) VEI: 0
| Episode 1 | Eruption (Explosive / Effusive) | SW rift zone (3450 and 2350 m) | |||||||||||||||||||||||||||||||||||||||||||||||||||||||||||
|---|---|---|---|---|---|---|---|---|---|---|---|---|---|---|---|---|---|---|---|---|---|---|---|---|---|---|---|---|---|---|---|---|---|---|---|---|---|---|---|---|---|---|---|---|---|---|---|---|---|---|---|---|---|---|---|---|---|---|---|---|
| 1919 Sep 26 - 1919 Nov 5 (?) | Evidence from Observations: Reported | |||||||||||||||||||||||||||||||||||||||||||||||||||||||||||
|
List of 10 Events for Episode 1 at SW rift zone (3450 and 2350 m)
|
||||||||||||||||||||||||||||||||||||||||||||||||||||||||||||
1916 May 19 - 1916 May 30 Confirmed Eruption (Explosive / Effusive) VEI: 0
| Episode 1 | Eruption (Explosive / Effusive) | SW rift zone (3000 and 2250 m) | |||||||||||||||||||||||||||||
|---|---|---|---|---|---|---|---|---|---|---|---|---|---|---|---|---|---|---|---|---|---|---|---|---|---|---|---|---|---|---|
| 1916 May 19 - 1916 May 30 | Evidence from Observations: Reported | |||||||||||||||||||||||||||||
|
List of 4 Events for Episode 1 at SW rift zone (3000 and 2250 m)
|
||||||||||||||||||||||||||||||
1914 Nov 25 - 1915 Jan 11 Confirmed Eruption (Explosive / Effusive) VEI: 0
| Episode 1 | Eruption (Explosive / Effusive) | Mokuaweoweo | ||||||||||||||||||||||||
|---|---|---|---|---|---|---|---|---|---|---|---|---|---|---|---|---|---|---|---|---|---|---|---|---|---|
| 1914 Nov 25 - 1915 Jan 11 | Evidence from Observations: Reported | ||||||||||||||||||||||||
|
List of 3 Events for Episode 1 at Mokuaweoweo
|
|||||||||||||||||||||||||
1907 Jan 9 - 1907 Jan 24 (on or after) Confirmed Eruption (Explosive / Effusive) VEI: 0
| Episode 1 | Eruption (Explosive / Effusive) | SW rift zone (1890 m) and Mokuaweoweo | |||||||||||||||||||||||||||||
|---|---|---|---|---|---|---|---|---|---|---|---|---|---|---|---|---|---|---|---|---|---|---|---|---|---|---|---|---|---|---|
| 1907 Jan 9 - 1907 Jan 24 (on or after) | Evidence from Observations: Reported | |||||||||||||||||||||||||||||
|
List of 4 Events for Episode 1 at SW rift zone (1890 m) and Mokuaweoweo
|
||||||||||||||||||||||||||||||
1903 Sep 1 - 1903 Dec 7 (?) Confirmed Eruption (Explosive / Effusive) VEI: 0
| Episode 1 | Eruption (Explosive / Effusive) | Mokuaweoweo | ||||||||||||||||||||||||
|---|---|---|---|---|---|---|---|---|---|---|---|---|---|---|---|---|---|---|---|---|---|---|---|---|---|
| 1903 Sep 1 - 1903 Dec 7 (?) | Evidence from Observations: Reported | ||||||||||||||||||||||||
|
List of 3 Events for Episode 1 at Mokuaweoweo
|
|||||||||||||||||||||||||
1899 Jul 1 - 1899 Jul 23 Confirmed Eruption (Explosive / Effusive) VEI: 1
| Episode 1 | Eruption (Explosive / Effusive) | NE rift zone (3260 m) and Mokuaweoweo | ||||||||||||||||||||||||||||||||||
|---|---|---|---|---|---|---|---|---|---|---|---|---|---|---|---|---|---|---|---|---|---|---|---|---|---|---|---|---|---|---|---|---|---|---|---|
| 1899 Jul 1 - 1899 Jul 23 | Evidence from Observations: Reported | ||||||||||||||||||||||||||||||||||
|
List of 5 Events for Episode 1 at NE rift zone (3260 m) and Mokuaweoweo
|
|||||||||||||||||||||||||||||||||||
1896 Apr 21 - 1896 May 6 Confirmed Eruption (Explosive / Effusive) VEI: 0
| Episode 1 | Eruption (Explosive / Effusive) | Mokuaweoweo | ||||||||||||||||||||||||
|---|---|---|---|---|---|---|---|---|---|---|---|---|---|---|---|---|---|---|---|---|---|---|---|---|---|
| 1896 Apr 21 - 1896 May 6 | Evidence from Observations: Reported | ||||||||||||||||||||||||
|
List of 3 Events for Episode 1 at Mokuaweoweo
|
|||||||||||||||||||||||||
1892 Nov 30 - 1892 Dec 3 Confirmed Eruption (Explosive / Effusive) VEI: 0
| Episode 1 | Eruption (Explosive / Effusive) | Mokuaweoweo | |||||||||||||||||||
|---|---|---|---|---|---|---|---|---|---|---|---|---|---|---|---|---|---|---|---|---|
| 1892 Nov 30 - 1892 Dec 3 | Evidence from Observations: Reported | |||||||||||||||||||
|
List of 2 Events for Episode 1 at Mokuaweoweo
|
||||||||||||||||||||
1887 Jan 16 - 1887 Jan 28 (?) Confirmed Eruption (Explosive / Effusive) VEI: 0
| Episode 1 | Eruption (Explosive / Effusive) | SW rift zone (1740 m) and Mokuaweoweo | ||||||||||||||||||||||||||||||||||||||||||||
|---|---|---|---|---|---|---|---|---|---|---|---|---|---|---|---|---|---|---|---|---|---|---|---|---|---|---|---|---|---|---|---|---|---|---|---|---|---|---|---|---|---|---|---|---|---|
| 1887 Jan 16 - 1887 Jan 28 (?) | Evidence from Observations: Reported | ||||||||||||||||||||||||||||||||||||||||||||
|
List of 7 Events for Episode 1 at SW rift zone (1740 m) and Mokuaweoweo
|
|||||||||||||||||||||||||||||||||||||||||||||
1880 Nov 5 - 1881 Aug 10 Confirmed Eruption (Explosive / Effusive) VEI: 1
| Episode 1 | Eruption (Explosive / Effusive) | NE rift zone (3170 m) | ||||||||||||||||||||||||||||||||||||||||||||
|---|---|---|---|---|---|---|---|---|---|---|---|---|---|---|---|---|---|---|---|---|---|---|---|---|---|---|---|---|---|---|---|---|---|---|---|---|---|---|---|---|---|---|---|---|---|
| 1880 Nov 5 - 1881 Aug 10 | Evidence from Observations: Reported | ||||||||||||||||||||||||||||||||||||||||||||
|
List of 7 Events for Episode 1 at NE rift zone (3170 m)
|
|||||||||||||||||||||||||||||||||||||||||||||
1880 May 1 - 1880 May 6 Confirmed Eruption (Explosive / Effusive) VEI: 1
| Episode 1 | Eruption (Explosive / Effusive) | Mokuaweoweo | ||||||||||||||||||||||||
|---|---|---|---|---|---|---|---|---|---|---|---|---|---|---|---|---|---|---|---|---|---|---|---|---|---|
| 1880 May 1 - 1880 May 6 | Evidence from Observations: Reported | ||||||||||||||||||||||||
|
List of 3 Events for Episode 1 at Mokuaweoweo
|
|||||||||||||||||||||||||
1879 Mar 9 - 1879 Mar 9 (?) Confirmed Eruption (Explosive / Effusive) VEI: 0
| Episode 1 | Eruption (Explosive / Effusive) | Mokuaweoweo | |||||||||||||||||||
|---|---|---|---|---|---|---|---|---|---|---|---|---|---|---|---|---|---|---|---|---|
| 1879 Mar 9 - 1879 Mar 9 (?) | Evidence from Observations: Reported | |||||||||||||||||||
|
List of 2 Events for Episode 1 at Mokuaweoweo
|
||||||||||||||||||||
1877 Feb 14 - 1877 Feb 24 Confirmed Eruption (Explosive / Effusive) VEI: 0
| Episode 1 | Eruption (Explosive / Effusive) | Mokuaweoweo, submarine west flank | |||||||||||||||||||
|---|---|---|---|---|---|---|---|---|---|---|---|---|---|---|---|---|---|---|---|---|
| 1877 Feb 14 - 1877 Feb 24 | Evidence from Observations: Reported | |||||||||||||||||||
|
List of 2 Events for Episode 1 at Mokuaweoweo, submarine west flank
|
||||||||||||||||||||
1876 Feb 13 - 1876 Feb 14 (?) Confirmed Eruption (Explosive / Effusive) VEI: 0
| Episode 1 | Eruption (Explosive / Effusive) | Mokuaweoweo | |||||||||||||||||||
|---|---|---|---|---|---|---|---|---|---|---|---|---|---|---|---|---|---|---|---|---|
| 1876 Feb 13 - 1876 Feb 14 (?) | Evidence from Observations: Reported | |||||||||||||||||||
|
List of 2 Events for Episode 1 at Mokuaweoweo
|
||||||||||||||||||||
1875 Aug 11 - 1875 Aug 18 (?) Confirmed Eruption (Explosive / Effusive) VEI: 0
| Episode 1 | Eruption (Explosive / Effusive) | Mokuaweoweo | |||||||||||||||||||
|---|---|---|---|---|---|---|---|---|---|---|---|---|---|---|---|---|---|---|---|---|
| 1875 Aug 11 - 1875 Aug 18 (?) | Evidence from Observations: Reported | |||||||||||||||||||
|
List of 2 Events for Episode 1 at Mokuaweoweo
|
||||||||||||||||||||
1875 Jan 10 - 1875 Feb 9 (?) Confirmed Eruption (Explosive / Effusive) VEI: 0
| Episode 1 | Eruption (Explosive / Effusive) | Mokuaweoweo | |||||||||||||||||||
|---|---|---|---|---|---|---|---|---|---|---|---|---|---|---|---|---|---|---|---|---|
| 1875 Jan 10 - 1875 Feb 9 (?) | Evidence from Observations: Reported | |||||||||||||||||||
|
List of 2 Events for Episode 1 at Mokuaweoweo
|
||||||||||||||||||||
1873 Apr 20 - 1874 Oct 19 (?) Confirmed Eruption (Explosive / Effusive) VEI: 1
| Episode 1 | Eruption (Explosive / Effusive) | Mokuaweoweo | ||||||||||||||||||||||||
|---|---|---|---|---|---|---|---|---|---|---|---|---|---|---|---|---|---|---|---|---|---|---|---|---|---|
| 1873 Apr 20 - 1874 Oct 19 (?) | Evidence from Observations: Reported | ||||||||||||||||||||||||
|
List of 3 Events for Episode 1 at Mokuaweoweo
|
|||||||||||||||||||||||||
1873 Jan 6 - 1873 Jan 7 (?) Confirmed Eruption (Explosive / Effusive) VEI: 0
| Episode 1 | Eruption (Explosive / Effusive) | Mokuaweoweo | |||||||||||||||||||
|---|---|---|---|---|---|---|---|---|---|---|---|---|---|---|---|---|---|---|---|---|
| 1873 Jan 6 - 1873 Jan 7 (?) | Evidence from Observations: Reported | |||||||||||||||||||
|
List of 2 Events for Episode 1 at Mokuaweoweo
|
||||||||||||||||||||
1872 Aug 9 - 1872 Sep Confirmed Eruption (Explosive / Effusive) VEI: 1
| Episode 1 | Eruption (Explosive / Effusive) | Mokuaweoweo | ||||||||||||||||||||||||
|---|---|---|---|---|---|---|---|---|---|---|---|---|---|---|---|---|---|---|---|---|---|---|---|---|---|
| 1872 Aug 9 - 1872 Sep | Evidence from Observations: Reported | ||||||||||||||||||||||||
|
List of 3 Events for Episode 1 at Mokuaweoweo
|
|||||||||||||||||||||||||
1871 Aug 10 - 1871 Aug 30 (?) Confirmed Eruption (Explosive / Effusive) VEI: 0
| Episode 1 | Eruption (Explosive / Effusive) | Mokuaweoweo | |||||||||||||||||||
|---|---|---|---|---|---|---|---|---|---|---|---|---|---|---|---|---|---|---|---|---|
| 1871 Aug 10 - 1871 Aug 30 (?) | Evidence from Observations: Reported | |||||||||||||||||||
|
List of 2 Events for Episode 1 at Mokuaweoweo
|
||||||||||||||||||||
[ 1870 Jan 1 (?) - 1870 Jan 15 (?) ] Uncertain Eruption
| Episode 1 | Eruption (Explosive / Effusive) | Mokuaweoweo | ||||||||||||||||||||||||
|---|---|---|---|---|---|---|---|---|---|---|---|---|---|---|---|---|---|---|---|---|---|---|---|---|---|
| 1870 Jan 1 (?) - 1870 Jan 15 (?) | Evidence from Unknown | ||||||||||||||||||||||||
|
List of 3 Events for Episode 1 at Mokuaweoweo
|
|||||||||||||||||||||||||
1868 Mar 27 - 1868 Apr 22 Confirmed Eruption (Explosive / Effusive) VEI: 2
| Episode 1 | Eruption (Explosive / Effusive) | SW rift zone (1000 m) and Mokuaweoweo | |||||||||||||||||||||||||||||||||||||||||||||||||||||||||||||||||||||
|---|---|---|---|---|---|---|---|---|---|---|---|---|---|---|---|---|---|---|---|---|---|---|---|---|---|---|---|---|---|---|---|---|---|---|---|---|---|---|---|---|---|---|---|---|---|---|---|---|---|---|---|---|---|---|---|---|---|---|---|---|---|---|---|---|---|---|---|---|---|---|
| 1868 Mar 27 - 1868 Apr 22 | Evidence from Observations: Reported | |||||||||||||||||||||||||||||||||||||||||||||||||||||||||||||||||||||
|
List of 12 Events for Episode 1 at SW rift zone (1000 m) and Mokuaweoweo
|
||||||||||||||||||||||||||||||||||||||||||||||||||||||||||||||||||||||
1865 Dec 30 - 1866 Apr 29 (?) Confirmed Eruption (Explosive / Effusive) VEI: 0
| Episode 1 | Eruption (Explosive / Effusive) | Mokuaweoweo | |||||||||||||||||||
|---|---|---|---|---|---|---|---|---|---|---|---|---|---|---|---|---|---|---|---|---|
| 1865 Dec 30 - 1866 Apr 29 (?) | Evidence from Observations: Reported | |||||||||||||||||||
|
List of 2 Events for Episode 1 at Mokuaweoweo
|
||||||||||||||||||||
1859 Jan 23 - 1859 Nov 25 Confirmed Eruption (Explosive / Effusive) VEI: 1
| Episode 1 | Eruption (Explosive / Effusive) | North flank (2800 m) and Mokuaweoweo | ||||||||||||||||||||||||||||||||||
|---|---|---|---|---|---|---|---|---|---|---|---|---|---|---|---|---|---|---|---|---|---|---|---|---|---|---|---|---|---|---|---|---|---|---|---|
| 1859 Jan 23 - 1859 Nov 25 | Evidence from Observations: Reported | ||||||||||||||||||||||||||||||||||
|
List of 5 Events for Episode 1 at North flank (2800 m) and Mokuaweoweo
|
|||||||||||||||||||||||||||||||||||
1855 Aug 11 - 1856 Nov Confirmed Eruption (Explosive / Effusive) VEI: 1
| Episode 1 | Eruption (Explosive / Effusive) | NE rift zone (3200 m) and Mokuaweoweo | ||||||||||||||||||||||||||||||||||
|---|---|---|---|---|---|---|---|---|---|---|---|---|---|---|---|---|---|---|---|---|---|---|---|---|---|---|---|---|---|---|---|---|---|---|---|
| 1855 Aug 11 - 1856 Nov | Evidence from Observations: Reported | ||||||||||||||||||||||||||||||||||
|
List of 5 Events for Episode 1 at NE rift zone (3200 m) and Mokuaweoweo
|
|||||||||||||||||||||||||||||||||||
1852 Feb 17 - 1852 Mar 11 (?) Confirmed Eruption (Explosive / Effusive) VEI: 2
| Episode 1 | Eruption (Explosive / Effusive) | NE rift zone (2560 m) and Mokuaweoweo | |||||||||||||||||||||||||||||||||||||||
|---|---|---|---|---|---|---|---|---|---|---|---|---|---|---|---|---|---|---|---|---|---|---|---|---|---|---|---|---|---|---|---|---|---|---|---|---|---|---|---|---|
| 1852 Feb 17 - 1852 Mar 11 (?) | Evidence from Observations: Reported | |||||||||||||||||||||||||||||||||||||||
|
List of 6 Events for Episode 1 at NE rift zone (2560 m) and Mokuaweoweo
|
||||||||||||||||||||||||||||||||||||||||
1851 Aug 8 - 1851 Aug 11 ± 1 days Confirmed Eruption (Explosive / Effusive) VEI: 0
| Episode 1 | Eruption (Explosive / Effusive) | Mokuaweoweo and SW rift zone | |||||||||||||||||||
|---|---|---|---|---|---|---|---|---|---|---|---|---|---|---|---|---|---|---|---|---|
| 1851 Aug 8 - 1851 Aug 11 ± 1 days | Evidence from Observations: Reported | |||||||||||||||||||
|
List of 2 Events for Episode 1 at Mokuaweoweo and SW rift zone
|
||||||||||||||||||||
1849 May Confirmed Eruption (Explosive / Effusive) VEI: 0
| Episode 1 | Eruption (Explosive / Effusive) | Mokuaweoweo | |||||||||||||||||||
|---|---|---|---|---|---|---|---|---|---|---|---|---|---|---|---|---|---|---|---|---|
| 1849 May - Unknown | Evidence from Observations: Reported | |||||||||||||||||||
|
List of 2 Events for Episode 1 at Mokuaweoweo
|
||||||||||||||||||||
1843 Jan 9 - 1843 Apr 10 (?) Confirmed Eruption (Explosive / Effusive) VEI: 0
| Episode 1 | Eruption (Explosive / Effusive) | North flank, Mokuaweoweo and NE rift | |||||||||||||||||||
|---|---|---|---|---|---|---|---|---|---|---|---|---|---|---|---|---|---|---|---|---|
| 1843 Jan 9 - 1843 Apr 10 (?) | Evidence from Observations: Reported | |||||||||||||||||||
|
List of 2 Events for Episode 1 at North flank, Mokuaweoweo and NE rift
|
||||||||||||||||||||
1832 Jun 20 - 1832 Jul 15 ± 7 days Confirmed Eruption (Explosive / Effusive) VEI: 0
| Episode 1 | Eruption (Explosive / Effusive) | Mokuaweoweo and adjacent vents | |||||||||||||||||||
|---|---|---|---|---|---|---|---|---|---|---|---|---|---|---|---|---|---|---|---|---|
| 1832 Jun 20 - 1832 Jul 15 ± 7 days | Evidence from Observations: Reported | |||||||||||||||||||
|
List of 2 Events for Episode 1 at Mokuaweoweo and adjacent vents
|
||||||||||||||||||||
1750 (?) Confirmed Eruption (Explosive / Effusive) VEI: 0
| Episode 1 | Eruption (Explosive / Effusive) | North flank (2380 m) and SW rift zone? | |||||||||||||||||||
|---|---|---|---|---|---|---|---|---|---|---|---|---|---|---|---|---|---|---|---|---|
| 1750 (?) - Unknown | Evidence from Observations: Reported | |||||||||||||||||||
|
List of 2 Events for Episode 1 at North flank (2380 m) and SW rift zone?
|
||||||||||||||||||||
1730 (?) Confirmed Eruption (Explosive / Effusive) VEI: 0
| Episode 1 | Eruption (Explosive / Effusive) | NE rift zone | |||||||||||||||||||
|---|---|---|---|---|---|---|---|---|---|---|---|---|---|---|---|---|---|---|---|---|
| 1730 (?) - Unknown | Evidence from Isotopic: 14C (uncalibrated) | |||||||||||||||||||
|
List of 2 Events for Episode 1 at NE rift zone
|
||||||||||||||||||||
1685 (?) Confirmed Eruption (Explosive / Effusive) VEI: 0
| Episode 1 | Eruption (Explosive / Effusive) | NE rift zone | |||||||||||||||||||
|---|---|---|---|---|---|---|---|---|---|---|---|---|---|---|---|---|---|---|---|---|
| 1685 (?) - Unknown | Evidence from Isotopic: 14C (uncalibrated) | |||||||||||||||||||
|
List of 2 Events for Episode 1 at NE rift zone
|
||||||||||||||||||||
1680 (?) Confirmed Eruption (Explosive / Effusive) VEI: 0
| Episode 1 | Eruption (Explosive / Effusive) | NW flank | |||||||||||||||||||
|---|---|---|---|---|---|---|---|---|---|---|---|---|---|---|---|---|---|---|---|---|
| 1680 (?) - Unknown | Evidence from Isotopic: 14C (uncalibrated) | |||||||||||||||||||
|
List of 2 Events for Episode 1 at NW flank
|
||||||||||||||||||||
1650 (?) Confirmed Eruption (Explosive / Effusive) VEI: 0
| Episode 1 | Eruption (Explosive / Effusive) | NE rift zone | |||||||||||||||||||
|---|---|---|---|---|---|---|---|---|---|---|---|---|---|---|---|---|---|---|---|---|
| 1650 (?) - Unknown | Evidence from Isotopic: 14C (uncalibrated) | |||||||||||||||||||
|
List of 2 Events for Episode 1 at NE rift zone
|
||||||||||||||||||||
1640 (?) Confirmed Eruption (Explosive / Effusive) VEI: 0
| Episode 1 | Eruption (Explosive / Effusive) | NE rift zone | |||||||||||||||||||
|---|---|---|---|---|---|---|---|---|---|---|---|---|---|---|---|---|---|---|---|---|
| 1640 (?) - Unknown | Evidence from Isotopic: 14C (uncalibrated) | |||||||||||||||||||
|
List of 2 Events for Episode 1 at NE rift zone
|
||||||||||||||||||||
1540 (?) Confirmed Eruption (Explosive / Effusive) VEI: 0
| Episode 1 | Eruption (Explosive / Effusive) | NE rift zone | |||||||||||||||||||
|---|---|---|---|---|---|---|---|---|---|---|---|---|---|---|---|---|---|---|---|---|
| 1540 (?) - Unknown | Evidence from Isotopic: 14C (uncalibrated) | |||||||||||||||||||
|
List of 2 Events for Episode 1 at NE rift zone
|
||||||||||||||||||||
1510 (?) Confirmed Eruption (Explosive / Effusive) VEI: 0
| Episode 1 | Eruption (Explosive / Effusive) | NE rift zone | |||||||||||||||||||
|---|---|---|---|---|---|---|---|---|---|---|---|---|---|---|---|---|---|---|---|---|
| 1510 (?) - Unknown | Evidence from Isotopic: 14C (uncalibrated) | |||||||||||||||||||
|
List of 2 Events for Episode 1 at NE rift zone
|
||||||||||||||||||||
1500 (?) Confirmed Eruption (Explosive / Effusive) VEI: 0
| Episode 1 | Eruption (Explosive / Effusive) | NE rift zone | |||||||||||||||||||
|---|---|---|---|---|---|---|---|---|---|---|---|---|---|---|---|---|---|---|---|---|
| 1500 (?) - Unknown | Evidence from Isotopic: 14C (uncalibrated) | |||||||||||||||||||
|
List of 2 Events for Episode 1 at NE rift zone
|
||||||||||||||||||||
1470 (?) Confirmed Eruption (Explosive / Effusive) VEI: 0
| Episode 1 | Eruption (Explosive / Effusive) | NE rift zone | |||||||||||||||||||
|---|---|---|---|---|---|---|---|---|---|---|---|---|---|---|---|---|---|---|---|---|
| 1470 (?) - Unknown | Evidence from Isotopic: 14C (uncalibrated) | |||||||||||||||||||
|
List of 2 Events for Episode 1 at NE rift zone
|
||||||||||||||||||||
1440 (?) Confirmed Eruption (Explosive / Effusive) VEI: 0
| Episode 1 | Eruption (Explosive / Effusive) | NE rift zone and NW flank | |||||||||||||||||||
|---|---|---|---|---|---|---|---|---|---|---|---|---|---|---|---|---|---|---|---|---|
| 1440 (?) - Unknown | Evidence from Isotopic: 14C (uncalibrated) | |||||||||||||||||||
|
List of 2 Events for Episode 1 at NE rift zone and NW flank
|
||||||||||||||||||||
1390 (?) Confirmed Eruption (Explosive / Effusive) VEI: 0
| Episode 1 | Eruption (Explosive / Effusive) | NE rift zone | |||||||||||||||||||
|---|---|---|---|---|---|---|---|---|---|---|---|---|---|---|---|---|---|---|---|---|
| 1390 (?) - Unknown | Evidence from Isotopic: 14C (uncalibrated) | |||||||||||||||||||
|
List of 2 Events for Episode 1 at NE rift zone
|
||||||||||||||||||||
1370 (?) Confirmed Eruption (Explosive / Effusive) VEI: 0
| Episode 1 | Eruption (Explosive / Effusive) | NE rift zone and Mokuaweoweo | |||||||||||||||||||
|---|---|---|---|---|---|---|---|---|---|---|---|---|---|---|---|---|---|---|---|---|
| 1370 (?) - Unknown | Evidence from Isotopic: 14C (uncalibrated) | |||||||||||||||||||
|
List of 2 Events for Episode 1 at NE rift zone and Mokuaweoweo
|
||||||||||||||||||||
1360 (?) Confirmed Eruption (Explosive / Effusive) VEI: 0
| Episode 1 | Eruption (Explosive / Effusive) | NE rift zone | |||||||||||||||||||
|---|---|---|---|---|---|---|---|---|---|---|---|---|---|---|---|---|---|---|---|---|
| 1360 (?) - Unknown | Evidence from Isotopic: 14C (uncalibrated) | |||||||||||||||||||
|
List of 2 Events for Episode 1 at NE rift zone
|
||||||||||||||||||||
1310 (?) Confirmed Eruption (Explosive / Effusive) VEI: 0
| Episode 1 | Eruption (Explosive / Effusive) | SW rift zone | |||||||||||||||||||
|---|---|---|---|---|---|---|---|---|---|---|---|---|---|---|---|---|---|---|---|---|
| 1310 (?) - Unknown | Evidence from Isotopic: 14C (uncalibrated) | |||||||||||||||||||
|
List of 2 Events for Episode 1 at SW rift zone
|
||||||||||||||||||||
1190 (?) Confirmed Eruption (Explosive / Effusive) VEI: 0
| Episode 1 | Eruption (Explosive / Effusive) | NE rift zone and Mokuaweoweo | |||||||||||||||||||
|---|---|---|---|---|---|---|---|---|---|---|---|---|---|---|---|---|---|---|---|---|
| 1190 (?) - Unknown | Evidence from Isotopic: 14C (uncalibrated) | |||||||||||||||||||
|
List of 2 Events for Episode 1 at NE rift zone and Mokuaweoweo
|
||||||||||||||||||||
1170 (?) Confirmed Eruption (Explosive / Effusive) VEI: 0
| Episode 1 | Eruption (Explosive / Effusive) | NE rift zone | |||||||||||||||||||
|---|---|---|---|---|---|---|---|---|---|---|---|---|---|---|---|---|---|---|---|---|
| 1170 (?) - Unknown | Evidence from Isotopic: 14C (uncalibrated) | |||||||||||||||||||
|
List of 2 Events for Episode 1 at NE rift zone
|
||||||||||||||||||||
1130 (?) Confirmed Eruption (Explosive / Effusive) VEI: 0
| Episode 1 | Eruption (Explosive / Effusive) | SW rift zone | |||||||||||||||||||
|---|---|---|---|---|---|---|---|---|---|---|---|---|---|---|---|---|---|---|---|---|
| 1130 (?) - Unknown | Evidence from Isotopic: 14C (uncalibrated) | |||||||||||||||||||
|
List of 2 Events for Episode 1 at SW rift zone
|
||||||||||||||||||||
1070 (?) Confirmed Eruption (Explosive / Effusive) VEI: 0
| Episode 1 | Eruption (Explosive / Effusive) | NE rift zone | |||||||||||||||||||
|---|---|---|---|---|---|---|---|---|---|---|---|---|---|---|---|---|---|---|---|---|
| 1070 (?) - Unknown | Evidence from Isotopic: 14C (uncalibrated) | |||||||||||||||||||
|
List of 2 Events for Episode 1 at NE rift zone
|
||||||||||||||||||||
1040 (?) Confirmed Eruption (Explosive / Effusive) VEI: 0
| Episode 1 | Eruption (Explosive / Effusive) | NE rift zone | |||||||||||||||||||
|---|---|---|---|---|---|---|---|---|---|---|---|---|---|---|---|---|---|---|---|---|
| 1040 (?) - Unknown | Evidence from Isotopic: 14C (uncalibrated) | |||||||||||||||||||
|
List of 2 Events for Episode 1 at NE rift zone
|
||||||||||||||||||||
0940 (?) Confirmed Eruption (Explosive / Effusive) VEI: 0
| Episode 1 | Eruption (Explosive / Effusive) | NE rift zone | |||||||||||||||||||
|---|---|---|---|---|---|---|---|---|---|---|---|---|---|---|---|---|---|---|---|---|
| 0940 (?) - Unknown | Evidence from Isotopic: 14C (uncalibrated) | |||||||||||||||||||
|
List of 2 Events for Episode 1 at NE rift zone
|
||||||||||||||||||||
0830 (?) Confirmed Eruption (Explosive / Effusive) VEI: 0
| Episode 1 | Eruption (Explosive / Effusive) | Mokuaweoweo and NW flank | |||||||||||||||||||
|---|---|---|---|---|---|---|---|---|---|---|---|---|---|---|---|---|---|---|---|---|
| 0830 (?) - Unknown | Evidence from Isotopic: 14C (uncalibrated) | |||||||||||||||||||
|
List of 2 Events for Episode 1 at Mokuaweoweo and NW flank
|
||||||||||||||||||||
0810 (?) Confirmed Eruption (Explosive / Effusive) VEI: 0
| Episode 1 | Eruption (Explosive / Effusive) | Mokuaweoweo | |||||||||||||||||||
|---|---|---|---|---|---|---|---|---|---|---|---|---|---|---|---|---|---|---|---|---|
| 0810 (?) - Unknown | Evidence from Isotopic: 14C (uncalibrated) | |||||||||||||||||||
|
List of 2 Events for Episode 1 at Mokuaweoweo
|
||||||||||||||||||||
0680 (?) Confirmed Eruption (Explosive / Effusive) VEI: 0
| Episode 1 | Eruption (Explosive / Effusive) | Mokuaweoweo | |||||||||||||||||||
|---|---|---|---|---|---|---|---|---|---|---|---|---|---|---|---|---|---|---|---|---|
| 0680 (?) - Unknown | Evidence from Isotopic: 14C (uncalibrated) | |||||||||||||||||||
|
List of 2 Events for Episode 1 at Mokuaweoweo
|
||||||||||||||||||||
0630 (?) Confirmed Eruption (Explosive / Effusive) VEI: 0
| Episode 1 | Eruption (Explosive / Effusive) | NE rift zone | |||||||||||||||||||
|---|---|---|---|---|---|---|---|---|---|---|---|---|---|---|---|---|---|---|---|---|
| 0630 (?) - Unknown | Evidence from Isotopic: 14C (uncalibrated) | |||||||||||||||||||
|
List of 2 Events for Episode 1 at NE rift zone
|
||||||||||||||||||||
0600 (?) Confirmed Eruption (Explosive / Effusive) VEI: 0
| Episode 1 | Eruption (Explosive / Effusive) | Mokuaweoweo | |||||||||||||||||||
|---|---|---|---|---|---|---|---|---|---|---|---|---|---|---|---|---|---|---|---|---|
| 0600 (?) - Unknown | Evidence from Isotopic: 14C (uncalibrated) | |||||||||||||||||||
|
List of 2 Events for Episode 1 at Mokuaweoweo
|
||||||||||||||||||||
0550 (?) Confirmed Eruption (Explosive / Effusive) VEI: 0
| Episode 1 | Eruption (Explosive / Effusive) | Mokuaweoweo | |||||||||||||||||||
|---|---|---|---|---|---|---|---|---|---|---|---|---|---|---|---|---|---|---|---|---|
| 0550 (?) - Unknown | Evidence from Isotopic: 14C (uncalibrated) | |||||||||||||||||||
|
List of 2 Events for Episode 1 at Mokuaweoweo
|
||||||||||||||||||||
0480 (?) Confirmed Eruption (Explosive / Effusive) VEI: 0
| Episode 1 | Eruption (Explosive / Effusive) | Mokuaweoweo | |||||||||||||||||||
|---|---|---|---|---|---|---|---|---|---|---|---|---|---|---|---|---|---|---|---|---|
| 0480 (?) - Unknown | Evidence from Isotopic: 14C (uncalibrated) | |||||||||||||||||||
|
List of 2 Events for Episode 1 at Mokuaweoweo
|
||||||||||||||||||||
0450 (?) Confirmed Eruption (Explosive / Effusive) VEI: 0
| Episode 1 | Eruption (Explosive / Effusive) | NE rift zone | |||||||||||||||||||
|---|---|---|---|---|---|---|---|---|---|---|---|---|---|---|---|---|---|---|---|---|
| 0450 (?) - Unknown | Evidence from Isotopic: 14C (uncalibrated) | |||||||||||||||||||
|
List of 2 Events for Episode 1 at NE rift zone
|
||||||||||||||||||||
0350 (?) Confirmed Eruption (Explosive / Effusive) VEI: 0
| Episode 1 | Eruption (Explosive / Effusive) | Mokuaweoweo | |||||||||||||||||||
|---|---|---|---|---|---|---|---|---|---|---|---|---|---|---|---|---|---|---|---|---|
| 0350 (?) - Unknown | Evidence from Isotopic: 14C (uncalibrated) | |||||||||||||||||||
|
List of 2 Events for Episode 1 at Mokuaweoweo
|
||||||||||||||||||||
0300 (?) Confirmed Eruption (Explosive / Effusive) VEI: 0
| Episode 1 | Eruption (Explosive / Effusive) | NE rift zone | |||||||||||||||||||
|---|---|---|---|---|---|---|---|---|---|---|---|---|---|---|---|---|---|---|---|---|
| 0300 (?) - Unknown | Evidence from Isotopic: 14C (uncalibrated) | |||||||||||||||||||
|
List of 2 Events for Episode 1 at NE rift zone
|
||||||||||||||||||||
0200 (?) Confirmed Eruption (Explosive / Effusive) VEI: 0
| Episode 1 | Eruption (Explosive / Effusive) | Mokuaweoweo | |||||||||||||||||||
|---|---|---|---|---|---|---|---|---|---|---|---|---|---|---|---|---|---|---|---|---|
| 0200 (?) - Unknown | Evidence from Isotopic: 14C (uncalibrated) | |||||||||||||||||||
|
List of 2 Events for Episode 1 at Mokuaweoweo
|
||||||||||||||||||||
0150 (?) Confirmed Eruption (Explosive / Effusive) VEI: 0
| Episode 1 | Eruption (Explosive / Effusive) | SE rift zone | |||||||||||||||||||
|---|---|---|---|---|---|---|---|---|---|---|---|---|---|---|---|---|---|---|---|---|
| 0150 (?) - Unknown | Evidence from Isotopic: 14C (uncalibrated) | |||||||||||||||||||
|
List of 2 Events for Episode 1 at SE rift zone
|
||||||||||||||||||||
0100 (?) Confirmed Eruption (Explosive / Effusive) VEI: 0
| Episode 1 | Eruption (Explosive / Effusive) | SE rift zone | |||||||||||||||||||
|---|---|---|---|---|---|---|---|---|---|---|---|---|---|---|---|---|---|---|---|---|
| 0100 (?) - Unknown | Evidence from Isotopic: 14C (uncalibrated) | |||||||||||||||||||
|
List of 2 Events for Episode 1 at SE rift zone
|
||||||||||||||||||||
0050 (?) Confirmed Eruption (Explosive / Effusive) VEI: 0
| Episode 1 | Eruption (Explosive / Effusive) | NE rift zone | |||||||||||||||||||
|---|---|---|---|---|---|---|---|---|---|---|---|---|---|---|---|---|---|---|---|---|
| 0050 (?) - Unknown | Evidence from Isotopic: 14C (uncalibrated) | |||||||||||||||||||
|
List of 2 Events for Episode 1 at NE rift zone
|
||||||||||||||||||||
0030 BCE (?) Confirmed Eruption (Explosive / Effusive) VEI: 0
| Episode 1 | Eruption (Explosive / Effusive) | NE and SW rift zones | |||||||||||||||||||
|---|---|---|---|---|---|---|---|---|---|---|---|---|---|---|---|---|---|---|---|---|
| 0030 BCE (?) - Unknown | Evidence from Isotopic: 14C (uncalibrated) | |||||||||||||||||||
|
List of 2 Events for Episode 1 at NE and SW rift zones
|
||||||||||||||||||||
0060 BCE (?) Confirmed Eruption (Explosive / Effusive) VEI: 0
| Episode 1 | Eruption (Explosive / Effusive) | Mokuaweoweo | |||||||||||||||||||
|---|---|---|---|---|---|---|---|---|---|---|---|---|---|---|---|---|---|---|---|---|
| 0060 BCE (?) - Unknown | Evidence from Isotopic: 14C (uncalibrated) | |||||||||||||||||||
|
List of 2 Events for Episode 1 at Mokuaweoweo
|
||||||||||||||||||||
0080 BCE (?) Confirmed Eruption (Explosive / Effusive) VEI: 0
| Episode 1 | Eruption (Explosive / Effusive) | SE rift zone | |||||||||||||||||||
|---|---|---|---|---|---|---|---|---|---|---|---|---|---|---|---|---|---|---|---|---|
| 0080 BCE (?) - Unknown | Evidence from Isotopic: 14C (uncalibrated) | |||||||||||||||||||
|
List of 2 Events for Episode 1 at SE rift zone
|
||||||||||||||||||||
0200 BCE (?) Confirmed Eruption (Explosive / Effusive) VEI: 0
| Episode 1 | Eruption (Explosive / Effusive) | NE rift zone | |||||||||||||||||||
|---|---|---|---|---|---|---|---|---|---|---|---|---|---|---|---|---|---|---|---|---|
| 0200 BCE (?) - Unknown | Evidence from Isotopic: 14C (uncalibrated) | |||||||||||||||||||
|
List of 2 Events for Episode 1 at NE rift zone
|
||||||||||||||||||||
0300 BCE (?) Confirmed Eruption (Explosive / Effusive) VEI: 0
| Episode 1 | Eruption (Explosive / Effusive) | NE rift zone | |||||||||||||||||||
|---|---|---|---|---|---|---|---|---|---|---|---|---|---|---|---|---|---|---|---|---|
| 0300 BCE (?) - Unknown | Evidence from Isotopic: 14C (uncalibrated) | |||||||||||||||||||
|
List of 2 Events for Episode 1 at NE rift zone
|
||||||||||||||||||||
0400 BCE (?) Confirmed Eruption (Explosive / Effusive) VEI: 0
| Episode 1 | Eruption (Explosive / Effusive) | SW rift zone | |||||||||||||||||||
|---|---|---|---|---|---|---|---|---|---|---|---|---|---|---|---|---|---|---|---|---|
| 0400 BCE (?) - Unknown | Evidence from Isotopic: 14C (uncalibrated) | |||||||||||||||||||
|
List of 2 Events for Episode 1 at SW rift zone
|
||||||||||||||||||||
0500 BCE (?) Confirmed Eruption (Explosive / Effusive) VEI: 0
| Episode 1 | Eruption (Explosive / Effusive) | SW rift zone | |||||||||||||||||||
|---|---|---|---|---|---|---|---|---|---|---|---|---|---|---|---|---|---|---|---|---|
| 0500 BCE (?) - Unknown | Evidence from Isotopic: 14C (uncalibrated) | |||||||||||||||||||
|
List of 2 Events for Episode 1 at SW rift zone
|
||||||||||||||||||||
0600 BCE (?) Confirmed Eruption (Explosive / Effusive) VEI: 0
| Episode 1 | Eruption (Explosive / Effusive) | NE rift zone | |||||||||||||||||||
|---|---|---|---|---|---|---|---|---|---|---|---|---|---|---|---|---|---|---|---|---|
| 0600 BCE (?) - Unknown | Evidence from Isotopic: 14C (uncalibrated) | |||||||||||||||||||
|
List of 2 Events for Episode 1 at NE rift zone
|
||||||||||||||||||||
0950 BCE (?) Confirmed Eruption (Explosive / Effusive) VEI: 0
| Episode 1 | Eruption (Explosive / Effusive) | Mokuaweoweo | |||||||||||||||||||
|---|---|---|---|---|---|---|---|---|---|---|---|---|---|---|---|---|---|---|---|---|
| 0950 BCE (?) - Unknown | Evidence from Isotopic: 14C (uncalibrated) | |||||||||||||||||||
|
List of 2 Events for Episode 1 at Mokuaweoweo
|
||||||||||||||||||||
1300 BCE (?) Confirmed Eruption (Explosive / Effusive) VEI: 0
| Episode 1 | Eruption (Explosive / Effusive) | Mokuaweoweo and NE rift zone | |||||||||||||||||||
|---|---|---|---|---|---|---|---|---|---|---|---|---|---|---|---|---|---|---|---|---|
| 1300 BCE (?) - Unknown | Evidence from Isotopic: 14C (uncalibrated) | |||||||||||||||||||
|
List of 2 Events for Episode 1 at Mokuaweoweo and NE rift zone
|
||||||||||||||||||||
1650 BCE (?) Confirmed Eruption (Explosive / Effusive) VEI: 0
| Episode 1 | Eruption (Explosive / Effusive) | NE and SW rift zones | |||||||||||||||||||
|---|---|---|---|---|---|---|---|---|---|---|---|---|---|---|---|---|---|---|---|---|
| 1650 BCE (?) - Unknown | Evidence from Isotopic: 14C (uncalibrated) | |||||||||||||||||||
|
List of 2 Events for Episode 1 at NE and SW rift zones
|
||||||||||||||||||||
1700 BCE (?) Confirmed Eruption (Explosive / Effusive) VEI: 0
| Episode 1 | Eruption (Explosive / Effusive) | SW rift zone | |||||||||||||||||||
|---|---|---|---|---|---|---|---|---|---|---|---|---|---|---|---|---|---|---|---|---|
| 1700 BCE (?) - Unknown | Evidence from Isotopic: 14C (uncalibrated) | |||||||||||||||||||
|
List of 2 Events for Episode 1 at SW rift zone
|
||||||||||||||||||||
1750 BCE (?) Confirmed Eruption (Explosive / Effusive) VEI: 0
| Episode 1 | Eruption (Explosive / Effusive) | NE rift zone | |||||||||||||||||||
|---|---|---|---|---|---|---|---|---|---|---|---|---|---|---|---|---|---|---|---|---|
| 1750 BCE (?) - Unknown | Evidence from Isotopic: 14C (uncalibrated) | |||||||||||||||||||
|
List of 2 Events for Episode 1 at NE rift zone
|
||||||||||||||||||||
1800 BCE (?) Confirmed Eruption (Explosive / Effusive) VEI: 0
| Episode 1 | Eruption (Explosive / Effusive) | NW and SW rift zones | |||||||||||||||||||
|---|---|---|---|---|---|---|---|---|---|---|---|---|---|---|---|---|---|---|---|---|
| 1800 BCE (?) - Unknown | Evidence from Isotopic: 14C (uncalibrated) | |||||||||||||||||||
|
List of 2 Events for Episode 1 at NW and SW rift zones
|
||||||||||||||||||||
1900 BCE (?) Confirmed Eruption (Explosive / Effusive) VEI: 0
| Episode 1 | Eruption (Explosive / Effusive) | SW rift zone | |||||||||||||||||||
|---|---|---|---|---|---|---|---|---|---|---|---|---|---|---|---|---|---|---|---|---|
| 1900 BCE (?) - Unknown | Evidence from Isotopic: 14C (uncalibrated) | |||||||||||||||||||
|
List of 2 Events for Episode 1 at SW rift zone
|
||||||||||||||||||||
2000 BCE (?) Confirmed Eruption (Explosive / Effusive) VEI: 0
| Episode 1 | Eruption (Explosive / Effusive) | SW rift zone | |||||||||||||||||||
|---|---|---|---|---|---|---|---|---|---|---|---|---|---|---|---|---|---|---|---|---|
| 2000 BCE (?) - Unknown | Evidence from Isotopic: 14C (uncalibrated) | |||||||||||||||||||
|
List of 2 Events for Episode 1 at SW rift zone
|
||||||||||||||||||||
2050 BCE (?) Confirmed Eruption (Explosive / Effusive) VEI: 0
| Episode 1 | Eruption (Explosive / Effusive) | Mokuaweoweo | |||||||||||||||||||
|---|---|---|---|---|---|---|---|---|---|---|---|---|---|---|---|---|---|---|---|---|
| 2050 BCE (?) - Unknown | Evidence from Isotopic: 14C (uncalibrated) | |||||||||||||||||||
|
List of 2 Events for Episode 1 at Mokuaweoweo
|
||||||||||||||||||||
2150 BCE (?) Confirmed Eruption (Explosive / Effusive) VEI: 0
| Episode 1 | Eruption (Explosive / Effusive) | NE rift zone | |||||||||||||||||||
|---|---|---|---|---|---|---|---|---|---|---|---|---|---|---|---|---|---|---|---|---|
| 2150 BCE (?) - Unknown | Evidence from Isotopic: 14C (uncalibrated) | |||||||||||||||||||
|
List of 2 Events for Episode 1 at NE rift zone
|
||||||||||||||||||||
2250 BCE (?) Confirmed Eruption (Explosive / Effusive) VEI: 0
| Episode 1 | Eruption (Explosive / Effusive) | NE rift zone | |||||||||||||||||||
|---|---|---|---|---|---|---|---|---|---|---|---|---|---|---|---|---|---|---|---|---|
| 2250 BCE (?) - Unknown | Evidence from Isotopic: 14C (uncalibrated) | |||||||||||||||||||
|
List of 2 Events for Episode 1 at NE rift zone
|
||||||||||||||||||||
2350 BCE (?) Confirmed Eruption (Explosive / Effusive) VEI: 0
| Episode 1 | Eruption (Explosive / Effusive) | Mokuaweoweo | |||||||||||||||||||
|---|---|---|---|---|---|---|---|---|---|---|---|---|---|---|---|---|---|---|---|---|
| 2350 BCE (?) - Unknown | Evidence from Isotopic: 14C (uncalibrated) | |||||||||||||||||||
|
List of 2 Events for Episode 1 at Mokuaweoweo
|
||||||||||||||||||||
2750 BCE (?) Confirmed Eruption (Explosive / Effusive) VEI: 0
| Episode 1 | Eruption (Explosive / Effusive) | NE and SW rift zones | |||||||||||||||||||
|---|---|---|---|---|---|---|---|---|---|---|---|---|---|---|---|---|---|---|---|---|
| 2750 BCE (?) - Unknown | Evidence from Isotopic: 14C (uncalibrated) | |||||||||||||||||||
|
List of 2 Events for Episode 1 at NE and SW rift zones
|
||||||||||||||||||||
3250 BCE (?) Confirmed Eruption (Explosive / Effusive) VEI: 0
| Episode 1 | Eruption (Explosive / Effusive) | SW rift zone | |||||||||||||||||||
|---|---|---|---|---|---|---|---|---|---|---|---|---|---|---|---|---|---|---|---|---|
| 3250 BCE (?) - Unknown | Evidence from Isotopic: 14C (uncalibrated) | |||||||||||||||||||
|
List of 2 Events for Episode 1 at SW rift zone
|
||||||||||||||||||||
3350 BCE (?) Confirmed Eruption (Explosive / Effusive) VEI: 0
| Episode 1 | Eruption (Explosive / Effusive) | NE rift zone | |||||||||||||||||||
|---|---|---|---|---|---|---|---|---|---|---|---|---|---|---|---|---|---|---|---|---|
| 3350 BCE (?) - Unknown | Evidence from Isotopic: 14C (uncalibrated) | |||||||||||||||||||
|
List of 2 Events for Episode 1 at NE rift zone
|
||||||||||||||||||||
3750 BCE (?) Confirmed Eruption (Explosive / Effusive) VEI: 0
| Episode 1 | Eruption (Explosive / Effusive) | NE rift zone | |||||||||||||||||||
|---|---|---|---|---|---|---|---|---|---|---|---|---|---|---|---|---|---|---|---|---|
| 3750 BCE (?) - Unknown | Evidence from Isotopic: 14C (uncalibrated) | |||||||||||||||||||
|
List of 2 Events for Episode 1 at NE rift zone
|
||||||||||||||||||||
4250 BCE (?) Confirmed Eruption (Explosive / Effusive) VEI: 0
| Episode 1 | Eruption (Explosive / Effusive) | SW rift zone | |||||||||||||||||||
|---|---|---|---|---|---|---|---|---|---|---|---|---|---|---|---|---|---|---|---|---|
| 4250 BCE (?) - Unknown | Evidence from Isotopic: 14C (uncalibrated) | |||||||||||||||||||
|
List of 2 Events for Episode 1 at SW rift zone
|
||||||||||||||||||||
5350 BCE (?) Confirmed Eruption (Explosive / Effusive) VEI: 0
| Episode 1 | Eruption (Explosive / Effusive) | SW rift zone | |||||||||||||||||||
|---|---|---|---|---|---|---|---|---|---|---|---|---|---|---|---|---|---|---|---|---|
| 5350 BCE (?) - Unknown | Evidence from Isotopic: 14C (uncalibrated) | |||||||||||||||||||
|
List of 2 Events for Episode 1 at SW rift zone
|
||||||||||||||||||||
5650 BCE (?) Confirmed Eruption (Explosive / Effusive) VEI: 0
| Episode 1 | Eruption (Explosive / Effusive) | SW rift zone | |||||||||||||||||||
|---|---|---|---|---|---|---|---|---|---|---|---|---|---|---|---|---|---|---|---|---|
| 5650 BCE (?) - Unknown | Evidence from Isotopic: 14C (uncalibrated) | |||||||||||||||||||
|
List of 2 Events for Episode 1 at SW rift zone
|
||||||||||||||||||||
5850 BCE (?) Confirmed Eruption (Explosive / Effusive) VEI: 0
| Episode 1 | Eruption (Explosive / Effusive) | NE and SW rift zones | |||||||||||||||||||
|---|---|---|---|---|---|---|---|---|---|---|---|---|---|---|---|---|---|---|---|---|
| 5850 BCE (?) - Unknown | Evidence from Isotopic: 14C (uncalibrated) | |||||||||||||||||||
|
List of 2 Events for Episode 1 at NE and SW rift zones
|
||||||||||||||||||||
6250 BCE (?) Confirmed Eruption (Explosive / Effusive) VEI: 0
| Episode 1 | Eruption (Explosive / Effusive) | NE rift zone | |||||||||||||||||||
|---|---|---|---|---|---|---|---|---|---|---|---|---|---|---|---|---|---|---|---|---|
| 6250 BCE (?) - Unknown | Evidence from Isotopic: 14C (uncalibrated) | |||||||||||||||||||
|
List of 2 Events for Episode 1 at NE rift zone
|
||||||||||||||||||||
6550 BCE (?) Confirmed Eruption (Explosive / Effusive) VEI: 0
| Episode 1 | Eruption (Explosive / Effusive) | Mokuaweoweo | |||||||||||||||||||
|---|---|---|---|---|---|---|---|---|---|---|---|---|---|---|---|---|---|---|---|---|
| 6550 BCE (?) - Unknown | Evidence from Isotopic: 14C (uncalibrated) | |||||||||||||||||||
|
List of 2 Events for Episode 1 at Mokuaweoweo
|
||||||||||||||||||||
6650 BCE (?) Confirmed Eruption (Explosive / Effusive) VEI: 0
| Episode 1 | Eruption (Explosive / Effusive) | NE rift zone | |||||||||||||||||||
|---|---|---|---|---|---|---|---|---|---|---|---|---|---|---|---|---|---|---|---|---|
| 6650 BCE (?) - Unknown | Evidence from Isotopic: 14C (uncalibrated) | |||||||||||||||||||
|
List of 2 Events for Episode 1 at NE rift zone
|
||||||||||||||||||||
7150 BCE (?) Confirmed Eruption (Explosive / Effusive) VEI: 0
| Episode 1 | Eruption (Explosive / Effusive) | NE and SW rift zones | |||||||||||||||||||
|---|---|---|---|---|---|---|---|---|---|---|---|---|---|---|---|---|---|---|---|---|
| 7150 BCE (?) - Unknown | Evidence from Isotopic: 14C (uncalibrated) | |||||||||||||||||||
|
List of 2 Events for Episode 1 at NE and SW rift zones
|
||||||||||||||||||||
7350 BCE (?) Confirmed Eruption (Explosive / Effusive) VEI: 0
| Episode 1 | Eruption (Explosive / Effusive) | SW rift zone | |||||||||||||||||||
|---|---|---|---|---|---|---|---|---|---|---|---|---|---|---|---|---|---|---|---|---|
| 7350 BCE (?) - Unknown | Evidence from Isotopic: 14C (uncalibrated) | |||||||||||||||||||
|
List of 2 Events for Episode 1 at SW rift zone
|
||||||||||||||||||||
7550 BCE (?) Confirmed Eruption (Explosive / Effusive) VEI: 0
| Episode 1 | Eruption (Explosive / Effusive) | NE rift zone | |||||||||||||||||||
|---|---|---|---|---|---|---|---|---|---|---|---|---|---|---|---|---|---|---|---|---|
| 7550 BCE (?) - Unknown | Evidence from Isotopic: 14C (uncalibrated) | |||||||||||||||||||
|
List of 2 Events for Episode 1 at NE rift zone
|
||||||||||||||||||||
7850 BCE (?) Confirmed Eruption (Explosive / Effusive) VEI: 0
| Episode 1 | Eruption (Explosive / Effusive) | NE rift zone | |||||||||||||||||||
|---|---|---|---|---|---|---|---|---|---|---|---|---|---|---|---|---|---|---|---|---|
| 7850 BCE (?) - Unknown | Evidence from Isotopic: 14C (uncalibrated) | |||||||||||||||||||
|
List of 2 Events for Episode 1 at NE rift zone
|
||||||||||||||||||||
8050 BCE (?) Confirmed Eruption (Explosive / Effusive) VEI: 0
| Episode 1 | Eruption (Explosive / Effusive) | NE rift zone | |||||||||||||||||||
|---|---|---|---|---|---|---|---|---|---|---|---|---|---|---|---|---|---|---|---|---|
| 8050 BCE (?) - Unknown | Evidence from Isotopic: 14C (uncalibrated) | |||||||||||||||||||
|
List of 2 Events for Episode 1 at NE rift zone
|
||||||||||||||||||||
This compilation of synonyms and subsidiary features may not be comprehensive. Features are organized into four major categories: Cones, Craters, Domes, and Thermal Features. Synonyms of features appear indented below the primary name. In some cases additional feature type, elevation, or location details are provided.
Synonyms |
||||
| Loa, Mount | Mowna Roa | ||||
Cones |
||||
| Feature Name | Feature Type | Elevation | Latitude | Longitude |
| Akimoana | Submarine cone | |||
| Kulua, Puʻu | Cone | 19° 32' 0.00" N | 155° 26' 0.00" W | |
| Moikeha | Submarine cone | |||
| Sulphur Cone | Cone | 19° 24' 0.00" N | 155° 38' 0.00" W | |
| Ulaula, Puʻu | Cone | 19° 32' 0.00" N | 155° 28' 0.00" W | |
Craters |
||||
| Feature Name | Feature Type | Elevation | Latitude | Longitude |
| Hohonu, Lua | Pit crater | 19° 26' 0.00" N | 155° 37' 0.00" W | |
| Hou, Lua | Pit crater | 19° 26' 0.00" N | 155° 37' 0.00" W | |
| Mokuaweoweo | Caldera | 19° 28' 0.00" N | 155° 36' 0.00" W | |
| Northeast Rift Zone | Fissure vent | 19° 32' 0.00" N | 155° 29' 0.00" W | |
| Poholo, Lua | Pit crater | 19° 29' 0.00" N | 155° 35' 0.00" W | |
| South Pit | Pit crater | 19° 27' 0.00" N | 155° 36' 0.00" W | |
| Southwest Rift Zone | Fissure vent | 19° 21' 0.00" N | 155° 40' 0.00" W | |
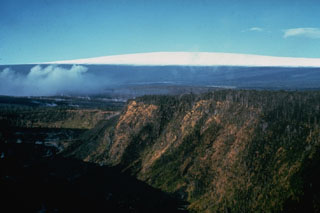 Kīlauea Iki crater in the foreground was the site of a major eruption in 1959. The crater is in Kīlauea's East Rift Zone and is seen here from the east with snow-capped Mauna Loa in the background. Gases rise from the Kīlauea caldera to the left.
 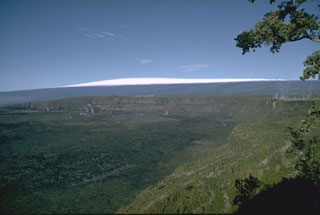 The 3 x 5 km caldera at the summit of Kīlauea is home of the Goddess Pele and has been Hawaii's most active volcano during historical time. Kīlauea is a shield volcano on the east flank of Mauna Loa, visible in the distance. Eruptions originate both from within the summit caldera and from SW and E rift zones that extend to the sea and predominately produce lava flows, with occasional explosive eruptions.
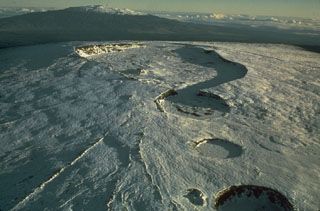 This 1975 photo of the snow-covered summit of Mauna Loa from the SW shows the 2.4 x 4.8 km wide Moku‘āweoweo caldera in the center, with three circular craters in the foreground. South Pit (merging with the SW caldera rim), Lua Hohonu, and Hua Hou (foreground), formed through collapse along the upper SW rift zone. Mauna Kea is in the distance.
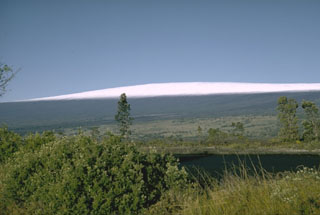 The low-angle flanks of Mauna Loa rise nearly 9 km from the sea floor. The elongated profile was created by repeated eruptions of thin lava flows, primarily from fissure vents along NE- and SW-trending rift zones. Almost 90% of the surface consists of lava flows less than 4,000 years old.
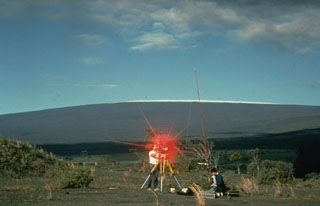 Hawaiian Volcano Observatory scientists conduct an electronic-distance measurement (EDM) survey on the rim of Kīlauea caldera in 1988, with snow-capped Mauna Loa in the background. The procedure uses a laser beam, which is reflected back to the EDM instrument from a distant cluster of reflectors. A precise determination of the distance between the two points is made by a small computer in the EDM instrument. These measurements allow scientists to detect inflation or deflation of the volcano due to changes in the magmatic or hydrothermal systems.
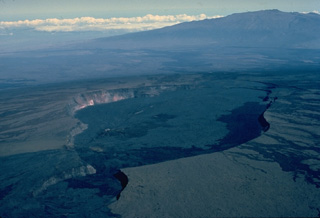 Calderas at the summits of basaltic shield volcanoes, such as this one at Hawaii's Mauna Loa volcano differ from those formed at more silicic stratovolcanoes. The 2.4 x 4.8 km wide Mokuaweoweo caldera, seen here from the south with Mauna Kea volcano in the background, formed when the summit collapsed after large amounts of magma were siphoned away from the summit region by flank eruptions or lava intrusions. The elongate, scalloped form of the caldera reflects both the influence of rift systems and the incremental growth of the caldera.
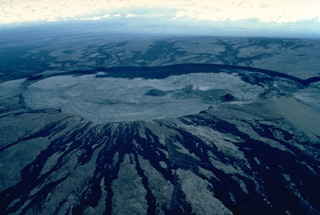 This aerial view of the summit of Mauna Loa from the NW shows the elongated, 2.4 x 4.8 km Mokuaweoweo caldera. The walls of the flat-bottomed caldera are 80-180 m high. Black lava flows visible on the flanks of the caldera were truncated when the caldera collapsed. Virtually the entire caldera floor in this April 1984 view is covered with light-colored lava flows produced during the first day of an eruption in March and April of that year. The cinder cone on the south (right) side of the caldera floor was formed during the 1940 eruption.
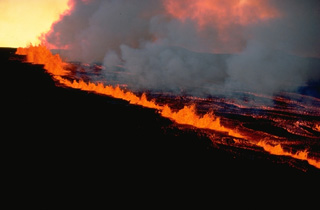 A long line of lava fountains several tens of meters high rise along a NE-flank fissure of Hawaii's Mauna Loa volcano on March 25, 1984. The fissure-fed eruption began within the Mokuaweoweo summit caldera and on the upper SW flank and then was concentrated on the NE flank. Single discrete segments of the eruptive fissure are offset, forming an en-echelon pattern. Activity commonly migrates along a fissure during the course of an eruption. Cinder cones may form where eruptive activity becomes localized at one or more points.
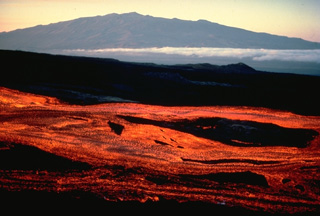 Broad streams of incandescent lava travel down the NE rift zone of Mauna Loa volcano early in the morning of March 25, 1984, with Mauna Kea volcano in the background to the north. The eruptive fissure initially opened in the summit caldera and SW rift zone, but soon migrated down the NE rift zone, where activity continued until the eruption ended on April 15. Lava flows from the NE rift zone traveled down the NE and SE flanks, reaching to within about 5 km of the city limits of Hilo.
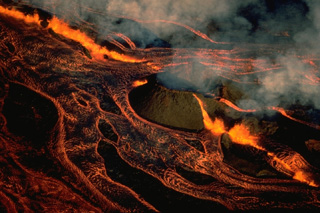 An en-echelon fissure cuts through Pohaku Hanalei, a pre-existing cinder cone on the NE rift zone of Mauna Loa volcano, at dawn on March 25, 1984, during the opening hours of the 1984 eruption. A line of lava fountains feeds incandescent lava flows that are diverted around the old cone and cover almost the entire field of view in this west-looking photo. A 2-km-long curtain of fire between about 3400 and 3470 m altitude was active on the morning of March 25, producing lava fountains 10-50 m high.
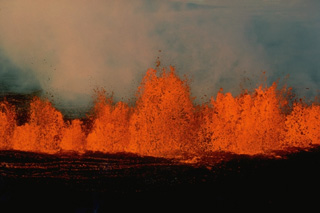 High gas pressure associated with fissure-fed eruptions of basaltic magma produce vigorous lava fountaining that creates a curtain of fire above the eruptive fissure. These fountains, several tens of meters high, occurred during eruptions along the NE rift zone of Mauna Loa on March 25, 1984.
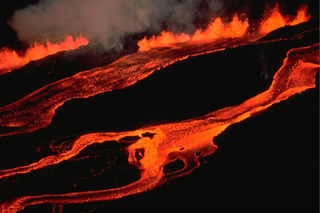 The en-echelon character of the 1984 eruptive fissure at Mauna Loa volcano can be appreciated in this March 25 view from the north along the NE rift zone. The lava fountain at the upper left feeds a lava flow that travels downslope out of view to the left. In the center, a lava flow can be seen that originated from the adjacent offset fissure segment immediately up slope, while the flow to the right originates from another fissure segment farther up slope beyond the photo margin.
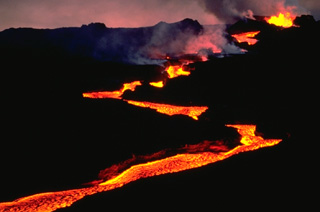 An incandescent lava flow winds its way down the NE rift zone of Mauna Loa volcano early in the morning of March 25, 1984. The flow direction varies as the lava flow detours around higher areas and follows topographic lows along the broad crest of the NE rift zone.
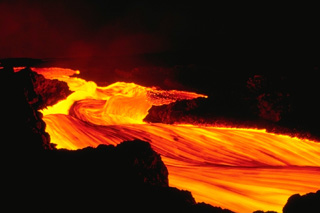 A stream of incandescent lava rapidly flows down the NE rift zone of Hawaii's Mauna Loa volcano during the early morning hours of an eruption that began on March 25, 1984. The eruptive fissures, which initially opened within the summit caldera and on the SW rift zone, then rapidly migrated across the summit caldera. Thereafter, activity was concentrated along the NE rift zone.
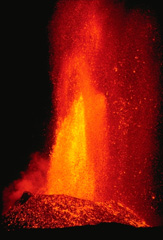 A lava fountain, fed by gas pressure within the basaltic magma of the 1984 Mauna Loa eruption, produces vertical jets of molten lava. Still-fluid, incandescent lava bombs litter the slopes of a cone that was contructed by ejecta that accumulated around the vent. This April photo was taken during a late stage of the eruption that began on March 25 and lasted until April 15.
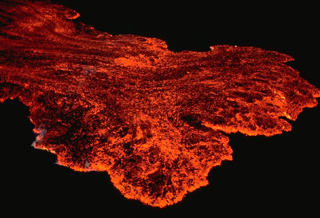 The toe of an April 1984 lava flow advances down the NE rift zone of Mauna Loa volcano in this nighttime view. The flow margin and much of the surface of the flow is incandescent; darker areas occur where the surface of the advancing lava flow has solidified.
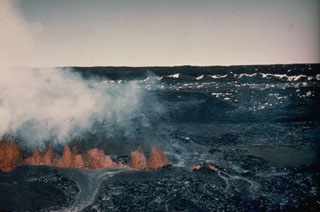 A line of lava fountains across the floor of Moku‘āweoweo caldera is seen from the western Mauna Loa caldera rim on 9 April 1940, two days after the start an eruption at the summit and upper SW flank. The fissure erupted in the SW portion of the caldera and propagated a total distance of 6 km across the caldera and down the SW rift zone. During the course of the eruption lava flows covered two-thirds of the caldera floor.
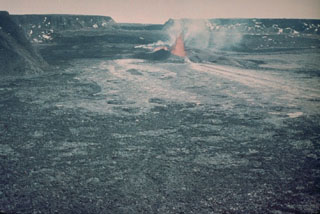 This 12 April 1940 photo shows a lava fountain within the Mauna Loa Moku‘āweoweo caldera from the SE. The eruption began during the night of 7 April from fissures that soon migrated down the SW rift zone. A 6-km-long fissure produced lava flows that covered two-thirds of the caldera floor. The eruption lasted until 18 August.
 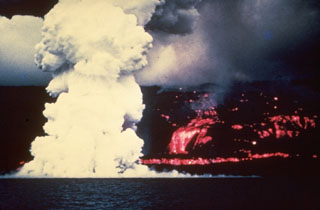 A laze plume (hydrochloric acid, steam, and fine glass particles) rises from the west coast of the Island of Hawai’i on 2 June 1950 where a lava flow from Mauna Loa enters the sea. The Ka’apuna lava flow (right) was the last of three lobes that entered the sea on the second day of an eruption that originated high on the SW rift zone. The lava flow crossed the road encircling the island near Heku Point and destroyed a new restaurant and several buildings. The eruption lasted until 23 June.
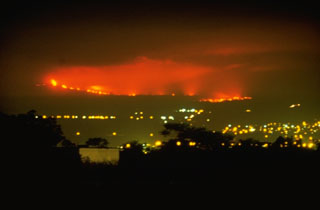 This nighttime view from the city of Hilo shows lava flows from Mauna Loa descending its NE flank on 4 April 1984. The flows traveled 42 km from vents on the upper NE rift zone of Mauna Loa, finally stopping only 5 km from the Hilo city limits. The 1984 lava flows were among the longest during historical time from Mauna Loa, matching the length of the 1942 flows. The 1855 and 1881 lava flows traveled significantly further, with the latter reaching within 2 km of Hilo Bay.
 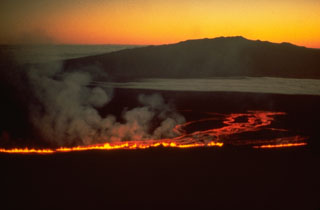 This view from the south on 5 March 1984 shows lava fountains producing a lava flow down the NE flank of Mauna Loa, with Mauna Kea in the background. The eruption began at 0126 at the summit and upper SW rift zone, but the fissure soon extended across the summit caldera and down the NE rift zone. Several hours later a new fissure opened 7 km to the east.
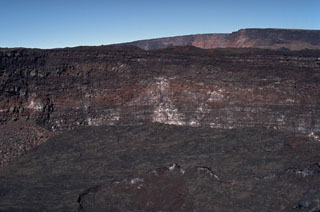 The steep walls of Lua Poholo pit crater, immediately NE of Mokuʻāweoweo caldera, expose a small portion of the accumulation of thin, overlapping lava flows that form Mauna Loa. This view from the NE shows the caldera rim to the upper right. Lava flows from recent eruptions fill crater floor, including the most recent 1984 eruption.
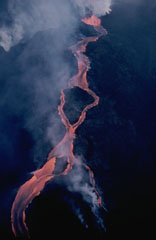 A lava flow from the Mauna Loa NE rift zone travels down the eastern flank on 30 March 1984. The flow developed a braided morphology as it moved around topographic highs. These flows originated from the easternmost vents of the 1984 fissure that opened during the afternoon of 5 March just below Pu'u 'Ula'ula; that remained the only active vent through to the end of the eruption on 15 April.
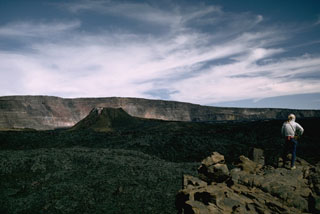 The spatter cone that formed during the 1940 eruption of Mauna Loa is seen in Moku'aweoweo caldera in this 1966 view from the southern rim of the caldera with the western caldera wall in the background. The eruption began along a 6-km-long fissure that extended across the caldera and down the SW rift zone. Activity soon became focused within the caldera and lava flows covered two-thirds of the caldera floor.
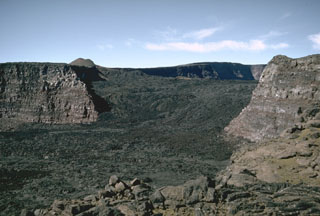 This view looks across Mauna Loa’s South Pit towards Moku’aweoweo caldera in 1966. The lava flows seen here erupted in 1949 within the caldera, then flowed into South Pit after covering the southern caldera floor and continued south for an additional 9 km beyond this crater. The small scoria cone on the horizon was constructed along the main fissure, which fed a lava flow that traveled 11 km down the west flank early in the eruption.
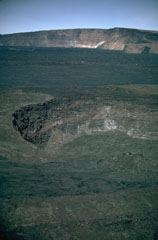 Lua Poholo pit crater is immediately NE of Moku’aweoweo caldera. The crater walls expose a small portion of the massive pile of thin, overlapping lava flows that have formed the summit of Mauna Loa. This 1987 view from the NE shows the western Moku’aweoweo caldera rim. The lava flows covering the caldera floor of the caldera were erupted in 1984.
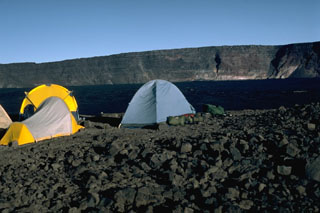 A campsite on the E rim of Mauna Loa's Moku’aweoweo caldera in 1987 has a view of the W rim that rises about 180 m above the lava flows from the 1984 eruption that covered the caldera floor. Lava flows from the 1975 eruption had also almost covered the entire floor. By this time, incremental filling of the caldera had almost halved the maximum recorded caldera depth of 320 m.
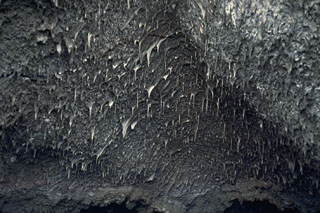 Lava stalactites are abundant on the ceiling of a 1984 fissure within the Mauna Loa Moku’aweoweo caldera. They formed when molten lava was flowing through, dripping and solidifying as they cooled. This section of the 1984 fissure erupted through the 1949 scoria cone located on the SW caldera rim.
 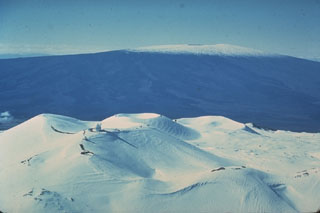 Hawaii's two largest shield volcanoes are Mauna Loa (in the background to the S) and Mauna Kea. Mauna Loa has the classic low-angle profile of a shield volcano constructed by repetitive eruptions of thin, overlapping lava flows. Mauna Kea’s profile has been modified by late-stage explosive eruptions that constructed a series of cones at the summit.
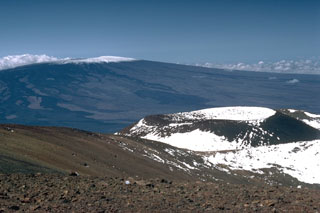 The Pu‘u Haukea scoria cone is one of many recent cones that have formed near the Mauna Kea summit. Mauna Loa is in the background with unvegetated lava flows visible down its flanks. Nearly the entire Mauna Loa surface seen here consists of lava flows erupted during the past 4,000 years.
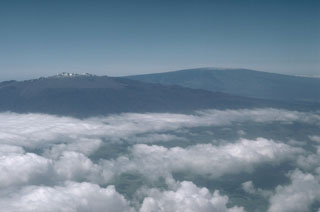 Mauna Kea (left) and Mauna Loa (right), both over 4,000 m above sea level, are also the world's largest active volcanoes, rising nearly 9 km above the sea floor around the island of Hawai’i. This aerial view from the NW shows the contrasting morphologies with the smooth profile of Mauna Loa, and Mauna Kea that was modified by the late-stage products of explosive eruptions.
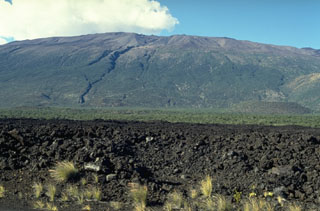 Mauna Kea is seen here from the S at the broad Humu'ulu Saddle between Mauna Kea and Mauna Loa. The lava flow in the foreground was emplaced during an 1843 eruption that originated on the NE rift zone of Mauna Loa. The flow traveled directly N to the Mauna Kea saddle, where it was deflected to the W. The irregular profile of the summit region of Mauna Kea is due to scoria cones and pyroclastic ejecta that are not present at Mauna Loa.
The following 331 samples associated with this volcano can be found in the Smithsonian's NMNH Department of Mineral Sciences collections, and may be availble for research (contact the Rock and Ore Collections Manager). Catalog number links will open a window with more information.
| Catalog Number | Sample Description | Lava Source | Collection Date |
|---|---|---|---|
| NMNH 109058 | Lava | -- | -- |
| NMNH 109059 | Lava | MOKUAWEOWEO CALDERA | -- |
| NMNH 109409-7 | Basalt | -- | -- |
| NMNH 111123-1848 | Olivine Basalt | -- | -- |
| NMNH 112521-52 | Tholeiite | KEAMOKU FLOW | -- |
| NMNH 112521-55 | Tholeiite | -- | -- |
| NMNH 112521-56 | Tholeiite | -- | -- |
| NMNH 112521-57 | Tholeiite | -- | -- |
| NMNH 112521-58 | Tholeiite | KEAMOKU FLOW | -- |
| NMNH 112521-64 | Tholeiite | KULANI CONE | -- |
| NMNH 113095-28 | Unidentified | S RIFT | -- |
| NMNH 113095-28 | Unidentified | S RIFT | -- |
| NMNH 113095-30 | Unidentified | S RIFT, ALIHA FLOW | -- |
| NMNH 113095-30 | Unidentified | S RIFT, ALIHA FLOW | -- |
| NMNH 113095-32 | Unidentified | SUMMIT | -- |
| NMNH 113095-32 | Unidentified | SUMMIT | -- |
| NMNH 113446 | Basalt | -- | -- |
| NMNH 113448 | Basalt | -- | -- |
| NMNH 113501-1 | Basalt | MOKUAWEOWEO CALDERA | -- |
| NMNH 113501-2 | Basalt | MOKUAWEOWEO CALDERA | -- |
| NMNH 113501-3 | Basalt | MOKUAWEOWEO CALDERA | -- |
| NMNH 113501-4 | Basalt | MOKUAWEOWEO CALDERA | -- |
| NMNH 113501-5 | Basalt | MOKUAWEOWEO CALDERA | -- |
| NMNH 113501-6 | Basalt | MOKUAWEOWEO CALDERA | -- |
| NMNH 113501-7 | Basalt | NE RIFT ZONE | -- |
| NMNH 113501-8 | Basalt | MOKUAWEOWEO CALDERA | -- |
| NMNH 113501-9 | Basalt | MOKUAWEOWEO CALDERA | -- |
| NMNH 113502-1 | Basalt | SW RIFT ZONE | -- |
| NMNH 113502-10 | Basalt | SW RIFT ZONE | -- |
| NMNH 113502-2 | Basalt | SW RIFT ZONE | -- |
| NMNH 113502-3 | Basalt | SW RIFT ZONE | -- |
| NMNH 113502-4 | Basalt | SW RIFT ZONE | -- |
| NMNH 113502-5 | Basalt | SW RIFT ZONE | -- |
| NMNH 113502-6 | Basalt | SW RIFT ZONE | -- |
| NMNH 113502-7 | Basalt | SW RIFT ZONE | -- |
| NMNH 113502-8 | Basalt | SW RIFT ZONE | -- |
| NMNH 113502-9 | Basalt | SW RIFT ZONE | -- |
| NMNH 113503-1 | Basalt | NE RIFT ZONE | -- |
| NMNH 113503-2 | Basalt | NE RIFT ZONE | -- |
| NMNH 113503-3 | Basalt | NE RIFT ZONE | -- |
| NMNH 113503-4 | Basalt | NE RIFT ZONE | -- |
| NMNH 113503-5 | Basalt | NE RIFT ZONE | -- |
| NMNH 113503-6 | Basalt | NE RIFT ZONE | -- |
| NMNH 113504-1 | Basalt | -- | -- |
| NMNH 113504-2 | Basalt | -- | -- |
| NMNH 113537-13 | Basalt | -- | 13 Jul 1975 |
| NMNH 113537-17 | Basalt | -- | 15 Jul 1975 |
| NMNH 113537-21 | Basalt | -- | 15 Jul 1975 |
| NMNH 113537-22 | Basalt | -- | 15 Jul 1975 |
| NMNH 113537-23 | Basalt | -- | 21 Jul 1975 |
| NMNH 113537-24 | Basalt | -- | 21 Jul 1975 |
| NMNH 113537-25 | Basalt | -- | 21 Jul 1975 |
| NMNH 113537-26 | Basalt | -- | 29 Jul 1975 |
| NMNH 113537-2A | Basalt | -- | 7 Jul 1975 |
| NMNH 114326-1 | Olivine Basalt | -- | -- |
| NMNH 114326-10 | Olivine Basalt | -- | -- |
| NMNH 114326-11 | Olivine Basalt | -- | -- |
| NMNH 114326-12 | Olivine Basalt | -- | -- |
| NMNH 114326-13 | Olivine Basalt | -- | -- |
| NMNH 114326-14 | Olivine Basalt | -- | -- |
| NMNH 114326-15 | Olivine Basalt | -- | -- |
| NMNH 114326-16 | Olivine Basalt | -- | -- |
| NMNH 114326-17 | Olivine Basalt | -- | -- |
| NMNH 114326-18 | Olivine Basalt | -- | -- |
| NMNH 114326-19 | Olivine Basalt | -- | -- |
| NMNH 114326-2 | Olivine Basalt | -- | -- |
| NMNH 114326-20 | Olivine Basalt | -- | -- |
| NMNH 114326-21 | Olivine Basalt | -- | -- |
| NMNH 114326-22 | Olivine Basalt | -- | -- |
| NMNH 114326-23 | Olivine Basalt | -- | -- |
| NMNH 114326-24 | Olivine Basalt | -- | -- |
| NMNH 114326-25 | Olivine Basalt | -- | -- |
| NMNH 114326-26 | Olivine Basalt | -- | -- |
| NMNH 114326-27 | Olivine Basalt | -- | -- |
| NMNH 114326-28 | Olivine Basalt | -- | -- |
| NMNH 114326-29 | Olivine Basalt | -- | -- |
| NMNH 114326-3 | Olivine Basalt | -- | -- |
| NMNH 114326-30 | Olivine Basalt | -- | -- |
| NMNH 114326-4 | Olivine Basalt | -- | -- |
| NMNH 114326-5 | Olivine Basalt | -- | -- |
| NMNH 114326-6 | Olivine Basalt | -- | -- |
| NMNH 114326-7 | Olivine Basalt | -- | -- |
| NMNH 114326-8 | Olivine Basalt | -- | -- |
| NMNH 114326-9 | Olivine Basalt | -- | -- |
| NMNH 114363-1 | Ultramafic Nodule | -- | -- |
| NMNH 114363-2 | Basalt | -- | -- |
| NMNH 114363-3 | Olivine Basalt | -- | -- |
| NMNH 114364-1 | Olivine Basalt | -- | -- |
| NMNH 114365-1 | Olivine Basalt | -- | -- |
| NMNH 114365-10 | Olivine Basalt | -- | -- |
| NMNH 114365-3 | Olivine Basalt | -- | -- |
| NMNH 114365-4 | Olivine Basalt | -- | -- |
| NMNH 114365-5 | Olivine Basalt | -- | -- |
| NMNH 114365-6 | Olivine Basalt | -- | -- |
| NMNH 114365-7 | Olivine Basalt | -- | -- |
| NMNH 114365-8 | Olivine Basalt | -- | -- |
| NMNH 114365-9 | Olivine Basalt | -- | -- |
| NMNH 114366-1 | Olivine Basalt | -- | -- |
| NMNH 114366-10 | Olivine Basalt | -- | -- |
| NMNH 114366-11 | Olivine Basalt | -- | -- |
| NMNH 114366-12 | Olivine Basalt | -- | -- |
| NMNH 114366-13 | Olivine Basalt | -- | -- |
| NMNH 114366-14 | Olivine Basalt | -- | -- |
| NMNH 114366-15 | Olivine Basalt | -- | -- |
| NMNH 114366-16 | Olivine Basalt | -- | -- |
| NMNH 114366-17 | Olivine Basalt | -- | -- |
| NMNH 114366-18 | Olivine Basalt | -- | -- |
| NMNH 114366-19 | Olivine Basalt | -- | -- |
| NMNH 114366-2 | Olivine Basalt | -- | -- |
| NMNH 114366-3 | Olivine Basalt | -- | -- |
| NMNH 114366-4 | Olivine Basalt | -- | -- |
| NMNH 114366-5 | Olivine Basalt | -- | -- |
| NMNH 114366-6 | Olivine Basalt | -- | -- |
| NMNH 114366-7 | Olivine Basalt | -- | -- |
| NMNH 114366-8 | Olivine Basalt | -- | -- |
| NMNH 114366-9 | Olivine Basalt | -- | -- |
| NMNH 114394-1 | Ultramafic Nodule | -- | -- |
| NMNH 114394-10 | Ultramafic Nodule | -- | -- |
| NMNH 114394-11 | Ultramafic Nodule | -- | -- |
| NMNH 114394-12 | Ultramafic Nodule | -- | -- |
| NMNH 114394-13 | Ultramafic Nodule | -- | -- |
| NMNH 114394-14 | Ultramafic Nodule | -- | -- |
| NMNH 114394-15 | Ultramafic Nodule | -- | -- |
| NMNH 114394-16 | Ultramafic Nodule | -- | -- |
| NMNH 114394-17 | Ultramafic Nodule | -- | -- |
| NMNH 114394-18 | Ultramafic Nodule | -- | -- |
| NMNH 114394-19 | Ultramafic Nodule | -- | -- |
| NMNH 114394-2 | Ultramafic Nodule | -- | -- |
| NMNH 114394-20 | Ultramafic Nodule | -- | -- |
| NMNH 114394-21 | Ultramafic Nodule | -- | -- |
| NMNH 114394-22 | Ultramafic Nodule | -- | -- |
| NMNH 114394-23 | Ultramafic Nodule | -- | -- |
| NMNH 114394-24 | Ultramafic Nodule | -- | -- |
| NMNH 114394-3 | Ultramafic Nodule | -- | -- |
| NMNH 114394-4 | Ultramafic Nodule | -- | -- |
| NMNH 114394-5 | Ultramafic Nodule | -- | -- |
| NMNH 114394-6 | Ultramafic Nodule | -- | -- |
| NMNH 114394-7 | Ultramafic Nodule | -- | -- |
| NMNH 114394-8 | Ultramafic Nodule | -- | -- |
| NMNH 114394-9 | Ultramafic Nodule | -- | -- |
| NMNH 114395-1 | Ultramafic Nodule | -- | -- |
| NMNH 114395-2 | Basalt | -- | -- |
| NMNH 114395-4 | Basalt | -- | -- |
| NMNH 114396-2 | Basalt | -- | -- |
| NMNH 114396-3 | Basalt | -- | -- |
| NMNH 114396-4 | Basalt | -- | -- |
| NMNH 114396-5 | Basalt | -- | -- |
| NMNH 114396-6 | Basalt | -- | -- |
| NMNH 114396-7 | Basalt | -- | -- |
| NMNH 114396-8 | Basalt | -- | -- |
| NMNH 114396-9 | Basalt | -- | -- |
| NMNH 114397-1 | Tholeiite | -- | -- |
| NMNH 114397-2 | Ultramafic Nodule | -- | -- |
| NMNH 114397-3 | Ultramafic Nodule | -- | -- |
| NMNH 114397-4 | Ultramafic Nodule | -- | -- |
| NMNH 114397-5 | Ultramafic Nodule | -- | -- |
| NMNH 114398-1 | Basalt | -- | -- |
| NMNH 114398-2 | Basalt | -- | -- |
| NMNH 114398-3 | Basalt | -- | -- |
| NMNH 114398-5 | Basalt | -- | -- |
| NMNH 114759-1 | Basalt | -- | -- |
| NMNH 114759-10 | Basalt | -- | -- |
| NMNH 114759-11 | Basalt | -- | -- |
| NMNH 114759-12 | Basalt | -- | -- |
| NMNH 114759-13 | Basalt | -- | -- |
| NMNH 114759-14 | Basalt | -- | -- |
| NMNH 114759-15 | Basalt | -- | -- |
| NMNH 114759-16 | Basalt | -- | -- |
| NMNH 114759-17 | Basalt | -- | -- |
| NMNH 114759-18 | Basalt | -- | -- |
| NMNH 114759-19 | Basalt | -- | -- |
| NMNH 114759-2 | Basalt | -- | -- |
| NMNH 114759-20 | Basalt | -- | -- |
| NMNH 114759-21 | Basalt | -- | -- |
| NMNH 114759-3 | Basalt | -- | -- |
| NMNH 114759-4 | Basalt | -- | -- |
| NMNH 114759-5 | Basalt | -- | -- |
| NMNH 114759-6 | Basalt | -- | -- |
| NMNH 114759-7 | Basalt | -- | -- |
| NMNH 114759-8 | Basalt | -- | -- |
| NMNH 114759-9 | Basalt | -- | -- |
| NMNH 115310-1 | Glass | -- | -- |
| NMNH 115310-10 | Glass | -- | -- |
| NMNH 115310-11 | Glass | -- | -- |
| NMNH 115310-12 | Glass | -- | -- |
| NMNH 115310-13 | Glass | -- | -- |
| NMNH 115310-14 | Glass | -- | -- |
| NMNH 115310-15 | Glass | -- | -- |
| NMNH 115310-16 | Glass | -- | -- |
| NMNH 115310-17 | Glass | -- | -- |
| NMNH 115310-18 | Glass | -- | -- |
| NMNH 115310-19 | Glass | -- | -- |
| NMNH 115310-2 | Glass | -- | -- |
| NMNH 115310-20 | Glass | -- | -- |
| NMNH 115310-3 | Glass | -- | -- |
| NMNH 115310-4 | Glass | -- | -- |
| NMNH 115310-5 | Glass | -- | -- |
| NMNH 115310-6 | Glass | -- | -- |
| NMNH 115310-7 | Glass | -- | -- |
| NMNH 115310-8 | Glass | -- | -- |
| NMNH 115310-9 | Glass | -- | -- |
| NMNH 115560-1 | Basalt Glass | -- | -- |
| NMNH 115560-2 | Basalt Glass | -- | -- |
| NMNH 115560-3 | Basalt Glass | -- | -- |
| NMNH 115560-4 | Basalt Glass | -- | -- |
| NMNH 115560-5 | Basalt Glass | -- | -- |
| NMNH 115560-6 | Basalt Glass | -- | -- |
| NMNH 115560-7 | Basalt Glass | -- | -- |
| NMNH 115560-8 | Basalt Glass | -- | -- |
| NMNH 115560-9 | Basalt Glass | -- | -- |
| NMNH 116130-1 | Basalt | SW RIFT ZONE | -- |
| NMNH 116130-10 | Basalt | SW RIFT ZONE | -- |
| NMNH 116130-11 | Basalt | SW RIFT ZONE | -- |
| NMNH 116130-12 | Basaltic Nodule | -- | -- |
| NMNH 116130-13 | Scoriaceous Basalt | NE RIFT ZONE | -- |
| NMNH 116130-14 | Scoriaceous Basalt | NE RIFT ZONE | -- |
| NMNH 116130-15 | Scoriaceous Basalt | NE RIFT ZONE | -- |
| NMNH 116130-16 | Scoriaceous Basalt | NE RIFT ZONE | -- |
| NMNH 116130-17 | Scoriaceous Basalt | NE RIFT ZONE | -- |
| NMNH 116130-18 | Basalt | NE RIFT ZONE | -- |
| NMNH 116130-19 | Scoriaceous Basalt | NE RIFT ZONE | -- |
| NMNH 116130-2 | Scoriaceous Basalt | SW RIFT ZONE | -- |
| NMNH 116130-20 | Scoriaceous Basalt | NE RIFT ZONE | -- |
| NMNH 116130-21 | Scoriaceous Basalt | NE RIFT ZONE | -- |
| NMNH 116130-22 | Scoriaceous-Pumiceous Basalt | NE RIFT ZONE | -- |
| NMNH 116130-3 | Olivine Basalt | SW RIFT ZONE | -- |
| NMNH 116130-4 | Olivine Basalt | -- | -- |
| NMNH 116130-5 | Scoriaceous Basalt | SW RIFT ZONE | -- |
| NMNH 116130-6 | Olivine Basalt | -- | -- |
| NMNH 116130-7 | Scoriaceous Basalt | SW RIFT ZONE | -- |
| NMNH 116130-8 | Scoriaceous Basalt | SW RIFT ZONE | -- |
| NMNH 116130-9 | Scoriaceous Basalt | SW RIFT ZONE | -- |
| NMNH 116150-1 | Olivine Basalt | SW RIFT ZONE | -- |
| NMNH 116150-2 | Basalt | NINOLE | -- |
| NMNH 116150-3 | Vesicular Basalt | -- | 6 Dec 1958 |
| NMNH 116151-1 | Basalt | MOKUAWEOWEO CALDERA | -- |
| NMNH 116151-10 | Basalt | MOKUAWEOWEO CALDERA | -- |
| NMNH 116151-11 | Basalt | MOKUAWEOWEO CALDERA | -- |
| NMNH 116151-12 | Basalt | MOKUAWEOWEO CALDERA | -- |
| NMNH 116151-13 | Basalt | MOKUAWEOWEO CALDERA | -- |
| NMNH 116151-14 | Basalt | MOKUAWEOWEO CALDERA | -- |
| NMNH 116151-15 | Basalt | MOKUAWEOWEO CALDERA | -- |
| NMNH 116151-16 | Basalt | MOKUAWEOWEO CALDERA | -- |
| NMNH 116151-17 | Basalt | MOKUAWEOWEO CALDERA | -- |
| NMNH 116151-18 | Basalt | MOKUAWEOWEO CALDERA | -- |
| NMNH 116151-2 | Basalt | MOKUAWEOWEO CALDERA | -- |
| NMNH 116151-3 | Basalt | MOKUAWEOWEO CALDERA | -- |
| NMNH 116151-4 | Basalt | MOKUAWEOWEO CALDERA | -- |
| NMNH 116151-5 | Basalt | MOKUAWEOWEO CALDERA | -- |
| NMNH 116151-6 | Basalt | MOKUAWEOWEO CALDERA | -- |
| NMNH 116151-7 | Basalt | MOKUAWEOWEO CALDERA | -- |
| NMNH 116151-8 | Basalt | MOKUAWEOWEO CALDERA | -- |
| NMNH 116151-9 | Basalt | MOKUAWEOWEO CALDERA | -- |
| NMNH 116152-1 | Scoriaceous Basalt | MOKUAWEOWEO CALDERA | -- |
| NMNH 116152-2 | Vesicular Basalt | MOKUAWEOWEO CALDERA | -- |
| NMNH 116152-3 | Basalt | MOKUAWEOWEO CALDERA | -- |
| NMNH 116249-32 | Scoriaceous Basalt | -- | -- |
| NMNH 116249-33 | Basaltic Pumice | -- | -- |
| NMNH 116249-34 | Basaltic Pumice | MOKUAWEOWEO CALDERA | -- |
| NMNH 116249-35 | Scoriaceous Basalt | MOKUAWEOWEO CALDERA | -- |
| NMNH 116249-36 | Glassy Basalt | NW SLOPE | -- |
| NMNH 116249-37 | Olivine Basalt | SW RIFT ZONE | -- |
| NMNH 116249-38 | Olivine Basalt | SW RIFT ZONE | -- |
| NMNH 116249-39 | Olivine Basalt | SW RIFT ZONE | -- |
| NMNH 116249-40 | Picritic Basalt | -- | -- |
| NMNH 116249-41 | Scoriaceous Basalt | -- | -- |
| NMNH 116249-42 | Picritic Basalt | MOKUAWEOWEO CALDERA | -- |
| NMNH 116249-43 | Scoriaceous Basalt | S RIFT ZONE | -- |
| NMNH 116249-44 | Scoriaceous Basalt | MOKUAWEOWEO CALDERA | -- |
| NMNH 116249-45 | Basalt | -- | -- |
| NMNH 116249-46 | Glassy Basalt | -- | -- |
| NMNH 116249-47 | Glassy Basalt | -- | -- |
| NMNH 116249-50 | Basalt | -- | -- |
| NMNH 116249-51 | Olivine Basalt | SW RIFT ZONE | -- |
| NMNH 116249-52 | Olivine Basalt | SW RIFT ZONE | -- |
| NMNH 116249-68 | Basalt | -- | -- |
| NMNH 116249-69A | Picritic Basalt | -- | -- |
| NMNH 116249-69B | Picritic Basalt | -- | -- |
| NMNH 116249-72 | Scoriaceous Basalt | -- | -- |
| NMNH 116249-73 | Scoriaceous Basalt | -- | -- |
| NMNH 116249-74 | Basaltic Pumice | KOKOOLAU CRATER | -- |
| NMNH 116249-75 | Scoriaceous Basalt | KOKOOLAU CRATER | -- |
| NMNH 116249-76 | Basalt | KOKOOLAU CRATER | -- |
| NMNH 116249-77 | Basalt | PUU KOLI | -- |
| NMNH 116253-1 | Olivine Basalt | -- | -- |
| NMNH 116253-13 | Olivine Basalt | -- | -- |
| NMNH 116253-14 | Andesine Basalt | -- | -- |
| NMNH 116253-2 | Basalt | -- | -- |
| NMNH 116253-47 | Lava | SW RIFT ZONE | -- |
| NMNH 116253-8 | Basalt | -- | -- |
| NMNH 116859-10 | Tholeiite | -- | -- |
| NMNH 116859-4 | Tholeiite | -- | -- |
| NMNH 116859-5 | Tholeiite | -- | -- |
| NMNH 116859-6 | Tholeiite | -- | -- |
| NMNH 116859-7 | Tholeiite | -- | -- |
| NMNH 116859-8 | Tholeiite | -- | -- |
| NMNH 116859-9 | Tholeiite | -- | -- |
| NMNH 116865-10 | Tholeiite | SW RIFT ZONE | -- |
| NMNH 116865-21 | Spatter | S RIFT ZONE | -- |
| NMNH 116865-22 | Spatter | MOKUAWEOWEO CALDERA; SW RIFT ZONE | -- |
| NMNH 116865-23 | Olivine Basalt | SW RIFT ZONE | -- |
| NMNH 116865-29 | Lava | -- | -- |
| NMNH 116865-4 | Tholeiite | N FLANK | -- |
| NMNH 116865-5 | Tholeiite | SW RIFT ZONE | -- |
| NMNH 116865-6 | Tholeiite | SW RIFT ZONE | -- |
| NMNH 116865-7 | Tholeiite | SW RIFT ZONE | -- |
| NMNH 116865-8 | Tholeiite | SW RIFT ZONE | -- |
| NMNH 116865-9 | Tholeiite | SW RIFT ZONE | -- |
| NMNH 117254-96 | Lava | -- | -- |
| NMNH 117270-1 | Andesine Basalt | -- | -- |
| NMNH 118148-53 | Basalt | -- | -- |
| NMNH 68464 | Basalt | -- | -- |
| NMNH 68464-1 | Lava | -- | -- |
| NMNH 68464-2 | Lava | -- | -- |
| NMNH 68465-1 | Lava | -- | -- |
| NMNH 68465-2 | Lava | -- | -- |
| NMNH 68465-3 | Lava | -- | -- |
| NMNH 68466 | Lava | -- | -- |
| NMNH 70568 | Basalt | -- | -- |
| NMNH 88126-41 | Olivine-Plagioclase Basalt | -- | -- |
| NMNH 88126-42 | Olivine-Plagioclase Basalt | -- | -- |
| NMNH 88126-43 | Olivine-Plagioclase Basalt | -- | -- |
| NMNH 88127-45 | Olivine-Plagioclase Basalt | -- | -- |
| NMNH 92588-100 | Volcanic Rock | -- | -- |
| NMNH 92588-101 | Volcanic Rock | -- | -- |
| NMNH 92588-99 | Volcanic Rock | -- | -- |
| NMNH 99987-1 | Andesine Basalt | -- | -- |
| NMNH 99987-2 | Andesine Basalt | -- | -- |
| NMNH 99988 | Andesine Basalt | -- | -- |
| NMNH 99989 | Olivine-Oligoclase Basalt | -- | -- |
| NMNH 99990 | Olivine Basalt | -- | -- |
| Copernicus Browser | The Copernicus Browser replaced the Sentinel Hub Playground browser in 2023, to provide access to Earth observation archives from the Copernicus Data Space Ecosystem, the main distribution platform for data from the EU Copernicus missions. |
| MIROVA | Middle InfraRed Observation of Volcanic Activity (MIROVA) is a near real time volcanic hot-spot detection system based on the analysis of MODIS (Moderate Resolution Imaging Spectroradiometer) data. In particular, MIROVA uses the Middle InfraRed Radiation (MIR), measured over target volcanoes, in order to detect, locate and measure the heat radiation sourced from volcanic activity. |
| MODVOLC Thermal Alerts | Using infrared satellite Moderate Resolution Imaging Spectroradiometer (MODIS) data, scientists at the Hawai'i Institute of Geophysics and Planetology, University of Hawai'i, developed an automated system called MODVOLC to map thermal hot-spots in near real time. For each MODIS image, the algorithm automatically scans each 1 km pixel within it to check for high-temperature hot-spots. When one is found the date, time, location, and intensity are recorded. MODIS looks at every square km of the Earth every 48 hours, once during the day and once during the night, and the presence of two MODIS sensors in space allows at least four hot-spot observations every two days. Each day updated global maps are compiled to display the locations of all hot spots detected in the previous 24 hours. There is a drop-down list with volcano names which allow users to 'zoom-in' and examine the distribution of hot-spots at a variety of spatial scales. |
|
WOVOdat
Single Volcano View Temporal Evolution of Unrest Side by Side Volcanoes |
WOVOdat is a database of volcanic unrest; instrumentally and visually recorded changes in seismicity, ground deformation, gas emission, and other parameters from their normal baselines. It is sponsored by the World Organization of Volcano Observatories (WOVO) and presently hosted at the Earth Observatory of Singapore.
GVMID Data on Volcano Monitoring Infrastructure The Global Volcano Monitoring Infrastructure Database GVMID, is aimed at documenting and improving capabilities of volcano monitoring from the ground and space. GVMID should provide a snapshot and baseline view of the techniques and instrumentation that are in place at various volcanoes, which can be use by volcano observatories as reference to setup new monitoring system or improving networks at a specific volcano. These data will allow identification of what monitoring gaps exist, which can be then targeted by remote sensing infrastructure and future instrument deployments. |
| Volcanic Hazard Maps | The IAVCEI Commission on Volcanic Hazards and Risk has a Volcanic Hazard Maps database designed to serve as a resource for hazard mappers (or other interested parties) to explore how common issues in hazard map development have been addressed at different volcanoes, in different countries, for different hazards, and for different intended audiences. In addition to the comprehensive, searchable Volcanic Hazard Maps Database, this website contains information about diversity of volcanic hazard maps, illustrated using examples from the database. This site is for educational purposes related to volcanic hazard maps. Hazard maps found on this website should not be used for emergency purposes. For the most recent, official hazard map for a particular volcano, please seek out the proper institutional authorities on the matter. |
| IRIS seismic stations/networks | Incorporated Research Institutions for Seismology (IRIS) Data Services map showing the location of seismic stations from all available networks (permanent or temporary) within a radius of 0.18° (about 20 km at mid-latitudes) from the given location of Mauna Loa. Users can customize a variety of filters and options in the left panel. Note that if there are no stations are known the map will default to show the entire world with a "No data matched request" error notice. |
| UNAVCO GPS/GNSS stations | Geodetic Data Services map from UNAVCO showing the location of GPS/GNSS stations from all available networks (permanent or temporary) within a radius of 20 km from the given location of Mauna Loa. Users can customize the data search based on station or network names, location, and time window. Requires Adobe Flash Player. |
| DECADE Data | The DECADE portal, still in the developmental stage, serves as an example of the proposed interoperability between The Smithsonian Institution's Global Volcanism Program, the Mapping Gas Emissions (MaGa) Database, and the EarthChem Geochemical Portal. The Deep Earth Carbon Degassing (DECADE) initiative seeks to use new and established technologies to determine accurate global fluxes of volcanic CO2 to the atmosphere, but installing CO2 monitoring networks on 20 of the world's 150 most actively degassing volcanoes. The group uses related laboratory-based studies (direct gas sampling and analysis, melt inclusions) to provide new data for direct degassing of deep earth carbon to the atmosphere. |
| Large Eruptions of Mauna Loa | Information about large Quaternary eruptions (VEI >= 4) is cataloged in the Large Magnitude Explosive Volcanic Eruptions (LaMEVE) database of the Volcano Global Risk Identification and Analysis Project (VOGRIPA). |
| EarthChem | EarthChem develops and maintains databases, software, and services that support the preservation, discovery, access and analysis of geochemical data, and facilitate their integration with the broad array of other available earth science parameters. EarthChem is operated by a joint team of disciplinary scientists, data scientists, data managers and information technology developers who are part of the NSF-funded data facility Integrated Earth Data Applications (IEDA). IEDA is a collaborative effort of EarthChem and the Marine Geoscience Data System (MGDS). |

