The Instituto Geofísico-Escuela Politécnica Nacional (IG-EPN) reported seismic unrest at Fernandina. A M 4.3 earthquake was recorded at 2306 on 16 November. A seismic swarm began at 0800 the next morning and was composed of smaller magnitude events located beneath the N flank. There are no residents on the island.
Source: Instituto Geofísico-Escuela Politécnica Nacional (IG-EPN)
Fissure eruption produced lava flows during 12-13 January 2020
Fernandina is a volcanic island in the Galapagos islands, around 1,000 km W from the coast of mainland Ecuador. It has produced nearly 30 recorded eruptions since 1800, with the most recent events having occurred along radial or circumferential fissures around the summit crater. The most recent previous eruption, starting on 16 June 2018, lasted two days and produced lava flows from a radial fissure on the northern flank. Monitoring and scientific reports come from the Instituto Geofísico, Escuela Politécnica Nacional (IG-EPN).
A report from IG-EPN on 12 January 2020 stated that there had been an increase in seismicity and deformation occurring during the previous weeks. On the day of the report, 11 seismic events had occurred, with the largest magnitude of 4.7 at a depth of 5 km. Shortly before 1810 that day a circumferential fissure formed below the eastern rim of the La Cumbre crater, at about 1.3-1.4 km elevation, and produced lava flows down the flank (figure 39). A rapid-onset seismic swarm reached maximum intensity at 1650 on 12 January (figure 40); a second increase in seismicity indicating the start of the eruption began around 70 minutes later (1800). A hotspot was observed in NOAA / CIMSS data between 1800 and 1810, and a gas plume rising up to 2 km above the fissure dispersed W to NW. The eruption lasted 9 hours, until about 0300 on 13 January.
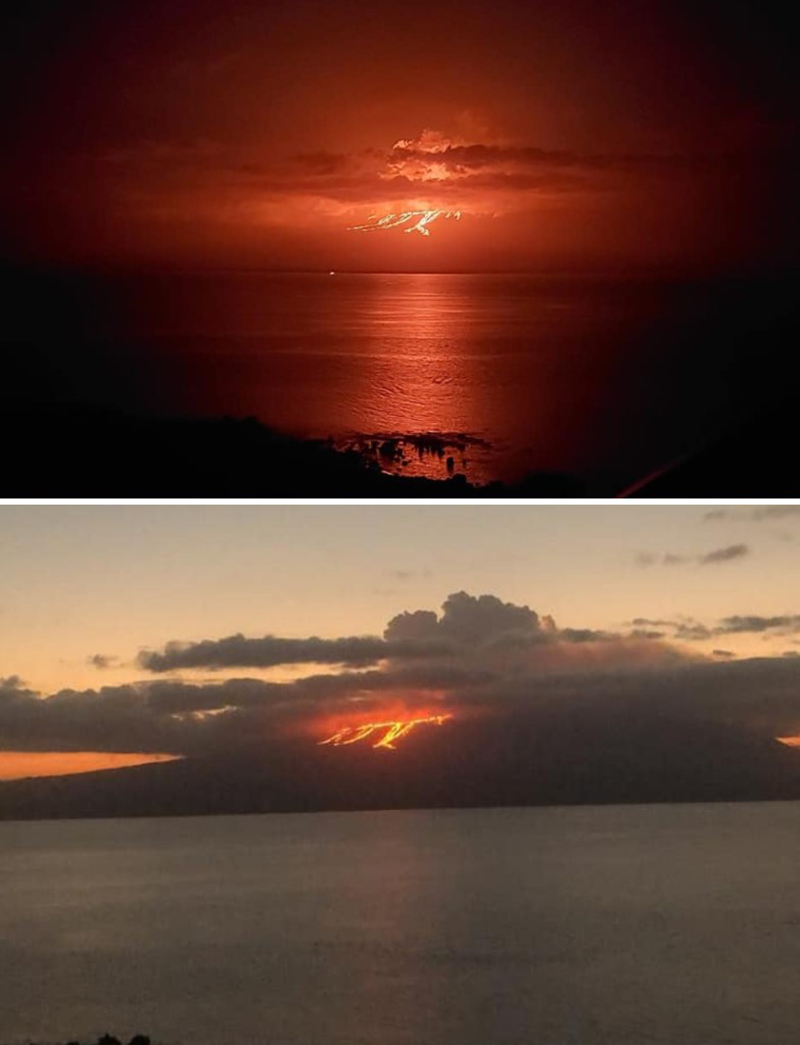 |
Figure 39. Lava flows erupting from a circumferential fissure on the eastern flank of Fernandina on 12 January 2020. Photos courtesy of Parque Nacional Galápagos. |
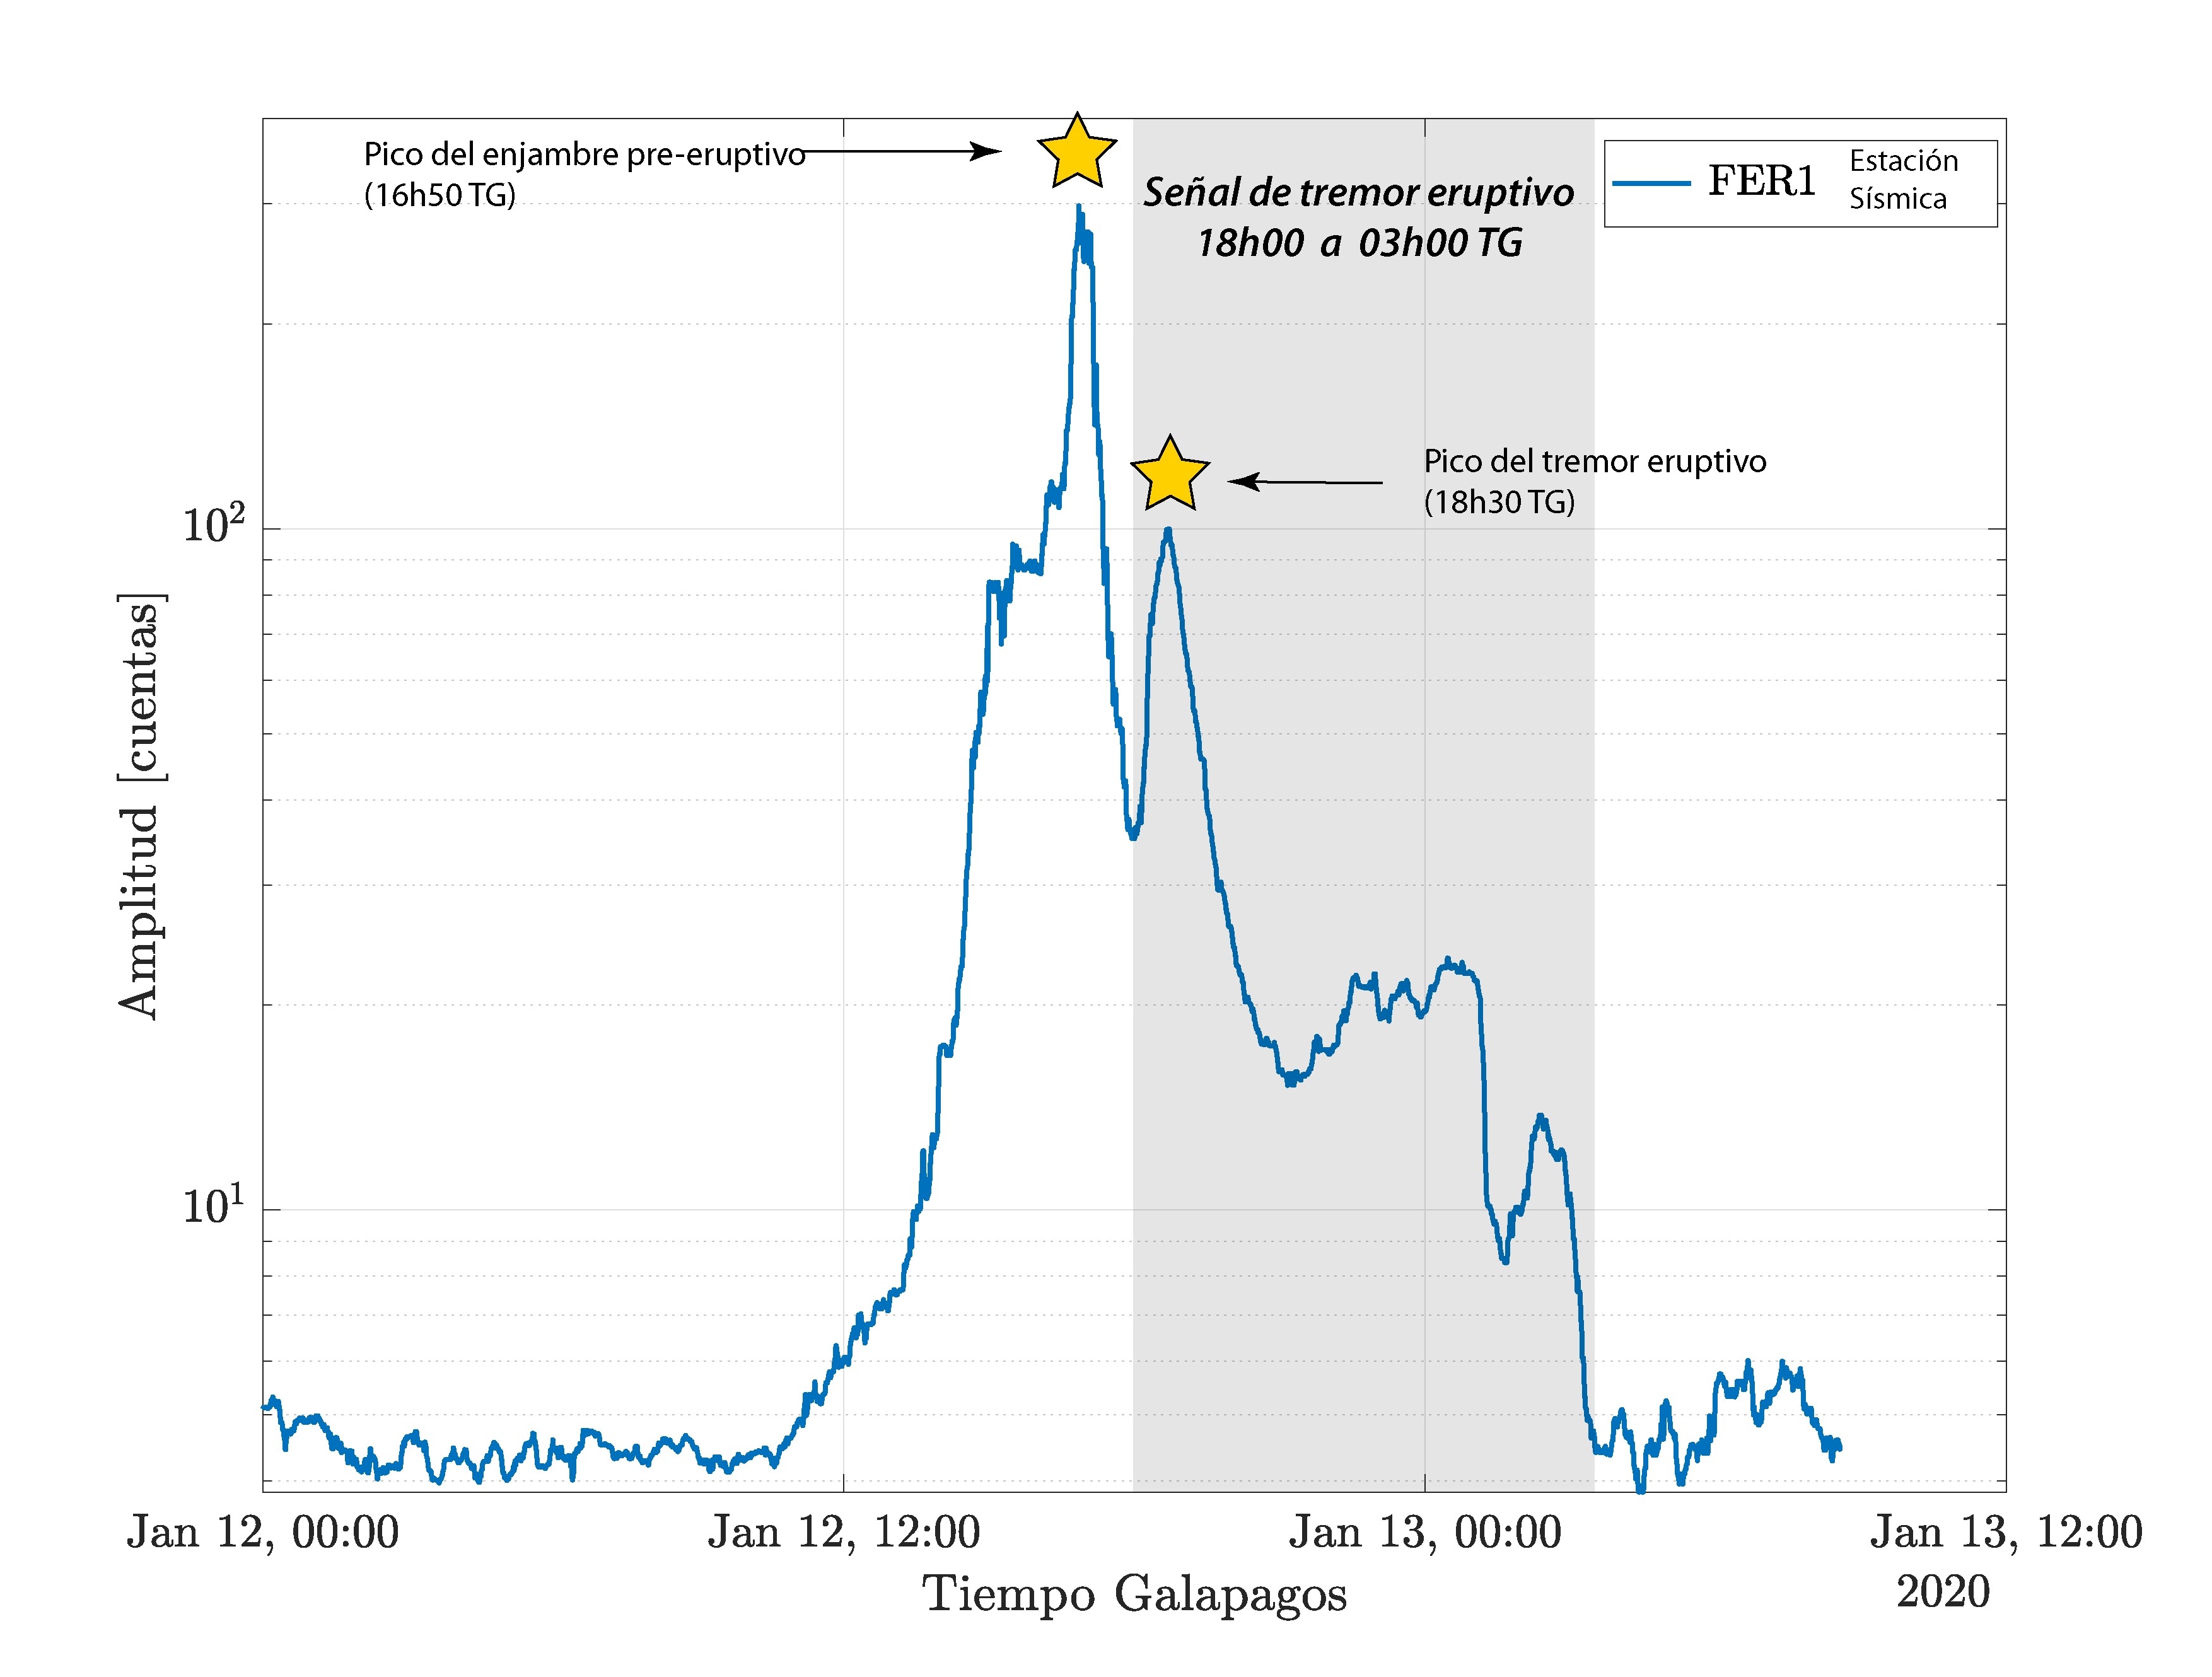 |
Figure 40. Graph showing the Root-Mean-Square (RMS) amplitude of the seismic signals from the FER-1 station at Fernandina on 12-13 January 2020. The graph shows the increase in seismicity leading to the eruption on the 12th (left star), a decrease in the seismicity, and then another increase during the event (right star). Courtesy of S. Hernandez, IG-EPN (Report on 13 January 2020). |
A report issued at 1159 local time on 13 January 2020 described a rapid decrease in seismicity, gas emissions, and thermal anomalies, indicating a rapid decline in eruptive activity similar to previous events in 2017 and 2018. An overflight that day confirmed that the eruption had ended, after lava flows had extended around 500 m from the crater and covered an area of 3.8 km2 (figures 41 and 42). Seismicity continued on the 14th, with small volcano-tectonic (VT) earthquakes occurring less than 500 m below the surface. Periodic seismicity was recorded through 13-15 January, though there was an increase in seismicity during 17-22 January with deformation also detected (figure 43). No volcanic activity followed, and no additional gas or thermal anomalies were detected.
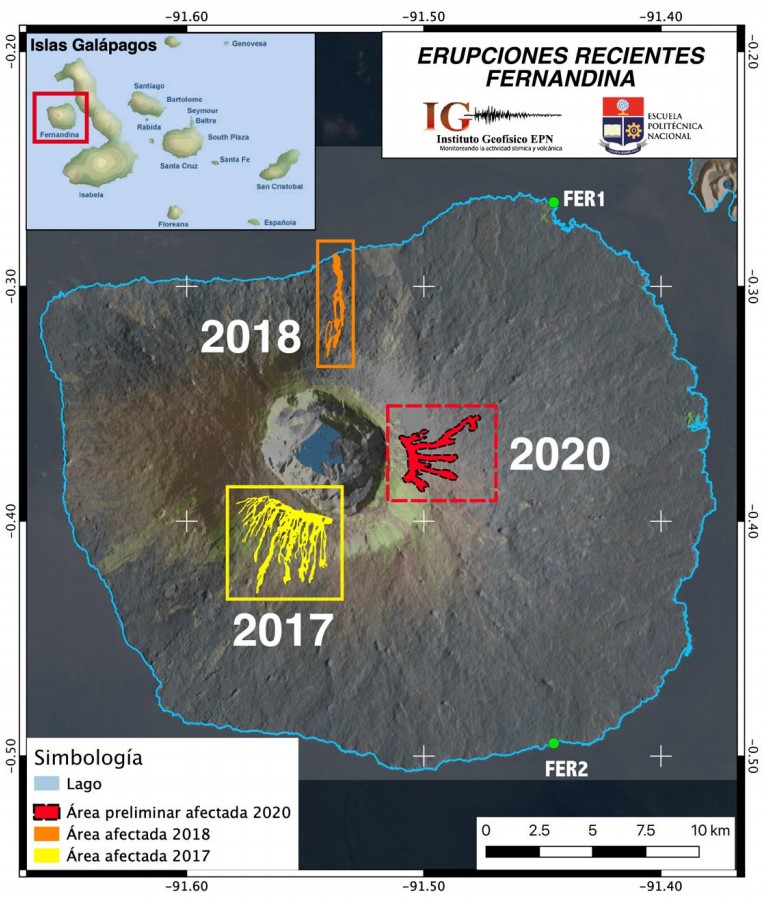 |
Figure 41. The lava flow extents at Fernandina of the previous two eruptions (4-7 September 2017 and 16-21 June 2018) and the 12-13 January 2020 eruption as detected by FIRMS thermal anomalies. Thermal data courtesy of NASA; figure prepared by F. Vásconez, IG-EPN (Report on 13 January 2020). |
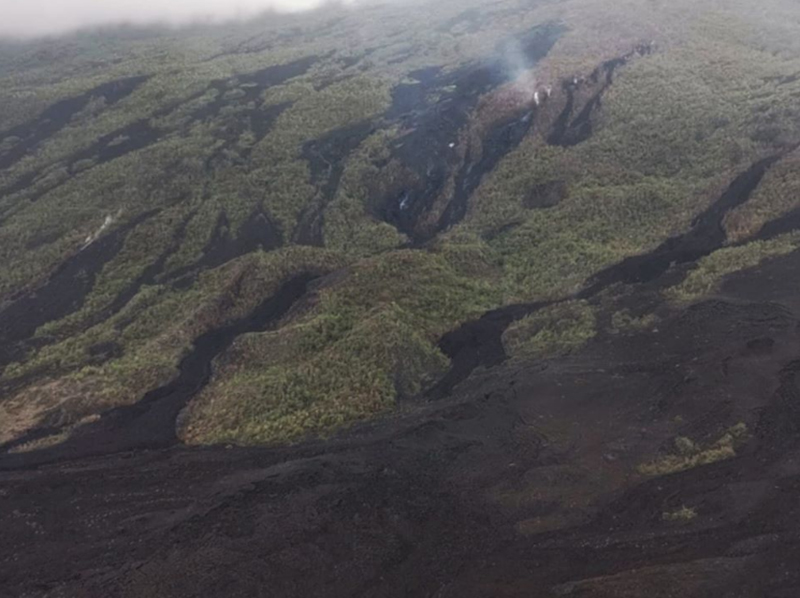 |
Figure 42. This fissure vent that formed on the E flank of Fernandina on 12 January 2020 produced several lava flows. A weak gas plume was still rising when this photo was taken the next day, but the eruption had ceased. Courtesy of Parque Nacional Galápagos. |
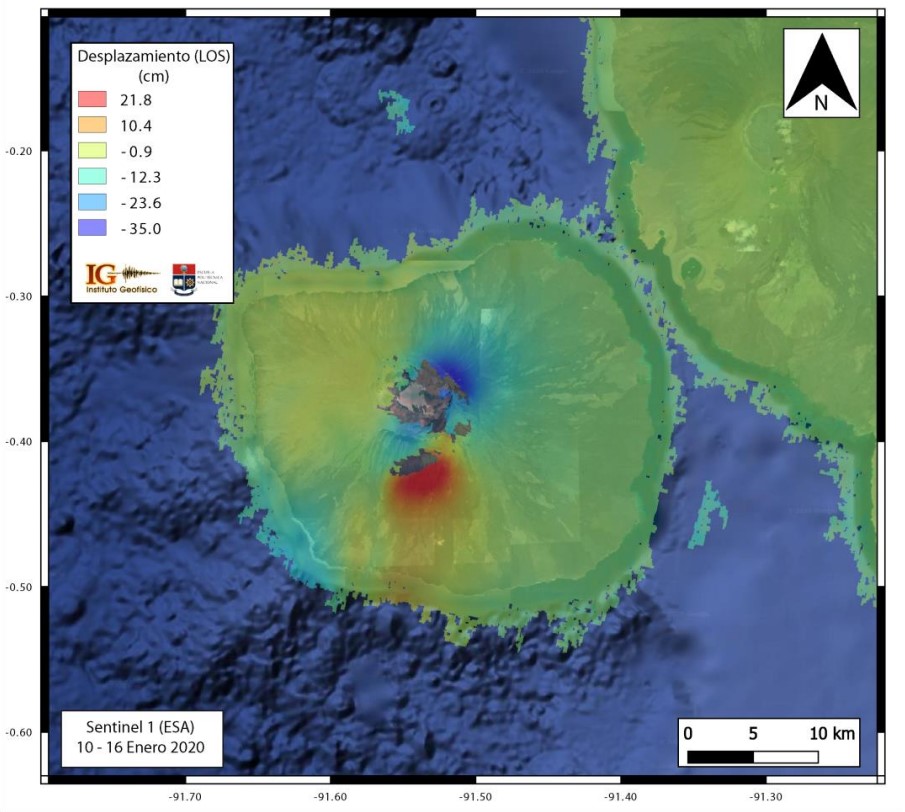 |
Figure 43. Soil displacement map for Fernandina during 10 and 16 January 2020, with the deformation generated by the 12 January eruption shown. Courtesy of IG-EPN (Report on 23 January 2020). |
Information Contacts: Instituto Geofísico, Escuela Politécnica Nacional (IG-EPN), Casilla 17-01-2759, Quito, Ecuador (URL: http://www.igepn.edu.ec/); Dirección del Parque Nacional Galápagos (DPNG), Isla Santa Cruz, Galápagos, Ecuador (URL: http://www.galapagos.gob.ec/).
2025: November
2024: February
| March
| April
| May
2021: November
2020: January
2018: June
2017: August
| September
2009: April
2005: May
The Instituto Geofísico-Escuela Politécnica Nacional (IG-EPN) reported seismic unrest at Fernandina. A M 4.3 earthquake was recorded at 2306 on 16 November. A seismic swarm began at 0800 the next morning and was composed of smaller magnitude events located beneath the N flank. There are no residents on the island.
Source: Instituto Geofísico-Escuela Politécnica Nacional (IG-EPN)
Instituto Geofísico-Escuela Politécnica Nacional (IG-EPN) reported that the eruption at Fernandina likely ended on 8 May. Daily thermal anomalies from the cooling lava flows on the SSE flank were identified in satellite images during 14-21 May. The number and intensity of the thermal anomalies were variable but decreased overall and were low by the end of the week. Sulfur dioxide emissions were 13 tons per day at 1356 on 15 May.
Source: Instituto Geofísico-Escuela Politécnica Nacional (IG-EPN)
Instituto Geofísico-Escuela Politécnica Nacional (IG-EPN) reported that the eruption at Fernandina decreased during 8-14 May. Sulfur dioxide emissions, measured using satellite data, ceased to be detected on 8 May, possibly indicating a decline in activity. Daily thermal anomalies from the lava flow were identified in satellite images.
Source: Instituto Geofísico-Escuela Politécnica Nacional (IG-EPN)
Instituto Geofísico-Escuela Politécnica Nacional (IG-EPN) reported that the eruption at Fernandina continued. The amount of lava flowing into the ocean significantly increased during 25-30 April and the lava flows spread along 800 m of the coastline. During 30 April-7 May daily thermal anomalies from the lava flow were identified in satellite images and gas-and-steam emissions rose from the area where lava entered the ocean. Sulfur dioxide emissions, measured using satellite data, fluctuated between about 205 and 803 tons per day during the first half of the week.
Source: Instituto Geofísico-Escuela Politécnica Nacional (IG-EPN)
Instituto Geofísico-Escuela Politécnica Nacional (IG-EPN) reported that the eruption at Fernandina continued during 24-30 April. Daily thermal anomalies along the lava flow were identified in satellite images and gas-and-steam emissions rose from the area where lava entered the ocean. Sulfur dioxide emissions, measured using satellite data, fluctuated between about 343 and 1,362 tons per day.
Source: Instituto Geofísico-Escuela Politécnica Nacional (IG-EPN)
Instituto Geofísico-Escuela Politécnica Nacional (IG-EPN) reported that the eruption at Fernandina continued during 16-23 April. Daily thermal anomalies were identified in satellite images. Sulfur dioxide emissions, measured using satellite data, fluctuated between about 207 and 1,418 tons per day. Gas-and-steam emissions rose from the area where lava entered the ocean; a 16 April photo showed three bright areas where lava entered the water and gas-and-steam plumes rising from the entries. During 21-22 April satellite images showed another lobe of lava low on the flank, descending towards the shoreline.
Source: Instituto Geofísico-Escuela Politécnica Nacional (IG-EPN)
Instituto Geofísico-Escuela Politécnica Nacional (IG-EPN) reported that the eruption at Fernandina continued during 10-16 April. Daily thermal anomalies were identified in satellite images, though during 12-14 April they were characterized as slight. Sulfur dioxide emissions based on satellite data fluctuating between about 120 and 658 tons per day. Gas-and-steam emissions rose from the area where lava entered the ocean based on satellite images; the emissions decreased on 13 April suggesting that only a very small amount of lava was entering the ocean. A new lobe of lava to the W of the main flow was identified in satellite images during 15-16 February.
Source: Instituto Geofísico-Escuela Politécnica Nacional (IG-EPN)
Instituto Geofísico-Escuela Politécnica Nacional (IG-EPN) reported that during 2 March-1 April an estimated 44 million cubic meters of lava had erupted at Fernandina, making the current eruption the largest in the last 15 years, surpassed only by the 2009 eruption. Fissure 13, located just below the crater rim on the upper SE flank, continued to be active during 2-9 April; the rate of lava effusion was about five cubic meters per second at least through 4 April, though the advancement rate of the distal end of the lava flow was variable. Sulfur dioxide emissions were generally at moderate levels, fluctuating between about 100 and 1,000 tons per day, though emissions were as high as around 1,650 tons per day on 4 April. Daily thermal anomalies over the lava flow continued to be detected and were variable in both number and intensity. The lava flows continued to advance down the flank and by 4 April were about 13.2 km long and about 1.3 km from the coastline. Based on observations from the Dirección del Parque Nacional Galápagos, the Ministerio del Ambiente, and Agua y Transición Ecológica the flows reached the ocean on 7 April. An 8 April satellite image showed plumes of gas and steam rising from the ocean entry.
Source: Instituto Geofísico-Escuela Politécnica Nacional (IG-EPN)
Instituto Geofísico-Escuela Politécnica Nacional (IG-EPN) reported that lava flows on Fernandina’s SSE flank continued to advance during 26 March-2 April. The flows were fed from a circumferential fissure that had opened high on the SE flank, just below the crater rim. Sulfur dioxide emissions detected by satellite fluctuated between about 200 and 1,300 tons per day and drifted W and SW on at least a few of the days. Daily thermal anomalies variable in both number and intensity over the lava flow continued to be detected. By 31 March the most distal part of the lava flow was about 1.5 km wide and about 2.4 km from the coastline.
Source: Instituto Geofísico-Escuela Politécnica Nacional (IG-EPN)
Instituto Geofísico-Escuela Politécnica Nacional (IG-EPN) reported that moderate eruptive activity continued at Fernandina during 20-26 March. Daily thermal anomalies were detected in satellite images. Sulfur dioxide (SO2) emissions identified in TROPOMI satellite data totaled 158 tons on 20 March, 720 tons on 24 March, and 790 tons during 25-26 March. Secretaría de Gestión de Riesgos (SGR) maintained the Alert Level at White (the lowest level on a four-color scale).
Sources: Instituto Geofísico-Escuela Politécnica Nacional (IG-EPN); Secretaría de Gestión de Riesgos (SGR)
IG-EPN reported that the eruption at Fernandina that began on 2 March occurred from about 20 circumferential fissures within an area 4.3 km long on the upper SE flank, between 1,000-1,200 m elevation. Multiple lava flows descended the SE flank; the longest lobe traveled SE then curved S, reaching about 750 m elevation, and having a total length of 8-9 km. Activity declined on 6 March and only Fissure 13 continued to effuse lava. The characterization of the activity level was changed from high to moderate on 13 March. The lava flows from Fissure 13 were active during 13-19 March based on thermal anomalies identified in satellite images, gas emissions, and photos shared by the Parque Nacional Galápagos. Sulfur dioxide emissions detected by satellite fluctuated between 576 and 1,133 tons per day.
Source: Instituto Geofísico-Escuela Politécnica Nacional (IG-EPN)
IG-EPN reported that the eruption at Fernandina continued during 6-12 March from a circumferential fissure located on the upper SE flank, though gradually decreased during the week. Hundreds of thermal anomalies over the lava flows were identified daily in satellite images during 5-8 March, and the longest lava flow advanced 100 m to a total length of 8 km. Gas emissions associated with the emplacement of lava flows drifted WSW. A fire W of the flow field was observed on 7 March. During 8-11 March dozens of thermal anomalies were identified daily in satellite images. Sulfur dioxide emissions measured from satellite were variable, with measurements between about 1,870 and 4,160 tons per day during 7-10 March.
Source: Instituto Geofísico-Escuela Politécnica Nacional (IG-EPN)
IG-EPN reported that an eruption at Fernandina began around 2350 on 2 March from a circumferential fissure on the upper SE flank. The fissure possibly propagated 3-5 km and produced a gas emission with low ash content that rose 2-3 km above the summit and drifted W, NNW, and SSE. The emission was detected in satellite data and the fissure was confirmed by pictures shared on social media and reports from Parque Nacional Galápagos. The emissions were intense until about 0400 on 3 March before decreasing. More than 1,000 thermal anomalies were identified in satellite images during 0044-0135 corresponding to multiple lava flows descending the SE flank. Sulfur dioxide emissions were about 46,460 tons per day (t/d) at 1327 on 3 March, based on satellite data. During 3-4 March gas plumes with low to no ash content continued to be identified in satellite images, drifting WSW. Hundreds of thermal anomalies were detected in satellite data with some of the intensities of the anomalies being characterized as high, very high, and extreme. Sulfur dioxide emissions had decreased to about 24,000 t/d at 1327 on 4 March, based on satellite data. Observations by park rangers during 4-5 March indicated that activity had decreased and the lava flows had only advanced slightly. Satellite data indicated that sulfur dioxide emissions continued to decline and were about 2,228 t/d at 1247 on 5 March. Gas plumes rose 370-970 m above the summit and drifted WSW. Hundreds of thermal anomalies continued to be detected during 5-6 March with a few being characterized as high to very high. The lava flows had traveled as far as 7.9 km based on satellite data and maps.
Sources: Instituto Geofísico-Escuela Politécnica Nacional (IG-EPN); Parque Nacional Galápagos
IG reported that slow deformation at Fernandina has been recorded over the previous 18 months. InSAR data showed that inflation was occurring at a rate of about 400 mm/year in the summit caldera and on the NE flank, while deflation was occurring at a rate of about 100-400 mm/year in areas on the upper W and SW flanks. On 13 October the areas of deflation changed to inflation and the rate of deformation in the caldera increased. On 17 November IG noted that fumarolic activity in the summit crater was visible during the previous few days and may have been related to a small episode of tremor on 16 November. IG also noted that periodic fumarolic activity and small episodes of tremor are common at Fernandina without an eruption.
Source: Instituto Geofísico-Escuela Politécnica Nacional (IG-EPN)
A reported from IG on 23 January noted that seismicity increased after the approximately nine-hour long 12 January eruption at Fernandina, characterized by sporadic earthquakes with magnitudes greater than 3 and small swarms. The strongest earthquake was a M 4.2 recorded on 21 January. Most of the earthquakes were shallow though occasionally some were located at depths greater than 10 km. Deformation of about 35 cm was detected around the fissures that produced the lava flows. The lava flows emitted on 12 January covered an approximate area of 3.8 square kilometers; no new thermal anomalies nor gas emissions have been recorded since the eruption.
Source: Instituto Geofísico-Escuela Politécnica Nacional (IG-EPN)
IG reported that a M 4.7 earthquake was recorded at 1642 on 12 January at Fernandina and followed by a swarm of 29 local earthquakes all below M 3.1. A new eruption began just before 1810 from a circumferential fissure located near the E edge of the caldera, at elevations around 1300-1400 m above sea level. Several lava flows descended the E flank; Galapagos National Park rangers witnessed the eruption from the Bolívar Channel station. A gas cloud rose 1.5-2 km above the fissure and drifted WNW. A second peak in seismicity was recorded 30-40 minutes after the eruption onset and then gradually decreased. Gas emissions decreased sometime after 2100 and thermal anomalies began to gradually diminish.
Source: Instituto Geofísico-Escuela Politécnica Nacional (IG-EPN)
On 21 June Parque Nacional Galápagos reported that lava flows at Fernandina were no longer reaching the ocean, though white plumes continued to rise from flows at the coastline.
Source: Parque Nacional Galápagos
IG reported that a seismic swarm at Fernandina began at 0837 on 16 June. Nine earthquakes stronger than M 2.5 were detected with the largest event, a M 4.1, located NE of the island at a depth of 4 km. An eruption that began between 1100 and 1115 was confirmed by guides on a passing boat passing, and by thermal anomalies identified in satellite images. The eruption occurred from a radial fissure on the NNE flank, producing gas plumes with low ash content that rose 2-3 km and drifted more than 250 km WNW. Lava flows reached the sea within a few hours. After two days of intense eruptive activity, tremor levels decreased significantly, thermal anomalies decreased (though continued to remain intense), and a significant drop in sulfur dioxide emissions was recorded.
Source: Instituto Geofísico-Escuela Politécnica Nacional (IG-EPN)
IG reported that activity at Fernandina began on 4 September with the detection of hybrid earthquakes followed by long-period events, and finally the onset of tremor at 1225 which heralded the beginning of the eruption. Lava emerged from a circumferential fissure near the SSW rim of the caldera and flowed down the S and SW flanks (with no evidence of the flows reaching the sea). A gas plume with low ash content rose 4 km above the crater rim and drifted W. Flows continued to be active on 5 September but by the evening the intensity had weakened. An eruptive plume rose about 2.5 km. Activity decreased significantly by 6 September.
Source: Instituto Geofísico-Escuela Politécnica Nacional (IG-EPN)
IG reported that increased seismicity at Fernandina was detected at around 0955 on 4 September. Based on accounts from Galapagos Park personnel and photos of the volcano, an eruption started at around 1225. The Washington VAAC reported that lava was detected in satellite images beginning at 1230; a steam-and-gas plume rose 2.4 km (8,000 ft) a.s.l. and drifted almost 60 km W. At around 1428 IG noted that an eruptive plume was identified in satellite images rising 4 km above the crater and drifting NW. The VAAC reported that on 5 September a plume likely composed of sulfur dioxide and water vapor, and possibly some ash, rose to 2.4 km (8,000 ft) a.s.l. and drifted SW. There are no residents on Fernandina.
Sources: Instituto Geofísico-Escuela Politécnica Nacional (IG-EPN); Washington Volcanic Ash Advisory Center (VAAC)
According to a news article, the eruption of Fernandina that began sometime between 2200 on 10 April and 0030 on 11 April continued after about 20 days. Variable activity included steam-and-gas emissions and lava flows.
Source: Antena 3
Based on analysis of satellite imagery and information from IG, the Washington VVAC reported that during 15-16 April gas-and-steam plumes from Fernandina drifted up to 555 km W and a thermal anomaly was detected on the W half of the island. According to news articles, the eruption caused the deaths of numerous fish and multiple sea lions that were found floating in the sea.
Sources: Agence France-Presse (AFP); Washington Volcanic Ash Advisory Center (VAAC)
Based on analysis of satellite imagery, IG reported that an eruption of Fernandina started sometime during 2200 on 10 April and 0030 on 11 April. Several thermal anomalies were seen on satellite imagery, possibly indicating active lava flows. A representative of the Galápagos National Park reported that tourists and park employees observed the eruption during the early hours of 11 April. According to news articles, Galápagos National Park personnel conducting an overflight indicated that the eruption occurred from a fissure on the SW flank, about 500 m from the summit crater. The fissure was 200 m long and 10 m wide, and ejected lava fountains 15 m high. A gas-and-ash plume drifted SW. The eruption took place near the site of the previous eruption in 2005.
Based on analysis of satellite imagery, the Washington VVAC reported that during 11-14 April gas and possible ash plumes drifted up to 370 km W, SW, S, and N. On 14 April, a large thermal anomaly and sulfur dioxide were detected. The observatory also reported smoke from burning vegetation.
Sources: Washington Volcanic Ash Advisory Center (VAAC); Instituto Geofísico-Escuela Politécnica Nacional (IG-EPN); Agence France-Presse (AFP)
According to the Washington VAAC, a weak hotspot was visible at Fernandina on 29 May at 2045 and a very short narrow plume of ash and gas was visible around 2215. There were no local reports confirming an eruption. By 30 May at 0615 the emission had dissipated and only the hotspot remained visible on satellite imagery.
Source: Washington Volcanic Ash Advisory Center (VAAC)
On 13 May the Charles Darwin Research Station (CDRS) received news that Fernandina, an island volcano in the Galapagos, had begun erupting that morning. Satellite photos showed a large cloud extending to the NW. On 14 May a joint Galápagos National Park and CDRS team flew over the eruption site. On approaching the island a large convection cloud could be seen rising above the main cloud layer above the volcano, but the caldera and rim could not be seen. On passing below the cloud, lava flows could be seen on the SW and S slopes. The first flow seems to have occurred more or less where the last eruption started in 1995, high on the SW slope, but from a circumferential fissure near the rim. The fissure itself could not be seen owing to the cloud on the rim, but map analysis suggests that the fissure was about 4.5 km long around the rim or just below it, with the first flows emanating from the W part of the fissure, and the latest flows from the E part. The flows descended the steepest part of the slopes quickly, and ponded on the gentler outer skirt of the island. The closest point that the lava had approached the sea on the 14th was 5.5 km from the coast. Lava passing through vegetated areas has caused small fires, but these have not spread far from the lava tongues themselves before going out. Most of the new flows have passed over unvegetated older lava.
A short time after the volcano started to erupt, the Sea-viewing Wide Field-of-view Sensor (SeaWiFS) flying on the OrbView-2 satellite captured an image showing a thick cloud of ash and steam fanning out W of the volcano, with a smaller, slightly darker plume blowing S. This darker plume may be more ash-rich than the larger plume, or it may be smoke from fires ignited by lava flows. Washington VAAC notices reported that the W-directed plume rose to about 5 km (17,000 feet) altitude on the afternoon of 13 May, and the S-directed plume went to 9 km (30,000 feet); both were visible later that day in satellite imagery more than 200 km from the volcano.
Thermal anomalies detected in MODIS satellite imagery, provided by the University of Hawaii, abundant on 14 and 15 May, were not evident on the 16th. Hot spots were again identified at the rim and down the S flank on 17 May.
Sources: NASA Earth Observatory; Washington Volcanic Ash Advisory Center (VAAC); Alan Tye, Charles Darwin Research Station; Hawai'i Institute of Geophysics and Planetology (HIGP) Thermal Alerts Team
Reports are organized chronologically and indexed below by Month/Year (Publication Volume:Number), and include a one-line summary. Click on the index link or scroll down to read the reports.
Eruption on 11 June 1968
Information Report 1/2 (13 June 1968) Seismicity detected
Seismic Report from Quito, Ecuador: "P wave 05h 56m 28s UT 11 June 1968. S wave missing. 600 miles west of Quito."
Infrasonic Report from Boulder, Colorado: "Acoustic wave reached Boulder at 0329 UT on 12 June. (Origin of wave at Galapagos approximately 2230 UT/1730 local time on 11 June). Stupendous explosion in the multi-megaton range, with gravity waves in atmosphere arriving about the same time as acoustic waves. Periods as long as 9 minutes amplitudes may be 20-40 dynes/cm2."
Information Report 3 (13 June 1968) Volcanic eruption, evacuations
Isabela Island volcanic eruption. Volcano eruptions have caused earth movements of some magnitude and subterranean rumblings. Blue and red streaks visible in the sky for ten miles. 2 small farms have been evacuated to beached and people will be evacuated from the island. No casualties but earth rumblings and quakes accompanied by occasional explosions are causing great alarm. Local earthquake at 1600 hrs. local time on 12 June.
Information Report 4 (13 June 1968) Seismic data for 11-12 June
The following seismic data was received from Quito Seismological Station at 1802Z on 13 June 1968 (table 1).
Table 1. Seismicity at Fernandina, 11-12 June 1968. Courtesy of Quito Seismological Station.
| Date | Phase | Time (UTC) | Event |
| 11 Jun 1968 | (i)P | 05 56 28.0 | 1 |
| 11 Jun 1968 | R | 05 59 38 | 1 |
| 11 Jun 1968 | e (P) | 16 21 45 | 2 |
| 11 Jun 1968 | e R | 16 25 11 | 2 |
| 12 Jun 1968 | e P | 00 26 05 | 3 |
| 12 Jun 1968 | e P | 08 06 04 | 4 |
| 12 Jun 1968 | e (P) | (garbled) | 5 |
| 12 Jun 1968 | iPD | 18 20 37.0 | 6 |
| 12 Jun 1968 | R | 18 24 00 | 6 |
| 12 Jun 1968 | iPD | 22 24 18.8 | 7 |
| 12 Jun 1968 | (S) | 22 26 46 | 7 |
| 12 Jun 1968 | R | 22 27 43 | 7 |
| 13 Jun 1968 | (P) | 04 51 20 | 8 |
| 13 Jun 1968 | (R) | 04 54 46 | 8 |
| 13 Jun 1968 | iPD | 07 36 53.6 | 9 |
| 13 Jun 1968 | (S) | 07 39 31 | 9 |
| 13 Jun 1968 | SSS | 07 39 46 | 9 |
| 13 Jun 1968 | R | 07 40 14 | 9 |
| 13 Jun 1968 | (P) | 12 51 13 | 10 |
Information Report 5 (14 June 1968) Eruption occurred
Volcano on Blue Mountain on Santa Isabela erupted at 122200Z. Eruption terminated early morning hours with dust cloud covering island between 40'-1°S. Lat. Island inhabitants report sighing small amount of red and blue light. Volcano name Sulphur.
Information Report 6 (14 June 1968) Seismic data for 13-14 June
The following seismic data was received from Quito Seismological Station at 1637Z on 14 June 1968 (table 2).
Table 2. Seismicity at Fernandina, 13-14 June 1968. Courtesy of Quito Seismological Station.
| Date | Phase | Time (UTC) | Note |
| 13 Jun 1968 | IP | 15 47 58.0 | DILATACION |
| 13 Jun 1968 | ES | 15 49 29 | -- |
| 13 Jun 1968 | SS | 15 50 41 | -- |
| 13 Jun 1968 | R | 15 51 28 | -- |
| 13 Jun 1968 | IP | 21 42 14.0 | DILATACION |
| 13 Jun 1968 | R | 21 45 48 | -- |
| 14 Jun 1968 | EP | 03 09 28 | -- |
| 14 Jun 1968 | P | 04 12 14 | DILATACION |
| 14 Jun 1968 | ESS | 04 14 54 | -- |
| 14 Jun 1968 | R | 04 14 58 | -- |
| 14 Jun 1968 | P | 10 43 10 | -- |
| 14 Jun 1968 | ESS | 10 45 44 | -- |
| 14 Jun 1968 | R | 10 46 24 | -- |
Information Report 7 (14 June 1968) Observation from neighboring island
The following report was received by radio at 2030 EST on 14 June 1968: "Heard eruption for first time, even though the island is 75 miles away. Quite a bit of lightning in the eruption clouds. A lot of lightning. No flames could be seen from Santa Cruz, but smoke seen pouring from area to the west and started again later on. Not sure which crater it came from on Isabela, but it came from the south end of Isabela. The night before last (12 June) there was quite a bit of activity. There may be a lava flow. There was a lava flow on the SE slopes of Fernandina a few weeks ago...about two or three weeks ago. The lava flow was seen on Fernandina from a ship at sea. This one may be Santo Tomas, or it may very well be Blue Mountain."
Information Report 8 (15 June 1968) Lava flows seen; ash reported
The following report was received at 2200 UT on 15 June 1968: "Eruption cloud was first observed at 2230 GMT on 11 June. One large shock was felt at approximately 2300 GMT same date, intensity 3 to 4. Compass bearing or eruption cloud due west from Academy Bay. three or four additional shocks and audible explosions followed at ten to fifteen minute intervals. There were less severe than first shock. Report from Villa Mil on southeastern Isabela Island states cinder and ash has fallen on town but do not yet know origin. There are still movements on the island. Ship being sent from Guayaquil to pick up people from island. A lava flow was observed coming down the southeast slopes of Fernandina at Punta Mangle at 2100 GMT on 15 May by the Chilean ship Navarino. Darwin Station party of four people including Station Director Parry departs tomorrow night (16 June) to island to investigate damage to flora and fauna."
Information Report 9 (17 June 1968) Observance of seismological disturbance
The following report was received by cable at 1625 UT on 17 June 1968: "Las Penas Geoacustical Station showed a disturbance beginning June 12 at 0153 and disappearing at 0445 with an average period of half minute."
Information Report 10 (18 June 1968) Continuing seismicity
The following cable was received at 1905 UT on 18 June 1968: "Latest information from stations representative on Isabela that eruption occurred Isla Fernandina seismic activity continuing station party is under way to investigate."
Information Report 11 (18 June 1968) Increased frequency of seismic events
The following information was received on 18 June 1968 from the Lamont Geological Observatory: "Over the last five days we have received some 25 identical signals originating between 40° and 50° from the SW that probably are directly related to the eruption. Most of these events are roughly the same size, except for one event on 15 June, which was notably larger than the rest. The frequency of events has increased from two per day on 12 June to 6 or 7 per day now."
Information Report 12/12a (19 June 1968) Seismic data for 14-18 June
The following seismic data was received from the Observatorio Astronomico de Quito (table 3).
Table 3. Seismicity at Fernandina, 14-18 June 1968. Courtesy of Observatorio Astronomico de Quito.
| Date | Phase | Time (UTC) | Event |
| 14 Jun 1968 | iPD | 16 26 48.2 | 1 |
| 14 Jun 1968 | SS | 16 29 37 | 1 |
| 14 Jun 1968 | R | 16 30 09 | 1 |
| 14 Jun 1968 | ePD | 22 30 48 | 2 |
| 14 Jun 1968 | R | 22 34 09 | 2 |
| 15 Jun 1968 | ePD | 02 57 48 | 3 |
| 15 Jun 1968 | iPD | 04 23 05.3 | 4 |
| 15 Jun 1968 | SS | 04 25 54 | 4 |
| 15 Jun 1968 | R | 04 26 26 | 4 |
| 15 Jun 1968 | P | 08 53 57 | 5 |
| 15 Jun 1968 | R | 08 57 27 | 5 |
| 15 Jun 1968 | e(P) | 12 06 16 | 6 |
| 15 Jun 1968 | P | 13 17 43 | 7 |
| 15 Jun 1968 | eP | 16 38 49 | 8 |
| 15 Jun 1968 | R | 16 43 11 | 8 |
| 15 Jun 1968 | iPD | 17 43 22.0 | 9 |
| 15 Jun 1968 | SS | 17 46 00 | 9 |
| 15 Jun 1968 | R | 17 46 41 | 9 |
| 15 Jun 1968 | (P) | 20 24 14 | 10 |
| 15 Jun 1968 | ePD | 21 28 00 | 11 |
| 15 Jun 1968 | R | 21 31 26 | 11 |
| 16 Jun 1968 | eP | 00 34 08 | 12 |
| 16 Jun 1968 | eP | 02 52 11 | 13 |
| 16 Jun 1968 | R | 02 55 35 | 13 |
| 16 Jun 1968 | iPD | 03 50 10.0 | 14 |
| 16 Jun 1968 | R | 03 53 51 | 14 |
| 16 Jun 1968 | eP | 07 16 19 | 15 |
| 16 Jun 1968 | R | 07 19 41 | 15 |
| 16 Jun 1968 | iP | 10 15 18.5 | 16 |
| 16 Jun 1968 | R | 10 18 38 | 16 |
| 16 Jun 1968 | (P) | 12 21 10 | 17 |
| 16 Jun 1968 | ePC | 13 03 21 | 18 |
| 16 Jun 1968 | R | 13 06 54 | 18 |
| 16 Jun 1968 | eP | 15 20 00 | 19 |
| 16 Jun 1968 | R | 15 23 18 | 19 |
| 16 Jun 1968 | ePD | 16 23 18 | 20 |
| 16 Jun 1968 | R | 16 26 39 | 20 |
| 16 Jun 1968 | ePD | 18 48 39 | 21 |
| 16 Jun 1968 | R | 18 51 42 | 21 |
| 16 Jun 1968 | iPC | 20 54 56.6 | 22 |
| 16 Jun 1968 | R | 20 57 10 | 22 |
| 16 Jun 1968 | (P) | 22 47 41 | 23 |
| 16 Jun 1968 | eP | 23 13 43 | 24 |
| 16 Jun 1968 | R | 23 17 06 | 24 |
| 17 Jun 1968 | ePD | 01 10 52 | 25 |
| 17 Jun 1968 | R | 01 14 11 | 25 |
| 17 Jun 1968 | ePC | 02 18 02 | 26 |
| 17 Jun 1968 | R | 02 21 16 | 26 |
| 17 Jun 1968 | eP | 04 31 26 | 27 |
| 17 Jun 1968 | R | 04 34 44 | 27 |
| 17 Jun 1968 | eP | 06 09 48 | 28 |
| 17 Jun 1968 | R | 06 12 39 | 28 |
| 17 Jun 1968 | eP | 06 48 41 | 29 |
| 17 Jun 1968 | R | 06 52 04 | 29 |
| 17 Jun 1968 | eP | 08 01 35 | 30 |
| 17 Jun 1968 | (P) | 08 12 09 | 31 |
| 17 Jun 1968 | eP | 08 54 16 | 32 |
| 17 Jun 1968 | R | 08 57 40 | 32 |
| 17 Jun 1968 | eP | 10 37 23 | 33 |
| 17 Jun 1968 | R | 10 40 40 | 33 |
| 17 Jun 1968 | eP | 12 05 10 | 34 |
| 17 Jun 1968 | eP | 12 55 57 | 35 |
| 17 Jun 1968 | iPC | 14 57 52.0 | 36 |
| 17 Jun 1968 | R | 14 01 13 | 36 |
| 17 Jun 1968 | (Ip)C | 16 38 36.2 | 37 |
| 17 Jun 1968 | R | 16 41 50 | 37 |
| 17 Jun 1968 | (P) | 16 59 23 | 38 |
| 17 Jun 1968 | eP | 17 20 12 | 39 |
| 17 Jun 1968 | eP | 17 40 06.0 | 40 |
| 17 Jun 1968 | R | 17 43 25 | 40 |
| 17 Jun 1968 | eP | 18 24 16.2 | 41 |
| 17 Jun 1968 | R | 18 27 39 | 41 |
| 17 Jun 1968 | eP | 21 11 08 | 42 |
| 17 Jun 1968 | iP | 22 08 41.9 | 43 |
| 17 Jun 1968 | R | 22 12 06 | 43 |
| 17 Jun 1968 | eP | 23 10 45 | 44 |
| 17 Jun 1968 | eP | 23 35 54 | 45 |
| 18 Jun 1968 | iPD | 00 11 50.0 | 46 |
| 18 Jun 1968 | eP | 01 13 48 | 47 |
| 18 Jun 1968 | iP | 01 39 54.3 | 48 |
| 18 Jun 1968 | R | 01 43 21 | 48 |
| 18 Jun 1968 | eP | 01 58 10 | 49 |
| 18 Jun 1968 | iP | 02 25 51.5 | 50 |
| 18 Jun 1968 | R | 02 28 09 | 50 |
| 18 Jun 1968 | e(P) | 03 34 41 | 51 |
| 18 Jun 1968 | iP | 03 56 11.8 | 52 |
| 18 Jun 1968 | R | 03 59 16 | 52 |
| 18 Jun 1968 | (P) | 05 07 49 | 53 |
| 18 Jun 1968 | iP | 05 30 26.8 | 54 |
| 18 Jun 1968 | eP | 06 29 26 | 55 |
| 18 Jun 1968 | (P) | 06 50 26 | 56 |
| 18 Jun 1968 | eP | 07 02 56 | 57 |
| 18 Jun 1968 | iPC | 07 16 10.0 | 58 |
| 18 Jun 1968 | R | 07 19 13 | 58 |
| 18 Jun 1968 | (P) | 08 34 22 | 59 |
| 18 Jun 1968 | iPC | 08 59 20.8 | 60 |
| 18 Jun 1968 | eP | 10 02 42 | 61 |
| 18 Jun 1968 | iP | 10 33 24.2 | 62 |
| 18 Jun 1968 | (P) | 11 56 34 | 63 |
| 18 Jun 1968 | iP | 12 30 44.0 | 64 |
Information Report 13 (19 June 1968) Acoustic signal on 19 June
The following report was received by telephone from Huancayo, Peru on at 0630 UTC on 19 June 1968: "Huancayo Peru Geoacoustic Station observed a signal of 10 microbars peak to peak of one hour duration beginning at 0108 GMT on 12 June. Signal strength 10 dynes/cm2."
Information Report 14 (19 June 1968) Almost continuous seismicity during 16-18 June
The following report was received by radio from Santa Cruz Seismic Station Galapagos Islands at 1500 UTC on 19 June 1968: “Almost continuous seismic activity from eruption. There were more than 350 individual events recorded between 0023 GMT 16 June and 2354 GMT on 18 June.”
Information Report 15 (20 June 1968) Seismic data for 16-19 June
The following seismic data was received by radio from Santa Cruz Seismic Station Galapagos Islands on 20 June 1968 (table 4).
Table 4. Seismicity at Fernandina, 16-18 June 1968. Courtesy of Santa Cruz Seismic Station Galapagos Islands.
| Date | Phase | Time (UTC) | Event |
| 16 Jun 1968 | iP | 03 45 56.6 | 1 |
| 16 Jun 1968 | iP | 07 13 32.8 | 2 |
| 16 Jun 1968 | iP | 10 12 30.3 | 3 |
| 16 Jun 1968 | iP | 13 00 14.2 | 4 |
| 16 Jun 1968 | iP | 15 17 11.5 | 5 |
| 16 Jun 1968 | iP | 16 20 31.7 * time correction at 16h30 +380 ms | 6 |
| 16 Jun 1968 | iP | 18 45 21.3 | 7 |
| 16 Jun 1968 | iP | 20 51 50.5 | 8 |
| 16 Jun 1968 | iP | 23 01 36.9 | 9 |
| 17 Jun 1968 | iP | 01 08 02.2 | 1 |
| 17 Jun 1968 | iP | 02 15 07.1 | 2 |
| 17 Jun 1968 | iP | 04 28 38.2 | 3 |
| 17 Jun 1968 | iP | 06 06 56.7 | 4 |
| 17 Jun 1968 | iP | 06 45 41.5 | 5 |
| 17 Jun 1968 | iP | 08 09 19.3 | 6 |
| 17 Jun 1968 | iP | 08 51 47.5 | 7 |
| 17 Jun 1968 | iP | 10 34 30.5 | 8 |
| 17 Jun 1968 | iP | 12 02 23.3 | 9 |
| 17 Jun 1968 | iP | 12 30 46.3 | 10 |
| 17 Jun 1968 | iP | 13 49 58.2 | 11 |
| 17 Jun 1968 | iP | 14 15 43.6 | 12 |
| 17 Jun 1968 | iP | 14 54 57.5 * time correction at 1500 UT +430 ms | 13 |
| 17 Jun 1968 | iP | 16 35 46.8 | 14 |
| 17 Jun 1968 | iP | 17 17 25.6 | 15 |
| 17 Jun 1968 | iP | 17 46 58.2 | 16 |
| 17 Jun 1968 | iP | 18 59 56.3 | 17 |
| 17 Jun 1968 | iP | 19 23 55.5 | 18 |
| 17 Jun 1968 | iP | 19 51 29.6 | 19 |
| 17 Jun 1968 | iP | 21 08 21.2 | 20 |
| 17 Jun 1968 | iP | 22 05 58.0 | 21 |
| 17 Jun 1968 | iP | 23 07 25.4 | 22 |
| 18 Jun 1968 | iP | 00 09 02.0 | 1 |
| 18 Jun 1968 | iP | 01 10 36.5 | 2 |
| 18 Jun 1968 | iP | 01 27 09.5 | 3 |
| 18 Jun 1968 | iP | 02 22 53.2 | 4 |
| 18 Jun 1968 | iP | 03 53 17.6 | 5 |
| 18 Jun 1968 | iP | 05 04 53.5 | 6 |
| 18 Jun 1968 | iP | 05 27 21.6 | 7 |
| 18 Jun 1968 | iP | 06 26 20.0 | 8 |
| 18 Jun 1968 | iP | 07 13 15.8 | 9 |
| 18 Jun 1968 | iP | 08 56 26.0 | 10 |
| 18 Jun 1968 | iP | 09 36 21.9 | 11 |
| 18 Jun 1968 | iP | 09 59 23.3 | 12 |
| 18 Jun 1968 | iP | 10 29 03.4 | 13 |
| 18 Jun 1968 | iP | 12 08 19.2 | 14 |
| 18 Jun 1968 | iP | 12 27 53.4 | 15 |
| 18 Jun 1968 | iP | 14 06 37.2 * time correction at 1405 +250 ms | 16 |
| 18 Jun 1968 | iP | 16 17 32.6 | 17 |
| 18 Jun 1968 | iP | 17 18 09.8 | 18 |
| 18 Jun 1968 | iP | 17 36 29.1 | 19 |
| 18 Jun 1968 | iP | 18 03 02.0 | 20 |
| 18 Jun 1968 | iP | 19 59 47.0 | 21 |
| 18 Jun 1968 | iP | 20 11 17.4 | 22 |
| 18 Jun 1968 | iP | 21 18 06.0 | 23 |
| 18 Jun 1968 | iP | 21 48 07.7 | 24 |
| 18 Jun 1968 | iP | 23 07 22.8 | 25 |
| 18 Jun 1968 | iP | 23 37 46.3 | 26 |
| 19 Jun 1968 | iP | 01 10 41.6 | 1 |
| 19 Jun 1968 | iP | 01 47 14.7 | 2 |
| 19 Jun 1968 | iP | 02 17 29.4 | 3 |
| 19 Jun 1968 | iP | 02 27 30.5 | 4 |
| 19 Jun 1968 | iP | 03 12 18.4 | 5 |
| 19 Jun 1968 | iP | 04 05 57.6 * time correction at 0415 +130 ms | 6 |
Information Report 16
This report was omitted from later compilations.
Information Report 17 (21 June 1968) Decreased seismicity on 21 June
The following report was received at 2115 on 21 June 1968 from Santa Cruz Seismic Station: “Noticeable decrease in seismic activity in the past five to six hours (after 1740 GMT on 21 June. Details on shocks follow: Distance to epicenter (S-P= 10 to 11 seconds or approximately 90 to 100 kilometers.), azimuth of epicenter approximately 74° West (Bearing 286°), P – rarefactional.“
Information Report 18 (23 June 1968) Collapsing caldera
The following report was received from Santa Cruz Seismic Station at 2115 GMT on 23 June 1968. Darwin Staion members visited the rim of the crater of Fernandina on 19 June and report the following observations: "The caldera is collapsing. There is continuing activity and it is causing the rim of the crater to break down. All around the crater the rim is collapsing, especially the south southeast rim. Very strong shocks have been felt. We had great difficulty in standing up because of heavy dust created by the thousands of tons of rock that was breaking off the rim and falling onto the floor. there are platforms that have also broken down and are continuing to break down. The platform on the SSE side of the crater has broken down. No lava flow was seen (a visit was not made to the SE of the crater where a lava flow was seen by the Chilean ship Navarino last month). There was no sign of fresh lavas and no excessive heat was noted. There was no light or glow at night. Strong tremors continue. We stayed on the slopes of the volcano overnight and could no stand upright because of the strong shocks. The whole island is covered to a varying extent with volcanic ash. Except for the inside of the crater, there had been no large damage to the island eco-system."
Information Contacts: Dr. Mena, Seismological Station, Quito, Ecuador; Dr. V.H. Goerke, ESSA Station, Boulder, Colorado; David Haskell, U.P.I.; Quito Seismological Station, Quito, Ecuador; Commander, 1st Naval Zone of Ecuador, Galapagos Islands; Forrest Nelson, HC8FN Radio, Santa Cruz Island, Galapagos Islands; Rulf Sievers, Santa Cruz Seismic Station, Galapagos Islands; Las Penas Geoacustical Station; Lamont Geological Observatory; Observatorio Astronomico de Quito; Huancayo Peru Geoacoustic Station.
Decreasing activity; collapsed caldera
Information Report 19 (01 July 1968) Ash plumes observed on 11 and 12 June
The following report was received from a sailor and fisherman, who was anchored at Urvina Bay on 11 June 1968 and at Elizabeth Bay on 12 June 1968 and observed the initial stages of the activities:
11 June (from Urvina Bay): "First saw a rising, drifting column of smoke coming out of Fernandina Crater. Then there was a big blast with a big smoke cloud. The underside of the smoke cloud was pink as if it were reflecting lavas in the crater. There was dust on top of the water after the explosion."
12 June (from Elizabeth Bay): "On the North side of Cerro Azul all over to the North slopes on Isabela, all the way over to Santo Tomas saw smoke coming from 30 different vents. Smoke was coming from a hill Northeast of Santo Tomas near Tortuga Bay on the East side of Isabela."
Indications are that the original report of activity on Isabela may be valid and that there was activity on both Fernandina and Isabela.
Information Report 20 (06 July 1968) Flight observations of caldera
The following report was received from Dr. Tom Simkin, from Academy bay, Santa Cruz, Galapagos Islands, at 2315 EDT on 6 July 1968, after a flight over the Fernandina volcano in a U.S. Air Force DC-6 flying out of the Panama Canal Zone. Dr. Simkin was accompanied by a team of six other scientists and observers and two U.S. Air Force photographers:
"Circled the caldera for about 20 minutes. All of the lower slopes were obscured by clouds but we had a good overall view of the caldera. There was no volcanic activity at the time. There is a new cone on the northwest sector of the floor of the caldera and some smoke was observed. Most active slumping took place on the northwest side of the floor which was covered with fresh debris. There is still considerable dust in the caldera. There appears to be substantial subsidence of the total crater floor. The small central cone and the lake are still there. Of the two observers in the plane who had previously been in the caldera, one felt that there had been a very substantial change, the other felt that there had not been a significant change. Minor seismic activity continues. There had not been a day without some seismic since the start of the major eruption. We are now getting two or three seismic events each day. The cloud cover was quite extensive on Isabela. We obtained good photographs of Cerro Azul caldera and noted no active volcanism. We do not yet have positive confirmation that volcanism occurred simultaneously on Fernandina and Isabela."
The expedition will spend the next three to five weeks on Fernandina Island mapping the changes resulting from the eruption activity and recording effects on the island ecosystem.
Information Report 21 (08 July 1968) Event chronology
The following report of event chronology was received from the Charles Darwin Research Station at Santa Cruz on 8 July 1968:
1. Description and Sequence of Events
11 June: 0556 hours GMT, the Seccion Sismologica of the Observatorio Astronomico in Quito records shocks originating 600 miles to W of Quito. 1100 hours local time, a strange cloud in the direction of Fernandina was noticed from Isabela and Santa Cruz. 1700 hours local time, a tremendous explosion occurs in the W of the Galapagos Islands. The shock was felt at Puero Ayora on Santa Cruz, at Villamil on Isabela, and on Floreana; and heard at San Cristobal. A mushroom-shaped cloud rose high in the sky to W of Santa Cruz. 1745 hours local time, a number of further explosions occurred, and the cloud, a spectacular sight in an otherwise cloudless sky, extended to Santa Cruz. The diameter of the cloud from Santa Cruz was recorded as: apex 140°, base 11°. Flashes, as electrical discharges, occurred over the area throughout the night. A fall-out of gray volcanic ash reached Puerto Villamil on Isabela, 90 kms. To SE.
15 June: The center of the eruption was verified as occurring on Fernandina.
18 June: The eruption was localized as in the summit area of the central caldera of Fernandina. A pall of brownish-colored mist, visible from the sea, lay over the higher area of the island.
19 June: During an ascent to the rim of the caldera continuous tremors were felt. The frequency and violence of these tremors was such that, at a point on the main outer slope of the volcano (685 m. alt) between the six hours 1730 to 2330 hours local time, 56 were counted, each lasting from 2 to 6 seconds, and of these 14 were sufficient to cause rock falls from cones on nearby slopes. Trees were seen to be shuddering as though a strong wind were blowing through their branches. The tremors grew and subsided, rather than being felt as abrupt shocks, giving jellylike material. It was found that these movements had caused, and were continuing to cause, the collapse of areas of the inner wall os the caldera: tremendous falls of rocks occurring at frequent intervals and tin the direction of the prevailing winds. The sound of the falling rocks was likened to the roar of heavy seas breaking on a rocky beach. A strong wind arose after each fall. Large areas of the edge of the caldera had fallen into the crater. The existing borders of the caldera were found, in the part visited on the E, to be heavily fissured. In places, cliffs and trees had been dislodged by the tremors. Because of the clouds of dust, it was not possible to see the floor of the crater. It is, however, thought probable that the lake (in February of this year covering some 120-140 hectares of the floor of the caldera) has disappeared, possible by evaporation shortly after the first explosions on 11 June or through cracks caused by tremors. The most active was judged to be the SE area of the caldera where it was known an active centre of the crater wall, about midway between the floor and the summit, is believed to have been the site of greatest activity and may itself have largely disintegrated as a result of the explosions and subsequent tremors.
2. Seismological Station, Santa Cruz
Seismological instruments at the CDRS, 120 kms. From the centre of activity, were thrown out of alignment during the initial period of seismic events. The Seismological Station was in operating conditions again at 0300 hours GMT on 16 June. From this date onwards, until 22 June, records show continuing seismic activity with an average of approximately 200 shocks every 24 hours, with the maximum amount of events being observed on 19 June. Between 1400-1500 hours GMT on 22 June a decreasing tendency of activity was noticed, shocks becoming less and less frequent. The latest seismograms, during the 24 hour period of 27-28 June, registered only 3 shocks of minor amplitudes.3. No Evidence of Fresh Lava
No evidence was found, 19-20 June, to indicate that lava was flowing. No flows were noticed from the sea; no light was visible over the mountain at night; nor was any excessive heat felt from the rim of the caldera. Seawater temperature records taken were considered as normal for the period of the year:
Punta Espinosa, Fernandina: 18 June – 18.2°C (64.8°F)
North coast of Fernandina: 19 June – 19.3°C (66.8°F)
Punta Vincente Roca, Northern Isabela: 21 June – 20.3°C (68.5°F)
Sulfur fumes, however, were noticed on the ascent, and may have originated from an active solfatara area reported in February of this year as increasing on the western inner slope of the caldera.
4. Biological Effects of the Eruption
It is yet early to give any substantial indication of the effects the eruption will have on biological communities of the island. Vegetation, probably over the entire island, is covered to a varying extent with volcanic ash: this would not of course be regarded as harmful or toxic to the plants themselves.
Dramatic disturbances, however, must have occurred to communities within the crater. The loake, forming a complex of islands and inlets due to the unevenness of the caldera floor, was bordered with reeds (Cyperus ligularis and C. anderssonii) and supported almost certainly the largest population of the endemic Galapagos duck (Anas bahamensis galapagoenisi) in the archipelago. A count of these ducks on 19 February, 1968 indicated their numbering in the order of 2,000 birds 91,929 adults were counted). Large numbers of young must have been in the crater at the time of the eruption.
In addition, other aquatic birds, including the Black-necked Stilt (Himantopus mexicanus), were found in the crater.
Extensive wooded areas previously occurred within the crater, near the floor and on the less steep slopes of the inner walls.
Species of plants inside the crater and endemic to the Galapagos Islands include: Cyperus anderssonii, Alternanthera filifolia, Phoradendron uncinatum, Mollugo snodgrassii, Croton scouleri, Waltheria reticulate, Cordia galapagensis, Tournefortia rufo-sericea, Lippia rosmarinifolia, Borreria ericaefolia, Darwiniothamnus lancifolius and Scalesia microcephala.
Information Report 23 (09 July 1968) Changes to the caldera
The following excerpts are taken from an abstract for a paper to be presented at the GSA Conference by Dr. Tom Simkin, Smithsonian Institution, and Dr. Keith Howard, U.S. Geological Survey. The abstract was radioed to the Center from the Galapagos Islands on 8 July 1968:
"On July 4 few changed were noted from the air on the former rim and walls but the southern part of the caldera floor had been lowered by approximately 300 meters. An old central cone on the now tilted floor remained intact and a large lake was still present. Despite the collapse of several cubic kilometers of material, the only indication of associated igneous activity in the caldera was a small new cone on the slumped northwest floor."
Information Report 24 (11 July 1968)
Report missing.
Information Report 25 (25 July 1968)
Report missing.
Information Contacts: Charles Darwin Research Station, Santa Cruz, Galapagos Islands; Dr. Tom Simkin, Smithsonian Institution.
News report of fieldwork following 11 June eruption
Card 0248-0249 (22 November 1968) News report of fieldwork following 11 June eruption
The following is from a New York Times report on 19 November 1968.
"The weird world of the Galapagos Islands, the living laboratory of giant turtles, iguanas and dandelion trees that inspired Charles Darwin's theory of evolution, is reported to have survived a severe volcano eruption last summer with appreciable damage.
"The news came as a relief to naturalists who had feared for the loss of numerous species of plants and animals that are either extinct or unknown elsewhere in the world--and, for the most part, unaffected by the ravages of man.
"Dr. Paul A. Colinvaux, an ecologist at Ohio State University, who just returned from the islands, said in a telephone interview yesterday that the 'damage to the wonderfully unique vegetation was incredibly slight.'
"Dr. Colinvaux was there with a team of scientists sent by the Smithsonian Institution in Washington. He visited the uninhabited Fernandina Island after reports were received of a volcanic eruption there on June 11.
"The Galapagos Islands, which are of volcanic origin, are situated in the Pacific Ocean along the Equator some 580 miles west of Ecuador. Darwin stayed on the islands in 1835 when as a young man, he sailed around the world on H.M.S. Beagle. His findings there led to his famous theories published in 'On the Origin of Species.'
"The eruption on Fernandina last June, believed to have been as powerful as a hydrogen bomb explosion, sent shock waves into the atmosphere that were recorded around the world. Volcanic ash fell on the next island in the chain, Isabella, which is 10 miles away.
"According to Dr. Colinvaux and his party, the volcano spewed no lava. But, when they arrived, steam and smoke were still drifting from a mile-wide hole in the crater. Part of the crater's rim had collapsed.
"Scientists at the United States Geological Survey in Washington said they had observed a number of volcanic eruptions around the world in the last few years from which no lava flowed.
"In a sense these are eruptions in reverse, the scientists said. They apparently occur when the crater floor collapses from the loss of pressure from subterranean lava instead of erupting from increased lava pressure.
"This lack of lava flow may have saved the island life, Dr. Colinvaux said. Still undisturbed by the explosion, he reported, were a forest of scalesia trees, members of the dandelion family that grow 30 feet tall, and otter-sized land iguanas.
"Scientists consider the Galapagos Islands a museum of life as it may have existed in the age of reptiles before mammals emerged to dominate the earth. The islands are known for their hawks and finches, giant cactus plants and four-eyed fish.
"Dr. Colinvaux believes that Fernandina harbors 'the only true virgin relic of the old Galapagos fauna, and perhaps the last truly virgin tropical community left on earth.'"
Information Contacts: John Noble Wilford, The New York Times.
Observations and assessment of effects from June eruption
Card 0311-0314 (24 December 1968) Observations and assessment of effects from June eruption
The following report was made by a team from the Charles Darwin Research Station which visited the interior of the caldera of Fernandina, 16-18 November, to assess effects of the June eruption.
Environmental changes. Although after-tremors appear to have ceased, persistent rock-falls still occur within the caldera. The east face is particularly unstable in this respect. The crater at present is a dust-filled arena devoid of vegetation; when winds build up during the day, visibility is often down to little more than 100 m.
The greatest change in the crater rim is in the W and NW where an entire section, stretching for some 1,000 m in both circumferential and radial directions, has disappeared. The crater itself, in consequence, appears to be now more nearly circular in oultine. At the base of this newly-breached part of the crater wall is the new cone reported by Simkin in July. Solfataras are concentrated in this area, arising through dark-colored patches where discharged steam has condensed on the surface, and both sulfurous emanations and the yellow deposits of native sulfur were noticed. Prior to the eruption a single ridge-like sulfur-bearing solfatara occurred in this area, near the margin of the crater floor.
An extensive new fumarole area lies in the S, about halfway up the rim from the surface of the lake.
From its position in the NW prior to the eruption the lake has shifted about 2,000 m to occupy the SE part of the crater floor. The temperature of the water was 24°C. The altitude of the lake was recorded as 450 m, and the present lake-edge as 950 m below the N rim.
In the NW, below the still extensive bench rimming the crater wall, is a plateau, heavily fissured and stretching transversely across the crater. The surface of this plateau is composed largely of a hardened sediment-like material upon which are drifts of powdery ash. Its SE face is channelled, as from the flowing of water to where the lake now lies; the fissures previously mentioned run counter to the direction of this slope falling to the lake. The most extensive part of this plateau is at an altitude of some 700 m and probably represents the previous lake floor level overlain with boulders and other fallen material.
The central cone besides having fallen some 250 m in altitude appears to be further tilted towards the SE. Its height however (approximately 115 m above the surface of the lake) has not altered significantly. It is covered to a varying extent with a mantle of gray-black ash.
The presence of a superficial layer of this gray-black ash elsewhere, particularly in gullies in the sedimented areas, suggests that emissive activity continued after the initial explosions and blow-out in the W, the subsequent collapse and movement of the lake.
Biological effects. Significant biological effects of the eruption are confined to the caldera. The entire vegetation cover of inner slopes has been swept away by landslides caused by the breaking away of the rim of the crater. Reed-fringed pools with Galapagos pintail no longer exist.
A few land iguanas (Conolophus subcristatus), lava lizards (Tropidurus albemarlensis) and geckos (Phyllodactylus sp.) either survived or have recently reinvaded the crater. In the lower parts there were found several dead land iguanas and one, still alive five months after the eruption, dying through the absence of food.
Five Galapagos pintail (Anas bahamensis galapagoensis) were seen over the lake and were in all likelihood recent arrivals. The fate of the large population of ducks, many presumably with non-flyign young in June, is unknown: there was no evidence of an influx into other areas of the archipelago following the eruption. The dove (Nesopelia galapagoensis) was found to have returned and to be fairly common near the lake-edge. Apart from the Galapagos hawk (Buteo galapagoensis) no other birds were seen in the crater.
On the northern rim, most of the shrub vegetation (Scalesia microcephala, Lippia rosmarinfolia, and occassional Cordia galapagoensis and Darwiniothamnus lancifolius) within 100 m of the edge has died. Pplants in this area are thickly encrusted, in some cases completely, with dust. The thin covering of soil near the rim is of a loose texture and the death of these plants may of course be due in part to the combined effects of dryness and movements caused by tremors (accentuated near the rim) disturbing their shallow rooting system.
Information Contacts: Roger Perry, Director, Charles Darwin Research Station, Galapagos Islands, Ecuador.
Three recent earthquakes; white puffs from cinder cones
Card 1194 (04 May 1971) Three recent earthquakes; white puffs from cinder cones
The National Ocean Survey (of NOAA, formerly Coast and Geodetic Survey) has located three recent earthquakes within 10 km of Isla Fernandina, the site of a massive caldera collapse in 1968. The first, at 1544 GMT April 9 and 4.5 mb was apparently felt by the sole resident of Isla Santiago, 75 km E of Fernandina. Two large events, 1719 GMT April 17 (5.4 mb) and 1741 GMT April 18 (5.7 mb) were felt by Edward McIntosh of the Golden Cachelot who was on the NE coast of Fernandina at the time of the April 18 quake. McIntosh reports that 6-8 puffs of white smoke, as distinct from reddish dust clouds caused by the earthquake, issued briefly from a group of cinder cones on the lower NE flank of the volcano. A seismograph 140 km from the caldera has registered many tremors beginning April 5 or April 6, and Rolf Sievers notes that the seismograms look very similar to those obtained during the 1968 collapse.
Dr. John Filson (MIT) reports that the large area seismic array (LASA) in Montana has located 21 events in the Galapagos starting April 9 and continuing. It seems likely that subsidence of Fernandina's caldera block has been renewed. The largest event on April 18, provisionally 5.7 mb (and ms), and located at 0.3°S, 91.7°W, exceeds the largest event of the 1968 collapse (5.4 mb) and all other reported Galapagos earthquakes since 1955. Seismic energy released already approaches that of the 1968 collapse, the largest known since Katmai (Alaska) in 1912.
Information Contacts: C. Vonhake, NOS/NOAA; E. McIntosh, Golden Cachelot, Lindblad Travel, New York, USA; R. Sievers, Darwin Research Station, Galapagos Islands, Ecuador; T. Simkin, SI.
No significant changes to caldera from recent earthquake swarm
Card 1249 (07 July 1971) No significant changes to caldera from recent earthquake swarm
"The earthquake swarm reported earlier (Event Card 1194) continued into early June but recent inspection of volcano Fernandina, the general center of earthquake locations, shows that the caldera has not resumed the collapse begun in 1968. The caldera remains essentially the same and aerial reconnaissance of nearby calderas, Wolf and Darwin (Isla Isabella) are likewise unchanged. We noted zones of strong recent fracturing on NW Fernandina and a group from the University of Oregon is reporting microseismic data from an array at this area."
Information Contacts: Educational Expeditions International Research Team, Galapagos Islands, Ecuador; T. Simkin, SI.
New eruptive products recognized during fieldwork
Card 1659 (19 June 1973) New eruptive products recognized during fieldwork
During recent fieldwork on Fernandina, new eruptive products were recognized in the SE end of the caldera. An arcuate fissure, ~1 km long and very near the rim of the SE bench, has erupted small amounts of fragmental material that is concentrated only a few tens of meters on the SE side, but on the NW (downwind) side this material has cascaded over the rim, draped much of the prominent scarp at this end of the caldera, and built a small forked delta into the lake below.
The new eruption had not taken place in late April 1972, but its products appear in photographs taken in late September. Those on the caldera rim at that time witnessed no volcanic activity, but felt a small earthquake at approximately 0600 GMT on 26 September 1972. This is the first recorded volcanic activity in the Galapagos Islands since the large eruption and caldera collapse on Fernandina in June 1968.
Information Contacts: Tom Simkin, SI.
More accurate date for 1972 eruption
Card 1749 (30 November 1973) More accurate date for 1972 eruption
We now have a more accurate date for this eruption which had not taken place on 22 April [1972]. During telephone notification of the [November 1973] Wolf activity to Dr. Bert Nordlie, we have learned that the eruption was prior to his visit to Fernandina in mid-July of 1972, but it was not reported to the Darwin Station or other Galapagos workers.
Information Contacts: Peter Kramer, Charles Darwin Research Station, Galapagos Islands, Ecuador; Tom Simkin, SI.
Eruption during 10-13 December sends lava flows into caldera
Card 1752 (13 December 1973) Visible and infrared satellite observations of eruption
"Observations from space show eruption on Volcan Fernandina, support previous indication of eruption on Wolf (Card 1749), and suggest strong thermal activity on Darwin.
"NOAA-2 satellite recorded vapor plume extending 200 km WSW from Fernandina summit 1543 GMT December 10. Infrared from same satellite shows arcuate hot spot at S end of caldera: the site of a small fissure eruption 16 months ago, caldera collapse in 1968, and large caldera lake. SKYLAB, on first clear-day pass since Wolf report, photographed eruption at 1335 GMT December 11 and described smoke issuing from Fernandina. December 12 NOAA-2 imagery shows fainter plume only 50 km long at 1500 GMT and thermal pattern same as December 10.
"NOAA-2 shows additional hot spots on E flank of Wolf and E flank of Darwin (20 km S of Wolf).
"Only known Galapagos earthquakes in last month are 1245 GMT November 30 (Mb 3.9), 0555 GMT December 10 (Mb 4.2), and 0111 GMT December 11 (Mb 3.9). Accurate locations not yet available. No reports yet from Darwin Station investigating event on ground."
Card 1757 (17 December 1973) Plume observations from space
Close inspection of NOAA-2 imagery shows hot spots reported on Event Card 1752 coincide with caldera floors, not outer flanks, and can probably be explained by normal daytime temperature differences. However, the plume from Fernandina summit was real. The December 10 plume origin was the S end of the caldera, its width increased to 15 km at 50 km WSW, and it was fully dispersed beyond 200 km. Narrow plume origin and SKYLAB observations suggest cloud did not rise high above 1.3 km elevation of caldera rim. Two days later the plume was less than 5 km at its widest, 40 km long, and also trended WSW. On December 14 it was even smaller and it was not visible on December 16 pass of NOAA-2. Daily ATS imagery indicates maximum plume length was on December 10.
Darwin Station seismograph reports five more local earthquakes within two hours of 0555 GMT December 10 event, but December 11 event recorded by LASA (Event Card 1752) was not recorded there. No other local events in Galapagos through December 15. LASA reports an event at 1625 GMT December 16 but this, like the December 11 event, appears to have been W of Fernandina.
Darwin Station party "saw nothing on Wolf" but gave no further details on that eruption (Event Card 1749). Another Darwin Station party is climbing Fernandina today and photographic overflights are planned for later this week.
Card 1760 (26 December 1973) Additional details of 10-13 December eruption from ground-based reports
"Reports and photographs from Darwin Station indicate Fernandina eruption from vents 220 m below E end of SE bench and along the prehistoric caldera boundary fault utilized in 1968 collapse. On December 13 two vents 50 m apart were feeding lava over 300 m down into the large (2-km-diameter) caldera lake below. A large delta had formed and the full lake surface was steaming vigorously. Despite substantial water loss through vapor, the lake level was approximately 5 m higher than before the eruption, suggesting at least 13 x 106 m3 of new lava.
"David Day climbed the volcano on the 4th as well as the 13th of December and neither his photographs nor his report indicate an premonitory activity at the eruption site just six days before the December 10 eruption. Mild fountaining was observed on the night of the 13th and Pele's Hair was both common on the SW caldera rim and present at the coast 16 km NW of the vent.
"Red glow above the caldera was first reported from the central part of the archipelago in the early evening of December 11 by the crew of the Floreana. Glow was also strong on the night of the 12th, but was less intense on the 13th, and was no longer visible from the coast of Fernandina on the night of the 15th. Satellite imagery has shown no detectable plume after December 14 and the interpretation on that day is questionable. inspection of photographs and reports from Galapagos indicate that cloud elevations were within 1 km of the caldera rim from December 13 onward.
"No new Galapagos region earthquakes have been located by LASA and the Darwin Station seismograph has been quiet. At local noon on 18 December a TAME/Metrotouring overflight had good visibility over the caldera and a description in Quito newspaper 'El Commercio' confirms that the eruption had ceased. The account describes the lake surface as agitated, however, and photographs show continued, but less intense, steaming of the full surface."
Information Contacts:
Card 1752 (13 December 1973) F. Parmenter, NOAA; M. McEwen, NASA; J. Filson, MIT; T. Simkin, SI.
Card 1757 (17 December 1973) A. Krueger and F. Parmenter, NOAA; J. Filson, MIT; P. Kramer, Darwin Research Station; T. Simkin, SI.
Card 1760 (26 December 1973) D. Day and R. Stevens, Darwin Station, Galapagos Islands, Ecuador; C. Ross, Floreana; A. Krueger, NOAA; J. Filson, MIT; El Commercio, Quito, Ecuador; T. Simkin, SI.
Fissure lava eruption during 23-27 March
A four-day eruption began 23 March from fissures at the SE end of Fernandina caldera. As in the similar eruptions of 1972 and 1973, lava flowed down the inner caldera wall into the large (2-km-diameter) caldera lake. The following report is compiled largely from information provided by Dagmar Werner and the Charles Darwin Research Station (CDRS).
A red glow over Fernandina's summit was first noticed at 2140 on 23 March by Werner, who was camped at the coast, 16 km WSW of the eruption site. Later inspection of seismograms at CDRS, 140 km ESE of Fernandina, showed three small events (M <= 3) between 1831 and 1852 that same evening, but no tremors were felt by Werner. A light ashfall dusted her camp that night and heavier ashfall was experienced twice while climbing to the caldera rim the next morning. Reaching the rim at 1300, she observed low fountaining from fissures along the W half of the prominent bench 300 m below the caldera's SE rim. Lava cascaded over 500 m to the lake (formed by the 1968 caldera collapse) and steaming was localized around a growing lava delta, forming there. This activity continued through the night and little change was observed before Dr. Werner departed the rim at 0700 on 25 March. Glow was again observed that night and a cloud was visible as she sailed away on the morning of 26 March.
A separate group including David Doubilet (National Geographic) and Jerry Wellington (University of California, Santa Barbara) was working near Fernandina and on the evening of 26 March observed a bright red glow that increased in intensity until midnight. By dawn, however, the intensity had decreased greatly and the eruption was essentially over [when] they reached the caldera rim at 2000 on 27 March. On 31 March a CDRS team was on its way to study the eruption's products and effects on the lake.
Information Contacts: D. Werner and C. MacFarland, CDRS, Galápagos; T. Simkin, SI.
Earthquake appears to have triggered new eruption
A new eruption began on 8 August and had apparently ended on 19 August when the last observers left the island. An earthquake (mb 4.5) at 0955 was located by USGS/NEIS 43 km NE of Fernandina caldera (easily within hypocenter location error for an event of this size at Fernandina) and appears to have triggered the eruption. One hour later an eruptive cloud was first noticed over the volcano and at 1230-1240 cloud heights of 4,500 and 6,000 m were independently estimated from distant parts of the archipelago. At this time (1231) a NOAA infrared satellite image recorded an irregular cloud roughly 55 km in diameter with its SE boundary over Fernandina. One hour later the cloud was still 55 km in maximum dimension, but had become wedge shaped with its apex over Fernandina and measured 27 km across at its WNW end. After another hour, at 1432, the plume had narrowed to 13 km some 46 km from its apex, and the next hourly image (1533) showed only the indistinct hint of a plume. That night, glow was observed over Fernandina several times and lightning was seen for 1/2 hour. On 9 August a large cloud remained over Fernandina, growing during the afternoon, but it has not been recognized on satellite imagery.
A group including Tui DeRoy Moore and Howard Snell reached the caldera rim on 10 August as the eruption entered its third full day. They observed smoking vents along a fissure on the NW bench of the caldera, roughly 300 m below the rim [see also 3:9]. This bench, isolated by a prehistoric collapse of the elliptical 4 x 6 km caldera, is symmetrically opposite the SE bench that has been the site of eruptions in 1972, 1973, and 1977. The SE end of the caldera also experienced maximum subsidence (350 m) in the major caldera collapse of 1968, while the NW end was unaffected both then and in the 10 years since. Scoria was recognized down to 200 m elevation on the NW flank and Pele's hair reached the NW coast of the island, 12 km from the caldera rim.
Remaining on the rim for nearly 3 days, the group observed intermittent fountaining along the 1-km fissure feeding lava to the caldera lake 500 m below and 2 km to the SE. One strong tremor was felt and rockfalls on the caldera walls were nearly continuous. Activity had declined when they left on 13 August, but another group, including Dee Boersma and Bob Tindle, reached the volcano on the night of 16 August and observed glow over the caldera. They climbed to the rim on the 18th and observed fountaining to 100 m from vents at the back of the bench, some 400 m NW of the vents active on 10-13 August [but see 3:9]. Fresh spatter was on caldera walls 200 m above the vents, and lava was flowing to the steaming lake. Activity declined in the early morning of 19 August and only vapor issued from the vents as the group left the rim. Neither vapor nor glow were seen over the volcano on 20 and 21 August, and no more recent reports are available.
Information Contacts: H. Hoeck, R. Tindle, and H. Snell, CDRS, Galápagos; T. Moore, Academy Bay, Galápagos; A. Kreuger, NOAA; D. Boersma, Univ. of Washington; USGS/NEIS, Denver, CO.
Eruption apparently ended 26 August
The eruption reported last month took place along a fault on the caldera's NW bench. This pre-1947 fault dropped the SE edge of the bench by about 80 m. The three active vents viewed 18-19 August were located on this fracture, not at the back of the bench as reported last month. Although the witnessed cessation of lava venting during the early morning of 19 August appeared to be the end of the eruption, on 24 and 26 August explosive "popping" sounds were heard by Robert Tindle 15 km from the caldera at the island's NE coast. These explosions lasted about 2 hours and were accompanied by "diffuse, smoky haze" drifting down the upper slopes of the volcano. From 27 August until he left the island 5 September, Tindle heard no other activity and saw no other clouds over the NW caldera rim. Visual observations of the caldera on 6 and 19 September likewise showed no signs of activity.
Further Reference. De Roy Moore, Tui, 1980, Galápagos: islands lost in time: Viking, New York, NY, 161 p.
Information Contacts: R. Tindle, H. Hoeck, and P. Ramón, CDRS, Galápagos.
Caldera eruption; lava flow; SO2 plume detected
At 0500 on 30 March, Oswaldo Chapi and Fausto Cepeda (of the Galápagos National Park) heard noise from Fernandina Caldera, 22 km SW of their position at Tagus Cove. Glow was visible over the NW end of the caldera and a cloud was seen issuing from the same location after sunrise. The eruption was described as being smaller than the Volcán Wolf eruption of 1982.
On 1 and 2 April, the TOMS instrument in the NIMBUS 7 polar orbiting satellite detected SO2 produced by the eruption (figure 15-9). No data were available 30-31 March, and SO2 had dropped below the detection threshold by 3 April. Strongest values on 1 April were directly over the volcano and a preliminary estimate of total SO2 was 60,000 metric tons. No eruption cloud was evident on NOAA weather satellite imagery. On the afternoon of 4 April, the cruise ship Santa Cruz reported a long vapor plume coming from the caldera, but apparently decreasing in size. They looked for glow over the volcano that night but reported none.
On 11 April Fernandina was climbed from the NW by David Day [and others], who reported an apparently inactive lava flow reaching from the W side of the caldera (near the site of the major eruption of 1968) to the lake. At 0650 the next morning, [Day's group] heard a noise "like a large landslide" from their camp near the W caldera rim. Within 30 seconds, they reached the rim in time to see what Day described as a nuée ardente that had already moved from the vent area halfway to the lake. They left the rim, and observers from Punta Espinoza (17 km to the NE) described an eruptive cloud rising at 0655 to an estimated height of about 7 km. At 0704, [Day's group] was overtaken by an ash rain described as "raindrops with ash" and total darkness persisted until 0720. A thickness of 3 mm of tephra accumulated during that period at their rim camp. By 0725 it was clear enough to see into the caldera. Tephra covered the new lava on the caldera floor with the exception of an area a few hundred meters across in which molten lava could be seen. [The group] left the rim at 1030 and no further volcanism had been witnessed at the time of their radio report, at 1500 on 13 April, from Punta Espinoza. [A substantial part of the caldera wall collapsed into the 1984 vent area on 11 April, and was responsible for most, if not all, of the phenomena witnessed by Day and his group.]
This is the 6th known eruption of Fernandina since the major explosive eruption and massive caldera collapse of 1968. The last eruption was not recognized in the Galápagos, but its products are visible in an aerial photograph taken 26 March 1982. From a 900-m-long circumferential fissure on the S rim of the caldera, flows moved both inward (N) down the caldera wall and over a high topographic bench, and outward (S) where the flow ponded behind another row of circumferential vents. The eruption had not yet taken place when Tom Simkin and others passed this area on 4 December 1980.
Information Contacts: G. Reck, CDRS, Galápagos; L. Maldonado, Quito, Ecuador; D. Day, Isla Santa Cruz, Galápagos; A. Krueger, NASA/GSFC; M. Matson, NOAA/NESDIS.
Eruption cloud extends 300 km
On 14 September an eruption of Fernandina ended the longest period of volcanic quiet in the Galápagos Islands in the last 20 years. Fernandina's last eruption was in March/April 1984 (9:3), and no eruptions have been reported from the Galápagos since then.
An unusual earthquake swarm was recorded by the WWSSN on 24 February 1988, and the most recent hypocenter locations (USGS Monthly Listing) place six events within 25 km of Fernandina's caldera. These took place within a 10-hour period and were in the mb range 5.0-5.5. Two more recent earthquakes have also been located within 25 km of Fernandina's caldera, an mb 4.8 event on 15 April and a 5.3 event on 20 May (USGS PDEs 16-88 and 21-88). Inquiries following the 24 February swarm revealed no observations of volcanism by scientists, residents, or tour vessel personnel in Galápagos, but Fernandina is uninhabited and cannot be seen from inhabited parts of the archipelago. Inspection of low-resolution satellite imagery found no Galápagos plumes on 24 February.
On 14 September, residents of southern Isla Isabela felt earthquakes around 1100, and around 1130 a National Park warden on one of the Isabela volcanoes saw an eruption cloud from Fernandina's caldera, roughly 60 km to the NW. Alfredo Carrasco confirmed the 1100 seismicity by inspecting the Darwin Station seismograms, but no other reports from the islands were available at press time. A group including National Park and Darwin Station personnel left Isla Santa Cruz for Fernandina on 15 September [13:10].
Inspection of NOAA geostationary satellite images by Otto Karst found no plume on an image returned at 1115, but a small, point-source cloud over western Fernandina at 1230. By 1830 the plume had spread 220 km SW and very preliminary inspection of infrared data suggested an altitude of 9 km for the cloud. The plume had started to separate from its source 2.5 hours later, indicating an end to the eruption, and by 0030 on 15 September the cloud was fully dispersed and no longer visible on the image. The path of the TOMS instrument on the Nimbus-7 polar orbiting satellite was not well placed for measuring the cloud on 14 September. However, preliminary TOMS data collected at about noon on 15 September showed a plume of SO2 extending ~ 300 km WNW from the vicinity of the island [see also 13:10].
Information Contacts: G. Reck and A. Carrasco, Charles Darwin Research Station; L. Maldonado, Metropolitan Touring, Quito; B. Presgrave, NEIC; M. Matson and O. Karst, NOAA/NESDIS; A. Krueger,GSFC.
Caldera wall collapsed; crater lake moved; lava flows, phreatic eruptions observed
The 14 September eruption led to the caldera's most dramatic changes since its floor dropped 350 m in 1968. The following account is based mainly on reports from Tui De Roy and Alfredo Carrasco, and photographs by Carrasco. Quoted material is from De Roy.
The E wall of the caldera, oversteepened since the 1968 collapse, failed, and the resulting debris avalanche covered the caldera floor, burying a 110-m-high tuff cone that had survived the 350 m drop in 1968. The caldera lake had been ~2 km in diameter, with a maximum depth in 1970 of 75 m at the SE end of the caldera. The avalanche drove it to the W and NW as a tsunami, and when it was first viewed from the rim (18-21 September) the lake had been raised by as much as 150 m, displaced to the NW, and greatly reduced in volume. The lake level dropped rapidly during those 3 days, as water percolated into the avalanche deposit below, and it was expected to disappear soon.
The eruption that apparently triggered the avalanche deposited up to 1.5 m of scoria on the caldera's ESE rim, ignited several fires in the dry brush vegetation, and destroyed the principal nesting area for Fernandina's large population of land iguanas. De Roy recognized that "fire storm" winds must have been strong, for wood on the side away from the caldera had been severely abraded by scoria and no branches thinner than a finger survived. She also measured a temperature of 45°C at 20 cm below the surface of the scoria, noting that "near the margins of the scoria field, where ground vegetation was not fully smothered, smoldering soil fires were running under the scoria, with occasional flare-ups spreading through the dry scrub." Pelé's hair was liberally distributed on the S rim ("wind-drifted heaps 5 cm thick around clumps of grass") and W flank, and reticulite was found floating 20 km S of Fernandina (and already colonized by larval crabs) 3 days after the eruption's start.
Lava flows continued after the avalanche, principally from a vent area ~ 100 m N and E of the 1973 vents, at an elevation ~ 750 m on the inner E wall. Flows coated the lower slopes and were filling in low spots on the caldera floor 18-21 September. De Roy described the hummocky avalanche deposits as "large heaps of rubble, including substantial rocks similar to the landslide accumulations along the caldera walls. [They are] scattered at random over the floor, some at least 20-30 m high, as though dumped by giant truck loads." Carrasco's photographs show low flows advancing to the W, near the former W lakeshore, to the NW between rubble masses, and to the NNW into the steaming lake remnant. These flows were moving during the 18-21 September observations, and "showed various glow points during the nights," but seemed to De Roy to be the redistribution of still-molten lava on the floor rather than continued feeding from vents.
Several phreatic explosions were witnessed from the rim, and small secondary explosion craters pockmarked many parts of the caldera floor. The largest explosion was at 1022 on 17 September as De Roy and others were ascending the NW flank of the volcano. A rumble and explosion were heard and "a billowing cloud rose rapidly over the caldera, then drifted SW, trailing black curtains of scoria or ash as well as a plume of brownish dust." Other explosions, mostly from the lava flow margins, were timed by David Day at 2330 on 17 September, 0415, 0658, and 0708 on the 18th, and 1005 on the 19th.
The E rim of the caldera, at an elevation of 1,350-1,450 m, was little changed by the 1968 collapse, but inner slopes averaged nearly 45° and were the caldera's most common sites of rock avalanches throughout the last 20 years. The lake lay at an elevation of ~ 430 m along the foot of this wall. De Roy estimates that a width "possibly as much as - but no more than - 250 m" was removed in the [main] avalanche and smaller avalanches that were continuing while the group was on the rim. A zone of nearly 3 km along the E wall has been affected. At 1403 on 19 September, David Day was on a cone ~ 200 m from the E rim "when a huge landslide removed a slice of rim perhaps 10 m thick by 40 m or so wide. This was followed immediately by a violent E-W jolt which he described as a rebound sensation. This jolt was not felt by the rest of the team on the S rim, nor were any other tremors felt during our stay." Fissures were observed in the new scoria within 50 m of the rim "sagging like glacier crevasses under snow." Landslides were common ("sometimes going on uninterrupted for an hour or more") during the group's 3 days on the rim, and the caldera was obscured by rockfall dust during much of 20-21 September.
The Nimbus-7 satellite that passes Galápagos around local noon every day has provided some interesting (and puzzling) information on SO2 distribution. Its orbit on the day of the eruption was far to the east of Fernandina and in the worst position of its 6-day cycle for measuring the eruption. It registered no SO2 on 14 September, less than an hour after the eruptive cloud was first sighted in Galápagos, but its orbit improved in the following days and so did the volcano's production of gas. On 15 September a broad SO2 plume extended from about 300 km NW of Fernandina to about 250 km SW, but no SO2 was detected as far as 400 km W. On the 16th there was a transmission problem that lost all data in a roughly E-W band 0-300 km S of Fernandina, but a weak SO2 anomaly was clear from 400 to 700 km SW. Coverage to the N and NW was good on the 16th, but no anomaly was seen in that quadrant. On the 17th there was a weak SO2 anomaly for ~200 km SW of Fernandina, and a considerably stronger one from 700-800 km SW. This was the plume's greatest distance from the volcano, but the weak local plume suggests that the source (Fernandina) was no longer supplying much volcanic gas. On the 18th there was no anomaly at all within 300 km of Fernandina, but a strong SO2 concentration (in fact the strongest of the eruption at 35 m-atm cm) 500-600 km to the SW. It is not clear why the strongest concentration of the eruption was that far (in time as well as space) from the eruption. On the 19th it had completely dispersed and no SO2 anomaly appeared on the image.
Information Contacts: T. De Roy and D. Day, Isla Santa Cruz; A. Carrasco and G. Reck, Charles Darwin Research Station; A. Krueger, GSFC.
Preliminary reports of intracaldera eruption
Preliminary reports indicated that an eruption began on 19 April and was continuing 4 days later. Few details were available from ground observers, although glow over the caldera was reported. The eruption was believed to be within the caldera, as were six of the volcano's seven other eruptions since the 1968 caldera collapse. NOAA weather satellite images showed a diffuse low-altitude plume ~100 km long emerging from Fernandina on 23 April at 0900. No eruptive activity had been evident on an image 2 hours earlier. At 1300, the plume, although still diffuse, appeared to extend ~ 320 km SW from the volcano, but it had dissipated by 1600. Satellite data from previous days was not immediately accessible.
Information Contacts: A. Brown and J. Lynch, SAB; T. De Roy, Isla Santa Cruz; M. Krafft, Cernay, France.
Large SO2-rich plumes deposit ash; lava fountains and flows from 1988 vent area
The eruption . . . began on 19 April and ended in the early morning hours of 24 April. It was observed by several groups both on and near Fernandina, providing documentation that is unusually detailed for this uninhabited island volcano.
The start of the eruption was witnessed at about 1300 by Kirstin and Feo Pitcairn while sailing towards Fernandina ~30 km to its N. A "towering column" developed within only a few minutes, and one hour later a second plume, from a source N of the first, was recognized. David Day. . . reported that the main vent was near the base of the ESE caldera wall at the 1988 eruption site, with another vent ~3 km to the NW, also on the main caldera boundary fault and near the easternmost 1978 eruption vent. At 1500, Day, then sailing near Isla Santiago, noted that the leading edge of the cloud had already reached that island's high point, ~ 90 km ENE of its source.
Shortly after 1500, cloud development accelerated. Kirstin Pitcairn described a "big white mushroom cloud above the N plume" and estimated the height of the rapidly rising S plume at 4-6 km. Day described the distant cloud as building slowly after 1510, and both observers remarked on the increased density of the ash cloud. At 1535 a new plume joined the other two, nearer the S plume, and rose very rapidly, but the S plume remained dominant and Pitcairn saw pink coloration to its top in daytime. Starting about 1600, ash fell at Cabo Hammond, on Fernandina's SW corner, where Markus Horning and assistants were studying fur seals. Ashfall was continuous for 3 hours and intermittent until about 2230, with an estimated accumulation of 5-10 mm for the full eruption. At 2015 Horning first heard noise from the eruption, a strong continuous rumbling without booms or explosions, that continued until well after midnight. A single explosion was heard by Milton Friere, 50 km E on Volcán Alcedo, at 1630 ( ± 15 minutes).
At 1830 David Day, then 110 km ESE, saw "the first of 3 large dark clouds punch up quickly above the low cloud covering Isabela . . . over a 10-minute period," and estimated the cloud height at 3-4 km.
That night the Pitcairns watched and videotaped the eruption from Punta Espinoza on Fernandina's NE coast. They described a varying spectacle including "flame-shaped jets shooting high into the billowing column," alternation of brightness between the two main plumes, and cessation of the central plume at 2043. At Cabo Hammond, Horning routinely measured incident light intensity at sea level every night, and his readings indicated maximum light emission/reflection that night from about 2000 to 2200. He noted that this was the only night in which glow from two vents was visible (only the S vent being active in later nights). Although it was a dark night (new moon 14 April), the peak glow corresponded to roughly 2/3 the light measured on clear full-moon nights.
The eruption was quieter on the early morning of 20 April, but zoologists N.P. and M.J. Ashmole, also at Espinoza, described renewed activity around 0845, including audible explosions, ash, and reappearance of the central column. On the opposite corner of the island, Horning experienced a heavy, dense fog that obscured the summit, but he heard strong explosions at 0857 and 1116. The Pitcairns described a huge dark cloud forming at 0910, and in late morning they sailed W to circle the island, but encountered heavy ashfall off the WNW coast. At 1152 the Nimbus-7 . . . TOMS instrument measured a strong SO2 plume to the SW, with the greatest concentration 500-600 km SSW and trace values to the W. A preliminary estimate of the total mass of SO2 was 1.7 x 10⁵ metric tons. The combination of ash and aerosol that stung the eyes caused the Pitcairn group to turn back about 1500. Ashfall increased to the N in late afternoon, and they experienced (decreasing) ashfall all the way back to Punta Espinoza. Very little ash fell at Cabo Hammond.
Activity had declined by the morning of 21 April, with only the S plume continuing and at decreased height. By mid-morning the summit was obscured by low cloud cover, but at 1120 Pitcairn saw all three plumes active (although the N one was small). From the summit of Sierra Negra, 65 km SE of Fernandina, David Day photographed "a medium-size eruption cloud" at noon. At the same time, however, the TOMS instrument detected virtually no SO2 over Galápagos but a low concentration 600 km W, on the equator. That night, Day sailed around Isabela and briefly saw faint glow over Fernandina as he approached it from the S.
On the morning of 22 April, . . . Day landed at NW Fernandina and noted 1 mm of fresh ash. At about 1040, while still low on the NW flank, he heard roaring from the vent, then roughly 12 km distant. This apparently marked a renewal of activity, for the TOMS instrument measured a strong concentration of SO2 immediately over Fernandina at 1046. Day reached the rim at 1730 and described 50-100-m fountains from the 1988 vent area, low on the opposite caldera wall. Fresh aa flows covered an estimated 80% of the low caldera floor, with only the higher lobes of the 1988 debris avalanches still visible. Most flows were to the NW, but a smaller flow went W below the SE bench. The aforementioned northerly vent, on the E side of the NW bench, had fed "a small flow" to join the others on the NW floor, and fumarolic activity was vigorous at the vent.
Day reported that the eruption continued with the same intensity all night, and the next day he explored to the S, finding that the maximum thickness of new tephra on the W rim was 1 cm at a point WNW of the main vent. Pele's hair was "fairly abundant." On this day (23 April), the GOES satellite detected a 105-km plume at 0900 that grew to 320 km SSW at 1300 and had dissipated by 1600 (16:3). At 1103 the TOMS instrument detected a strong SO2 concentration ~ 90 km SW and lower values to ~ 225 km SW; a preliminary estimate of the total mass was ~4 x 10⁴ metric tons. Day was on the S rim of the caldera at 1205, when he saw "a mass of landslides round and above the main vent" that was immediately followed by increased activity at the vent. Fountain height increased by almost 50% and his group (~ 3 km SW of the vent) experienced light scoria fall 10 minutes later that lasted for 15 minutes. Noise and fountaining, after almost ceasing, resumed at 2006 that evening and Day saw additional flareups at 2019, 2037, and 2100. Day observed a small flow NW from the main vent from 2100 to 2122, with no noise, but reported no further observations or sounds overnight.
Horning had reached the SW rim at 1700 and watched the S vent continue producing lava until at least 0100 on 24 April, but it had ceased by 0530. Day also noted no activity between dawn and his leaving the rim at 0630 that morning. Horning's SW-rim camp received 1 mm or less of ash overnight, but when they returned to their coastal camp that evening ~ 1-2 mm had accumulated in their absence. No glow was observed during the nights of 24 and 25 April.
Geologist Dennis Geist was on the summit of Alcedo from 24 April and reported that the only sign of a Fernandina eruption was a small (~ 3 km diameter) white cloud above the caldera. No glow was observed that night, either from Alcedo or N of the volcano (where Day was sailing around N Isabela). The small white cloud persisted over Fernandina at least until 27 April when Geist left Alcedo.
Information Contacts: D. Day, Isla Santa Cruz; F. Pitcairn and K. Pitcairn, Bryn Athyn, PA, USA; M. Horning, Seeweisen, Germany; S. Doiron, GSFC; N. Ashmole and M. Ashmole, Univ of Edinburgh, Scotland; D. Geist, Univ of Idaho, USA.
Lava escapes on SW flank and flows 5 km to enter the ocean
Fernandina... is erupting... from a fissure on its outer flank (figure 1). The last flank eruption, in 1968, was followed by a 350-m collapse of the central caldera floor, and the eight eruptions since then have all been within the caldera or on its rim.
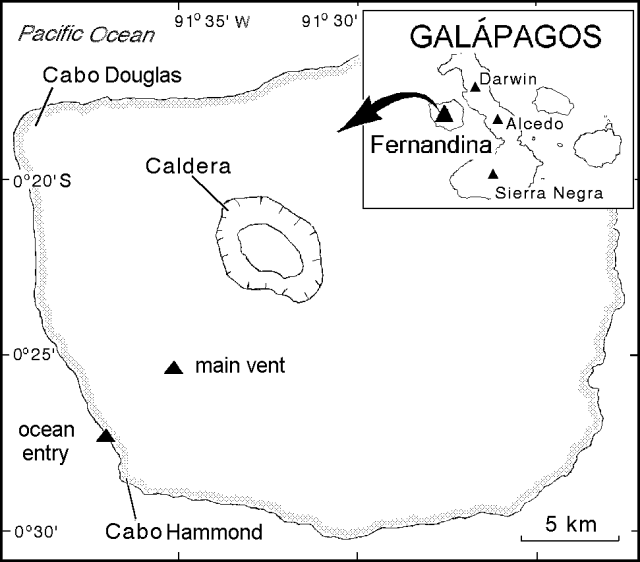 |
Figure 1. Sketch map of Fernandina showing preliminary locations of the ocean entry and main vent. Some estimates suggest the main vent was closer to the sea, only 2 km inland. The index map is incomplete in its portrayal of both volcanoes and islands of the Archipelago. |
On the evening of 25 January distant observers saw a red glow over Fernandina. Closer inspection a day and a half later revealed lava erupting from a radial fissure on the island's SW flank and flowing ~5 km to the ocean (figure 1). At the ocean entry, lava constructed a delta and, although reports suggested a possible decrease in lava output after 13 February, the eruption continued as of last report (mid-Feb).
According to Jim Stimac, the eruption was first sighted at about 1930 on 25 January, when Lenin Cruz, on a fishing boat 140 km E of Fernandina, noticed a red-orange glow on the horizon lingering after sunset. About 50 minutes later, volcanologists Stimac and Fraser Goff also noticed the glow from their campsite on the NW rim of Sierra Negra volcano, ~ 65 km SE. By 2040 they saw glow both from a rising plume over the SW flank and from the summit caldera, which had just cleared of clouds. The glow persisted until dawn. At 0630 the next morning they could see a plume ~4 km high rising from the SW flank of Fernandina. On this and following days the eruption was also witnessed from fishing boats and official Ecuadorian vessels.
As Stimac and others approached Fernandina on the morning of 27 January, they saw two distinct plumes from gases rising over the fissure vent, and from steam over the ocean entry. The two plumes coalesced, rose 3-4 km, and were blown to the W as a white plume. A red-brown haze layer was visible downwind of the vertical plume, and a bluish color was seen above the fissure. After sunset on 27 January, the fissure, a sinuous lava flow, and the ocean entry were more clearly visible. Lava flowing in a narrow active channel near the vent traveled at 3-5 m/s. The larger velocity was similar to values estimated later from videos. Stimac made an order-of-magnitude lava output estimate. Based on the larger velocity, and a 10-m width by a 3-m depth the output was about 1.3 x 10⁷ m3/day.
On both the evening of 28 January and the morning of 29 January the fissure vent was several hundred meters in length, with three distinct fountains. The highest fountaining issued from the upper two vents, and the highest-thrown bombs took 3-5 seconds to fall indicative of 45-125 m fountain heights. The upper fountain produced the finest tephra (most vesicles, highest proportion of vesicles to glass) and probably had the highest gas-to-lava ratio. The middle fountain produced larger bombs. Whereas the upper two fountains were vertical, the lowest vent sent material laterally downslope. Tephra were found as far as 1 km from the vent; near the fissure, they were generally <1 cm in diameter. The tephra consisted of amber-brown vesicular glass with 5-10% plagioclase phenocrysts.
By sunrise on 28 January, an asymmetric spatter-cone several meters high had grown around the main fissure vent, and by the next morning, it had reached 20-30 m high. Clear weather on 29 January unveiled at least two other recently active vents, burnt vegetation, and fresh lava located on higher ground on the SW flank. These observations, combined with those of 25 January, suggested to Stimac that the eruption began inside the caldera, but shifted almost immediately to the radial flank fissures. The caldera, however, has not been visited since the eruption began. Stimac left Fernandina on 29 January, but he saw activity at the main vent episodically, as conditions permitted, from Alcedo volcano (~45 km E) until he left the islands on 14 February.
Within about a kilometer of the main vent and lava channel, Palo Santo trees were felled or broken. Tui De Roy described them as broken by "violent turbulence" and noted they had fallen in seemingly random directions around what she inferred as the early vents.
The translucent, bluish gas plume above the fissure was typically a few hundred meters wide and it rose 100-500 m high before forming turbulent white steam clouds. Observers smelled no sulfur gases but an acrid smell was attributed to unseen, but suspected, burned vegetation. Falling rain irritated eyes and also could have damaged foliage.
Godfrey Merlen's report on the eruption follows. "Although some new lava fields have been created, the eruption has settled into a pattern with fountaining lava (30-200 m) forming scoria ridges alongside its fissure. It seems that initially the active fissure extended for ~ 1.5 km, but later lava extrusion was restricted to ~ 400 m (29 January). However, a film taken on 2 February, seems to show an increase in the length of the erupting fissure. A river of lava ~ 100 m wide is seen flowing to the sea, ~ 5 km away, where new land is slowly being formed. The front entering the sea is ~ 800-m wide."
At the ocean entry, the lava had several active channels, and several that were recently abandoned. Near the ocean entry, observers identified 15 fish species of dead fish, including some that live at moderate depths. The normally dark-green seawater abruptly changed to yellow green at a distance of ~ 900 m from the ocean entry. Ambient sea surface temperature was ~ 25°C at distance from the eruption, but in the yellow-green area it reached 32°C. On 28 January, ponded lava drained rapidly into the sea. At a location 200 m out from the ocean entry, steam rose from the surface and the sea-surface temperature exceeded the thermometer's range (>60°C). Cold surface water was also detected (19.6°C or ~5°C below ambient); it may have risen from depth when displaced by encroaching lava.
Tui De Roy noted that the eruption appeared to change in character after 13 February when flow-filled channels caused new lava to spread out into smaller lobes with less of a trough-shaped morphology. She also noted that the amber-colored, W-directed plume was visible for tens of kilometers.
Although the eruption has yet to be imaged from space, and the TOMS is currently inoperative, the eruption has been documented on film by local and visiting scientists, and a Japanese public television crew. The TV crew's producer, Hiromichi Iwasaki, described a 1.5-km radius of discolored water around the entry, and rain due to condensed steam. Tui De Roy reported that the eruption took a considerable toll on wildlife, as many fish died and this attracted seabirds who dove into the heated waters and were scalded to death.
The eruption followed an increase in seismicity in and near the western Galápagos. A mb 5.1 earthquake at 1811 on 14 December was recorded by the NEIC. Another (mb 5.1) was recorded at 1330 on 11 January, following five smaller events the previous day on the transform fault about 200 km NNE of Fernandina. We have also received reports of local earthquakes felt on Alcedo volcano (~45 km E).
Fernandina also erupted in 1991, 1988, 1984, 1981 (± 1), and 17 to 18 other times in a historical record going back as far as 1813. Most of these eruptions were of short duration and located in or near the summit caldera.
Information Contacts: J. Stimac, LANL, Los Alamos; G. Merlen, Estacion Cientifica Charles Darwin; H. Iwasaki, Nippon Hoso Kyokai (Japan Broadcasting Corporation), Tokyo; T. De Roy, Golden Bay, New Zealand; NEIC.
Flank eruption slows but continues until at least 19 March
The fissure eruption... has continued sending lava flows down the SW flank and into the sea. All of the new flows appeared to be aa lavas (figure 2). Godfrey Merlen compared the eruption intensity in late January to 5 March and concluded that it had decreased significantly... eruptions continued through at least 19 March.
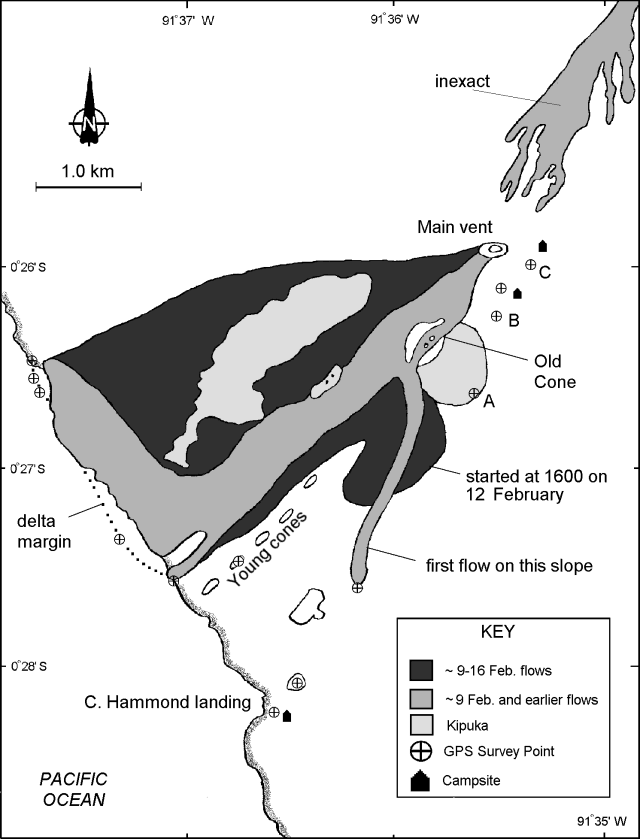 |
Figure 2. SW Fernandina Island sketch map from an original ~9 February map by Godfrey Merlen with later annotations by Tui De Roy. GPS points A, B, and C were recorded on 7 March. Point A lay at the extreme S end of a new 80-m-wide aa flow that also passed through point B. Point C lay at the foot of the S side of an active cone. |
Tui De Roy was on the island during 8-16 February and part of her report follows (the term "kipuka" refers to an area of older rocks surrounded by younger lava flows). She saw two vent areas (figure 2): 1) an early eruptive site (active before she arrived) in the crater of an old cone ("Old Cone"), and 2) a main vent where the sustained activity that she witnessed took place ("Main vent"). She also had a reconnaissance view of some small finger-like lava flows at higher elevation ("inexact" on figure 2 and discussed below under Early Activity).
"All of the activity has taken place along a prominently marked, prehistoric radial fissure running from about half way up the volcano right down to the shore. This fissure is marked by numerous old cones of varying ages, ranging from a very old, elongated (and perfectly aligned) well-vegetated cones covered in ancient ash at the edge of a kipuka ["Old Cone"], to a string of 6-8 very recent looking cones on the lower flats coming right down to the shore [figure 2]. Significantly, a couple of very small new spatter cones had been active briefly early in this eruption within the crater of the old cone.... The entire length of this radial fissure had built up through previous eruptions something of a ridgeline down the flank of the volcano, which served to deflect most of the current lava to its northern watershed, although later in our stay an increasing number of flows were beginning to spill over through a gap to the S, posing an imminent threat to the wildlife oasis of Cape Hammond...."
De Roy also noted that in many cases the paths of lava flows descending the flank "could not be readily followed because of undulations in the land and the fact that many of the flows disappeared into lava tubes at several points." But, she did describe flows that were visible, as follows.
"Both the active flows, as well as some that appeared to have now stopped, meandered and braided down the slope, with arms crisscrossing through irregular-shaped kipukas far to the NW of the main and most direct path to the sea. A new flow (as shown on Godfrey's map) reached the sea S of the main flows at about 0800 on 8 February where it formed a new delta and continued to advance steadily before halting a couple of days later."
Although there were slight variations, the intensity and height of the fountaining remained "remarkably steady" during her stay. The single active main vent displayed continuous fountaining 50-100 m tall. Fountains shot up both vertically and at oblique angles on either side of the vent. During 8-16 February the spatter cone around the vent grew considerably broader, but little taller. She camped near the vent on 9 and 13 February (figure 2) and watched the growth of a very blocky mass of rubble at the E base of the cone.
The migration of flows toward the N is emphasized by comparing De Roy's 16 February annotations of lava extent to the map completed by Merlen about a week earlier (figure 2). Starting about 12 February new flow paths developed high on the slope. Some lava flowed N as small fingers, but beginning at about 1600 on 12 February a large lobe flowed more southward than before. This migration of lava flows to the N and S corresponded with a progressive decrease in lava flow rate at the ocean entry (even though, as previously mentioned, the fountaining at the vent showed no marked decrease). By the time De Roy departed at noon on 16 February ". . . there seemed to be no more flowing of lava into the sea, with only slight wisps of steam still rising along the shore." On the nights of 13-15 February the glow from lava on the flats 1-2 km inland seemed to increase.
Although De Roy's observation of smoke and other airborne material was from upwind positions, she reported the following: "Only a very small amount of solid airborne particles appear to have been emitted during the initial stage of the eruption. A minimal amount of Pele's hair was evident near the shore, barely increasing in density closer to the vent. Within 1-2 km of the vent a thin dusting of light, gassy scoria littered the ground as in all previously observed Fernandina eruptions, but in much lower amount than some of the caldera eruptions of the 1970s and 1980s. Such scoria was still being produced at the time of our visit, with constant fallout in the area of our camp of 9 February whenever the eruption cloud drifted above us. No signs of ash from this eruption were present anywhere; although I did hear comment of 'ash' dusting one of the early boats to visit the site.
"Intense heat was rising from the main vent, with only moderate amounts of bluish-white smoke. It rose vertically into a constantly contorting, billowing, major thermal head, resembling a thunderhead. In addition, a pall of amber-colored fumes surrounded this cloud column and spread westward at all times, regardless of the shifting directions of the wind at lower elevations, which caused the main cloud to waver in various directions at different times of day or night. This pall was particularly evident when traversed by sunshine or moonshine, which took on a brownish hue. This plume should have been evident on satellite images, regardless of the main cloud possibly being mistaken for the normal thunderhead prevalent over the island during this El Niño season. The 'smoke' from the vent did seem to increase very gradually during our stay."
Besides the main vent, the eruption also produced voluminous amounts of gases from two other sources: 1) several areas of the main lava flow ~2 km below the main vent where degassing took place at the mouths of lava tubes, and 2) at the lava's ocean entry where mainly steam was rising. The first source of gases came out of the main lava flow and was thought to be degassing at the mouths of lava tubes.
Weather satellites (and shuttle astronauts)... have thus far been unable to obtain clear views of the eruption plume. The difficulty has been screening from high clouds coupled with inadequate eruptive plume heights. The TOMS instrument that has successfully imaged Galápagos eruptions since 1979 failed in December 1994.
Having seen the eruption in late-January, Godfrey Merlen returned... on the night of 5 March and noted a reduction in the comparative intensity of the eruption. In March the molten lava at the ocean entry was "dripping rather than flowing." Though less intense than in February, lava outflows remained concentrated at the site where lava had initially entered the sea in January; in March this amounted to about 10 separate outpourings over a 90-m lateral distance. Merlen noted that the small delta created there was ~5-m high and already cut back by waves forming an almost vertical cliff face. In contrast to earlier stages of the eruption, floating dead fish and the abundant wildlife feeding on them were largely absent. In March the sea surface temperature was up to 45°C, while it was ~24.5°C at a distance from the new delta. These temperatures were down from those in mid-Feb when at equivalent spots temperatures were >60°C and ~ 27°C (table 5). No new lava flows had moved to the S. Though still very hot, the new flow appeared to have left nearby vegetation nearly green, suggesting it may have been cooler when erupted than some of the earlier lavas. Scoria thickness on the new cone's upwind base averaged 5 cm.
Table 5. A summary of measurements and remarks comparing offshore seawater and nearshore turgid water close to the lava's ocean entry for the vigorous part of the eruption (late January and early February). Courtesy of Godfrey Merlen.
| Location | Color | Temperature | Secci disk visible to (depth) | Remarks |
| "Normal" water offshore | Dark blue | 27°C | ~12 m | -- |
| Turgid water at the lava's ocean entry | Bright green | 31°C | Up to ~2 km offshore and extending S of Cape Hammond landing | -- |
| Adjacent the lava entry | Brownish-yellow | >60°C | -- | Steaming with rising bubbles |
As previously mentioned, the "old cone" (figure 2) contained two or three early vents within its crater. These vents were marked by steep black spatter. The spatter had been flung 20-30 m, coating and charring trees. Those trees closest to the vents (~15 m from them) had their bark steamed off and were deep orange in color. Although these vents were only briefly active, they discharged a very rough aa flow.
Around the old cone many of the larger trees (Palo Santo and Opuntia cacti) had lost limbs or been knocked down (uprooted or snapped off at mid-height). The trees had predominantly fallen in a downhill direction, radiating roughly away from the main vent. An absence of directional scouring from scoria, and the presence of Waltheria bushes repeatedly twisted around their bases, suggested violent multidirectional wind gusts (a "tornado") rather than a well-defined unidirectional blast. Within a kilometer of the vent, however, Jasminocercus cacti consistently showed mild blistering from excess heat on their ventward sides.
Merlen noted that during the eruption lightning and heavy rain were commonly seen. For example, on the night of 28 January (prior to the release of ponded lava into the sea at about 2230) there was considerable sheet lightning coming from high clouds. Merlen also noted that high columns of thick white steam rose on occasion to ~4 km. The ascent of these plumes appeared dependant on the flux of lava into the sea.
Submarine acoustic recordings were also made by Merlen on 27-29 January using a Benthos hydrophone. The recordings detected extremely loud, echoing explosions at least 7 km from the lava's ocean entry. These sounds were not heard during subsequent visits (on 6-7 and 10 February); however, during all visits the hydrophones received a cacophony of hissings, poppings, and low-level thumps.
Some of Merlen's oceanographic observations are summarized in table 1. Within the discolored water Merlen also noted a ~100-m-diameter circular patch of upwelling water that was "glassy-smooth" and encircled by standing waves up to a meter in height on its margins. Located near the shore and not shifting in position, the upwelling water was cool and sufficiently turbulent to make steerage of the dingy difficult. In contrast to the cool (19.6°C) upwelling water, only 2-3 m away from its margin very hot (50°C) water was found. The upwelling water was brought to his attention by seabirds attracted to it. "Around this dramatic phenomenon and spreading out from it were a quantity of dead fish representing a mesopelagic fauna, including hatchet fish (Argyopelecus sp.), what appears to be a scabbard fish (Aphanopus sp.), and others that have yet to be identified." Although a limited amount is known about the vertical ranges of these kinds of fish, their presence at the surface may help determine the sources of this cold upwelling water.
Biological impact. De Roy noted that the wildlife appeared unable to comprehend the dangers from the intense heat of the lava. Marine iguanas were attracted to the warmth of active flows, climbed onto them, and were ignited before being able to escape. On the other hand, sea turtles and adult fur seals cruised through steaming waters within meters of the lava flow edge and showed no immediate signs of discomfort or injury. In other cases, it was unclear if the water temperature or chemistry was more critical in causing death (eg. pelicans, marine invertebrates, moray eels, and fish). In the sea and along the shore, many animals were attracted by the abundance of dead marine life floating on the surface. These opportunistic species included frigate birds, boobies, brown noddies, storm petrels, and many hundreds of pelicans. Merlen mentioned pelicans with pouches scalded from diving into hot seawater. In addition, De Roy saw sharks, sea lions, and flightless cormorants feeding. The eruption also killed some land iguanas. If lava flows were to reach Cape Hammond this would threaten flightless cormorants, penguins, and marine iguanas as well as one of the largest breeding populations of Galápagos fur seals. Merlen closed his 28 February report with the words: "the overall impression was that of biology in confusion."
Information Contacts: T. De Roy, Golden Bay, New Zealand; G. Merlen and D. Day, Estacion Cientifica Charles Darwin; J. Lynch, SAB; C. Evans, Lockheed.
Lava enters the sea at three locations; ejections from lava lake
Fernandina continued to erupt in late March. While acting as a guide for a film crew, Godfrey Merlin made his third visit . . . and reported on 26 March concerning the 30 hours the group spent at the volcano.
Lava flowing into the sea was concentrated in three areas. Two areas were the same as two months earlier, and the third was ~400 m to the N. Most of the lava descended the near-vertical shoreline, a sea-cliff that was typically ~4-m high and being progressively undercut by wave action removing sand along its base. Flowing in channels of 0.5-1.5 m width, the lava often dripped into the ocean, although Merlin noted that the lava to the N had "the appearance of water cascading to the sea." Discolored water still surrounded the lava's ocean entries. The amount of lava flowing into the sea was difficult to judge, but at least one substantial fluctuation in flow volume was seen during their 30-hour visit.
The group reached shore at the Cape Hammond landing, an area rich in wildlife that could have been threatened if lava flows had continued to progress in that direction. They found that nearby flow fronts remained immobile since the previous visit . . . . Merlin suggested that the lava issuing from main vent (now a well-formed cone), was descending in old tubes to the shore. At night, no incandescence could be seen between the main vent and the sea. During the day, in the upper third of this interval, white vapor rose from the lava flows but otherwise there was little surface evidence of their freshness.
While hiking to the main vent they heard several explosions and saw molten lava "tossed above the rim of the cone every few seconds." Nevertheless, Merlin and Mr. Iwago of the Japanese Broadcasting Corporation (NGK) ascended the cone's base, which they described as built on "huge blocks of reddish-gray rock jumbled together" with intermediate spaces "filled with glassy scoria." Next, they descended into a shallow valley of scoria with extremely hot vents, some ringed by white deposits. They climbed the upper slopes of the spatter cone from the E, upwind side, and found that the cone held a "heaving, rolling, red sea of molten lava" that was ~30-40 m in diameter and 40 m below the cone's rim. Spatter was thrown ~70 m above the lava lake's surface. On the cone's W side, lava flowed over the rim and descended into a tube within the cone.
They found eight dead marine iguanas. Although their appearance ranged from unscorched to charred, the iguanas had each been "literally cooked on the surface of the lava." The group also noted that live iguanas continued to invade the still-hot surface. In contrast to earlier in the eruption, no dead fish were seen floating along the coast and accordingly the large number of sea birds that previously had come to feed on them were absent.
Information Contacts: G. Merlen, Estacion Cientifica Charles Darwin.
Eruption ends in early April
Tui De Roy reported in late May that the Fernandina eruption (BGVN 20:01-20:03) was vigorous again at the close of March, but ended around 8 April. Although unable to return to the eruption site herself, she gathered this information from local fishermen and guides.
Information Contacts: Tui De Roy, Patons Rock Beach, Takaka, Golden Bay, New Zealand.
Now-cooling lava and the eruption's impact on plants and animals
Godfrey Merlen was granted permission by the Galapagos National Park Service to make a post-eruption visit to Fernandina. The recent eruption ceased on about 8 April 1995 (BGVN 20:05). Merlen looked at the eruptions impact on plants and animals, and viewed the newly formed lava fields and cone in the absence of the acrid gases and heat present during the eruption.
Merlin arrived at Cape Hammond on 26 July (figure 3) and climbed for 2 hours along a well-known route to the kipuka adjacent the cone. From this point, he approached the cone itself. He noted Jasminocereus cactus, which form a distinctive part of the flora in the area, and, which were partially scalded within several hundred meters of the lava. Surprisingly, they were heavy with fruit.
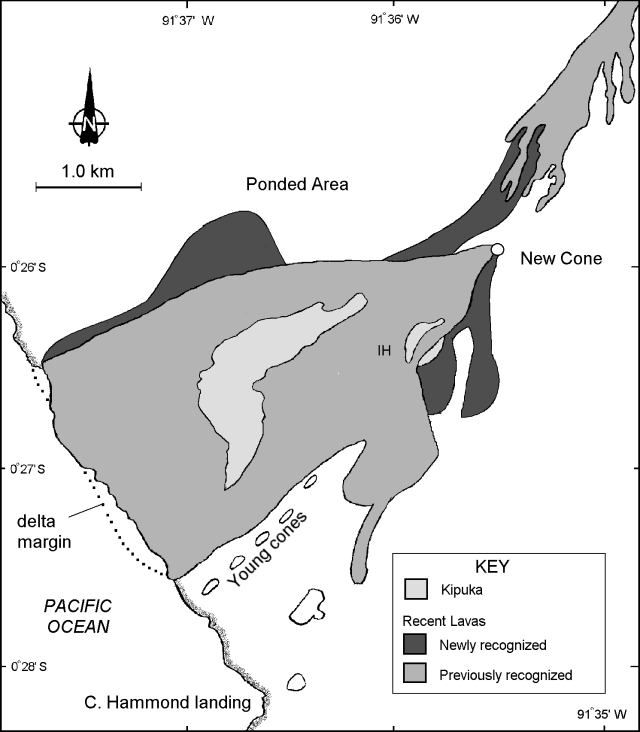 |
Figure 3. Sketch map showing newly recognized lava flows and the location of kipukas, including the one termed "Iguana Hill" (IH). Scale is approximate. |
The cone was approached from the SW. Large blocks of new lava formed the base of the cone, and below them the old lavas were totally covered with a scoria layer. Poking through this layer were a number of Opuntia cactus. Many had been badly burnt by the heat, but they had undergone strong regrowth, and some had up to 9 or 10 new pads. A few flowers were also present.
He ascended the cone (figure 3) easily, due to its firm surface composed of congealed spatter. From the rim he observed that the lava lake had drained, leaving a reddish rubble in the bottom of the crater. A visible entrance to a lava tunnel on the crater's W side probably served as a lava exit route. Circumferential fissures had developed in many areas around the rim, leading to inward collapses. On the N side of the cone's rim, hot spots disclosed by shimmering, heated air indicated that they were still too hot to approach closely.
From the rim one could look upslope and see the earliest flows from the eruption (figure 3). Though previously obscured by gases, it now seems clear that the flow farthest to the N was of significant extent, even though previously unseen. It had traveled a considerable distance past the cone and then turned N, filling in a low area well down toward the coast. Later, lava from the cone butted up against this flow, making a continuous field of new lava.
In descending from the cone's N side towards the "Iguana Hill" kipuka (figure 3), he crossed over the fresh new aa lava, but there were also some smooth patches and many small lava tubes on the surface. The track of the main lava tube could be followed by noting the white encrustations on the rocks. On approach to these encrustations extreme heat was felt. He assumed that a short distance below the surface there were partially liquid lavas that were still degassing. Away from these encrustations the surface of the lava was quite cool.
Although Iguana Hill was wreathed in acidic volcanic gases for many weeks during the eruption, Land Iguanas trapped there survived and four adults were seen. This hardly represents all the iguanas, as the dense scrub vegetation impeded investigation. Many of the plants on the Iguana Hill kipuka were putting out leaves. Zanthoxylum, Croton, and Cordia were all in full leaf, the former were a particularly noticeable bright green.
Blue "smoke" was still visible a little to the NE of Iguana Hill. There was also a little smoke in the low area behind the shoreline. The coast itself was volcanically quiet. Heavy southerly swells broke along a long, black beach that stood in front of the near-vertical sea cliff. This eruption changed conditions at the Cape Hammond landing little, if at all. Flightless cormorants were building nests and some had eggs. The pupping season for the fur seals and sea lion had begun.
A perspective sketch (figure 4) from a point several kilometers offshore shows that the lava flow that started high on the shoulder of the volcano lined up with the westernmost string of cones, including one cone on the coast. However, the new cone, the vent for much of this recently erupted lava, lies off this line to the S.
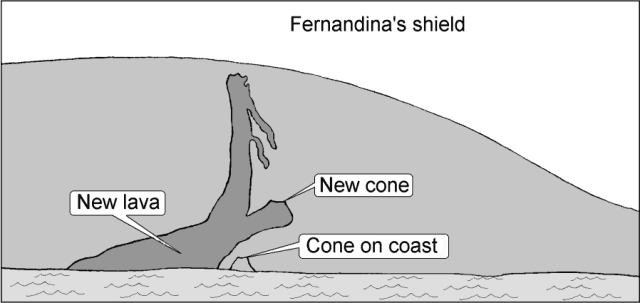 |
Figure 4. Sketch of Fernandina drawn from a point several kilometers offshore looking NE. The sketch shows the alignment of cones and some of the upper lava flows. |
Information Contacts: Godfrey Merlen, skipper of motor vessel "Ratty," Fundacion Charles Darwin Para Las Islas Galapagos, Estacion Cientifica Charles Darwin, Ecuador.
Lava flows down S flank from circumferential vents near caldera rim
On the morning of 13 May 2005, a new eruption started on uninhabited Fernandina volcano (figure 5). Fernandina last erupted in 1995 (figure 6), and had been quiet and seemingly unchanged when a team from the Ecuadorian Institute of Geophysics (IG) flew over it in late March 2005. On 11 May an M 5.0 earthquake occurred with an epicenter ~ 30 km E of Fernandina's center. Only two other earthquakes have been located by the U.S. Geological Survey (USGS) within 100 km of Fernandina in last 4.5 years (M 4.0 on 23 February 2005 and M 4.6 on 16 April 2005), both having epicenters ~ 70-80 km SE of Fernandina's center. A seismic station, installed by the IG in 1996 on the NE coast of the island, was out of service at the time of eruption.
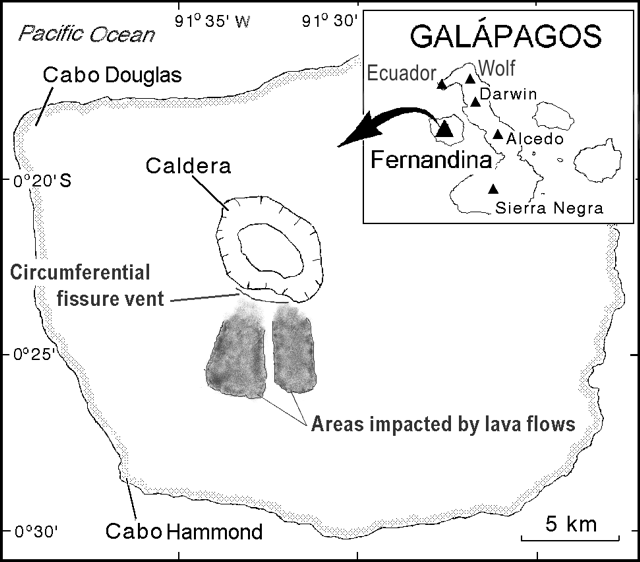 |
Figure 5. Sketch map of Fernandina, showing the conspicuous summit caldera, and indicating the flow fields and circumferential vent area from the 13 May 2005 eruption (as mapped on 14 May by airborne reconnaissance and reported by the Charles Darwin Research Station). Key features include the active circumferential fissure vent and two main areas impacted by lava flows. The eastern area contained lava flows still mobile on 14 May; flows to the W had already cooled by 14 May. On the index map of the Galápagos Islands, the largest island, Isabela, is ~ 130 km long and lies to the E of Fernandina island. "La Cumbre"—Spanish for the summit, peak, or top—has been mistakenly applied to the volcano, apparently because the summit was so labeled on an old map. The island has also been called Narborough. The index map is incomplete in its portrayal of both volcanoes and islands of the archipelago. Revised from BGVN 20:01. |
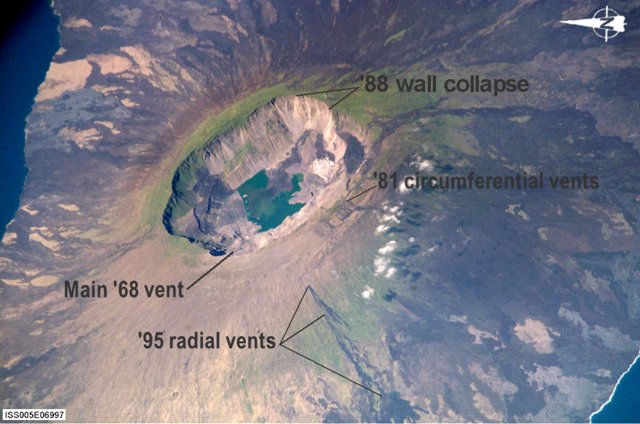 |
Figure 6. A 2002 International Space Station photograph of Fernandina, looking obliquely towards the E (N is towards the left). Labels show key features developed in 1995, 1981, and 1968 eruptions. Note the island's coastline in the lower-right corner and along much of the left margin. Despite the steep walls bounding the 850 m deep, 5 x 6.5 km central caldera, it supports both animal and plant populations. Image ISS05E06997 (Visible Earth v1 ID 18002) with contrast enhanced and labels added by Bulletin editors. |
Galápagos National Park workers in western Galápagos were apparently the first to witness the eruption, and IG technicians recognized it on satellite imagery. The University of Hawaii presents hotspot images on their website. Their GOES data lacked hotspots at 0930, but a clear and strong one had developed on the S flank by 0945. Francisco Dousdebes (of Metropolitan Touring) placed the eruption's start time at 0935. S-flank hotspots were comparatively extensive by 1015. The Washington VAAC issued their first full advisory at 1315. Their notices reported that the W-directed plume rose to ~ 5 km altitude, and the S-directed plume went to 9 km; both were visible as late as 1745 on 13 May, depicting the leading portions of Fernandina' s ash plume more than 200 km from the volcano
An overflight of the eruption on the 13th by the National Park resulted in a report by Patricio Ramón and Hugo Yepes, and the eruption was confirmed by Washington Tapia, director of the Galápagos National Park. That evening, Galápagos resident Greg Estes telephoned Dennis Geist to report that the eruptive source was a "circumferential vent near [the] summit, S side . . . 6 km long with an eruptive zone 50 m across." It was uncertain how this fissure was related to the 1981 eruption site (figure 2 and SEAN 09:03). IG also noted that tephra had fallen on neighboring Isabela Island, in the areas of the volcanoes Wolf and Ecuador (~ 40 km from the vent, figure 1).
At 0537 on the second morning, 14 May, the Washington VAAC reported low level ash/steam not visible in infrared imagery, but at 0746, 1½ hours after sunrise, a plume of ash extended ~ 130 km to the W and was moving at 18 km/hour at 1,800 m elevation. The GOES thermal anomaly was greatly diminished by 0930, and remained low to non-existent until resumption around 1415. That afternoon, an overflight by Godfrey Merlen, Wacho Tapia, and Alan Tye (Charles Darwin Research Station) resulted in the fullest report to date.
They said that although the vent area was obscured by clouds, topography suggested a 4.5 km long fissure vent near the S rim, with activity having progressed from SW (near the first and uppermost flows of the 1995 radial fissure eruption) to the E (figure 1). The lava flows "had begun to pond on the gentler outer skirt of the island," and were then 5.5 km from the coast (~ 5 km from the vents). They thought it unlikely that the flows would reach the sea. A follow-up news report in El Comercio (Quito) quoted Tapia as identifying five flows down the S flank. Only one remained incandescent. At 1745 on 14 May, Washington VAAC reported a plume remaining to the NW, but—lacking detectable ash—they discontinued advisories. Thermal anomalies on the GOES satellite remained strong, however, until the next morning.
The report also noted that, "As on previous eruptions, such as that on Cerro Azul in 1998, lava passing through vegetated areas has caused small fires, but these have not spread far from the lava tongues themselves before going out. Most of the new flows have passed over unvegetated older lava, and damage to Fernandina's vegetation is limited."
The team also flew over Alcedo volcano on Isabela, where Project Isabela staff had reported increased fumarole activity. Steam was rising from the "new" fumarole sites (active since the 1990s) and from the area of sulfur deposits and fumaroles in the southwestern area of the rim, but this activity did not appear unusual.
On 15 May, the GOES thermal anomaly was gone before noon, but returned near midnight (about 2330), over a smaller area, and it remained through sunrise (0615) on 16 May. Small anomalies were visible the next several nights (when contrast with adjacent cold flows was strongest), but there was no obvious evidence of continued feeding of the new flows.
The complex thermal anomalies detected in MODIS satellite imagery (provided by the University of Hawaii), were abundant around the time of eruption. They spread over Fernandina's rim, in some cases in the caldera, and broadly over the S flank. They continued through at least the rest of May.
The Washington VAAC reported that a weak hotspot started 29 May 2005 at 1945 (30 May at 0145 UTC) and a very short narrow plume of ash and gases appeared in multi-spectral imagery at 2145 (30 May at 0345 UTC). No ground confirmation of an eruption was available, and there was a layer of low-level weather cloud over the island. At that time, the plume appeared to dissipate as it moved away at ~ 18 km/hour.
Information Contacts: Patricio Ramón and Hugo Yepes, Geophysical Institute (IG), Escuela Politécnica Nacional, Apartado 17-01-2759, Quito, Ecuador (URL: http://www.igepn.edu.ec/); Alan Tye, Charles Darwin Research Station, Puerto Ayora, Santa Cruz, Galapagos Islands, Ecuador (URL: http://www.darwinfoundation.org/); Washington Volcanic Ash Advisory Center (VAAC), Satellite Analysis Branch, NOAA/NESDIS E/SP23, NOAA Science Center Room 401, 5200 Auth Road, Camp Springs, MD 20746, USA (URL: http://www.ssd.noaa.gov/); Tom Simkin, Dept. of Mineral Sciences, National Museum of Natural History, Smithsonian Institution, Washington, DC 20013-7012, USA; National Earthquake Information Center, U.S. Geological Survey, Box 25046, DFC, MS 966, Denver, CO 80225-0046, USA (URL: https://earthquake.usgs.gov/); MODIS Thermal Alert System; University of Hawaii and Manoa, 168 East-West Road, Post 602, Honolulu, HI 96822, USA (URL: http://modis.higp.hawaii.edu).
Lava flows from a 10-28 April fissure eruption reach the sea
In early April 2009, Fernandina (also known as La Cumbre volcano) erupted. According to the Ecuador Institute of Geophysics (IG), satellite data suggested that the eruption began sometime between 2200 on 10 April and 0030 on 11 April. The seismic station at Puerto Ayora, on the nearby island of Santa Cruz, recorded no earthquakes associated with this eruption. High numbers of thermal anomalies ended after 28 April. Although no report is available, photos posted by the IG show steam rising from the eruptive fissure, but no active lava emission, on 1 May.
On the morning of 11 April an eruptive column was seen by both a passing tourist boat and Galápagos National Park rangers located on Canal Bolívar. Authorities at the National Park reported both lava flows and ash plumes. A true-color MODIS image taken on the morning of 11 April showed an ash-and-steam plume rising from the area of active lava flows (figure 7).
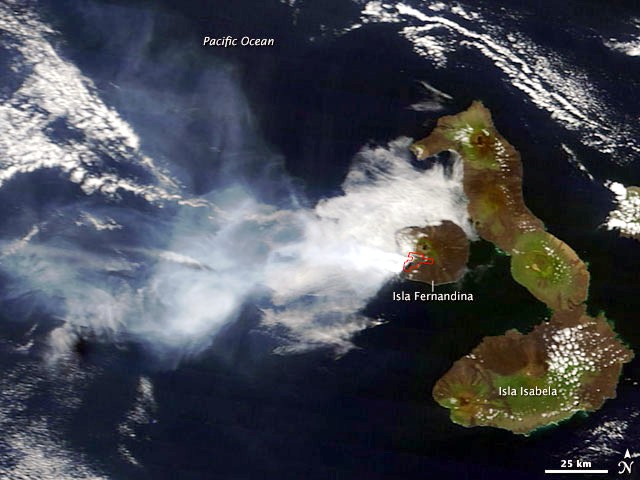 |
Figure 7. Terra MODIS satellite image of volcanic activity on Isla Fernandina, 11 April 2009 (1610 UTC). Its larger neighbor, Isla Isabela, encircles the island's E side. The plume extended over the ocean and diffuse portions remained visible at least 150 km W. The diffuse plume's contours partly cover denser zones of billowy weather clouds. The outline on the SW side of Isla Fernandina shows the margin of the hotspot detected on this date by MODIS. Courtesy of Jeff Schmaltz and Michon Scott, NASA MODIS Rapid Response Team and NASA Earth Observatory. |
Galápagos National Park Rangers conducted a flyover on 13 April 2009 (figure 8) and found the eruption's intensity undiminished. The eruption source was a fissure on the SW flank, in an area ~ 500 m from the summit crater near the site of the 2005 eruption. The fissure was ~ 200 m long and 10 m wide, and ejected lava fountains 15 m high. A gas-and-ash plume drifted SW. Lava traveled several kilometers in a single flow, then downslope it divided into three branches. Further downslope it merged into two flows, both of which reached the ocean. A large column of steam rose where lava poured into the ocean.
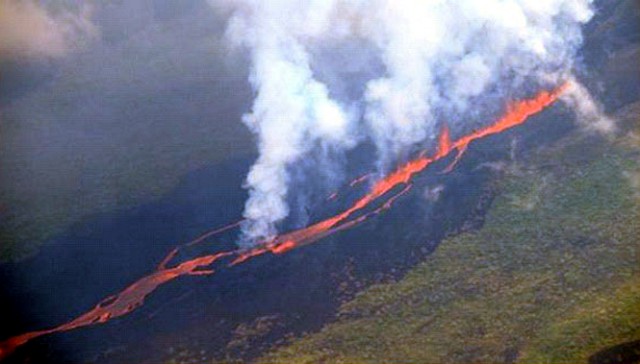 |
Figure 8. Aerial photo of Fernandina, 13 April 2009, showing fountaining lava along a fissure feeding lava flows downslope (left). Courtesy of the Office of Public Relations, Galápagos National Park Service. |
During an overflight on the morning of 15 April, personnel from the Galapagos National Park Service (GNPS) verified that the eruption continued, but with less intensity. Three vents at ~ 400 m elevation on the southwest flank along the radial fissure were active (figure 9), feeding a lava flow up to 10 m wide. The area was free of clouds, making it possible to observe a band of hot water along the coastline of the island, near the point at which the lava enters the ocean. According to a preliminary report from the research vessel sent by the GNPS to the eruption site, the lava has caused deaths among different species of fish and killed several fur seals. During 15-16 April gas-and-steam plumes from Fernandina drifted up to 555 km W.
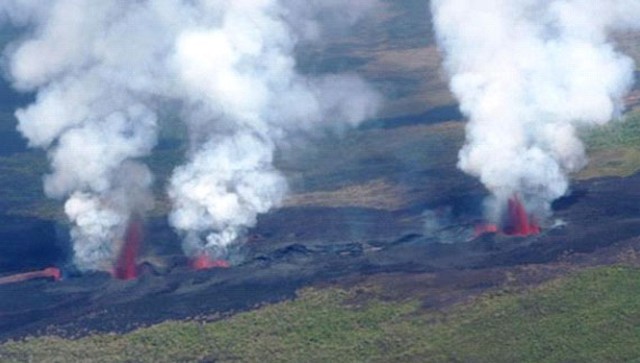 |
Figure 9. Aerial photo of Fernandina, 15 April 2009, showing three active vents along the radial fissure. Courtesy of the Office of Public Relations, Galápagos National Park Service. |
Satellite imagery. Satellite images posted by NASA Earth Observatory showed ash plumes on 11, 12, and 27 April in MODIS imagery. All of the plumes were moving W and interpreted as ash-bearing. Based on analysis of satellite imagery, the Washington VAAC reported that during 11-14 April, gas and possible ash plumes expanded laterally up to both 300 km W and 270 km N. The eruption also produced a substantial plume of sulfur dioxide (SO2) seen in Ozone Monitoring Instrument (OMI) imagery that extended far W of the islands over the Pacific Ocean (figure 10). The Aura image indicated a tentative mass of 1.47 x 10⁵metric tons. NASA's Cloud-Aerosol Lidar and Infrared Pathfinder Satellite Observations (CALIPSO) also detected a substantial low-altitude sulfate aerosol plume at an altitude of ~ 3 km.
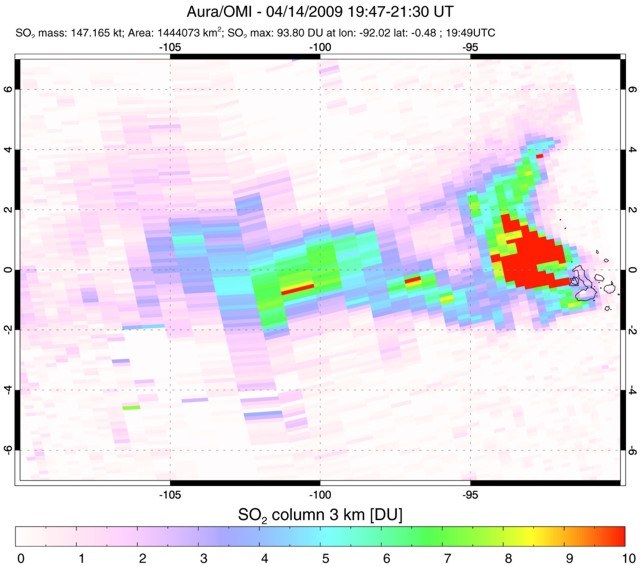 |
Figure 10. Plume of SO2 that extended far W of Fernandina, over the Pacific Ocean, imaged by the Ozone Monitoring Instrument (OMI) on NASA's Aura satellite from 1947-2130 UTC on 14 April 2009. In this image, SO2 is measured in Dobson Units. (See key to shading of colors along bottom edge.) NASA image courtesy Simon Carn. |
MODVOLC Thermal Alerts.Thermal anomalies detected by the MODVOLC system were measured from 11 April to at least 12 May 2009 (figure 11). After the initial widespread pixels on 11 April, the thermal alerts were all located on the SW flank below the caldera, and extended down to the ocean. From 11-28 April, the number of the alerts during any satellite pass was rather large, ranging from 45 pixels at the onset of the eruption to 20 pixels after two weeks. Intermittent anomalies were detected through 21 May 2009.
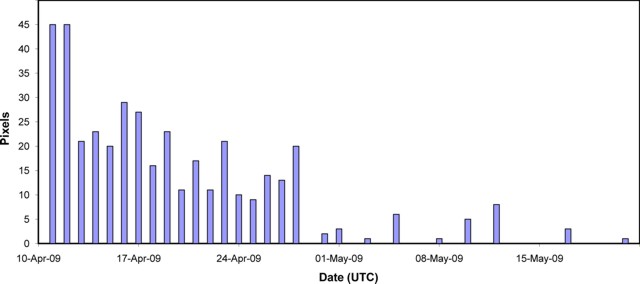 |
Figure 11. Graph showing the largest number of daily MODVOLC thermal alerts at Fernandina, 10 April-22 May 2009. For many of the days during this event, thermal alerts were measured in 3-4 satellite crossings; only the crossing with the highest number of pixels per day were selected for the graph. Data courtesy of Hawai'i Institute of Geophysics and Planetology (HIGP) Thermal Alerts System. |
Information Contacts: Geophysical Institute (IG), Escuela Politécnica Nacional, Apartado 17-01-2759, Quito, Ecuador (URL: http://www.igepn.edu.ec/); Galápagos National Park Service, Ministry of the Environment, Isla Santa Cruz, Galápagos, Ecuador (URL: http://www.galapagospark.org/); Galapagos Conservancy, 11150 Fairfax Blvd, Suite 408, Fairfax, VA 22030, USA (URL: http://www.galapagos.org/); Washington Volcanic Ash Advisory Center (VAAC), Satellite Analysis Branch, NOAA/NESDIS E/SP23, NOAA Science Center Room 401, 5200 Auth Road, Camp Springs, MD 20746, USA (URL: http://www.ssd.noaa.gov/); Hawai'i Institute of Geophysics and Planetology (HIGP) Thermal Alerts System, School of Ocean and Earth Science and Technology (SOEST), Univ. of Hawai'i, 2525 Correa Road, Honolulu, HI 96822, USA (URL: http://modis.higp.hawaii.edu/); Simon Carn, Dept of Geological and Mining Engineering and Sciences, Michigan Technological University, 1400 Townsend Dr., Houghton, MI 49931, USA (URL: https://so2.gsfc.nasa.gov/); NASA Earth Observatory (URL: http://earthobservatory.nasa.gov/).
Thermal and gas analyses of April 2009 eruption
Silvana Hidalgo and Patricia Mothes of the Ecuador Instituto Geofisco, Escuela Politécnica Nacional (IG-EPN) (Geophysical Institute, National Polytechnic School) sent an informal report on gas and temperature measurements during the final stage of the April 2009 eruption of Fernandina (Bourquin and others, 2009). Our last report on Fernandina in April 2009 (BGVN 34:04) discussed this eruption. The following information came from that document.
The 2009 Fernandina volcano eruption, beginning 11 April 2009, was characterized by an extensive lava outpouring on the SW flank and sulfur dioxide (SO2) gas emission. First eyewitnesses reported an eruptive column on the morning of 11 April. Thermal and SO2 anomalies were shown by MODIS and AURA satellites, respectively. Rangers from the Galápagos National Park Service (GPNS) found the active eruptive fissure during a flight on 13 April 2009 (figure 12) . That fissure was near the 2005 eruptive fissure (BGVN 30:04). The 2009 fissure was ~ 200 m long and 10 m wide, and ejected lava fountains 15 m high. A gas and ash plume drifted SW, and a steam plume rose where the lava flow poured into the ocean (figure 13).
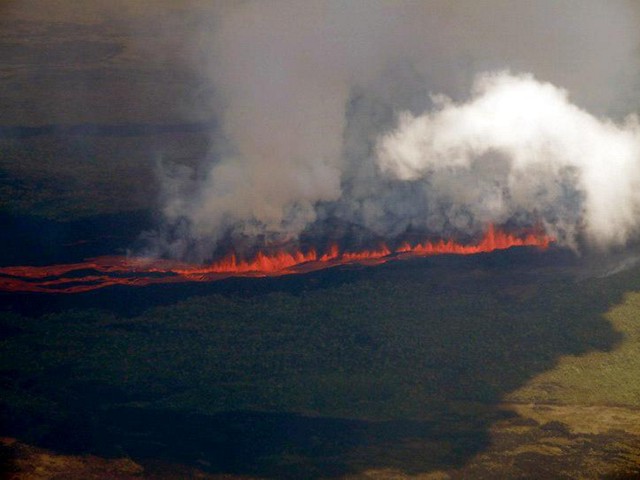 |
Figure 12. Aerial photograph taken 13 April 2009 of the eruptive fissure seen as a horizontal band with a curtain of lava fountains during the Fernandina eruption. Courtesy of Oscar Carvajal, GNPS ranger; from (Bourquin and others, 2009). |
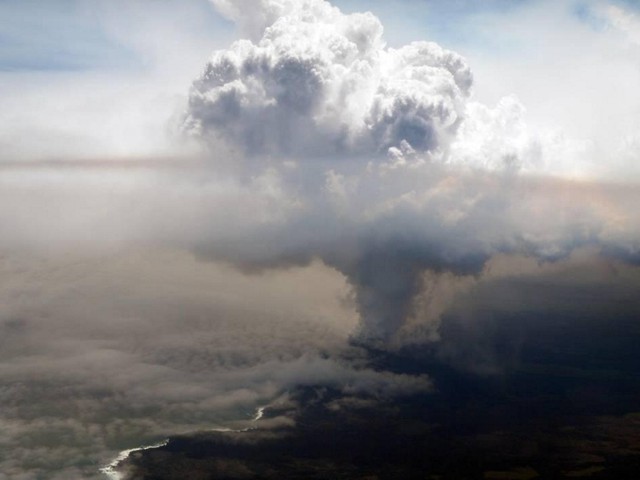 |
Figure 13. Aerial photograph taken 13 April 2009 of the steam plume caused by lava flowing into the ocean during the Fernandina eruption. Courtesy of Oscar Carvajal, GNPS ranger; from (Bourquin and others, 2009). |
During a flight on the morning of 15 April, personnel from the GNPS verified that the eruption continued, but with lower intensity than in the days before. Three vents discharging lava at ~ 400 m elevation on the SW flank along a radial fissure were active, feeding a lava flow up to 10 m wide. During 15-16 April, gas-and-steam plumes from Fernandina drifted up to 555 km W.
The images recorded by the OMI (ozone monitoring instrument) satellite-borne platform showed a drastic decrease of activity after 16 April and a new increase on the 23 April (there was no data between 19 and 23 April due to a satellite update). This decrease in the eruption intensity correlated with a drop in the number of thermal alerts detected by MODIS satellite. The eruption ended on 28 April 2009.
A field campaign was conducted by IGEPN from 27 April to 5 May 2009 to compare ground results with satellite data. Measurements of the SO2 associated with the eruption were conducted 29-30 April. At this time the eruption was nearing completion; the scientists were unable to make field measurements of the high SO2 fluxes during the earlier, more vigorous eruption phase.
SO2 measurements. The SO2 measurements were carried on using a mobile-DOAS (differential optical absorption spectroscopy) instrument composed of a small, upward-looking telescope, connected by optical fiber to a spectrometer and a GPS (global positioning system) receiver (figure 14). The measurements were performed during several traverses around the eruption vent using a small boat supplied by the Galápagos National Park. One traverse along the W side (downwind side) of the island, conducted on 29 April 2009, found a SO2 flux maximum measurement of 2,997 tons/day. On 30 April, a traverse along the S and SW side of the island measured 527 tons/day. The IG-EPN report gave more detailed data on all measurements in support of the SO2 program made during the 2-day survey.
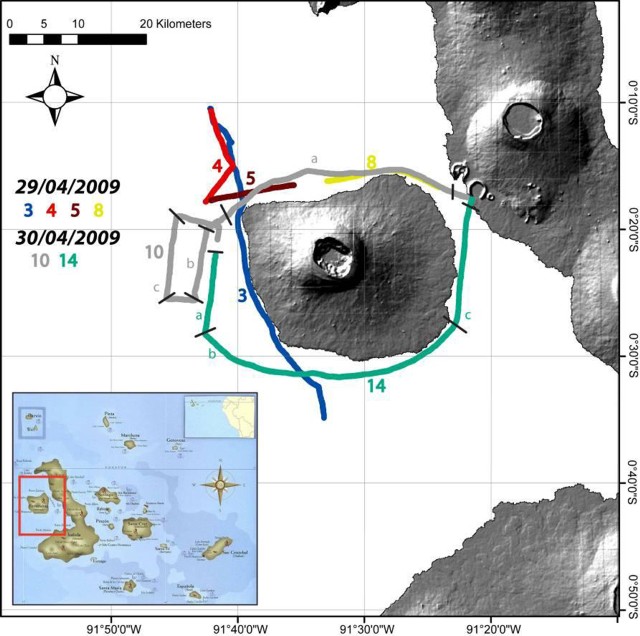 |
Figure 14. Shaded relief map [digital elevation model (DEM)] of Fernandina Island including the NW part of Isabela to the E. The labeled lines correspond to the small boat traverses done on 29-30 April 2009 to measure environmental properties for SO2 flux analyses. Courtesy of Bourquin and others, 2009. |
Ozone monitoring instrument (OMI) satellite images showed degassing from 11-16 April 2009, with the higher SO2 values on 12 and 14 April. This degassing was associated with ash emission observed with MODIS satellite (shown in BGVN 34:04). From 17-19 April almost no SO2 was visible in the satellite images. After 4 days without data, satellite images showed a high SO2 emission on 23 April, increasing until 25 April when the eruption began its decline. After this date, and for the days when the field measurements were conducted, little SO2 was present in the atmosphere.
Thermal measurements. The team made measurements using a forward looking infrared (FLIR) thermal camera during a flight over the zone covered by the fresh lava flows (figure 15, table 2). These measurements, associated with post eruption satellite images, allowed an estimation of the area covered by the eruption products.
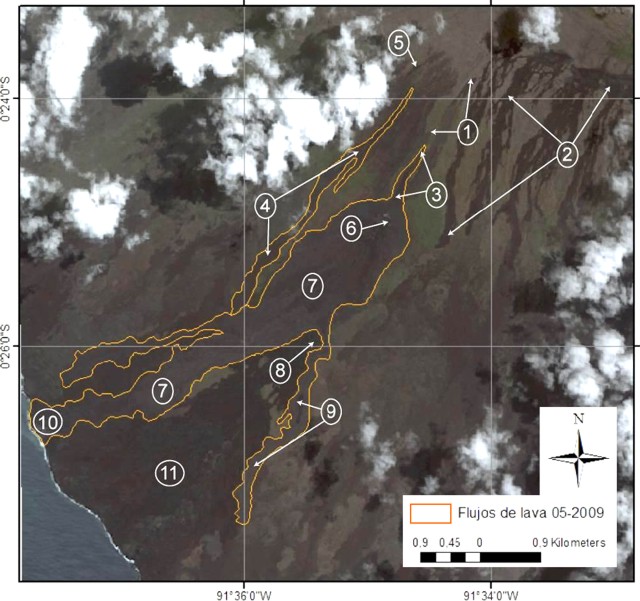 |
Figure 15. High-resolution satellite image after the April 2009 Fernandina eruption identifying individual lava flows and other points of interest. Courtesy of Bourquin and others (2009). |
Table 2. Description of points of interest at Fernandina from comparison of satellite thermal images and lava flow photographs. Location numbers correspond to the numbered points in figure 15. Courtesy of Bourquin and others (2009).
| Event | Location Number | Comments |
| 1995 eruption (radial fissure) | 1 | Upper vents at elevation of ~1,000 and ~750 m with the associated lava flows. |
| 2005 eruption (circumferential fissure) | 2 | Upper vents with the associated lava flows. |
| 2009 eruption (radial fissure) | 3 | Upper vents at elevation of ~550 m covering part of the 1995 eruptive fissure and lava flows; vents displayed activity during the first overflight (13 April 2009) (figure 16); maximum apparent temperature measured with the thermal camera was 179.3°C. |
| 2009 eruption (radial fissure) | 4 | Upper vents at elevation of ~700 m located to W of 1995 eruptive fissure; vents active during the first flight (13 April 2009); maximum apparent temperature measured with the thermal camera was 67°C. |
| 2009 eruption | 5 | Dark grey patch not observed on images previous to April 2009 eruption; might correspond to a short-life vent with small lavas. |
| 2009 eruption (radial fissure) | 6 | Principal vents at elevation of ~500 m; last visual observation of incandescence was on 29 April 2009 during; measurements with the thermocouple in a 50 cm crack and greater-than-30-m-long crack gave maximum temperature of 970°C. |
| 2009 eruption | 7 | Area covered by principal April 2009 lava flows that reached the sea; maximum apparent temperature measured with the thermal camera was 131.9°C. |
| 1995 eruption (radial fissure) influence 2009 lava flow | 8 | Principal 1995 vent; during the first part of 2009 eruption, lava flowed W to this vent and reached the ocean; after a while, it changed its course and flowed E to the vent but never reached the ocean. |
| 1995 lava field and 2009 lava flow | 9 | SE lobe of the 2009 lava flow borders 1995 lava field and ends 1,800 m before entering into the ocean; maximum apparent temperature measured with the thermal camera was 70.9°C (figure 17). |
| 2009 eruption | 10 | April 2009 lava flows entered into the ocean the first days of the eruption; this region of the lava flows is 800 m-wide (figure 18); maximum apparent temperature measured with the thermal camera was 132°C. |
| 1995 eruption | 11 | 1995 eruption lava field. |
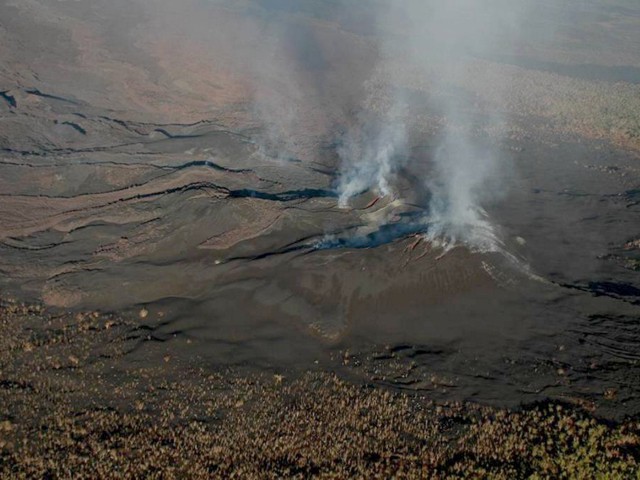 |
Figure 16. Aerial photo showing the upper fissure and the principal vents of the April 2009 Fernandina eruption. Courtesy of Bourquin and others (2009). |
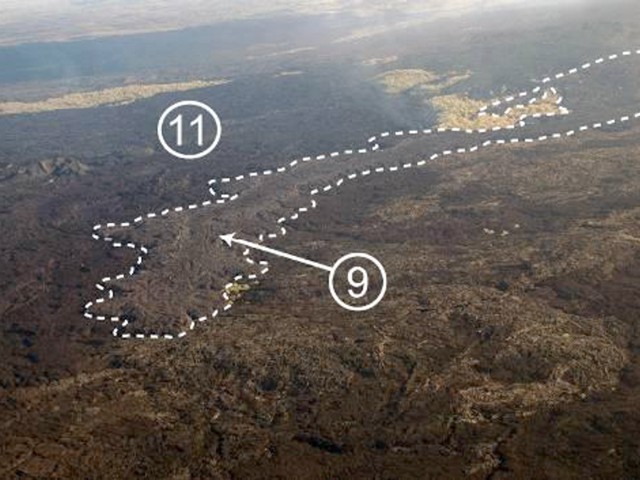 |
Figure 17. Photograph of SE lava flow (area 9) from the April 2009 Fernandina eruption. Area number 11 corresponds to the 1995 eruption lava field. Courtesy of Bourquin and others (2009). |
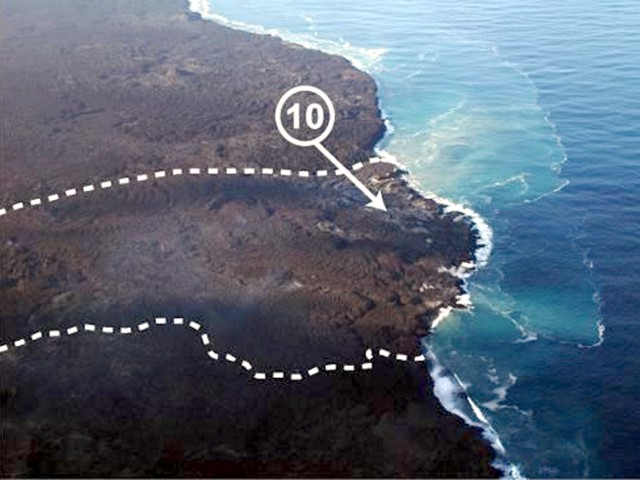 |
Figure 18. Photograph of lava flow entering the ocean on the SW coast (area 10) from the April 2009 Fernandina eruption. Courtesy of Bourquin and others (2009). |
Estimation of the area covered. The area covered by the April 2009 Fernandina volcano eruption was estimated using (1) thermal images taken with the infrared camera FLIR during the overflight of 1 May 2009, (2) QUICKBIRD satellite image (browse image visible; 11 May 2009), (3) ASTER satellite image (16 May 2009), (4) photographs taken by the personal of IGEPN and GNPS during the overflight of 1 May 2009, and (5) a Digital Elevation Model (DEM) provided by the IGEPN. Thanks to the strong thermal contrast between the new products and the older lava flows, it was possible to map precisely the limits of April 2009 eruption.
The thermal contrast information was stacked on the satellite images and the area has been calculated with the help of the DEM (figure 19). The area covered by the April 2009 eruption is of about 6.7 km2 which is a value similar to the 1995 eruption (6.5 km2; Rowland and others, 2003). Unfortunately no thickness measurements are available for the April 2009 lava flows. Nevertheless, considering the similarities between both eruptions, IGEPN scientists used the average thickness calculated by Rowland and others (2003) for the 1995 eruption (8.5 ? 2 m), to calculate the 2009 eruption volume. It gives an approximate volume of 57 ? 13 million m3 of lava emitted. This volume is equivalent to those of 1995 and 1988 but the emission rates were drastically different. This estimation has to be taken carefully as no thickness measurement was done during the fieldwork.
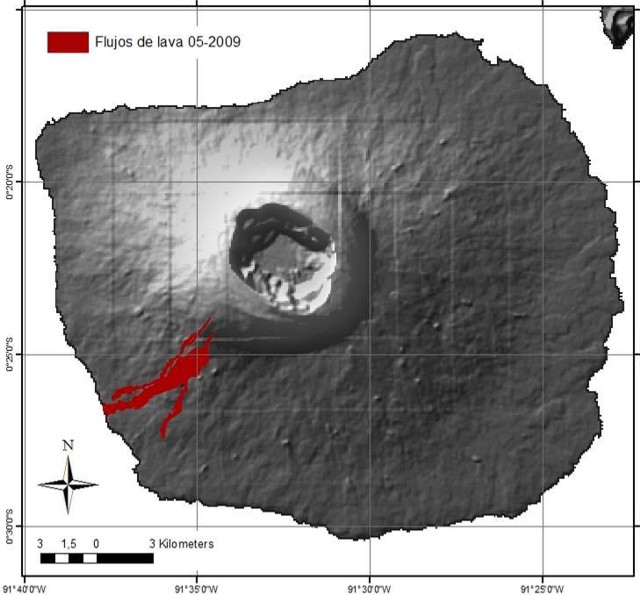 |
Figure 19. Map of Fernandina showing the extent of the April 2009 lava flows extending down the SW flank to the ocean. Courtesy of Bourquin and others (2009). |
Satellite thermal data. As shown in BGVN 34:04, from 11 April to 22 June 2009 MODVOLC detected 789 hot-spots on Fernandina Island with 725 during the time of the eruption and 64 after it. The number of thermal alerts was the highest for 12 April and then decreased until the end of the eruption. At least three episodes of high effusion occurred, during 11-14, 16-19, and 28 April. Comparing these observations with the OMI satellite images, the first two effusive episodes were accompanied by high SO2 emissions, but not the last one. This could be due to an artifact on the OMI satellite image for 28 April. The decreasing number of thermal alerts after 28 April is thought to illustrate the cooling of the lava flows, as they are not associated with SO2 emissions.
Eruption photos. The smugmug.com website shows a number of photos of the April 2009 Fernandina eruption from offshore. According to the website, the vessel carrying the photographers was restricted from sailing to visit the side of Fernandina Island where the volcano was erupting in mid-April. On 19 April the vessel was given permission by the Galapagos National Park to see the volcano. The boat anchored ~ 1.6 km offshore and the photographers boarded small boats to get within ~ 90 m of where the lava was pouring into the sea (figures 20 and 21).
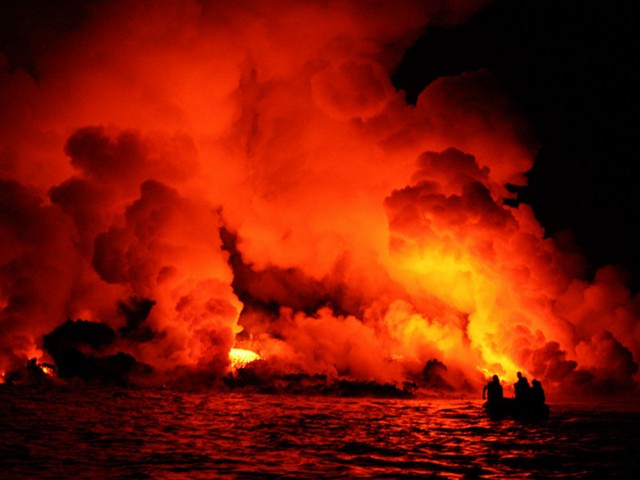 |
Figure 20. Night photo of the ocean entry area at Ferandina taken 19 April 2009. In this photo a small boat is apparent in the right midground, with silhouettes of people highlighed by incandescence in the background. Courtesy of smugmug; the photographer's name was not specified on that website. |
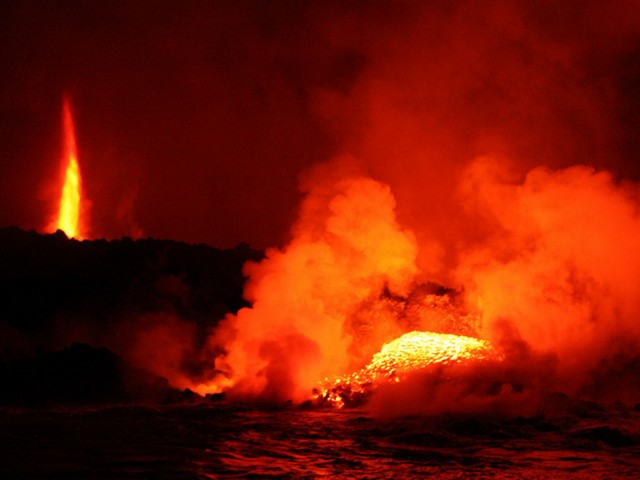 |
Figure 21. Photo of the ocean entry area at Fernandina taken 19 April 2009. In this photo the red-orange lava about to enter the ocean is apparent at right and at elevation on the left appears a a fountain jets towards the night sky. Courtesy of smugmug; the photographer's name was not specified on that website. |
References. Bourquin, J., Hidalgo, S., Bernard, B., Ramón, P., Vallejo, S., and Parmigiani, A, 2009, April 2009 Fernandina volcano eruption, Galápagos Islands, Ecuador: SO2 and thermal field measurements compared with satellite data: Informal report, Instituto Geofisco Escuela Politécnica Nacional (IGEPN).
Rowland, S.K., Harris, A.J.L., Wooster, M.J., Amelung, F., Garbeil, H., Wilson, L, and Mouginis-Mark, P.J., 2003, Volumetric characteristics of lava flows from interferometric radar and multispectral satellite data: The 1995 Fernandina and 1998 Cerro Azul eruptions in the western Galápagos: Bulletin of Volcanology, v. 65, no. 5, p. 311-330.
Information Contacts: Silvana Hidalgo and Patricia Mothes, Instituto Geofisco Escuela Politécnica Nacional (IGEPN) (Geophysical Institute, National Polytechnic School), Casilla 1701-2759, Quito, Ecuador (URL: http://www.igepn.edu.ec/); Hawai'i Institute of Geophysics and Planetology (HIGP) Thermal Alerts System, School of Ocean and Earth Science and Technology (SOEST), Univ. of Hawai'i, 2525 Correa Road, Honolulu, HI 96822, USA (URL: http://modis.higp.hawaii.edu/); Kevin L. Bailey (URL: http://www.wildphotopics.com/International/Galapagos-Islands-and-Quito/Fernandina-Island-La/i-JZ5VQh6).
Brief fissure eruption sends lava flow down the SW flank in early September 2017
Eruptions at Fernandina Island in the Galapagos often occur from vents located around the caldera rim along boundary faults and fissures, and occasionally from side vents on the flank. The last eruption in 2009 generated fountaining basaltic lava along several fissure vents. Lava flowed down the SW flank and entered the sea for a few weeks during April 2009. A new eruption began on 4 September 2017 after eight years of no surface activity, and lasted for about one week. Information about this new eruption was provided by Ecuador's Institudo Geofisica, Escuela Politécnica Nacional (IG-EPN), the Dirección del Parque Nacional Galápagos (DPNG), the Washington Volcanic Ash Advisory Center (VAAC), and several sources of satellite data.
A brief fissure vent eruption began on 4 September 2017 at Fernandina, located at the SW rim of the caldera. Small amounts of ash were noted in the plume that rose 2.5 km, but most of the emission was steam and SO2. Vegetation fires were ignited on the SW flank, but lava did not reach the ocean. There was no sign of volcanic activity within the summit crater. A significant area with thermal anomalies was seen in infrared satellite data through 7 September.
Eruption of early September 2017. After eight years of little activity, Fernandina (La Cumbre) began a new eruptive phase on 4 September 2017, at approximately 1225 (Galápagos time) (figure 22). Inflation between March 2015 and September 2017 was 17 cm centered on the caldera; 5 cm of that inflation occurred in the last two months before the eruption (figure 23).
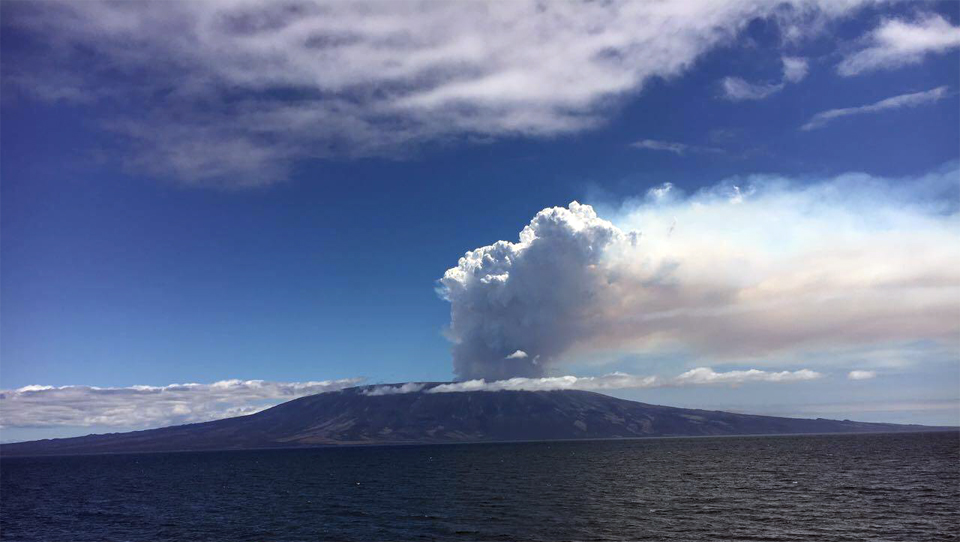 |
Figure 22. Fernandina began a new eruption on 4 September 2017. The initial plume was mostly steam, but contained significant SO2 and possibly minor ash. Photo by DPNG personnel, courtesy of IG-EPN (INFORME ESPECIAL VOLCÁN FERNANDINA N°1 – 2017, Lunes, 04 Septiembre 2017 16:49). |
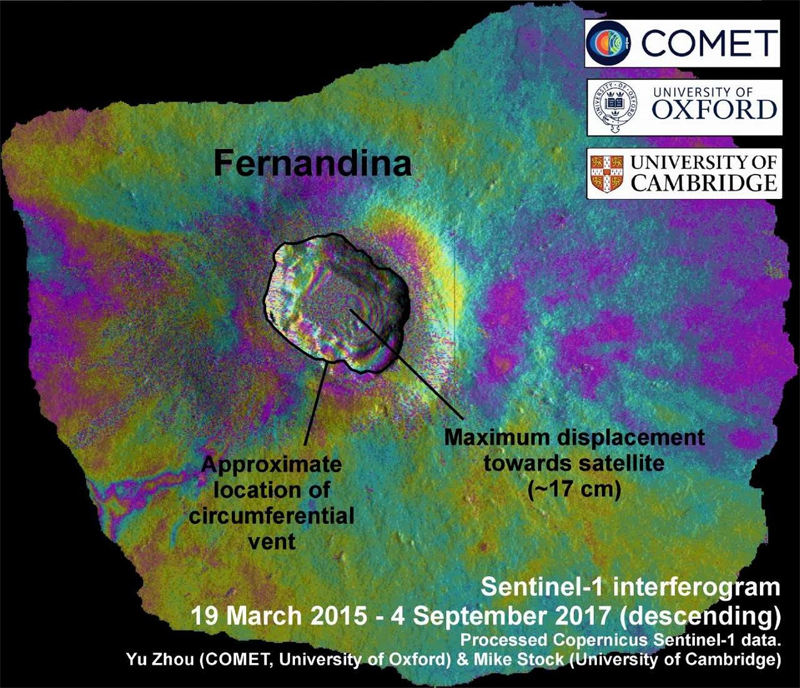 |
Figure 23. Interferogram image of Fernandina between 19 March 2015 and 4 September 2017 shows about 17 cm of inflation in the caldera. Each concentric band of colors within the caldera represents several centimeters of inflation. Created by Yu Zhou and Mike Stock, courtesy of IG-EPN (INFORME ESPECIAL DEL VOLCÁN FERNANDINA N°2 – 2017, Miércoles, 06 Septiembre 2017 17:16). |
Seismic activity began with hybrid-type earthquakes (fractures with fluid movements) followed by Long Period (LP) earthquakes (fluid movements). The seismic network of the Geophysical Institute installed in the Galapagos began to detect activity at the volcano around 0955 on 4 September 2017. The beginning of the eruption was associated with a volcanic tremor that began at 1225. At 1428, an eruptive column was visible in satellite imagery, interpreted at an approximate height of 4,000 m above the crater, drifting WNW (figure 24).
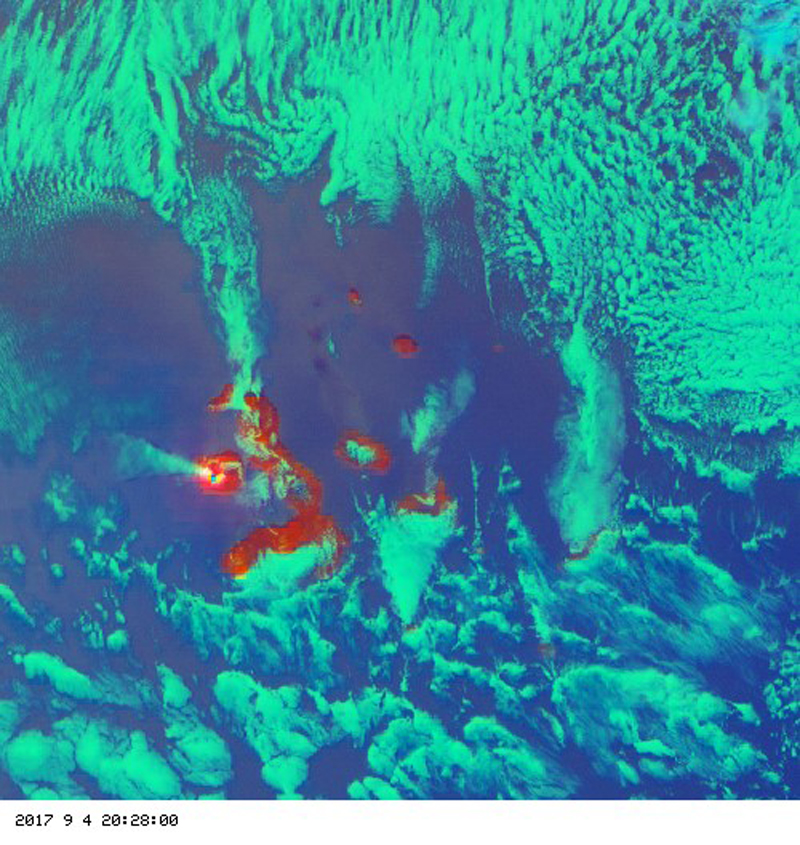 |
Figure 24. This false-color satellite image of Fernandina on 4 September 2017 showed the eruption column drifting NW estimated at 4,000 m altitude. Source: http://goes.higp.hawaii.edu/cgi-bin/imageview?sitename=galapagos. Courtesy of IG-EPN (INFORME ESPECIAL VOLCÁN FERNANDINA N°1 – 2017, Lunes, 04 Septiembre 2017 16:49). |
The Washington VAAC reported that satellite imagery indicated a lava eruption which produced a plume of steam and gas that rose to 2,400 m above sea level and extended about 60 km W of the summit. While initially no ash was reported in the plume, a few hours later a new VAAC report suggested that minor ash was possibly present, although it was most likely primarily SO2. Satellite data reported by the NASA Goddard Space Flight Center showed SO2 emissions on 4-6 and 8 September (figure 25).
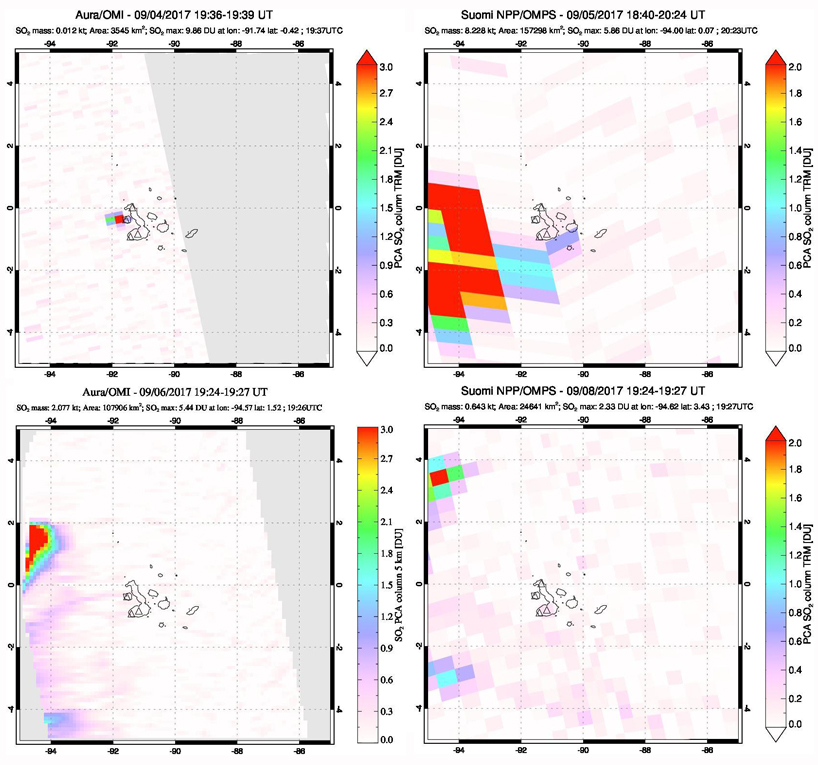 |
Figure 25. SO2 emissions from Fernandina were identified with the OMI instrument on the Aura satellite and the OMPS instrument on Japan's Suomi satellite during 4-8 September 2017. Upper left: A small SO2 emission emerges very close in time to the first reported observation of the eruption on 4 September. Upper right: The low-resolution OMPS image clearly shows a large plume drifting W about 24 hours later. Lower left and right: SO2 is present NW of the Galapagos over the eastern Pacific on 6 and 8 September. Courtesy of NASA Goddard Space Flight Center. |
Thermal alerts indicative of fresh lava flows from the rim of the summit crater were first reported by MODVOLC on 4 September 2017 (UTC), and abundant through 7 September (figure 26). No thermal anomalies were recorded in MODVOLC data on 8 September. An additional group of alert pixels was recorded on 9 September, but it's not clear if they were caused by fresh lava flows or burning fires; a few more intermittent pixels were recorded through 20 September. The MIROVA system also captured a significant spike in heatflow at Fernandina during the same period (figure 27). Some of the anomalies measured by both systems were likely the result of the fires caused by the lava flows as well as the flows themselves.
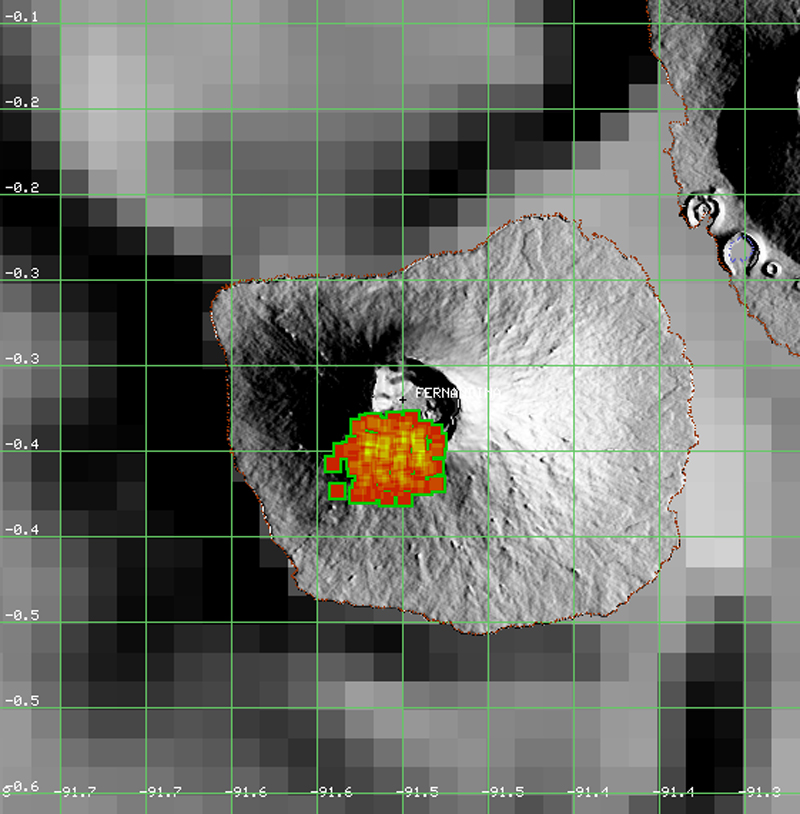 |
Figure 26. Map showing the location of new lava flows at Fernandina during 4-7 September 2017 using MODVOLC thermal alerts. Fires may have caused some of the alert pixels. Courtesy of HIGP MODVOLC Thermal Alerts System. |
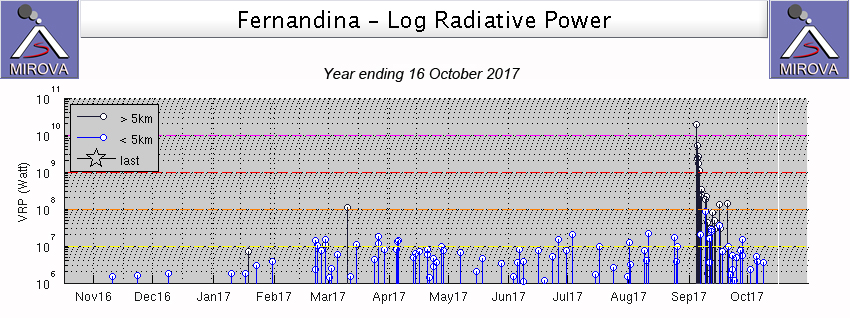 |
Figure 27. MIROVA thermal anomalies show a spike in activity at Fernandina during the period of the September 2017 eruption in this graph of log radiative power for the year ending on 16 October 2017. The initial spike that was located more than 5 km from the summit confirms the lava flows were located on the crater rim and flank and not in the summit crater. Some anomalies may also be due to the fires caused by the lava flows. Courtesy of MIROVA. |
Incandescence was first observed during the night of 4 September (figure 28). Lava flows apparently originated from a circumferential fissure near the fissure of the 2005 eruption on the SSW rim of the caldera. The lava flowed down the S and SW flanks but did not reach the sea. Active lava flows were observed during the night of 5 September (figure 29). The intensity of the eruption decreased significantly after about 48 hours.
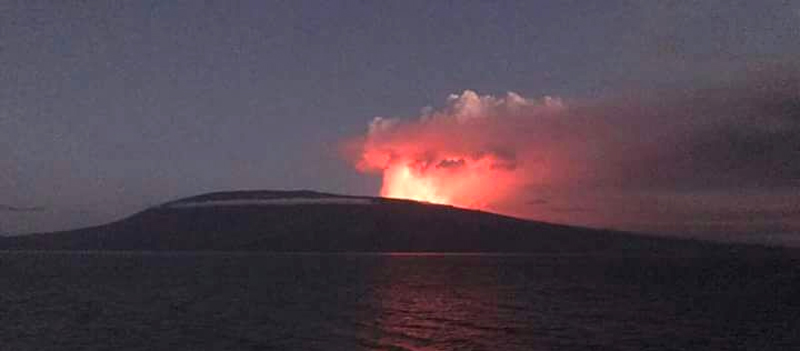 |
Figure 28. Incandescence at Fernandina on 4 September 2017. Photo by Alex Medina, courtesy of IG-EPN (INFORME ESPECIAL DEL VOLCÁN FERNANDINA N°2 – 2017, Miércoles, 06 Septiembre 2017 17:16). |
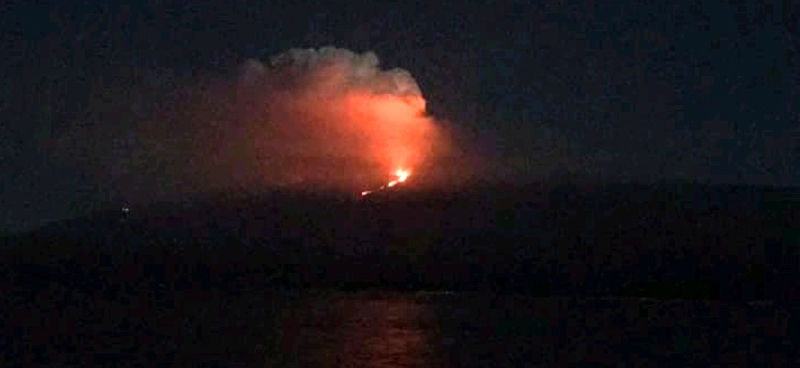 |
Figure 29. A lava flow is visible on the SW flank of Fernandina on 5 September 2017. Photo by Alex Medina, courtesy of IG-EPN (INFORME ESPECIAL DEL VOLCÁN FERNANDINA N°2 – 2017, Miércoles, 06 Septiembre 2017 17:16). |
A technical team from the Directorate of the Galapagos National Park (DPNG) made an aerial inspection using the seaplane Sea Wolf on 7 September 2017. They observed a radial fissure in the same area where the 2005 eruption occurred, and several lava flows. No recent volcanic activity or any landslides were seen inside the caldera. The lava flows had ceased movement, but there were isolated fires burning patches of vegetation surrounded by older lava flows (figures 30 and 31). The lava had traveled from the summit crater at about 1,200 m down to 500 m elevation. While lava was not observed flowing into the sea, coastal monitoring by the park rangers showed water vapor on the SW coast, so it was possible that lava had reached the ocean through subsurface lava tubes.
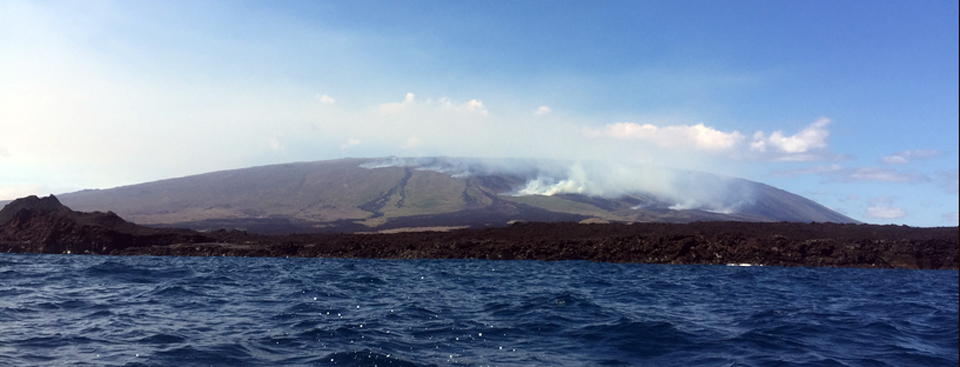 |
Figure 30. Lava flows burn vegetation on Fernandina during the eruption of September 2017. Observers on a 7 September 2017 flyover by DPNG reported that the active flows had ceased, but vegetation was burning at four different sites. Courtesy of Directorate of the Galapagos National Park (DPNG) (11/09/2017– Sobrevuelo al volcán La Cumbre, en Galápagos). |
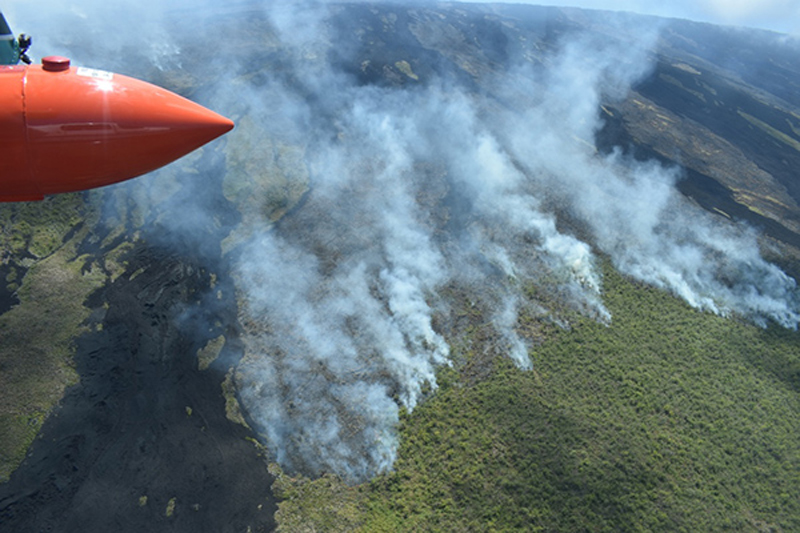 |
Figure 31. Vegetation on Fernandina burns on 7 September 2017 after lava flows erupted beginning on 4 September 2017. There was no evidence of flowing lava during the overflight. Courtesy of the Galapagos Conservancy. |
Information Contacts: Instituto Geofísico (IG-EPN), Escuela Politécnica Nacional, Casilla 17-01-2759, Quito, Ecuador (URL: http://www.igepn.edu.ec ); Dirección del Parque Nacional Galápagos (DPNG), Isla Santa Cruz, Galápagos, Ecuador (URL: http://www.galapagos.gob.ec/); MIROVA (Middle InfraRed Observation of Volcanic Activity), a collaborative project between the Universities of Turin and Florence (Italy) supported by the Centre for Volcanic Risk of the Italian Civil Protection Department (URL: http://www.mirovaweb.it/); Hawai'i Institute of Geophysics and Planetology (HIGP), MODVOLC Thermal Alerts System, School of Ocean and Earth Science and Technology (SOEST), Univ. of Hawai'i, 2525 Correa Road, Honolulu, HI 96822, USA (URL: http://modis.higp.hawaii.edu/); NASA Goddard Space Flight Center (NASA/GSFC), Global Sulfur Dioxide Monitoring Page, Atmospheric Chemistry and Dynamics Laboratory, 8800 Greenbelt Road, Goddard, Maryland, USA (URL: http://so2.gsfc.nasa.gov/index.html ); Galapagos Conservancy, (URL:https://www.galapagos.org).
Brief eruptive episode 16-22 June 2018, lava flows down N flank into the ocean
Eruptions at Fernandina Island in the Galapagos often occur from vents located around the caldera rim along boundary faults and fissures, and occasionally from side vents on the flank. The last eruption in September 2017 lasted for about one week and originated from a fissure at the SW rim of the caldera. A new eruption in June 2018 lasted for less than a week and originated from a fissure on the N flank of the volcano. Information about the latest eruption was provided by Ecuador's Institudo Geofisica, Escuela Politécnica Nacional (IG-EPN), the Dirección del Parque Nacional Galápagos (PNG), the Washington Volcanic Ash Advisory Center (VAAC), and several sources of satellite data.
A seismic swarm on 16 June 2018 preceded a brief eruptive episode at Fernandina that lasted from 16 to 22 June. Lava erupted from a radial fissure and quickly flowed to the sea down the N flank. Emissions were primarily gas with low ash content and included substantial SO2. After two days of activity, seismicity returned to background levels on 18 June. Park Officials reported only cooling flows and lava no longer entering the sea by 21 June 2018.
Eruption of June 2018. The first evidence of a new eruptive event at Fernandina began as a seismic swarm on 16 June 2018. The largest event (M 4.1) was located 4 km off the NE flank of the island. An active eruption was confirmed a few hours later by guides on a passing boat and by satellite images which indicated a thermal anomaly on the N flank. The eruption consisted of a lava flow on the NNE flank and a gas plume that rose 2-3 km and drifted SW (figure 32). The lava flow quickly reached the ocean, generating steam and gas explosions that were visible from Canal Bolívar, the narrow channel on the NE side of Isla Fernandina that separates it from Isla Isabela (figure 33).
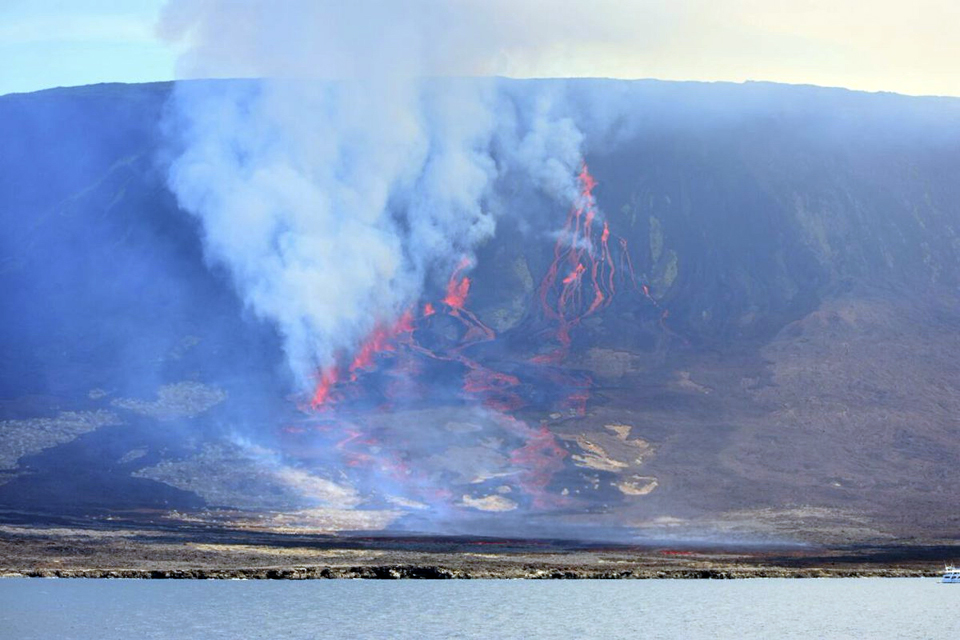 |
Figure 32. Lava from a new eruption at Fernandina flowed quickly down the N flank of the island to the ocean on 16 June 2018, according to Parque Nacional Galapagos officials. Courtesy of Parque Nacional Galapagos. |
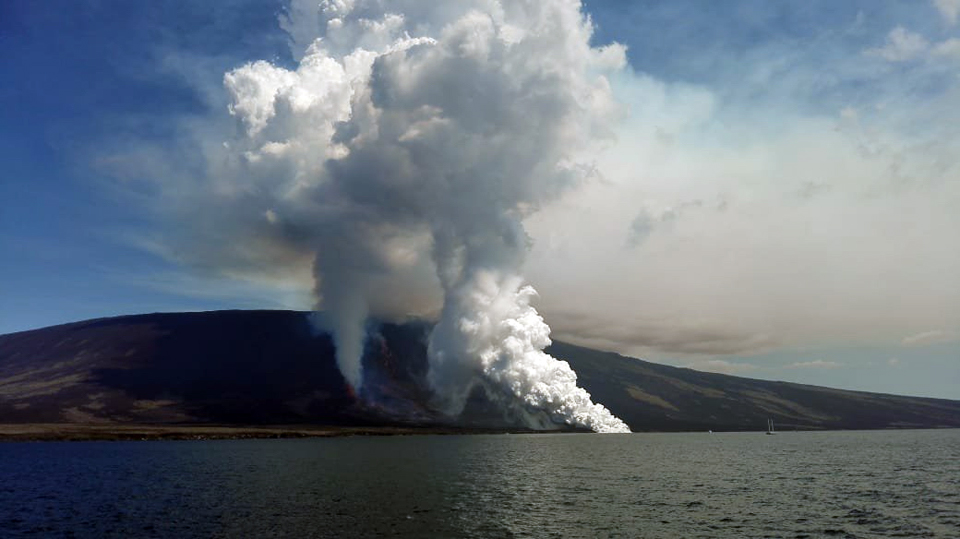 |
Figure 33. Explosions produced large plumes of steam as lava reached the ocean on the N flank of Fernandina on 16 June 2018. Courtesy of Parque Nacional Galapagos. |
Observations by PNG officials and visitors indicated that lava flows came from a radial fissure on the NNE flank, and produced gas plumes with low ash content that rose 2-3 km and drifted more than 250 km WNW (figures 34 and 35). The Washington VAAC detected an ash and gas plume in visible satellite imagery drifting W from the summit at 2.4 km altitude late in the day on 16 June, along with a significant thermal signature in infrared imagery. A second gas-and-ash plume at the same altitude drifted WNW the following day for a few hours before dissipating. After two days of intense eruptive activity, seismic tremor activity had declined significantly to background levels by noon on 18 June.
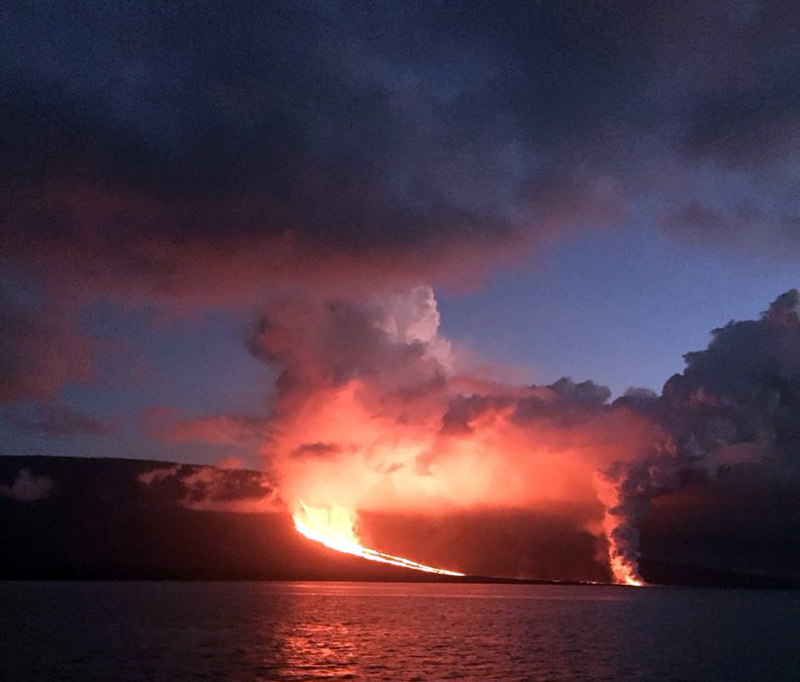 |
Figure 34. Incandescent lava flows from the eruption of Fernandina produced large plumes of water vapor as they reached the sea during the evening of 16 June 2018. Courtesy of Parque Nacional Galapagos. |
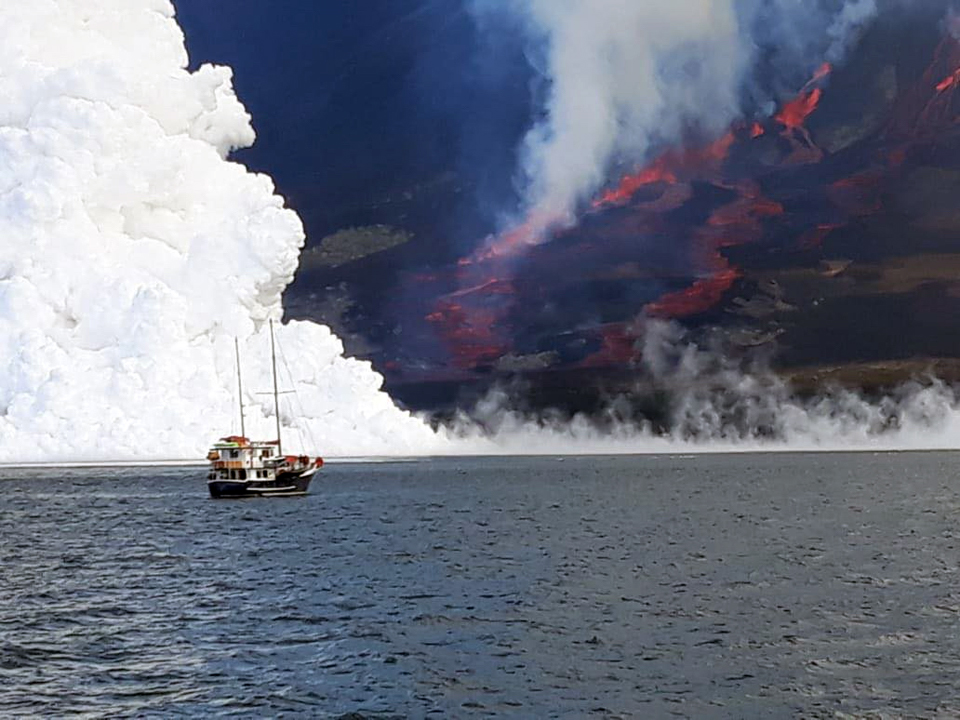 |
Figure 35. Incandescent lava reached the sea during 16-18 June 2018 at Fernandina from a brief eruptive episode. The lava flowed down the N flank. Courtesy of CNH Tours, posted 20 June 2018. |
A strong pulse of SO2 emissions that drifted W was recorded by satellite instruments on 17 and 18 June 2018 (figure 36). The MODVOLC thermal alert system also recorded a surge of over 100 thermal anomalies from infrared satellite imagery that lasted from 17 to 22 June. More than half of the anomalies appeared on 17 June. The alert pixels were all clustered on the N flank. The MIROVA system also record the spike in thermal activity on 17 June and indicated that the heat source was more than 5 km from the summit (figure 37).
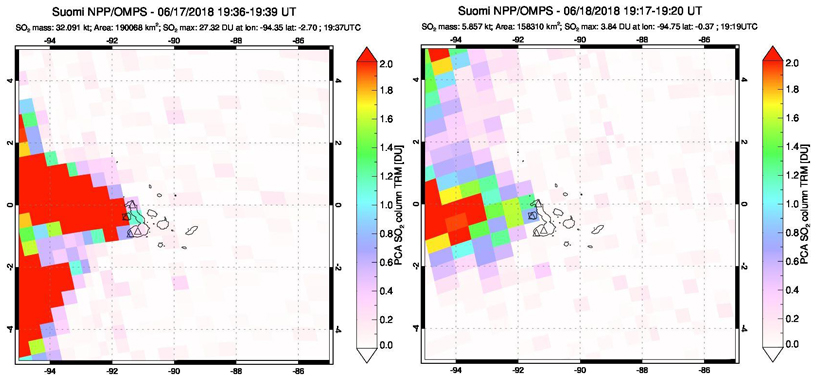 |
Figure 36. A strong pulse of SO2 issued from Fernandina on 17 June 2018 and was recorded by the OMPS instrument on the SUOMI NPP satellite. The plume drifted W and measured at about 27 Dobson Units (DU). Courtesy of NASA Goddard Space Flight Center. |
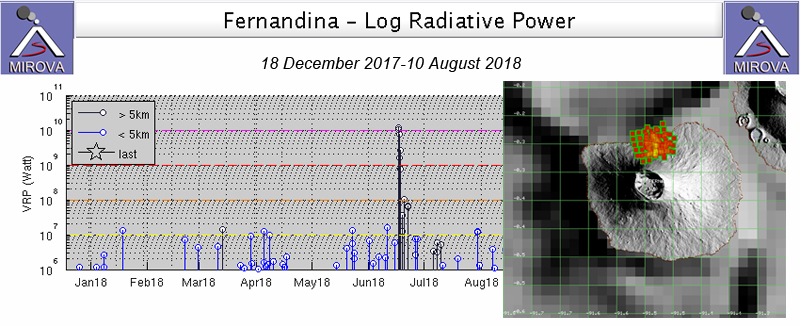 |
Figure 37. The MIROVA system log radiative power measurement for Fernandina showed a spike of thermal activity on 16-17 June 2018 that coincided with the fissure eruption that sent lava flows down the N flank of the volcano into the sea. The black bars indicate a heat source more than 5 km from the summit. The MODVOLC thermal alert system detected over 100 thermal alerts at Fernandina between 17 and 22 June 2018, concurring with observations of lava flows on the N flank of the volcano. Courtesy of MIROVA and MODVOLC. |
By 21 June 2018 PNG officials reported that lava was no longer reaching the ocean, but steam from cooling flows was visible at the coastline and over the area of the new flows (figure 38).
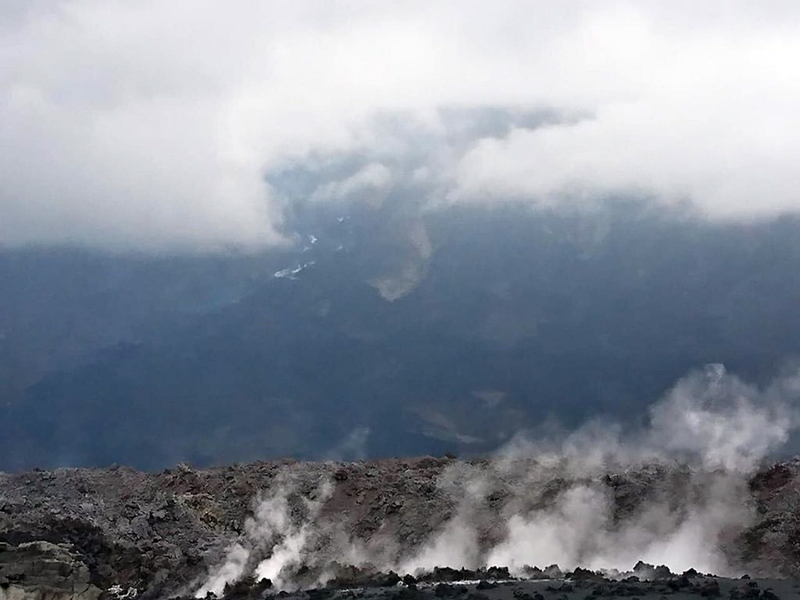 |
Figure 38. By 21 June 2018 active lava flows were no longer reaching the ocean at Fernandina, although steam from cooling lava was still visible near the coast and along the N flank. Courtesy of Parque Nacional Galapagos. |
Information Contacts: Instituto Geofísico (IG), Escuela Politécnica Nacional, Casilla 17-01-2759, Quito, Ecuador (URL: http://www.igepn.edu.ec/); Dirección del Parque Nacional Galápagos (DPNG), Av. Charles Darwin y S/N, Isla Santa Cruz, Galápagos, Ecuador (URL: http://www.galapagos.gob.ec/, Twitter: @parquegalapagos); Hawai'i Institute of Geophysics and Planetology (HIGP) - MODVOLC Thermal Alerts System, School of Ocean and Earth Science and Technology (SOEST), Univ. of Hawai'i, 2525 Correa Road, Honolulu, HI 96822, USA (URL: http://modis.higp.hawaii.edu/); MIROVA (Middle InfraRed Observation of Volcanic Activity), a collaborative project between the Universities of Turin and Florence (Italy) supported by the Centre for Volcanic Risk of the Italian Civil Protection Department (URL: http://www.mirovaweb.it/); NASA Goddard Space Flight Center (NASA/GSFC), Global Sulfur Dioxide Monitoring Page, Atmospheric Chemistry and Dynamics Laboratory, 8800 Greenbelt Road, Goddard, Maryland, USA (URL: https://so2.gsfc.nasa.gov/); Cultural and Natural Heritage Tours, Galapagos, (CNH Tours), 14 Kilbarry Crescent, Ottawa, Ontario, K1K 0G8, Canada (URL: https://www.cnhtours.com/, Twitter: @CNHtours).
Fissure eruption produced lava flows during 12-13 January 2020
Fernandina is a volcanic island in the Galapagos islands, around 1,000 km W from the coast of mainland Ecuador. It has produced nearly 30 recorded eruptions since 1800, with the most recent events having occurred along radial or circumferential fissures around the summit crater. The most recent previous eruption, starting on 16 June 2018, lasted two days and produced lava flows from a radial fissure on the northern flank. Monitoring and scientific reports come from the Instituto Geofísico, Escuela Politécnica Nacional (IG-EPN).
A report from IG-EPN on 12 January 2020 stated that there had been an increase in seismicity and deformation occurring during the previous weeks. On the day of the report, 11 seismic events had occurred, with the largest magnitude of 4.7 at a depth of 5 km. Shortly before 1810 that day a circumferential fissure formed below the eastern rim of the La Cumbre crater, at about 1.3-1.4 km elevation, and produced lava flows down the flank (figure 39). A rapid-onset seismic swarm reached maximum intensity at 1650 on 12 January (figure 40); a second increase in seismicity indicating the start of the eruption began around 70 minutes later (1800). A hotspot was observed in NOAA / CIMSS data between 1800 and 1810, and a gas plume rising up to 2 km above the fissure dispersed W to NW. The eruption lasted 9 hours, until about 0300 on 13 January.
|
Figure 39. Lava flows erupting from a circumferential fissure on the eastern flank of Fernandina on 12 January 2020. Photos courtesy of Parque Nacional Galápagos. |
|
Figure 40. Graph showing the Root-Mean-Square (RMS) amplitude of the seismic signals from the FER-1 station at Fernandina on 12-13 January 2020. The graph shows the increase in seismicity leading to the eruption on the 12th (left star), a decrease in the seismicity, and then another increase during the event (right star). Courtesy of S. Hernandez, IG-EPN (Report on 13 January 2020). |
A report issued at 1159 local time on 13 January 2020 described a rapid decrease in seismicity, gas emissions, and thermal anomalies, indicating a rapid decline in eruptive activity similar to previous events in 2017 and 2018. An overflight that day confirmed that the eruption had ended, after lava flows had extended around 500 m from the crater and covered an area of 3.8 km2 (figures 41 and 42). Seismicity continued on the 14th, with small volcano-tectonic (VT) earthquakes occurring less than 500 m below the surface. Periodic seismicity was recorded through 13-15 January, though there was an increase in seismicity during 17-22 January with deformation also detected (figure 43). No volcanic activity followed, and no additional gas or thermal anomalies were detected.
|
Figure 41. The lava flow extents at Fernandina of the previous two eruptions (4-7 September 2017 and 16-21 June 2018) and the 12-13 January 2020 eruption as detected by FIRMS thermal anomalies. Thermal data courtesy of NASA; figure prepared by F. Vásconez, IG-EPN (Report on 13 January 2020). |
|
Figure 42. This fissure vent that formed on the E flank of Fernandina on 12 January 2020 produced several lava flows. A weak gas plume was still rising when this photo was taken the next day, but the eruption had ceased. Courtesy of Parque Nacional Galápagos. |
|
Figure 43. Soil displacement map for Fernandina during 10 and 16 January 2020, with the deformation generated by the 12 January eruption shown. Courtesy of IG-EPN (Report on 23 January 2020). |
Information Contacts: Instituto Geofísico, Escuela Politécnica Nacional (IG-EPN), Casilla 17-01-2759, Quito, Ecuador (URL: http://www.igepn.edu.ec/); Dirección del Parque Nacional Galápagos (DPNG), Isla Santa Cruz, Galápagos, Ecuador (URL: http://www.galapagos.gob.ec/).
|
|
||||||||||||||||||||||||||
There is data available for 33 confirmed eruptive periods.
2024 Mar 2 - 2024 May 8 Confirmed Eruption (Explosive / Effusive)
| Episode 1 | Eruption (Explosive / Effusive) | SE flank | |||
|---|---|---|---|---|
| 2024 Mar 2 - 2024 May 8 | Evidence from Observations: Satellite (visual) | |||
2020 Jan 12 - 2020 Jan 13 Confirmed Eruption (Explosive / Effusive) VEI: 0
| Episode 1 | Eruption (Explosive / Effusive) | ||||||||||||||
|---|---|---|---|---|---|---|---|---|---|---|---|---|---|---|
| 2020 Jan 12 - 2020 Jan 13 | Evidence from Observations: Reported | |||||||||||||
|
List of 1 Events for Episode 1
|
||||||||||||||
2018 Jun 16 - 2018 Jun 21 Confirmed Eruption (Explosive / Effusive) VEI: 1
| Episode 1 | Eruption (Explosive / Effusive) | Radial fissure on NNE flank | |||||||||||||||||||||||||||||||||||||||||||||||||||||
|---|---|---|---|---|---|---|---|---|---|---|---|---|---|---|---|---|---|---|---|---|---|---|---|---|---|---|---|---|---|---|---|---|---|---|---|---|---|---|---|---|---|---|---|---|---|---|---|---|---|---|---|---|---|---|
| 2018 Jun 16 - 2018 Jun 21 | Evidence from Observations: Reported | |||||||||||||||||||||||||||||||||||||||||||||||||||||
|
List of 9 Events for Episode 1 at Radial fissure on NNE flank
|
||||||||||||||||||||||||||||||||||||||||||||||||||||||
2017 Sep 4 - 2017 Sep 8 ± 1 days Confirmed Eruption (Explosive / Effusive) VEI: 1
| Episode 1 | Eruption (Explosive / Effusive) | SSW caldera rim and La Cumbre crater | |||||||||||||||||||||||||||||||||||||||||||||||||||||||||||||||
|---|---|---|---|---|---|---|---|---|---|---|---|---|---|---|---|---|---|---|---|---|---|---|---|---|---|---|---|---|---|---|---|---|---|---|---|---|---|---|---|---|---|---|---|---|---|---|---|---|---|---|---|---|---|---|---|---|---|---|---|---|---|---|---|---|
| 2017 Sep 4 - 2017 Sep 8 ± 1 days | Evidence from Observations: Reported | |||||||||||||||||||||||||||||||||||||||||||||||||||||||||||||||
|
List of 11 Events for Episode 1 at SSW caldera rim and La Cumbre crater
|
||||||||||||||||||||||||||||||||||||||||||||||||||||||||||||||||
2009 Apr 10 - 2009 Apr 28 (?) Confirmed Eruption (Explosive / Effusive) VEI: 2
| Episode 1 | Eruption (Explosive / Effusive) | SW flank (400 m) | |||||||||||||||||||||||||||||||||||||||||||
|---|---|---|---|---|---|---|---|---|---|---|---|---|---|---|---|---|---|---|---|---|---|---|---|---|---|---|---|---|---|---|---|---|---|---|---|---|---|---|---|---|---|---|---|---|
| 2009 Apr 10 - 2009 Apr 28 (?) | Evidence from Observations: Reported | |||||||||||||||||||||||||||||||||||||||||||
|
List of 7 Events for Episode 1 at SW flank (400 m)
|
||||||||||||||||||||||||||||||||||||||||||||
2005 May 13 - 2005 May 29 (?) Confirmed Eruption (Explosive / Effusive) VEI: 2
| Episode 1 | Eruption (Explosive / Effusive) | South caldera rim | |||||||||||||||||||||||||||||||||
|---|---|---|---|---|---|---|---|---|---|---|---|---|---|---|---|---|---|---|---|---|---|---|---|---|---|---|---|---|---|---|---|---|---|---|
| 2005 May 13 - 2005 May 29 (?) | Evidence from Observations: Reported | |||||||||||||||||||||||||||||||||
|
List of 5 Events for Episode 1 at South caldera rim
|
||||||||||||||||||||||||||||||||||
1995 Jan 25 - 1995 Apr 8 (?) Confirmed Eruption (Explosive / Effusive) VEI: 2
| Episode 1 | Eruption (Explosive / Effusive) | SW flank | ||||||||||||||||||||||||||||||||||||||||||||||||||||||||||
|---|---|---|---|---|---|---|---|---|---|---|---|---|---|---|---|---|---|---|---|---|---|---|---|---|---|---|---|---|---|---|---|---|---|---|---|---|---|---|---|---|---|---|---|---|---|---|---|---|---|---|---|---|---|---|---|---|---|---|---|
| 1995 Jan 25 - 1995 Apr 8 (?) | Evidence from Observations: Reported | ||||||||||||||||||||||||||||||||||||||||||||||||||||||||||
|
List of 10 Events for Episode 1 at SW flank
|
|||||||||||||||||||||||||||||||||||||||||||||||||||||||||||
1991 Apr 19 - 1991 Apr 24 Confirmed Eruption (Explosive / Effusive) VEI: 2 (?)
| Episode 1 | Eruption (Explosive / Effusive) | Base of ESE and NW caldera wall | ||||||||||||||||||||||||||||||||||||||
|---|---|---|---|---|---|---|---|---|---|---|---|---|---|---|---|---|---|---|---|---|---|---|---|---|---|---|---|---|---|---|---|---|---|---|---|---|---|---|---|
| 1991 Apr 19 - 1991 Apr 24 | Evidence from Observations: Reported | ||||||||||||||||||||||||||||||||||||||
|
List of 6 Events for Episode 1 at Base of ESE and NW caldera wall
|
|||||||||||||||||||||||||||||||||||||||
1988 Sep 14 - 1988 Sep 16 Confirmed Eruption (Explosive / Effusive) VEI: 2 (?)
| Episode 1 | Eruption (Explosive / Effusive) | East caldera wall | |||||||||||||||||||||||||||||||||||||||||||||||||||||
|---|---|---|---|---|---|---|---|---|---|---|---|---|---|---|---|---|---|---|---|---|---|---|---|---|---|---|---|---|---|---|---|---|---|---|---|---|---|---|---|---|---|---|---|---|---|---|---|---|---|---|---|---|---|---|
| 1988 Sep 14 - 1988 Sep 16 | Evidence from Observations: Reported | |||||||||||||||||||||||||||||||||||||||||||||||||||||
|
List of 9 Events for Episode 1 at East caldera wall
|
||||||||||||||||||||||||||||||||||||||||||||||||||||||
1984 Mar 30 Confirmed Eruption (Explosive / Effusive) VEI: 1
| Episode 1 | Eruption (Explosive / Effusive) | NW corner of caldera | ||||||||||||||||||||||||||||
|---|---|---|---|---|---|---|---|---|---|---|---|---|---|---|---|---|---|---|---|---|---|---|---|---|---|---|---|---|---|
| 1984 Mar 30 - Unknown | Evidence from Observations: Reported | ||||||||||||||||||||||||||||
|
List of 4 Events for Episode 1 at NW corner of caldera
|
|||||||||||||||||||||||||||||
1981 Aug 1 ± 270 days Confirmed Eruption (Explosive / Effusive) VEI: 0
| Episode 1 | Eruption (Explosive / Effusive) | South caldera rim | ||||||||||||||||||
|---|---|---|---|---|---|---|---|---|---|---|---|---|---|---|---|---|---|---|---|
| 1981 Aug 1 ± 270 days - Unknown | Evidence from Observations: Reported | ||||||||||||||||||
|
List of 2 Events for Episode 1 at South caldera rim
|
|||||||||||||||||||
1978 Aug 8 - 1978 Aug 26 Confirmed Eruption (Explosive / Effusive) VEI: 2
| Episode 1 | Eruption (Explosive / Effusive) | NW caldera bench | |||||||||||||||||||||||||||||||||||||||||||
|---|---|---|---|---|---|---|---|---|---|---|---|---|---|---|---|---|---|---|---|---|---|---|---|---|---|---|---|---|---|---|---|---|---|---|---|---|---|---|---|---|---|---|---|---|
| 1978 Aug 8 - 1978 Aug 26 | Evidence from Observations: Reported | |||||||||||||||||||||||||||||||||||||||||||
|
List of 7 Events for Episode 1 at NW caldera bench
|
||||||||||||||||||||||||||||||||||||||||||||
1977 Mar 23 - 1977 Mar 27 Confirmed Eruption (Explosive / Effusive) VEI: 1
| Episode 1 | Eruption (Explosive / Effusive) | SE caldera bench | |||||||||||||||||||||||||||||||||
|---|---|---|---|---|---|---|---|---|---|---|---|---|---|---|---|---|---|---|---|---|---|---|---|---|---|---|---|---|---|---|---|---|---|---|
| 1977 Mar 23 - 1977 Mar 27 | Evidence from Observations: Reported | |||||||||||||||||||||||||||||||||
|
List of 5 Events for Episode 1 at SE caldera bench
|
||||||||||||||||||||||||||||||||||
1973 Dec 9 - 1973 Dec 16 ± 1 days Confirmed Eruption (Explosive / Effusive) VEI: 2
| Episode 1 | Eruption (Explosive / Effusive) | ESE caldera wall | ||||||||||||||||||||||||||||||||||||||
|---|---|---|---|---|---|---|---|---|---|---|---|---|---|---|---|---|---|---|---|---|---|---|---|---|---|---|---|---|---|---|---|---|---|---|---|---|---|---|---|
| 1973 Dec 9 - 1973 Dec 16 ± 1 days | Evidence from Observations: Reported | ||||||||||||||||||||||||||||||||||||||
|
List of 6 Events for Episode 1 at ESE caldera wall
|
|||||||||||||||||||||||||||||||||||||||
1972 Jun 4 ± 45 days Confirmed Eruption (Explosive / Effusive) VEI: 0
| Episode 1 | Eruption (Explosive / Effusive) | SE caldera bench | |||||||||||||||||||||||||||||||||
|---|---|---|---|---|---|---|---|---|---|---|---|---|---|---|---|---|---|---|---|---|---|---|---|---|---|---|---|---|---|---|---|---|---|---|
| 1972 Jun 4 ± 45 days - Unknown | Evidence from Observations: Reported | |||||||||||||||||||||||||||||||||
|
List of 5 Events for Episode 1 at SE caldera bench
|
||||||||||||||||||||||||||||||||||
1968 Jun 11 - 1968 Jul 4 (on or before) Confirmed Eruption (Explosive / Effusive) VEI: 4
| Episode 1 | Eruption (Explosive / Effusive) | West caldera wall | ||||||||||||||||||||||||||||||||||||||||||||||||||||||||||||||||||||
|---|---|---|---|---|---|---|---|---|---|---|---|---|---|---|---|---|---|---|---|---|---|---|---|---|---|---|---|---|---|---|---|---|---|---|---|---|---|---|---|---|---|---|---|---|---|---|---|---|---|---|---|---|---|---|---|---|---|---|---|---|---|---|---|---|---|---|---|---|---|
| 1968 Jun 11 - 1968 Jul 4 (on or before) | Evidence from Observations: Reported | ||||||||||||||||||||||||||||||||||||||||||||||||||||||||||||||||||||
|
List of 12 Events for Episode 1 at West caldera wall
|
|||||||||||||||||||||||||||||||||||||||||||||||||||||||||||||||||||||
1968 May 21 - 1968 May 23 ± 1 days Confirmed Eruption (Explosive / Effusive) VEI: 2
| Episode 1 | Eruption (Explosive / Effusive) | ESE flank (600 m) | ||||||||||||||||||||||||||||||||||||||
|---|---|---|---|---|---|---|---|---|---|---|---|---|---|---|---|---|---|---|---|---|---|---|---|---|---|---|---|---|---|---|---|---|---|---|---|---|---|---|---|
| 1968 May 21 - 1968 May 23 ± 1 days | Evidence from Observations: Reported | ||||||||||||||||||||||||||||||||||||||
|
List of 6 Events for Episode 1 at ESE flank (600 m)
|
|||||||||||||||||||||||||||||||||||||||
1961 Mar 21 ± 1 days - 1961 Sep 16 ± 15 days Confirmed Eruption (Explosive / Effusive) VEI: 2
| Episode 1 | Eruption (Explosive / Effusive) | SE flank | |||||||||||||||||||||||
|---|---|---|---|---|---|---|---|---|---|---|---|---|---|---|---|---|---|---|---|---|---|---|---|---|
| 1961 Mar 21 ± 1 days - 1961 Sep 16 ± 15 days | Evidence from Observations: Reported | |||||||||||||||||||||||
|
List of 3 Events for Episode 1 at SE flank
|
||||||||||||||||||||||||
1958 Sep 16 (?) ± 15 days - 1958 Dec 30 (on or after) Confirmed Eruption (Explosive / Effusive) VEI: 2
| Episode 1 | Eruption (Explosive / Effusive) | SE, SW and west caldera rim | |||||||||||||||||||||||
|---|---|---|---|---|---|---|---|---|---|---|---|---|---|---|---|---|---|---|---|---|---|---|---|---|
| 1958 Sep 16 (?) ± 15 days - 1958 Dec 30 (on or after) | Evidence from Observations: Reported | |||||||||||||||||||||||
|
List of 3 Events for Episode 1 at SE, SW and west caldera rim
|
||||||||||||||||||||||||
1937 Mar - 1937 Apr Confirmed Eruption (Explosive / Effusive) VEI: 0
| Episode 1 | Eruption (Explosive / Effusive) | |||||||||||||||||||
|---|---|---|---|---|---|---|---|---|---|---|---|---|---|---|---|---|---|---|---|
| 1937 Mar - 1937 Apr | Evidence from Observations: Reported | ||||||||||||||||||
|
List of 2 Events for Episode 1
|
|||||||||||||||||||
1927 Dec 13 (on or before) Confirmed Eruption (Explosive / Effusive) VEI: 0
| Episode 1 | Eruption (Explosive / Effusive) | South flank near Punta Mangle | ||||||||||||||||||
|---|---|---|---|---|---|---|---|---|---|---|---|---|---|---|---|---|---|---|---|
| 1927 Dec 13 (on or before) - Unknown | Evidence from Observations: Reported | ||||||||||||||||||
|
List of 2 Events for Episode 1 at South flank near Punta Mangle
|
|||||||||||||||||||
1926 Confirmed Eruption (Explosive / Effusive)
| Episode 1 | Eruption (Explosive / Effusive) | ||||
|---|---|---|---|---|
| 1926 - Unknown | Evidence from Observations: Reported | |||
1917 May 14 Confirmed Eruption (Explosive / Effusive) VEI: 0
| Episode 1 | Eruption (Explosive / Effusive) | Cape Hammond (SW flank) | |||||||||||||
|---|---|---|---|---|---|---|---|---|---|---|---|---|---|---|
| 1917 May 14 - Unknown | Evidence from Observations: Reported | |||||||||||||
|
List of 1 Events for Episode 1 at Cape Hammond (SW flank)
|
||||||||||||||
1888 Apr 10 (?) Confirmed Eruption (Explosive / Effusive) VEI: 1
| Episode 1 | Eruption (Explosive / Effusive) | |||||||||||||||||||
|---|---|---|---|---|---|---|---|---|---|---|---|---|---|---|---|---|---|---|---|
| 1888 Apr 10 (?) - Unknown | Evidence from Observations: Reported | ||||||||||||||||||
|
List of 2 Events for Episode 1
|
|||||||||||||||||||
1846 Nov 6 (on or before) - 1846 Nov 24 (on or after) Confirmed Eruption (Explosive / Effusive) VEI: 0
| Episode 1 | Eruption (Explosive / Effusive) | East flank | |||||||||||||||||||||||
|---|---|---|---|---|---|---|---|---|---|---|---|---|---|---|---|---|---|---|---|---|---|---|---|---|
| 1846 Nov 6 (on or before) - 1846 Nov 24 (on or after) | Evidence from Observations: Reported | |||||||||||||||||||||||
|
List of 3 Events for Episode 1 at East flank
|
||||||||||||||||||||||||
1825 Feb 14 - 1825 Oct (on or after) Confirmed Eruption (Explosive / Effusive) VEI: 3
| Episode 1 | Eruption (Explosive / Effusive) | East summit and SE flank | |||||||||||||||||||||||
|---|---|---|---|---|---|---|---|---|---|---|---|---|---|---|---|---|---|---|---|---|---|---|---|---|
| 1825 Feb 14 - 1825 Oct (on or after) | Evidence from Observations: Reported | |||||||||||||||||||||||
|
List of 3 Events for Episode 1 at East summit and SE flank
|
||||||||||||||||||||||||
1819 May 15 - 1819 May 18 Confirmed Eruption (Explosive / Effusive) VEI: 2
| Episode 1 | Eruption (Explosive / Effusive) | ||||||||||||||||||||||||
|---|---|---|---|---|---|---|---|---|---|---|---|---|---|---|---|---|---|---|---|---|---|---|---|---|
| 1819 May 15 - 1819 May 18 | Evidence from Observations: Reported | |||||||||||||||||||||||
|
List of 3 Events for Episode 1
|
||||||||||||||||||||||||
1817 (in or before) Confirmed Eruption (Explosive / Effusive) VEI: 2
| Episode 1 | Eruption (Explosive / Effusive) | Volcano Uncertain: Western Galápagos | |||||||||||||||||||||||
|---|---|---|---|---|---|---|---|---|---|---|---|---|---|---|---|---|---|---|---|---|---|---|---|---|
| 1817 (in or before) - Unknown | Evidence from Unknown | |||||||||||||||||||||||
|
List of 3 Events for Episode 1 at Volcano Uncertain: Western Galápagos
|
||||||||||||||||||||||||
1814 Jul - 1814 Aug Confirmed Eruption (Explosive / Effusive) VEI: 2
| Episode 1 | Eruption (Explosive / Effusive) | ||||||||||||||||||||||||
|---|---|---|---|---|---|---|---|---|---|---|---|---|---|---|---|---|---|---|---|---|---|---|---|---|
| 1814 Jul - 1814 Aug | Evidence from Observations: Reported | |||||||||||||||||||||||
|
List of 3 Events for Episode 1
|
||||||||||||||||||||||||
1813 Jul 14 (on or before) Confirmed Eruption (Explosive / Effusive) VEI: 2
| Episode 1 | Eruption (Explosive / Effusive) | South flank | ||||||||||||||||||
|---|---|---|---|---|---|---|---|---|---|---|---|---|---|---|---|---|---|---|---|
| 1813 Jul 14 (on or before) - Unknown | Evidence from Observations: Reported | ||||||||||||||||||
|
List of 2 Events for Episode 1 at South flank
|
|||||||||||||||||||
1550 (in or after) Confirmed Eruption (Explosive / Effusive) VEI: 0
| Episode 1 | Eruption (Explosive / Effusive) | |||||||||||||||||||
|---|---|---|---|---|---|---|---|---|---|---|---|---|---|---|---|---|---|---|---|
| 1550 (in or after) - Unknown | Evidence from Isotopic: Cosmic Ray Exposure | ||||||||||||||||||
|
List of 2 Events for Episode 1
|
|||||||||||||||||||
1150 (in or after) Confirmed Eruption (Explosive / Effusive) VEI: 0
| Episode 1 | Eruption (Explosive / Effusive) | |||||||||||||||||||
|---|---|---|---|---|---|---|---|---|---|---|---|---|---|---|---|---|---|---|---|
| 1150 (in or after) - Unknown | Evidence from Isotopic: Cosmic Ray Exposure | ||||||||||||||||||
|
List of 2 Events for Episode 1
|
|||||||||||||||||||
0950 ± 500 years Confirmed Eruption (Explosive / Effusive) VEI: 0
| Episode 1 | Eruption (Explosive / Effusive) | |||||||||||||||||||
|---|---|---|---|---|---|---|---|---|---|---|---|---|---|---|---|---|---|---|---|
| 0950 ± 500 years - Unknown | Evidence from Isotopic: Cosmic Ray Exposure | ||||||||||||||||||
|
List of 2 Events for Episode 1
|
|||||||||||||||||||
This compilation of synonyms and subsidiary features may not be comprehensive. Features are organized into four major categories: Cones, Craters, Domes, and Thermal Features. Synonyms of features appear indented below the primary name. In some cases additional feature type, elevation, or location details are provided.
Synonyms |
| Narborough | Plata | Cumbre, La |
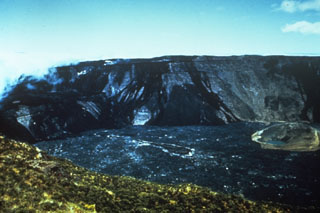 A 1966 photo from the NE caldera rim shows the effects of an eruption in 1958. A major effusive eruption from vents on the SE, SW, and west caldera rims produced lava flows that descended the SE and SW flanks and also flowed into the caldera, completely covering the caldera floor. One report suggested that the eruption was underway during a September-October 1958 visit; the eruption was in waning stages on a December 30, 1958 visit. At this time, prior to additional collapse in 1968, the caldera was 800 m deep.
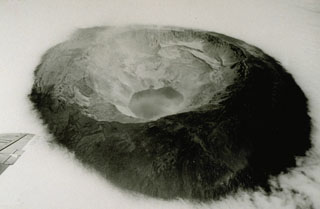 The 1968 eruption of Fernandina was one of the few historical instances in which caldera collapse has been documented. This oblique aerial photograph taken three weeks after the start of the caldera collapse shows Fernandina volcano from the ESE. The NW and SE benches and the central tuff cone (whose crater is partially filled by the small embayment at the top of the lake) can still be seen in this photograph, despite roughly 350 m subsidence of the SE caldera floor. Note the dust from rock avalanches on the oversteepened walls.
 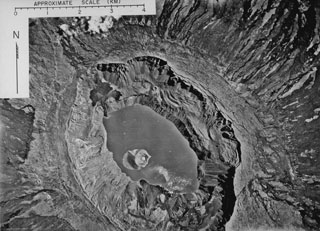 An aerial photograph mosaic shows Fernandina caldera from above in 1947. Concentric rows of circumferential fissures that are prominent along the caldera rim fed dark lava flows down the outer flanks of the volcano. The caldera lake that surrounds a prominent tuff cone was destroyed by lava flows during an eruption in 1958, but had reappeared prior to caldera collapse in 1968. During the 1968 collapse, the caldera floor dropped 350 m. The tuff cone rode the slow, piecemeal collapse downward without fragmenting.
 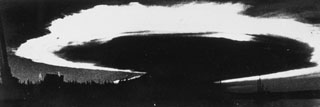 Caldera collapse in 1968 at the basaltic shield volcano, Fernandina, was preceded by lava effusion on the SE flank and a major explosive eruption on 11 June. The ash plume, seen here from Academy Bay on Santa Cruz Island within minutes of the explosion, is backlit by the late afternoon sun and was spreading at an estimated lateral speed of 80 km per hour. At the time of this photograph the ash plume was 175 km across with an altitude of 20-25 km.
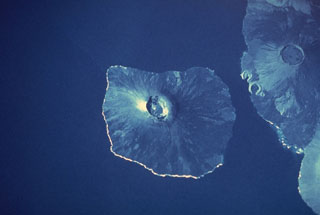 Two massive Galápagos shield volcanoes, their slopes darkened by young unvegetated lava flows that reach to the sea, appear in this space-shuttle photograph. Fernandina volcano, the most active in the Galápagos Islands, forms a 30 x 34 km wide island with a 4 x 6.5 km wide caldera at its summit. Darwin volcano, north of the midpoint of Isabela Island, has a 5-km-wide summit caldera. The tuff cones of Tagus and Beagle are prominent along its western coast. The light-colored area south of Darwin is the lower western flank of Alcedo volcano.
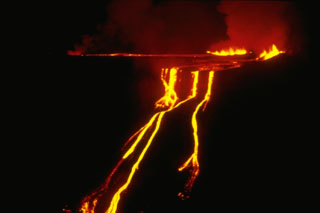 A fissure eruption on the SE caldera bench of Fernandina volcano feeds lava flows that form a spectacular, 530-m-high cascade of molten lava down the caldera wall. A four-day-long eruption began on March 23, 1977 from fissures on the west side of the SE caldera bench, 300 m below the caldera rim. Lava flows can be seen spreading out over the caldera bench before pouring over the caldera wall. The distal end of the lava flows formed a small lava delta in the 2-km-wide caldera lake.
 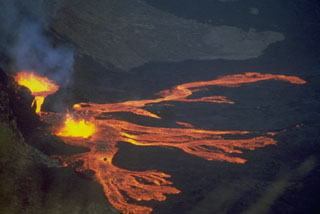 Lava fountains from Fernandina volcano in the Galápagos Islands feed multiple lobes of lava in 1978 that travel across a down-dropped block of the NW caldera bench, about 380 m below the caldera rim. The 1978 eruption began on 8 August when a 6-km-high eruption plume rose to be visible from distant locations in the archipelago. During the course of the eruption lava flows traveled 2 km into the caldera lake, more than 400 m below. Activity ended on 26 August.
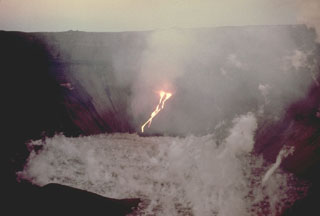 Streams of incandescent lava descend into the steaming caldera lake of Fernandina volcano in December 1973. This was one of several eruptions during the 1970's that produced lava flows from vents on caldera benches that spilled into the caldera lake. This eruption began on December 9 from vents 220 m below the east end of the SE bench, producing lava flows that formed a small lava delta in the lake. Glow was no longer visible the night of December 15, and ground observation on December 17 confirmed that the eruption had ceased.
 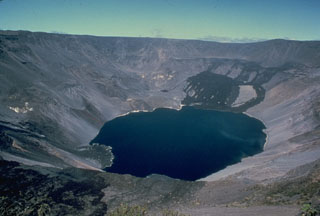 Fernandina, the most active of Galápagos volcanoes, is a basaltic shield volcano with a deep 4 x 6.5 km summit caldera. This 1978 photo shows dark lava flows at the far NW end that were erupted from the NW caldera bench in August 1978. The lava delta at the lower left was formed by lava flows down the west side of the SE bench in 1977. In 1968 the caldera floor dropped 350 m following a major explosive eruption. Collapse of part of the east caldera wall during a 1988 eruption produced a debris-avalanche deposit that absorbed the caldera lake.
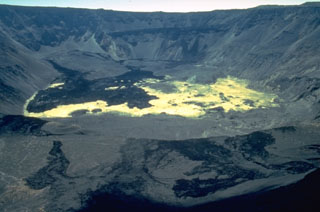 The light-colored lake sediments on the caldera floor are partially overlain by deposits of a massive debris avalanche produced when the east caldera wall collapsed on September 14, 1988. The debris avalanche swept into the caldera lake, displacing it and initially raising its level over 100 m. Lava flows from vents at about 750 m on the inner east wall were erupted through and onto the surface of the avalanche deposit on September 14-16, forming the dark areas at the left. By the time of this January 1989 photo the lake had been largely absorbed within the avalanche deposit.
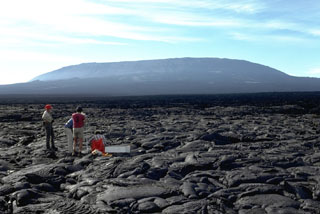 Fernandina volcano in the Galápagos exhibits steep upper flanks formed by eruptions of lava flows from circumferential fissures around a summit caldera rim, contrasting with the broad, low-angle lower flanks. Scientists from the Smithsonian Institution, U.S. Geological Survey, and the Charles Darwin Research Station conduct measurements on a pahoehoe lava flow near the SE coast. Young, unvegetated lava flows cover the flanks.
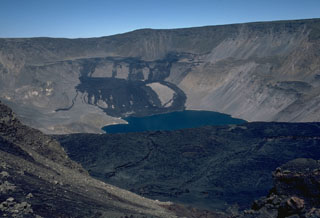 The dark lava flows at the far NW end of Fernandina caldera were emplaced in August 1978. An eruption beginning on August 8 produced an eruption cloud 4.5-6 km high. This was followed by the emplacement of a large lava flow from a 1-km-long fissure system on the NW caldera bench that flowed into the caldera lake. Lava fountaining was observed during visits to the caldera rim, on August 10-13 and 16-19. The eruption had ended by the 26th. Fresh lava flows in the foreground mantle the surface of the prominent SE caldera bench.
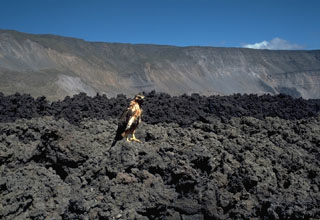 A Galápagos hawk perches on a blocky lava flow erupted in Fernandina caldera in 1978, inspecting some of the infrequent visitors to the caldera floor of this uninhabited island volcano. These August 1978 lava flows descended from the NW caldera bench over a broad, 1-km-wide front into the caldera lake. The NE rim in the background rises over 800 m above this part of the floor of the 4.5 x 6 km caldera.
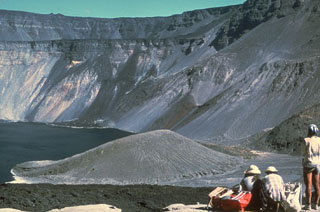 The tuff cone at the lower center, seen here from the NW in 1978, dropped 280 m during collapse of the Fernandina caldera floor in 1968. Collapse occurred in a piecemeal fashion over a period of about two weeks and the 110-m-high tuff cone, which previously formed an island in the caldera lake, rode the collapse downward without fracturing. The tuff cone was later buried by a 1991 lava flow following a 1988 debris avalanche. The prominent SE caldera bench is seen at the far side of the roughly 1-km-deep caldera.
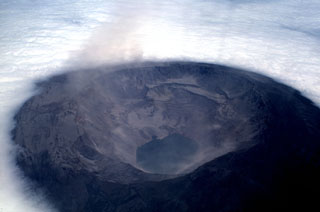 Dust clouds rise from Fernandina caldera on July 4, 1968, about three weeks after a major explosive eruption that was followed by collapse of the caldera floor. Collapse occurred incrementally and asymmetrically, ranging up to about 350 m at the SE end of the caldera, which contains the caldera lake. Fernandina, the most active of Galápagos volcanoes, is a basaltic shield volcano with a deep 4 x 6.5 km summit caldera. Flat-topped benches mark the SE and NW ends of the elliptical caldera.
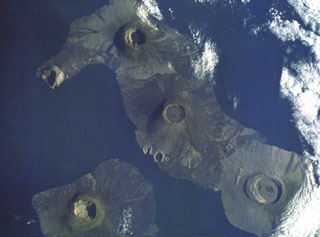 This dramatic Space Shuttle photo from a 1988 mission shows five major calderas of the Galápagos Islands. Caldera diameters capping these basasltic shield volcanoes range up to 8 km. At the lower left is Fernandina volcano. At the lower right is mostly vegetated Alcedo volcano on Isabela Island. Above and to the left is Darwin volcano, with the two prominent breached tuff cones, Tagus and Beagle, on its SW flank. Volcán Wolf is at the top of the photo, and Volcán Ecuador with its breached caldera forms the NW tip of Isabela Island.
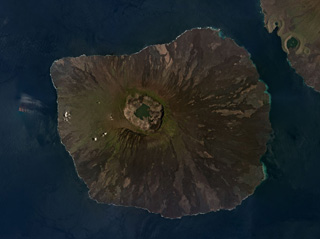 The Fernandina shield volcano in the Galapagos Islands has a roughly 5 x 6 km summit caldera seen in this March 2019 Planet Labs satellite image monthly mosaic (N is at the top). Frequent eruptions often produce circumferential fissures near the caldera as well as fissures on the lower flanks that feed lava flows, many of which are visible in a radial pattern around the flanks. Lava flows and collapse events around the caldera walls modify the caldera floor, which has a lake at the time of this image acquisition.
The following 182 samples associated with this volcano can be found in the Smithsonian's NMNH Department of Mineral Sciences collections, and may be availble for research (contact the Rock and Ore Collections Manager). Catalog number links will open a window with more information.
| Catalog Number | Sample Description | Lava Source | Collection Date |
|---|---|---|---|
| NMNH 113710-F705 | Basalt | -- | -- |
| NMNH 113710-F706 | Basalt | -- | -- |
| NMNH 113710-F707 | Basalt | -- | -- |
| NMNH 113710-F708 | Basalt | -- | -- |
| NMNH 113710-F709 | Basalt | -- | -- |
| NMNH 113710-F710 | Basalt | -- | -- |
| NMNH 113710-F711 | Volcanic Glass | -- | -- |
| NMNH 113710-F712 | Volcanic Ash | -- | -- |
| NMNH 113710-F713 | Volcanic Ash | -- | -- |
| NMNH 113710-F714 | Volcanic Ash | -- | -- |
| NMNH 113710-F715 | Volcanic Ash | -- | -- |
| NMNH 113710-F716 | Volcanic Glass | -- | -- |
| NMNH 118001-1 | Lapilli-ash | -- | -- |
| NMNH 118001-10 | Ash | -- | -- |
| NMNH 118001-100 | Basalt | -- | -- |
| NMNH 118001-101 | Basalt | -- | -- |
| NMNH 118001-102 | Basalt | -- | -- |
| NMNH 118001-103 | Basalt | -- | -- |
| NMNH 118001-104 | Igneous Rock | -- | -- |
| NMNH 118001-105 | Igneous Rock | -- | -- |
| NMNH 118001-106 | Scoria | -- | -- |
| NMNH 118001-107 | Pele's Hair | -- | -- |
| NMNH 118001-108 | Basalt | -- | -- |
| NMNH 118001-109 | Tephra | -- | -- |
| NMNH 118001-11 | Tephra | -- | -- |
| NMNH 118001-110 | Basalt | -- | -- |
| NMNH 118001-111 | Andesite | -- | -- |
| NMNH 118001-112 | Basalt | -- | -- |
| NMNH 118001-113 | Basalt | -- | -- |
| NMNH 118001-114 | Basalt | -- | -- |
| NMNH 118001-115 | Basalt | -- | -- |
| NMNH 118001-116 | Basalt | -- | -- |
| NMNH 118001-117 | Basalt | -- | -- |
| NMNH 118001-118 | Basalt | -- | -- |
| NMNH 118001-119 | Andesite | -- | -- |
| NMNH 118001-12 | Tephra | -- | -- |
| NMNH 118001-120 | Andesite | -- | -- |
| NMNH 118001-121 | Tephra | -- | -- |
| NMNH 118001-122 | Scoria | -- | -- |
| NMNH 118001-123 | Tephra | -- | -- |
| NMNH 118001-124 | Andesite | -- | -- |
| NMNH 118001-125 | Tephra | -- | -- |
| NMNH 118001-126 | Basalt | -- | -- |
| NMNH 118001-127 | Andesite | -- | -- |
| NMNH 118001-128 | Tephra | -- | -- |
| NMNH 118001-129 | Basalt | -- | -- |
| NMNH 118001-13 | Tephra | -- | -- |
| NMNH 118001-130 | Basalt | -- | -- |
| NMNH 118001-131 | Tephra | -- | -- |
| NMNH 118001-132 | Andesite | -- | -- |
| NMNH 118001-133 | Basalt | -- | -- |
| NMNH 118001-134 | Basalt | -- | -- |
| NMNH 118001-135 | Limestone | -- | -- |
| NMNH 118001-136 | Basalt | -- | -- |
| NMNH 118001-137 | Scoria | -- | -- |
| NMNH 118001-138 | Scoria | -- | -- |
| NMNH 118001-139 | Scoria | -- | -- |
| NMNH 118001-14 | Tephra | -- | -- |
| NMNH 118001-140 | Basalt | -- | -- |
| NMNH 118001-141 | Basalt | -- | -- |
| NMNH 118001-142 | Basalt | -- | -- |
| NMNH 118001-143 | Basalt | -- | -- |
| NMNH 118001-144 | Basalt | -- | -- |
| NMNH 118001-145 | Basalt | -- | -- |
| NMNH 118001-146 | Basalt | -- | -- |
| NMNH 118001-147 | Basalt | -- | -- |
| NMNH 118001-148 | Ash | -- | -- |
| NMNH 118001-149 | Lapilli-ash | -- | -- |
| NMNH 118001-15 | Tephra | -- | -- |
| NMNH 118001-150 | Ash | -- | -- |
| NMNH 118001-151 | Marble | -- | -- |
| NMNH 118001-152 | Marble | -- | -- |
| NMNH 118001-153 | Ash | -- | -- |
| NMNH 118001-154 | Lapilli-ash | -- | -- |
| NMNH 118001-155 | Basalt Glass | -- | -- |
| NMNH 118001-156 | Basalt | -- | -- |
| NMNH 118001-157 | Basalt | -- | -- |
| NMNH 118001-158 | Ash | -- | -- |
| NMNH 118001-159 | Ash | -- | -- |
| NMNH 118001-16 | Tephra | -- | -- |
| NMNH 118001-160 | Ash | -- | -- |
| NMNH 118001-161 | Ash | -- | -- |
| NMNH 118001-162 | Scoria | -- | -- |
| NMNH 118001-163 | Pele's Hair | -- | -- |
| NMNH 118001-164 | Ash | -- | -- |
| NMNH 118001-165 | Ash | -- | -- |
| NMNH 118001-166 | Scoria | -- | -- |
| NMNH 118001-167 | Pele's Hair | -- | -- |
| NMNH 118001-168 | Scoria | -- | -- |
| NMNH 118001-169 | Basalt | -- | -- |
| NMNH 118001-17 | Ash | -- | -- |
| NMNH 118001-170 | Basalt | -- | -- |
| NMNH 118001-18 | Lapilli-ash | -- | -- |
| NMNH 118001-19 | Tephra | -- | -- |
| NMNH 118001-2 | Lapilli-ash | -- | -- |
| NMNH 118001-20 | Ash | -- | -- |
| NMNH 118001-21 | Tephra | -- | -- |
| NMNH 118001-22 | Tephra | -- | -- |
| NMNH 118001-23 | Basalt | -- | -- |
| NMNH 118001-24 | Basalt | -- | -- |
| NMNH 118001-25 | Basalt | -- | -- |
| NMNH 118001-26 | Basalt | -- | -- |
| NMNH 118001-27 | Basalt | -- | -- |
| NMNH 118001-28 | Basalt | -- | -- |
| NMNH 118001-29 | Basalt | -- | -- |
| NMNH 118001-3 | Lapilli-ash | -- | -- |
| NMNH 118001-30 | Basalt | -- | -- |
| NMNH 118001-31 | Basalt | -- | -- |
| NMNH 118001-32 | Basalt | -- | -- |
| NMNH 118001-33 | Basalt | -- | -- |
| NMNH 118001-34 | Gabbro | -- | -- |
| NMNH 118001-35 | Basalt | -- | -- |
| NMNH 118001-36 | Basalt | -- | -- |
| NMNH 118001-37 | Basalt | -- | -- |
| NMNH 118001-38 | Basalt | -- | -- |
| NMNH 118001-39 | Basalt | -- | -- |
| NMNH 118001-4 | Lapilli-ash | -- | -- |
| NMNH 118001-40 | Gabbro | -- | -- |
| NMNH 118001-41 | Tephra | -- | -- |
| NMNH 118001-42 | Basalt | -- | -- |
| NMNH 118001-43 | Basalt | -- | -- |
| NMNH 118001-44 | Basalt | -- | -- |
| NMNH 118001-45 | Basalt | -- | -- |
| NMNH 118001-46 | Basalt | -- | -- |
| NMNH 118001-47 | Basalt | -- | -- |
| NMNH 118001-48 | Basalt | -- | -- |
| NMNH 118001-49 | Dike Rock | -- | -- |
| NMNH 118001-5 | Lapilli-ash | -- | -- |
| NMNH 118001-50 | Igneous Rock | -- | -- |
| NMNH 118001-51 | Igneous Rock | -- | -- |
| NMNH 118001-52 | Igneous Rock | -- | -- |
| NMNH 118001-53 | Igneous Rock | -- | -- |
| NMNH 118001-54 | Basalt | -- | -- |
| NMNH 118001-55 | Basalt | -- | -- |
| NMNH 118001-56 | Igneous Rock | -- | -- |
| NMNH 118001-57 | Igneous Rock | -- | -- |
| NMNH 118001-58 | Igneous Rock | -- | -- |
| NMNH 118001-59 | Igneous Rock | -- | -- |
| NMNH 118001-6 | Lapilli-ash | -- | -- |
| NMNH 118001-60 | Igneous Rock | -- | -- |
| NMNH 118001-61 | Igneous Rock | -- | -- |
| NMNH 118001-62 | Igneous Rock | -- | -- |
| NMNH 118001-63 | Basalt | -- | -- |
| NMNH 118001-64 | Igneous Rock | -- | -- |
| NMNH 118001-65 | Basalt | -- | -- |
| NMNH 118001-66 | Gabbro | -- | -- |
| NMNH 118001-67 | Gabbro | -- | -- |
| NMNH 118001-68 | Basalt | -- | -- |
| NMNH 118001-69 | Basalt | -- | -- |
| NMNH 118001-7 | Lapilli-ash | -- | -- |
| NMNH 118001-70 | Basalt | -- | -- |
| NMNH 118001-71 | Basalt | -- | -- |
| NMNH 118001-72 | Basalt | -- | -- |
| NMNH 118001-73 | Basalt | -- | -- |
| NMNH 118001-74 | Basalt | -- | -- |
| NMNH 118001-75 | Basalt | -- | -- |
| NMNH 118001-76 | Basalt | -- | -- |
| NMNH 118001-77 | Basalt | -- | -- |
| NMNH 118001-78 | Pele's Hair | -- | -- |
| NMNH 118001-79 | Igneous Rock | -- | -- |
| NMNH 118001-8 | Ash | -- | -- |
| NMNH 118001-80 | Scoria | -- | -- |
| NMNH 118001-81 | Basalt | -- | -- |
| NMNH 118001-82 | Scoria | -- | -- |
| NMNH 118001-83 | Igneous Rock | -- | -- |
| NMNH 118001-84 | Basalt | -- | -- |
| NMNH 118001-85 | Basalt | -- | -- |
| NMNH 118001-86 | Basalt | -- | -- |
| NMNH 118001-87 | Andesite | -- | -- |
| NMNH 118001-88 | Basalt | -- | -- |
| NMNH 118001-89 | Basalt | -- | -- |
| NMNH 118001-9 | Ash | -- | -- |
| NMNH 118001-90 | Andesite | -- | -- |
| NMNH 118001-91 | Andesite | -- | -- |
| NMNH 118001-92 | Andesite | -- | -- |
| NMNH 118001-93 | Basalt | -- | -- |
| NMNH 118001-94 | Igneous Rock | -- | -- |
| NMNH 118001-95 | Igneous Rock | -- | -- |
| NMNH 118001-96 | Igneous Rock | -- | -- |
| NMNH 118001-97 | Basalt | -- | -- |
| NMNH 118001-98 | Basalt | -- | -- |
| NMNH 118001-99 | Igneous Rock | -- | -- |
| Copernicus Browser | The Copernicus Browser replaced the Sentinel Hub Playground browser in 2023, to provide access to Earth observation archives from the Copernicus Data Space Ecosystem, the main distribution platform for data from the EU Copernicus missions. |
| MIROVA | Middle InfraRed Observation of Volcanic Activity (MIROVA) is a near real time volcanic hot-spot detection system based on the analysis of MODIS (Moderate Resolution Imaging Spectroradiometer) data. In particular, MIROVA uses the Middle InfraRed Radiation (MIR), measured over target volcanoes, in order to detect, locate and measure the heat radiation sourced from volcanic activity. |
| MODVOLC Thermal Alerts | Using infrared satellite Moderate Resolution Imaging Spectroradiometer (MODIS) data, scientists at the Hawai'i Institute of Geophysics and Planetology, University of Hawai'i, developed an automated system called MODVOLC to map thermal hot-spots in near real time. For each MODIS image, the algorithm automatically scans each 1 km pixel within it to check for high-temperature hot-spots. When one is found the date, time, location, and intensity are recorded. MODIS looks at every square km of the Earth every 48 hours, once during the day and once during the night, and the presence of two MODIS sensors in space allows at least four hot-spot observations every two days. Each day updated global maps are compiled to display the locations of all hot spots detected in the previous 24 hours. There is a drop-down list with volcano names which allow users to 'zoom-in' and examine the distribution of hot-spots at a variety of spatial scales. |
|
WOVOdat
Single Volcano View Temporal Evolution of Unrest Side by Side Volcanoes |
WOVOdat is a database of volcanic unrest; instrumentally and visually recorded changes in seismicity, ground deformation, gas emission, and other parameters from their normal baselines. It is sponsored by the World Organization of Volcano Observatories (WOVO) and presently hosted at the Earth Observatory of Singapore.
GVMID Data on Volcano Monitoring Infrastructure The Global Volcano Monitoring Infrastructure Database GVMID, is aimed at documenting and improving capabilities of volcano monitoring from the ground and space. GVMID should provide a snapshot and baseline view of the techniques and instrumentation that are in place at various volcanoes, which can be use by volcano observatories as reference to setup new monitoring system or improving networks at a specific volcano. These data will allow identification of what monitoring gaps exist, which can be then targeted by remote sensing infrastructure and future instrument deployments. |
| Volcanic Hazard Maps | The IAVCEI Commission on Volcanic Hazards and Risk has a Volcanic Hazard Maps database designed to serve as a resource for hazard mappers (or other interested parties) to explore how common issues in hazard map development have been addressed at different volcanoes, in different countries, for different hazards, and for different intended audiences. In addition to the comprehensive, searchable Volcanic Hazard Maps Database, this website contains information about diversity of volcanic hazard maps, illustrated using examples from the database. This site is for educational purposes related to volcanic hazard maps. Hazard maps found on this website should not be used for emergency purposes. For the most recent, official hazard map for a particular volcano, please seek out the proper institutional authorities on the matter. |
| IRIS seismic stations/networks | Incorporated Research Institutions for Seismology (IRIS) Data Services map showing the location of seismic stations from all available networks (permanent or temporary) within a radius of 0.18° (about 20 km at mid-latitudes) from the given location of Fernandina. Users can customize a variety of filters and options in the left panel. Note that if there are no stations are known the map will default to show the entire world with a "No data matched request" error notice. |
| UNAVCO GPS/GNSS stations | Geodetic Data Services map from UNAVCO showing the location of GPS/GNSS stations from all available networks (permanent or temporary) within a radius of 20 km from the given location of Fernandina. Users can customize the data search based on station or network names, location, and time window. Requires Adobe Flash Player. |
| DECADE Data | The DECADE portal, still in the developmental stage, serves as an example of the proposed interoperability between The Smithsonian Institution's Global Volcanism Program, the Mapping Gas Emissions (MaGa) Database, and the EarthChem Geochemical Portal. The Deep Earth Carbon Degassing (DECADE) initiative seeks to use new and established technologies to determine accurate global fluxes of volcanic CO2 to the atmosphere, but installing CO2 monitoring networks on 20 of the world's 150 most actively degassing volcanoes. The group uses related laboratory-based studies (direct gas sampling and analysis, melt inclusions) to provide new data for direct degassing of deep earth carbon to the atmosphere. |
| Large Eruptions of Fernandina | Information about large Quaternary eruptions (VEI >= 4) is cataloged in the Large Magnitude Explosive Volcanic Eruptions (LaMEVE) database of the Volcano Global Risk Identification and Analysis Project (VOGRIPA). |
| EarthChem | EarthChem develops and maintains databases, software, and services that support the preservation, discovery, access and analysis of geochemical data, and facilitate their integration with the broad array of other available earth science parameters. EarthChem is operated by a joint team of disciplinary scientists, data scientists, data managers and information technology developers who are part of the NSF-funded data facility Integrated Earth Data Applications (IEDA). IEDA is a collaborative effort of EarthChem and the Marine Geoscience Data System (MGDS). |

