Explosive activity, major uplift, and fault formation during 31 March-early May 2000
As reported in BGVN 25:03, an eruption at Usu began on 31 March 2000 following several days of increased seismicity. A description of eruption precursors was presented in BGVN 25:06. This report summarizes activity between the 31 March eruption and early May 2000. Vigorous activity continued throughout April 2000 (figures 29 and 30), and activity was continuing in May.
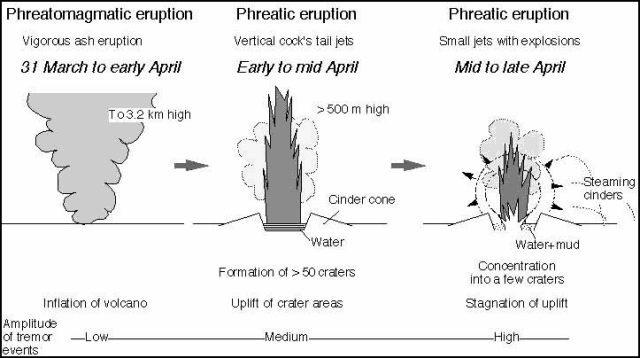 |
Figure 29. Schematic illustration showing the eruption sequence at Usu during 31 March-late April 2000. Courtesy of VRC, ERI. |
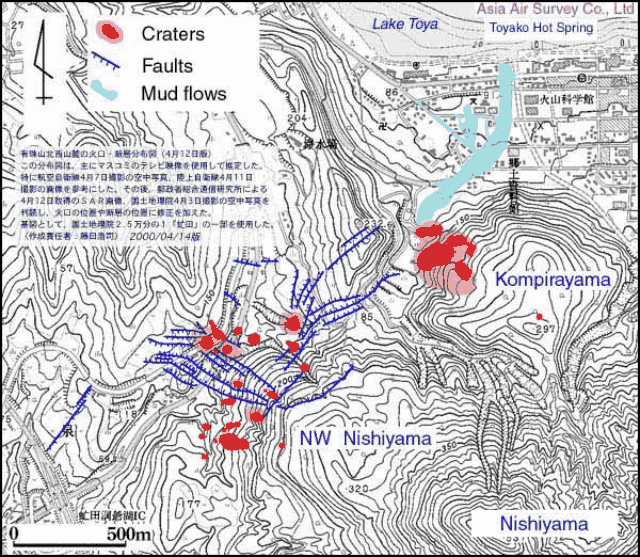 |
Figure 30. Map showing the distribution of active craters, faults, and mudflows as of 14 April 2000. Usu's summit rises to the S, outside the map area. Courtesy of Asia Air Survey Co. Ltd. |
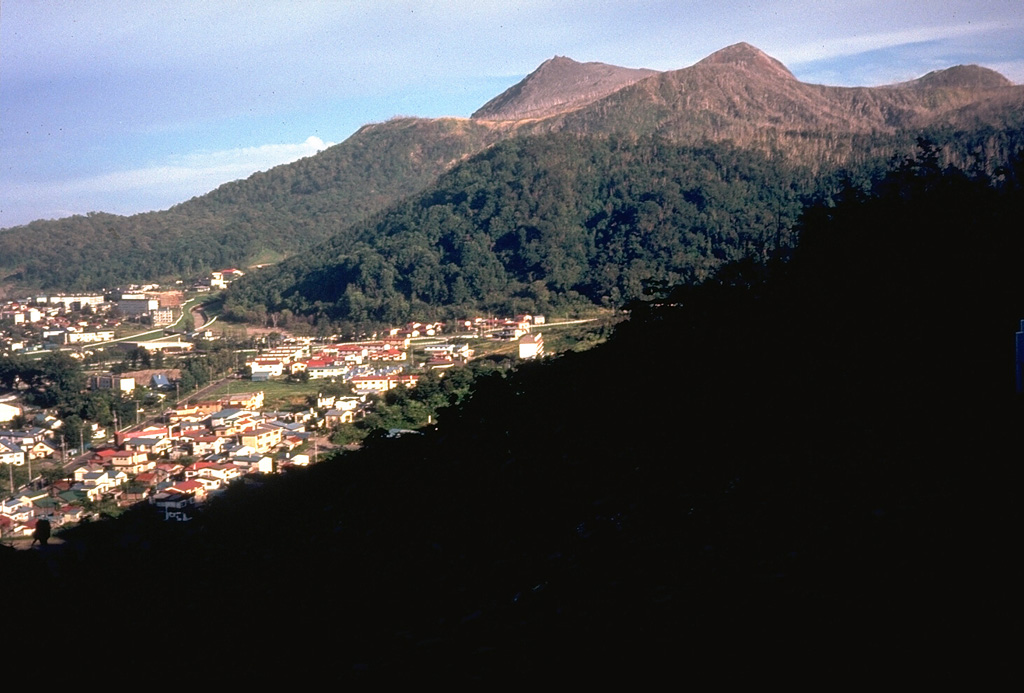
According to the Geographical Survey Institute, the region including the crater areas was elevated 3.3 m/day during the three days from 31 March to 3 April, suggesting the formation of a new cryptodome similar to Meiji-Shinzan, a cryptodome that formed on Usu's N flank in 1910 and Showa-Shinzan, a cryptodome and lava dome that formed during 1944-45 (figure 31).
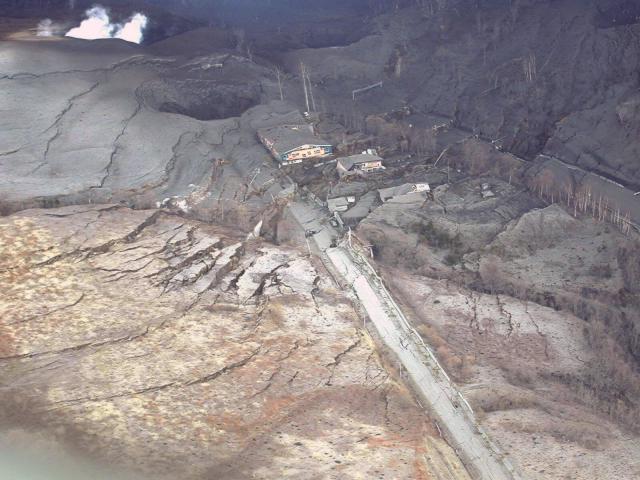 |
Figure 31. View from a helicopter facing N on 17 April 2001, showing multiple steaming vents in the background and several faults formed by uplift of the NW Nishi-yama area. Courtesy of S. Nakada. |
Around 6 April 2000, the eruption style changed from phreatomagmatic ash emissions to phreatic ejection of vertical cock's-tail jets reaching 500 m above the craters. By 10 April, more than 30 craters had formed in the Kompira-yama and NW Nishi-yama areas (figures 30 and 32). Cinders ejected by the continuing explosions steamed after they landed around the craters. The temporal changes in eruption style can be explained by assuming that the magma approached an overlying aquifer, estimated to lie between 0 and 300 m below sea level, and passed almost directly through it. According to the Usu Volcano Observatory, the amplitude of volcanic tremors increased after 6 April and increased further after 12 April.
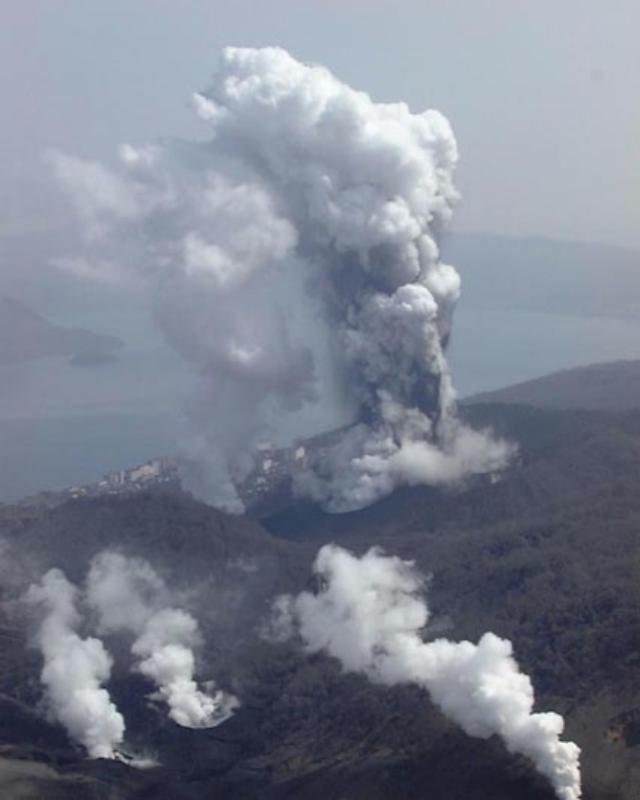 |
Figure 32. View from a helicopter looking NE on 10 April 2001, showing multiple active vents within the Kompira-yama (center) and NW Nishi-yama (foreground) crater areas. Toyako Hot Spring and town lie in the background. Courtesy of S. Nakada. |
Eruptions continued though late April, although plume activity decreased. White clouds were emitted from the Kompira-yama and NW Nishi-yama craters. Small explosions were observed. Cinders ejected from NW Nishi-yama dusted the Kompira-yama craters. The plumes frequently darkened with ash, implying partial collapse of vent walls. The principal active craters in both areas grew to a few hundred meters across and had dry funnel-shaped floors.
Uplift continued at a decreased rate in the NW Nishi-yama area. The total height of the uplift was 60 m by the end of April according to an air-photo survey by the Geographical Survey Institute. Uplift was < 20 m for the Kompira-yama area except for the crater rims. The total volume of uplift in the two crater areas was estimated to be ~40 x 106 m3; one order of magnitude smaller than the volume of the 1944-45 Showa-Shinzan dome. According to the Joint University Research Group, the uplift rate was the highest in the initial stage of eruption and decreased exponentially to ~10 cm/day by early May.
Information Contacts: Setsuya Nakada and Hidefumi Watanabe, Volcano Research Center, Earthquake Research Institute, University of Tokyo, Yayoi 1-1-1, Bunkyo-ku, Tokyo 113-0032, Japan (URL: http://www.eri.u-tokyo.ac.jp/VRC/index_E.html); Geological Survey of Japan, 1-1-3 Higashi, Ibaraki, Tsukuba 305, Japan (URL: https://www.gsj.jp/); Geographical Survey Institute of Japan (URL: http://www.gsi-mc.go.jp/); Usu Volcano Observatory, Institute of Seismology and Volcanology, Graduate School of Science, Hokkaido University, Sohbetsu-cho, Usu-gun, Hokkaido, 052-0103, Japan (URL: http://www.sci.hokudai.ac.jp/isv/english/); Tatsuro Chiba, Asia Air Survey Co. Ltd..
The Global Volcanism Program has no Weekly Reports available for Toya.
Reports are organized chronologically and indexed below by Month/Year (Publication Volume:Number), and include a one-line summary. Click on the index link or scroll down to read the reports.
Major eruption on 7 August from a new vent
A major eruption began at 0912 on 7 August 1977 from a new vent [on the SE slope of] Ko-Usu dome (figure 1), after [32] hours of premonitory seismicity. About [0.08] km3 of hypersthene dacite tephra has been ejected, in eruption columns that rose to 10 km or more on four occasions (figure 2). Ashfalls forced the evacuation of about 20,000 tourists and 7,000 residents from nearby towns, and caused serious crop damage, particularly N of the volcano (figures 3 and 4). Table 1 is a summary of the eruption.
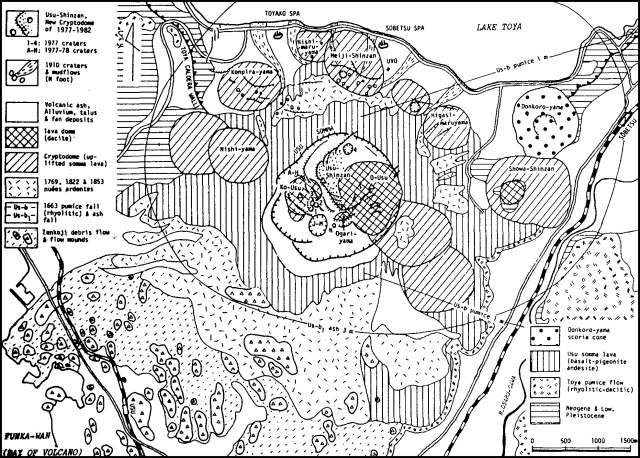 |
Figure 1. Geologic map of Usu showing vent locations for the eruption that began in August 1977. From Katsui and others, 1985. |
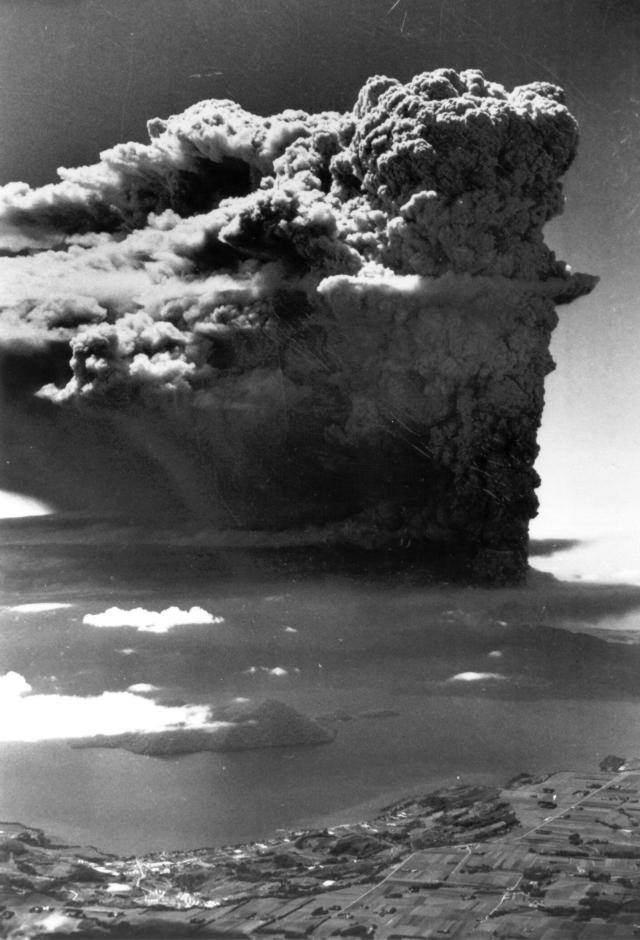 |
Figure 2. Ash-laden cloud from Usu at 0950 on 7 August 1977, 38 minutes after the eruption began. View approximately to the S. Photo by The Hokkaido Shinbun, courtesy of Yoshio Katsui. |
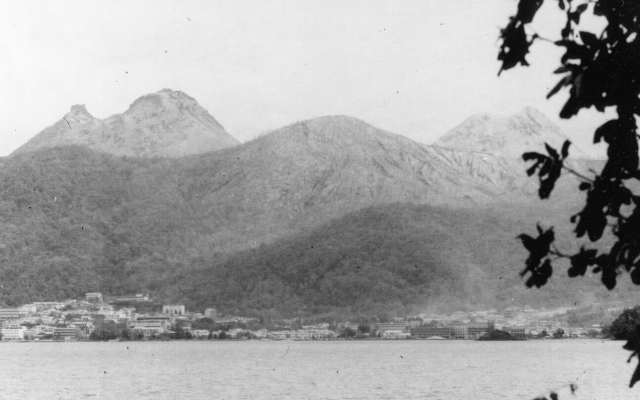 |
Figure 3. Usu volcano on 12 August 1977 looking SE across Lake Toya with the town of Toyako-Spa in the foreground. O-Usu (left) and Ko-Usu (right) lava domes lie within the Usu somma. The first three major explosive eruptions 7-9 August originated from vents behind Ko-Usu in this view; the fourth major eruption on 9 August occurred from a vent in front of O-Usu. Trees on the upper slopes were completely stripped of leaves by volcanic ejecta. Photo by Lee Siebert. |
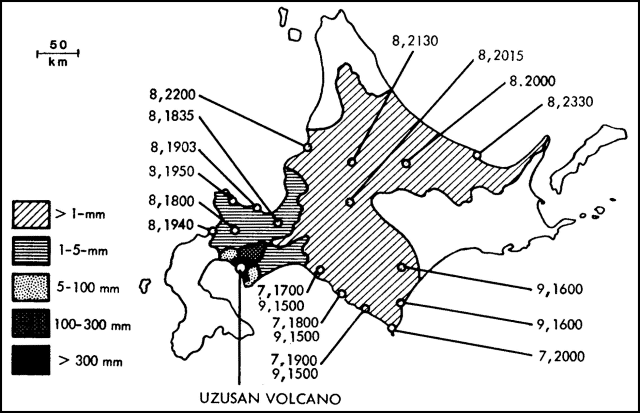 |
Figure 4. Map showing distribution of Usu's ash on the island of Hokkaido. Open circles are sampling localities. The associated numbers refer to the date and time of first appearance(s) at each locality of [pumice from] explosions on 7, 8, and 9 August 1977. Courtesy of JMA. |
Table 1. Summary of explosions from Usu, 7-14 August 1977. Vent numbers correspond to those shown in figure 1. Cloud heights (in km) are approximate. Adapted from Katsui and others (1978).
| Date | Time | Vent | Cloud Height | Ashfall Azimuth | Remarks |
| 07 Aug 1977 | 0912-1140 | 1 | 12 | S 60 E | Up to 30 cm of ash and breccia fell 4 km away. Airplane windows were cracked by tephra at 3,600 m altitude. Lightning accompanied the eruption cloud. "White smoke." |
| 07 Aug 1977 | 1331 | 1 | 2 | -- | -- |
| 07 Aug 1977 | 1620 | 1 | 1.5 | -- | -- |
| 07 Aug 1977 | 1822 | 1 | 1.5 | -- | -- |
| 08 Aug 1977 | 1335-1410 | 2 | -- | -- | -- |
| 08 Aug 1977 | 1537-1800 | 2 | 10 | N 40 W | Ash reached Asahigawa, 180 km NE. Pumice up to 20 cm diameter fell 3 km away. |
| 08 Aug 1977 | 1900 | 2 | -- | -- | -- |
| 08-09 Aug 1977 | 2340-0215 | 3 | 10? | N 45 W | Incandescent material rose several hundred meters. |
| 09 Aug 1977 | 0530-0730 | 3 | 6? | N 10 E | Ash reached the Sea of Okhotsk, about 75 km N. |
| 09 Aug 1977 | 0815-0825 | 3 | 1.5 | -- | -- |
| 09 Aug 1977 | 0855-0905 | 3 | 1.5 | -- | -- |
| 09 Aug 1977 | 0908-0925 | 3 | 1 | -- | -- |
| 09 Aug 1977 | 1020-1105 | 4 | 4 | N 75 E | -- |
| 09 Aug 1977 | 1120-1420 | 4 | 9 | S 65 E | -- |
| 12 Aug 1977 | 0812-0900 | 3 | 2.5 | N 35 W | "Black smoke." |
| 13-14 Aug 1977 | 2237-0155 | 3 | 4? | N 70 E | Two centimeters of pumice nearby; eruption accompanied by lightning. |
Earthquake frequency exceeded 100 events/hour during the premonitory swarm, then ranged between 60 and [120]/hour until the afternoon of 16 August, when a decline to 40/hour occurred. [Seismicity declined suddenly when explosions occurred (figure 5).] By 24 August, event frequency had declined further but magnitudes had increased to a maximum of 4, resulting in an increase in total energy release. Hypocenters were 1-2 km beneath the [summit].
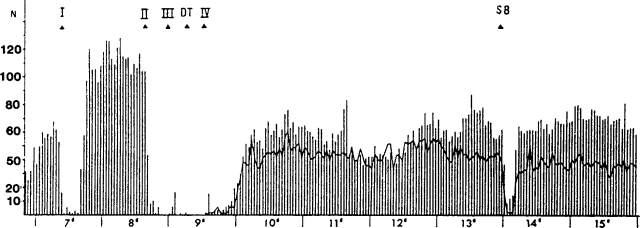 |
Figure 5. Hourly seismicity at Usu from the night of 6-7 August to 15 August 1977. Decreases in seismicity accompanied major explosive episodes, indicated by small triangles. Courtesy of JMA. |
Uplift and fissuring were observed on 12 August between Ko-Usu and O-Usu domes. Ground temperatures in this area were elevated to 33°C from the normal 24°C. Usu last erupted 23 June 1944-30 September 1945, producing Showa-Shinzan dome [at the E foot of the volcano].
Reference. Katsui, Y., Komuro, H., and Uda, T., 1985, Development of faults and growth of Usu-shinzan cryptodome in 1977-1982 at Usu volcano, north Japan: Journal of the Faculty of Science, Hokkaido University, ser. IV: Geology and Mineralogy, v. 21, no. 3, p. 339-362.
Information Contacts: T. Tiba, National Science Museum, Tokyo; L. Siebert, SI; J. Bloom, U.S. Embassy, Tokyo.
Cryptodome rises to 70 m by late September
No explosions have been reported since 14 August, but a new cryptodome at the E foot of Ko-Usu, surrounded by a 1.5-km semicircular fissure zone, had risen about 70 m by late September. Local earthquake swarms continued.
Information Contacts: Y. Katsui, Hokkaido Univ.; JMA, Tokyo; L. Siebert, SI; Asahi Evening News.
Continued cryptodome uplift and weak emission of steam clouds
Surface activity during September was confined to continued cryptodome uplift and weak emission of steam clouds, which rose a maximum of 600 m from summit vents [produced by the August eruption]. Daily recorded seismic events, including many felt shocks, declined irregularly through September, but remained high at the end of the month (figure 6).
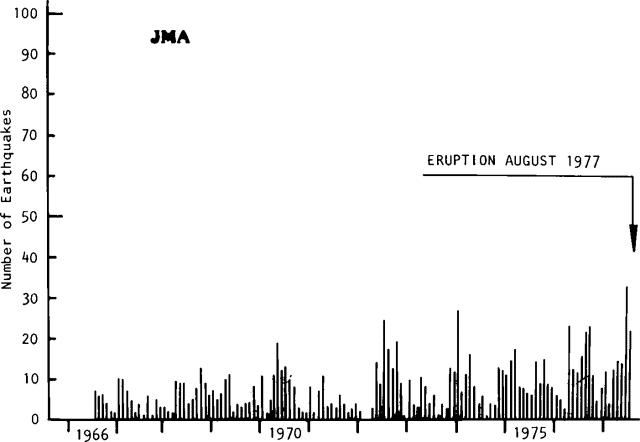 |
Figure 6. Graph of monthly volcanic earthquakes at Usu, July 1966-July 1977 [showing a gradual increase in seismicity]. The monthly mean is 9. Courtesy of JMA. |
Information Contacts: JMA, Tokyo.
Small steam explosion from three new vents on 16 November
Weak emission of white to grayish-white steam from small craters and fissures near Ko-Usu and O-Usu continued through October, reaching a maximum height of 400 m above the vents. Uplift of Ogari-yama [a large block making up most of the 2 km-diameter somma's NE quadrant, that has been uplifted] at the E foot of Ko-Usu since August, continued during October at the rate of about 45 cm/day, while Ko-Usu itself subsided about 40 cm/day. Another [unnamed peak of the uplifting block], about 240 m ENE of Ko-Usu's summit, rose 60 cm/day in October.
A small steam explosion from three new vents began between 0300 and 0400 on 16 November (figure 7) and lasted until about 0930. The explosion, the first from Usu since 14 August, produced a 300-m cloud and was accompanied by rumbling. The new vents (one is 6 m in diameter, the other two about 2 m in diameter) are clustered atop a 25-m-diameter rise at the edge of the unnamed new cryptodome. Several hundred local earthquakes per day continued to be recorded (figure 8).
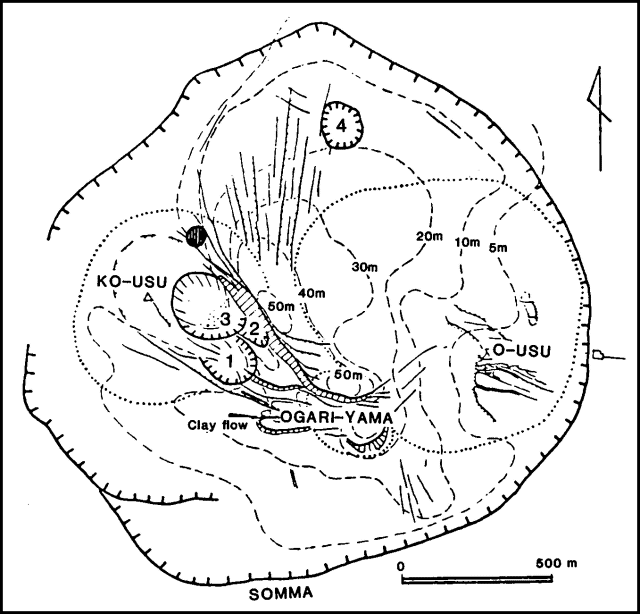 |
Figure 7. Region within Usu's somma. Solid lines are faults and fractures, dashed lines show amount of new uplift as of 23 August, and dotted lines outline pre-existing domes (Ko-Usu, O-Usu, and Ogari-yama). New craters are numbered. The location of the 16 November 1977 vent is shown by a small shaded circle N of vent 3; location was provided by JMA. From Katsui and others, 1978. |
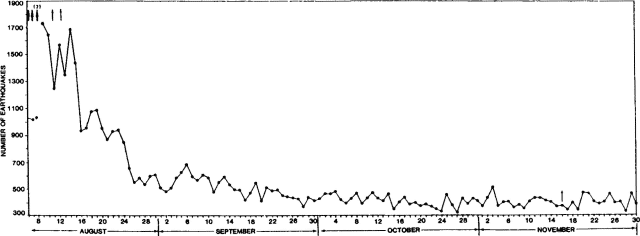 |
Figure 8. Number of seismic events/day, 7 August-30 November 1978, recorded by a JMA seismograph 2.3 km N of the summit of O-Usu. Heavy arrows indicate major explosions, lighter arrows smaller explosions [considered to be phreatic]. Continuous [eruption] tremor, represented by * prevented a [precise] earthquake count on 9 August. Courtesy of JMA. |
Reference. Katsui, Y., Oba, Y. Onuma, K, Suzukuki, T., Kondo, Y., and others, 1978, Preliminary report of the 1977 eruption of Usu volcano: Journal of the Faculty of Science, Hokkaido University, Ser. 4, v. 18, p. 385-408.
Information Contacts: T. Tiba, National Science Museum, Tokyo; JMA, Tokyo.
Weak steam emission through November
Weak emission of white to grayish-white steam continued through November from small craters and fissures near the summits of Ko-Usu and O-Usu. During November, daily rates of uplift declined slightly at both [peaks of the uplifting block] (Ogari-yama and another centered about 240 m ENE of Ko-Usu's summit) to about 40 cm/day, from October rates of 45 and 60 cm/day respectively. Subsidence of Ko-Usu had also slowed, from 40 cm/day in October to about 30 cm/day in November. According to the Japan Times, a team of Hokkaido University geophysicists has located a shallow ellipsoidal aseismic zone beneath the two cryptodomes. The zone has a maximum dimension of 1 km and a minimum dimension of 0.5 km, but it was not possible to determine its depth from the newspaper article.
Further Reference. Yokoyama, I., 1978, The 1977 eruption of Usu volcano with a special reference to prediction of volcanic activities: Bulletin of the Volcanological Society of Japan, 2nd series, v. 23, no. 1, p. 65-82.
Information Contacts: Y. Katsui, Hokkaido Univ.; JMA, Tokyo; Japan Times.
Decreasing ground movement, but light tephra 13 January
Weak white and grayish-white steaming from vents and fissures near the summits of O-Usu and Ko-Usu continued during December, with a maximum cloud height of about 300 m. On 13 January, white steam clouds rose about 500 m from [a new vent (named B)] at 0740 and at 1125. A thin layer of ash was seen on top of snow at Date City (about 10 km SE of Usu) and Sobetsu (about 5 km NW of Usu).
Cryptodome uplift . . . declined slightly (to about 35 cm/day in December, from about 40 cm/day the preceding month). Subsidence at Ko-Usu, about 30 cm/day in November, decreased to about 15 cm/day in December. Daily local seismicity also decreased slightly in December.
Information Contacts: JMA, Tokyo; T. Tiba, National Science Museum, Tokyo; Y. Katsui, Hokkaido Univ.
Earthquake frequency increases; new cryptodome uplift slows
Weak steaming from vents and fissures on the slopes of . . . Ko-Usu and the new cryptodome NE of Ko-Usu continued during January. Steam clouds rose a maximum of 400 m above the vents. The rate of uplift of the new cryptodome briefly increased in late December to 38 cm/day (from 35 cm/day in mid-December), then declined to 31 cm/day in early January and to 26 cm/day by the end of the month. A team from Hokkaido University measured its summit altitude at 568 m in early January [compared to about 490 m altitude before the August 1977 eruption].
Daily earthquake frequency gradually increased at the end of January, and by late February had returned to the September rate. Epicentral distribution, according to Hokkaido University geophysicists, was unchanged, concentrated beneath Ko-Usu and the N portion of the somma, to slightly N of the somma.
Information Contacts: JMA, Tokyo; D. Shackelford, CA.
Two small eruptions in late February; cryptodome uplift and seismicity increase
Two small eruptions were observed during February, originating from vents 250-300 m ENE of the summit of Ko-Usu dome. The first occurred at 1559 on the 25th from a vent 2-3 m in diameter, producing a 500-m gray ash cloud and a trace of ashfall near the volcano. The dark gray ash cloud from the second eruption, at 0740 on 27 February, rose about 1,200 m from a 15-20-m-diameter crater, causing 2-3 mm of ashfall a few km SE of Usu.
The rate of uplift at the . . . cryptodome increased substantially, from about 23 cm/day in January to about 39 cm/day in February at Ogari-yama, and from 26 cm/day in late January to about 41 cm/day in February at the unnamed [peak] about 400 m E of the summit of Ko-Usu. February subsidence at Ko-Usu continued at the January rate of about 8 cm/day. Daily earthquake counts at Usu began to increase in late January and remained relatively high through most of February (figure 9).
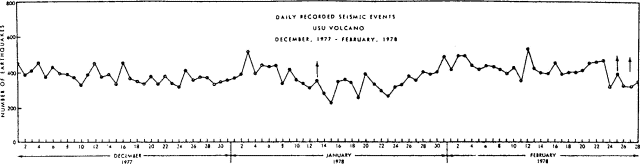 |
Figure 9. Number of seismic events/day during l December 1977-28 February 1978, recorded by a JMA seismograph 2.3 km N of the summit of O-Usu. Arrows mark steam explosions. Courtesy of JMA. |
Information Contacts: JMA, Tokyo; T. Tiba, National Science Museum, Tokyo.
Small steam explosions continue through April; seismicity and uplift rate decline
The steam explosions of 25 and 27 February were followed by similar events, each lasting a few hours, on 2, 3, 4, 5, 6, 9, 11, and 14 March, and on 24 April, causing slight ashfalls around the volcano. All of the explosions originated from a small area NE of Ko-Usu, where geologists found eight small vents on 5 March.
After a sharp increase to 39 cm/day in February, the rate of uplift at Ogari-yama had declined to 26 cm/day by late March and averaged 24 cm/day in April. . . . Daily earthquake counts also increased substantially in February to a monthly average of 411/day, but decreased to 345/day in March and 260/day in April. . . .
Information Contacts: JMA, Tokyo.
Seven new steam explosions, causing minor ashfalls
After 30 days of quiescence, steam explosions occurred on 26, 29, and 31 May, and 1, 2, 4, and 7 June, causing ashfalls on surrounding villages. The largest explosion produced a 3-mm ash deposit in a village at the foot of the volcano, and blocks were scattered in the summit crater, 500 m from the vent. Scientists from the University of Hokkaido observed the ejection of incandescent blocks during the night of 2 June, the first incandescent ejecta recognized since the initial large [pumice eruptions] of August 1977. This suggests that the rising magma column is now near the surface.
. . . The general downtrend in daily seismicity that began in February continued through early June. The rate of uplift at the new cryptodome (centered about 400 km E of the summit of Ko-Usu) increased sharply in February, but began to decrease in March and continued to decrease through May (data from I. Yokoyama).
Information Contacts: JMA, Tokyo.
Uplift slows, but steam explosions continue
Steam explosions continued through late July, with ashfalls around the volcano from those observed on 2, 3, 4, 7, 11, 22, 26, 28, and 30 June, and 2 July. The rate of uplift at the new cryptodome decreased to 17.6 cm/day in May and 13.6 cm/day in June. Subsidence of Ko-Usu dome has virtually stopped.
The Japan Times reported a 5-minute eruption on 16 July, with ejecta rising about 1,000 m above the vent. Reuters reported that eruption columns reached 2,000 m on [29] July. [Ash eruptions occurred frequently 15-31 July.]
Information Contacts: JMA, Tokyo; Japan Times; Reuters.
Steam explosions and glow; trends of declining seismicity and slower uplift continue
Steam explosions continued, occurring on 2, 9, 10, 15-17, 25, and 28-31 July. The 15 July explosions deposited 10 mm of ash on nearby villages, the largest ashfall since November 1977. Vent I (figure 10), site of explosions in April, late May, and June became quiescent, but reflected glow could be seen above this area at night in June and July. Vents J, K, and L (about 300 m SE of vent I) were formed by explosions on 9, 15, and 16 July, respectively. Vigorous steam emission accompanied by continuous tremor enlarged the vents.
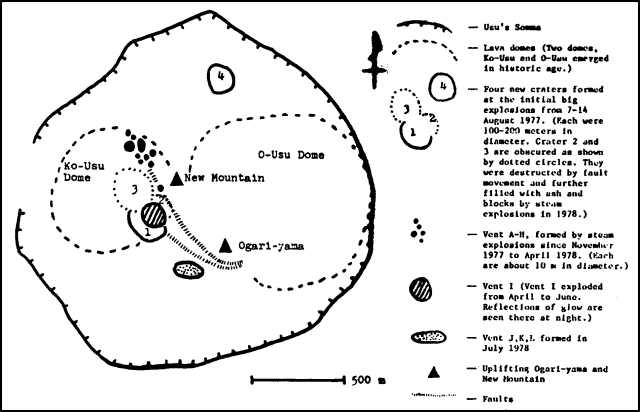 |
Figure 10. Sketch map of the summit area as of July 1978. Courtesy of JMA. |
Mean daily seismicity fell to 175 events, of which an average of 23/day were felt. Uplift rates at . . . the new cryptodome ENE of Ko-Usu continued to decrease. . . . Subsidence of Ko-Usu dome has virtually ceased.
The Kyodo broadcasting company reported an explosion of Usu at 0325 on 24 August. The ash cloud rose about 800 m and ash fell on Noboribetsu, about 30 km from Usu. Shortly after the explosion, glow was seen above the summit for several minutes. An increase in local seismicity occurred 2 days before the explosion; 345 events were recorded 22 August, but only 102 on the 23rd.
Information Contacts: JMA, Tokyo; I. Yokoyama and Y. Katsui, Hokkaido Univ.; Kyodo broadcasting company.
Explosions increasingly frequent; incandescence visible
Steam explosions were more frequent in August than in July. Explosions, most lasting no more than 15 minutes, occurred on 1, 3, 7-14, 16-20, 24-26, and 28-30 August, causing ashfalls in nearby villages. More than 1 cm of ash was deposited on villages a few km E of Usu after explosions on 16 and 24 August. During the 24 August activity, [an incandescenct column 300 m high] was visible from the base of the volcano for the first time since Usu's major eruption of August 1977. The August explosions produced a 350 x 200 m crater in the S portion of the summit area, engulfing the smaller vent active in July. Crater growth persisted through early September.
The rates of uplift at the new cryptodome . . . continued to decline, to 7 cm/day during August. Local seismicity also continued to decline, to an average of 91 events/day, about 1/6 of which were felt. Tokiko Tiba reported that explosions from 2215-2235 on 12 September and 0030-0217 on 13 September produced a 3-km eruption cloud, accompanied by lightning, and 1-5 cm of ashfall on Toyako-spa, about 3 km NNW of the active crater.
Information Contacts: JMA, Tokyo; I. Yokoyama, Hokkaido Univ.; T. Tiba, National Science Museum, Tokyo.
Stronger explosions, including incandescent ejecta; ashfall to N; seismicity and cryptodome uplift rates increase slightly
Explosions were recorded on 1-2, 5-8, 11-13, 20-22, 24-25, and 27-28 September. Most lasted only a few minutes and produced ashfalls of no more than 0.5 mm in thickness (figures 11 and 12). However, the two explosions that occurred during the night of 12-13 September were the largest since steam explosions began in November 1977. Ash clouds, accompanied by much lightning, rose 2.5 km above the crater and deposited up to 3.5 cm of ash over a broad area N of the volcano. Columns of incandescent tephra, about 600 m high, were present over the crater for three 10-minute periods during the 12-13 September activity, dropping blocks in the summit area. All of the September explosions occurred from the newly-named Gin-numa Crater, which had grown to a roughly circular feature, 350 m in diameter and 70 m deep, by the end of the month.
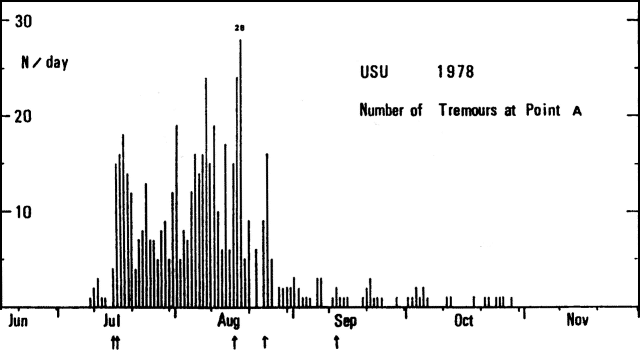 |
Figure 11. Daily number of continuous tremor episodes, lasting from 1 minute to 1 hour, recorded at Usu July-October 1978. Tremor episodes correspond to periods of ash emission. Arrows indicate larger explosions. |
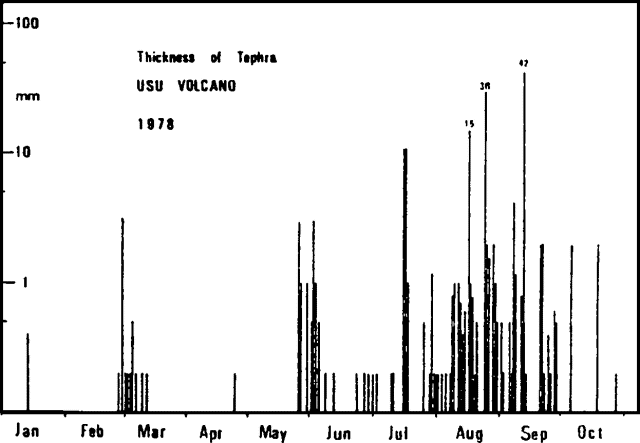 |
Figure 12. Daily thickness (in mm) of newly-deposited tephra at the foot of Usu. Note logarithmic scale. |
Cryptodome uplift rates and the number of local earthquakes per day both increased slightly in September, after several months of decline.
Information Contacts: JMA, Tokyo; I. Yokoyama, Hokkaido Univ.
Lahar kills three nearby; explosions decline
A lahar flowed through the town of Toyako-spa (at Usu's NW foot) on 24 October, killing three persons, destroying 16 houses, and damaging 20 others. However, the number of summit area explosions declined to three in October (one each on the 5th, 18th, and 27th) after one or more had been recorded on 16 days in September. The 5 October explosion originated from Gin-numa crater, active since August, but a new 30-m-diameter vent (labeled N in figure 13) opened less than 100 m to the NE on 18 October and was the source of the explosions on the 18th and 27th.
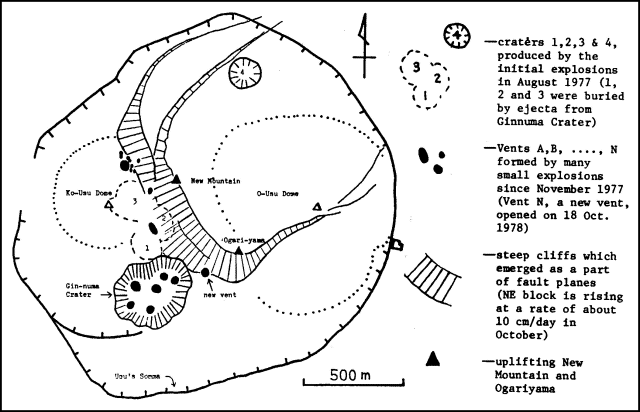 |
Figure 13. Map of the Usu summit area, late October 1978. Locations were surveyed by the Katsui group of the University of Hokkaido and JMA The figure was adapted by Manabu Komiya from the Katsui Group report. |
I. Yokoyama reported that both the average number of earthquakes per day and the rate of cryptodome uplift increased slightly in October, continuing a trend that began the preceding month.
Information Contacts: JMA, Tokyo; I. Yokoyama, Hokkaido Univ.
Activity declines, but deformation and seismicity continue
The number of days per month in which one or more explosions were recorded has dropped sharply, from 21 in August to three in October.
As of early December, there had been no explosions since 27 October. Local seismicity declined to an average of 79 earthquakes per day in November, and I. Yokoyama reported that the rate of cryptodome uplift decreased to 6.5 cm/day. Both seismicity and cryptodome uplift rates had increased slightly in September and October but have been on a general downward trend since February.
Since the initial explosions of August 1977, the N portion of Usu's somma has been slowly moving outward, causing severe local faulting at the N foot of the volcano. The distance between the N rim of the somma and the shore of Lake Toya decreased by about 65 m September 1977-March 1978 (Yokoyama, 1978). Numerous small faults have formed, damaging or destroying buildings in the area (figure 14). Some roads have been cut by faults (figure 15), and underground water pipes, telephone cables, and tubes for hot spring water have been cut at several hundred points.
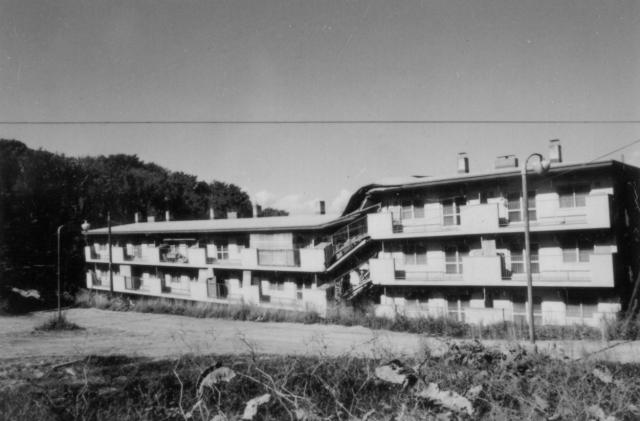 |
Figure 14. Apartment building near Usu damaged by faulting (and now abandoned). Photo taken in October 1978. Courtesy of Manabu Komiya. |
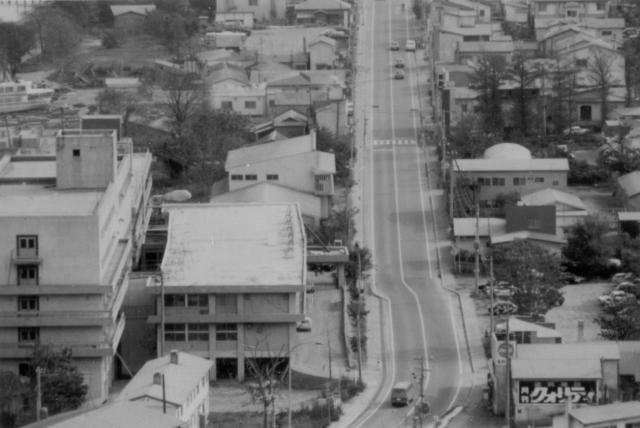 |
Figure 15. Two-meter fault dislocation in a road [2 km NW of] Usu. Note the slight distortion of the flat-roofed building in left-center foreground. Fault movement began in October 1977. Photo taken in October 1978. Courtesy of Manabu Komiya. |
Further References. Imagawa, T., 1986, Mud and debris flows on Mt. Usu after the 1977-1978 eruptions: Environmental Science, Hokkaido, v. 9, no. 1, p. 113-135.
Katsui, Y., Yokoyama, I., Watanabe, H., and Murozumi, M., 1981, Usu volcano, in Katsui, Y. (ed.), Symposium on Arc Volcanism Field Excursion guide to Usu and Tarumai Volcanoes and Noboribetsu Spa, Part I: Volcanological Society of Japan, Tokyo, p. 1-37.
Niida, K., Katsui, Y., Suzuki, T., and Kondo, Y., 1980, The 1977-1978 eruption of Usu volcano: Journal of the Faculty of Science, Hokkaido University, ser. IV, v. 19, p. 357-394.
Seki, K. (ed.), 1978, Usu eruption and its impact on environment: Hokkaido University, Sapporo, 496 p. (41 papers).
Yokoyama, I., Yamashita, H., Watanabe, H., and Okada, H., 1981, Geophysical characteristics of dacite volcanism - 1977-1978 eruption of Usu volcano: JVGR, v. 9, p. 335-358.
Japan Meterological Agency, 1980, The eruption of Usu volcano (August 1977-December 1978): Technical Reports of the JMA, v. 99, 203 p.
Information Contacts: JMA, Tokyo; I. Yokoyama, Hokkaido Univ.
Voluminous steaming continues; no explosions in 3 months
No explosions have occurred since 27 October 1978, although voluminous steam emission has been continuous. The average number of seismic events per day was 84 in December, up slightly from 79/day in November.
Information Contacts: JMA, Tokyo.
Cryptodome uplift rate continues decline; 2 year history summarized graphically
No explosions occurred in January 1979. The average number of local earthquakes/day declined slightly, from 84 in December to 76 in January (figure 16), and the rate of cryptodome uplift also showed a small decrease. The ground deformation continued NW of the volcano, but stopped to the N, NE, and E (figure 17).
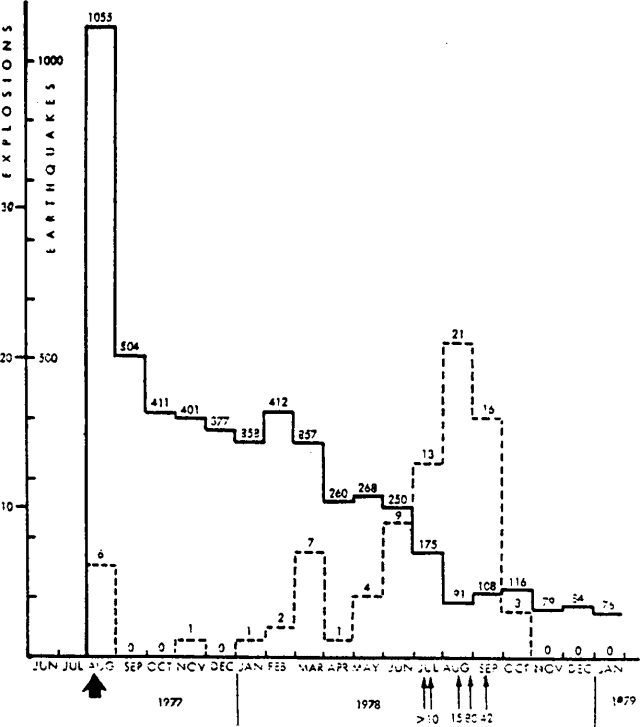 |
Figure 16. Monthly means of Usu's daily seismicity recorded by a seismograph 2.3 km N of Usu (solid line), and number of days per month in which explosions occurred (dashed line), June 1977-January 1979. The double arrow represents the major explosions of 7-14 August 1977 and the single arrows indicate the most important of the much smaller 1978 explosions. The number beneath each single arrow is the thickness of tephra, in mm, deposited at the foot of the volcano by that explosion (data from figures 11 and 12). Courtesy of JMA. |
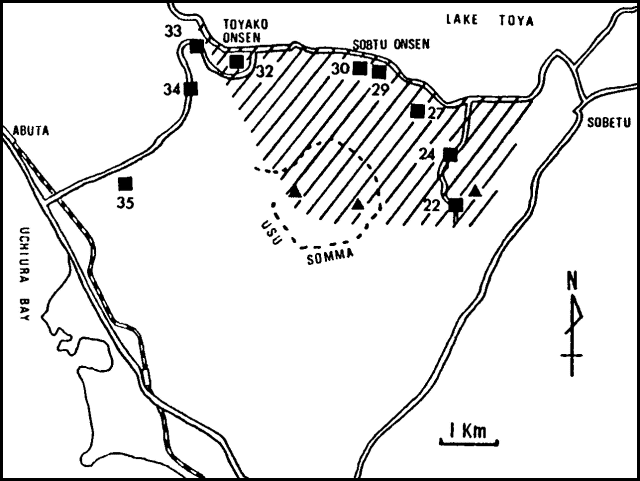 |
Figure 17. Map of Usu and vicinity, with the area affected by severe ground deformation shaded. Courtesy of JMA. |
Information Contacts: JMA, Tokyo.
Seismicity and cryptodome uplift rate continue to decline
The average number of earthquakes per day at Usu declined from 76 in January 1979 to 56 in February, and cryptodome uplift rates also decreased, to about 5 cm/day. No explosions have occurred since October.
Information Contacts: JMA, Tokyo.
Rates of seismicity and cryptodome uplift remain constant
No explosions have occurred since October 1978. In March, seismicity and the rate of cryptodome uplift remained at the same levels as in February.
Information Contacts: JMA, Tokyo.
Seismicity declines slightly
Seismicity declined from an average of 64 events/day in March to 61/day in April. No explosions have occurred since October 1978.
Information Contacts: JMA, Tokyo.
Uplift continues, but seismicity declines slightly and no new explosions
Monthly recorded seismicity continued to decline slightly in May, while cryptodome uplift remained constant at about 5 cm/day (figure 18). Ogari-yama and the Usu-Shinzan (Usu "New Mountain"), once thought to be separate cryptodomes, are now considered to be two peaks of a single [rising block]. Ogari-yama has risen 160 m since uplift began in August 1977. No explosions have occurred at Usu since 27 October 1978.
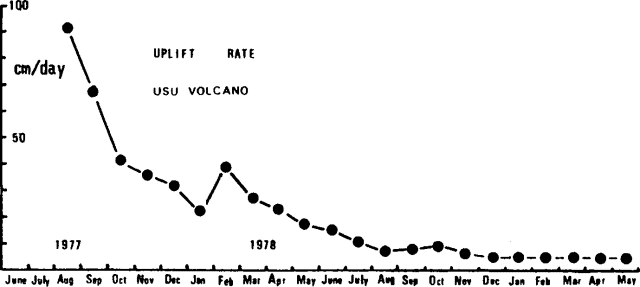 |
Figure 18. Rate of cryptodome uplift at Usu in cm/day, July 1977-May 1979. Courtesy of JMA. |
Information Contacts: JMA, Tokyo.
Slow seismic decline continues; elevation changes summarized
Yosihiro Sawada provided the following data (table 2) on total summit area elevation changes since activity began in August 1977 [based on results from Hokkaido University]. The uplift rate at Ogari-yama was 5 cm/day in May and 3 cm/day in July.
Table 2. Total elevation change at several features on Usu, as of 31 July 1979. Courtesy of Y. Sawada.
| Location | Elevation Change |
| New cryptodome | + 159.51 m |
| Ogari-yama | + 163.26 m |
| O-Usu | - 23 m |
| Ko-Usu | - 54.8 m |
Seismicity continued to decline slowly, from an average of 54 events/day in June to 47/day in July. The actual number of events per day sometimes varied considerably from the mean; in June, daily earthquakes ranged from 5 to 293.
When inspected on 31 July, Gin-numa Crater (formed by the activity of August-October 1978) contained a pool of water. Strong fumaroles on its rim had maximum measured temperatures of 635°C.
Information Contacts: Y. Sawada, MRI, Tokyo; D. Shackelford, CA.
Cryptodome uplift and seismicity continue
Seismic activity (table 3) and cryptodome uplift have continued through May 1980. The rate of cryptodome uplift and outward movement of the N somma wall both averaged about 5 cm/day in November 1979 and 4 cm/day in March 1980. In May, white vapor rose from three vents. Three new parallel faults with a combined throw of about 60 cm passed through the S portions of the active vents.
Table 3. Monthly means of the number of recorded earthquakes per day, July 1979-May 1980. Courtesy of JMA.
| Month | Mean Daily Earthquakes |
| Jul 1979 | 47 |
| Aug 1979 | 36 |
| Sep 1979 | 35 |
| Oct 1979 | 36 |
| Nov 1979 | 36 |
| Dec 1979 | 44 |
| Jan 1980 | 38 |
| Feb 1980 | 35 |
| Mar 1980 | 29 |
| Apr 1980 | 19 |
| May 1980 | 22 |
Information Contacts: JMA, Tokyo; D. Shackelford, Fullerton CA.
1980 cryptodome uplift and seismicity summarized
Cryptodome uplift and local seismicity continued through 1980. Local seismicity continued an irregular decline through 1980 (figure 19 and table 4). Felt shocks averaged 3/day in 1980, but swarms of 30-40 felt events in a single day occurred about once a month. . . . Careful correlation of seismic records with observed surface deformation and faulting revealed that larger earthquakes occurred simultaneously with measureable fault movements.
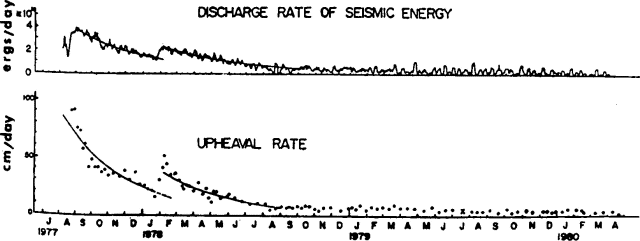 |
Figure 19. Monitoring data from Usu, August 1977-April 1980, showing discharge rate of seismic energy in ergs/day (top) and uplift rate in cm/day of the Usu-Shinzan cryptodome (bottom). Note the increase in February 1978. [Uplift] data are from I. Yokoyama. |
Table 4. Monthly number of local seismic events at Usu, 1980-81. Courtesy of JMA.
| Month | Recorded Events | Felt Events |
| Jan 1980 | [1177] | 234 |
| Feb 1980 | 1004 | 216 |
| Mar 1980 | 890 | 162 |
| Apr 1980 | 582 | 92 |
| May 1980 | [674] | 121 |
| Jun 1980 | [221] | 32 |
| Jul 1980 | 601 | 112 |
| Aug 1980 | 486 | 82 |
| Sep 1980 | 620 | 108 |
| Oct 1980 | 413 | 69 |
| Nov 1980 | 604 | 106 |
| Dec 1980 | [571] | 94 |
| Jan 1981 | 357 | 63 |
| Feb 1981 | 289 | 49 |
| Mar 1981 | 235 | 41 |
| Apr 1981 | 485 | 92 |
| May 1981 | 153 | 35 |
| Jun 1981 | 151 | 33 |
| Jul 1981 | 423 | 89 |
| Aug 1981 | 317 | 64 |
| Sep 1981 | 244 | 41 |
| Oct 1981 | 315 | 52 |
| Nov 1981 | [290] | 54 |
| Dec 1981 | 440 | 105 |
The rate of cryptodome uplift decreased through 1980, from 5 cm/day in January to 3-4 cm/day in December [at the peak of] Usu-Shinzan . Northward lateral movement of the N flank continued at a similar rate. As a result, compression of the ground N of the volcano also continued, affecting several towns and villages.
Information Contacts: JMA, Tokyo; I. Yokoyama, Hokkaido Univ.
Cryptodome growth slows; local seismicity continues
"The crustal deformation and local seismicity at Usu continued through 1981. The monthly number of recorded seismic events, having gradually declined since the major 1977 eruption, dropped further to about 308/month in 1981 but remained at about this level through the year (figure 20 and table 4). Gradually weakening steam activity from the craters formed in 1978 has been observed. Around these craters, there have been many fumaroles that vigorously emitted white vapor; highest temperature was 643°C in August 1981. According to the data from the Usu Volcano Observatory (Hokkaido University) the rate of uplift of the Usu-Shinzan cryptodome decreased from about 2/cm per day in 1980 to about 0.8 cm/day in 1981. The northward lateral movement of the N flank continued at a similar rate."
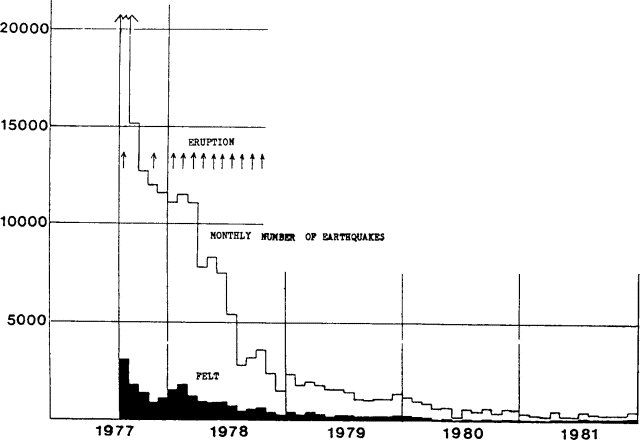 |
Figure 20. Graph of monthly numbers of recorded (white bars) and felt (black bars) seismic events at Usu, August 1977-December 1981, supplied by I. Yokoyama. [Eruptive] activity during a particular month is indicated by arrows. Earthquakes in August 1977 numbered at least 25,000. |
Information Contacts: I. Yokoyama, Hokkaido Univ.
Decreased seismic activity; negligible ground deformation
Seismicity and ground deformation at Usu ended in spring 1982, after 58 months of activity. The monthly number of recorded seismic events had gradually declined since the major eruption in 1977, but remained above background through 1981, when approximately 308 seismic events were recorded per month. Ground deformation had also continued since the eruption. The rate of uplift of the cryptodome decreased from about 2 cm/day in 1980 to about 0.8 cm in 1981. Northward lateral movement of the N flank also continued through 1981.
In 1982, seismic activity decreased to the background level of about 10 events per month by April; 496 events were recorded in January, 231 in February, 79 in March, 10 in April and 11 in May. Ground deformation has been negligible since April 1982.
Further References. Yokoyama, I. (ed.), 1984, Report of joint geophysical and geochemical observations of Usu volcano in 1982 and Tarumai volcano in 1983, 214 p.
Information Contacts: JMA, Tokyo.
Fumarole temperatures decline slightly
Usu's major explosions of August 1977 were followed by rapid (but decreasing) cryptodome growth and seismicity. Smaller explosions started in November 1977, became more vigorous and frequent during the following summer, and ended in October. The rate of cryptodome growth increased briefly in early 1978 but slowed gradually, as did accompanying seismicity, for the next several years, ceasing rather abruptly in early 1982. Some points on the cryptodome rose as much as 180 m and a baseline between the N foot of the volcano and its N crater rim had shortened by a similar amount by early 1982 (Yokoyama, Katsui, and Abiko, 1983).
The following is a report from S.N. Williams. "A team of U.S. and Japanese scientists visited Usu's crater in mid-August to continue their study of fumarole mineral geochemistry and mineralogy begun in September 1981. Fumarole locations, distribution of fumarole incrustations, and temperatures were mapped. Samples of gas and fumarole sublimates were collected.
"Peak fumarole temperatures have declined somewhat. Fumarole 2, 770°C in 1981, was 730°C in 1983; no. 3 decreased from 690 to 650°C; no. 1 from 550 to 545°C. Gas discharge continued at a tremendous rate with the associated roaring jet sound. Extensive deposition of fumarole incrustations continued. All of these fumaroles were located in a narrow valley between the 1977-82 cryptodome (Usu-Shinzan) and Ko-Usu, a lava dome extruded in either the 1663 or 1769 eruption.
"Overall, a broad concentric zonation was noted in the temperature distribution of the fumaroles. Large areas of steaming ground on Ko-Usu dome and Usu-Shinzan formed an aureole around the high-temperature fumaroles. These approximately 100°C fumaroles continued to emit large quantities of H2S. Gin-numa Lake appeared to maintain about the same level as in 1981."
Reference. Yokoyama, I., Katsui, Y., and Abiko, T., 1983, The 1979-1982 Activities of Usu Volcano in Report on Volcanic Activities and Volcanological Studies in Japan for the Period from 1979 to 1982; Bulletin of the Volcanological Society of Japan, v. 28, no. 1, appendix, p. 15-19.
Information Contacts: S. Williams, R. Stoiber, and J. Patterson, Dartmouth College; T. Abiko, Muroran Inst. of Tech.
Seismic activity increases
The number of earthquakes gradually increased to 18 during the first half of May.
The latest eruptive activity consisted of major explosions in August 1977 that were followed by rapid cryptodome growth. More explosions took place in November 1977, became more vigorous and frequent the following summer, and ended in October 1978. Dome growth and seismicity continued for several years and ceased abruptly in 1982 (SEAN 08:12).
Information Contacts: Japan Meteorological Agency (JMA), Volcanological Division, Seismological and Volcanological Department, 1-3-4 Ote-machi, Chiyoda-ku, Tokyo 100, Japan.
Eruptions began on 31 March and proceeded from multiple craters on the NW flank
Following several days of increased seismicity, an eruption of Usu volcano began on 31 March. The eruption, the first at Usu since 1977-82, was continuing in April. This report is based on information compiled from a wide variety of sources cited in the text by Setsuya Nakada at the Volcano Research Center, University of Tokyo. Vigorous activity continued through April, and by the end of the month there were more than 50 craters; details will be provided in the next Bulletin.
Precursory activity. The number of volcanic earthquakes around Usu began increasing after 0800 on 27 March, prompting a series of Volcano Advisory notices from the Japan Meteorological Agency (JMA). At the site of the seismic station, ~2 km S of the summit, there were 16 earthquakes recorded on 27 March, followed by 599 (including 68 felt earthquakes) on the 28th (table 5). Neither volcanic tremor nor visible change in fumarolic gas had been observed by the night of 28 March.
Table 5. Numbers of earthquake events at Usu during 27 March-4 April 2000. The JMA seismometer is located ~2 km S of the summit. Courtesy of JMA.
| Date | Volcanic | Low-frequency | Felt | Tremor |
| 27 Mar 2000 | 16 | 0 | ? | 0 |
| 28 Mar 2000 | 599 | 5 | 68 | 0 |
| 29 Mar 2000 | 1629 | 164 | 600 | 0 |
| 30 Mar 2000 | 2454 | 326 | 537 | 0 |
| 31 Mar 2000 | 788 | 139 | 299 | 0 |
| 01 Apr 2000 | 159 | 24 | 52 | 0 |
| 02 Apr 2000 | 48 | 3 | 3 | 0? |
| 03 Apr 2000 | 22 | 0 | 2 | 0? |
| 04 Apr 2000 | 9 | 0 | 1 | 0? |
On the evening of 28 March the National Coordination Committee of Volcanic Eruption Prediction (chaired by Yoshiaki Ida, Univ. of Tokyo) warned about the high possibility of an imminent eruption. JMA also called resident's attention to the hazard of mudflows triggered due to snow melting during an eruption. A hot spring resort at the N foot of the volcano had about 1,600 guests this night. However, more than 400 persons living around the volcano voluntarily evacuated by the night of 28 March.
A Volcano Alert was issued by JMA on the morning of 29 March. That day the number of volcanic earthquakes totaled 1,629 (600 of them felt), including low-frequency earthquakes whose number increased with time. At 0708 on 29 March a M 3.4 had a hypocenter on the N slope. Later that day, at 1722, one of M 4.2 was centered on the NW slope; analysis indicated faulting along a nearly vertical slip plane. The GPS network around the volcano, maintained by the Geographical Survey Institute (GSI), detected inflation. Neither volcanic tremor nor visible changes in fumarolic gas had been observed yet. People living in a city and two towns around the volcano were required to evacuate on the afternoon of 29 March. By that night, more than 9,000 people evacuated, including all tourists in resorts at the N foot of the volcano.
The number of volcanic earthquakes continued to increase on 30 March, to a total of 2,454, including 326 low-frequency earthquakes and 537 felt events. During a helicopter flight, Yoshio Katsui and Hiromu Okada (Hokkaido University) found chains of cracks as long as 100 m along the NW part of the caldera rim, just above the hypocenters of the volcanic earthquakes. A group of geologists from the same university, the Geological Survey of Japan (GSJ), and the Geological Survey of Hokkaido also found small cracks and signs of ground deformation at the N-NW foot of the volcano. The hot-spring resort on the S shore of Lake Toya, Toyako-Onsen, lies within the area that these phenomena were observed. The Usu Volcano Observatory of Hokkaido University, at the N foot of the volcano, was moved ~8 km S to the western part of Date City. Frequency and magnitude of earthquakes changed in a manner similar to that seen in the 1910 eruption; that event started with a phreatic eruption after 5 days of precursory phenomena. This was followed by explosions from 45 craters aligned along a 2.7-km-long, EW-trending zone. The 1910 eruption ended with a 3-month period of cryptodome emplacement.
Eruptions begin on 31 March. At 1310 on 31 March a phreatic eruption ~4 km NW of the summit and ~2 km NE of the epicenters of the volcanic earthquakes sent ash 3,200 m above the crater. Ash and cinders from the newly formed craters fell on nearby houses. After about 2 hours of strong ash emissions the eruption declined. No injuries were reported. According to Yoshio Katsui, who did a helicopter inspection, five craters formed successively that joined into one larger crater (roughly 200 m long and 60 m wide) during this eruptive episode.
According to the Joint University Research Group (JURG) on the morning of 31 March, additional cracks were observed in the W flank of the volcano, and on the summit of the old lava dome within the caldera. Cracks found the previous day on the NW flank and foot of the volcano became wider. Seismicity had decreased from the previous day.
According to a Volcano Advisory at 0312 on 1 April, a M 4.8 earthquake occurred, the largest so far during this eruption. Observations using a JMA camera indicated that another phase of the eruption started at the W foot around 0250, when explosions formed new craters near the previous craters W of Nishi-yama and also 1.5 km NE, on Konpira-yama. The latter were close to houses in the resort on the shore of Lake Toya. Cock's-tail-shaped jets were frequently observed from the active craters. Sometimes eruption clouds rose more than 2 km above the vents. According to Tadahide Ui, petrological work in Hokkaido University identified a few juvenile fragments in the products of the first eruption. Takayuki Kaneko (VRC, U. Tokyo) inspected the craters from the Asahi Shinbun news helicopter on 1 April (figure 21 and table 6).
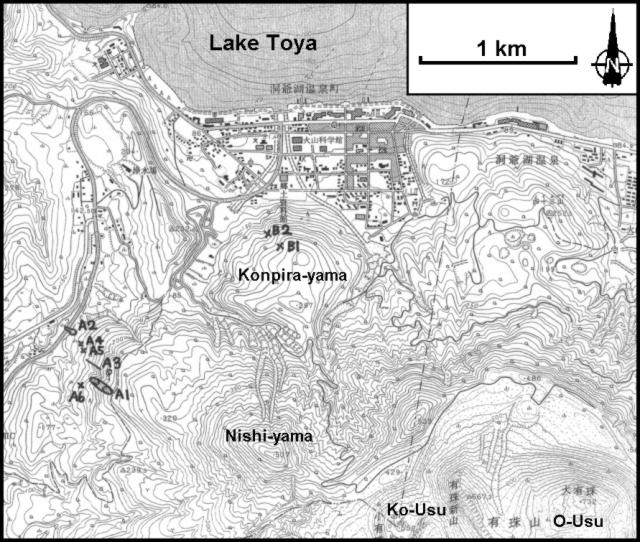 |
Figure 21. Topographic map of the NW sector of Usu, showing the distribution of new craters in the Nishi-yama and Konpira-yama dome areas, 1 April 2000. The summit, on the O-Usu dome, is at the lower right. Craters are numbered in the order of their opening. Courtesy of Takayuki Kaneko. |
Table 6. Venting from west of Nishi-yama dome (craters A1-A6) and near Konpira-yama dome (craters B1-B2) at stated times on 1 April 2000, as seen from helicopter by Takayuki Kaneko (VRC, U. Tokyo). Craters formed in the same order as their numbers, but the opening sequence of A4 and A5 was unclear.
| Crater | Status on 1 April (1110-1130) | Status on 1 April (1310-1330) |
| A1 | Inactive | Inactive |
| A2 | Active (white-to-dark cloud) | Active (white) |
| A3 | Active (dark) | Active (dark) |
| A4 | Not open | Active (white) |
| A5 | Not open | Active (white) |
| A6 | Not open | Activity began (white) |
| B1 | Not open | Active (white) |
| B2 | Not open | Activity began (white) |
According to the JURG and the GSJ, deformation on the NW part of the volcano continued. During 31 March to 1 April, with respect to the volcano's foot, the NW caldera rim uplifted by as much as 30 cm a day and migrated NE by 25 cm over a period of 19 hours. Small crack systems observed in the N foot also supported some slow but continual migration on the NW part of the volcano.
The GSJ and Hokkaido University noted that on 2 April fresh pumice fragments floated in Toya Lake, ~3.7 km ENE of the 31 May eruption vent. Three faults extending E-W for a few hundred meters were seen on 3 April near the explosion craters (NW of Nishi-yama). The maximum throw of the faults was ~10 m. They form a normal fault system with subsidence in the N side according to Kiyoaki Niida of Hokkaido University. A new fault system was found on 4 April a few hundred meters N of the one near the craters NW of Nishi-yama, according to Okada, and the area between the two fault systems was subsiding to form a graben. In early April, the fracture, which formed near the NW part of the summit caldera rim on 30 March, widened to ~4-5 m. The eruptive activity continued and the Asahi newspaper reported that at 1700 on 4 April at least one new crater lying between the two existing groups of craters sent a white plume 600 m high.
A new crater formed on the morning of 5 April on Konpira-yama near the previous two craters and sent a grayish plume to ~400 m height, according to JMA. On the W slope of Konpira-yama, a mudflow moved down slowly toward the spa, raising steam.
The main edifice consists of basaltic to basaltic-andesites (49-53% SiO2) with a small summit caldera. Ten dacitic lava or cryptodomes (68-73 % SiO2) lie on the summit and N slope arranged in two lines trending NW-SE. The eruptions that occurred at the summit (in 1663, 1769, 1822, 1853 and 1977-82) commenced with a strong Plinian phase and, apart from 1977-82, were accompanied by pyroclastic flows. All but perhaps the 1769 eruption also involved the growth of lava or cryptodomes in the middle to final stages. Both summit (O-Usu and Ko-Usu) and flank (Showa-Shinzan) lava domes, along with seven cryptodomes, were erupted in historical time. The war-time growth of Showa-Shinzan was painstakingly documented by the local postmaster, who created the first detailed record of lava-dome growth.
During the flank eruptions (in 1910 and 1943-45) the building of lava or cryptodomes was preceded by phreatic explosions in the initial stage. Each eruption lasted from one month to two years, with between thirty and one hundred years of repose between them. According to Akihiko Tomiya (Geological Survey of Japan), precursory seismicity of the historical eruptions (mainly volcanic earthquakes) lasted from 32 hours (1977-82) to 6 months (1943-45).
Information Contacts: Volcano Research Center, Earthquake Research Institute, University of Tokyo, Yayoi 1-1-1, Bunkyo-ku, Tokyo 113-0032, Japan (URL: http://www.eri.u-tokyo.ac.jp/VRC/index_E.html); Geological Survey of Japan, 1-1-3 Higashi, Ibaraki, Tsukuba 305, Japan (URL: https://www.gsj.jp/); Usu Volcano Observatory, Institute of Seismology and Volcanology, Graduate School of Science, Hokkaido University, Sohbetsu-cho, Usu-gun, Hokkaido, 052-0103, Japan (URL: http://www.sci.hokudai.ac.jp/isv/english/); Japan Meteorological Agency, Volcanological Division, 1-3-4 Ote-machi, Chiyoda-ku, Tokyo 100, Japan.
Eruption decreasing in intensity; precursors to 31 March eruption
Usu's multi-vent NW-flank eruption that began on 31 March 2000 continued until at least 10 July (see previous report and map in BGVN 25:03). By 10 July the eruption had lost considerable vigor. The last noteworthy ash fall took place on 6 April; a small one occurred on 7 April. Several excellent reports were published rapidly by the Geological Survey of Hokkaido (GSH, 2000a, b). This article provides a summary of those Japanese-language reports as well as excerpts from a formal statement discussing Usu's behavior through 10 July. Satellite imagery also provided ashfall data. The active dome and associated vent group was incorrectly spelled "Konpira-yama" in previous Bulletin reports. According to formal rules of translation this name should be "Kompira-yama."
Prior to the eruption, geological mapping and bore holes had delineated portions of Usu's edifice and surrounding subsurface, enabling workers to draw a generalized cross section (figure 22). In addition to these background studies, as Usu entered an eruptive phase on 31 March a comprehensive suite of monitoring instruments were in place.
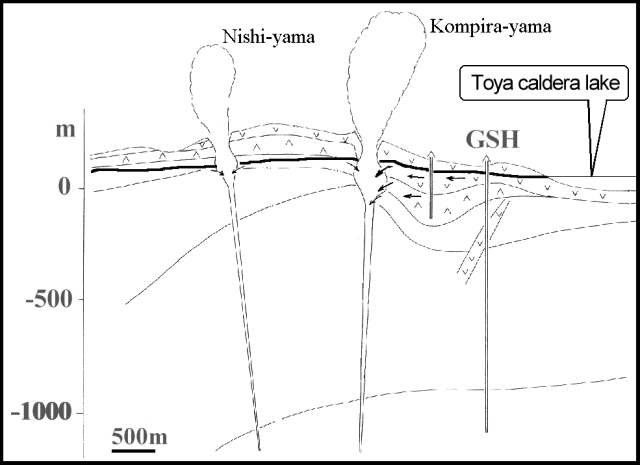 |
Figure 22. A schematic cross section across the flank of Usu showing boreholes, subsurface rock units (unlabeled), and areas of the two active vent groups with their plumes. The schematic illustrates the inferred zone of phreatic eruptions, estimated at 200-1000 m in depth. The groundwater surface was drawn as the distinctly heavier line connecting to the Toya lake on the right and at a depth of a few tens of meters above the "0" datum on the left). Arrows show the idealized paths of groundwater moving through the rock. After GSH (2000a, b). |
Four days prior to the eruption, groundwater levels in instrumented wells (the potentiometric surface) around the volcano began to change (figure 23). A day or two later, these perturbations escalated rapidly. Data from five wells (figure 23) show that at least four underwent roughly synchronous offsets that grew to reach the 2- to 10-m range. These dramatic offsets were inferred to have been driven by the influx of magma. Also, water temperatures increased at hot springs. The level of the groundwater surface in the instrumented wells peaked near the time the eruption started. For the wells with post-eruptive data on figure 23, the groundwater surface began a comparatively gradual steady decrease soon after the eruption started. Ancillary details on well locations and behavior appear in the cited reports.
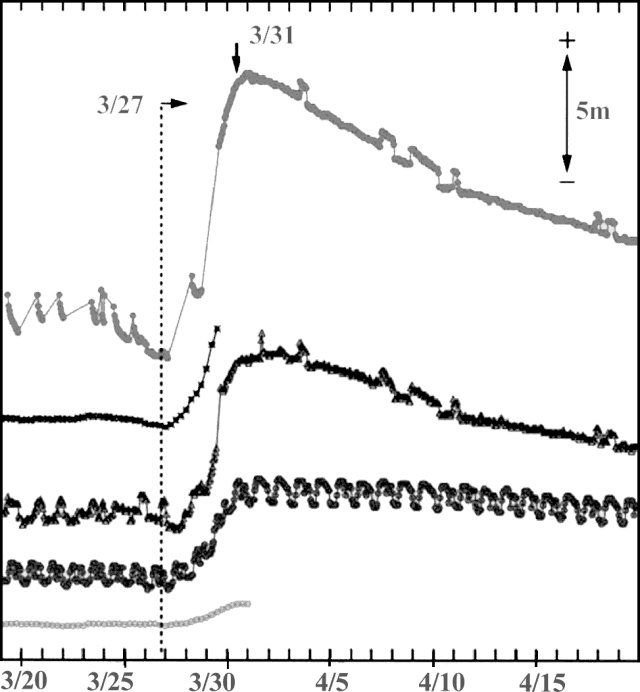 |
Figure 23. Perturbations to the groundwater surface level in monitored water wells around the time of the initial Usu eruptions; common vertical scale bar at upper right shows relative magnitude of displacement with strong offset beginning around 27 March 2000. Small arrow labeled "3/31" indicates the point of initial eruption (31 March 2000). After GSH (2000a, b). |
Global Positioning System (GPS) data helped predict the 31 March eruption. GPS station KMK is near Hokkaido's N coast and ~7 km E of Usu's active vent groups. KMK was compared with three other stations near Usu beginning around 30 March (figure 24). The comparison revealed large vertical motions-tens of centimeters per day- including some beginning on 29 March (not shown). Figure 24 shows how the rates of vertical motion declined in early April at all three close-in stations. The reports also noted horizontal motions measuring tens of centimeters per day.
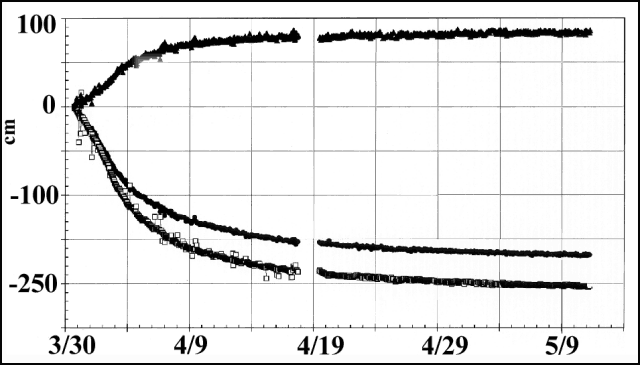 |
Figure 24. Relative vertical position of the land surface near Usu during 30 March-9 May 2000. The comparison is between three close-in GPS stations with respect to station KMK, ~ 7 km E of the Kompira-yama and western Nishi-yama vent groups. After GSH (2000a, b). |
Clear precursory seismicity appeared at Usu (figure 25). The maxima, ~150 earthquakes in a 2-hour interval (i.e., ~75 earthquakes/hour), occurred ~1 day prior to the eruption. The eruptive pulses on 1 April took place during an interval with comparatively low seismicity.
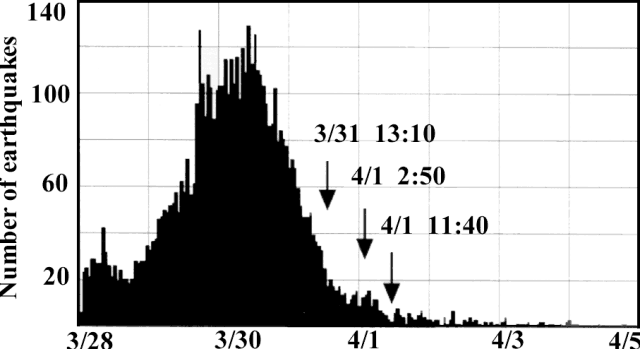 |
Figure 25. Seismic overview of Usu for 28 March to 7 April 2000 portraying multifold increases in the number of earthquakes prior to the 31 March eruption. Bars are for 2-hour intervals with the maximum values representing ~75 earthquakes/hour. The arrows indicate the date of the first three eruptions of the episode. For comparison, the perturbations of hydraulic head were strongest during 27-31 March. After GSH (2000a, b). |
Figure 26 provides a graphical summary of the episode's eight modest but identifiable ash falls. Most of the ash blew E, but an eruption on 1 April blew SE and one on 4 April blew N. GSH (2000a) features a time line for the two vent groups in eruption, graphically portraying 31 March-7 April plume observation. Figure 27 presents a sample of this larger time line: the portion for 1 April 2000. Figures such as this provide a particularly apt summary of complex phenomena.
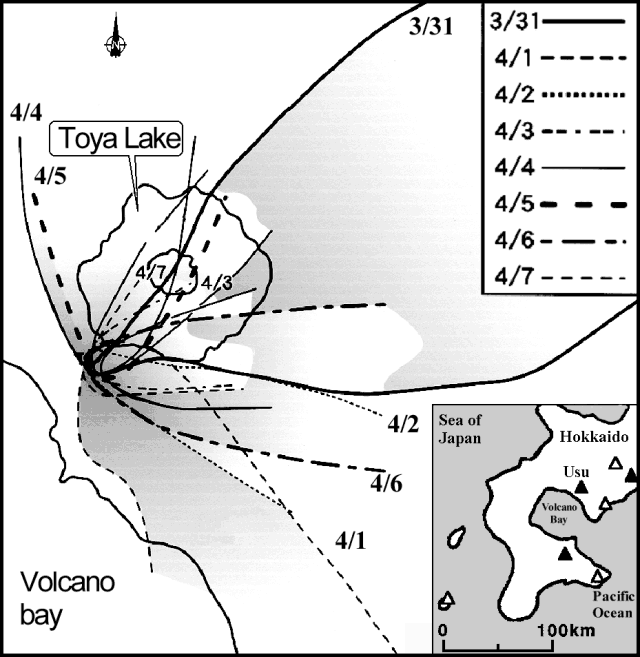 |
Figure 26. Limits of ash fall distribution seen for Usu's outbursts (31 March-7 April 2000). The date convention is month/day. After GSH, 2000a, b. |
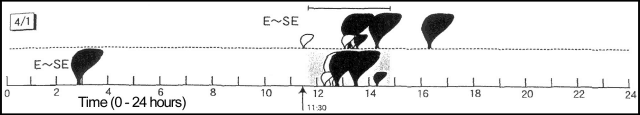 |
Figure 27. A time line of activity at Usu on 1 April 2000 portraying the character of eruptive plumes from the Kompira-yama (upper line) and western Nishi-yama (lower line) vent groups. Plume symbols are shown in two sizes and colors, representing larger (>1-km-tall), smaller (< 1-km-tall), black, and white plumes. The shaded area bracketed by a solid line above (about 1145-1545) indicates an interval of dominantly visual plume observations. The arrow at 11:30 represents the time of onset for an eruption. The given compass directions (eg., E~SE) indicate the direction of ashfall from the vent groups. The original full-length version (31 March-7 April, in Japanese) includes numerous other notes and comments. After GSH (2000a). |
Committee's announcement. The Usu eruption committee chaired byYoshiaki Ida made a formal announcement on 10 July. They noted that on this date Usu's phreatic eruption continued at the Kompira-yama and western Nishi-yama vent groups, but the supply of magma from depth had almost ceased. Accordingly, they anticipated a gradual decrease in volcanism.
The committee indicated that the current eruption occurred due to upward movement of magma from depths of ~10 km reaching a shallow reservoir around 4-5 km. Portions of the shallow reservoir traveled NW and then to the vents where magma escaped. The committee noted that on 10 July uplift still continued at western Nishi-yama (~5 cm/day) but that its areal extent and rate were decreasing. The committee noted that by 10 July small faults associated with the eruption ceased moving. They appeared as visible fault traces cutting across roads and other infrastructure (see photos in GSH, 2000a, b).
The committee also noted that the early phases of the eruption had ejected portions of juvenile material, whereas by 10 July the eruptions mainly discharged steam. Similarly, with time, cloud height and explosive vigor decreased. On 10 July Nishi-yama still gave off intermittent weak ash; Kompira-yama still emitted loud blasts with glowing volcanic rocks. But by this time such activities had decreased and ballistic bombs continued to fall several hundred meters from the Kompira-yama vent group. Earthquakes continued on the SW flank of Usu, but by 10 July they became increasingly scarce. The committee suggested a pyroclastic surge was unlikely in the near future .
Satellite imagery. A satellite image from 3 April shows Usu's ash blanketing parts of the largely snow-covered landscape (figure 28). The image caption states that the team planned to image Usu every 3-4 days. The images were captured on ASTER (The Advanced Spaceborne Thermal Emission and Reflection Radiometer), a Japanese-built instrument that obtains high-resolution (15-90 m2/pixel) images at 14 wavelengths from visible to thermal infrared. ASTER registers land surface temperature, emissivity, reflectance, and elevation; it flies on the Terra platform where it serves as a zoom lens for the other Terra instruments. ASTER has the ability to change viewing angles, enabling it to make stereoscopic images and detailed terrain height models. NASA terms the Terra satellite the flagship of the EOS mission. The latter is an effort to better understand planet Earth's atmosphere, land, and oceans, as well as their interactions with solar radiation and with one another.
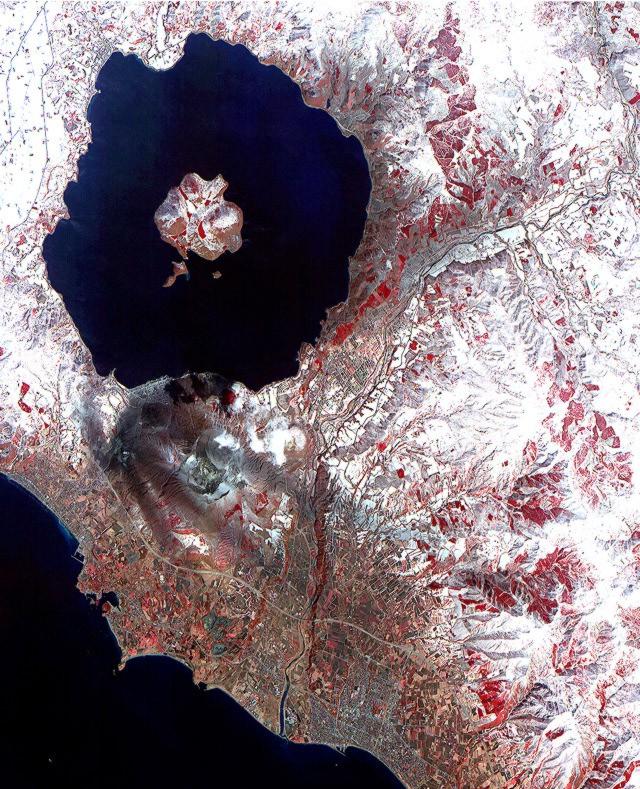 |
Figure 28. A false-color image taken on 3 April by the Terra satellite's ASTER instrument showing the ash-darkened snow resulting from complex eruptions at Usu volcano's multiple vents. N is towards the top of the image. Usu and many of the visible deposits lie immediately S of Lake Toya, a circular 10-km-diameter caldera lake with a central island. The Pacific Ocean lies towards the S (the image's lower left-hand corner) and in this region enters Uchiura-Wan bay. (ASTER record identification, 257). Courtesy of NASA. |
References. Geological Survey of Hokkaido (GSH), 2000a, Observations of Usu's volcanic eruption, 2000, Preliminary Report (in Japanese), 53 p. (in color on the GSH website and available as a 47 M file.
Geological Survey of Hokkaido (GSH), 2000b, Usu eruption in 2000, GSH News, 2000, 5, vol. 16, (ISSN 1345-1138), (text and captions in Japanese), 4 p. (1 additional sheet with 8 color plates)
Information Contacts: Masahiro Yahata, Geological Survey of Hokkaido, Kita 19, Nishi 12, Kita-Ku, Sapporo, 060-0819, Japan; Yoshiaki Ida, University of Tokyo, Earthquake Research Institute, Yayoi 1-1-1 Bunkyo-Ku, Tokyo 113, Japan; NASA Terra Project, NASA Goddard SFC, MC 613, Greenbelt, MD 20771 USA (URL: https://terra.nasa.gov/); Yasushi Yamaguchi, Japan Outreach Center for ASTER, Nagoya University, Earth & Planetary Sci Dept/Faculty Sci, Furou-cho Chikusa-ku, Nagoya 464-01; Usu Volcano Observatory, Institute of Seismology and Volcanology, Graduate School of Science, Hokkaido University, Sohbetsu-cho, Usu-gun, Hokkaido, 052-0103, Japan (URL: http://www.sci.hokudai.ac.jp/isv/english/).
Explosive activity, major uplift, and fault formation during 31 March-early May 2000
As reported in BGVN 25:03, an eruption at Usu began on 31 March 2000 following several days of increased seismicity. A description of eruption precursors was presented in BGVN 25:06. This report summarizes activity between the 31 March eruption and early May 2000. Vigorous activity continued throughout April 2000 (figures 29 and 30), and activity was continuing in May.
|
Figure 29. Schematic illustration showing the eruption sequence at Usu during 31 March-late April 2000. Courtesy of VRC, ERI. |
|
Figure 30. Map showing the distribution of active craters, faults, and mudflows as of 14 April 2000. Usu's summit rises to the S, outside the map area. Courtesy of Asia Air Survey Co. Ltd. |
According to the Geographical Survey Institute, the region including the crater areas was elevated 3.3 m/day during the three days from 31 March to 3 April, suggesting the formation of a new cryptodome similar to Meiji-Shinzan, a cryptodome that formed on Usu's N flank in 1910 and Showa-Shinzan, a cryptodome and lava dome that formed during 1944-45 (figure 31).
|
Figure 31. View from a helicopter facing N on 17 April 2001, showing multiple steaming vents in the background and several faults formed by uplift of the NW Nishi-yama area. Courtesy of S. Nakada. |
Around 6 April 2000, the eruption style changed from phreatomagmatic ash emissions to phreatic ejection of vertical cock's-tail jets reaching 500 m above the craters. By 10 April, more than 30 craters had formed in the Kompira-yama and NW Nishi-yama areas (figures 30 and 32). Cinders ejected by the continuing explosions steamed after they landed around the craters. The temporal changes in eruption style can be explained by assuming that the magma approached an overlying aquifer, estimated to lie between 0 and 300 m below sea level, and passed almost directly through it. According to the Usu Volcano Observatory, the amplitude of volcanic tremors increased after 6 April and increased further after 12 April.
|
Figure 32. View from a helicopter looking NE on 10 April 2001, showing multiple active vents within the Kompira-yama (center) and NW Nishi-yama (foreground) crater areas. Toyako Hot Spring and town lie in the background. Courtesy of S. Nakada. |
Eruptions continued though late April, although plume activity decreased. White clouds were emitted from the Kompira-yama and NW Nishi-yama craters. Small explosions were observed. Cinders ejected from NW Nishi-yama dusted the Kompira-yama craters. The plumes frequently darkened with ash, implying partial collapse of vent walls. The principal active craters in both areas grew to a few hundred meters across and had dry funnel-shaped floors.
Uplift continued at a decreased rate in the NW Nishi-yama area. The total height of the uplift was 60 m by the end of April according to an air-photo survey by the Geographical Survey Institute. Uplift was < 20 m for the Kompira-yama area except for the crater rims. The total volume of uplift in the two crater areas was estimated to be ~40 x 106 m3; one order of magnitude smaller than the volume of the 1944-45 Showa-Shinzan dome. According to the Joint University Research Group, the uplift rate was the highest in the initial stage of eruption and decreased exponentially to ~10 cm/day by early May.
Information Contacts: Setsuya Nakada and Hidefumi Watanabe, Volcano Research Center, Earthquake Research Institute, University of Tokyo, Yayoi 1-1-1, Bunkyo-ku, Tokyo 113-0032, Japan (URL: http://www.eri.u-tokyo.ac.jp/VRC/index_E.html); Geological Survey of Japan, 1-1-3 Higashi, Ibaraki, Tsukuba 305, Japan (URL: https://www.gsj.jp/); Geographical Survey Institute of Japan (URL: http://www.gsi-mc.go.jp/); Usu Volcano Observatory, Institute of Seismology and Volcanology, Graduate School of Science, Hokkaido University, Sohbetsu-cho, Usu-gun, Hokkaido, 052-0103, Japan (URL: http://www.sci.hokudai.ac.jp/isv/english/); Tatsuro Chiba, Asia Air Survey Co. Ltd..
|
|
||||||||||||||||||||||||||
There is data available for 13 confirmed eruptive periods.
2000 Mar 31 - 2001 Sep 15 ± 5 days Confirmed Eruption (Explosive / Effusive) VEI: 2
| Episode 1 | Eruption (Explosive / Effusive) | Usu N flank (Kompira-yama & W Nishi-yama) | ||||||||||||||||||||||||||||||||||||||||||||||||||||||||||||||||||||
|---|---|---|---|---|---|---|---|---|---|---|---|---|---|---|---|---|---|---|---|---|---|---|---|---|---|---|---|---|---|---|---|---|---|---|---|---|---|---|---|---|---|---|---|---|---|---|---|---|---|---|---|---|---|---|---|---|---|---|---|---|---|---|---|---|---|---|---|---|---|
| 2000 Mar 31 - 2001 Sep 15 ± 5 days | Evidence from Observations: Reported | ||||||||||||||||||||||||||||||||||||||||||||||||||||||||||||||||||||
|
List of 12 Events for Episode 1 at Usu N flank (Kompira-yama & W Nishi-yama)
|
|||||||||||||||||||||||||||||||||||||||||||||||||||||||||||||||||||||
1977 Aug 7 - 1982 Mar 16 ± 15 days Confirmed Eruption (Explosive / Effusive) VEI: 3
| Episode 1 | Eruption (Explosive / Effusive) | Usu-Shinzan | |||||||||||||||||||||||||||||||||||||||||||||||||||||||||||||||||||||||||||||||||||||||||||||
|---|---|---|---|---|---|---|---|---|---|---|---|---|---|---|---|---|---|---|---|---|---|---|---|---|---|---|---|---|---|---|---|---|---|---|---|---|---|---|---|---|---|---|---|---|---|---|---|---|---|---|---|---|---|---|---|---|---|---|---|---|---|---|---|---|---|---|---|---|---|---|---|---|---|---|---|---|---|---|---|---|---|---|---|---|---|---|---|---|---|---|---|---|---|---|
| 1977 Aug 7 - 1982 Mar 16 ± 15 days | Evidence from Observations: Reported | |||||||||||||||||||||||||||||||||||||||||||||||||||||||||||||||||||||||||||||||||||||||||||||
|
List of 17 Events for Episode 1 at Usu-Shinzan
|
||||||||||||||||||||||||||||||||||||||||||||||||||||||||||||||||||||||||||||||||||||||||||||||
1944 Jun 23 - 1945 Sep 19 Confirmed Eruption (Explosive / Effusive) VEI: 2
| Episode 1 | Eruption (Explosive / Effusive) | Usu East flank (Showa-Shinzan) | |||||||||||||||||||||||||||||||||||||||||||||||||||||||||||||||||||||||||||||||||||||||||||||||||||||||
|---|---|---|---|---|---|---|---|---|---|---|---|---|---|---|---|---|---|---|---|---|---|---|---|---|---|---|---|---|---|---|---|---|---|---|---|---|---|---|---|---|---|---|---|---|---|---|---|---|---|---|---|---|---|---|---|---|---|---|---|---|---|---|---|---|---|---|---|---|---|---|---|---|---|---|---|---|---|---|---|---|---|---|---|---|---|---|---|---|---|---|---|---|---|---|---|---|---|---|---|---|---|---|---|---|
| 1944 Jun 23 - 1945 Sep 19 | Evidence from Observations: Reported | |||||||||||||||||||||||||||||||||||||||||||||||||||||||||||||||||||||||||||||||||||||||||||||||||||||||
|
List of 19 Events for Episode 1 at Usu East flank (Showa-Shinzan)
|
||||||||||||||||||||||||||||||||||||||||||||||||||||||||||||||||||||||||||||||||||||||||||||||||||||||||
1910 Jul 25 - 1910 Nov Confirmed Eruption (Explosive / Effusive) VEI: 2
| Episode 1 | Eruption (Explosive / Effusive) | Usu North flank (Meiji-Shinzan) | ||||||||||||||||||||||||||||||||||||||||||||||||||||||||||||||||||||||||||||||
|---|---|---|---|---|---|---|---|---|---|---|---|---|---|---|---|---|---|---|---|---|---|---|---|---|---|---|---|---|---|---|---|---|---|---|---|---|---|---|---|---|---|---|---|---|---|---|---|---|---|---|---|---|---|---|---|---|---|---|---|---|---|---|---|---|---|---|---|---|---|---|---|---|---|---|---|---|---|---|---|
| 1910 Jul 25 - 1910 Nov | Evidence from Observations: Reported | ||||||||||||||||||||||||||||||||||||||||||||||||||||||||||||||||||||||||||||||
|
List of 14 Events for Episode 1 at Usu North flank (Meiji-Shinzan)
|
|||||||||||||||||||||||||||||||||||||||||||||||||||||||||||||||||||||||||||||||
1853 Apr 22 - 1853 Sep Confirmed Eruption (Explosive / Effusive) VEI: 4
| Episode 1 | Eruption (Explosive / Effusive) | O-Usu | ||||||||||||||||||||||||||||||||||||||||||||||||||||||||||
|---|---|---|---|---|---|---|---|---|---|---|---|---|---|---|---|---|---|---|---|---|---|---|---|---|---|---|---|---|---|---|---|---|---|---|---|---|---|---|---|---|---|---|---|---|---|---|---|---|---|---|---|---|---|---|---|---|---|---|---|
| 1853 Apr 22 - 1853 Sep | Evidence from Observations: Reported | ||||||||||||||||||||||||||||||||||||||||||||||||||||||||||
|
List of 10 Events for Episode 1 at O-Usu
|
|||||||||||||||||||||||||||||||||||||||||||||||||||||||||||
1822 Mar 12 - 1822 Sep Confirmed Eruption (Explosive / Effusive) VEI: 4
| Episode 1 | Eruption (Explosive / Effusive) | Foot of Ko-Usu dome, Ogari-yama | |||||||||||||||||||||||||||||||||||||||||||||||||||||||||||||||||||||||||
|---|---|---|---|---|---|---|---|---|---|---|---|---|---|---|---|---|---|---|---|---|---|---|---|---|---|---|---|---|---|---|---|---|---|---|---|---|---|---|---|---|---|---|---|---|---|---|---|---|---|---|---|---|---|---|---|---|---|---|---|---|---|---|---|---|---|---|---|---|---|---|---|---|---|---|
| 1822 Mar 12 - 1822 Sep | Evidence from Observations: Reported | |||||||||||||||||||||||||||||||||||||||||||||||||||||||||||||||||||||||||
|
List of 13 Events for Episode 1 at Foot of Ko-Usu dome, Ogari-yama
|
||||||||||||||||||||||||||||||||||||||||||||||||||||||||||||||||||||||||||
1769 Jan 23 Confirmed Eruption (Explosive / Effusive) VEI: 4
| Episode 1 | Eruption (Explosive / Effusive) | Ko-Usu | |||||||||||||||||||||||||||||||||||||||||||||||||||||
|---|---|---|---|---|---|---|---|---|---|---|---|---|---|---|---|---|---|---|---|---|---|---|---|---|---|---|---|---|---|---|---|---|---|---|---|---|---|---|---|---|---|---|---|---|---|---|---|---|---|---|---|---|---|---|
| 1769 Jan 23 - Unknown | Evidence from Observations: Reported | |||||||||||||||||||||||||||||||||||||||||||||||||||||
|
List of 9 Events for Episode 1 at Ko-Usu
|
||||||||||||||||||||||||||||||||||||||||||||||||||||||
1690 ± 10 years Confirmed Eruption (Explosive / Effusive)
| Episode 1 | Eruption (Explosive / Effusive) | Usu | |||||||||||||||||||||||||||||||||
|---|---|---|---|---|---|---|---|---|---|---|---|---|---|---|---|---|---|---|---|---|---|---|---|---|---|---|---|---|---|---|---|---|---|---|
| 1690 ± 10 years - Unknown | Evidence from Correlation: Tephrochronology | |||||||||||||||||||||||||||||||||
|
List of 5 Events for Episode 1 at Usu
|
||||||||||||||||||||||||||||||||||
1663 Aug 16 - 1663 Sep 5 ± 4 days Confirmed Eruption (Explosive / Effusive) VEI: 5
| Episode 1 | Eruption (Explosive / Effusive) | Usu, Usu-b Pumice | |||||||||||||||||||||||||||||||||||||||||||||||||||||
|---|---|---|---|---|---|---|---|---|---|---|---|---|---|---|---|---|---|---|---|---|---|---|---|---|---|---|---|---|---|---|---|---|---|---|---|---|---|---|---|---|---|---|---|---|---|---|---|---|---|---|---|---|---|---|
| 1663 Aug 16 - 1663 Sep 5 ± 4 days | Evidence from Observations: Reported | |||||||||||||||||||||||||||||||||||||||||||||||||||||
|
List of 9 Events for Episode 1 at Usu, Usu-b Pumice
|
||||||||||||||||||||||||||||||||||||||||||||||||||||||
1638 Jul 25 Confirmed Eruption (Explosive / Effusive)
| Episode 1 | Eruption (Explosive / Effusive) | Usu | |||||||||||||||||||||||
|---|---|---|---|---|---|---|---|---|---|---|---|---|---|---|---|---|---|---|---|---|---|---|---|---|
| 1638 Jul 25 - Unknown | Evidence from Observations: Reported | |||||||||||||||||||||||
|
List of 3 Events for Episode 1 at Usu
|
||||||||||||||||||||||||
1626 May 19 - 1626 Jul (?) Confirmed Eruption (Explosive / Effusive)
| Episode 1 | Eruption (Explosive / Effusive) | Usu | |||||||||||||
|---|---|---|---|---|---|---|---|---|---|---|---|---|---|---|
| 1626 May 19 - 1626 Jul (?) | Evidence from Observations: Reported | |||||||||||||
|
List of 1 Events for Episode 1 at Usu
|
||||||||||||||
[ 1611 Oct ] Uncertain Eruption
| Episode 1 | Eruption (Explosive / Effusive) | ||||||||||||||
|---|---|---|---|---|---|---|---|---|---|---|---|---|---|---|
| 1611 Oct - Unknown | Evidence from Unknown | |||||||||||||
|
List of 1 Events for Episode 1
|
||||||||||||||
4600 BCE ± 200 years Confirmed Eruption (Explosive / Effusive)
| Episode 1 | Eruption (Explosive / Effusive) | Usu | ||||||||||||||||||
|---|---|---|---|---|---|---|---|---|---|---|---|---|---|---|---|---|---|---|---|
| 4600 BCE ± 200 years - Unknown | Evidence from Isotopic: 14C (calibrated) | ||||||||||||||||||
|
List of 2 Events for Episode 1 at Usu
|
|||||||||||||||||||
6550 BCE ± 1500 years Confirmed Eruption (Explosive / Effusive)
| Episode 1 | Eruption (Explosive / Effusive) | Usu | ||||||||||||||||||
|---|---|---|---|---|---|---|---|---|---|---|---|---|---|---|---|---|---|---|---|
| 6550 BCE ± 1500 years - Unknown | Evidence from Isotopic: 14C (calibrated) | ||||||||||||||||||
|
List of 2 Events for Episode 1 at Usu
|
|||||||||||||||||||
This compilation of synonyms and subsidiary features may not be comprehensive. Features are organized into four major categories: Cones, Craters, Domes, and Thermal Features. Synonyms of features appear indented below the primary name. In some cases additional feature type, elevation, or location details are provided.
Cones |
||||
| Feature Name | Feature Type | Elevation | Latitude | Longitude |
| Donkoroyama
Donkoro-yama |
Cone | |||
| Usuzan
Usu |
Stratovolcano | |||
Craters |
||||
| Feature Name | Feature Type | Elevation | Latitude | Longitude |
| Genta-ana | Crater | 42° 33' 7.00" N | 140° 51' 7.00" E | |
| Gin-numa | Crater | 380 m | 42° 32' 10.00" N | 140° 49' 59.00" E |
| Toya | Pleistocene caldera | 42° 36' 0.00" N | 140° 47' 0.00" E | |
Domes |
||||
| Feature Name | Feature Type | Elevation | Latitude | Longitude |
| Higashi-Maruyama | Dome | 307 m | 42° 32' 56.00" N | 140° 51' 22.00" E |
| Kompirayama
Konpira-yama Kompira-yama |
Dome | 297 m | 42° 33' 4.00" N | 140° 49' 16.00" E |
| Ko-Usu | Dome | 550 m | 42° 32' 0.00" N | 140° 49' 44.00" E |
| Meiji-Shinzan
Meizi-Sinzan |
Dome | 253 m | 42° 33' 29.00" N | 140° 50' 17.00" E |
| Nakajima
Naka-jima |
Dome | 455 m | 42° 36' 0.00" N | 140° 46' 0.00" E |
| Nishi-Maruyama | Dome | 160 m | 42° 34' 0.00" N | 140° 49' 59.00" E |
| Nishi-yama | Dome | 520 m | 42° 32' 38.00" N | 140° 49' 8.00" E |
| Ogariyama
Ogari-yama |
Dome | 669 m | 42° 32' 10.00" N | 140° 50' 10.00" E |
| O-Usu | Dome | 737 m | 42° 32' 29.00" N | 140° 50' 34.00" E |
| Showashinzan
Syowa-Sinzan Showa-Shinzan |
Dome | 402 m | 42° 32' 24.00" N | 140° 52' 4.00" E |
| Usu-Shinzan | Dome | 640 m | 42° 32' 33.00" N | 140° 50' 4.00" E |
 Usu rises at the right across Lake Toya with the Nakanojima lava dome complex at the left forming an island in the caldera lake. The light-colored area in the bottom half of this 12 August 1977 photo is floating pumice produced by explosive eruptions of Usu during 7-9 August.
 Usu rises to the SE above the town of Toyako Spa on the shores of Lake Toya on 12 August 1977. O-Usu (left) and Ko-Usu (right) lava domes are within the summit caldera. The first of three major explosive eruptions during 7-9 August originated from vents behind Ko-Usu in this view and stripped trees of vegetation on the upper slopes. Growth of a new lava dome in the area between the two domes later in the eruption greatly changed the morphology of the summit.
 O-Usu lava dome (left center), the largest of several lava domes constructed in the summit crater of Usu volcano, formed during a major eruption in 1853. The eruption began on 22 April. The Kaei (Tateiwa) pyroclastic flow may have erupted on 27 April. Major explosive activity ended in early May and was followed by the growth of the dome. Two cryptodomes on the SE flank are thought to have formed at the same time as O-Usu. It is seen here from the S, with the 1944-45 Showa-Shinzan dome forming the small peak to the right.
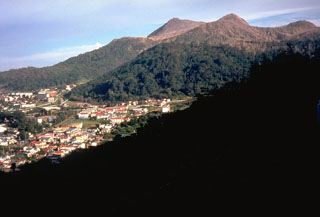 Usu volcano is a located on the southern topographic rim of the 110,000-year-old Toya caldera. The summit, seen here above the town of Toyako-Onsen to the NW, consists of dacitic lava domes and a cryptodome that were emplaced in a small summit caldera during historical eruptions.
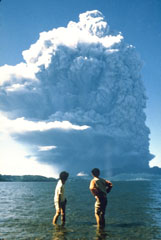 An ash plume from the first of nine major explosions of Usu during 7-14 August 1977 towers above Lake Toya. The plume rapidly grew to a height of 12 km. The explosive eruptions were followed by slow growth of a cryptodome (a lava dome that does not breach the surface) over a period of five years. Phreatic explosions accompanied cryptodome growth in November 1977 and January-October 1978. By the end of the 1982 eruption Usu-Shinzan had grown to 180 m above the crater floor.
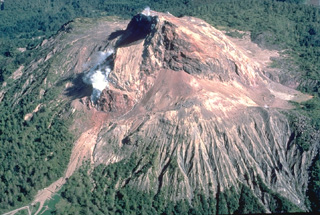 Showa-Shinzan lava dome, seen here in an aerial view from the east in 1981, was born in a cornfield on the eastern flank of Usu volcano during a 1944-45 eruption. The dome eventually rose 275 m above the pre-eruption surface. Scientific observation was only sporadically possible during this war-time eruption. The local postmaster, Masao Mimatsu, made careful sketches of growth of the dome that provided an invaluable record of the eruption's progress.
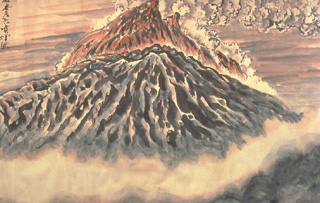 This March 1945 sketch by Masao Mimatsu, the postmaster of a town near Showa-Shinzan volcano, shows an eruption plume extending from the top of the growing lava dome. After 17 months of slow uplift that raised a cornfield more than 150 m to form the "Roof Mountain," lava first breached the surface in November 1944. By the time the eruption ended, a year later, the dome reached a height of 275 m above the pre-eruption surface.
 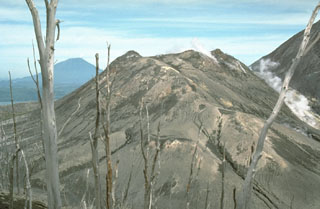 Ko-Usu lava dome, seen here from the S, is mantled by a thick ejecta deposit from the 1977 eruption. This is one of several lava domes in the summit crater of Usu volcano, formed after a major explosive eruption either in 1663 or 1769 CE. Yotei volcano is on the left horizon.
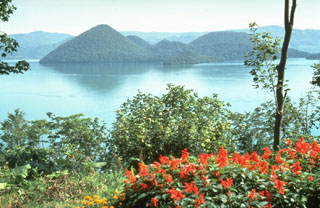 A group of lava domes form Nakanojima, an island in the center of Lake Toya. The lake fills the 10-km-wide caldera, which formed following a major explosive eruption about 110,000 years ago. The photo was taken from the flank of Usu volcano on the southern rim of the caldera.
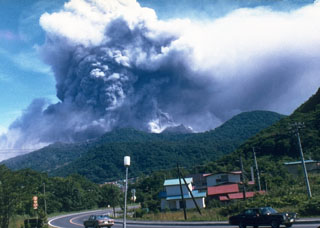 An ash plume rises above Usu on the afternoon of 7 August 1977, the first day of an eruption that lasted until 1982. Nine major explosive eruptions during 7-14 August 1977 were followed by slow growth of the Usu-Shinzan cryptodome. A crypotodome is a lava dome that uplifts the ground without breaking through to the surface.
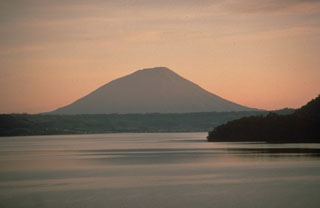 Yotei volcano is seen here to the NW above Lake Toya, which fills the 10-km-wide Toya caldera. The caldera formed during a major eruption about 110,000 years ago. A series of lava domes in the center of the lake form Nakanojima island, whose flank is in the right foreground. The photo was taken from the lower flank of Usu volcano, which formed on the southern rim of Toya caldera.
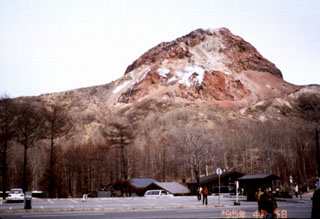 The Showa-Shinzan lava dome formed on the E flank of Usu volcano during eruptions in 1944-45. Rapid ground deformation initially raised flat cornfields to form a 150-m-high flat-topped hill on the lower E flank. Explosive eruptions from the center of the uplifted area began on 23 June 1944 and continued almost daily until 31 October. The dome breached the surface in November 1944 and ceased growing by September 1945 at a height of about 275 m.
 Usu is along the SW boundary of the larger Toya caldera and is shown here in this September 2019 Planet Labs satellite image monthly mosaic (N is at the top). The Usu edifice summit contains the collapse scarp in the center of the image, which is 1.5-2 km across and contains both domes and cryptodomes. Additional cryptodomes surround the scarp from the NW around to the SE.
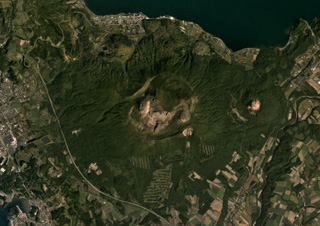 Usu formed along the SW boundary of Toya caldera and is shown in this September 2019 Planet Labs satellite (N is at the top). There is a 2-km-wide crater at the top, and within that crater and on the flanks are a scoria cone, three lava domes, and more than ten cryptodomes. Flank collapse possibly occurred around 8-7 ka, emplacing a debris avalanche deposit to the south.
The following 48 samples associated with this volcano can be found in the Smithsonian's NMNH Department of Mineral Sciences collections, and may be availble for research (contact the Rock and Ore Collections Manager). Catalog number links will open a window with more information.
| Catalog Number | Sample Description | Lava Source | Collection Date |
|---|---|---|---|
| NMNH 107466-00 | Pickeringite | -- | -- |
| NMNH 107467-00 | Sassolite | -- | -- |
| NMNH 108788 | Hypersthene Dacite | -- | -- |
| NMNH 108980-1 | Hypersthene Dacite | -- | -- |
| NMNH 108980-10 | Rhyolite | -- | -- |
| NMNH 108980-11 | Rhyolite | -- | -- |
| NMNH 108980-12 | Hypersthene Dacite | -- | -- |
| NMNH 108980-13 | Claystone | -- | -- |
| NMNH 108980-14 | Hypersthene Dacite | -- | -- |
| NMNH 108980-15 | Hypersthene Dacite | -- | -- |
| NMNH 108980-16 | Claystone | -- | -- |
| NMNH 108980-17 | Claystone | -- | -- |
| NMNH 108980-18 | Sulfur | -- | -- |
| NMNH 108980-19 | Unidentified | -- | -- |
| NMNH 108980-2 | Hypersthene Dacite | -- | -- |
| NMNH 108980-20 | Unidentified | -- | -- |
| NMNH 108980-21 | Unidentified | -- | -- |
| NMNH 108980-3 | Hornblende Dacite | -- | -- |
| NMNH 108980-4 | Olivine-Pyroxene Andesite | -- | -- |
| NMNH 108980-5 | Olivine-Pyroxene Andesite | -- | -- |
| NMNH 108980-6 | Olivine-Pyroxene Andesite | -- | -- |
| NMNH 108980-7 | Olivine-Pyroxene Andesite | -- | -- |
| NMNH 108980-9 | Unidentified | -- | -- |
| NMNH 112870 | Hypersthene Dacite | SYOWA-SINZAN DOME | -- |
| NMNH 112871 | Dacite | O-USU DOME | -- |
| NMNH 112871 | Dacite | O-USU DOME | -- |
| NMNH 112872 | Pyroxene Andesite | -- | -- |
| NMNH 112872 | Pyroxene Andesite | SYOWA-SINZAN DOME | -- |
| NMNH 112873 | Augite Andesite | SYOWA-SINZAN DOME | -- |
| NMNH 112873 | Augite Andesite | SYOWA-SINZAN DOME | -- |
| NMNH 112874 | Pigeonite Andesite | SYOWA-SINZAN DOME | -- |
| NMNH 112874 | Pigeonite Andesite | SYOWA-SINZAN DOME | -- |
| NMNH 112875 | Olivine Basalt | NISI-MARUYAMA DOME | -- |
| NMNH 112875 | Olivine Basalt | NISI-MARUYAMA DOME | -- |
| NMNH 113873 | Dacitic Pumice | -- | -- |
| NMNH 113874 | Dacitic Pumice | -- | -- |
| NMNH 113875 | Dacitic Pumice | -- | -- |
| NMNH 113876 | Dacitic Pumice | -- | -- |
| NMNH 113877 | Dacitic Pumice | -- | -- |
| NMNH 113878 | Dacitic Pumice | -- | -- |
| NMNH 113879 | Dacitic Pumice | -- | -- |
| NMNH 113880 | Dacitic Pumice | -- | -- |
| NMNH 113881 | Dacitic Pumice | -- | -- |
| NMNH 113882 | Dacitic Pumice | -- | -- |
| NMNH 113883 | Dacitic Pumice | -- | -- |
| NMNH 113884-1 | Dacitic Pumice | -- | -- |
| NMNH 116691-30 | Dacitic Pumice | -- | 1 Jan 1981 |
| NMNH 117451-10 | Obsidian | -- | -- |
| Copernicus Browser | The Copernicus Browser replaced the Sentinel Hub Playground browser in 2023, to provide access to Earth observation archives from the Copernicus Data Space Ecosystem, the main distribution platform for data from the EU Copernicus missions. |
| MIROVA | Middle InfraRed Observation of Volcanic Activity (MIROVA) is a near real time volcanic hot-spot detection system based on the analysis of MODIS (Moderate Resolution Imaging Spectroradiometer) data. In particular, MIROVA uses the Middle InfraRed Radiation (MIR), measured over target volcanoes, in order to detect, locate and measure the heat radiation sourced from volcanic activity. |
| MODVOLC Thermal Alerts | Using infrared satellite Moderate Resolution Imaging Spectroradiometer (MODIS) data, scientists at the Hawai'i Institute of Geophysics and Planetology, University of Hawai'i, developed an automated system called MODVOLC to map thermal hot-spots in near real time. For each MODIS image, the algorithm automatically scans each 1 km pixel within it to check for high-temperature hot-spots. When one is found the date, time, location, and intensity are recorded. MODIS looks at every square km of the Earth every 48 hours, once during the day and once during the night, and the presence of two MODIS sensors in space allows at least four hot-spot observations every two days. Each day updated global maps are compiled to display the locations of all hot spots detected in the previous 24 hours. There is a drop-down list with volcano names which allow users to 'zoom-in' and examine the distribution of hot-spots at a variety of spatial scales. |
|
WOVOdat
Single Volcano View Temporal Evolution of Unrest Side by Side Volcanoes |
WOVOdat is a database of volcanic unrest; instrumentally and visually recorded changes in seismicity, ground deformation, gas emission, and other parameters from their normal baselines. It is sponsored by the World Organization of Volcano Observatories (WOVO) and presently hosted at the Earth Observatory of Singapore.
GVMID Data on Volcano Monitoring Infrastructure The Global Volcano Monitoring Infrastructure Database GVMID, is aimed at documenting and improving capabilities of volcano monitoring from the ground and space. GVMID should provide a snapshot and baseline view of the techniques and instrumentation that are in place at various volcanoes, which can be use by volcano observatories as reference to setup new monitoring system or improving networks at a specific volcano. These data will allow identification of what monitoring gaps exist, which can be then targeted by remote sensing infrastructure and future instrument deployments. |
| Volcanic Hazard Maps | The IAVCEI Commission on Volcanic Hazards and Risk has a Volcanic Hazard Maps database designed to serve as a resource for hazard mappers (or other interested parties) to explore how common issues in hazard map development have been addressed at different volcanoes, in different countries, for different hazards, and for different intended audiences. In addition to the comprehensive, searchable Volcanic Hazard Maps Database, this website contains information about diversity of volcanic hazard maps, illustrated using examples from the database. This site is for educational purposes related to volcanic hazard maps. Hazard maps found on this website should not be used for emergency purposes. For the most recent, official hazard map for a particular volcano, please seek out the proper institutional authorities on the matter. |
| IRIS seismic stations/networks | Incorporated Research Institutions for Seismology (IRIS) Data Services map showing the location of seismic stations from all available networks (permanent or temporary) within a radius of 0.18° (about 20 km at mid-latitudes) from the given location of Toya. Users can customize a variety of filters and options in the left panel. Note that if there are no stations are known the map will default to show the entire world with a "No data matched request" error notice. |
| UNAVCO GPS/GNSS stations | Geodetic Data Services map from UNAVCO showing the location of GPS/GNSS stations from all available networks (permanent or temporary) within a radius of 20 km from the given location of Toya. Users can customize the data search based on station or network names, location, and time window. Requires Adobe Flash Player. |
| DECADE Data | The DECADE portal, still in the developmental stage, serves as an example of the proposed interoperability between The Smithsonian Institution's Global Volcanism Program, the Mapping Gas Emissions (MaGa) Database, and the EarthChem Geochemical Portal. The Deep Earth Carbon Degassing (DECADE) initiative seeks to use new and established technologies to determine accurate global fluxes of volcanic CO2 to the atmosphere, but installing CO2 monitoring networks on 20 of the world's 150 most actively degassing volcanoes. The group uses related laboratory-based studies (direct gas sampling and analysis, melt inclusions) to provide new data for direct degassing of deep earth carbon to the atmosphere. |
| Large Eruptions of Toya | Information about large Quaternary eruptions (VEI >= 4) is cataloged in the Large Magnitude Explosive Volcanic Eruptions (LaMEVE) database of the Volcano Global Risk Identification and Analysis Project (VOGRIPA). |
| EarthChem | EarthChem develops and maintains databases, software, and services that support the preservation, discovery, access and analysis of geochemical data, and facilitate their integration with the broad array of other available earth science parameters. EarthChem is operated by a joint team of disciplinary scientists, data scientists, data managers and information technology developers who are part of the NSF-funded data facility Integrated Earth Data Applications (IEDA). IEDA is a collaborative effort of EarthChem and the Marine Geoscience Data System (MGDS). |

