

AVO reported that sulfur dioxide emissions were detected by local gas monitoring sensors at Cleveland starting on 21 June. The emission rate increased during 24-30 June and then declined to background levels on 1 July. Although sulfur dioxide emissions had declined, vigorous steaming and moderately elevated surface temperatures at the summit were detected in satellite images the following days. On 5 July the Volcano Alert Level was raised to Advisory (the second lowest level on a four-level scale) and the Aviation Color Code was raised to Yellow (the second lowest color on a four-color scale). During 6-8 July a few small earthquakes were detected, steaming from the summit was observed, and elevated surface temperatures were characterized as weak. On 8 July the Volcano Alert Level was lowered to Normal and the Aviation Color Code was lowered to Green.
Source: US Geological Survey Alaska Volcano Observatory (AVO)
Explosion on 1 June 2020 produced an ash plume and destroyed the January 2019 lava dome
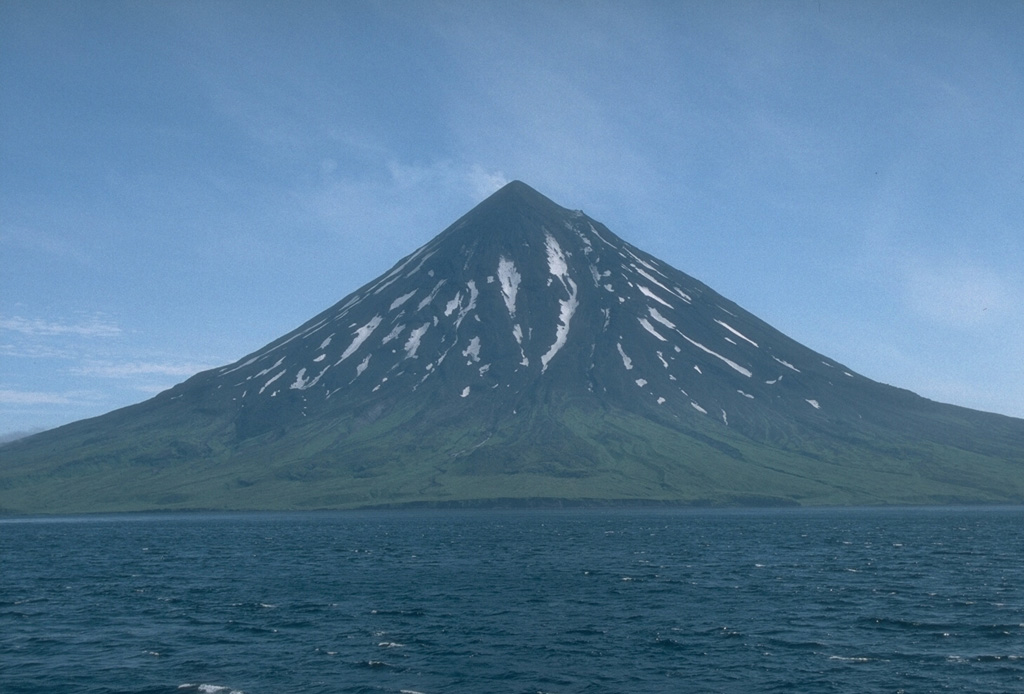
Cleveland is located in the western portion of Chuginadak Island, a remote island that is part of the east central Aleutians. Recent activity has been dominated by small ash explosions, intermittent lava dome growth, gas-and-steam emissions, and occasional thermal anomalies. The previous report described an ash explosion on 9 January 2019 that was followed by lava dome growth; by February the lava dome had begun to slowly subside (BGVN 45:03). This report covers activity during February-July 2020 using information primarily from the Alaska Volcano Observatory (AVO) and satellite data. According to AVO, local seismic, infrasound, and web camera data were unavailable due to an ongoing equipment failure.
Activity during February-May 2020 was relatively low and mainly consisted of weak gas-and-steam emissions and elevated surface temperatures near the summit, according to AVO. Sentinel-2 thermal satellite imagery highlights both gas-and-steam emissions and these higher surface temperatures near the summit crater (figure 34).
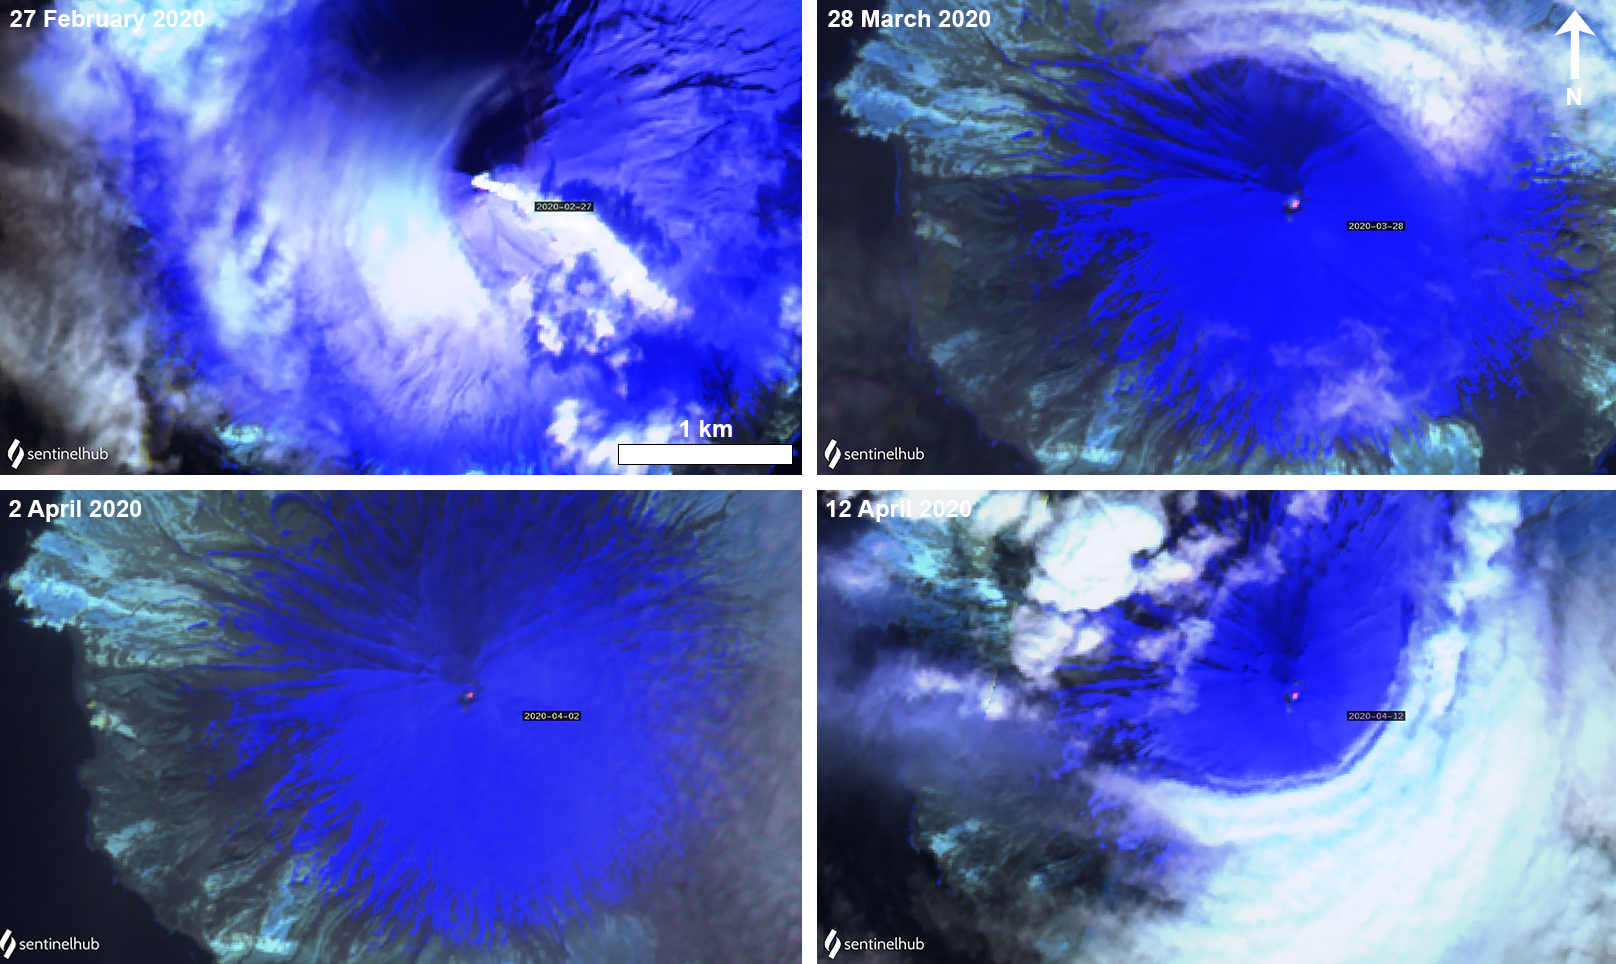 |
Figure 34. Sentinel-2 thermal satellite imagery of Cleveland showing a gas-and-steam plume (top left) and a weak thermal hotspot in the summit crater during late March to April 2020. Images using “Atmospheric penetration” (bands 12, 11, 8A) rendering; courtesy of Sentinel Hub Playground. |
According to AVO, infrasound sensors recorded a small explosion on 1 June at 2232 local time, producing an ash plume that rose to an altitude of 6.7 km and drifted S, though clouds prevented the detection of the ash plume at the time in satellite imagery. The explosion destroyed the January 2019 lava dome and ejected a large amount of material from the summit crater. AVO raised the Volcano Alert Level (VAL) to Watch (second highest of four) and the Aviation Color Code (ACC) to Orange (second highest of four). No significant volcanic activity was noted after the 1 June explosion, although a gas-and-steam plume was visible on 3 June rising from the ash-covered summit (figure 35). As a result, on 17 June AVO lowered the VAL to Advisory and the ACC to Yellow.
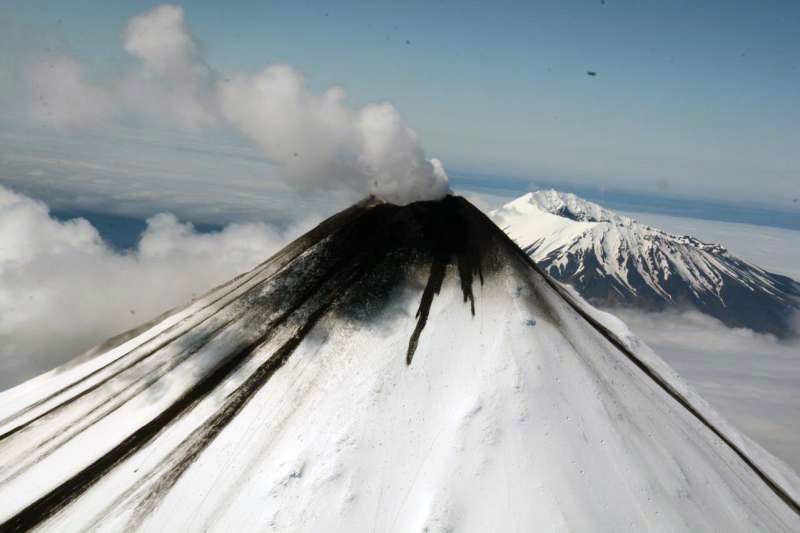 |
Figure 35. Photograph of Cleveland on 3 June 2020 (timestamp has been edited out due to new information. (14 Aug 2025)), showing gas-and-steam emissions and ash covering the summit. Photo by Burke Mees, courtesy of AVO. |
A comparison of images from before the 1 June event and afterwards showed initial ash deposits on the S flank on 4 June and ash and debris flow deposits on all flanks on 21 June (figure 36). Analysis of satellite imagery from 22 June revealed that ejecta had traveled as far as 1.4 km from the summit crater (figure 37). By that time volcanic debris flows had carried material 2.9 km down the E flank and more than 2.7 km down the N flank. This event also caused a thermal anomaly detected in the MIROVA (Middle InfraRed Observation of Volcanic Activity) analysis of MODIS satellite data.
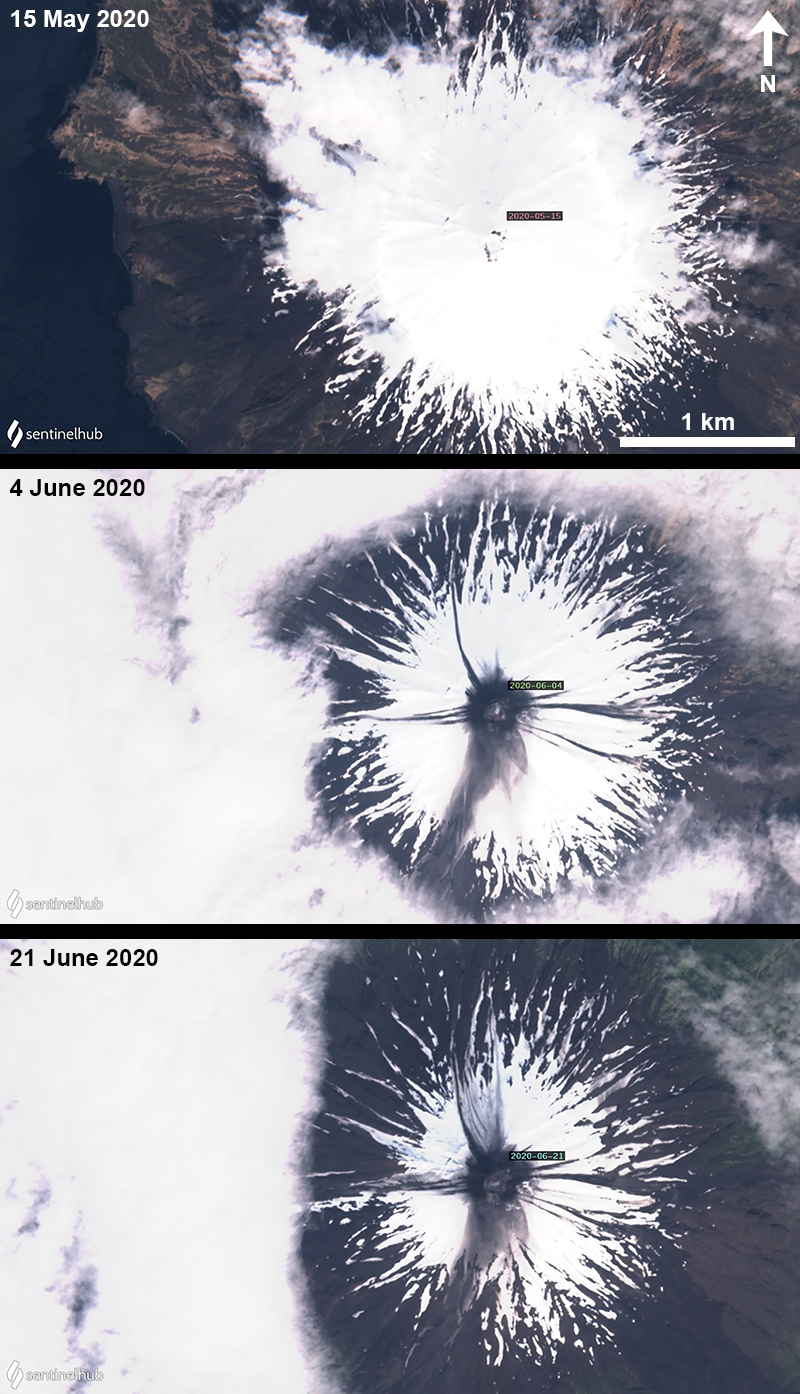 |
Figure 36. Sentinel-2 satellite images showing Cleveland before the explosion on 1 June (top) and after the explosion (middle and bottom). The ash plume generated from the event resulted in ashfall dominantly on the SW flank (middle); volcanic debris flows mixed with ash descended all flanks (bottom). Images using “Natural color” (bands 4, 3, 2) rendering; courtesy of Sentinel Hub Playground. |
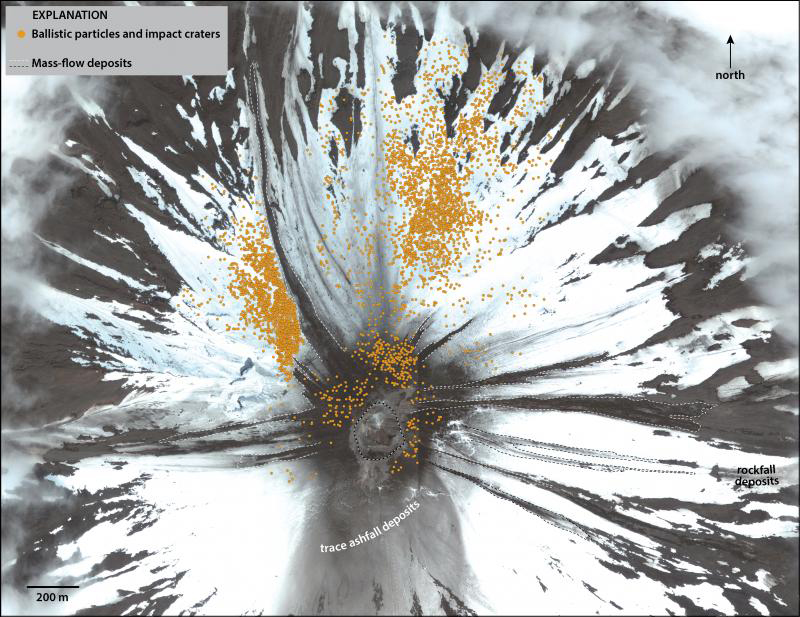 |
Figure 37. GeoEye-1 satellite image of Cleveland taken on 22 June 2020 (0000) showing the location of the ejected blocks and bombs (orange dots) produced from the 1 June explosion. These ejecta traveled as far as 1.3-1.4 km from the summit crater. Trace ashfall deposits are also observed, dominantly on the N and S flanks. Image prepared by Chris Waythomas, courtesy of AVO. |
Information Contacts: Alaska Volcano Observatory (AVO), a cooperative program of a) U.S. Geological Survey, 4200 University Drive, Anchorage, AK 99508-4667 USA (URL: https://avo.alaska.edu/), b) Geophysical Institute, University of Alaska, PO Box 757320, Fairbanks, AK 99775-7320, USA, and c) Alaska Division of Geological & Geophysical Surveys, 794 University Ave., Suite 200, Fairbanks, AK 99709, USA (URL: http://dggs.alaska.gov/); MIROVA (Middle InfraRed Observation of Volcanic Activity), a collaborative project between the Universities of Turin and Florence (Italy) supported by the Centre for Volcanic Risk of the Italian Civil Protection Department (URL: http://www.mirovaweb.it/); Sentinel Hub Playground (URL: https://www.sentinel-hub.com/explore/sentinel-playground).
2024: July
2023: January
| July
| August
2022: May
| June
2021: March
| October
2020: May
| June
| September
2019: January
| February
| November
2018: January
| February
| March
| April
| May
| June
| July
| August
| December
2017: February
| March
| April
| May
| June
| July
| August
| September
| October
| November
| December
2016: April
| May
| June
| October
| November
2015: June
| July
| August
| September
| October
2014: January
| February
| June
2013: February
| March
| May
2012: January
| February
| March
| April
| May
| June
| July
| August
| September
| November
2011: March
| July
| August
| September
| October
| November
| December
2010: May
| June
| August
| September
2009: April
| June
| September
| October
| December
2008: February
| May
| July
| August
| December
2007: July
| August
| September
2006: February
| May
| September
| October
2005: June
| July
| August
| October
| November
2001: February
| March
| April
| May
AVO reported that sulfur dioxide emissions were detected by local gas monitoring sensors at Cleveland starting on 21 June. The emission rate increased during 24-30 June and then declined to background levels on 1 July. Although sulfur dioxide emissions had declined, vigorous steaming and moderately elevated surface temperatures at the summit were detected in satellite images the following days. On 5 July the Volcano Alert Level was raised to Advisory (the second lowest level on a four-level scale) and the Aviation Color Code was raised to Yellow (the second lowest color on a four-color scale). During 6-8 July a few small earthquakes were detected, steaming from the summit was observed, and elevated surface temperatures were characterized as weak. On 8 July the Volcano Alert Level was lowered to Normal and the Aviation Color Code was lowered to Green.
Source: US Geological Survey Alaska Volcano Observatory (AVO)
AVO reported that seismicity at Cleveland had decreased over the previous few weeks to background levels. The Aviation Color Code was lowered to Green (the lowest color on a four-color scale) and the Volcano Alert Level was lowered to Normal (the lowest level on a four-level scale). Slightly elevated surface temperatures and diffuse gas emissions from the summit crater continued to occasionally be observed, or normal behavior for Cleveland. Monitoring capabilities had been upgraded to a five-station real-time seismic network, or enough stations to located volcanic earthquakes, based on an AVO partnership with the AVERT (Anticipating Volcanic Eruptions in Real-Time) project at Columbia University.
Source: US Geological Survey Alaska Volcano Observatory (AVO)
AVO reported that seismicity at Cleveland was low during 26 July through 1 August. Weather clouds obscured views of the volcano in satellite and webcam images, though minor steaming from the summit was observed during 27-31 July and 1 August. A single earthquake was detected on 26 July. During 28-30 July several earthquakes were detected by the local seismic network and weakly elevated surface temperatures were observed in satellite images. Many of these earthquakes were located less than 6 km below the surface. While these earthquakes are small (less than magnitude 2), they are unusual for Cleveland. The Volcano Alert Level remained at Advisory (the second level on a four-level scale) and the Aviation Color Code remained at Yellow (the second color on a four-color scale).
Source: US Geological Survey Alaska Volcano Observatory (AVO)
AVO reported that numerous earthquakes at Cleveland have been detected by the local seismic network during the previous week and 37 of the events were large enough to be located. Earthquake hypocenters shallowed from depths of less than 18 km during the beginning to depths less than 6 km by the end of the week. The earthquakes were small, at magnitudes less than 2, but the rate of events was unusual for Cleveland. The seismicity along with elevated surface temperatures at the summit crater frequently identified in satellite images and continued gas-and-steam emissions suggested an increased likelihood of a future eruption. The Volcano Alert Level for Cleveland to Advisory (the second level on a four-level scale) and the Aviation Color Code to Yellow (the second color on a four-color scale) at 1218 on 19 July. Earthquakes continued to be detected (but were too small to be located) during 21-23 July. Weather clouds mostly obscured views of the volcano in satellite and web camera images, though minor steaming from the summit occurred during 23-24 July.
Source: US Geological Survey Alaska Volcano Observatory (AVO)
AVO lowered both the Volcano Alert Level and the Aviation Color Code for Cleveland to Unassigned (insufficient monitoring to make an assessment) on 5 January, noting that signs of unrest had declined over the previous several months. Elevated surface temperatures in the summit crater were occasionally identified in satellite images but at a reduced frequency and strength. The last eruptive activity was a short-lived explosion on the evening of 1 June 2020, and sulfur dioxide emissions were last detected on 29 July 2022.
Source: US Geological Survey Alaska Volcano Observatory (AVO)
AVO reported that during 15-21 June elevated surface temperatures over Cleveland were sometimes identified in satellite images, reflecting the continuing emissions of hot gases. Weather clouds sometimes prevented views of the volcano. Crater subsidence in the summit crater was detected during the previous several weeks. Sulfur dioxide emissions were detected on 15 and 21 June. The Aviation Color Code remained at Yellow and the Volcano Alert Level remained at Advisory.
Source: US Geological Survey Alaska Volcano Observatory (AVO)
AVO reported that during 24-31 May daily elevated surface temperatures over Cleveland were identified in satellite images, along with plumes of steam and sulfur dioxide gas. Crater subsidence in the summit crater was detected during 26-27 May. The Aviation Color Code remained at Yellow and the Volcano Alert Level remained at Advisory.
Source: US Geological Survey Alaska Volcano Observatory (AVO)
AVO reported that during 17-24 May almost daily elevated surface temperatures over Cleveland were identified in satellite images. Daily sulfur dioxide emissions were visible, and steam plumes rose from the crater during 22-24 May. A series of small, local earthquakes were detected on 18 May. The Aviation Color Code remained at Yellow and the Volcano Alert Level remained at Advisory.
Source: US Geological Survey Alaska Volcano Observatory (AVO)
AVO reported that during 11-17 May elevated surface temperatures over Cleveland were identified in satellite images. No significant seismic or infrasound activity was detected. A continuous sulfur dioxide plume drifted 500 km during 15-16 May. The Aviation Color Code remained at Yellow and the Volcano Alert Level remained at Advisory.
Source: US Geological Survey Alaska Volcano Observatory (AVO)
On 10 May AVO raised the Aviation Color Code and the Volcano Alert Level for Cleveland to Yellow and Advisory, respectively, noting that elevated surface temperatures and sulfur dioxide emissions were identified in satellite data during the past few days.
Source: US Geological Survey Alaska Volcano Observatory (AVO)
On 20 October AVO lowered both the Aviation Color Code and the Volcano Alert Level for Cleveland to Unassigned, noting a steady decline in volcanic unrest over the previous few months. Elevated surface temperatures were still identified in satellite images, though at a reduced frequency and strength. A short-lived explosion on 1 June 2020 was the last time eruptive activity was recorded.
Source: US Geological Survey Alaska Volcano Observatory (AVO)
AVO reported that a magnitude 4.3 earthquake at Cleveland was recorded during the morning of 26 March. Smaller earthquakes continued to be detected that day at a decreasing rate. There have been no signs of activity observed in infrasound or satellite data, nor evidence of volcanic gas emissions and elevated surface temperatures due to clouds. The Aviation Color Code remained at Yellow and the Volcano Alert Level remained at Advisory.
Source: US Geological Survey Alaska Volcano Observatory (AVO)
AVO reported that on 10 March an earthquake at Cleveland was large enough to be recorded by seismometers 100 km away on Umnak Island. On 17 March volcanic gas emissions increased and elevated surface temperatures were identified in satellite images. The Aviation Color Code was raised to Yellow and the Volcano Alert Level was raised to Advisory.
Source: US Geological Survey Alaska Volcano Observatory (AVO)
AVO lowered both the Volcano Alert Level and the Aviation Color Code for Cleveland to Unassigned on 3 September, noting a lack of unrest over the past few months. A short-lived explosion was recorded on 1 June; satellite images showed no signs of elevated temperatures nor surficial changes in the summit crater since then.
Source: US Geological Survey Alaska Volcano Observatory (AVO)
AVO reported that no additional volcanic activity was detected at Cleveland after the short-lived explosion recorded on 1 June. The Volcano Alert Level was lowered to Advisory and the Aviation Color Code was lowered to Yellow.
Source: US Geological Survey Alaska Volcano Observatory (AVO)
AVO reported that unrest at Cleveland likely continued during 10-16 June, though no activity was identified in cloudy satellite images nor detected by regional geophysical networks. AVO noted that local seismic, infrasound, and web camera data are unavailable due to an equipment failure, Cleveland continued to be monitored with regional seismic and infrasound stations on nearby islands, along with lightning and satellite data capabilities. The Volcano Alert Level remained at Watch and the Aviation Color Code remained at Orange.
Source: US Geological Survey Alaska Volcano Observatory (AVO)
AVO reported that the eruption at Cleveland on 1 June destroyed the January 2019 lava dome and ejected a large amount of material from the summit crater. Volcanic debris flows traveled about 2.9 km down the E flank and more than 2.7 km down the N flank. No significant volcanic activity was noted in often cloudy satellite views during 2-9 June; a steam plume was visible on 3 June. The Volcano Alert Level remained at Watch and the Aviation Color Code remained at Orange.
Source: US Geological Survey Alaska Volcano Observatory (AVO)
A small explosion at Cleveland was recorded at 1032 on 1 June and produced an ash plume that rose to 6.7 km (22,000 ft) a.s.l. and drifted S. The local geophysical stations and web camera were unavailable due to an ongoing network outage. AVO raised the Volcano Alert Level to Watch and the Aviation Color Code to Orange.
Source: US Geological Survey Alaska Volcano Observatory (AVO)
AVO lowered both the Volcano Alert Level and the Aviation Color Code for Cleveland to Unassigned on 7 May, noting that explosive activity on 9 January 2019 (and subsequent lava extrusion in the summit crater) was followed by an overall decrease in detected surface temperature and no further surface changes.
Source: US Geological Survey Alaska Volcano Observatory (AVO)
AVO lowered the Volcano Alert Level for Cleveland to Advisory and the Aviation Color Code to Yellow on 15 November, noting that new satellite data and reanalysis of previous data over the past week showed that lava effusion likely had not begun on 8 November. Regional seismic and infrasound data showed no evidence of eruptive activity during 8-19 November; weakly-to-moderately elevated surface temperatures were sometimes identified in satellite images and steam plumes were sometimes visible in webcam images.
Source: US Geological Survey Alaska Volcano Observatory (AVO)
Highly elevated surface temperatures identified in satellite data indicated that slow lava effusion in Cleveland’s summit crater may have begun during 7-8 November. AVO raised the Volcano Alert Level to Watch and the Aviation Color Code to Orange. Robust steaming was visible in satellite and webcam images on 7 November.
Source: US Geological Survey Alaska Volcano Observatory (AVO)
AVO reported that unrest at Cleveland continued during 20-24 February, though no activity was detected in seismic or infrasound data. Elevated surface temperatures were identified in satellite images; weather clouds sometimes prevented views of the volcano. Satellite data showed continued subsidence of the lava dome with no evidence of new lava. On 25 February the Aviation Color Code was lowered to Yellow and the Volcano Alert Level was lowered to Advisory.
Source: US Geological Survey Alaska Volcano Observatory (AVO)
AVO reported that unrest at Cleveland continued during 13-19 February, though no activity was detected in seismic or infrasound data. Elevated surface temperatures were identified in satellite images; weather clouds sometimes prevented views of the volcano. The Aviation Color Code remained at Orange and the Volcano Alert Level remained at Watch.
Source: US Geological Survey Alaska Volcano Observatory (AVO)
AVO reported that analysis of recent satellite data suggested that the lava dome in Cleveland’s summit crater first observed on 12 January may have stopped growing on 16 January, and since then the center of the dome slowly subsided. Weakly elevated surface temperatures were evident in satellite data during 28 January-4 February. The Aviation Color Code remained at Orange and the Volcano Alert Level remained at Watch.
Source: US Geological Survey Alaska Volcano Observatory (AVO)
A small explosion at Cleveland was recorded by the seismic network at 1155 on 8 December. A second small explosion with a higher peak amplitude was detected at 1153 on 12 December, prompting AVO to raise the Aviation Color Code to Orange and the Volcano Alert Level to Watch. No ash cloud was observed, though weather clouds obscured views of the volcano. Elevated surface temperatures were visible in satellite data on 15 December. A small explosion which occurred at 0737 on 16 December generated a minor ash cloud that drifted NE.
Source: US Geological Survey Alaska Volcano Observatory (AVO)
Low-level unrest at Cleveland continued, though on 22 August AVO noted a pause in activity and lowered the Aviation Color Code to Yellow and the Volcano Alert Level to Advisory. The report noted that elevated surface temperatures were identified in satellite images the previous day, suggestive of hot gas emissions from the summit crater vents.
Source: US Geological Survey Alaska Volcano Observatory (AVO)
AVO reported that unrest at Cleveland continued during 15-20 August, though nothing significant was detected in seismic or infrasound data. Steaming from the crater was sometimes visible in clear webcam views, and elevated surface temperatures were occasionally identified in satellite images. The Aviation Color Code remained at Orange and the Volcano Alert Level remained at Watch.
Source: US Geological Survey Alaska Volcano Observatory (AVO)
AVO reported that unrest at Cleveland continued during 25-31 July, though nothing significant was detected in seismic or infrasound data. Meteorological cloud cover prevented views of the crater on most days, though steaming from the crater was visible in satellite and webcam views during 25-26 July. The Aviation Color Code remained at Orange and the Volcano Alert Level remained at Watch.
Source: US Geological Survey Alaska Volcano Observatory (AVO)
AVO reported that unrest at Cleveland continued during 18-23 July, though nothing significant was detected in seismic or infrasound data. Weakly elevated surface temperatures were identified in satellite images during 18 and 23-24 July; meteorological cloud cover hindered views of the crater on most of the other days. A small deposit of blocks within the summit crater and just below the E crater rim observed only in satellite data suggested the occurrence of a very small explosion undetectable in seismic and pressure sensor data. The Aviation Color Code remained at Orange and the Volcano Alert Level remained at Watch.
Source: US Geological Survey Alaska Volcano Observatory (AVO)
AVO reported that unrest at Cleveland continued during 11-17 July, though nothing significant was detected in seismic or infrasound data. Weakly elevated surface temperatures were identified in satellite images on 11 July; meteorological cloud cover prevented views of the crater on the other days. The Aviation Color Code remained at Orange and the Volcano Alert Level remained at Watch.
Source: US Geological Survey Alaska Volcano Observatory (AVO)
AVO reported that unrest at Cleveland continued during 4-10 July, though nothing significant was detected in seismic or infrasound data. Meteorological cloud cover often prevented views of the crater. Weakly elevated surface temperatures were identified in satellite images during 7 and 9-10 July; a small steam cloud was visible on 7 July. The Aviation Color Code remained at Orange and the Volcano Alert Level remained at Watch.
Source: US Geological Survey Alaska Volcano Observatory (AVO)
AVO reported that unrest at Cleveland continued during 27 June-3 July, though nothing significant was detected in seismic or infrasound data. Elevated surface temperatures were identified in satellite images during 29 June-2 July; the thermal anomaly extended SW downslope in the crater consistent with a lava flow. The Aviation Color Code remained at Orange and the Volcano Alert Level remained at Watch.
Source: US Geological Survey Alaska Volcano Observatory (AVO)
AVO reported that a satellite image of Cleveland acquired on 25 June showed a small, circular lava flow about 80 m in diameter in the summit crater. The presence of a flow over the active vent increases the chances of an explosion, so AVO raised the Aviation Color Code to Orange and the Volcano Alert Level to Watch.
Source: US Geological Survey Alaska Volcano Observatory (AVO)
AVO reported that low-level unrest at Cleveland continued during 13-19 June. Elevated surface temperatures were evident in satellite data on days when the area was cloud-free. Nothing unusual was observed in seismic or pressure sensor data. The Aviation Color Code remained at Yellow and the Volcano Alert Level remained at Advisory.
Source: US Geological Survey Alaska Volcano Observatory (AVO)
AVO reported that low-level unrest at Cleveland continued during 6-12 June. Elevated surface temperatures were identified using satellite data on most days, during times of cloud-free observations. Nothing unusual was observed in seismic or pressure sensor data. Steam emissions were observed during 11-12 June. The Aviation Color Code remained at Yellow and the Volcano Alert Level remained at Advisory.
Source: US Geological Survey Alaska Volcano Observatory (AVO)
AVO reported that a small explosion at Cleveland was detected in seismic and infrasound data at 2149 on 4 May. The event produced a small ash cloud that rose as high as 6.7 km (22,000 ft) a.s.l. and drifted SE. The Aviation Color Code and the Volcano Alert Level were raised to Orange/Watch. No additional significant activity led AVO to the lower the levels back to Yellow/Advisory on 6 May.
Source: US Geological Survey Alaska Volcano Observatory (AVO)
AVO reported that a small explosion at Cleveland was detected in seismic and infrasound data at 0759 on 13 April; no eruption plume was visible in satellite images. The Aviation Color Code remained at Orange and the Volcano Alert Level remained at Watch.
Source: US Geological Survey Alaska Volcano Observatory (AVO)
AVO reported that seismic and infrasound sensors recorded a small explosion at Cleveland at 0355 on 4 April. A subsequent satellite image indicated that hot material ejected from the event was deposited on the W flank, possibly reaching the coastline. A small ash cloud drifted SW at or below 4.6 km (15,000 ft) a.s.l. The Aviation Color Code was raised to Orange and the Volcano Alert Level was raised to Watch. Hours later, a small, short-duration seismic event coupled with satellite data suggested a small ash emission. The Alert level was lowered back to Yellow/Advisory on 6 April due to no further signs of activity.
Source: US Geological Survey Alaska Volcano Observatory (AVO)
AVO reported that seismic and infrasound sensors recorded a small explosion at Cleveland at 2219 on 14 March; ash plumes were not visible in subsequent cloudy satellite images. The Aviation Color Code remained at Yellow and the Volcano Alert Level remained at Advisory.
Source: US Geological Survey Alaska Volcano Observatory (AVO)
AVO reported that unrest continued at Cleveland during 7-13 March. Elevated surface temperatures were identified in satellite images on 7 March and seismicity slightly increased on 8 March. The Aviation Color Code was lowered to Yellow and the Volcano Alert Level was lowered to Advisory.
Source: US Geological Survey Alaska Volcano Observatory (AVO)
AVO reported that elevated surface temperatures were identified in satellite images of Cleveland during 28 February-3 March. Local seismic and infrasound sensors recorded a small explosion at 0557 on 2 March prompting AVO to raise the Aviation Color Code to Orange and the Volcano Alert Level to Watch. A volcanic cloud rose to an altitude of 4.6 km (15,000 ft) a.s.l. and drifted ENE. A satellite image acquired on 5 March showed no new lava effusion in the crater. The Aviation Color Code was lowered to Yellow and the Volcano Alert Level was lowered to Advisory.
Source: US Geological Survey Alaska Volcano Observatory (AVO)
AVO reported that a small explosion at Cleveland was detected in seismic and infrasound data at 2154 on 21 February. A satellite image acquired several hours after the event showed an area of moderately elevated surface temperatures extending about 2 km ESE from the summit, indicative of a warm deposit. The Aviation Color Code remained at Yellow and the Volcano Alert Level remained at Advisory.
Source: US Geological Survey Alaska Volcano Observatory (AVO)
AVO reported that low-level unrest continued at Cleveland. Thermal anomalies were identified in satellite data during 15-16 February, and possibly on 17 February. The Aviation Color Code remained at Yellow and the Volcano Alert Level remained at Advisory.
Source: US Geological Survey Alaska Volcano Observatory (AVO)
AVO reported that there was no evidence of significant activity at Cleveland since the last explosion was detected on 18 December 2017. The Aviation Color Code was lowered to Yellow and the Volcano Alert Level was lowered to Advisory. AVO noted that low-level unrest continued.
Source: US Geological Survey Alaska Volcano Observatory (AVO)
AVO reported that unrest at Cleveland continued during 31 January-6 February, though nothing significant was detected in seismic or infrasound data. Moderately elevated surface temperatures were identified in satellite images during 30-31 January; cloudy weather prevented observations the rest of the week. The Aviation Color Code remained at Orange and the Volcano Alert Level remained at Watch.
Source: US Geological Survey Alaska Volcano Observatory (AVO)
AVO reported that unrest at Cleveland continued during 24-30 January. A possible cold vapor plume drifted S on 24 January. Slightly elevated surface temperatures were identified in satellite images a few times during 26-30 January. Nothing significant was detected in seismic or infrasound data. The Aviation Color Code remained at Orange and the Volcano Alert Level remained at Watch.
Source: US Geological Survey Alaska Volcano Observatory (AVO)
Based on recent satellite data AVO reported on 19 January that a new lava flow had been emplaced within Cleveland’s summit crater sometime since the last observations of elevated surface temperatures on 5 January. Elevated surface temperatures were identified in satellite images during 19-22 January. No activity was detected by seismic or infrasound sensors during 20-23 January. The Aviation Color Code remained at Orange and the Volcano Alert Level remained at Watch.
Source: US Geological Survey Alaska Volcano Observatory (AVO)
AVO reported that on 27 and 31 December 2017 and 1 January 2018 elevated surface temperatures in Cleveland's summit crater were identified in satellite data; no other activity was noted using satellite data during 28 December 2017-2 January 2018, though weather clouds often hindered observations. Seismic and infrasound data were at background levels. The Aviation Color Code remained at Orange and the Volcano Alert Level remained at Watch.
Source: US Geological Survey Alaska Volcano Observatory (AVO)
AVO reported that a small explosion at Cleveland was detected in seismic and infrasound data at 1817 on 17 December; no eruption plume was visible in satellite observations, though conditions were cloudy. The Aviation Color Code remained at Orange and the Volcano Alert Level remained at Watch.
Source: US Geological Survey Alaska Volcano Observatory (AVO)
AVO reported that during 6-12 December no thermal anomalies were visible in mostly clear satellite images, and no activity was detected by seismic or infrasound sensors. AVO noted that lava effusion may have paused or stopped; a satellite image acquired on 26 November showed that the lava dome had the appearance of rubble in the bottom of the shallow crater. On 12 December AVO lowered the Aviation Color Code to Yellow and the Volcano Alert Level to Advisory, though an explosion the next day prompted a return to Orange and Watch, respectively. That explosion on 13 December was detected at 0420, and produced an eruption cloud identified in satellite data rising to an altitude of 6.1 km (20,000 ft) a.s.l. and drifting E.
Source: US Geological Survey Alaska Volcano Observatory (AVO)
AVO reported that during 29 November-5 December no significant activity was visible in cloudy to mostly cloudy satellite images, and no activity was detected by seismic or infrasound sensors. The Aviation Color Code remained at Orange and the Volcano Alert Level remained at Watch.
Source: US Geological Survey Alaska Volcano Observatory (AVO)
AVO reported that during 22-28 November no significant activity at Cleveland was visible in cloudy to partly cloudy satellite images, and no activity was detected by seismic or infrasound sensors. The Aviation Color Code remained at Orange and the Volcano Alert Level remained at Watch.
Source: US Geological Survey Alaska Volcano Observatory (AVO)
AVO reported that during 15-20 November elevated surface temperatures in Cleveland's summit crater were sometimes identified in satellite data, consistent with lava at or near the surface; weather clouds sometimes prevented observations. No significant eruptive activity was detected by seismic or infrasound sensors. On 14 November a small explosion occurred from a vent in the middle of the dome. The Aviation Color Code remained at Orange and the Volcano Alert Level remained at Watch.
Source: US Geological Survey Alaska Volcano Observatory (AVO)
AVO reported that during 8-13 November elevated surface temperatures in Cleveland's summit crater were identified in satellite data, possibly indicative of a lava flow in the crater. No significant eruptive activity was detected by seismic or infrasound sensors; both sensors detected a signal associated with low-level emissions during 0056-0059 on 12 November. A small explosion was recorded at 0315 on 14 November. The Aviation Color Code remained at Orange and the Volcano Alert Level remained at Watch.
Source: US Geological Survey Alaska Volcano Observatory (AVO)
AVO reported that small explosions at Cleveland on 28 and 30 October partly destroyed the lava dome within the summit crater. Elevated surface temperatures were identified in satellite data during clear views during 1 and 5-7 November, possibly indicative of a lava flow in the crater. Otherwise no significant eruptive activity was recorded by seismic or infrasound sensors. The Aviation Color Code remained at Orange and the Volcano Alert Level remained at Watch.
Source: US Geological Survey Alaska Volcano Observatory (AVO)
Based on satellite observations, AVO reported that the lava dome in Cleveland's summit crater continued to grow, and by 23 October it had dimensions of 140 x 110 m. A small, 30-second-long explosion was recorded at 1045 on 28 October in seismic and infrasound data. Weather conditions were overcast with clouds at approximately 4.6 km (15,000 ft) a.s.l.; no volcanic plumes associated with the explosion were identified in satellite images emerging above the cloud level. A small explosion was recorded at 0320 on 30 October, though no ash plume was observed rising above the weather clouds at 2.4 km (8,000 ft) a.s.l. in satellite data. Slightly elevated surface temperatures were detected the next day. The Aviation Color Code remained at Orange and the Volcano Alert Level remained at Watch.
Source: US Geological Survey Alaska Volcano Observatory (AVO)
AVO reported that the lava dome in Cleveland's summit crater continued to grow, and by 15 October it covered an area of about 9,500 square meters with dimensions of 125 x 100 m. No significant change in the size of the dome was identified in satellite data from 15 to 19 October. During 16 and 21-23 October satellite data showed moderately elevated surface temperatures and a small steam plume was visible in web camera images. The Aviation Color Code remained at Orange and the Volcano Alert Level remained at Watch.
Source: US Geological Survey Alaska Volcano Observatory (AVO)
On 13 October AVO reported that the lava dome in Cleveland’s summit crater, first observed in satellite data on 30 September, had doubled in size during 1-11 October. The lava dome covered an area of 8,300 square meters, and had approximate dimensions of 115 x 95 m. The number and intensity of elevated surface temperatures identified in satellite data had declined during the week, possibly indicating slowed or paused dome growth. A small steam plume was observed in mostly clear web camera views during 15-16 October, and moderately elevated surface temperatures were identified in satellite images on 16 October; these observations suggested continuing dome growth. The Aviation Color Code remained at Orange and the Volcano Alert Level remained at Watch.
Source: US Geological Survey Alaska Volcano Observatory (AVO)
AVO reported that no significant activity at Cleveland was observed in seismic or infrasound data during 4-10 October, though elevated surface temperatures identified in satellite data on 6 October suggested that the lava dome in the summit crater (first noted on 30 September) continued to grow. Elevated surface temperatures were identified during 8-9 October. The Aviation Color Code remained at Orange and the Volcano Alert Level remained at Watch.
Source: US Geological Survey Alaska Volcano Observatory (AVO)
AVO reported that two small explosions at Cleveland were detected at 0516 and 0558 on 28 September in infrasound and seismic data. Elevated surface temperatures were identified in satellite data, and a weak plume rising from the summit crater was recorded by the webcam. Satellite data indicated that lava effusion in the summit crater began on 30 September, and by 1 October the new lava dome had grown to about 4,200 square meters. The Aviation Color Code remained at Orange and the Volcano Alert Level remained at Watch.
Source: US Geological Survey Alaska Volcano Observatory (AVO)
AVO reported that during 20-24 September nothing significant was observed in satellite images and web camera views of Cleveland, and nothing noteworthy was detected in seismic or infrasound data. Minor steaming was noted during 22-24 September. A three-minute-long explosion that began at 1747 on 25 September was detected by seismic and infrasound sensors. Satellite data 30 minutes later suggested that a volcanic cloud likely containing ash rose to 4.6 km (15,000 ft) a.s.l. and drifted S. The Aviation Color Code remained at Orange and the Volcano Alert Level remained at Watch.
Source: US Geological Survey Alaska Volcano Observatory (AVO)
AVO reported that during 13-19 September nothing significant was observed in often cloudy satellite images and web camera views of Cleveland; elevated surface temperatures were identified in satellite images during 13-15 September and minor steaming was noted during 17-19 September. Nothing noteworthy was detected in seismic or infrasound data. The Aviation Color Code remained at Orange and the Volcano Alert Level remained at Watch.
Source: US Geological Survey Alaska Volcano Observatory (AVO)
AVO reported that during 6-12 September nothing significant was observed in often cloudy satellite images and web camera views of Cleveland; minor steaming was noted during 10-11 September. In addition, nothing noteworthy was detected in seismic or infrasound data. The Aviation Color Code remained at Orange and the Volcano Alert Level remained at Watch.
Source: US Geological Survey Alaska Volcano Observatory (AVO)
AVO reported that elevated surface temperatures at Cleveland were identified in satellite data during 29-30 August and 4-5 September; cloudy weather sometimes prevented satellite and webcam observations. Small vapor plumes from the summit was observed in webcam images during 30-31 August. Nothing noteworthy was detected in seismic or infrasound data. The Aviation Color Code remained at Orange and the Volcano Alert Level remained at Watch.
Source: US Geological Survey Alaska Volcano Observatory (AVO)
AVO reported that elevated surface temperatures at Cleveland were identified in satellite data during 25-28 August. Small vapor plumes from the summit were observed in webcam images during 28-29 August. The Aviation Color Code remained at Orange and the Volcano Alert Level remained at Watch.
Source: US Geological Survey Alaska Volcano Observatory (AVO)
AVO reported that elevated surface temperatures at Cleveland were identified in satellite data during 17-21 August. Minor degassing from the summit was observed in satellite and webcam images during 20-21 August. A 1-minute-long moderate explosion was detected at 1043 on 22 August in infrasound and seismic data. The Aviation Color Code remained at Orange and the Volcano Alert Level remained at Watch.
Source: US Geological Survey Alaska Volcano Observatory (AVO)
AVO reported that elevated surface temperatures at Cleveland were identified in satellite data during 9-15 August; weather clouds occasionally obscured views. No significant activity was observed in seismic and infrasound data. On 11 August AVO noted that lava-dome growth had stopped or slowed, based on satellite observations. Steam emissions from the summit crater were occasionally visible in webcam images. The Aviation Color Code remained at Orange and the Volcano Alert Level remained at Watch.
Source: US Geological Survey Alaska Volcano Observatory (AVO)
On 7 August AVO stated that recent data suggested that the extrusion of lava at the bottom of Cleveland's summit crater may have slowed or paused during the previous week, though unrest continued. Elevated surface temperatures in the summit crater were identified in satellite data and vigorous steaming was recorded by the webcam during 7-8 August. The Aviation Color Code remained at Orange and the Volcano Alert Level remained at Watch.
Source: US Geological Survey Alaska Volcano Observatory (AVO)
AVO reported that during 26 July-1 August no activity was observed in seismic or infrasound data at Cleveland. The small lava dome on the floor of the crater had grown from 30 m in diameter to 42, and continued to inflate; the surface area of the dome was at least 50 x 45 m (~2,100 square meters), which was an increase of about 75% since 25 July (~1,200 square meters). Steam plumes rising from the crater were recorded by the webcam during 25 and 29-30 July, and elevated surface temperatures (consistent with lava-dome growth) were identified in satellite images during 30 July-1 August. The Aviation Color Code remained at Orange and the Volcano Alert Level remained at Watch.
Source: US Geological Survey Alaska Volcano Observatory (AVO)
AVO reported that during 19-23 July elevated surface temperatures from Cleveland were identified in satellite images; no activity was observed in seismic, infrasound, or web-camera data although these data had been intermittent. On 21 July AVO noted that a new small lava dome, about 30 m in diameter and 10 m high, had appeared at the bottom of the summit crater within the previous week. The webcam recorded a weak steam plume rising from the summit crater on 25 July. The Aviation Color Code remained at Orange and the Volcano Alert Level remained at Watch.
Source: US Geological Survey Alaska Volcano Observatory (AVO)
AVO reported that during 12-18 July no significant activity at Cleveland was observed in cloudy or mostly cloudy satellite and web camera images; some minor steaming was noted. Moderately elevated surface temperatures were identified in satellite images on 14 July. Aviation Color Code remained at Orange and the Volcano Alert Level remained at Watch.
Source: US Geological Survey Alaska Volcano Observatory (AVO)
AVO reported that during 5-11 July no significant activity at Cleveland was observed in cloudy or mostly cloudy satellite and web camera images; some minor degassing was noted. Seismicity remained low. The Aviation Color Code remained at Orange and the Volcano Alert Level remained at Watch.
Source: US Geological Survey Alaska Volcano Observatory (AVO)
A moderate 10-minute-long explosion at Cleveland was detected in both seismic and infrasound data beginning at 0319 on 4 July, prompting AVO to raise the Aviation Color Code to Orange and the Volcano Alert Level to Watch. After the event, seismicity declined and remained low. Satellite images showed no clear evidence of an ash plume.
Source: US Geological Survey Alaska Volcano Observatory (AVO)
AVO reported that there have been no detections of anomalous seismicity or infrasound at Cleveland since a brief explosion on 16 May. Satellite-based evidence of continuing lava effusion was observed on 7 June but since then surface temperatures had become weaker. On 26 June AVO lowered the Aviation Color Code to Yellow and the Volcano Alert Level to Advisory.
Source: US Geological Survey Alaska Volcano Observatory (AVO)
AVO reported that no unusual activity at Cleveland had been detected in seismic or infrasound data during 14-20 June. Minor steaming from the summit was recorded by a webcam during 17-18 June, and slightly elevated surface temperatures were identified in a satellite image acquired on 19 and 20 June. The Aviation Color Code remained at Orange and the Volcano Alert Level remained at Watch.
Source: US Geological Survey Alaska Volcano Observatory (AVO)
AVO reported that on 6 June small low-frequency earthquakes at Cleveland were recorded by the seismic network. Elevated surface temperatures identified in satellite images during 6-7 June were consistent with lava effusion at the summit crater. No volcanic activity was detected in seismic, infrasound, or cloudy satellite images during 8-13 June, though AVO noted that lava effusion may have been occurring. A thermal anomaly was identified in satellite images during 12-13 June. The Aviation Color Code remained at Orange and the Volcano Alert Level remained at Watch.
Source: US Geological Survey Alaska Volcano Observatory (AVO)
AVO reported that no significant volcanic activity at Cleveland was detected in seismic, infrasound, or cloudy satellite images during 31 May-5 June. The webcam recorded steam emissions during periods of clear weather. Small low-frequency events were recorded by the seismic station located on the flank of the volcano beginning at 0939 on 6 June. The events were consistent with lava-dome growth, but growth could not be visually confirmed. The Aviation Color Code remained at Orange and the Volcano Alert Level remained at Watch.
Source: US Geological Survey Alaska Volcano Observatory (AVO)
AVO reported that no significant volcanic activity at Cleveland was detected in seismic, infrasound, or mostly cloudy satellite images during 24-30 May. The webcam periodically recorded steam emissions. The Aviation Color Code remained at Orange and the Volcano Alert Level remained at Watch.
Source: US Geological Survey Alaska Volcano Observatory (AVO)
AVO reported that a short-lived explosion at Cleveland was detected in both seismic and infrasound data at 1938 on 16 May; the seismic signal lasted about 11 minutes. An ash cloud observed in satellite images rose to an altitude of 4.6 km (15,000 ft) a.s.l. and drifted SW for about five hours. The explosions completely destroyed the lava dome that was emplaced in the summit crater during April-May. The Aviation Color Code remained at Orange and the Volcano Alert Level remained at Watch.
Source: US Geological Survey Alaska Volcano Observatory (AVO)
AVO reported that no significant volcanic activity at Cleveland was detected in seismic, infrasound, or satellite data during 10-16 May. The webcam recorded some gas plumes during 13-14 May. The Aviation Color Code remained at Orange and the Volcano Alert Level remained at Watch.
Source: US Geological Survey Alaska Volcano Observatory (AVO)
AVO reported that satellite images of Cleveland acquired during 28 April-2 May showed that the lava dome in the summit crater had widened and grown taller. AVO further noted that dome extrusion had occurred with little to no detectable seismicity. The Aviation Color Code remained at Orange and the Volcano Alert Level remained at Watch.
Source: US Geological Survey Alaska Volcano Observatory (AVO)
AVO reported that recent satellite images of Cleveland revealed that a lava dome has been extruded in the summit crater, with growth likely beginning after the last explosion on [24 March]. The Aviation Color Code was raised to Orange and the Volcano Alert Level was raised to Watch.
Slightly elevated surface temperatures were identified in satellite images over the past couple of weeks. The new dome was first visible in images on 15 April, with the presence of a small (less than 10 m diameter) mound deep in the crater. By 23 April this mound had grown to 45 m in diameter. Dome growth had occurred with no detectable seismicity.
Source: US Geological Survey Alaska Volcano Observatory (AVO)
AVO reported that no significant volcanic activity at Cleveland was detected in seismic, infrasound, or satellite data since an explosion occurred on 24 March. The Aviation Color Code was lowered to Yellow and the Volcano Alert Level was lowered to Advisory on 5 April.
Source: US Geological Survey Alaska Volcano Observatory (AVO)
AVO reported that no significant volcanic activity at Cleveland was detected in seismic or infrasound data during 29 March-4 April, and satellite views were often obscured by clouds. The Aviation Color Code remained at Orange and the Volcano Alert Level remained at Warning.
Source: US Geological Survey Alaska Volcano Observatory (AVO)
A small explosion at Cleveland was detected in both seismic and infrasound data at 0815 on 24 March, prompting AVO to raise the Aviation Color Code to Orange and the Volcano Alert Level to Watch. Cloud cover at 9.1 km (30,000 ft) a.s.l. obscured satellite observations of the volcano, and no ash cloud was observed from this event. Cloud cover prevented views during 25-27 March, and slightly elevated surface temperatures were identified in satellite data during 27-28 March; nothing significant was detected in seismic or infrasound data.
Source: US Geological Survey Alaska Volcano Observatory (AVO)
On 8 March AVO reported that satellite data collected over the previous few weeks did not indicate any growth of Cleveland's lava dome that was emplaced sometime in late January; weakly elevated surface temperatures detected in satellite data were consistent with cooling lava and not indicative of new activity. The Aviation Color Code was lowered to Yellow and the Volcano Alert Level was lowered to Advisory.
Source: US Geological Survey Alaska Volcano Observatory (AVO)
AVO reported that during 1-4 and 6-7 March slightly elevated surface temperatures were identified in satellite images of Cleveland, along with minor steaming from the summit visible in clear webcam images during 1-3 March. Cloud cover prevented views on 5 March. The Aviation Color Code remained at Orange and the Volcano Alert Level remained at Watch.
Source: US Geological Survey Alaska Volcano Observatory (AVO)
AVO reported that during 22-28 February no significant activity at Cleveland was observed in satellite and webcam views, nor in seismic or infrasound data. Slightly elevated surface temperatures were identified in a satellite image during 26-28 February, and minor steaming was visible in webcam images during 27-28 February. The Aviation Color Code remained at Orange and the Volcano Alert Level remained at Watch.
Source: US Geological Survey Alaska Volcano Observatory (AVO)
AVO reported that although weather clouds mostly prevented satellite and webcam views of Cleveland during 15-21 February, slightly elevated surface temperatures were identified in satellite imagery during 18-19 February. The Aviation Color Code remained at Orange and the Volcano Alert Level remained at Watch.
Source: US Geological Survey Alaska Volcano Observatory (AVO)
AVO reported that weakly elevated surface temperatures in Cleveland's summit crater were identified in satellite images during 7-9 February. Minor steaming was noted on 8 February. AVO noted that these observations were consistent with the presence of a lava dome that began extruding in the summit crater in late January. The Aviation Color Code remained at Orange and the Volcano Alert Level remained at Watch.
Source: US Geological Survey Alaska Volcano Observatory (AVO)
On 3 February AVO reported that recent satellite data indicated that a new lava dome had been extruded, and partially filled Cleveland's summit crater. The new dome is about 70 m in diameter, similar in size to previous lava domes that have developed on the crater floor. Since explosive activity has sometimes followed lava-dome extrusion, AVO increased the Aviation Color Code to Orange and the Volcano Alert Level to Watch. Weakly elevated surface temperatures were identified in several satellite images during 6-7 February, consistent with the presence of a lava dome that began forming in late January.
Source: US Geological Survey Alaska Volcano Observatory (AVO)
AVO reported that no activity at Cleveland had been observed following the explosion at Cleveland on 24 October. The Level of Concern Color Code was lowered to Yellow and the Volcano Alert Level was lowered to Advisory.
Source: US Geological Survey Alaska Volcano Observatory (AVO)
On 31 October AVO reported that satellite views of Cleveland late in the last week indicated that the 24 October explosion destroyed most of the previous lava dome, leaving a deep crater. Darkened areas around the summit region in post-explosion web camera images were interpreted as minor ash deposits from the explosion. Unrest continued during 26 October-1 November; clouds often obscured views of the volcano. The Level of Concern Color Code remained at Orange and the Volcano Alert Level remained at Watch.
Source: US Geological Survey Alaska Volcano Observatory (AVO)
AVO reported that an explosion at Cleveland was detected at 1310 on 24 October by both infrasound (air pressure) sensors and seismometers. Residents in Nikolski (75 km E) reported hearing the explosion. Weather clouds obscured satellite views although no eruption plume was detected above the cloud deck at 8.5 km (30,000 ft) a.s.l. AVO raised the Level of Concern Color Code to Orange and the Volcano Alert Level to Watch. Clear webcam views on 25 October showed intermittent, minor steam emissions possibly containing slight amounts of ash rising just above the crater rim.
Source: US Geological Survey Alaska Volcano Observatory (AVO)
AVO reported that seismic activity at Cleveland had remained low since explosions were detected in infrasound (pressure sensor) and seismic data on 5 and 10 May. No significant activity had been observed since satellite data confirmed the eruption of a small-volume lava dome within the summit crater on 18 May; weakly elevated surface temperatures detected during 2-3 June were consistent with cooling lava. On 3 June AVO lowered the Level of Concern Color Code to Yellow and the Volcano Alert Level was lowered to Advisory.
Source: US Geological Survey Alaska Volcano Observatory (AVO)
AVO reported that a small lava dome in Cleveland's summit crater first observed on 18 May had grown to about 60 m in diameter, though it had not changed since 23 May. Weakly elevated surface temperatures detected in satellite images during 25-26 May were consistent with the presence of the new lava dome. Seismicity remained low through 31 May. The Level of Concern Color Code remained at Orange and the Volcano Alert Level remained at Watch.
Source: US Geological Survey Alaska Volcano Observatory (AVO)
Based on analysis of satellite data, on 18 May AVO reported that a small-volume lava dome had erupted in Cleveland's summit crater during the past several days. The 50-m-diameter dome was similar in size and morphology to the past 10 domes extruded and destroyed since 2011 (the most recent cycle was earlier in May). Weak seismicity detected on 17 May was likely caused by lava extrusion. The Level of Concern Color Code remained at Orange and the Volcano Alert Level remained at Watch.
Source: US Geological Survey Alaska Volcano Observatory (AVO)
AVO reported that an explosion at Cleveland was detected at 0732 on 10 May by infrasound (air pressure) sensors. Cloud cover prevented satellite views during most of the previous week; nothing noteworthy was detected in satellite data and no anomalous seismicity was recorded after the explosion through 14 May. Energetic steaming and highly elevated surface temperatures in the summit crater were observed in satellite data on 15 May. The Level of Concern Color Code remained at Orange and the Volcano Alert Level remained at Watch.
Source: US Geological Survey Alaska Volcano Observatory (AVO)
AVO reported that an explosion at Cleveland was detected at 1844 on 5 May by both infrasound (air pressure) sensors and seismic data. AVO raised the Level of Concern Color Code to Orange and the Volcano Alert Level to Watch. Satellite views the next day were obscured by clouds; no signs of ash was detected above the cloud deck. AVO noted that the event likely modified the new, small lava dome that had been growing in the summit crater since the previous explosion on 16 April. No activity was observed in satellite images nor detected by the seismic and infrasound networks during 6-8 May. A small explosion was detected at 0732 on 10 May by infrasound sensors. A minor amount of ash was possibly generated by the explosion, but nothing was detected in satellite data and AVO received no reports of ash emissions from local observers or passing pilots.
Source: US Geological Survey Alaska Volcano Observatory (AVO)
On 29 April, AVO reported that no activity had been detected at Cleveland following the 16 April explosion; seismicity had returned to low levels within an hour of the event and no infrasound (pressure sensor) signals had been detected. Recent satellite images indicated that the August 2015 lava dome was gone and had been replaced with a small cinder cone within the summit crater. The Level of Concern Color Code was lowered to Yellow and the Volcano Alert Level was lowered to Advisory.
Source: US Geological Survey Alaska Volcano Observatory (AVO)
AVO reported that during 20-26 April no unusual seismicity was detected at Cleveland, and partly to mostly cloudy satellite images captured no activity. The Level of Concern Color Code remained at Orange and the Volcano Alert Level remained at Watch.
Source: US Geological Survey Alaska Volcano Observatory (AVO)
AVO reported an explosion at Cleveland at 1058 on 16 April was detected by both infrasound (air pressure) and seismic data. AVO raised the Level of Concern Color Code to Orange and the Volcano Alert Level to Watch. Seismicity decreased to background levels within an hour of the explosion. Satellite views the next day were obscured by clouds below 9.1 km (30,000 ft) a.s.l.; no signs of ash had been detected above that altitude.
Source: US Geological Survey Alaska Volcano Observatory (AVO)
AVO reported that strongly elevated temperatures at Cleveland had not been detected since 18 August, and moderately elevated temperatures have been observed with decreasing regularity since then (30 September was the most recent instance). In addition, explosive activity, as detected by infrasound, last occurred on 6 August. Due to the declining activity and indications that lave effusion likely had stopped, AVO lowered the Level of Concern Color Code to Yellow and the Volcano Alert Level to Advisory on 14 October.
Source: US Geological Survey Alaska Volcano Observatory (AVO)
AVO reported that during 7-13 October no activity at Cleveland was detected in satellite and webcam images. No significant activity was detected in seismic or infrasound data. The Aviation Color Code remained at Orange and the Volcano Alert Level remained at Watch.
Source: US Geological Survey Alaska Volcano Observatory (AVO)
AVO reported that during 30 September-6 October low-level unrest at Cleveland likely continued. Weakly elevated surface temperatures were detected in satellite images during 29-30 September. Minor steaming was recorded by the webcam on 1 October. The Aviation Color Code remained at Orange and the Volcano Alert Level remained at Watch.
Source: US Geological Survey Alaska Volcano Observatory (AVO)
AVO reported that during 23-29 September low-level unrest at Cleveland likely continued. The Aviation Color Code remained at Orange and the Volcano Alert Level remained at Watch.
Source: US Geological Survey Alaska Volcano Observatory (AVO)
AVO reported that during 16-22 September low-level unrest at Cleveland continued. Weakly elevated surface temperatures were detected in one satellite image during 20-21 September. The Aviation Color Code remained at Orange and the Volcano Alert Level remained at Watch.
Source: US Geological Survey Alaska Volcano Observatory (AVO)
AVO reported that during 9-15 September elevated surface temperatures at Cleveland were occasionally detected in satellite images. A robust steam plume was visible on 9 September. The Aviation Color Code remained at Orange and the Volcano Alert Level remained at Watch.
Source: US Geological Survey Alaska Volcano Observatory (AVO)
AVO reported that during 2-3 September a few very small earthquakes were detected at Cleveland. During 5-7 September elevated surface temperatures were detected in satellite images. Steaming from the summit was recorded by the webcam on 5 September. The next day satellite and webcam images showed a low-level gas-and-steam plume over the volcano. A robust steam plume was visible on 8 September. The Aviation Color Code remained at Orange and the Volcano Alert Level remained at Watch.
Source: US Geological Survey Alaska Volcano Observatory (AVO)
AVO reported that elevated surface temperatures in satellite images were periodically detected over Cleveland during 26 August-1 September. A small earthquake swarm was detected near Cleveland starting at 1103 on 29 August. A few, small, local earthquakes were detected during 30 August-1 September, likely a continuation of the swarm. The Aviation Color Code remained at Orange and the Volcano Alert Level remained at Watch.
Source: US Geological Survey Alaska Volcano Observatory (AVO)
On 21 August AVO reported that elevated surface temperatures detected at Cleveland's summit crater in satellite images during the previous few days likely indicated lava effusion. Minor steam emissions rose from the crater during 21-22 August. Elevated surface temperatures during 23-25 August were again detected. The Aviation Color Code remained at Orange and the Volcano Alert Level remained at Watch.
Source: US Geological Survey Alaska Volcano Observatory (AVO)
AVO reported that no unusual seismicity was detected at Cleveland during 12-18 August. Weather clouds prevented satellite and webcam views most days. On 18 August elevated surface temperatures were detected in satellite images and minor steam emissions were recorded by the webcam. The Aviation Color Code remained at Orange and the Volcano Alert Level remained at Watch.
Source: US Geological Survey Alaska Volcano Observatory (AVO)
AVO reported that during an overflight of Cleveland on 4 August a field crew observed a cooling pad of lava that covered the crater floor. A thermal camera detected temperatures of the dome surface in the range of 550-600 degrees Celsius. Minor vapor and diffuse ash emissions inside the crater were noted. During 4-6 August satellite images detected slightly elevated surface temperatures at the summit and the webcam recorded very minor steam emissions at times of clear weather. A small explosion occurred at 2203 on 6 August; no ash emissions were observed in satellite or webcam images. Small steam plumes rose from the crater during 9-10 August. The Aviation Color Code remained at Orange and the Volcano Alert Level remained at Watch.
Source: US Geological Survey Alaska Volcano Observatory (AVO)
AVO reported that during 29 July-4 August satellite images detected strongly elevated surface temperatures at Cleveland's summit consistent with growth of a new lava dome. A field crew working in the area on 1 August reported frequent rockfalls on the volcano. A weak infrasound signal was much smaller than the explosion detected on 21 July; the signal may have been related to gas emissions, also consistent with lava-dome effusion. A very small gas plume was visible in webcam images during 2-3 August, and steam emissions were observed on 4 August. The Aviation Color Code remained at Orange and the Volcano Alert Level remained at Watch.
Source: US Geological Survey Alaska Volcano Observatory (AVO)
AVO reported that during an overflight of Cleveland on 24 July a local field crew observed a thin layer of ash on the upper flanks (confirming a small explosion the week before) and vigorous steaming from the summit area. A small steam plume was recorded by the webcam on 27 July. The Aviation Color Code remained at Orange and the Volcano Alert Level remained at Watch.
Source: US Geological Survey Alaska Volcano Observatory (AVO)
AVO reported that at 0817 on 21 July an explosion at Cleveland was detected in both infrasound and seismic data. Cloud cover up to 9.1 km (30,000 ft) a.s.l. obscured views; no ash above the cloud deck was observed. Observers on a boat at the NE side of Cleveland reported seeing a dusting of ash on the snow near the summit as well as moderate steaming from the summit area. The Aviation Color Code was raised to Orange and the Volcano Alert Level was raised to Watch.
Source: US Geological Survey Alaska Volcano Observatory (AVO)
AVO reported that no significant activity was detected at Cleveland in seismic or infrasound data during 24-30 June. Elevated surface temperatures were detected during 28-30 June, and webcam images from 29 June showed fresh ash deposits at the summit. The Aviation Color Code remained at Yellow and the Volcano Alert Level remained at Advisory.
Source: US Geological Survey Alaska Volcano Observatory (AVO)
On 19 June AVO reported renewed unrest at Cleveland the previous week, characterized by elevated surface temperatures detected in satellite images and a dusting of ash near the summit visible on 14 June. Minor steaming was visible in the webcam during the week. The consistently elevated temperatures suggested possible renewed growth of the small lava dome in the summit crater. The Aviation Color Code remained at Yellow and the Volcano Alert Level remained at Advisory.
Source: US Geological Survey Alaska Volcano Observatory (AVO)
AVO reported earlier in June that an explosion from Cleveland on the evening of 5 June was detected on the Dillingham acoutstic infrasound array and at seismic stations at Korovin volcano. The brief event was similar to previous explosions at Cleveland, and generated a small detached plume with a weak ash signal observed in satellite imagery. The cloud was at an altitude of about 7.6 km (25,000 ft) a.s.l., had moved about 140 km SW, and rapidly dissipated. The last previous explosion at was 6 March, seen by residents of Nikolski who reported small ash puffs.
Source: US Geological Survey Alaska Volcano Observatory (AVO)
AVO reported that small explosions from Cleveland were detected by infrasound and lightning alarms at 1917 on 24 February and 0135 on 25 February. Small ash clouds from the explosions were detected in satellite images several hours after the events drifting at an altitude of about 5 km (16,000 ft) a.s.l. The Volcanic Alert Level remained at Advisory and the Aviation Color Code remained at Yellow.
Source: US Geological Survey Alaska Volcano Observatory (AVO)
AVO reported that no further activity at Cleveland had been detected after three brief explosions on 28 and 30 December, and 2 January; satellite images suggested no new lava effusion. On 10 January AVO lowered the Volcanic Alert Level to Advisory and the Aviation Color Code to Yellow.
Source: US Geological Survey Cascades Volcano Observatory (CVO)
AVO reported that at 1229 on 28 December 2013 an explosion at Cleveland was detected on distant seismic and infrasound instruments. Although satellite images did not detect ash it was possible the explosion generated minor ash emissions. Elevated surface temperatures following the explosion were detected. Another similar explosion was detected at 1906 on 30 December, and a third brief explosion was detected at 1900 on 1 January 2014. Following the second and third explosions, satellite images detected distinct ash plumes, detached from the summit, drifting 75-100 km N at unknown altitudes. On 2 January AVO raised the Volcanic Alert Level to Watch and the Aviation Color Code to Orange. No further activity was detected during 3-7 January.
Source: US Geological Survey Alaska Volcano Observatory (AVO)
On 4 June AVO reported that no explosions from Cleveland had been detected since 6 May, and there was no evidence of lava effusion since 13 May. Weakly elevated surface temperatures detected in recent clear-weather satellite images were consistent with cooling of a newly emplaced lava flow. AVO lowered the Volcanic Alert Level to Advisory and the Aviation Color Code to Yellow.
Source: US Geological Survey Alaska Volcano Observatory (AVO)
AVO reported that during 22-23 May elevated surface temperatures over Cleveland were observed in satellite images. Clouds obscured views during 24-26 May. Slightly elevated surface temperatures, consistent with a cooling lava flow, were observed in several satellite images during 26-28 May. The Volcanic Alert Level remained at Watch and the Aviation Color Code remained at Orange.
Source: US Geological Survey Alaska Volcano Observatory (AVO)
AVO reported that during 14-15 and 18-19 May elevated surface temperatures over Cleveland were observed in satellite images. Clouds obscured views during 16 and 20-21 May. Satellite image analysis revealed that a small lava flow had breached the SE rim of the summit crater and traveled as far as1.5 km down the flank. The Volcanic Alert Level remained at Watch and the Aviation Color Code remained at Orange.
Source: US Geological Survey Alaska Volcano Observatory (AVO)
AVO reported that during 8-9 May no further explosions had been detected at Cleveland based on regional infrasonic data. Cloud cover prevented satellite observations of the crater. Clear satellite views revealed vigorous steam plumes during 10-11 May and thermal anomalies during 10-14 May. On 14 May AVO noted that analysis of recent satellite imagery revealed a 100-m-wide lava flow, breaching the SE rim of the summit crater, and extending about 1.5 km down the SE flank. The Volcanic Alert Level remained at Watch and the Aviation Color Code remained at Orange.
Source: US Geological Survey Alaska Volcano Observatory (AVO)
AVO reported that on 4 May the infrasound network detected three short-duration explosions from Cleveland at 0500, 0717, and 1144. A small, low-altitude ash cloud along with high surface temperatures at the summit were observed in satellite images starting at 0717. In a report posted at 1822 AVO noted that both webcam and satellite images suggested continuous low-level emissions of gas, steam, and minor amounts of ash over the past several hours with a faint plume drifting E below 4.6 km (15,000 ft) a.s.l. The Volcanic Alert Level was raised to Watch and the Aviation Color Code was raised to Orange.
On 5 May the amplitude of the Cleveland infrasonic tremor, as measured by the ground-coupled airwaves on the Okmok seismic network, 120 km NE, decreased from its peak activity the evening before. Satellite images again detected continuous low-level emissions of gas, steam, and minor amounts of ash producing a faint plume that drifted E below 4.6 km (15,000 ft) a.s.l. Explosions were detected at 1123 on 5 May and 0800 on 6 May. A thermal anomaly continued to be detected. A news article stated that some airplanes were diverted away from Cleveland.
Source: US Geological Survey Alaska Volcano Observatory (AVO)
AVO reported that during 6-7 March clouds obscured satellite views of Cleveland's lava dome. On 8 March AVO noted that the lava dome had remained unchanged since 6 February, and the last thermal anomalies were observed on 26 February. Although cloud cover often prevents observations of the dome, clear views between 1 and 5 March verified no changes. The Volcanic Alert Level was lowered to Advisory and the Aviation Color Code was lowered to Yellow.
Source: US Geological Survey Alaska Volcano Observatory (AVO)
AVO reported that during 27 February-5 March clouds obscured satellite views of Cleveland's lava dome. The Volcanic Alert Level remained at Watch and the Aviation Color Code remained at Orange.
Source: US Geological Survey Alaska Volcano Observatory (AVO)
AVO reported that during 20-26 February clouds obscured satellite views of Cleveland's lava dome. The Volcanic Alert Level remained at Watch and the Aviation Color Code remained at Orange.
Source: US Geological Survey Alaska Volcano Observatory (AVO)
AVO reported that during 12-15 February elevated surface temperatures from Cleveland's lava dome were detected in satellite images. Clouds obscured views of the dome during 16-19 February. The Volcanic Alert Level remained at Watch and the Aviation Color Code remained at Orange.
Source: US Geological Survey Alaska Volcano Observatory (AVO)
On 6 February AVO reported that satellite imagery acquired on 30 January indicated that a lava dome had grown in Cleveland's summit crater, prompting AVO to raise the Volcanic Alert Level to Watch and the Aviation Color Code to Orange. The dome was about 100 m in diameter and may have begun forming as early as 24 January when elevated surface temperatures were observed in satellite images. The size and shape of the dome appeared to be unchanged based on satellite data acquired on 2 February. Elevated surface temperatures from the lava dome were detected during 5-6 and 8-11 February.
Source: US Geological Survey Alaska Volcano Observatory (AVO)
On 21 November AVO noted that no explosions at Cleveland had been detected since 10 November, nor evidence of renewed lava-dome growth. The Volcanic Alert Level was lowered to Advisory and the Aviation Color Code was lowered to Yellow. Elevated surface temperatures were detected in satellite imagery during 21-24 November. Clouds obscured satellite and web camera views during 25-27 November.
Source: US Geological Survey Alaska Volcano Observatory (AVO)
AVO reported that no new activity was observed in cloudy- to- mostly-cloudy satellite images and web-camera views during 14-15 November. Clouds completely obstructed views during 16-18 November. The Aviation Color Code remained at Orange.
Source: US Geological Survey Alaska Volcano Observatory (AVO)
AVO reported that on 6 November thermal infrared satellite images of Cleveland showed elevated surface temperatures. Clouds obscure views of the lava dome during 7-9 November. A small ash cloud drifting ENE was detected in satellite imagery at 1147 on 10 November. The Volcano Alert Level was raised to Watch and the Aviation Color Code was raised to Orange. At 1843 the ash cloud was observed almost 100 km S of Dutch Harbor (260 km ENE). No new activity was observed in mostly cloudy images during11-13 November. Post-event analysis of infrasound data suggested that a small explosion likely occurred at 1125 on 10 November.
Source: US Geological Survey Alaska Volcano Observatory (AVO)
On 5 September, AVO reported that satellite views of Cleveland showed no evidence of further eruptive activity since the last explosion on 20 August. Fresh lava within the summit crater was last detected in images in early May. The Volcano Alert Level was lowered to Advisory and the Aviation Color Code was lowered to Yellow.
Source: US Geological Survey Alaska Volcano Observatory (AVO)
AVO reported that satellite images of Cleveland from 17 August showed that the summit crater was tephra-covered, funnel-shaped, and contained no lava dome. Cloud cover prevented observations during 28 August-3 September. The Volcano Alert Level remained at Watch and the Aviation Color Code remained at Orange.
Source: US Geological Survey Alaska Volcano Observatory (AVO)
AVO reported that nothing unusual was observed at Cleveland in cloudy to partly cloudy satellite images during 22-26 August. Slightly elevated surface temperatures were detected at the summit during 23-24 August. Cloud cover prevented observations during 27-28 August. The Volcano Alert Level remained at Watch and the Aviation Color Code remained at Orange.
Source: US Geological Survey Alaska Volcano Observatory (AVO)
AVO reported that nothing unusual was observed at Cleveland in cloudy to partly cloudy satellite images during 15-16, 18, and 20-21 August. A small explosion was detected on 17 August by seismic and infrasound instruments on neighboring volcanoes. No evidence of an ash cloud was visible in satellite images following the event. Another small explosion on 19 August produced a low-level ash cloud, observed in satellite imagery, that drifted SE. Retrospective analysis of ground-coupled airwaves in seismic data further confirmed the explosion. The Volcano Alert Level remained at Watch and the Aviation Color Code remained at Orange.
Source: US Geological Survey Alaska Volcano Observatory (AVO)
AVO reported that during 8-11 August elevated surface temperatures from Cleveland were detected in partly-cloudy satellite images. Cloud cover prevented observations on 12 August. Nothing unusual was observed in images during 13-14 August. The Volcano Alert Level remained at Watch and the Aviation Color Code remained at Orange.
Source: US Geological Survey Alaska Volcano Observatory (AVO)
AVO reported that cloud cover prevented satellite and web-camera observations of Cleveland during 1-3 and 5-6 August. A small explosion at 0838 on 4 August was detected based on retrospective analysis of infrasound data. Satellite images showed a brief, faint steam plume about four hours after the event and also detected elevated surface temperatures in several clear views of the volcano. On 7 August elevated surface temperatures were detected in partly-cloudy satellite images. The Volcano Alert Level remained at Watch and the Aviation Color Code remained at Orange.
Source: US Geological Survey Alaska Volcano Observatory (AVO)
AVO reported that cloud cover mostly prevented satellite and web camera observations of Cleveland during 25-31 July. Slightly elevated surface temperatures were detected in satellite images during 25-26 and 29-30 July. The Volcano Alert Level remained at Watch and the Aviation Color Code remained at Orange.
Source: US Geological Survey Alaska Volcano Observatory (AVO)
AVO reported that elevated surface temperatures from Cleveland were detected in satellite images during 18-20 July. Images revealed nothing unusual during 20-22 July. Cloud cover mostly prevented observations during 22-24 July; a steam plume rose from the crater on 23 July. The Volcano Alert Level remained at Watch and the Aviation Color Code remained at Orange.
Source: US Geological Survey Alaska Volcano Observatory (AVO)
AVO reported that on 11 July a low-altitude ash cloud from Cleveland was detected in satellite imagery. During 12-15 July cloud cover prevented views of the volcano. Elevated surface temperatures were detected in images on 15 July. The Volcano Alert Level remained at Watch and the Aviation Color Code remained at Orange.
Source: US Geological Survey Alaska Volcano Observatory (AVO)
AVO reported that cloudy conditions at Cleveland often prevented observations during 4-9 July. Clear views of the volcano by the web camera on the morning of 6 July revealed a distinct plume, likely containing water vapor and volcanic gas, drifting several tens of miles downwind from the summit. Elevated surface temperatures were detected in satellite images on 10 July. The Volcano Alert Level remained at Watch and the Aviation Color Code remained at Orange.
Source: US Geological Survey Alaska Volcano Observatory (AVO)
AVO reported that cloudy conditions at Cleveland mostly prevented observations during 26-28 June. An area of possibly elevated surface temperatures was observed in images during 27-28 June. Cloud cover prevented observations during 29 June-3 July. The Volcano Alert Level remained at Watch and the Aviation Color Code remained at Orange.
Source: US Geological Survey Alaska Volcano Observatory (AVO)
AVO reported that a small amount of ash from an explosion at Cleveland on 19 June was visible in satellite imagery drifting ESE. During 20-24 June thermal anomalies were detected in satellite imagery. On 21 June a small steam-and-gas plume was visible in web camera images. The Volcano Alert Level remained at Watch and the Aviation Color Code remained at Orange.
Source: US Geological Survey Alaska Volcano Observatory (AVO)
AVO reported that during 12-19 June meteorological cloud cover often prevented satellite views of Cleveland. Elevated surface temperatures at the summit were detected using infrared imagery during 12-13 and 18-19 June. A pilot report, a web camera image, and infrasound data all indicated that an ash-producing explosion occurred around 1405 on 19 June. The pilot report suggested that the cloud altitude was 10 km (35,000 ft) a.s.l. and the infrasound data indicated that the eruption duration was short. The Volcano Alert Level was raised to Watch and the Aviation Color Code was raised to Orange.
Source: US Geological Survey Alaska Volcano Observatory (AVO)
AVO reported that during 5-6 June elevated surface temperatures at Cleveland's summit were detected in satellite imagery. A low-level plume that rose to an altitude of 3.5 km (11,500 ft) a.s.l. was observed by a web camera on 6 June. A strong sulfur odor was reported by observers in Nikolski (75 km E). Clouds prevented views of the volcano on 7 June. Minor deposits of ash near the summit crater were observed in satellite images during 9-10 June and elevated surface temperatures were detected during 11-12 June. The Volcano Alert Level remained at Advisory and the Aviation Color Code remained at Yellow.
Source: US Geological Survey Alaska Volcano Observatory (AVO)
On 30 May AVO reported that no explosions or renewed lava-dome growth had been detected at Cleveland since 9 May. The Volcano Alert Level was lowered to Advisory and the Aviation Color Code was lowered to Yellow. On 4 June a possible small explosion was detected by infrasound. No eruption plume was observed in cloudy satellite images, but elevated surface temperatures were detected at the summit.
Source: US Geological Survey Alaska Volcano Observatory (AVO)
AVO reported that during 23-29 May satellite observations of Cleveland's summit crater revealed nothing unusual; no ash emissions or other signs of unrest were detected or reported. The Volcano Alert Level remained at Watch and the Aviation Color Code remained at Orange.
Source: US Geological Survey Alaska Volcano Observatory (AVO)
AVO reported that during 16-22 May satellite observations of Cleveland's summit crater revealed nothing unusual; no ash emissions or other signs of unrest were detected or reported. The Volcano Alert Level remained at Watch and the Aviation Color Code remained at Orange.
Source: US Geological Survey Alaska Volcano Observatory (AVO)
AVO reported that during 9-12 and 15 May cloudy weather conditions prevented satellite observations of Cleveland's summit crater. Elevated surface temperatures were detected in images on 13 May and possibly the next day. The Volcano Alert Level remained at Watch and the Aviation Color Code remained at Orange.
Source: US Geological Survey Alaska Volcano Observatory (AVO)
Based on analyses of satellite images, AVO reported on 4 May that the small lava dome recently emplaced in Cleveland's summit crater had been destroyed late in the previous week, but the explosion was too small to be detected by distant infrasound and seismic networks. A small new dome was extruded following the explosion and was the fifth dome to be observed in this eruptive episode which began in July 2011. During 4-5 May two small explosions were detected. No ash was observed with the mostly-cloudy conditions. Satellite observations were obscured by clouds during 6-8 May.
Source: US Geological Survey Alaska Volcano Observatory (AVO)
AVO reported that elevated surface temperatures were detected over Cleveland in satellite imagery during 25-29 April and possibly on 30 April. Observations showed that a small lava dome, 25 m across, had recently been emplaced.
Source: US Geological Survey Alaska Volcano Observatory (AVO)
AVO reported that elevated surface temperatures were observed over Cleveland in satellite imagery during 17-18 April. An explosion on 19 April at 0438, detected by seismometers at Makushin and Okmok volcanoes, generated an ash cloud the rose 4-6 km (13,100-19,700 ft) a.s.l. and drifted S. Satellite images showed block-and-ash deposits extending for up to 1 km down the S flank. A possible weak thermal anomaly was detected in images during 20-21 April.
Source: US Geological Survey Alaska Volcano Observatory (AVO)
AVO reported that elevated surface temperatures were observed over Cleveland in satellite imagery during 11-12 April. Two explosions were detected on 13 April by distant seismic stations and infrasound arrays. Neither of these explosions produced an ash cloud that could be detected in satellite images. There was no evidence of explosive activity or eruption of lava in the summit crater during 14-17 April. No seismic information was available because Cleveland does not have a real-time seismic network.
Source: US Geological Survey Alaska Volcano Observatory (AVO)
AVO reported that a small explosion from Cleveland was detected at 0112 on 4 April by distant seismic stations and infrasound arrays. Weather conditions prevented the detection of a possible eruption cloud in satellite images or by visual observation of the summit. Observations the next day revealed a thermal anomaly and that the 70-m-diameter lava dome had been destroyed by the explosion. This was the third lava dome that was erupted and subsequently destroyed by explosive events since the eruption began in July 2011.
On 6 April two short-duration explosions occurred at about 1635 and 2126. The resulting eruption clouds were ash poor and did not rise above 3 km (10,000 ft) a.s.l. Elevated surface temperatures were observed using infrared satellite images near the times of the explosions. Satellite observations were obscured by clouds during 8-10 April. No seismic information was available because Cleveland does not have a real-time seismic network.
Source: US Geological Survey Alaska Volcano Observatory (AVO)
AVO reported that on 28 March the Volcano Alert Level for Cleveland was raised to Watch and the Aviation Color Code was raised to Orange due to the formation of a new lava dome, observed in satellite imagery, which extruded in the summit crater during the previous week. During 29 March-3 April cloud cover prevented observations of the crater. Elevated surface temperatures consistent with a hot lava dome were detected in infrared satellite imagery on 4 April. No seismic information was available because Cleveland does not have a real-time seismic network.
Source: US Geological Survey Alaska Volcano Observatory (AVO)
AVO reported on 23 March that the Volcano Alert Level and Aviation Color Code for Cleveland were lowered to Advisory and Yellow, respectively, because no explosions had been detected since 13 March and lava-dome growth was not evident after that.
Source: US Geological Survey Alaska Volcano Observatory (AVO)
AVO reported that a small explosion from Cleveland was detected at 1455 on 13 March by distant seismic stations and infrasound arrays. Weather conditions prevented the detection of a possible eruption cloud in satellite images or by visual observation of the summit. No other activity was detected during 14-19 March. The Volcano Alert Level remained at Watch and the Aviation Color Code remained at Orange. No current seismic information was available because Cleveland does not have a real-time seismic network.
Source: US Geological Survey Alaska Volcano Observatory (AVO)
AVO reported that a small explosion from Cleveland was detected at 1905 on 7 March by distant seismic stations and infrasound arrays. Weather conditions prevented the detection of a possible eruption cloud in satellite images or by visual observation of the summit. Another small explosion was detected at 1605 on 9 March and again weather conditions prevented observations. No other activity was detected during 11-13 March. The Volcano Alert Level remained at Watch and the Aviation Color Code remained at Orange. No current seismic information was available because Cleveland does not have a real-time seismic network.
Source: US Geological Survey Alaska Volcano Observatory (AVO)
AVO reported that during 24 February-2 March satellite images of Cleveland revealed no unusual activity and no significant changes in the size of the lava dome. A weak thermal anomaly was detected in satellite imagery on 3 March. The Volcano Alert Level remained at Watch and the Aviation Color Code remained at Orange. No current seismic information was available because Cleveland does not have a real-time seismic network.
Source: US Geological Survey Alaska Volcano Observatory (AVO)
AVO reported that satellite observations of Cleveland during 22-28 February revealed that the growth of the lava dome continued at a slow rate. Cloud cover over the volcano prevented views of the lava dome during 22 and 25-28 February. On 23 February a thermal anomaly was detected in partly cloudy satellite images. The Volcano Alert Level remained at Watch and the Aviation Color Code remained at Orange. No current seismic information was available because Cleveland does not have a real-time seismic network.
Source: US Geological Survey Alaska Volcano Observatory (AVO)
AVO reported that during 15-18 and 20-21 February no observations of elevated surface temperatures or ash emissions from Cleveland were noted. On 17 February, AVO reported that partly-cloudy satellite observations over the past week revealed that the lava dome had grown to about 60 m in diameter. On 19 February an elevated surface temperature was detected in satellite images. The Volcano Alert Level remained at Watch and the Aviation Color Code remained at Orange. No current seismic information was available because Cleveland does not have a real-time seismic network.
Source: US Geological Survey Alaska Volcano Observatory (AVO)
AVO reported that during 8-14 February there were no observations of elevated surface temperatures or ash emissions from Cleveland because of partly cloudy conditions. On 10 February satellite observations revealed that the lava dome had grown to about 50 m in diameter. The Volcano Alert Level remained at Watch and the Aviation Color Code remained at Orange. No current seismic information was available because Cleveland does not have a real-time seismic network.
Source: US Geological Survey Alaska Volcano Observatory (AVO)
AVO reported that during 2-7 February cloud cover over Cleveland prevented views of the lava dome in the summit crater. The Volcano Alert Level remained at Watch and the Aviation Color Code remained at Orange. No current seismic information was available because Cleveland does not have a real-time seismic network.
Source: US Geological Survey Alaska Volcano Observatory (AVO)
AVO reported that on 31 January the Volcano Alert Level for Cleveland was raised to Watch and the Aviation Color Code was raised to Orange due to the formation of a new 40-m-wide lava dome in the summit crater that was observed in satellite imagery on 30 January. The lava dome that formed during the past fall and winter was removed by explosive activity on 25 and 29 December 2011. No current seismic information was available because Cleveland does not have a real-time seismic network.
Source: US Geological Survey Alaska Volcano Observatory (AVO)
AVO reported that an ash cloud from Cleveland rose to an altitude of 4.6 km (15,000 ft) a.s.l. and drifted 80 km ESE on 29 December. AVO raised the Volcano Alert Level to Watch and the Aviation Color Code to Orange. During 30 December-3 January there were no new signs of explosive activity; the Volcano Alert Level was lowered to Advisory and the Aviation Color Code to Yellow on 30 December. No current seismic information was available because Cleveland does not have a real-time seismic network.
Source: US Geological Survey Alaska Volcano Observatory (AVO)
AVO reported that a thermal anomaly over the lava dome surface in Cleveland's summit crater was visible on 2 November, although cloudy views mostly prevented observations. On 3 November AVO lowered the Volcano Alert Level to Advisory and the Aviation Color Code to Yellow because satellite observations indicated no significant change in the size of the lava dome, and no explosive activity or ash emissions had been reported. Cloud cover continued to prevent observations during 4-6 November. Satellite imagery showed slightly elevated temperatures near the volcano's summit during 6-7 November. No current seismic information was available because Cleveland does not have a real-time seismic network.
Source: US Geological Survey Alaska Volcano Observatory (AVO)
AVO reported that a radar image from 23 October indicated a lowering of the lava dome surface in Cleveland's summit crater. During 26 October-1 November cloud cover prevented views of the lava dome. The Volcano Alert Level remained at Watch and the Aviation Color Code remained at Orange. No current seismic information was available because Cleveland does not have a real-time seismic network.
Source: US Geological Survey Alaska Volcano Observatory (AVO)
AVO reported that during 19-23 October cloud cover over Cleveland prevented views of the lava dome in the summit crater. The Volcano Alert Level remained at Watch and the Aviation Color Code remained at Orange. No current seismic information was available because Cleveland does not have a real-time seismic network.
Source: US Geological Survey Alaska Volcano Observatory (AVO)
AVO reported that during 12-13 October cloud cover over Cleveland prevented views of the lava dome in the summit crater. Partly cloudy satellite views during 14-18 October showed elevated surface temperatures from the crater indicative of continued growth of the lava dome. The Volcano Alert Level remained at Watch and the Aviation Color Code remained at Orange. No current seismic information was available because Cleveland does not have a real-time seismic network.
Source: US Geological Survey Alaska Volcano Observatory (AVO)
AVO reported that during 5-6 and 9-11 October cloud cover over Cleveland prevented views of the lava dome in the summit crater. Partly cloudy satellite views during 7-8 October showed elevated surface temperatures at the summit. The Volcano Alert Level remained at Watch and the Aviation Color Code remained at Orange. No current seismic information was available because Cleveland does not have a real-time seismic network.
Source: US Geological Survey Alaska Volcano Observatory (AVO)
AVO reported that during 27-28 September and 30 September-1 October thermal anomalies over Cleveland's summit lava dome were detected in satellite images and suggested that the lava dome continued to slowly grow. Clouds obscured views on 29 September and during 2-3 October. Elevated surface temperatures were detected by satellite in partly cloudy images acquired during 3-4 October. The Volcano Alert Level remained at Watch and the Aviation Color Code remained at Orange. No current seismic information was available because Cleveland does not have a real-time seismic network.
Source: US Geological Survey Alaska Volcano Observatory (AVO)
AVO reported that during 20-21 September no observations of elevated surface temperatures or ash emissions from Cleveland were visible in partly cloudy satellite images. Clouds obscured views on 22 September. Elevated surface temperatures were observed in satellite images during 23-24 September, suggesting that the lava dome eruption was continuing. On 25 September AVO noted that elevated surface temperatures were not observed in several clear views of the volcano by satellite during the previous 24-hour period. Cloud cover prevented observations on 26 September.
Source: US Geological Survey Alaska Volcano Observatory (AVO)
AVO reported that during 13-17 September no lava-dome activity in Cleveland's summit crater was observed in partly cloudy satellite images. During 17-18 September a thermal anomaly was detected in satellite images. A report on 20 September noted that recent observations revealed the lava dome had grown to about 165 m in diameter, remained contained within the crater, and was 20 m below the E crater rim.
Source: US Geological Survey Alaska Volcano Observatory (AVO)
AVO reported that although cloud cover often prevented observations of Cleveland during 7-12 September, a thermal anomaly on the lava dome was visible during 8-9 and 12 September. A possible anomaly was visible on 10 September. The anomalies suggested that lava-dome growth was continuing, although no activity was observed in partly cloudy satellite images during 12-13 September. The Volcano Alert Level remained at Watch and the Aviation Color Code remained at Orange. No current seismic information was available because Cleveland does not have a real-time seismic network.
Source: US Geological Survey Alaska Volcano Observatory (AVO)
On 30 August, AVO reported that satellite observations during the previous two weeks indicated that lava-dome growth at Cleveland had paused. AVO lowered the Volcano Alert Level to Advisory and the Aviation Color Code to Yellow. During 31 August-2 September cloud cover prevented views of the summit crater, but a thermal anomaly at the summit was observed during 3-5 September. Observations on 6 September indicated that the lava dome had resumed growth, reaching 120 m in diameter and filling the floor of the crater. AVO raised the Volcano Alert Level to Watch and the Aviation Color Code to Orange. No current seismic information was available because Cleveland does not have a real-time seismic network.
Source: US Geological Survey Alaska Volcano Observatory (AVO)
AVO reported that during 17-23 August cloud cover over Cleveland prevented observations of the summit crater. On 21 August AVO noted that a weak, 1-pixel thermal anomaly was observed in a recent satellite view during a cloud break. The Volcano Alert Level remained at Watch and the Aviation Color Code remained at Orange. No current seismic information was available because Cleveland does not have a real-time seismic network.
Source: US Geological Survey Alaska Volcano Observatory (AVO)
On 9 August AVO reported that possible thermal anomalies on Cleveland were detected in satellite imagery. Cloud cover prevented observations of the summit area during 10-12 and 15-16 August, but several thermal anomalies were visible during 13-14 August. A scientist that flew 32 km N of the volcano on 14 August observed small white "puffs" of steam rising 30-60 m above the summit, even though most of the volcano was obscured by clouds. The Volcano Alert Level remained at Watch and the Aviation Color Code remained at Orange. No current seismic information was available because Cleveland does not have a real-time seismic network.
Source: US Geological Survey Alaska Volcano Observatory (AVO)
AVO reported that observations from 2 August of the lava dome growing in Cleveland's summit crater revealed growth from about 40 m to 50 m in diameter since 29 July. Weak thermal anomalies were observed in satellite imagery during 2-3, 5, and 7-9 August when cloud cover was limited or absent. The Volcano Alert Level remained at Watch and the Aviation Color Code remained at Orange. No current seismic information was available because Cleveland does not have a real-time seismic network.
Source: US Geological Survey Alaska Volcano Observatory (AVO)
AVO reported that on 2 August the Volcano Alert Level for Cleveland was raised to Watch and the Aviation Color Code was raised to Orange due to the formation of a 40-m-wide lava dome in the summit crater that was observed on 29 July. The lava dome was extruded sometime after 7 July following the last clear view of the summit area, however thermal anomalies observed since 19 July suggested that the dome had extruded since that time.
Source: US Geological Survey Alaska Volcano Observatory (AVO)
AVO reported that on 20 July the Volcano Alert Level for Cleveland was raised to Advisory, and the Aviation Color Code was raised to Yellow, due to thermal anomalies visible in satellite imagery during 19-20 and 22 July. Cloud cover prevented observations during 21 and 23-26 July. No current seismic information was available because Cleveland does not have a real-time seismic network.
Source: US Geological Survey Alaska Volcano Observatory (AVO)
On 31 March, AVO lowered the Volcano Alert Level and the Aviation Color Code for Cleveland to Unassigned noting that no eruptive activity had been confirmed during the previous few months. Neither significant thermal anomalies nor ash deposits on snow were observed in recent satellite imagery.
Source: US Geological Survey Alaska Volcano Observatory (AVO)
AVO reported that during 25-26 September a weak thermal anomaly from Cleveland was detected in satellite imagery. Cloud cover prevented views of the volcano during 22-24 and 27-28 September. The Volcano Alert Level remained at Advisory and the Aviation Color Code remained at Yellow. No current seismic information was available because Cleveland does not have a real-time seismic network.
Source: US Geological Survey Alaska Volcano Observatory (AVO)
AVO reported that on 15 September a thermal anomaly from Cleveland was detected in satellite imagery. Cloud cover prevented views of the volcano during 16-21 September. The Volcano Alert Level remained at Advisory and the Aviation Color Code remained at Yellow. No current seismic information was available because Cleveland does not have a real-time seismic network.
Source: US Geological Survey Alaska Volcano Observatory (AVO)
AVO reported that during 7-8 September clear-weather satellite views of Cleveland showed no thermal anomalies or recent deposits on the flanks. The Volcano Alert Level and the Aviation Color Code were lowered to Unassigned. On 11 September, a thermal anomaly was observed in satellite imagery. The next day a possible ash plume seen in satellite imagery rose to the estimated altitude of 7.6 km (25,000 ft) a.s.l. and drifted E. The Volcano Alert Level and the Aviation Color Code were again raised to Advisory and Yellow, respectively. A thermal anomaly was again visible during 13-14 September.
Source: US Geological Survey Alaska Volcano Observatory (AVO)
AVO reported that during 31 August-1 September thermal anomalies from Cleveland were detected in satellite imagery. The Volcano Alert Level remained at Advisory and the Aviation Color Code remained at Yellow. No current seismic information was available because Cleveland does not have a real-time seismic network.
Source: US Geological Survey Alaska Volcano Observatory (AVO)
AVO reported that on 26 August the Volcano Alert Level for Cleveland was raised to Advisory, and the Aviation Color Code was raised to Yellow, due to a persistent thermal anomaly near the summit visible in satellite imagery on most days during 16-24 August. Cloudy weather conditions prevented views of the summit during 25-29 August. A thermal anomaly was again seen in satellite imagery at night during 29-30 August. No current seismic information was available because Cleveland does not have a real-time seismic network.
Source: US Geological Survey Alaska Volcano Observatory (AVO)
AVO reported that on 11 June the Volcano Alert Level and the Aviation Color Code for Cleveland was lowered to Unassigned; no activity or unrest was detected during 4-11 June.
Source: US Geological Survey Alaska Volcano Observatory (AVO)
AVO reported that a weak thermal anomaly from Cleveland was detected in satellite imagery on 2 June. Cloud cover mostly prevented observations during 3-8 June. The Volcano Alert Level remained at Advisory and the Aviation Color Code remained at Yellow.
Source: US Geological Survey Alaska Volcano Observatory (AVO)
AVO reported a small ash emission from Cleveland on 30 May. A detached plume seen in satellite imagery rose no higher than 4.9 km (16,000 ft) a.s.l. and drifted SW. Satellite images the next day revealed minor (uncharacterized) flow deposits on the upper flanks. The Volcano Alert Level remained at Advisory and the Aviation Color Code remained at Yellow.
Source: US Geological Survey Alaska Volcano Observatory (AVO)
On 25 May, AVO raised the Volcano Alert Level for Cleveland to Advisory and the Aviation Color Code to Yellow because thermal anomalies from the crater were seen in satellite imagery during the previous few days.
Source: US Geological Survey Alaska Volcano Observatory (AVO)
On 18 December, AVO reported that a diffuse ash plume emitted from Cleveland on 12 December was retrospectively detected in satellite imagery. No other activity was noted.
Source: US Geological Survey Alaska Volcano Observatory (AVO)
On 19 October, AVO reported that no eruptive activity from Cleveland had been observed since the brief eruption on 2 October. The Aviation Color Code and the Volcano Alert Level were lowered to Unassigned. Cleveland is not monitored by a real-time seismic network, thus the levels "Green" or "Normal" do not apply because background activity is not defined.
Source: US Geological Survey Alaska Volcano Observatory (AVO)
A small explosive eruption of Cleveland on 2 October prompted AVO to raise the Volcano Alert Level to Watch and the Aviation Color Code to Orange. A detached ash cloud at estimated altitudes of 4.6-6.1 km (15,000-20,000 ft) a.s.l. was seen on satellite imagery; the cloud drifted about 600 km NE and dispersed over the Bering Sea. No further activity was reported. On 5 October, the Volcano Alert Level was lowered to Advisory and the Aviation Color Code was lowered to Yellow. No seismic information was available because Cleveland does not have a real-time seismic network.
Source: US Geological Survey Alaska Volcano Observatory (AVO)
A small explosive eruption of Cleveland on 25 June prompted AVO to raise the Volcano Alert Level to Watch and the Aviation Color Code to Orange. An ash cloud that detached from the volcano was seen on satellite imagery moving S at an estimated altitude of 4.6 km (15,000 ft) a.s.l. No further activity was reported. On 27 June, AVO lowered the Volcano Alert Level to Advisory and the Aviation Color Code to Yellow.
Source: US Geological Survey Alaska Volcano Observatory (AVO)
On 1 May, AVO decreased the Aviation Color Code and the Volcano Alert Level for Cleveland to "Unassigned" because no volcanic activity had been detected since late January. Cleveland is not monitored by a real-time seismic network, thus the levels "Green" or "Normal" do not apply because background activity is not defined.
Source: US Geological Survey Alaska Volcano Observatory (AVO)
AVO reported that cloud cover prevented satellite observations of Cleveland during 31 December, and 1, 3, and 5 January. The brief explosive emission of ash was detected on 2 January. A resultant ash plume rose to an altitude of 6 km (20,000 ft) a.s.l. and drifted about 240 km ESE. A thermal anomaly over the summit was detected on 4 January. No current seismic information was available because Cleveland does not have a real-time seismic network. The Volcanic Alert Level remained at Advisory and the Aviation Color Code remained at Yellow.
Source: US Geological Survey Alaska Volcano Observatory (AVO)
AVO reported that on 24 December the Volcano Alert Level for Cleveland was raised to Advisory, and the Aviation Color Code was raised to Yellow, due to a persistent thermal anomaly near the summit visible on satellite imagery acquired the day before. The previous Alert Levels were listed as Unassigned. Cloud cover prevented observations during 25-27 December. The thermal anomaly was again detected on 28 December, but was absent the next two days. No current seismic information was available because Cleveland does not have a real-time seismic network.
Source: US Geological Survey Alaska Volcano Observatory (AVO)
AVO reported that cloud cover prevented satellite observations of Cleveland during 20-26 August, although a possible thermal anomaly was present on 24 August. On 25 August the Volcano Alert Level was lowered to Advisory and the Aviation Color Code to Yellow.
Source: US Geological Survey Alaska Volcano Observatory (AVO)
AVO reported that cloud cover prevented satellite observations of Cleveland during 13-18 August. The Volcano Alert Level remained at Watch and the Aviation Color Code at Orange.
Source: US Geological Survey Alaska Volcano Observatory (AVO)
On 6 August, AVO reported that the thermal anomalies noted at Cleveland's summit and on the W, S, and SE flanks had decreased in intensity since first noted on 21 July, indicating that the lava flows slowed or stopped. The Volcanic Alert Level was lowered to Advisory and the Aviation Color Code to Yellow. During 7-10 August, a weak thermal anomaly at the summit was intermittently visible when not obscured by clouds and drifting ash from the eruption of Kasatochi (about 400 km WSW). On 11 August, thermal anomalies on satellite imagery indicated that lava flowed down the flanks. The Volcano Alert Level was raised to Watch and the Aviation Color Code to Orange. On 12 August, an ash plume rose to an altitude of 7.6 km (25,000 ft) a.s.l. and drifted 100 km SW.
Source: US Geological Survey Alaska Volcano Observatory (AVO)
AVO reported that thermal anomalies at Cleveland's summit, detected on satellite imagery during 30 July-5 August, suggested the presence of an active lava flow. A diffuse plume drifted less than 20 km NE, N, and NW at an altitude of 6.1 km (20,000 ft) a.s.l. on 31 July. On 5 August, thermal anomalies on the W, S, and SE flanks possibly indicated the presence of pyroclastic flows or hot lahars. The Volcanic Alert Level remained at Watch and the Aviation Color Code remained at Orange.
Source: US Geological Survey Alaska Volcano Observatory (AVO)
AVO reported that satellite views of Cleveland were hindered on 23 July due to cloud cover. On 24 July, a low-level ash plume and a strong thermal anomaly were noted near the summit. The thermal anomaly suggested the presence of an active lava flow. The thermal anomaly continued to be detected during 26-28 July and possible ash plumes drifted SE, E, and NE at altitudes of 3-6.1 km (10,000-20,000 ft) a.s.l. during 27-29 July.
Source: US Geological Survey Alaska Volcano Observatory (AVO)
On 21 July, AVO raised the Volcano Alert Level for Cleveland to Watch and the Aviation Color Code to Orange based on reports from pilots and observers on fishing boats. Reports from fishing boats indicated that an eruption started at about 1200 and ash near sea level may have drifted NW. Pilots reported that an ash-and-steam plume rose to altitudes of 4.6-5.2 km (15,000-17,000 ft) a.s.l. and drifted SE. Observations of satellite imagery on 22 July revealed a steam plume possibly containing some ash drifting more than 50 km ESE at altitudes of 3-6.1 km (10,000-20,000 ft) a.s.l. A strong thermal anomaly interpreted as a possible lava flow was also present in the imagery.
Source: US Geological Survey Alaska Volcano Observatory (AVO)
On 9 May, AVO reported that an increasing number of thermal anomalies at Cleveland were visible on satellite imagery during the previous two weeks. A small ash plume rose to an altitude of below 4.6 km (15,000 ft) a.s.l. on 7 May. A ship N of Nikolski (75 km ENE) reported a dusting of ash around the same time. The Volcanic Alert Level remained at Advisory and the Aviation Color Code remained at Yellow.
Source: US Geological Survey Alaska Volcano Observatory (AVO)
AVO reported that a weak thermal anomaly and an ash plume from Cleveland were visible on satellite imagery on 29 February. The ash plume rose to an altitude of below 3 km (10,000 ft) a.s.l. The Volcanic Alert Level remained at Advisory and the Aviation Color Code remained at Yellow.
Source: US Geological Survey Alaska Volcano Observatory (AVO)
AVO reported that a low-level ash plume from Cleveland was visible on satellite imagery and drifted about 300 km SE on 22 February. The Volcanic Alert Level remained at Advisory and the Aviation Color Code remained at Yellow.
Source: US Geological Survey Alaska Volcano Observatory (AVO)
AVO reported that a minor explosion from Cleveland on 15 February produced a small, diffuse ash plume that rose to an altitude of below 3 km (10,000 ft) a.s.l. and drifted NW. The Volcanic Alert Level remained at Advisory and the Aviation Color Code remained at Yellow.
Source: US Geological Survey Alaska Volcano Observatory (AVO)
AVO reported that diffuse ash plume from Cleveland was observed on satellite imagery drifting 12 km SE at an altitude below 1.5 km (5,000 ft) a.s.l. during a break in cloud cover on 8 February. Later that day AVO received pilot reports of an ash plume that rose to an altitude of 6.1 km (20,000 ft) a.s.l. and observed the plume on satellite imagery drifting NW. Due to the increased activity, the Volcanic Alert Level was raised to Watch and the Aviation Color Code was raised to Orange. No precursory or current seismic information is available because Cleveland does not have a real-time seismic network. During 10-11 February, a thermal anomaly was possibly visible on satellite imagery. The Volcanic Alert Level was lowered back to Advisory and the Aviation Color Code was lowered to Yellow on 12 February.
Source: US Geological Survey Alaska Volcano Observatory (AVO)
AVO lowered the Volcanic Alert Level for Cleveland from Watch to Advisory and the Aviation Color Code from Orange to Yellow on 6 September. AVO noted that since late July, ash and gas plumes were absent in satellite imagery and no reports of activity were received. Clouds obscured satellite and web camera views during 5-11 September.
Source: US Geological Survey Alaska Volcano Observatory (AVO)
Clouds obscured satellite and web camera views of Cleveland volcano during 29 August-4 September. A clear view of the crater on 30 August and 1 September revealed thermal anomalies at the summit. No current seismic information is available because Cleveland does not have a real-time seismic network. The Aviation Color Code remained at Orange and the Volcano Alert Level remained at Watch.
Source: US Geological Survey Alaska Volcano Observatory (AVO)
Clouds obscured satellite and web camera views of Cleveland volcano during 22-28 August. A clear view of the crater on 23 and 28 August revealed thermal anomalies at the summit. The Aviation Color Code remained at Orange and the Volcano Alert Level remained at Watch.
Source: US Geological Survey Alaska Volcano Observatory (AVO)
Clouds obscured satellite and web camera views of Cleveland volcano during 15-20 August. A clear view of the crater on 20 August revealed a thermal anomaly at the summit. The Aviation Color Code remained at Orange and the Volcano Alert Level remained at Watch.
Source: US Geological Survey Alaska Volcano Observatory (AVO)
Clouds obscured satellite and web camera views of Cleveland volcano during 8-13 August. A few clear views of the crater during 13-14 August revealed multiple thermal anomalies. The Aviation Color Code remained at Orange and the Volcano Alert Level remained at Watch.
Source: US Geological Survey Alaska Volcano Observatory (AVO)
A thermal anomaly in the crater of Cleveland was intermittently visible on satellite imagery during 2-6 August, though bad weather often limited observations. Photographs from 27 July and a pilot report from 2 August indicated fresh volcanic ejecta on the slopes and summit. The E portion of Chuginadak Island was dusted with ash on 3 August. The Aviation Color Code remained at Orange and the Volcano Alert Level remained at Watch.
Source: US Geological Survey Alaska Volcano Observatory (AVO)
A thermal anomaly in the crater of Cleveland was visible on satellite imagery during 25-26 July. The Volcanic Alert Level remained at Watch and the Aviation Color Code remained at Orange through at least 30 July. On the 27th AVO noted that low-level eruptive activity continued. Three small SO2 clouds produced by small explosions on 20 July were detected in OMI satellite data provided by the University of Maryland Baltimore County. No further explosive activity had been detected by the OMI sensor since that time. AVO is unable to track local earthquake activity related to volcanic unrest.
Sources: US Geological Survey Alaska Volcano Observatory (AVO); OMI Sulfur Dioxide Group
AVO raised the Volcanic Alert Level for Cleveland from Advisory to Watch and the Aviation Color Code from Yellow to Orange on 20 July. The change in Alert Level was based on the presence of an intense thermal anomaly in the crater and associated steam-and-gas plume observed on satellite imagery. The thermal anomaly continued to be detected on satellite imagery during 22-23 July.
Source: US Geological Survey Alaska Volcano Observatory (AVO)
AVO raised the Alert Level for Cleveland from Advisory to Watch on 28 October based on pilot reports of an ash plume. Satellite imagery confirmed the presence of a plume drifting ENE at an altitude estimated at 6.1 km (20,000 ft) a.s.l. A pilot reported that the altitude of the plume was in excess of 9.1 km (30,000 ft) a.s.l. On 30 October, the Alert Level was lowered back to Advisory because of no further evidence of activity.
Source: US Geological Survey Alaska Volcano Observatory (AVO)
On 7 September, AVO raised the level of Concern Color Code for Cleveland from unassigned to Yellow after a short-lived explosion on 24 August was verified by video footage. The resultant ash plume reached an altitude of about 3 km (~10,000 ft) a.s.l. and produced ash fall. An hour later, only minor steaming from the summit was noted. A weak thermal anomaly in the summit crater was present in subsequent satellite images.
Source: US Geological Survey Alaska Volcano Observatory (AVO)
The ash plume from Cleveland observed from the International Space Station on 23 May, drifted SW and had mostly dissipated by 24 May. No further activity was recorded. On 26 May AVO downgraded the Concern Color Code from Yellow to "Not Assigned".
Sources: US Geological Survey Alaska Volcano Observatory (AVO); Washington Volcanic Ash Advisory Center (VAAC)
On 23 May, AVO reported that an astronaut aboard the International Space Station observed an ash plume from Cleveland at 1500. A plume was visible on satellite imagery at 1507 that drifted SW and reached a height of 6.1 km (20,000 ft) a.s.l. At 1700, an image showed the detached ash plume 130 km SW of Cleveland. The Concern Color Code was raised to Yellow. No precursory or current seismic information is available because Cleveland does not have a real-time seismic network.
Source: US Geological Survey Alaska Volcano Observatory (AVO)
On the morning of 2 May beginning at 0101, a thermal anomaly and continuous plume from Cleveland were seen on satellite imagery. The plume extended ~50 km SW of the volcano and was visible on satellite imagery for about 6 hours. Satellite data suggested a maximum cloud height of ~1 km (3,500 ft) a.s.l. There was no indication of ash in the observed cloud. No further activity was detected at Cleveland after 2 May. Cleveland was not assigned a Concern Color Code because there is no real-time seismic network at the volcano to monitor seismic changes.
Source: US Geological Survey Alaska Volcano Observatory (AVO)
AVO decreased the Concern Color Code at Cleveland from Orange to Yellow on 11 February. They received no information about further eruptive activity or ash emissions after 6 February, and no ash clouds were detected on satellite imagery. Clouds obscured the volcano during 6-11 February, therefore, AVO could not verify that eruptive activity ended and it is possible that the volcano remains in a state of low-level unrest.
Sources: US Geological Survey Alaska Volcano Observatory (AVO); Anchorage Volcanic Ash Advisory Center (VAAC)
An ash cloud emitted from Cleveland was detected on satellite imagery beginning at 0757 on 6 February, leading AVO to increase the Concern Color Code to Red from an unassigned code (Cleveland does not normally have a Concern Color Code because it is not seismically monitored, therefore no definitive information about background activity is available). An image at 0900 on the same day showed a small ash cloud ~130 km ESE of the volcano. Initial data suggested that the cloud was at a height of ~6.7 km (22,000 ft) a.s.l. The ash cloud detached from the volcano and there was no indication of continuous ash emission. Ash had largely dissipated on satellite imagery by 1341. AVO received no information about additional ash emissions, so they decreased the Concern Color Code to Orange around 1655 on 6 February.
Sources: US Geological Survey Alaska Volcano Observatory (AVO); Washington Volcanic Ash Advisory Center (VAAC); Anchorage Volcanic Ash Advisory Center (VAAC)
Activity at Cleveland further decreased during 18-25 November. Following a brief ash burst on 7 October, no further ash emissions were noted. AVO did not detect a temperature anomaly in the vicinity of the volcano after 6 November. Based on this information, AVO concluded that the likelihood of significant ash-producing events decreased, so they terminated Concern Color Code Yellow. Cleveland is not monitored with seismic equipment, therefore AVO did not assign Color Concern Code Green.
Source: US Geological Survey Alaska Volcano Observatory (AVO)
After a brief ash burst at Cleveland on 7 October, no further eruptive activity was recorded at the volcano. On 10 October, AVO reduced the Concern Color Code from Orange to Yellow. AVO warned that although there were no additional ash bursts noted, they consider the volcano restless. Explosive ash-producing events could occur at any time and without warning (owing to the lack of local seismic monitoring). AVO continued to monitor the volcano using satellite imagery.
Source: US Geological Survey Alaska Volcano Observatory (AVO)
AVO staff recorded a small ash cloud emitted from Cleveland on satellite imagery on the morning of 7 October. Based on satellite data, a small eruption occurred at Cleveland sometime before 0300. The ash cloud was located E of the volcano and ~150 km ESE of Dutch Harbor at 0900. AVO, in consultation with the National Weather Service, estimated that the top of the ash cloud reached no more than 4.6 km (15,000 ft) a.s.l. The ash cloud dissipated and was not detected on satellite imagery after 1000. The Concern Color Code at Cleveland was Orange on 7 October. During 7-10 October, there were no new observations of eruptive activity at Cleveland on satellite imagery, by pilots, or ground-based observers, so the Concern Color Code was reduced to Yellow.
Source: US Geological Survey Alaska Volcano Observatory (AVO)
A thermal feature at Cleveland was detected on several satellite images obtained on 31 August, but there was no evidence of eruptive activity at the volcano. Cleveland is not seismically monitored, so AVO did not assign it a Concern Color Code.
Source: US Geological Survey Alaska Volcano Observatory (AVO)
AVO reduced the Concern Color Code at Cleveland from Yellow to "Not Assigned" on 27 August because there had been no evidence of activity at the volcano since a thermal feature was observed on satellite imagery on 11 August. Cleveland does not have a real-time seismic network; volcanoes without seismic networks are not assigned a color code of Green because without the seismic data, AVO has no definitive information that the level of activity of the volcano is at background.
Source: US Geological Survey Alaska Volcano Observatory (AVO)
Satellite imagery of Cleveland volcano on 4 August showed a thermal anomaly, indicating that activity continued. Cleveland remained at Concern Color Code Yellow.
Source: US Geological Survey Alaska Volcano Observatory (AVO)
Satellite imagery of Cleveland during 22-29 July showed minor steaming from the volcano's summit, possible fresh localized ash deposits, and a weak thermal anomaly. According to AVO, these observations suggested that low-level volcanic unrest continued. Cleveland remained at Concern Color Code Yellow.
Source: US Geological Survey Alaska Volcano Observatory (AVO)
Satellite imagery taken on 18 July showed steam emanating from Cleveland's summit and evidence of minor ash emissions. Satellite imagery from the rest of 15-22 July was obscured by meteorological clouds. Cleveland remained at Concern Color Code Yellow.
Source: US Geological Survey Alaska Volcano Observatory (AVO)
Satellite imagery of Cleveland taken during 1-8 July revealed increased activity at the volcano, so AVO assigned a Concern Color Code of Yellow on 7 July. The images showed increased heat flow, thin ash deposits, and possible debris flows extending ~1 km down the volcano's flanks from the summit crater. AVO reported that based on historical eruptions at Cleveland, it is possible that explosive, ash-producing events could occur at any time without warning (due to a lack of seismic monitoring).
Source: US Geological Survey Alaska Volcano Observatory (AVO)
Satellite imagery of Cleveland taken during 24 June to 1 July showed increased heat flow from the volcano and a possible debris flow. AVO stated that although observations were inhibited by cloudy weather, they indicated the possibility of increased volcanic activity. AVO did not assign a Concern Color Code to Cleveland due to the lack of seismic monitoring at the volcano and limited satellite observations. The last eruption at Cleveland began in February 2001 when three explosive events produced ash clouds as high as 12 km (39,400 ft) a.s.l.
Source: US Geological Survey Alaska Volcano Observatory (AVO)
Neither eruptive activity nor thermal anomalies have been observed at Cleveland during the previous 6 weeks.
Source: US Geological Survey Alaska Volcano Observatory (AVO)
Cleveland was observed on satellite images numerous times during the week and no thermal anomalies were detected. AVO had received no reports of significant volcanic activity from pilots, residents, or satellite remote-sensors since the last eruption on 19 March.
Source: US Geological Survey Alaska Volcano Observatory (AVO)
Cleveland was obscured by clouds during most of the week and no thermal anomalies were observed. AVO had received no reports of significant volcanic activity from pilots, residents, or satellite remote-sensors since the last eruption on 19 March.
Source: US Geological Survey Alaska Volcano Observatory (AVO)
Volcanic unrest continued at Cleveland through 4 May. The volcano was obscured by clouds during the report period and no thermal anomalies were observed. Pulses of volcanic tremor continued to be detected by an AVO seismic network 230 km to the E of the volcano. AVO personnel installed a temporary seismic-recording instrument at Nikolski, ~70 km to the E of the volcano, in an attempt to verify that the source of the tremor is Cleveland. AVO had received no reports of significant volcanic activity from either pilots, residents, or satellite remote-sensors since the last eruption on 19 March.
Source: US Geological Survey Alaska Volcano Observatory (AVO)
Volcanic unrest continued at Cleveland through 27 April. During this time a thermal anomaly was observed on satellite imagery when weather permitted. Low pulses of volcanic tremor continued to be detected by an AVO seismic network 230 km to the E of the volcano. AVO had received no reports of significant volcanic activity from either pilots, residents, or satellite remote-sensors since the last eruption on 19 March.
Source: US Geological Survey Alaska Volcano Observatory (AVO)
Volcanic unrest continued at Cleveland through 20 April. A thermal anomaly was persistently detected in satellite imagery on days when the weather was clear to partly cloudy. Low-level pulses of volcanic tremor were detected several times during the week by an AVO seismic network 230 km to the E of the volcano. AVO received no reports of significant volcanic activity from either pilots, residents, or satellite remote sensors.
Source: US Geological Survey Alaska Volcano Observatory (AVO)
Volcanic unrest continued at Cleveland through 13 April. A thermal anomaly was last detected on satellite imagery on 8 April, but cloudy conditions in the area may have hidden the anomaly from the satellite's view during the rest of the week. Low-level pulses of volcanic tremor were detected several times during the week by an AVO seismic network 230 km to the E of the volcano. AVO received no reports of significant volcanic activity from either pilots, residents, or satellite remote sensors.
Source: US Geological Survey Alaska Volcano Observatory (AVO)
The AVO reported that unrest continued at Cleveland. This was based on data from a seismic network 230 km E of the volcano that intermittently recorded low-level volcanic tremor over the last several weeks. Since the 19 March eruption there have been no reports of significant activity from either pilots, residents, or satellite remote sensors. The thermal anomaly previously observed in the vicinity of the volcano has been absent since 23 March. Based on current data and the volcano's historical activity, the AVO warned that additional ash-producing eruptions are possible at any time.
Source: US Geological Survey Alaska Volcano Observatory (AVO)
The AVO reported that after 24 March, satellite imagery has not shown the thermal anomaly that had been visible since the 19 March eruption of Cleveland. No further explosive activity has been reported. Occasional avalanching of material from the steep flanks of Cleveland may produce small, localized plumes.
Source: US Geological Survey Alaska Volcano Observatory (AVO)
On 20 March AVO could no longer detect the ash cloud resulting from the 19 March eruption of Cleveland. Based on satellite data, AVO estimates that the explosive eruption started at 1430 on 19 March and may have lasted as long as 6 hours. The National Weather Service estimated the top of the ash cloud was as high as 9.1 km a.s.l. No ashfall was reported in Nikolski, 75 km E of the volcano. A thermal anomaly detected in satellite imagery following the explosive activity was still visible as of 23 March. The elevated temperature indicated by the anomaly is most likely the result of continued unrest at the volcano and the cooling of recently erupted material.
Sources: US Geological Survey Alaska Volcano Observatory (AVO); Washington Volcanic Ash Advisory Center (VAAC)
The AVO reported that at 1430 on 19 March an explosive eruption at Cleveland was detected on satellite imagery. The National Weather Service estimated the top of the cloud to be at ~ 9 km a.s.l. An observer in the town of Nikolski reported that at about 1900 a strong haze resulting from the eruption extended SE from the volcano, but there was no ashfall. The Washington VAAC concluded that the ash cloud had dissipated by 0230 on 20 March because it was no longer visible on satellite imagery.
Sources: US Geological Survey Alaska Volcano Observatory (AVO); Washington Volcanic Ash Advisory Center (VAAC)
The AVO reported that an explosive eruption at Cleveland began at 0500 on 11 March. The resultant ash cloud was visible on satellite imagery from the onset of the eruption and after it ended 3 hours later. Wind-data analysis suggested that the ash cloud reached a height of 6-7.6 km a.s.l. By 1400 the main part of the ash cloud was detached from the volcano and drifting to the E. Satellite imagery from 2030 showed that the ash cloud was located in two main regions; one region was centered ~80 km S of Dutch Harbor and was ~80 km in diameter, and the other was centered ~160 km SE of Dutch Harbor and extended ~160 km E to W and ~65 km N to S. Both areas of ash were visible on satellite imagery through 1315 on 12 March. In addition, a thermal anomaly on the volcano, which was first detected shortly after the eruption began, persisted. AVO interpreted the thermal anomaly to indicate that unrest was continuing at Cleveland and that further explosive activity could occur at anytime. By 0930 on 13 March the ash cloud was no longer visible on satellite imagery.
Sources: Tokyo Volcanic Ash Advisory Center (VAAC); US Geological Survey Alaska Volcano Observatory (AVO); Anchorage Volcanic Ash Advisory Center (VAAC)
The AVO reported that no further eruptive activity was observed or detected at Cleveland since the 19 February eruption. During 19 February to 2 March, GOES-10 imagery showed a weak thermal anomaly that was probably related to hot material deposited on the flanks of the volcano on the 19th. Photographs taken a few days after the eruption showed significant accumulation of spatter and lava blocks high on the steep flanks of the volcano; occasional avalanching of this debris may produce small, localized ash plumes.
Source: US Geological Survey Alaska Volcano Observatory (AVO)
The ash cloud produced from the 19 February eruption of Cleveland volcano was visible on GOES-10 imagery through 1700 on 21 February. The AVO reported that a thermal anomaly was detected on satellite imagery during 21-26 February. On 22 February a pilot reported that steam was observed rising from near the SE shoreline of the volcano where an apparently fresh deposit entered the sea. The deposit may have been an active lava flow fan or hot debris, and was probably the source of the satellite thermal anomaly. On 23 February an active lava flow or hot lahar was observed on the volcano's SW flank. Avalanches of hot, rubbly debris from this flow reached the sea and produced steam clouds at the shoreline.
Sources: US Geological Survey Alaska Volcano Observatory (AVO); Anchorage Volcanic Ash Advisory Center (VAAC)
The AVO reported that Cleveland volcano erupted explosively at 0600 on 19 February, producing an ash-and-steam cloud that was detected from the beginning of the eruption on GOES imagery and confirmed by pilot reports at 1310. Satellite imagery at 0945 showed that the cloud was in two sections; the lower section reached ~5.2 km a.s.l. and drifted SE of Cleveland, and the higher section reached 9.1-10.7 km a.s.l. and drifted to the N. By 1900 the cloud had extended at least 120 km to the N and drifted E towards Dutch Harbor, Akutan, and beyond. The National Weather Service via the Anchorage VAAC, and the Federal Aviation Administration, issued a volcanic ash advisory to divert aircraft away from the ash cloud. During 1200 to about 1600, light ash fell in the closest inhabited town to the volcano, Nikolski (~30 residents), 45 miles E of the volcano. The Anchorage VAAC reported that additional eruptions occurred through 1800. According to the AVO, explosive activity ended in the late afternoon and at 2130 a thermal anomaly was still visible on satellite imagery. Prior to the eruption the AVO had received pilot reports and photos of increased emissions on 2 February, but the reports could not be confirmed without ground-based monitoring instrumentation. The AVO warned that further eruptive activity could occur with little warning. Because Cleveland is not seismically monitored, the AVO did not assign a level of concern color code.
GOES images and animation of the 19 February ash cloud
Sources: Reuters; Anchorage Daily News; US Geological Survey Alaska Volcano Observatory (AVO); Anchorage Volcanic Ash Advisory Center (VAAC)
Reports are organized chronologically and indexed below by Month/Year (Publication Volume:Number), and include a one-line summary. Click on the index link or scroll down to read the reports.
Steam plume with little ash
"About midday on 10 December, pilot Tom Madsen (president, Aleutian Air) noted an anomalous 400+ m-high eruption column over Mt. Cleveland from the ground at Nikolski, Umnak Island (about 65 km ENE of the volcano). The top of the vertical column had drifted at least 0.5 km to the N. The white eruption cloud probably consisted principally of steam with only minor amounts of ash, if any. Based on observations by Madsen, Mt. Cleveland has been steaming fairly continuously since at least 1982, when he began flying regularly from Dutch Harbor (Unalaska Island) to Atka (Atka Island). Reeder has received several reports about steam-blast and phreatomagmatic eruptions at Mt. Cleveland over the last several years."
Information Contacts: J. Reeder, Alaska Div. of Geol. and Geophys. Surveys.
Steam plume with some ash
On 28 April, Thomas Madsen (president, Aleutian Air Ltd.) observed an eruption plume emerging from the summit of Mt. Cleveland. He first saw the grayish-white plume at about 1220, from 190 km to the E, estimating that it reached ~2,900 m altitude . . . and extended SW. The plume had definite dark streaks and swirls of ash. Passengers on a Peninsula Airways flight . . . at about 1900 reported that the eruptive activity had declined to minor steam emission.
Information Contacts: J. Reeder, ADGGS.
Incandescent tephra
The crew of the ship Blackhawk, (Hap Heyden, Ron Saylor, Dave Weyl and Capt. Emil Lindal) observed eruptive activity . . . on the morning of 27 May. At 0100, while some 30 km E . . . , one of the crew members could see glow at the top of the volcano and smelled sulfur fumes.
From 11 km ESE . . . at about 0235, Heyden observed a crater ~60 m in diameter on the upper ESE flank. The back inside wall of the crater was visible. Lava rose to 30 m above the rim, then fell back into the crater. Weyl saw an ~10-m-wide glowing zone that extended from the crater at least 100 m down the SE flank, probably a lava channel. Glow from the crater seemed to be pulsating substantially. As the Blackhawk headed SW, at about 0450, Saylor detected a fog-like cloud that irritated his eyes and throat. They did not emerge from the fume cloud until they were S of Herbert Island, ~25 km SSW of the volcano. No ash was detected on the boat.
T. Madsen and John Reeder flew within 40 km of Mt. Cleveland on 10 July at about 1845 and 2115, observing minor steaming from the SE summit. Black ash blanketed the upper 650 m of the volcano, while the lower slopes were still covered with white snow.
Information Contacts: J. Reeder, ADGGS.
Lava flow and ash emission from summit crater
On 19 June pilot T. Madsen (Aleutian Airways) observed minor bluish-brown ash rising to 2,000-2,500 m altitude and drifting SE for as much as 50 km. Later that day (about 1300) Madsen observed continued fine ash emissions. Fresh ash was seen on all flanks of the volcano but was concentrated on the ESE flank. Two or three large hot rocks fell from the summit onto the ESE flank during his observations.
Pilot Harold Wilson (Peninsula Airways) observed Mt. Cleveland several times between 22 and 29 June. At 1600 on 22 June a steam plume was rising ~300 m above the summit and fresh black ash covered most of the volcano; snow had fallen in the region in the last week. At noon the next day incandescent lava was visible in the cracks of a 30-m-diameter dome-like feature within the summit crater. A narrow lava flow extended down the ESE slope and ponded at the base of the volcano. Blocks were thrown to 30 m above the vent and steam rose ~450 m above the summit. Numerous photos were taken. The "dome" incandescence and steam emission remained visible through 26 June. On 27 June the volcano was obscured by steam and clouds. Wilson noted that the activity was the most intense he had ever seen at Mt. Cleveland since he began flying in the region in 1980.
Information Contacts: J. Reeder, ADGGS.
Incandescent fountains from summit vent
On 22 July, H. Wilson (Peninsula Airways) observed an active lava fountain at 1700 and again at close range at 2100 (during daylight). He photographed an incandescent fountain, 20-30 m high and ~2.5 m wide, emerging from the summit-crater vent that had been active in June. A lava flow from this vent reached the base of the volcano in June but Wilson did not recognize an active summit lava flow during his 22 July overflights. A mound that had formed at the head of the June lava flow appeared to have grown slightly. Some steam and very minor ash was being emitted from the vent.
Information Contacts: J. Reeder, ADGGS.
Possible source of 10.6-km cloud; lava flow
During at least five overflights between 6 and 10 August, H. Wilson (Peninsula Airways) observed incandescent lava and summit glow, but did not recognize any lava fountains or moving flows. High-pressure steam emission was occurring and steam drifted as far as 3 km from the summit. At about 1500 on 26 August, pilot T. Madsen (Aleutian Air) observed a 600-m-high ash and steam plume. Two days later, on 28 August at about 0930, Scott Kerr and Pete Galaktionoff heard a distant rumbling sound lasting ~15 seconds while camping on Kagamil Island (25 km NE of Mt. Cleveland, 120 km NE of Amukta). Overcast skies prevented observations. At 0944 that day the National Warning Center of the North American Air Defense Command (NORAD) issued a warning of a large eruption of Mt. Cleveland, after detecting a hot spot that morning at 52.78°N, 169.93°W through remote sensing. Steve Shivers (USGS Anchorage) recognized a WNW-trending plume on a NOAA 10 satellite image returned at 1030. The ~15-km plume was elongated WNW from a point ~15 km W of Mt. Cleveland. From more than 100 km away at about 1100, pilot Charles Nickerson (Reeve Aleutian Airways) reported that the plume, which appeared to be drifting WNW, reached 9-10.6 km altitude with about a 25 km upper radius, but the plume was by then apparently detached from its origin and the volcano that fed it is not certain. He estimated that the plume was just ENE of Amukta and W of Cleveland. Mt. Cleveland's summit appeared to be emitting a 300 m-high steam plume. At about 1200, Larry Conner (MarkAir) also observed the eruption plume from a point ~30 km S of Amukta, which was completely covered by clouds and not emitting a plume. At about 1400, pilot William Redmond (Peninsula Airways) observed unusual, thin, brown-tinted, cirrus layers beginning 65 km WNW of Mt. Cleveland at 2,400 m altitude and higher. The wind was blowing from the E.
Information Contacts: J. Reeder, ADGGS.
Single ash burst generates a plume to >10 km altitude
A vigorous steam plume was observed by pilots on 29 April and by AVO observers on 10 May. No ash was observed on 10 May either in the plume or on the flanks of the volcano. A single ash burst on 25 May generated a plume that rose to ~10.5 km altitude according to two pilot reports between 1700 and 1800 in the afternoon. The plume was described as dark gray and moderately dense by one pilot. Weather clouds obscured the view from satellites immediately following the eruption, but NWS satellite imagery later showed a small volcanic cloud drifting NE over the Bering Sea at ~5 km altitude. Apparently the activity consisted of a single burst without a sustained eruption; no additional eruptive activity was reported through mid-June.
Information Contacts: AVO; J. Lynch, SAB.
Ashfall from 21 May eruption observed on the NE flank
On 21 June, AVO observers noted a broad, black swath of material extending from within a few hundred meters of the summit well down the NE flank. A vigorous white steam plume was being driven by wind down the ESE flank. The debris was presumed to be ash from the small [25] May eruption. FWS personnel aboard the RV Tiglax had observed the black swath earlier in the week.
Information Contacts: AVO.
19 February explosion sends ash up to 10 km
At 0600 on 19 February workers at the Alaska Volcano Observatory (AVO) using satellite imagery detected an ash cloud emanating from Cleveland volcano. The eruption was apparently explosive (figure 1). According to images captured at 0945 the ash cloud had split and drifted in two directions; one traveled 120 km SE of the volcano and reached an altitude of over 5 km, while the other cloud drifted higher, traveled 100 km N, and rose to an altitude of over 9 km (figure 2). A volcanic ash advisory was first issued at 1040 on the same day indicating that ash was being carried E at a velocity of ~55 km/hour and had reached an altitude of over 10 km. Subsequent pilot reports and satellite data revealed a diminishing intensity of the ash issuing from Cleveland, although observers in Nikolski, 72 km to the E, reported ashfall initiating at 1200 and persisting through 1600. Explosive activity ended by late afternoon.
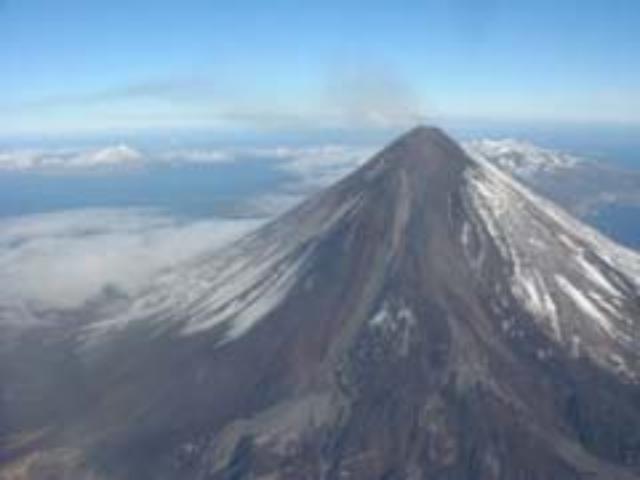 |
Figure 1. Cleveland on 21 February. The usually white, snow-covered flanks are shown darkened by ash from the eruption. Photo was taken by Burke Mees (PenAir pilot) and transmitted courtesy of AVO. |
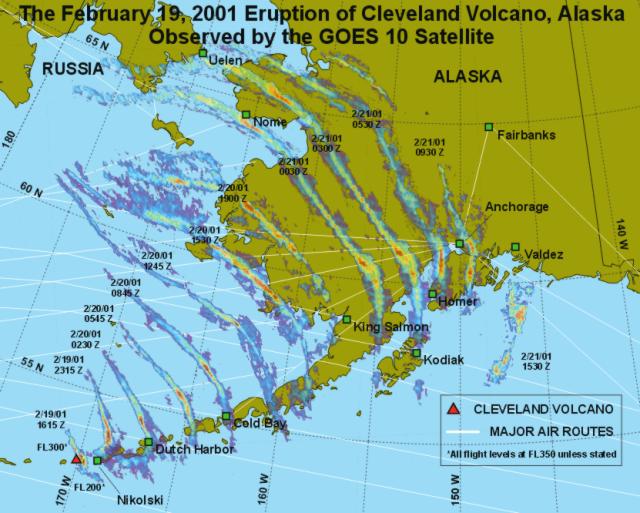 |
Figure 2. Composite of GOES images showing the progressive locations and evolution of the ash clouds erupted from Cleveland during 19-21 February. The initial image of the plume (far left) was taken at 0815 on 19 February approximately 2 hours after the eruption began (labeled "2/19/01, 1615 Z"). Over time the plume bifurcated, sent ash SE to an altitude of 6 km, and ash N and slightly W to an altitude of 9 km. Ash clouds rose to a maximum altitude of over 10 km (roughly "FL330," aviation shorthand for 33,000 feet) before dissipating. Times are listed in UTC (not local time). The image also highlights the importance of quickly relaying information from volcano observatories to airline dispatchers in order to keep pilots aware of potential ash along their routes. Only areas of detected ash are shown, and ash may be present elsewhere. Image noise has been removed for clarity. Courtesy of AVO. |
AVO workers observed a persistent large thermal anomaly at the volcano, which indicated that further eruptions could occur at any time. Pilots flying near the volcano late on 21 February confirmed no further ash production, but one did observe steaming near the termination of a flow on the volcano's SW flank. The steaming was located where rubbly, apparently hot debris entered the sea, and could have been an active lava flow or a fan of debris; it likely explains the thermal anomaly detected in satellite images. A thermal anomaly continued to be detected as of 26 February, suggesting that low-level activity was still occurring. No level of concern color codes were assigned for Cleveland because AVO has no seismic monitoring stations at the volcano.
Even after the eruption ceased, the eastward drifting ash-and-steam cloud continued to be a hazard to aviators (figure 2). The SE portion of the plume approached the westernmost point of Umnak Island by 1030 on the day of the eruption, and the entire plume was carried farther E so that it reached Dutch Harbor and Akutan by 1900.
Satellite imagery at 0730 on 20 February showed the ash cloud as a band extending from S of Port Heiden to N of Nunivak Island. No ashfall was reported at Dutch Harbor, Port Heiden, or Dillingham, however.
By 0530 on 21 February the cloud could be seen on satellite imagery stretching from near Montague Island S about 150 km over the northern portion of the Gulf of Alaska. The ash band dissipated and became undetectable in satellite images by about 1700 on 21 February. A smaller ash cloud may also have drifted over interior Alaska reaching N of Fairbanks, but it became indistinguishable from weather clouds by the same time.
Reference. Miller, T.P., McGimsey, R.G., Richter, D.H., Riehle, J.R., Nye, C.J., Yount, M.E. and Dumoulin, J.A., 1998, Catalog of the historically active volcanoes of Alaska: U.S. Geological Survey Open-File Report 98-582, Alaska Volcano Observatory, Alaska, 1998. 104 p.
Information Contacts: Alaska Volcano Observatory (AVO), a cooperative program of a) U.S. Geological Survey, 4200 University Drive, Anchorage, AK 99508-4667, USA (URL: http://www.avo.alaska.edu/), b) Geophysical Institute, University of Alaska, PO Box 757320, Fairbanks, AK 99775-7320, USA, and c) Alaska Division of Geological & Geophysical Surveys, 794 University Ave., Suite 200, Fairbanks, AK 99709, USA; Anchorage Volcanic Ash Advisory Center (VAAC), 6930 Sand Lake Road, Anchorage, AK 99502, USA (URL: http://vaac.arh.noaa.gov/).
Further eruptions and ash plumes during March 2001
As predicted in February 2001 (BGVN 26:01) by staff at the Alaska Volcano Observatory (AVO), Cleveland erupted again, sending up noteworthy plumes on both 11 and 19 March. The 11 March event produced an ash plume that reached a height of ~4.4-5.9 km above Cleveland's summit (figure 3). On 19 March, AVO detected an explosive eruption on satellite imagery that began at ~1430. According to images taken at 1830, the ash cloud was V-shaped with one portion extending 185 km to the E and the other extending ~200 km to the SE (figure 4). The National Weather Service estimated the top of the cloud to be at ~9.7 km altitude. At about 1900, an observer in Nikolski, ~70 km to the E of the volcano, reported an intense haze resulting from the ash that extended to the SE, but saw no local ashfall.
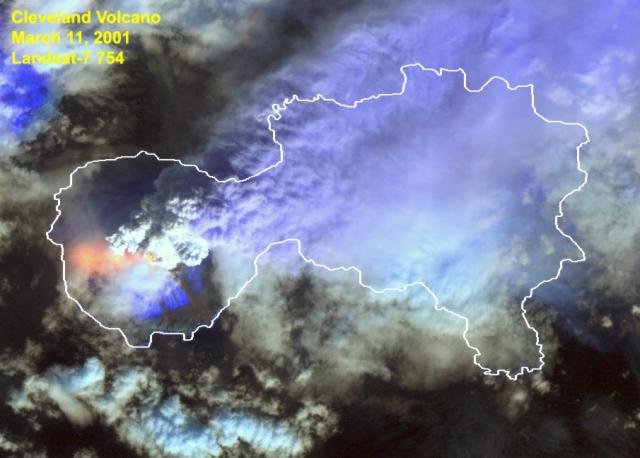 |
Figure 3. Color composite of LandSat images from the 11 March 2001 Cleveland eruption. The white outline shows the position of Chuginadak Island, hidden beneath the ash. Courtesy of Dave Schneider (AVO, USGS). |
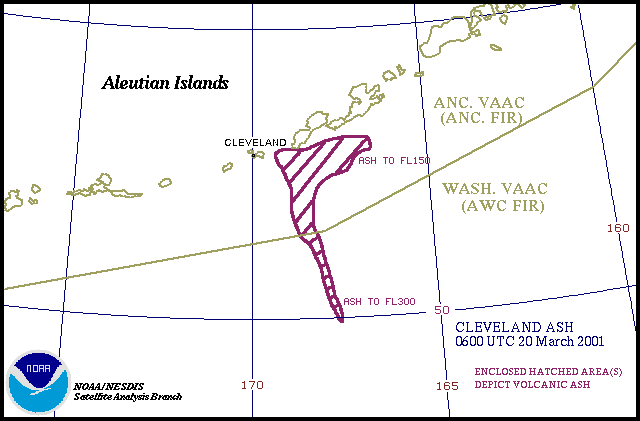 |
Figure 4. Sketch map illustrating ash area from Cleveland as of 2200 on 19 March 2001 (0600 on 20 March 2001 UTC). After an image by NOAA. |
The Washington Volcanic Ash Advisory Center (VAAC) issued advisories for both eruptions based on information from GOES-10 infrared and multi-spectral imagery (figure 4). No ash was detected in satellite imagery reported in the subsequent advisory issued at 0500 on 20 March; the ash from the eruption had dissipated.
Volcanic unrest continued at Cleveland through 4 May. Pulses of volcanic tremor continued to be detected by an AVO seismic network 230 km to the E of the volcano. AVO personnel installed a temporary seismic-recording instrument at Nikolski in an attempt to verify that the source of the tremor was Cleveland. AVO had received no reports of significant volcanic activity from either pilots, nearby residents, or satellite remote sensors since the last eruption on 19 March.
Information Contacts: Tom Miller and Dave Schneider, Alaska Volcano Observatory (AVO), a cooperative program of a) U.S. Geological Survey, 4200 University Drive, Anchorage, AK 99508-4667, USA (URL: http://www.avo.alaska.edu/), b) Geophysical Institute, University of Alaska, PO Box 757320, Fairbanks, AK 99775-7320, USA, and c) Alaska Division of Geological & Geophysical Surveys, 794 University Ave., Suite 200, Fairbanks, AK 99709, USA; Washington Volcanic Ash Advisory Center (VAAC), Washington, DC, USA (URL: http://www.ospo.noaa.gov/Products/atmosphere/vaac/).
Minor eruptions during June-October 2005 after 4 years of quiet
Mount Cleveland produced significant ash plumes during March 2001 (BGVN 26:04). Volcanic unrest continued through 4 May 2001, and signals consistent with volcanic seismicity were detected by an Alaska Volcano Observatory (AVO) seismic network 230 km E. By the end of May, neither eruptive activity nor thermal anomalies were observed. Until July 2005, no alert level was assigned, and AVO monitoring produced no reports on Cleveland.
Cleveland lacks a real-time seismic network. Accordingly, even during times of perceived quiet there is an absence of definitive information that activity level is at background. AVO's policy for volcanoes without seismic networks is to not get assigned a color code of Green.
Satellite imagery of Cleveland taken during 24 June to 1 July 2005 showed increased heat flow from the volcano and a possible debris flow. AVO stated that although observations were inhibited by cloudy weather, they indicated the possibility of increased volcanic activity. AVO did not assign a Concern Color Code to Cleveland due to the lack of seismic monitoring and limited satellite observations.
Satellite images during 1-8 July showed increased heat flow, thin ash deposits, and possible debris flows extending ~ 1 km down the flanks from the summit crater. AVO assigned a Concern Color Code of Yellow on 7 July. On 18 July satellite imagery showed steam emanating from Cleveland's summit and evidence of minor ash emissions. Meteorological clouds obscured Cleveland during the third week of July. During 22-29 July satellite images showed minor steaming from the summit, possible fresh localized ash deposits, and a weak thermal anomaly.
On 4 August satellite images showed a thermal anomaly. On 27 August AVO reduced the Concern Color Code at Cleveland from Yellow to "Not Assigned" because there had been no evidence of activity since a thermal feature was observed on satellite imagery from 11 August. A thermal feature was detected on several satellite images obtained on 31 August, and one on 19 September, but there was no evidence of eruptive activity.
On 7 October, AVO raised the Concern Color Code to Orange after detecting a small drifting volcanic ash cloud. The cloud was seen in satellite data at a spot ~ 150 km ESE of Dutch Harbor at 1700 UTC. Based on data from a regional seismometer at Nikolski, AVO concluded that the ash came from a small Cleveland eruption at approximately 0145. AVO, in consultation with the National Weather Service, estimated the top of the ash cloud to be no more than 4,600 m altitude. The ash cloud dissipated and was not detected via satellite after 1800 UTC. Three days passed during which there were no new observations of eruptive activity at Cleveland from satellite data, pilots, or ground-based observers. Accordingly, on 10 October the Concern Color Code was reduced to Yellow.
Information Contacts: Alaska Volcano Observatory (AVO), a cooperative program of the U.S. Geological Survey, 4200 University Drive, Anchorage, AK 99508-4667, USA (URL: http://www.avo.alaska.edu/), Geophysical Institute, University of Alaska, PO Box 757320, Fairbanks, AK 99775-7320, USA, and Alaska Division of Geological & Geophysical Surveys, 794 University Ave., Suite 200, Fairbanks, AK 99709, USA; Washington Volcanic Ash Advisory Center (VAAC), Washington, DC, USA (URL: http://www.ospo.noaa.gov/Products/atmosphere/vaac/).
6 February 2006 eruption on remote, non-instrumented island
According to the Alaska Volcano Observatory (AVO), Mount Cleveland, a volcano on an uninhabited island in the central Aleutian chain, erupted at 0757 on 6 February 2006, sending a cloud of ash to 6.7 km (22,000 ft) altitude. Officials at AVO issued a Code Red warning for the volcano because the ash cloud was near a level where it could interfere with jet traffic, said Chris Waythomas, a U.S. Geological Survey geologist. There were no reports of falling ash. The nearest community is Nikolski, a tiny Aleut village of 31 people 73 km E of the volcano.
Cleveland's last major eruptive period was in March 2001 when three explosions occurred and the volcano produced significant ash plumes (BGVN 26:04). Discussion of that episode was renewed briefly at the end of the Augustine report in this issue (BGVN 31:01). That discussion (and cited references) noted that the ash cloud from a Cleveland eruption on 19 February 2001 had a modeled path that carried the cloud S, passing over Northern California. Two days after the eruption, aviators flying near San Francisco, California, smelled sulfurous gases, presumably from the Cleveland eruption. There were also minor ash emissions from July to October 2005 (BGVN 30:09).
AVO downgraded the level of concern color code for Cleveland from Red to Orange on 7 February 2006 at 1655 hours. No new ash emissions or thermal anomalies have been detected in clear to partly cloudy satellite views from the morning of 8 February. AVO noted that Cleveland does not have a real-time seismic network and therefore it is unable to monitor seismic changes.
Information Contacts: Alaska Volcano Observatory (AVO), a cooperative program of the U.S. Geological Survey, 4200 University Drive, Anchorage, AK 99508-4667, USA (URL: http://www.avo.alaska.edu/), Geophysical Institute, University of Alaska, PO Box 757320, Fairbanks, AK 99775-7320, USA, and Alaska Division of Geological & Geophysical Surveys, 794 University Ave., Suite 200, Fairbanks, AK 99709, USA; Washington Volcanic Ash Advisory Center (VAAC), Satellite Analysis Branch (SAB), NOAA/NESDIS E/SP23, NOAA Science Center Room 401, 5200 Auth Road, Camp Springs, MD 20746, USA (URL: http://www.ospo.noaa.gov/Products/atmosphere/vaac/).
Ash plume on 23 May 2006 to over 6 km altitude
Since an ash cloud was detected on 6 February 2006 (BGVN 31:01), observers have documented two brief spurts of activity. On the morning of 2 May beginning at 0101, a thermal anomaly and continuous plume were seen on satellite imagery. The plume extended ~ 50 km SW and was visible on imagery for ~ 6 hours. Satellite data suggested a maximum height of ~ 1 km altitude There was no indication of ash in the cloud. No further activity was detected for several weeks after the 2 May plume. In this interval Cleveland was not assigned a Concern Color Code because there is no real-time seismic network at the volcano.
The second episode took place on 23 May 2006. AVO reported that an astronaut aboard the International Space Station observed an ash plume from Cleveland at 1500. At 1507 satellite imagery showed a plume that drifted SW and reached an altitude of ~ 6.1 km. At 1700, an image showed the detached ash plume 130 km SW of Cleveland. The Concern Color Code was raised to Yellow.
The ash plume had mostly dissipated by 24 May. On 26 May, AVO downgraded the Concern Color Code from Yellow to "Not Assigned."
Information Contacts: Alaska Volcano Observatory (AVO), a cooperative program of the U.S. Geological Survey, 4200 University Drive, Anchorage, AK 99508-4667, USA (URL: http://www.avo.alaska.edu/), the Geophysical Institute, University of Alaska, PO Box 757320, Fairbanks, AK 99775-7320, USA, and the Alaska Division of Geological and Geophysical Surveys, 794 University Ave., Suite 200, Fairbanks, AK 99709, USA; Earth Observatory, National Aeronautics and Space Administration (NASA) (URL: http://earthobservatory.nasa.gov/NaturalHarards/).
Astronauts capture photo of 23 May eruption
On 23 May 2006, the Alaska Volcano Observatory (AVO) received a report from the International Space Station indicating that a plume was observed moving W from Cleveland volcano at 2300 UTC (BGVN 31:06). A photograph of the plume taken from the International Space Station was released by the National Aeronautics and Space Administration (NASA) (figure 5).
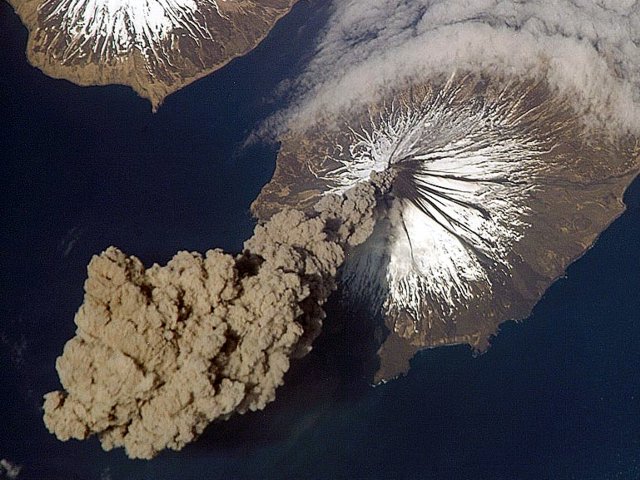 |
Figure 5. Eruption of Mount Cleveland on 23 May 2006 as photographed from the International Space Station at an orbital altitude of ~ 400 km. The photograph (N at the top; Carlisle Island to the NW) shows the ash plume moving SW from the summit. Banks of fog (arcuate clouds at upper right) are common features around the Aleutian Islands. The event proved to be short-lived; ~ 2 hours later, the plume had completely detached from the volcano. Courtesy of Jeffrey N. Williams, Flight Engineer and NASA Science Officer, International Space Station Expedition 13 Crew, NASA Earth Observatory. |
Starting at about 2300 UTC, just before this image was taken, Cleveland underwent a short eruption. The volcanic plume was seen in Advanced Very High Resolution Radiometer (AVHRR) polar-orbiting satellite data beginning from 2307 UTC. By 0100 UTC on 24 May the ash plume had detached from the vent and was approximately 130 kilometers SW of the volcano. Satellite data showed a cloud height of about 6.1 km asl (table 1). The plume was no longer detectable in satellite imagery by 0057 UTC on 25 May. In response to the event, AVO raised the Level of Concern Color Code to 'Yellow.'
Table 1. Satellite observations of ash plume from Cleveland volcano. Courtesy of the Washington Volcanic Ash Advisory Center (VAAC).
| Date and Time (UTC) | Plume altitude | Direction and speed |
| 24 May 2006 (0200) | 8.2 km | SW at 55 km/hour |
| 24 May 2006 (0800) | 6.7 km | SW at 37-46 km/hour |
| 24 May 2006 (1400) | 6.1 km | W at 37-46 km/hour |
The last eruption of Cleveland was 6 February 2006 (BGVN 31:01). Since 24 May 2006, no new information about ash emissions had been received, nor have indications of continuing activity been detected from satellite data for the volcano. This short-lived event was typical of recent Cleveland activity. On 7 August 2006, AVO downgraded the Level of Concern Color Code for Cleveland from 'Yellow' to 'Not Assigned." Because Cleveland is not monitored with real-time seismic instrumentation, during intervals of repose it does not receive an assignment of Color Code 'Green,' but instead is left 'Not Assigned.'
Information Contacts: National Aeronautics and Space Administration (NASA) Earth Observatory (URL: http://earthobservatory.nasa.gov/); Washington Volcanic Ash Advisory Center (VAAC) (URL: http://www.ospo.noaa.gov/Products/atmosphere/vaac/); Jeffery Williams, NASA, ISS Crew Earth Observations and the Image Science & Analysis Group, Johnson Space Center 2101 NASA Parkway, Houston, TX 77058, USA.
Short duration explosions during August-October 2006
Cleveland's commonly observed activity consisting of short duration explosions, such as those seen earlier in the year on 6 February 2006 (BGVN 31:01) and on 23 May 2006 (BGVN 31:07), continued during August and October 2006. This report will cover the 24 August and 28 October eruptions.
At 1955 on 24 August a brief eruption was seen by mariners on a passing ship. The eruption was unconfirmed by satellite data. Video footage sent to the Alaska Volcano Observatory (AVO) on 28 August showed that an ash cloud rose to an approximate altitude of 3 km and produced minor ashfall. Shortly after the eruption, minor steaming was observed from the vent on additional footage. In response to the eruption, the AVO raised the level of Concern Color Code from 'unassigned' to 'Yellow' on 7 September. A weak thermal anomaly in the summit crater was present in subsequent satellite images.
Clouds obstructed visibility through most of September and October.
A pilot reported that a minor eruption started at 1345 on 28 October. Satellite data confirmed the presence of an ash cloud drifting ENE of the volcano. The height of the cloud was estimated at an altitude of 6 km using the satellite imagery. One pilot reported the plume top at an altitude of 9 km. The AVO raised the alert level to 'Orange' during 28-29 October. On 30 October the AVO lowered the level to 'Yellow' because of no further evidence of activity.
Information Contacts: Alaska Volcano Observatory (AVO), a cooperative program of the U.S. Geological Survey, 4200 University Drive, Anchorage, AK 99508-4667, USA; Geophysical Institute, University of Alaska, PO Box 757320, Fairbanks, AK 99775-7320, USA; and Alaska Division of Geological & Geophysical Surveys, 794 University Ave., Suite 200, Fairbanks, AK 99709, USA (URL: http://www.avo.alaska.edu/).
Thermal anomalies and minor explosions continue through February 2008
Our previous reports on Cleveland discussed short duration explosions on 6 February 2006 (BGVN 31:01), 23 May 2006 (BGVN 31:07), and on 24 August and 28 October 2006 (BGVN 31:09).
We received no further reports on Cleveland until June 2007. On 12 June, steam emissions were observed. The plume rose to an altitude of 3.7 km and drifted SE for 200 km. On 17 June, satellite imagery showed a significant thermal anomaly. Low level eruptive activity was suggested. No ash plume was detected. On 26 June, satellite imagery showed another thermal anomaly. On 20 July, the Alaska Volcano Observatory (AVO) raised the Alert Level from Advisory to Watch and the Aviation Color Code from Yellow to Orange, based upon an intense thermal anomaly in the crater and an associated steam-and-gas plume observed on satellite imagery. Three small SO2 clouds produced by small explosions on 20 July were detected in OMI satellite data. Weak thermal activity was observed by satellite imagery throughout the month.
On 27 July AVO noted that low-level eruptive activity continued. Photographs from 27 July and a pilot report from 2 August indicated fresh volcanic ejecta on the slopes and summit. The E portion of Chuginadak Island was dusted with ash on 3 August. AVO lacks a local seismic system at the volcano was thus unable to track local volcanic earthquakes.
Thermal anomalies continued to be detected on satellite imagery, although clouds obscured satellite and web camera views of the volcano on most days during August through 11 September. A few clear views of the crater during this time revealed multiple thermal anomalies at the summit, indicating that low-level eruptive activity continued.
On 6 September, AVO lowered the Volcanic Alert Level for Cleveland from Watch to Advisory and the Aviation Color Code from Orange to Yellow, based on the observation that since late July, ash and gas plumes had been absent in satellite imagery and no reports of activity had been received. On 20 November the last weak thermal anomaly was observed for the year.
At 1200 on 17 January 2008, minor ash emission was detected, which drifted N. The plume height could not be determined. Thermal anomalies were found in the satellite imagery later that day. According to the AVO, on 8 February, during a break in the cloud cover, satellite imagery detected a diffuse ash plume extending about 12 km SE at an altitude below 1.5 km. Later that day AVO received pilot reports of a diffuse ash plume that rose to an altitude of 6.1 km and, according to satellite imagery, drifted NW. Due to the increased activity, the Volcanic Alert Level was raised to Watch and the Aviation Color Code was raised to Orange. During 10-11 February, a feeble thermal anomaly was marginally visible on satellite imagery.
On 12 February, the Volcanic Alert Level was lowered back to Advisory and the Aviation Color Code was lowered to Yellow. This occurred in response to the observation that minor eruptive activity appeared to have subsided and no further evidence of ash emission had been reported.
On 15 February, a minor explosion from Cleveland produced a small, diffuse ash plume that rose to an altitude of below 3 km and drifted NW. On 16 February, a brief explosion occurred. On 22 February, satellite imagery detected a low-level ash plume that drifted about 300 km SE. On 23 February, satellite imagery revealed a thermal anomaly. On 29 February, satellite imagery detected a weak thermal anomaly and a small ash plume that rose to an altitude of below 3 km. On 15, 27, and 30 March, weak thermal anomalies were detected. As of 4 April 2008, Cleveland remains at Advisory and the Aviation code Yellow.
Information Contacts: Alaska Volcano Observatory (AVO), a cooperative program of the U.S. Geological Survey, 4200 University Drive, Anchorage, AK 99508-4667, USA, the Geophysical Institute, University of Alaska, PO Box 757320, Fairbanks, AK 99775-7320, USA, and the Alaska Division of Geological & Geophysical Surveys, 794 University Ave., Suite 200, Fairbanks, AK 99709, USA (URL: http://www.avo.alaska.edu/); Volcanic Emissions Group, Ozone Monitoring Instrument (OMI)-Total Ozone Monitoring Spectrometer (TOMS), Joint Center for Earth Systems Technology, University of Maryland Baltimore County (UMBC), and NASA Goddard Space Flight Center (URL: http://toms.unbc.edu/).
Eruption on 21 July 2008; lava flows and ash plumes
Minor explosions were reported from Cleveland volcano on 15 and 29 February 2008 Cleveland (BGVN 33:02); such events have been typical during the last several years. This report discusses subsequent behavior and observations into late August, including thermal anomalies, explosions, ash plumes, and an inferred lava flow.
AVO noted that during the two weeks prior to 9 May 2008, an increasing number of thermal anomalies were visible on satellite imagery. On 7 May, a small ash plume rose to an altitude of below 4.6 km. Also, around the same time, a ship N of Nikolski on Umnak Island (~ 75 km ENE) reported receiving a dusting of ash (figure 6).
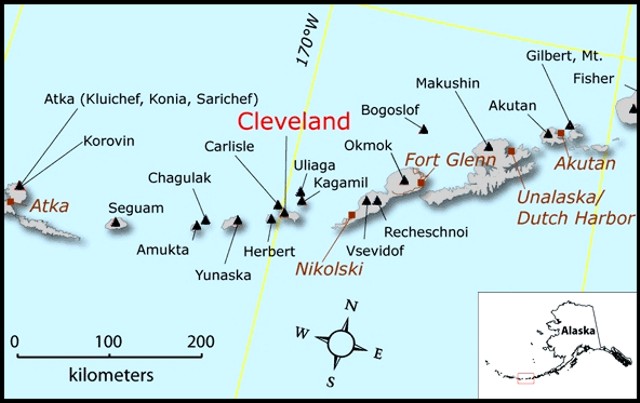 |
Figure 6. Map of the Aleutian Islands focused around Cleveland volcano. From E to W, the noted settlements are Atka, Nikolski, Fort Glenn, Unalaska/Dutch Harbor, and Akutan. Courtesy of the Alaskan Division of Geological and Geophysical Surveys. |
During June and early July 2008, satellite and webcam views were mostly obscured by clouds and fog, and AVO received no reports of eruptive activity. Satellite analysts noted a minor thermal anomaly on 8 June.
On 21 July, AVO raised the alert level/aviation color code for Cleveland to Watch/Orange based on reports from pilots and observers on fishing boats. Reports from fishing boats indicated that an eruption started at about 1200 and ash near sea level may have drifted NW. Pilots reported that an ash-and-steam plume rose to altitudes of ~ 4.6-5.2 km and drifted SE.
Satellite imagery for 22 July revealed a steam plume possibly containing some ash drifting more than 50 km ESE. It reached altitudes of 3-6 km. Thermal anomalies led analysts to infer a possible lava flow. Also, in harmony with this interpretation, on 22 July the MODVOLC algorithm registered its first alert thus far in 2008 (3 pixels) and near-daily alerts followed as late as 29 July (table 2).
Table 2. Thermal anomalies ("alerts") at Cleveland registered by the MODIS satellite as processed by the MODVOLC algorithm during the interval 1 January-9 September 2008. The only recent alerts during that interval were during the period of 22-29 July. Courtesy of Hawai'i Institute of Geophysics and Planetology (HIGP) Thermal Alerts System.
| Date (UTC) | Time (UTC) | Pixels | Satellite |
| 22 Jul 2008 | 1255 | 3 | Aqua |
| 23 Jul 2008 | 0010 | 3 | Aqua |
| 24 Jul 2008 | 0840 | 2 | Terra |
| 24 Jul 2008 | 1245 | 3 | Aqua |
| 24 Jul 2008 | 1420 | 5 | Aqua |
| 27 Jul 2008 | 1315 | 1 | Aqua |
| 27 Jul 2008 | 2240 | 1 | Terra |
| 29 Jul 2008 | 0855 | 1 | Terra |
AVO reported that satellite views were hindered on 23 July due to cloud cover. On 24 July, a low-level ash plume and a strong thermal anomaly were noted near the summit. This thermal anomaly again suggested the presence of an active lava flow. The MODIS measurements shown in table 2 for 24 July indicated several thermal anomalies to the W of the cone and pixels that are displaced downslope, E of the cone, several almost reaching the ocean. The thermal anomalies continued to be detected during 26-28 July, and possible ash plumes drifted SE, E, and NE at altitudes of 3-6.1 km during 27-29 July.
According to David Schneider of AVO, the MODVOLC algorithm has a higher trigger threshold than an analyst and MODVOLC also has fewer observations each day since it only uses MODIS satellite data. AVO uses MODIS, AVHRR, and GOES satellites to reduce the chance of missing thermal anomalies due to cloud cover. Both MODVOLC and AVO use mid-IR data (in the 3.0 to 3.5 micron range) to detect high temperature thermal anomalies.
AVO reported that thermal anomalies detected at Cleveland's summit by various satellites during 30 July-5 August 2008 also suggested the presence of an active lava flow. The anomaly on 30 July extended about 6-9 km. On 31 July, a diffuse plume drifted less than 20 km NE, N, and NW at an altitude of 6.1 km. The plume was seen from an airplane on 1 August.
On 5 August, thermal anomalies appeared on the W, S, and SE flanks. They possibly indicated the presence of pyroclastic flows or hot lahars. On 6 August 2008, AVO reported that the thermal anomalies noted at Cleveland's summit and on the W, S, and SE flanks had decreased in intensity since first noted on 21 July, indicating that the lava flows slowed or stopped. The hazard status was lowered to Yellow/Advisory. During 7-10 August 2008, a weak thermal anomaly at Cleveland's summit was intermittently visible when not obscured by clouds and drifting ash from Kasatochi (~ 390 km WSW).
On 11 August, thermal anomalies on satellite imagery again indicated that lava flowed down the flanks. On 12 August an ash plume rose to an altitude of 7.6 km and drifted 100 km SW. Cloud cover prevented satellite observations during 13-26 August, although a possible thermal anomaly was present on 24 August. On 11 August the hazard status rose to Orange/Watch, but on 25 August it dropped to Yellow/Advisory.
Information Contacts: Alaska Volcano Observatory (AVO), a cooperative program of the U.S. Geological Survey, 4200 University Drive, Anchorage, AK 99508-4667, USA (URL: http://www.avo.alaska.edu/), the Geophysical Institute, University of Alaska, PO Box 757320, Fairbanks, AK 99775-7320, USA, and the Alaska Division of Geological and Geophysical Surveys, 794 University Ave., Suite 200, Fairbanks, AK 99709, USA; Hawai'i Institute of Geophysics and Planetology (HIGP) Thermal Alerts System, School of Ocean and Earth Science and Technology (SOEST), Univ. of Hawai'i, 2525 Correa Road, Honolulu, HI 96822, USA (URL: http://modis.higp.hawaii.edu/).
Explosive ash emission on 2 January 2008
Satellite images acquired during the night of 23 December 2008 showed a persistent thermal anomaly near the summit of Cleveland, a stratovolcano forming the western half of the remote and uninhabited Chuginadak Island in the E-central Aleutian Islands. Cloud cover prevented satellite observations during 25-27 December, but a small thermal anomaly was observed on 28 December 2008. The Alaska Volcano Observatory (AVO) raised the aviation color code to Yellow and the alert level to Advisory on 24 December 2008.
AVO reported that on the morning of 2 January 2009, a short-lived but explosive ash emission occurred. The resulting plume reached to an altitude of ~ 6 km. The plume was first observed in a satellite image obtained at 1645 UTC and was visible in subsequent images for several hours. The plume drifted ~ 240 km ESE, but then dispersed rapidly and could no longer be detected. Satellite views of the volcano were obscured by clouds most of the week; however, a minor thermal anomaly was observed in satellite views of the summit on the morning of 4 January. During this event no active lava flows were observed, as compared with events of July-August 2008 (BGVN 33:07).
Cleveland lacks seismic instrumentation; satellite data and pilot reports are the primary information sources. Thermal anomalies were absent after the cluster of events during 22-29 July 2008 (BGVN 33:07).
Information Contacts: Alaska Volcano Observatory (AVO), a cooperative program of the U.S. Geological Survey, 4200 University Drive, Anchorage, AK 99508-4667, USA (URL: http://www.avo.alaska.edu/), the Geophysical Institute, University of Alaska, PO Box 757320, Fairbanks, AK 99775-7320, USA, and the Alaska Division of Geological and Geophysical Surveys, 794 University Ave., Suite 200, Fairbanks, AK 99709, USA.
Two explosive ash emissions in June and October 2009
As previously reported (BGVN 33:11) , the Alaska Volcano Observatory (AVO) had raised the aviation color code for Cleveland on 24 December 2008 to Yellow and the alert level to Advisory, following a thermal anomaly near the summit that was present for two days. The anomaly was occasionally observed into early January 2009. On 2 January, a short-lived ash explosion produced an ash plume that rose ~ 6 km and drifted ~ 240 km ESE before dissipating.
A small explosive eruption on 25 June 2009 sent an ash cloud rose to an estimated altitude of 4.6 km, which quickly detached from the volcano and drifted S. Another small and brief explosive eruption occurred on 2 October. A small detached ash cloud rose to maximum altitudes of 4.6-6.1 km and drifted ~ 600 km NE, dispersing over the Bering Sea. No further activity was detected through 19 October, so the Alert Levels were lowered to "Unassigned." Cleveland is not monitored by a real-time seismic network, thus the levels "Green" or "Normal" do not apply because background activity is not defined.
Information Contacts: Alaska Volcano Observatory (AVO), a cooperative program of the U.S. Geological Survey, 4200 University Drive, Anchorage, AK 99508-4667, USA (URL: http://www.avo.alaska.edu/), the Geophysical Institute, University of Alaska, P.O. Box 757320, Fairbanks, AK 99775-7320, USA, and the Alaska Division of Geological and Geophysical Surveys, 794 University Ave., Suite 200, Fairbanks, AK 99709, USA.
At least three eruptions during 2009, with a possible fourth on 12 December
Cleveland, an Aleutian Islands volcano situated almost 1,500 km S of the E margin of the Bering strait, had multiple short-duration ash-bearing explosive eruptions in 2009. The first of these documented eruptions took place on 2 January 2009 (BGVN 33:11). The next two documented ash-bearing eruptions occurred on 25 June and 2 October 2009 (BGVN 34:10). As stated in those previous issues, thermal anomalies were common in satellite data as reported by the Alaskan Volcano Observatory (AVO).
Previously not reported was a possible fourth 2009 eruption, which took place on 12 December. It seemingly generated a diffuse ash plume, an event detected a few days later in satellite imagery (figure 7). AVO had also lowered the hazard status on 12 December to "Unassigned," a level that results from the lack of a nearby seismic receiver and the consequent inability to define background seismicity. As of late January 2010, further activity at Cleveland was absent and no further reports were issued.
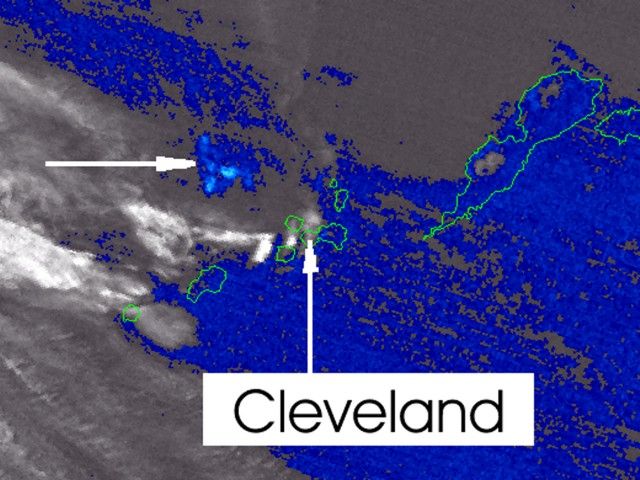 |
Figure 7. A MODIS satellite image of Cleveland volcano and vicinity captured at 2237 UTC on 12 December 2009 (brightness temperature difference from Channel 31 minus Channel 32). The plume (at tip of horizontal arrow) was judged as likely due to an eruption but this was not certain. N is towards the top and for approximate scale, the adjacent (Nikolski) island outlined to the E is ~100 km long (for other maps, see BGVN 33:07 and 26:01). Courtesy of John Dehn, AVO (arrows added). |
John Dehn of AVO provided more details regarding the discovery and interpretation of the 12 December plume (figure 7). It was initially detected by David J. Beberwyk at the Air Force Weather Agency (AFWA). The information was passed to AVO and distributed to staff on 14 December. After looking at the imagery, they announced in log entries on 15 December that they had possibly missed the faint signal in their daily reporting. Dehn was "pretty confident that this [was] real but the signal is comparable to weather systems."
Dehn went on to note that "Cleveland is known for these small events, and whether we catch them is up to the fortuitousness of a satellite pass and good weather. No further activity was reported, though [AVO's] Rick Wessels noted that a MODIS image from a few hours later shows possible dark deposits on the NW side of the summit. The summit of the volcano has typically had dark deposits on the snow in recent years as we've seen on the webcam, satellite imagery and observer reports so this [was] not conclusive."
Information Contacts: Alaska Volcano Observatory (AVO), a cooperative program of the U.S. Geological Survey, 4200 University Drive, Anchorage, AK 99508-4667, USA; Geophysical Institute, University of Alaska, PO Box 757320, Fairbanks, AK 99775-7320, USA; and Alaska Division of Geological & Geophysical Surveys, 794 University Ave., Suite 200, Fairbanks, AK 99709, USA (URL: http://www.avo.alaska.edu/).
Small ash eruptions during 25 May to early June 2010
The Alaska Volcano Observatory (AVO) noted four explosive events at Cleveland in 2009, the last causing a diffuse ash plume on 12 December (BGVN 34:12). Additional small ash clouds have since been observed during late May and early June.
On 25 May 2010, AVO warned that thermal anomalies observed in satellite data over the past few days suggested another period of unrest. In the past, thermal anomalies at the summit have been followed by moderate ash bursts, sometimes to aircraft flight levels. An ash cloud was visible in a satellite image at 0756 on 30 May. It rose to an altitude of ~ 4.9 km and drifted to the SW. At the time of the satellite image, the cloud was detached, and it was estimated that the emission had occurred several hours earlier. The event was interpreted as a short-lived ash emission without signs of further activity. Satellite images from 31 May also showed minor deposits on the upper flanks, and a 1 June image showed debris flow deposits down the E flank and ashfall deposits on the SW flank. Small plume were seen rising from the crater on 1 and 4 June (figure 8). A weak thermal anomaly detected on 2 June suggested continuing low-level ash emission.
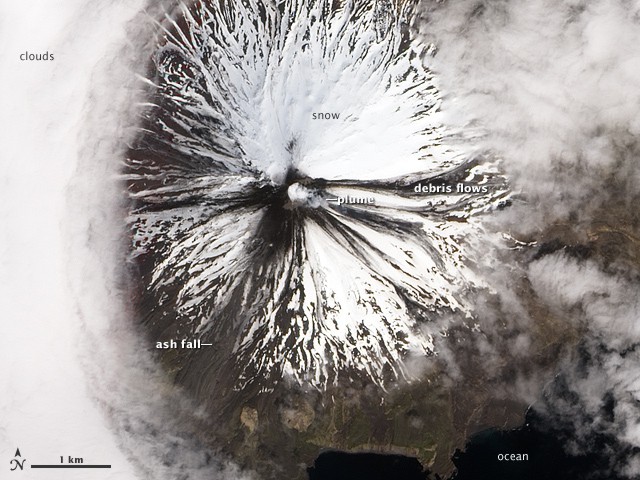 |
Figure 8. The Advanced Land Imager (ALI) on NASA's Earth Observing-1 (EO-1) satellite captured this image of Cleveland on 4 June 2010. Clouds nearly surround the snow-capped volcano, which is striped with dark ash and debris flow. A small, faint plume rises from the summit. Courtesy of NASA/GSFC/METI/ERSDAC/JAROS, and U.S./Japan ASTER Science Team and NASA Earth Observatory. |
From 5-9 June 2010, satellite images of Cleveland were mostly obscured by clouds, and AVO received no reports of ash emission. On 10 June, a partly cloudy satellite view lacked evidence of ash emissions or thermal anomalies.
Information Contacts: Alaska Volcano Observatory (AVO), a cooperative program of the U.S. Geological Survey, 4200 University Drive, Anchorage, AK 99508-4667, USA; Geophysical Institute, University of Alaska, PO Box 757320, Fairbanks, AK 99775-7320, USA; and Alaska Division of Geological & Geophysical Surveys, 794 University Ave., Suite 200, Fairbanks, AK 99709, USA (URL: http://www.avo.alaska.edu/); NASA Earth Observatory (URL: http://earthobservatory.nasa.gov/NaturalHazards); NASA/GSFC/METI/ERSDAC/JAROS and U.S./Japan ASTER Science Team (URL: http://asterweb.jpl.nasa.gov/).
Thermal anomalies and possible plumes through mid-September 2010
Occasional small ash eruptions occurred at Cleveland during 2009 through early June 2010 (BGVN 35:06). Mild restless behavior continued at least into mid-September 2010 but it was uncertain whether ash had been emitted.
Table 3 compiles key observations and alerts for Cleveland volcano during mid-June through 31 March 2011. The Alaska Volcano Observatory (AVO) reported that thermal anomalies were sometimes visible and sometimes absent on satellite imagery. One or two ash plumes may have also been emitted. Accordingly, these observations caused authorities to raise and lower the Volcano Alert Level and Aviation Color Code (table 3). Volcano seismicity was absent because Cleveland lacks a real-time seismic network. The thermal anomalies and possible plumes could both could stem from steam emissions (see AVO statement at bottom of this report).
Table 3. Reports of activity at Cleveland based on satellite imagery during 10 June 2010 through 31 March 2011. Also shown are Volcano Alert Level and Aviation Color Code fluctuations based on that activity. Courtesy AVO.
| Date | Observation based on satellite imagery | Volcano Alert Level | Aviation Color Code |
| 10 Jun 2010 | -- | Advisory | Yellow |
| 11 Jun 2010 | -- | Unassigned | Unassigned |
| 16 Aug-1 Sep 2010 | Thermal anomalies visible on most days | -- | -- |
| 26 Aug 2010 | -- | Advisory | Yellow |
| 07-08 Sep 2010 | Clear-weather views showed no thermal anomalies or recent deposits on the flanks | -- | -- |
| 08 Sep 2010 | -- | Unassigned | Unassigned |
| 11 Sep 2010 | Thermal anomaly visible | -- | -- |
| 12 Sep 2010 | Possible ash plume rose to ~7.6-km altitude and drifted E | -- | -- |
| 12 Sep 2010 | -- | Advisory | Yellow |
| 13-15 Sep 2010 | Thermal anomalies visible | -- | -- |
| 16-24 Sep 2010 | Cloud cover prevented views | -- | -- |
| 25-26 Sep 2010 | Weak thermal anomaly visible | -- | -- |
| 27-28 Sep 2010 | Cloud cover prevented views | -- | -- |
| 31 Mar 2011 | -- | Unassigned | Unassigned |
On 12 September 2010, a possible ash plume was visible in satellite imagery; it rose to an estimated altitude of 7.6 km and drifted E. A 14 September image showed a dense white plume issuing from Cleveland (figure 9).
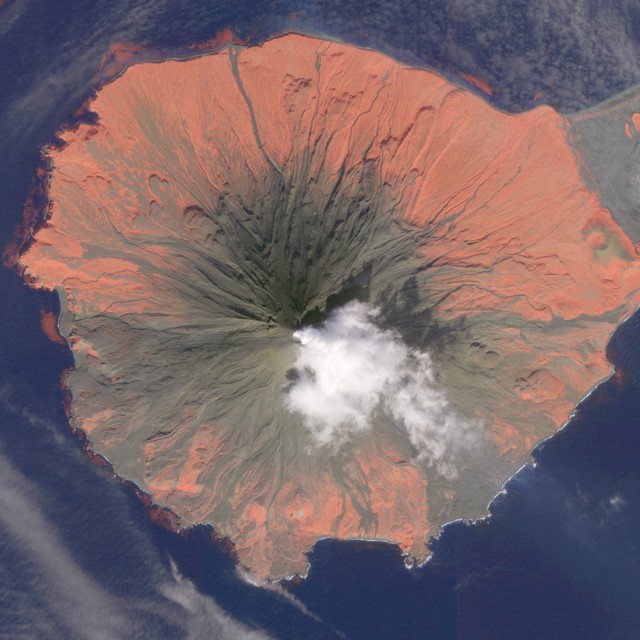 |
Figure 9. Image of a small, dense, compact white plume issuing from Cleveland at 1431 on 14 Sept 2010, captured by the GeoEye IKONOS satellite. In color versions of the image, red highlights areas of vegetation detected by the near-infrared channel. Photographed/created by Rick Wessels. Image processed by AVO/USGS; copyright 2010 by GeoEye. Courtesy AVO. |
On 31 March 2011, AVO lowered the Volcano Alert Level and the Aviation Color Code to Unassigned, noting that no eruptive activity had been confirmed during the previous few months. No significant thermal anomalies or ash deposits on snow were observed in satellite imagery.
In its 31 March 2011 report, AVO stated that "Cleveland experiences frequent episodes of low-level unrest; the summit crater at Cleveland often emits visible plumes of water vapor and possibly small quantities of volcanic gas. Heat associated with this process can produce occasional weak thermal anomalies detected by satellite; however, these do not always indicate eruptive activity has occurred or is imminent."
AVO also stated, in an earlier report, that low-level ash emissions at Cleveland occur frequently and also do not necessarily mean that a larger eruption is imminent.
Information Contacts: Alaska Volcano Observatory (AVO), a cooperative program of the U.S. Geological Survey, 4200 University Drive, Anchorage, AK 99508-4667, USA; Geophysical Institute, University of Alaska, PO Box 757320, Fairbanks, AK 99775-7320, USA; and Alaska Division of Geological & Geophysical Surveys, 794 University Ave., Suite 200, Fairbanks, AK 99709, USA (URL: http://www.avo.alaska.edu/).
Dome growth during August-September 2011 seen evolving in radar data
Figure 10 shows the location of Cleveland volcano, the scene of significant changes in dome morphology in August and September 2011. On 31 March 2011 the Alaska Volcano Observatory (AVO) lowered the Volcano Alert Level and the Aviation Color Code for Cleveland to Unassigned, noting that no eruptive activity had been confirmed during the previous few months (BGVN 36:05). Cleveland lacks a real-time seismic network, which means AVO cannot track local earthquakes and estimate volcanic unrest. AVO notes that short-lived explosions with ash clouds that could exceed 6.1 km altitude can occur without warning and may go undetected on satellite imagery for hours. Low-level ash emissions at Cleveland occur frequently and do not necessarily mean a larger eruption is imminent. AVO continues to monitor the volcano using satellite imagery.
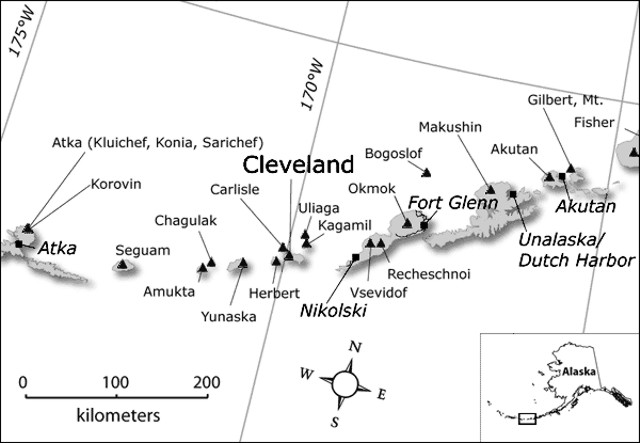 |
Figure 10. Location of Cleveland volcano and other Aleutian volcanoes with respect to nearby cities and towns. Map created by Janet Schaefer and provided courtesy of AVO and the Alaska Division of Geological & Geophysical Surveys (ADGGS). |
AVO reported that on 20 July 2011 the Volcano Alert Level for Cleveland was raised to Advisory, and the Aviation Color Code was raised to Yellow due to thermal anomalies visible in satellite imagery during 19-20 and 22 July 2011. Cloud cover prevented observations during 21 and 23-26 July.
During the week of 25-31 July 2011 elevated but weak thermal anomalies were observed in satellite images of during periods of clear weather. AVO found no evidence of ash emissions or eruptive activity. Observations on 29 July 2011 showed a small lava dome ~ 40 m in diameter in the summit crater, apparently formed since 19 July based on measured thermal anomalies. Observations on 2 August revealed growth of the lava dome from ~40 to 50 m in diameter. In response, AVO raised the Aviation Color Code to Orange and the Alert Level to Watch.
An animated sequence of satellite radar images revealed what was hard to see through persistent weather clouds. They portrayed dynamic growth of the lava dome during early August through at least late September 2011 (figure 11).
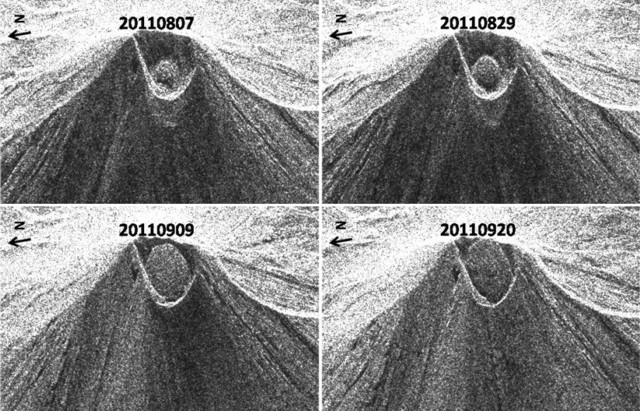 |
Figure 11. A sequence of satellite radar images showing Cleveland volcano's summit crater and growth of its lava dome for 7, 18, and 29 August, and 9 and 20 September 2011. The radar data are from the TerraSAR-X sensor (wavelength 31 mm, frequency 9.6 GHz). The summit crater is ~ 200 m across. Note that satellite radar images have inherent topographic distortion (eg. foreshortening and layover) due to the manner in which they are collected. Image copyrighted in 2011 by the German Remote Sensing Data Center (DFD) and German Aerospace Center (DLR). Provided courtesy of Dave Schneider and Zhong Lu (Alaska Volcano Observatory, AVO) and the U.S. Geological Survey (USGS). |
AVO reported weak thermal anomalies in satellite imagery during 2-3, 5, 7-9, and 13-14 August when cloud cover was limited or absent. They noted that a scientist flying N of the volcano on 14 August observed small white puffs of steam rising 30-60 m above the summit, even though most of the volcano was obscured by clouds.
During 17-23 August cloud cover over Cleveland prevented observations of the summit crater. On 21 August AVO noted that a weak, 1-pixel thermal anomaly was observed in a recent satellite view during a cloud break. On 30 August 2011, satellite observations during the previous two weeks indicated a pause in lava-dome growth. AVO lowered the Volcano Alert Level to Advisory and the Aviation Color Code to Yellow. Cloud cover prevented views of the summit crater during 31 August-2 September, but a thermal anomaly at the summit was observed during 3-5 September.
Observations on 6-7 September 2011 indicated that the lava dome had resumed growth (figure 11), reaching 120 m in diameter and filling the floor of the crater. AVO again raised the Volcano Alert Level to Watch and the Aviation Color Code to Orange. Although cloud cover often prevented observations of Cleveland during 7-12 September, a thermal anomaly on the lava dome was visible during 8-9 and 12 September, and a possible anomaly was visible on 10 September. These anomalies suggested that lava-dome growth was continuing, although no activity was observed in partly cloudy satellite images during 12-17 September. During 17-18 September a thermal anomaly was detected in imagery.
A report on 20 September noted that recent observations revealed the lava dome had grown to ~165 m in diameter. The dome remained contained within the ~ 200-m-diameter crater at Cleveland's summit, having advanced to ~ 20 m below the E crater rim.
During 20-22 September no observations of elevated surface temperatures or ash emissions from Cleveland were visible in partly cloudy satellite images. Elevated surface temperatures were observed in satellite images during 23-24 September, suggesting that the lava dome eruption was continuing. On 24-25 September 2011 elevated surface temperatures were absent in several clear satellite images. Cloud cover prevented observations on 26 September. Satellite views detected continued elevated summit temperatures over the period 27-28 September 2011. Satellite data also suggested ongoing eruption as the lava dome continued growing.
Information Contacts: Alaska Volcano Observatory (AVO), a cooperative program of a) U.S. Geological Survey (USGS), 4200 University Drive, Anchorage, AK 99508-4667 USA (URL: http://www.avo.alaska.edu/), b) Geophysical Institute, University of Alaska, PO Box 757320, Fairbanks, AK 99775-7320, USA, and c) Alaska Division of Geological & Geophysical Surveys (ADGGS), 794 University Ave., Suite 200, Fairbanks, AK 99709, USA (URL: http://www.dggs.alaska.gov/).
Amendments to BGVN reports 2001-2011
Our last report on Cleveland volcano, August 2011 (BGVN 36:08), described lava dome growth in August-September 2011. This report first addresses late 2011 to early 2012 observations, and then presents some amendments to Bulletin reports over the last decade.
Late 2011-early 2012. According to the Alaska Volcano Observatory (AVO), by the first week of October 2011 satellite images showed the lava dome was within 10 m of the crater rim on the SW and ENE sides of the crater. On 23 October, a TerraSAR-X satellite radar image of Cleveland showed no discernable growth in the lava dome over the course of the past several weeks. Instead, the 23 October image showed deflation or collapse of the dome.
On 3 November 2011, citing lack of dome growth evident in satellite images, AVO lowered both the Aviation Color Code to YELLOW and the Alert Level to ADVISORY. Throughout November, weather permitting, AVO continued to observe thermal anomalies and steam plumes in satellite imagery, consistent with cooling of the emplaced hot dome. Observations in early December 2011 showed continued deflation and cooling of the lava dome, which was about 1x10⁶ m3 in volume.
On 29 December 2011, AVO observed in satellite imagery a detached, drifting ash cloud at an altitude of ~4.6 km and ~80 km ESE of Cleveland. Ground-coupled airwaves from an explosion were also detected at the distant Okmok seismic network, placing the time of explosion at 1312 (UTC) on 29 December 29.
Based on the presence of an ash cloud, on 29 December AVO raised the aviation color code to ORANGE and the alert level to WATCH. On 30 December, with no new explosive activity, AVO lowered the aviation color code to YELLOW and the alert level to ADVISORY. Subsequent satellite images showed that the 25 December (recognized in retrospective data analysis) and 29 December explosions had largely removed the dome.
On 30 January 2012, satellite data showed another small dome within the summit crater, which measured ~ 40 m in diameter by 30 January. On 31 January, AVO raised the aviation color code to ORANGE and the volcano alert level to WATCH. No observations of elevated surface temperatures or ash emissions from Cleveland were noted during 15-21 February. On 17 February, AVO reported that partly-cloudy satellite observations over the past week revealed that the current lava dome had grown to about 60 m in diameter and occupied a small portion of the approximately 200-m diameter summit crater. On 19 February an elevated surface temperature was detected in satellite images. As of this date, there is no real-time seismic monitoring network on Mount Cleveland.
Amendments to Bulletin. According to Diefenbach, Guffanti, and Ewert, (2009), "During the past 29 years, 43 volcanoes within the United States have produced 95 eruptions and 32 episodes of unrest. More than half of the 30 eruptive volcanoes have erupted two or more times. The majority (77 percent) of U.S. eruptions has occurred in Alaska. Akutan volcano in Alaska has produced the most eruptions (11) in the past 29 years, followed by Veniaminof (10), Cleveland (9), and Pavlof (8)."
Because of the relative importance of Cleveland in the Aleutian chain as a source of active volcanism along a busy commercial airline route, we revisited the AVO web site recently to compare information available with that which we used to prepare the Bulletin in the past. As a prelude to this section, table 4 lists Cleveland eruptions reported by the AVO during 2001-2012 and the issues of the Bulletin covering a particular event.
Table 4. Dates of significant eruptions as reported by the AVO web site for Cleveland from January 2001 through January 2012, and related BGVN reports covering the respective eruptions. These data were accessed 9 February 2012; as of that date, the latest eruption reported by AVO was the one of 19 July 2011. From the AVO web site.
| Item | Eruption dates (start-stop; ? = questionable event) | BGVN issue(s) |
| a | 02 Feb-15 Apr 2001 | 26:01, 26:04 |
| b | 27 Apr-27 Sep 2005 | 30:09 |
| c | 06 Feb-06 Feb 2006 | 31:01, 31:06 |
| d | 23 May-23 May 2006 | 31:06, 31:07 |
| e | 24 Aug-28 Oct 2006 | 31:09 |
| f | Jun 2007-28 Oct 2008 | 33:02, 33:07 |
| g | 02 Jan-21 Jan 2009 | 33:11 |
| h | 26 Jun-26 Jun 2009 | 34:10 |
| i | 02 Oct-02 Oct 2009 | 34:10 |
| j | 30 May-02 Jun 2010 | 35:06 |
| k | 12 Sep-12 Sep 2010 (?) | 36:05 |
| l | 19 Jul 2011 ± 7 days | 36:08 |
We amend some of our previous Bulletin reports with the following excerpts from USGS reports of Cleveland eruptions since 2001, ending with the last Bulletin containing a report on Cleveland (BGVN 36:08). The dates for the eruptions are the start and stop dates from the USGS reports.
Item a, Table 4 - BGVN 26:01: On 19 February 2001, Cleveland volcano erupted explosively at ~1430 UTC and AVO established the eruption termination date as 15 April 2001. However, after the eruption, AVO received reports indicating that precursory emission activity had taken place. Most graphic was a photograph taken on 2 February 2001 by a pilot flying by the volcano showing a dark, lobate deposit on the snow-covered SW flank and robust steaming from the summit crater.
Item a, Table 4 - BGVN 26:04: According to AVO, in 2001, ash fall from the February 2001 eruption of Cleveland was observed only at Nikolski over a ~5 hr on 19 February 2001. A sample from Nikolski showed that the ash was composed of glass shards, crystals, and lithics. The glass was dacitic and had a magmatic morphology rather than phreatomagmatic.
Item b, Table 4 - BGVN 30:09: On 27 April 2005, the Federal Aviation Association (FAA) alerted AVO of a pilot report of eruptive activity (ash cloud 4.6-5.5 km altitude) in the vicinity of Cleveland (based on coordinates from the pilots). Although satellite images and nearby seismic stations showed no evidence of activity, a one-time Urgent Pilot Report and a one-time SIGMET were issued.
Item c, Table 4 - BGVN 31:01: AVO noted that by the end of 6 January 2006 there were no further reports or images of ash production at Cleveland.
Item f, Table 4 - BGVN 33:02: Satellite data from February 2007 revealed evidence of recent activity involving ejection of bombs and debris on the upper flanks and generation of water-rich flows that traveled halfway to the coast. No ash emissions or ash fall deposits were observed. This level of activity -accompanied by persistent thermal anomalies - occurred throughout the spring and early summer. On 4 March 2008, a pilot reported minor ash to 1.5 km above sea level in the vicinity of Cleveland, and a weak thermal anomaly was observed the following day.
Item g, Table 4 - BGVN 33:11: The volcano was relatively quiet until 28 October 2008, when an ash cloud rising to ~4.6 km and drifting E was spotted in satellite imagery. On 29 October, another cloud, 160 km long and drifting NE at an altitude of 3.0 km with little or no ash was observed. A strong thermal anomaly over the summit of the volcano was noted on 30 October 2008, but given the low-level nature of the recent activity, AVO did not elevate the Color Code or Alert Level.
Item k, Table 4 - BGVN 36:05: AVO continued to detect thermal anomalies on 14, 15, 25, and 26 September 2010, and 1 October. During the other days, clouds prevented satellite observation of Cleveland. Although the weather usually prevented observations of Cleveland, weak thermal anomalies were also detected on 14, 19, 25, and 29 October 2010. Clouds completely obscured observations for the week of 1-6 November 2010, but thermal anomalies were again detected on 7 November. The weather then remained cloudy until 16,17, 25, 28, and 30 November 2010, when thermal anomalies were again visible. Thermal anomalies were also recorded on 6, 13, 14, 23, and 27 December 2010, and weak thermal anomalies were visible on 1, 11, and 16 January 2011. A weak thermal anomaly was observed on 1 February 2011, and on 9 February a pilot overflew Cleveland and reported minor, repetitive steam emissions rising hundreds of meters above the summit. The snow on the flanks was pristine, with no indication of recent ash emissions. Steam emissions are common at Cleveland and do not indicate an increased level of unrest.
References. Cervelli, P. F., and Cameron, C. E., 2008, Causation or coincidence? The correlations in time and space of the 2008 eruptions of Cleveland, Kasatochi, and Okmok Volcanoes, Alaska, EOS, Transactions of the American Geophysical Union, Fall Meeting 2008, abstract ##A53B-0278.
Diefenbach, A.K., Guffanti, M., and Ewert, J.W., 2009, Chronology and References of Volcanic Eruptions and Selected Unrest in the United States, 1980-2008, U.S. Geological Survey Open-File Report 2009-1118, 85 p (http://pubs.usgs.gov/of/2009/1118/).
Information Contacts: Alaska Volcano Observatory (AVO), a cooperative program of a) U.S. Geological Survey, 4200 University Drive, Anchorage, AK 99508-4667, USA (URL: http://www.avo.alaska.edu/), b) Geophysical Institute, University of Alaska, PO Box 757320, Fairbanks, AK 99775-7320, USA, and c) Alaska Division of Geological & Geophysical Surveys, 794 University Ave., Suite 200, Fairbanks, AK 99709, USA; USAToday (URL: http://www.usatoday.com).
Dome growth and destruction during 2012-2013
In the previous Bulletin report (BGVN 37:01) we discussed a cycle of lava-dome growth within the summit crater from late 2011 through early 2012. That cycle of extrusion and destruction of domes continued into 2013. The lava dome observed on 30 January 2013 persisted to the end of this reporting period, September 2013. The dynamic conditions at Cleveland caused the Alaska Volcano Observatory (AVO) to report numerous changes in the Aviation Color Code and Alert Level, fluctuating between Yellow/Advisory and Orange/Watch throughout this time period (table 5).
Table 5. During 2012-2013, AVO announced changes in the Aviation Color Code and Volcano Alert Level for Cleveland. AVO and other US Observatories use a combination color code and alert level system that addresses both airborne and ground-based hazards (Gardner and Guffanti, 2006); the lowest level in this 4-step system is Normal/Green and the highest is Warning/Red. Courtesy of USGS-AVO.
| Date of Change | Aviation Color Code/ Volcano Alert Level |
| 31 Jan 2012 | Orange/Watch |
| 23 Mar 2012 | Yellow/Advisory |
| 28 Mar 2012 | Orange/Watch |
| 30 May 2012 | Yellow/Advisory |
| 19 Jun 2012 | Orange/Watch |
| 05 Sep 2012 | Yellow/Advisory |
| 10 Nov 2012 | Orange/Watch |
| 21 Nov 2012 | Yellow/Advisory |
| 06 Feb 2013 | Orange/Watch |
| 08 Mar 2013 | Yellow/Advisory |
| 04 May 2013 | Orange/Watch |
| 04 Jun 2013 | Yellow/Advisory |
Continued explosions during 2012-2013. Cleveland has a history of frequent, minor ash emissions particularly during 2005-2009 (McGimsey and others, 2007; Neal and others, 2011) and with more frequency during 2011-2013 (Guffanti and Miller, 2013; De Angelis and others, 2012). During 2012-2013, Cleveland remained unmonitored by ground-based seismic instrumentation; volcanic unrest was primarily detected by the seismic network located on nearby Umnak Island (figure 12). Observations were also conducted with satellites that have capabilities of distinguishing ash from meteorological clouds during clear conditions: GOES (Geostationary Operational Environmental Satellite), POES (Polar Operational Environmental Satellite which carries the AVHRR scanner), and the Terra and Aqua satellites that carry MODIS sensors.
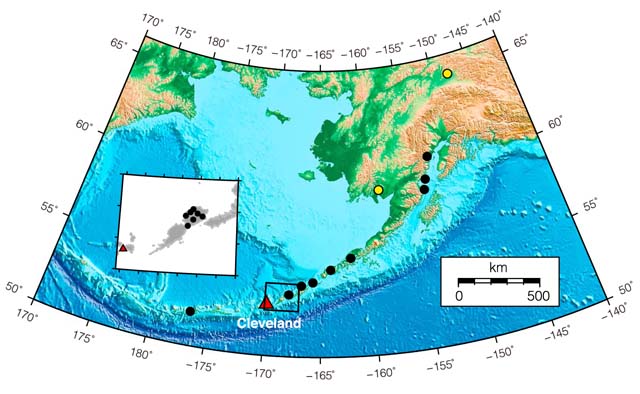 |
Figure 12. Locations of Cleveland volcano (red triangle) and the infrasound stations in Alaska. Black dots are individual infrasound sensors co-located with seismic monitoring stations, yellow dots are infrasound arrays. The inset shows Umnak Island where the Okmok volcano stations are located; this is the closest seismic network to Cleveland. Map modified from De Angelis and others, 2012. |
Additional assessments of explosive activity in this period were aided by (1) direct observations from mariners or pilots (PIREPS); (2) near real-time recordings of ground-coupled airwaves that characteristically arrive at seismic stations as extremely slow velocity signals, ~1 order of magnitude smaller than typical seismic velocity in the crust (De Angelis and others, 2012); (3) new infrasound detection capabilities recently expanded to include a station on Akutan (~500 km ENE of Cleveland).
De Angelis and others (2012) determined that 20 explosions were detected between December 2011 and August 2012, particularly by infrasound sensors as far away as 1,827 km from the active vent, as well as ground-coupled acoustic waves recorded at seismic stations across the Aleutian Arc. By retrospectively examining the record of airwaves from Cleveland, those authors determined that many explosions had gone unnoticed in satellite images, likely because of poor weather conditions that obscured the signal or because these explosions were brief, small, and lofted little ash.
Significant ash explosions in April-June 2012 and May 2013. During the 2012-2013reporting period, explosions from Cleveland's summit crater were most frequently detected during April and June 2012 (figure 13). Additional explosions were reported by AVO through July 2013. Relative quiescence (which included minor thermal anomalies visible in satellite images) followed and continued through September 2013.
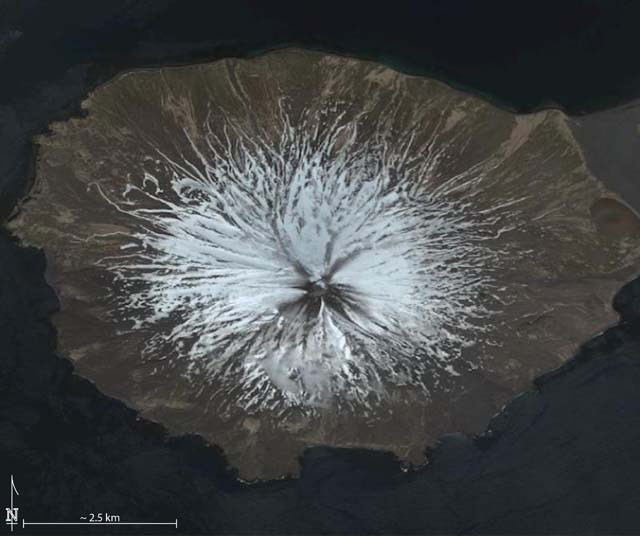 |
Figure 13. Satellite image of Cleveland collected on 9 June 2012 by the satellite Worldview-2. Snow persisted on the flanks during this time, but recent, minor ash deposits were visible around the summit crater. In this view, N is at the top of the image and the narrow isthmus connecting Cleveland to the rest of Chuginadak Island is at the R-hand side of the image (although not visible here). Courtesy of USGS-AVO and Digital Globe. |
During 2012-2013, at least two explosions were large enough to generate ash plumes that reached >4 km above the summit crater. Both were reported by the Anchorage Volcanic Ash Advisory Center (VAAC) on 7 April 2012 and 4 May 2013. The April event produced a plume that rose ~6 km a.s.l.; AVO reported that ash drifted E at 18 m/s. The 4 May 2013 event (figure 14) generated an ash plume that rose ~4.6 km a.s.l. Based on POES data and AVO observations, the ash drifted SE at ~10 m/s and dissipated within 5 hours.
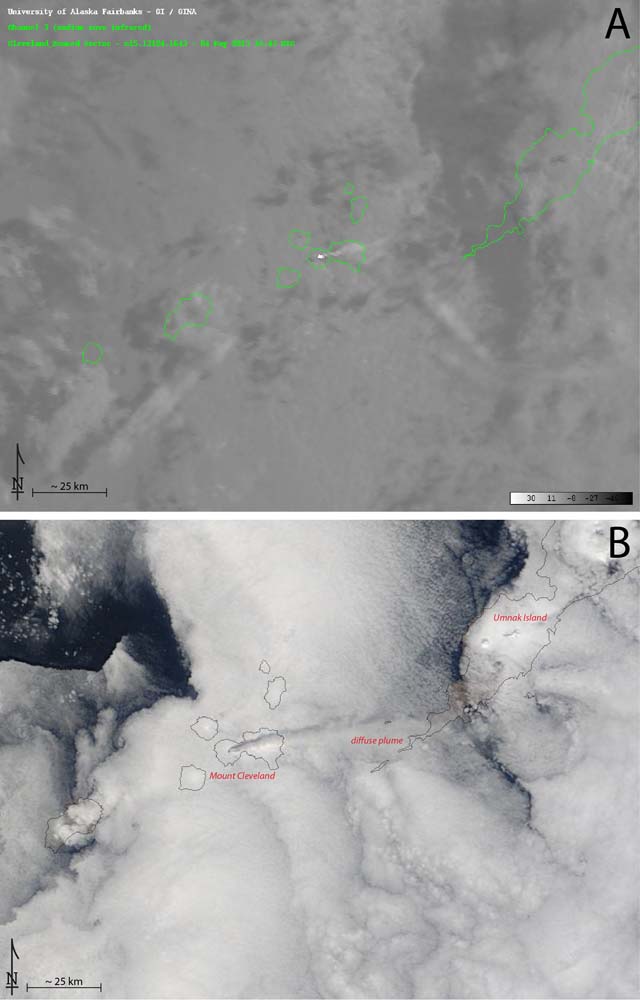 |
Figure 14. (A) AVHRR satellite image of Cleveland was taken at 0643 on 4 May 2013. This infrared image shows elevated temperatures that were present at Cleveland's summit and a small, low-level eruption plume containing minor amounts of ash trailed to the E. The thermal anomaly appears as a white dot in the center of the image. Courtesy of USGS-AVO/UAF-GI. (B) True-color Terra MODIS satellite image acquired at 2050 on 4 May 2013 shows an eruption plume from Cleveland. The diffuse ash plume extended from Cleveland's summit and across the SW point of Umnak Island. Courtesy of USGS-AVO and Land Atmosphere Near-real time Capability for EOS (LANCE) system operated by the NASA/GSFC/Earth Science Data and Information System (ESDIS). |
During 2012-2013, AVO reported that explosions were frequently attributed to dome destruction. Those events often completely removed the new lava domes from the crater (table 6).
Table 6. Cleveland's lava dome history during 2012-2013 based on a variety of observations of the Cleveland summit crater. Note that an earlier dome was destroyed during 25-29 December 2011 and was confirmed absent by 24 January 2012. Courtesy of USGS-AVO.
| New Dome Date | Observations |
| 30 Jan 2012 | 40 m across. Dome was gone by 11 March 2012. |
| 26 Mar 2012 | 70 m across. Dome was gone by 4 April 2012. |
| 25 Apr 2012 | 25 m across. Dome was gone some time before 29 April 2012. |
| 03 May 2012 | 25 m wide. Dome was gone by 6 May 2012. |
| 30 Jan 2013 | 100 m wide. Dome persisted through September 2013. |
More on elevated surface temperatures during 2012-2013. In addition to the case shown in figure 14A, thermal anomalies in the vicinity of Cleveland's summit crater were frequently detected during this reporting period. AVO inferred that these observations reflected a variety of volcanic activity such as fresh, hot tephra from recent explosions, the hot open conduit at the bottom of the summit crater, incandescent rock such as the above mentioned domes (table 6) at the surface, or hot volcaniclastic flow deposits on the flanks (figure 15).
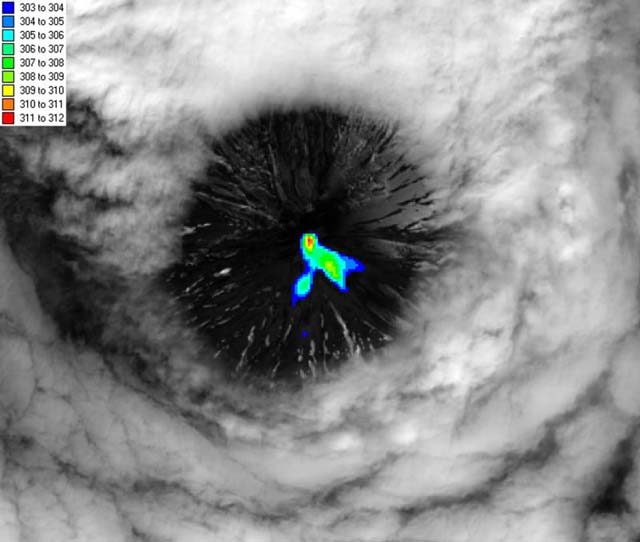 |
Figure 15. Composite image of the Cleveland summit area compiled from Landsat-8 images acquired on 8 June 2013. N is at the top of the image. Thermal infrared data are overlain onto a visible wavelength image; the extent of lava flows erupted during early May 2013 appears bright with colors corresponding to temperatures in the key (upper-L-hand corner). Temperature values are given in Kelvin, and range from 303-312 K (86-102 °F). The longest lava flows extended to ~715 m downslope from the summit. The summit was also covered by dark ash deposits and is surrounded by a low cloud deck. Courtesy of USGS-AVO. |
AVO reported that a satellite-based thermal alarm was triggered on 12 June 2012, attributed to the formation of hot lahars or rubble flows on Cleveland's flanks. While no lava dome was present at that time (see table 6), this was a significant event that transported debris to 700 m elevation on the NW flank (note that Cleveland has a summit elevation of 1,730 m). Other deposits, likely from other lahars, were mobilized on the NNW and NNE flanks. The deposits were mainly confined to drainages; deposits extended >1.5 km in length. Flowage features on the SE and SW flanks reached >1 km in length. AVO scientists also noted that all flanks had shown signs of melted snow but cautioned that the visual effect could also be attributed to non-eruptive remobilization of existing fragmental material on the steep flanks.
Volcaniclastic deposits were also noted based in satellite images on 10 November 2012. These features were located on the E flank and extended ~1 km down the slope.
References: De Angelis, S., Fee, D., Haney, M., and Schneider, D., 2012. Detecting hidden volcanic explosions from Mt. Cleveland Volcano, Alaska with infrasound and ground-coupled airwaves, Geophysical Research Letters, 39, L21312, doi:10.1029/2012GL053635.
Gardner, C.A. and Guffanti, M.C., 2006. U.S. Geological Survey's Alert Notification System for Volcanic Activity, USGS Fact Sheet 2006-3139.
Guffanti, M., and Miller, T., 2013. A volcanic activity alert-level system for aviation: review of its development and application in Alaska: Natural Hazards, 15 p., doi:0.1007/s11069-013-0761-4.
McGimsey, R.G., Neal, C.A., Dixon, J.P., and Ushakov, Sergey, 2007. 2005 Volcanic activity in Alaska, Kamchatka, and the Kurile Islands: Summary of events and response of the Alaska Volcano Observatory: U.S. Geological Survey Scientific Investigations Report 2007-5269, 94 p., available at http://pubs.usgs.gov/sir/2007/5269/.
Neal, C.A., McGimsey, R.G., Dixon, J.P., Cameron, C.E., Nuzhaev, A.A., and Chibisova, Marina, 2011. 2008 Volcanic activity in Alaska, Kamchatka, and the Kurile Islands: Summary of events and response of the Alaska Volcano Observatory: U.S. Geological Survey Scientific Investigations Report 2010-5243, 94 p., available at http://pubs.usgs.gov/sir/2010/5243.
Information Contacts: Alaska Volcano Observatory (AVO), a cooperative program of a)U.S. Geological Survey, 4200 University Drive, Anchorage, AK 99508-4667, USA (URL: http://www.avo.alaska.edu/), b)Geophysical Institute, University of Alaska, PO Box 757320, Fairbanks, AK 99775-7320, USA (URL: http://www.gi.alaska.edu/), and c)Alaska Division of Geological & Geophysical Surveys, 794 University Ave., Suite 200, Fairbanks, AK 99709, USA (URL: http://www.dggs.alaska.gov/); and Anchorage Volcanic Ash Advisory Center (VAAC), 6930 Sand Lake Road, Anchorage, AK 99502, USA (URL: http://vaac.arh.noaa.gov/list_vaas.php).
Multiple explosions and minor ash plumes continue into early June 2014
Cleveland experienced frequent minor ash emissions during January 2012-September 2013. During that reporting period activity was monitored by the seismic network on nearby Umnak Island (140 km NE) or through satellite imagery because there was no ground-based seismic instrumentation. In April 2012 and May 2013, explosion-generated ash plumes reached more than 4 km above the summit crater (BVGN 38:10). Some energetic eruptions were also accompanied by dome destruction and hot lahars that descended the flanks.
During October 2013-September 2014, the time period covered in this report, activity included short-duration explosions recorded by the Alaska Volcano Observatory's (AVO) infrasound or pressure sensors and the seismic network, and weakly elevated surface temperatures and plumes recorded by satellite imagery (table 7 and figure 16). The volcano Alert Level was raised to Watch (Aviation Color Code raised to Orange) during 2-9 January 2014 as a result of explosions creating minor ash plumes, but returned to Advisory (Yellow) on 10 January.
Table 7. Notable observations of Cleveland based on infrasound sensors and satellite imagery during October 2013-September 2014. Courtesy of AVO.
| Date | Time | Infrasound sensors | Satellite imagery |
| 02 Oct 2013 | 0424 | Short duration explosion. | -- |
| 05 Oct 2013 | -- | Continuous pressure waves; discrete small explosions. | -- |
| 13 Nov 2013 | -- | -- | Weakly elevated surface temperatures near summit. |
| 25 Nov 2013 | 1931 | Small, short duration explosion. | -- |
| 28 Dec 2013 | 1229 | Brief explosion. | Elevated temperatures. |
| 30 Dec 2013 | 1906 | Brief explosion. | Minor ash plumes detached from summit. |
| 01 Jan 2014 | 1900 | Explosion. | Minor ash plumes detached from summit. |
| 02 Feb 2014 | -- | -- | Weak elevated surface temperatures. |
| 17, 19, 20 Feb 2014 | -- | -- | Steam plume. |
| 24 Feb 2014 | 1917 | Explosion. | Small ash clouds; 5 km altitude. |
| 25 Feb 2014 | 0135 | Explosion. | Small ash clouds; 5 km altitude. |
| 05 Jun 2014 | 1008 | Explosion. | Small detached ash plume. |
| 06 Jun 2014 | 0004 | -- | Small, detached cloud with a weak ash signal. |
| 07 Jul 2014 | -- | -- | Weakly elevated surface temperatures. |
| 08-09 Jul 2014 | -- | -- | Vigorous steam and gas plume. |
| 20, 21, 26-31 Jul 2014 | -- | -- | Elevated surface temperature in summit crater. |
| 18 Aug 2014 | -- | -- | Elevated surface temperature. |
| 01-05 Sep 2014 | -- | -- | Thermal feature at summit. |
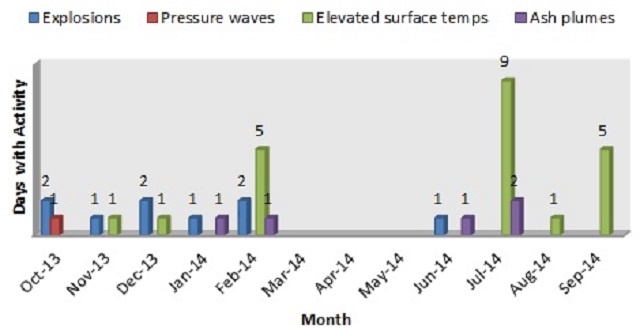 |
Figure 16. Graphical summary of activity at Cleveland, showing the days with observed activity during October 2013-Septamber 2014. Courtesy of AVO. |
Activity during October-December 2013. A small explosion was detected by infrasound sensors on 2 October 2013. The following two days, three total explosions were recorded. On 5 October continuous pressure waves likely due to gas jetting and discrete small explosions were recorded by infrasound sensors on Okmok, located on Umnak Island.
From October through the first three weeks of December, evidence of further ash emissions was absent from satellite imagery. After the two explosions on 28 and 30 December 2013, AVO stated ash clouds may have been generated but were not detected in satellite data.
Activity during January-March 2014. By 2 January 2014, AVO observed that Cleveland seemed to have entered a "renewed phase of elevated unrest." Ash plumes visible in satellite images extended 75-100 km N of the volcano. Subsequent analysis of the images concluded the plumes rose no more than 4.6 km altitude.
Following explosions in late February 2014, satellite observations showed deposits of ash and large lava blocks on the upper flank, 2.5 km from the summit. This indicated the February explosions were more energetic than those commonly observed over the past few years.
In the evening of 6 March, residents of Nikolski (located on Umnak Island) reported small bursts of ash rising less than 300 m above the summit. These small, brief, events were not detected by satellite imagery or by AVO seismic and infrasound networks.
Activity during June-September 2014. After two months of relative quiet, an explosion on 5 June was recorded by the Dillingham acoustic infrasound array and seismic stations at Korovin volcano, 288 km W. The event was reported to be short in duration and had a similar amplitude to explosions in past years. A detached cloud observed on 6 June had an altitude of 7.6 km, traveled 140 km SW, and subsequently dissipated.
During the week of 8 August 2014, scientists working near Cleveland observed steady gas-and-steam plumes emitted from the summit crater, and incandescence at the summit. According to AVO, on 15 August scientists reported "puffing activity consisting of steam and gas from the summit and vapor clouds over the volcano."
In mid-August, the National Science Foundation sent researchers to install two monitoring stations, powered by batteries and solar power, on Chugunadak Island 15 km from Cleveland's summit. This was the first time modern geological equipment had been placed in such close proximity to Mount Cleveland due to its remote location. Station CLES (Cleveland East) at the SE base of Cleveland hosts both broadband and short-period seismometers, along with two infrasound sensors. On the SE coast of Chuginadak (figure 17) station CLCO (Concord Point) consists of short-period seismometers, a web-camera, and an array of five infrasound sensors. The monitoring stations will provide real-time observations to scientists who have previously been relying solely on distant seismic networks and satellite data.
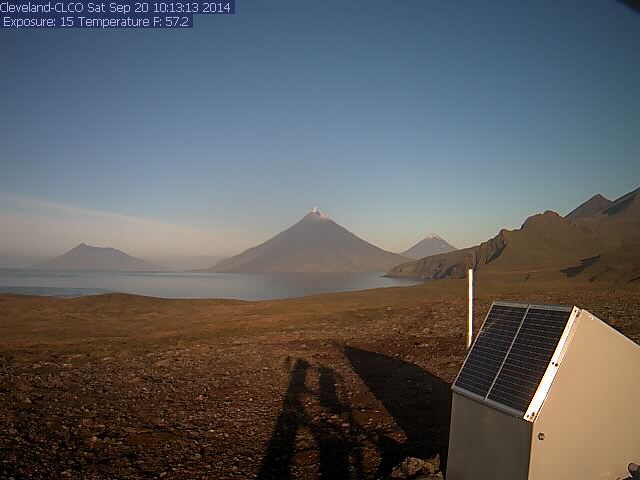 |
Figure 17. View of Cleveland on 20 September 2014 taken from the newly installed web camera located near Concord Point, Chuginadak Island. It looks WNW to Cleveland. Mount Herbert is visible on the far left, along with Mount Carlisle on the right. The camera turns on once an hour to capture three images. Courtesy of AVO. |
On the evening of 17 August, a steam plume was visible from the web camera at Station CLES, followed by another small steam plume the morning of 29 August.
Information Contacts: Alaska Volcano Observatory (AVO), a cooperative program of a) U.S. Geological Survey, 4200 University Drive, Anchorage, AK 99508-4667, USA (URL: http://www.avo.alaska.edu/), b) Geophysical Institute, University of Alaska, PO Box 757320, Fairbanks, AK 99775-7320, USA (URL: http://www.gi.alaska.edu/), and c) Alaska Division of Geological & Geophysical Surveys, 794 University Ave., Suite 200, Fairbanks, AK 99709, USA (URL: http://www.dggs.alaska.gov/)
Growth and destruction of six lava domes between June 2014 and February 2017
Large lava flows descend the flanks of Alaska's Cleveland volcano, located on Chuginadak Island in the Aleutians, slightly over 1,500 km SW of Anchorage (figure 18). However, dome growth and destruction by frequent small ash explosions have been more typical behavior in recent years; historical activity, including three large (VEI 3) eruptions, is recorded back to 1893. The Alaska Volcano Observatory (AVO) and the Anchorage Volcanic Ash Advisory Center (VAAC) are responsible for monitoring activity and notifying air traffic of aviation hazards associated with Cleveland. This report summarizes activity between July 2011 and June 2014, and provides details of activity from June 2014 through February 2017.
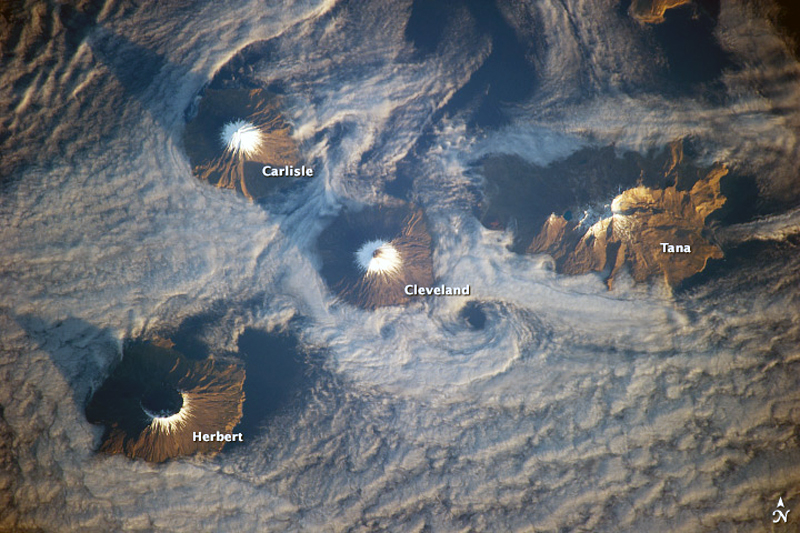 |
Figure 18. Morning sunlight illuminates the southeast-facing slopes of the Islands of the Four Mountains on 15 November 2013 in this photograph taken from the International Space Station (ISS). The islands, part of the Aleutian Island chain, are the upper slopes of volcanoes rising from the sea floor: Carlisle, Cleveland, Herbert, and Tana. Carlisle and Herbert volcanoes are distinct cones and form separate islands. Cleveland and the Tana volcanic complex form the eastern and western ends respectively of Chuginadak Island; clouds obscure the connecting land area. Astronaut photograph ISS038-E-3612 acquired with a Nikon D3S digital camera using a 400 mm lens, provided by the ISS Crew Earth Observations experiment and Image Science & Analysis Laboratory, Johnson Space Center. The image was taken by the Expedition 38 crew. It has been cropped and enhanced to improve contrast, and lens artifacts have been removed. Caption by William L. Stefanov, Jacobs at NASA-JSC. Courtesy of NASA Earth Observatory. |
Summary of activity during July 2011-June 2014. Dome growth and destruction characterized activity at Cleveland during 2011-2014. Eruptive episodes are challenging to determine due to weather conditions and the remoteness of the volcano; detectible ash plumes are intermittent, and thermal anomalies caused by dome growth are often obscured in satellite imagery. Seismic and infrasound data on explosions often provide valuable information. Dome growth was clearly documented between late July and October 2011 (BGVN 36:08, 37:01). An ash cloud observed on 29 December 2011 was followed by observations of dome growth in satellite data on 30 January 2012. Significant ash explosions occurred during April and June 2012 (BGVN 38:10). AVO also reported ash plumes on 12 July and 20 August 2012. Another small ash cloud was noted by AVO on 10 Nov 2012.
Details of the 2013 activity are provided in Dixon et al. (2015) and summarized here. Elevated temperatures in mid-January 2013 were followed by observations of a new lava dome that measured 100 m in diameter on 30 January 2013, and a second lava extrusion on 9 February. Elevated surface temperatures were intermittently observed until the next ash explosion on 4 May 2013, which was followed by a larger series of explosions on 6 May that filled the crater with tephra and created flowage deposits on the NE, E, and SE flanks. On 26 July, analysis of a satellite images suggested a new lava flow within the summit crater.
From August through 28 December 2013 the infrasound and seismic networks detected a number of additional explosions and periods of infrasonic tremor (see table 8 in Dixon et al., 2015). Most of these events did not have an accompanying ash signal in AVHRR satellite images, suggesting minor to no ash emissions. A detectible ash cloud on 30 December 2013 was preceded by strongly elevated surface temperature readings in the summit area on 28 December (BVGN 39:08). Ash plumes were again detected at the summit on 2 January, 25 February, and 6 March 2014. Cleveland was quiet for almost three months until an explosion on 5 June with a weak ash signal was detected.
Summary of activity during June 2014-February 2017. The growth and explosive destruction of six lava domes at Cleveland were recorded between June 2014 and February 2017. Although an explosion on 5 June 2014 was the last recorded explosion with confirmed ash until 14 June 2015, thermal and visual satellite evidence suggested dome growth activity during July-September and late November 2014. Weakly elevated surface temperatures at the summit were intermittent through February 2015. Minor ash deposits on the flanks were observed on 14 June 2015 in addition to stronger elevated surface temperatures, suggesting a new dome growth episode. An explosion on 21 July 2015 was thought to have destroyed the dome, and strongly elevated surface temperatures indicating new dome growth continued through July and August.
Moderately-elevated surface temperatures were detected at the summit in satellite data from January through 16 April 2016 when a new explosion was recorded. Satellite views in late April indicated that the August 2015 lava dome had been replaced with a small cinder cone within the summit crater. Explosions with no ash reported occurred twice in May, before the extrusion of a small amount of lava forming a new lava dome was observed on 17 May 2016, and which continued to grow for about one week. Moderately-elevated surface temperatures reappeared in mid-July, and field crews observed incandescence in a vent at the summit in late July. Satellite thermal anomalies were persistent from mid-May through September 2016. A new explosion on 24 October 2016 destroyed the dome emplaced in May; satellite views in November showed a deep pit within the summit crater. Weakly elevated surface temperatures reappeared in early December 2016. Moderately-elevated surface temperatures reappeared on 31 January 2017, [followed on 3 February by satellite observations that indicated] a new dome of similar size to earlier ones was once again filling the summit crater.
Activity during June 2014-February 2015. An ash-bearing explosion occurred in the late evening hours of 5 June 2014, resulting in a detached cloud with a weak ash signal observed in a satellite image that rapidly dissipated; no additional ash explosions were observed over the next 12 months. Weakly elevated surface temperatures were observed in satellite data on 7 July, and a vigorous steam-and-gas plume was observed on 8 and 9 July. Typical steam-and-gas emissions and persistent elevated surface temperatures in the summit crater were noted in satellite observations during clear periods through July and August, but AVO received no reports from pilots or mariners of any eruptive activity. Scientists working on the island in early August noted incandescence and puffing activity of steam and gas at the summit, and witnessed several small rockfall events. A newly installed webcam and other geophysical equipment at station CLCO near Concord Point on the SE coast of Chuginadak Island, about 15 km E of the volcano's summit, became operational in September 2014. In mid-September several rockfall signals were detected by the new local seismic network, and indicated the continued instability of volcanic debris on the steep upper flanks of the volcano.
Elevated surface temperatures were observed at the summit on clear days with occasional minor steaming visible in webcam images from late September to late October 2014. On 14 November AVO reported that vigorous steaming from the summit crater was observed in webcam images during the prior week, although they remarked that steam emissions are routinely observed at Cleveland and do not necessarily indicate an increase in unrest. On 28 November, they noted that a small mound of lava in the crater was observed in clear satellite views earlier that week that may have corresponded with the appearance of a faint thermal signal in the satellite data; the lava possibly extruded around 24 November. Satellite views on 19 December 2014 showed weakly elevated surface temperatures at the summit vent.
Low-density gas emissions and weakly elevated surface temperatures in the summit region were observed on 1 January 2015, and during clear weather up to 9 January. After this, nothing of note was observed in satellite or webcam images, and no significant activity was detected in seismic or infrasound (air pressure) data until weakly elevated surface temperatures were again detected in satellite data on 25 February. A low-level steam-and-gas plume emanated from the summit on 24 February, and again was identified in multiple satellite images on 28 February. During March, April, and May 2015, no significant activity, except for occasional steaming from the summit crater, was observed during periods of clear weather, causing AVO to downgrade both the Aviation Color Code (ACC) and the Volcano Alert Level (VAL) to Unassigned on 28 May 2015.
Activity during June 2015-March 2016. AVO issued a new VONA (Volcano Observatory Notice for Aviation) on 17 June 2015 returning the Aviation Color Code to Yellow (Yellow is 2nd lowest on a 4-color scale), and the Volcano Alert Level to Advisory (also 2nd lowest on a 4-level scale). This was based on satellite detection of elevated surface temperatures at the summit and an image from 14 June showing very minor ash deposits on the upper flanks. They interpreted the increase in temperature as consistent with renewed growth of the small lava dome within the crater. Elevated summit surface temperatures were again observed on 30 June, and during three clear days in early July. On 21 July AVO detected an explosion in both infrasound and seismic data, and raised the ACC to Orange and the VAL to WATCH. Satellite views were obscured by clouds, though a dusting of ash on the upper flanks was noted by a nearby field crew and recorded by the webcam later in the day. The explosion destroyed the dome that had formed in November 2014. Strongly elevated surface temperatures were recorded at the summit during the last week of July, including a thermal alert pixel from the MODVOLC system on 31 July.
Slightly elevated surface temperatures were recorded at the summit during the first week of August 2015. On 4 August, a field crew working in the area reported a small amount of lava covering the crater floor. Surface temperatures of the cooling lava measured by the crew were in the range of 550-600°C. Minor ash-and-gas emissions were also observed. A small explosion occurred on 6 August at 2203 AKDT, but no ash cloud was identified. Strongly elevated surface temperatures suggestive of lava effusion were noted in satellite data through 18 August, and weakly elevated temperatures were recorded for the rest of August and September. A small swarm of earthquakes was detected on 29 August.
AVO lowered the ACC to Yellow and the VAL to ADVISORY on 14 October 2015, citing the likely cessation of lava effusion, while minor steaming, weakly elevated surface temperatures, and slightly above-background seismicity continued through November 2015. Exceptionally clear weather during late November allowed many views of the volcano, showing only modest steaming from the summit. Elevated surface temperatures were detected twice during December, and an increase in frequency of small VT (Volcano-Tectonic) events was noted on 22 and 23 December, but otherwise no significant seismicity or emissions (other than steam plumes) were detected.
Moderately-elevated surface temperatures were detected at the beginning of the second week in January 2016, followed by several small earthquakes per day during the third week, and weakly elevated temperatures. Low-level seismicity and elevated surface temperatures were next observed during the last week of February; a brief burst of small local earthquakes was recorded on 28 February followed by weakly elevated surface temperatures during the first week of March. Moderately-elevated surface temperatures were again observed during the last week of March.
Activity during April-September 2016. A new explosion on 16 April 2016 was detected in both infrasound and seismic data, but satellite views were obscured by clouds. AVO raised the ACC to Orange until 29 April, when they noted that recent satellite imagery indicated that the August 2015 lava dome had been replaced with a small cinder cone within the summit crater; seismic activity remained lower after the explosion. Another explosion on 5 May at 1844 local time led AVO to raise the ACC back to Orange, although no ash emissions were observed above the cloud deck. A brief explosive event on 10 May was detected by pressure sensors near the volcano, and again no ash was reported.
A small volume of lava was extruded from the summit on 17 or 18 May, as confirmed in satellite data. The low-relief, 50-m-diameter dome was similar in size and shape to the ten domes observed since 2011, the most recent of which was extruded and destroyed earlier in May. During the week of 20 May, this lava dome enlarged to about 60 m in diameter. Dome growth appeared to have paused or ceased by 23 May. Weakly elevated surface temperatures were observed in mostly clear views by satellite on 25 and 26 May, which is consistent with the presence of the new lava dome. The Aviation Color Code was lowered from Orange to Yellow by AVO on 3 June when no other signs of eruptive activity were observed. Occasional clear satellite views detected weakly elevated surface temperatures that AVO interpreted as consistent with cooling lava during June 2016.
The MIROVA infrared data suggests ongoing thermal anomalies from late May through September 2016 (figure 19). AVO reported weakly-to-moderately-elevated surface temperatures reappearing during the second and third weeks of July. Field crews conducted an overflight during the last week of July and observed incandescence from a vent in the summit crater. Low-level steam plumes and minor degassing were observed a number of times during August. A small swarm of earthquakes occurred on 29 August; owing to the small number of telemetered seismometers on Cleveland, the locations and magnitudes of the earthquakes could not be determined precisely. Thermal anomalies were observed in satellite data during the last week of August and slightly elevated surface temperatures were observed on clear satellite images a number of times in September.
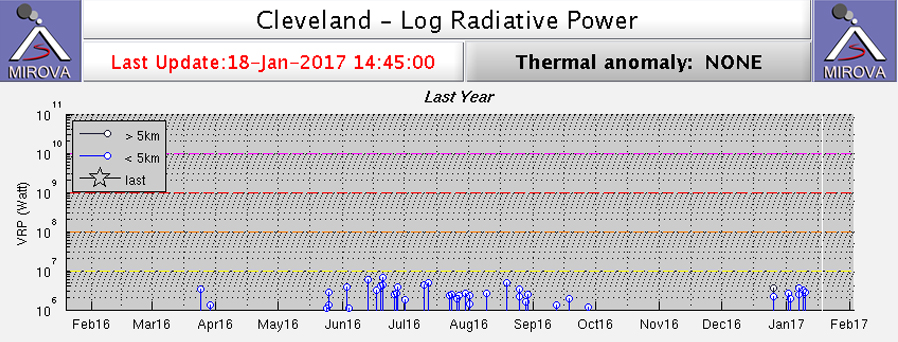 |
Figure 19. MIROVA data from 18 January 2016 to 18 January 2017 showing a persistent thermal anomaly from Cleveland starting about the time of the observation of the new lava dome (17 or 18 May) through late September 2016. A new thermal anomaly appears in late December 2016. AVO reported elevated surface temperatures on 6 January 2017. Courtesy of MIROVA. |
Activity during October 2016-February 2017. AVO detected an explosion at 1310 local time on 24 October 2016 that was heard by residents in Nikolski (75 km E), prompting AVO to raise the ACC to Orange and the VAL to WATCH. No evidence of an eruption cloud was detected above the weather cloud present at 8.5 km altitude, and no ashfall was reported in Nikolski. However, clear post-explosion webcam views of the volcano showed a darkened area around the summit crater which may have been the result of minor ash fallout. Narrow dark streaks were also observed extending down the upper snow-covered part of the edifice, which according to AVO may have been produced by small flows of meltwater and ash. They lowered the ACC back to Yellow on 4 November 2016. Satellite views from early November indicated that the lava dome emplaced in late May was mostly destroyed in the 24 October explosion, and was replaced with a deep pit within the summit crater. Minor steaming was observed from the summit during a few periods of clear weather in November.
Observations of weakly-elevated surface temperatures returned 8 and 9 December, with minor steaming at the summit observed on clear days. A MIROVA thermal anomaly signal reappeared around 25 December. This was followed by AVO's observation of weak-to-moderate elevated surface temperatures during first week of January 2017. Low-level steam plumes were seen on clear days later in the month. Moderately-elevated surface temperatures appeared in satellite data on 31 January. [On 3 February 2017 the appearance of a new dome] led AVO to raise the ACC to Orange. Satellite observations indicated that a new lava dome had been extruded and was partially filling the summit crater. The new dome was about 70 m in diameter and similar in size to previous lava domes that have developed on the floor of the crater.
References: Dixon, J.P., Cameron, C., McGimsey R.G., Neal, D.A., and Waythomas, C., 2015, 2013 Volcanic activity in Alaska-Summary of events and response of the Alaska Volcano Observatory: U.S. Geological Survey Scientific Investigations Report 2015-5110, 92 p., http://dx.doi.org/10.3133/sir20155110 .
Information Contacts: Alaska Volcano Observatory (AVO), a cooperative program of a) U.S. Geological Survey, 4200 University Drive, Anchorage, AK 99508-4667 USA (URL: http://www.avo.alaska.edu/), b) Geophysical Institute, University of Alaska, PO Box 757320, Fairbanks, AK 99775-7320, USA, and c) Alaska Division of Geological & Geophysical Surveys, 794 University Ave., Suite 200, Fairbanks, AK 99709, USA (URL: http://www.dggs.alaska.gov/); Anchorage Volcanic Ash Advisory Center (VAAC), Alaska Aviation Weather Unit, NWS NOAA US Dept of Commerce, 6930 Sand Lake Road, Anchorage, AK 99502-1845(URL: http://www.ssd.noaa.gov/); Hawai'i Institute of Geophysics and Planetology (HIGP), MODVOLC Thermal Alerts System, School of Ocean and Earth Science and Technology (SOEST), Univ. of Hawai'i, 2525 Correa Road, Honolulu, HI 96822, USA (URL: http://modis.higp.hawaii.edu/); MIROVA (Middle InfraRed Observation of Volcanic Activity), a collaborative project between the Universities of Turin and Florence (Italy) supported by the Centre for Volcanic Risk of the Italian Civil Protection Department (URL: http://www.mirovaweb.it/); NASA Earth Observatory, EOS Project Science Office, NASA Goddard Space Flight Center, Goddard, Maryland, USA (URL: http://earthobservatory.nasa.gov/).
Dome growth and destruction multiple times during January-November 2017
Dome growth and destruction accompanied by small ash explosions has been typical behavior at Alaska's Cleveland volcano in recent years (figures 20, 21, and 22). Located on Chuginadak Island in the Aleutians, slightly over 1,500 km SW of Anchorage, it has historical activity, including three large (VEI 3) eruptions, recorded back to 1893. The Alaska Volcano Observatory (AVO) and the Anchorage Volcanic Ash Advisory Center (VAAC) are responsible for monitoring activity and notifying air traffic of aviation hazards associated with Cleveland. This report provides a summary table of dome growth and destruction since 2013 (table 8), and details of continued activity from January through November 2017.
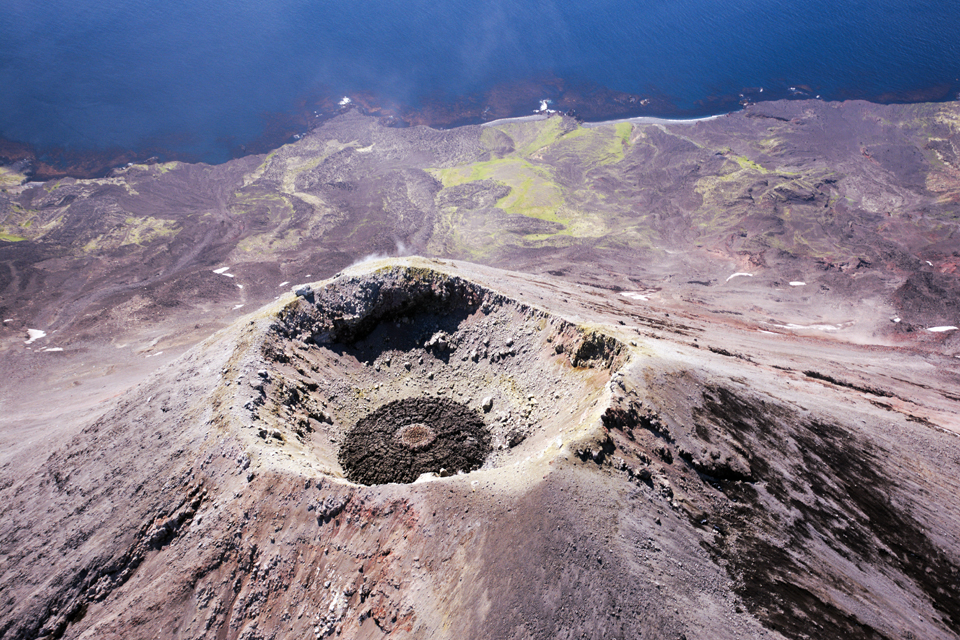 |
Figure 20. A lava dome was growing at the summit of Cleveland on 4 August 2015. Concentric rings and radial fractures in the dome surface surrounded an elevated hot dome. Photo taken during the 2015 field season of the Islands of Four Mountains multidisciplinary project, work funded by the National Science Foundation, the USGS/AVO, and the Keck Geology Consortium. Courtesy of AVO. |
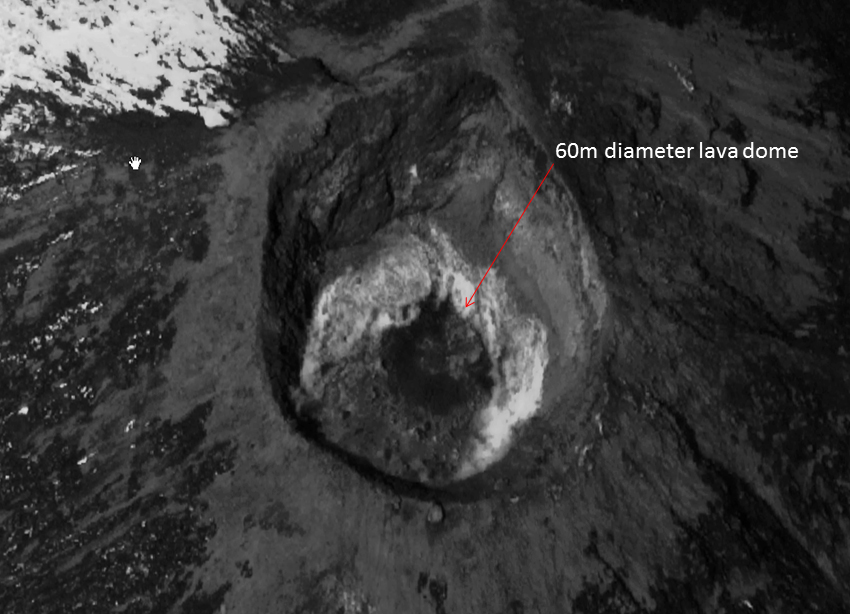 |
Figure 21. A 60-m-diameter lava dome was seen in this WorldView-1 satellite image from 25 May 2016 of Cleveland's summit crater. Image created by Rick Wessels, USGS. Image data copyright 2016 Digital Globe, NextView License. Courtesy of AVO. |
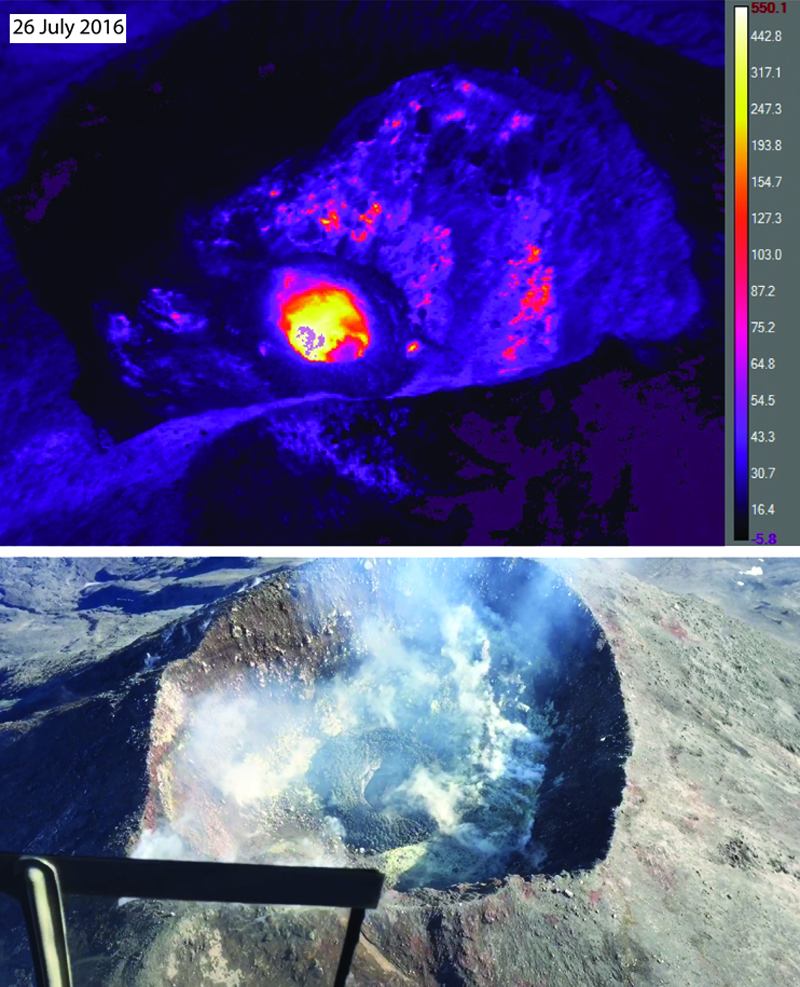 |
Figure 22. Thermal and photographic images of the lava dome that was growing in the summit crater of Cleveland on 26 July 2016. Top image is from a FLIR (Forward Looking InfraRed) camera, where warmer colors indicate hotter temperatures (scale is in Celsius); bottom image is a photograph of the summit crater, lava dome, and active fumaroles. AVO crew observed incandescence from the summit crater vent during this overflight. Courtesy of AVO. |
Table 8. Observations of dome growth and other crater activity at Cleveland, 2013-2017. Data extracted from AVO reports.
| Date | Dome Observations |
| Jan-Feb 2013 | New lava flow observed multiple times, 100 m across |
| 4-6 May 2013 | Explosions, ash cloud |
| Jun-Jul 2013 | Elevated temperatures, satellite imagery |
| 2-5 Oct 2013 | Explosions |
| 13 Nov 2013 | Elevated surface temperatures near summit |
| 25 Nov 2013 | Explosion |
| 28 Dec 2013 | Strongly elevated surface temperature near summit |
| 30 Dec 2013, 2 Jan 2014 | Small ash cloud visible; explosion with ash plume |
| Jan-25 Feb 2014 | Elevated surface temperatures near summit multiple times |
| 25 Feb 2014 | Two small explosions and ash clouds |
| 7 Mar-4 Jun 2014 | No detected activity |
| 5 Jun 2014 | Explosion |
| 7 Jul 2014-Aug 2014 | Intermittent weakly elevated surface temperatures at summit, vigorous steam plume, incandescence at summit during field visit |
| Late Aug-early Sep 2014 | Elevated surface temperatures in satellite data |
| 14, 24 Nov 2014 | Vigorous steaming observed in webcam; Satellite image shows small lava dome in summit crater |
| 5 Dec 2014-9 Jan 2015 | Minor steaming and weakly elevated surface temperatures at summit |
| 25, 28 Feb 2015 | Weakly elevated surface temperatures at summit, low level steam plume observed |
| 26 Mar 2015 | Small steam plume, no further activity until 14 June |
| 14 Jun 2015 | Ash cover on upper flanks |
| 17 Jun-21 Jul 2015 | Elevated surface temperatures at summit |
| 21 Jul 2015 | Explosion |
| 31 Jul, 4 Aug 2015 | Strongly elevated surface temperatures at summit, photograph (figure 20) of lava dome in summit crater |
| 6 Aug 2015 | Small explosion |
| Aug-Oct 2015 | Intermittent elevated surface temperatures at summit |
| 29 Aug 2015 | Seismic swarm |
| Sep-Nov 2015 | No Reported Activity |
| Dec 2015 | Elevated surface temperatures at summit |
| 22-23 Dec 2015 | Increased frequency of small VT events |
| Jan 2016 | Elevated surface temperatures at summit |
| 28 Feb 2016 | Brief burst of small local earthquakes |
| Mar-1 April 2016 | Elevated surface temperatures at summit |
| 16 April 2016 | Explosion |
| 6 and 10 May 2016 | Explosions |
| 17-25 May 2016 | Small lava dome observed (figure 21) |
| Jun-Jul 2016 | Elevated surface temperatures at summit |
| 26 Jul 2016 | Lava dome observed (figure 22) |
| Aug-21 Oct 2016 | Intermittent degassing, steam plumes, and elevated surface temperatures at summit |
| 24, 28 Oct 2016 | Explosion, ashfall observed |
| 5 Nov 2016-23 Mar 2017 | Elevated surface temperatures and intermittent steam emissions at summit. 3 Feb 2017 Satellite observation of lava dome |
| 24 Mar 2017 | Small explosion |
| Late Mar -15 May 2017 | Elevated surface temperatures at summit crater; Dome observed 15 April |
| 16 May 2017 | Explosion |
| 6-29 Jun 2017 | Small, low-frequency earthquakes on 6 Jun, elevated surface temperatures at summit crater several times during June |
| 4 Jul 2017 | Explosion |
| 7 Jul-21 Aug 2017 | Elevated surface temperatures at summit crater; satellite (July 14-21) and photographic (July 25-26) observations of lava dome at summit (figure 23) |
| 22 Aug 2017 | Explosion |
| Late Aug-24 Sep 2017 | Sporadic observations of elevated surface temperatures at summit crater |
| 26, 28 Sep 2017 | Explosions |
| 28 Sep-Oct 2017 | Elevated surface temperature at crater; lava effusion observed throughout October |
| 28, 30 Oct 2017 | Explosions |
| Early Nov 2017 | Elevated surface temperatures at crater |
| 14, 16 Nov 2017 | Explosions |
Lava dome extrusion may have been ongoing since early December 2016, when weakly elevated surface temperatures reappeared after the 24 October 2016 explosion. The lava dome was first observed in satellite imagery on 3 February 2017. Elevated surface temperatures were recorded throughout February and March 2017, and there was a small explosion on 24 March. Growth of a new dome was first observed on 15 April; it continued until being destroyed by an explosion on 16 May. Seismic data on 6 June and elevated temperatures on 7 June indicated growth of another dome, which continued until an explosion on 4 July 2017. There were multiple satellite and photographic observations of the growing dome during July and August; it was destroyed in an explosion on 22 August. Elevated surface temperatures were sporadically observed in early September. The next explosion took place on 26 September followed by two weaker ones on 28 September. Lava effusion was observed in satellite imagery throughout October. Small explosions on 28 and 30 October partly destroyed the lava dome. Elevated surface temperatures were recorded in early November along with small explosions on 14 and 16 November.
Activity during January-April 2017. While no activity was detected in infrasound or seismic data during January 2017, weakly elevated surface temperatures continued to be observed in infrequent clear satellite views (8 and 9 January), just as they were during 8-10 December and in infrared thermal data at the end of December (BGVN 42:04, figure 19). Low-level steam plumes were seen in clear views of the summit from the webcam during 15-19 and 21 January. Moderately elevated surface temperatures were observed in satellite data on 31 January 2017.
Satellite observations on 3 February 2017 confirmed the presence of a new lava dome at the bottom of the summit crater. The dome was about 70 m in diameter at that time, similar in size to previous domes. Observations in satellite imagery of weakly elevated surface temperatures at the summit continued during 7-9 February and during the last few days of the month. Minor steaming was seen in clear webcam images on 8 February. AVO noted that these observations were consistent with the presence of an active lava dome.
Minor steaming from the summit visible in clear webcam views, and slightly elevated surface temperatures in nighttime infrared satellite images, were present on several days during the first half of March. By the third week, surface temperatures were weakly to moderately elevated. At 0815 AKST (1615 UTC) on 24 March, a small explosion was detected in both seismic and infrasound (pressure sensor) data. This event was short-lived and similar to, if not smaller than, recent explosions. Cloud cover obscured observations by satellite. Slightly elevated surface temperatures were observed at the summit again during the last week of March.
No significant activity was detected in seismic, infrasound, or satellite data during the first two weeks of April 2017. A satellite image on 15 April, however, showed the presence of a small (less than 10-m-diameter) mound deep in the crater; the previous 75-m-diameter lava dome had been destroyed by the 24 March explosion. Satellite observations over the next several days indicated continued dome growth. Slightly elevated surface temperatures again appeared in a satellite view on 18 April. A satellite image on 23 April showed the dome partially filling the crater.
Activity during May-August 2017. Satellite images on 2 May showed that the lava dome was still active and had grown from about 15 m to more than 20 m in diameter. No further surface changes were evident on 8 May, indicating a pause or termination to the lava effusion. A short explosive eruption on 16 May at 1917 AKDT (17 May at 0317 UTC) was detected by local seismic instruments and lasted about 11 minutes. The resulting ash cloud rose to around 3.7-4.6 km altitude and was seen in satellite images to drift SW for about 5 hours. Satellite observations in the following days showed that the lava dome, built after the 24 March explosion, had been completely destroyed. Occasional clear webcam views showed steam emissions in the week following the 16 May explosion. Satellite imagery from 25 May suggested possible elevated surface temperatures at the summit while images from 26 May showed no change in the crater morphology since 16 May. No significant activity was detected in seismic or infrasound data for the remainder of May.
Evidence of possible lava effusion within the summit crater next appeared during the first week of June 2017. Small low-frequency earthquakes were detected on 6 June and elevated surface temperatures were observed in night-time satellite images on 7 June. Weakly elevated surface temperatures were observed in satellite images on 13, 19-23, and 29 June, and occasional clear webcam views of the summit showed light steaming. No activity was observed in seismic or infrasound data during the remainder of June.
A moderate explosive eruption lasting about ten minutes occurred early on the morning of 4 July at 0319 AKDT (1119 UTC). Elevated surface temperatures at the summit were visible after that on 7 and 14 July in satellite images, and occasional clear webcam views of the summit showed minor steaming. Satellite observations during 14-21 July revealed that a new dome, about 30 m in diameter and 10 m in height, had appeared at the bottom of the summit crater. Elevated surface temperatures were again observed on 22-24 July. New satellite observations between 21 and 28 July showed that the lava dome had reached about 42 m in diameter, with a slight inflation of its approximate height of 10 m. Minor steaming from the crater was seen in the webcam on 25 and 29-30 July; elevated surface temperatures were identified in satellite data on 30 July and 1 August. No activity was observed in seismic or infrasound data after the 4 July explosion for the remainder of the month.
Slow growth of the lava dome in the summit crater continued during the first few days of August 2017. Satellite observations showed that the dome surface area increased by about 75%, and covered an area of approximately 2,100 m2 (45 x 50 m) by 4 August. The height of the dome also increased due to intrusion of new lava. Elevated surface temperatures were observed in satellite data along with steam emissions from the summit crater seen in webcam images during periods of clear weather for the first few days of August, and again during 7-8 August. The small lava dome was observed during an overflight on 17 August (figure 23).
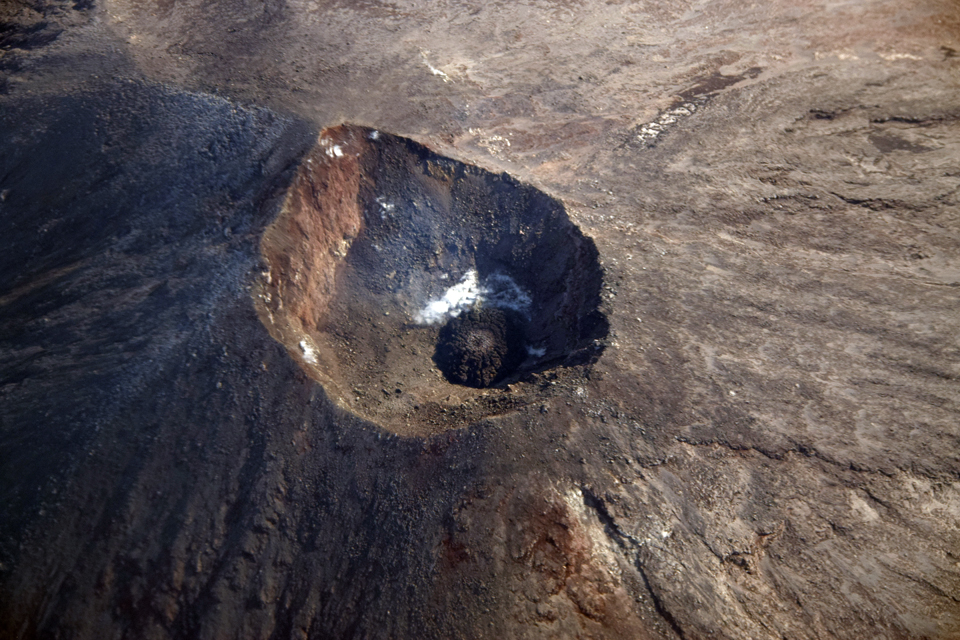 |
Figure 23. A small lava dome grew inside the summit crater of Cleveland on 17 August 2017. Photo by Janet Schaefer, courtesy of AVO/ADGGS (Alaska Volcano Observatory/Alaska Division of Geological & Geophysical Surveys). |
Minor degassing from the summit was seen in satellite and webcam images during 20-21 August. No explosive (ash-producing) activity was detected in seismic, infrasound, or webcam data in August until a 1-minute-long explosion on 22 August 2017 at 1043 AKDT (1843 UTC). Satellite data from 24 August indicated that the explosion destroyed the lava flow on the crater floor that had effused during July-August 2017. Explosion debris was evident on the crater floor, but no other changes to the summit area or flanks were noted. The 22 August explosion was detected by seismic and infrasound (air pressure) sensors, but no ash clouds were seen in satellite data. Nothing unusual was detected in seismic, infrasound, or satellite data for the remainder of August, except that elevated surface temperatures were observed sporadically in satellite data, suggesting that lava was present within the crater. A weak vapor plume was also sometimes visible at the summit in webcam images.
Activity during September-November 2017. Weakly elevated surface temperatures were observed in satellite data on 5 and 14 September 2017, along with minor steaming reported on 11, 17-19, and 22-24 September. These observations suggested to AVO the continued presence of lava in the crater. A small, short (three-minute-long) explosion was detected on local seismic and infrasound sensors at 1747 AKDT on 25 September (0147 on 26 September UTC) that produced a small volcanic cloud visible in satellite data about 30 minutes later with a height estimated at below 4.6 km altitude. Two weaker explosions were subsequently detected in infrasound and seismic data on 28 September (0516 and 0558 AKDT, 1319 and 1358 UTC), although no visible ash clouds were associated with these events. Weakly elevated surface temperatures during 28-30 September suggested that lava was present in the summit crater; a weak plume emanating from the crater could be seen when the summit was cloud-free.
Lava effusion in the crater was again noted in satellite data beginning on 30 September, forming a low dome that covered an area of about 4,200 m2 by 1 October 2017. Low-resolution satellite data from 6 October showed highly elevated surface temperatures, suggesting that slow growth of the dome continued. The dome doubled in size between 1 and 11 October when it appeared to cover an area of about 8,300 m2 and had approximate dimensions of 95 x 115 m. The number and intensity of elevated surface temperatures seen in satellite imagery declined during 7-13 October.
Satellite data from 15 October showed that the lava dome covered an area of about 9,500 m2 with dimensions of 100 x 125 m. There was no significant change in the size of the lava dome between 15 and 19 October based on satellite image analysis. On 16 October, satellite imagery revealed moderately elevated surface temperatures, and the webcam provided views of a small steam plume. Satellite data showed that the lava dome had grown further to about 110 x 140 m by 23 October and that surface temperatures were moderately elevated on 22 and 24 October. Small steam plumes were seen in webcam views during 22- 24 October. Small explosions on 28 and 30 October partly destroyed the dome within the summit crater. This was followed by slightly to moderately elevated surface temperatures occasionally observed in satellite imagery through the end of the month.
Moderately elevated surface temperatures were consistently observed in satellite imagery throughout the first half of November, suggesting new lava at or near the surface. Seismic and infrasound sensors detected a signal associated with low-level emissions shortly after midnight on 12 November. Two small explosions were also detected by the sensors on 14 and 16 November. These events were less energetic than those seen previously, and no volcanic cloud was observed following either explosion. A number of small earthquakes were detected on 14 November. Satellite observations of the summit indicated that a dome remained in the crater, and that the explosions were sourced from a vent in the middle of the dome. The satellite data showed no significant changes for the second half of November; although the volcano was obscured by cloud cover much of the time.
The infrared MIROVA thermal data for 2017 provided evidence that generally coincided with the satellite thermal observations of persistent heat production from dome growth throughout the year (figure 24).
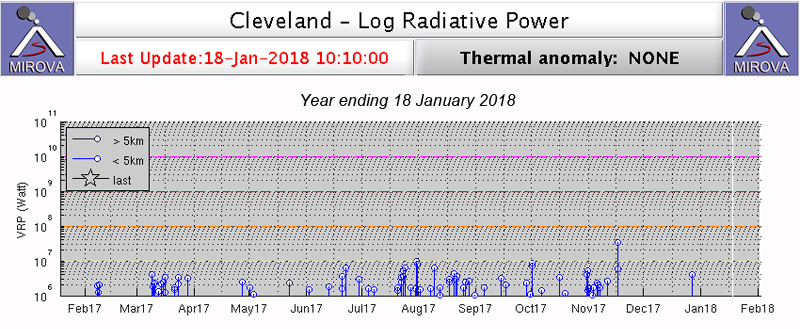 |
Figure 24. Infrared MODIS satellite data plotted with the MIROVA system shows intermittent thermal pulses from Cleveland for the year ending on 18 January 2018. Many of the spikes in thermal energy correspond to periods of satellite and photographic observation of dome growth. Courtesy of MIROVA. |
Information Contacts: Alaska Volcano Observatory (AVO), a cooperative program of a) U.S. Geological Survey, 4200 University Drive, Anchorage, AK 99508-4667 USA (URL: https://avo.alaska.edu/), b) Geophysical Institute, University of Alaska, PO Box 757320, Fairbanks, AK 99775-7320, USA, and c) Alaska Division of Geological & Geophysical Surveys, 794 University Ave., Suite 200, Fairbanks, AK 99709, USA (URL: http://www.dggs.alaska.gov/); Anchorage Volcanic Ash Advisory Center (VAAC), Alaska Aviation Weather Unit, NWS NOAA US Dept of Commerce, 6930 Sand Lake Road, Anchorage, AK 99502-1845 USA (URL: http://vaac.arh.noaa.gov/); MIROVA (Middle InfraRed Observation of Volcanic Activity), a collaborative project between the Universities of Turin and Florence (Italy) supported by the Centre for Volcanic Risk of the Italian Civil Protection Department (URL: http://www.mirovaweb.it/).
Ongoing episodes of lava effusion in the crater and explosions through July 2018
Cleveland, at the western end of the isolated Chuginadak Island in the Aleutian Islands, is characterized by frequent small explosions that are monitored using local seismic and infrasound sensors, and by elevated surface temperatures that are monitored by satellite-based infrared sensors. The current eruptive period began in April 2016 and has continued through at least July 2018. The Alaska Volcano Observatory (AVO) is responsible for monitoring, and issues regular reports describing activity.
Small explosions in mid-December 2017 were followed by elevated surface temperatures later in the month and a lava flow in the summit crater that began effusing on 5 January 2018 (table 9). Thermal anomalies and other signs of unrest continued through 24 February, when a small explosion was detected. Another explosion was reported on 2 March with a plume rising to 4.6 km altitude and drifting ENE. Satellite data continued to identify elevated temperatures in early March. Small explosions were identified using seismic and infrasound data on 14 March and 4 April. The ash cloud on 4 April rose to 4.6 km altitude and drifted SW; hot material was ejected onto the W flank.
Thermal anomalies were ongoing in June. A small circular lava flow (~80 m in diameter) in the summit crater was reported on 25 June; a thermal anomaly noted during 29 June-2 July extending SW downslope within the crater was consistent with a lava flow, according to AVO. Weakly elevated surface temperatures were reported on many days during 7-23 July, along with some small steam plumes (figure 25). A small deposit of blocks, within the summit crater and just below the E crater rim, seen using satellite imagery during 18-23 July suggested to AVO that there had been a very small explosion not recorded using seismic or pressure sensor monitors.
Table 9. Observations of dome growth and other crater activity at Cleveland, December 2017-July 2018. Note that the absence of observable activity from satellites is often due to cloud cover. Data courtesy of Alaska Volcano Observatory (AVO).
| Date | Observation |
| 13 Dec 2017 | Small explosion (0420); plume rising to 6.1 km and drifting E |
| 17 Dec 2017 | Small explosion (1817) |
| 27 Dec-01 Jan 2018 | Elevated surface temperatures |
| 19 Jan 2018 | New lava flow within summit crater since 5 January |
| 19-22 Jan 2018 | Elevated surface temperatures |
| 24-30 Jan 2018 | Unrest; possible cold vapor plume drifted S on 24 Jan; some slightly elevated surface temperatures during 26-30 Jan |
| 31 Jan-06 Feb 2018 | Unrest, moderately elevated surface temperatures |
| 07-13 Feb 2018 | Low-level unrest |
| 14-20 Feb 2018 | Low-level unrest; thermal anomalies during 15-17 Feb |
| 24 Feb 2018 | Small explosion (2154); several hours later satellite showed moderately elevated surface temperatures extending ~2 km from summit |
| 28 Feb-03 Mar 2018 | Elevated surface temperatures |
| 02 Mar 2018 | Small explosion (0557); plume rose to 4.6 km, drifted ENE |
| 07 Mar 2018 | Elevated surface temperatures on satellite images |
| 08 Mar 2018 | Seismicity slightly increased |
| 14 Mar 2018 | Small explosion in seismic and infrasound (2219), no visible ash plume |
| 04 Apr 2018 | Small explosion in seismic and infrasound (0355), hot material ejected on W flank and small ash cloud to 4.6 km drift SW |
| 04 Apr 2018 | Small, short-duration seismic event (~0600) coupled with small ash emission |
| 13 Apr 2018 | Small explosion (0759) in seismic and infrasound |
| 04 May 2018 | Small explosion (2149) in seismic and infrasound; small ash cloud to 6.7 km, drift SE |
| 6-12 Jun 2018 | Elevated surface temperatures |
| 11-12 Jun 2018 | Steam emissions |
| 13-19 Jun 2018 | Elevated surface temperatures |
| 25 Jun 2018 | Small, circular lava flow (~80 m in diameter) in summit crater |
| 29 Jun-02 Jul 2018 | Elevated surface temperatures; thermal anomaly extended SW |
| 07, 09-10 Jul 2018 | Weakly elevated surface temperatures; small steam cloud on 7 July |
| 11 Jul 2018 | Weakly elevated surface temperatures |
| 18-23 Jul 2018 | Weakly elevated surface temperatures; small deposit of blocks within the summit crater and just below the E crater rim |
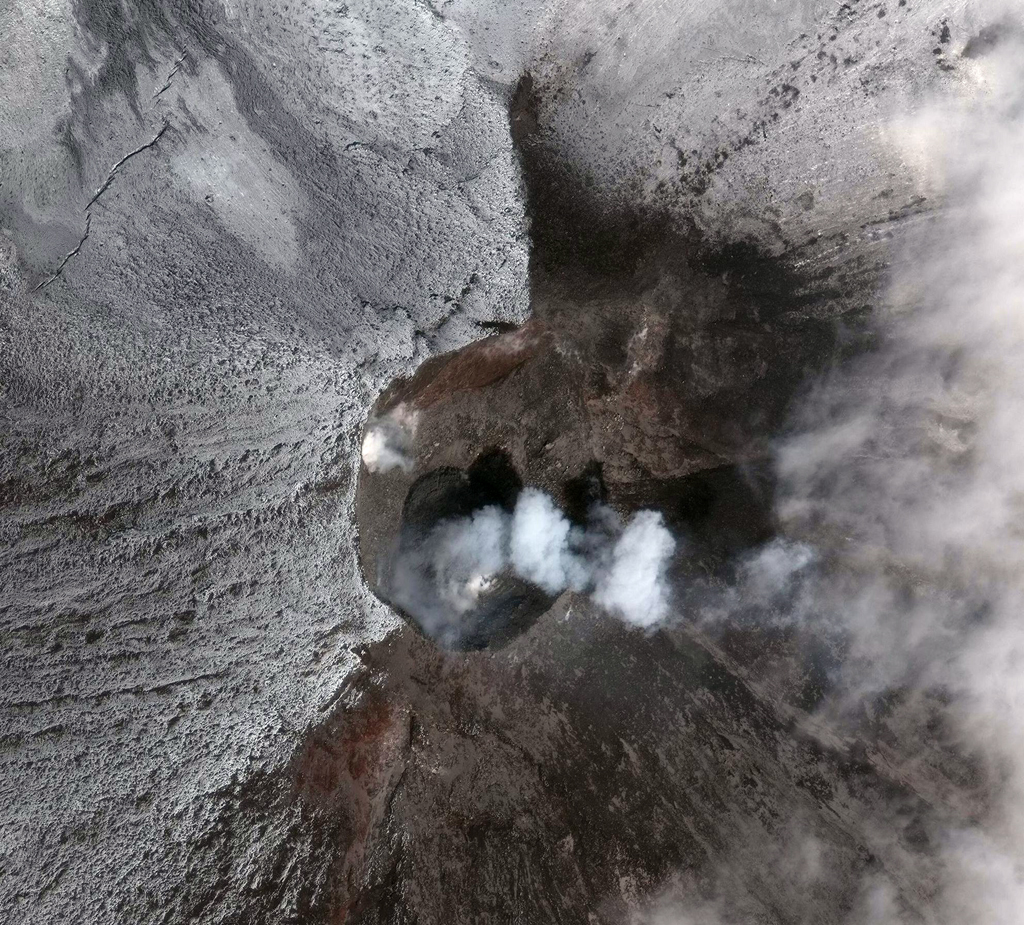 |
Figure 25. Worldwide-3 satellite image of the summit crater of Cleveland volcano on 10 July 2018. The 80-m-diameter circular lava flow extruded in late June 2018 can be seen as well as minor steam emissions. Courtesy of Alaska Volcano Observatory / U.S. Geological Survey (Image 117311, color adjusted). |
Information Contacts: Alaska Volcano Observatory (AVO), a cooperative program of a) U.S. Geological Survey, 4200 University Drive, Anchorage, AK 99508-4667 USA (URL: https://avo.alaska.edu/), b) Geophysical Institute, University of Alaska, PO Box 757320, Fairbanks, AK 99775-7320, USA, and c) Alaska Division of Geological & Geophysical Surveys, 794 University Ave., Suite 200, Fairbanks, AK 99709, USA (URL: http://www.dggs.alaska.gov/); Anchorage Volcanic Ash Advisory Center (VAAC), Alaska Aviation Weather Unit, NWS NOAA US Dept of Commerce, 6930 Sand Lake Road, Anchorage, AK 99502-1845 USA (URL: http://vaac.arh.noaa.gov/).
Intermittent dome growth and explosions with small ash plumes, July 2018-January 2019
Dome growth and destruction accompanied by small ash explosions have been typical behavior at Alaska's Cleveland volcano in recent years. Located on Chuginadak Island in the Aleutians, slightly over 1,500 km SW of Anchorage, it has historical activity, including three large (VEI 3) eruptions, recorded back to 1893. The Alaska Volcano Observatory (AVO) and the Anchorage Volcanic Ash Advisory Center (VAAC) are responsible for monitoring activity and notifying air traffic of aviation hazards associated with Cleveland. Its remoteness makes satellite imagery an important source of information for interpreting activity. This report covers continuing thermal and minor explosive activity during July 2018 through January 2019.
After evidence of a small lava dome on the floor of the summit crater appeared in late June 2018, weakly elevated surface temperatures were observed intermittently during July. A small deposit of fresh ejecta was observed in satellite data at the end of July. Weak and moderately elevated surface temperatures were observed during August and into September. A clear satellite image in mid-September confirmed the presence of a growing dome in the summit crater. No seismic or infrasound activity was reported in October or November, and persistent clouds mostly obscured satellite images. Four small explosions were reported during December 2018, two of them produced small ash plumes. A single explosion in early January produced a tephra deposit visible in satellite images, and a new dome was visible growing inside the crater during the middle of the month. Intermittent elevated surface temperatures were observed during the rest of January 2019, but no additional explosions were reported.
Low levels of unrest continued at Cleveland during July 2018. Elevated surface temperatures were detected through 3 July following the observation of a small lava dome on the floor of the summit crater on 25 June (BGVN 43:07). Weakly elevated surface temperatures were observed in high resolution satellite data on 11 July, and several times during the second half of the month when weather conditions were clear. Field crews working on Chuginadak Island on 19 July 2018 repaired the Cleveland web camera. Steaming at the summit was visible in both web camera and satellite images at times during the last week of July (figure 26). On 24 July, a small deposit of ballistic blocks was observed in satellite imagery within the summit crater and just below the eastern crater rim. These blocks suggested to AVO that minor explosive activity occurred at the summit that was below the detection threshold of the seismic and pressure sensors.
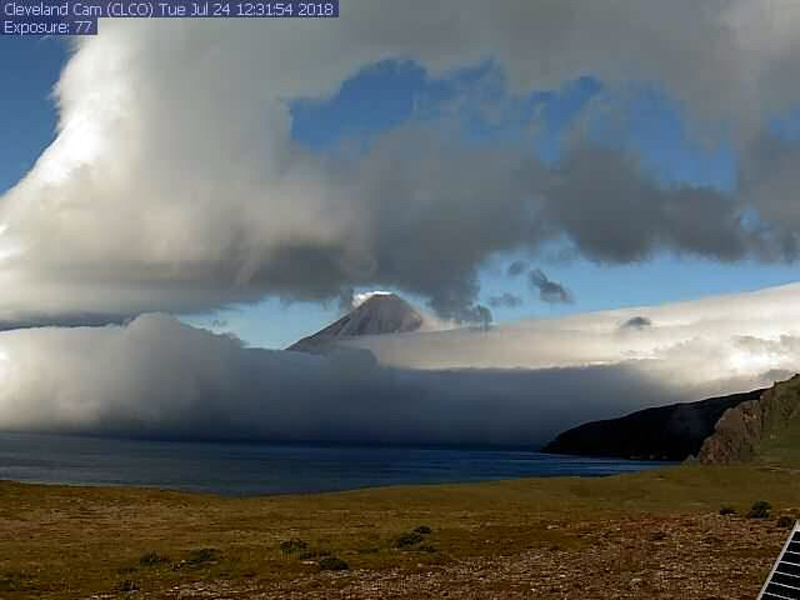 |
Figure 26. The Cleveland webcam captured a brief clear view of the often-cloudy summit, exhibiting minor steaming, on 24 July 2018. Image courtesy of AVO/USGS. |
No eruptive activity was detected during August. Moderately elevated surface temperatures were observed on 7 August and most days during the second week of the month. Occasional clear web camera views of the summit showed slight steam emissions. The Aviation Color Code was reduced from Orange to Yellow and the Volcano Alert Level to Advisory on 22 August 2018 after several weeks of only elevated surface temperatures in the summit area. Minor explosive activity had last been observed in late July and since that time there had been no evidence of lava extrusion in the summit crater. Elevated surface temperatures continued to be observed, however, during the last two weeks of the month.
Weakly elevated surface temperatures in the summit crater continued to be observed in satellite data during periods of clear weather in the first week of September. A few moderately elevated surface temperatures appeared in the second week, and continued during the third week of September. An unobscured satellite view on 10 September (figure 27) showed the first evidence of an emplaced lava dome within the crater. Temperatures were moderate to weakly elevated throughout the last week of the month. Satellite observations from 20 September suggested that the small collapse crater in the center of the summit dome emplaced over the summer was beginning to inflate, but clear evidence of new lava emplacement was not detected.
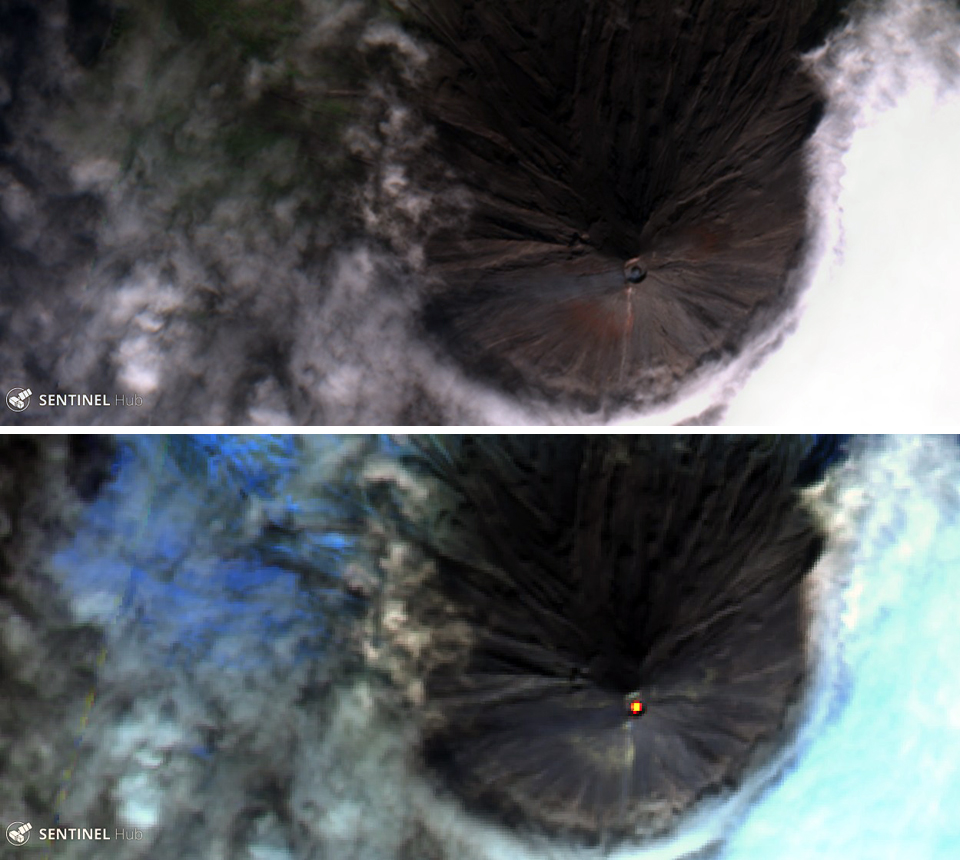 |
Figure 27. Cleveland volcano on 10 September 2018 showed evidence of an emplaced dome within the summit crater with both a natural color (bands 4,3,2) image of the summit (upper) and an atmospheric penetration image (bands 12, 11 and 8A) that shows the thermal anomaly from the summit dome. Courtesy of Sentinel Hub. |
No significant activity was detected in seismic or infrasound (pressure) sensor data during October or November 2018. Satellite views of the volcano were obscured by clouds for most of the time; elevated surface temperatures were observed in satellite data a few times in the last few days of October and during the first half of November; there were no observations of activity in mostly cloudy satellite images at the end of November.
Although a few satellite observations of elevated surface temperatures at the summit were made during the first week of December 2018, two small explosions occurred during the second week. The first happened on 8 December at 2355 AKST (0855 UTC on 9 December). The second, which had a higher peak seismic amplitude, occurred on 12 December at 1153 AKST (2053 UTC). No ash cloud was observed after either event, though satellite views were largely obscured by clouds at the time. The color code and Alert Level were raised to Orange/Watch after the second explosion. Elevated surface temperatures continued to be observed in satellite imagery at the volcano's summit during the second week. Another short-lived explosion occurred on 16 December at 0737 AKST (1637 UTC). A small ash cloud drifting NE was observed afterwards in satellite imagery. Elevated surface temperatures appeared following this explosion. Conditions were mostly cloudy for the remainder of December; occasional clear satellite views showed no further temperature anomalies. Local seismic sensors recorded a short-lived explosion at 1817 AKST on 28 December (0317 UTC 29 December). A pilot report indicated an ash plume from the event at 5.2 km altitude moving E.
Satellite images through 2 January 2019 showed that the explosion on 29 December enlarged the diameter of the summit crater by about 25 m and large ballistic blocks impacted the upper edifice N and E of the crater. After 10 days of diminished activity following the sequence of explosions in December, AVO reduced the Aviation Color Code to Yellow and the Volcano Alert Level to Advisory on 7 January 2019. On 9 January at 1015 AKST (1915 UTC) the single local seismic sensor recorded a small, short-lived explosion. A satellite image captured three hours after the event revealed a tephra deposit, a steam plume, and elevated temperature at the summit (figure 28). The explosion was not detected on regional infrasound arrays, nor was a volcanic cloud observed above the meteorological clouds at 3 km altitude.
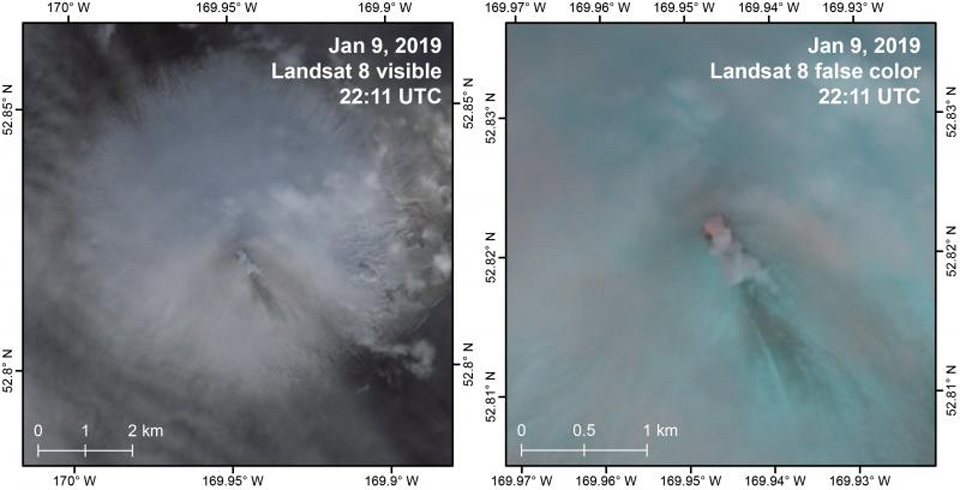 |
Figure 28. A Landsat 8 image acquired three hours after the explosion at Cleveland on 9 January 2019 revealed a small steam plume and tephra deposit in visible imagery (left), and heat at the crater in the short-wave infrared (SWIR) bands (right, pan-sharpened false color). The small deposit is consistent with the geophysical evidence for the small size of the explosion. Image created by Hannah Dietterich, courtesy of AVO/USGS and Landsat 8. |
Satellite data showed that starting around 12 January, a new and growing lava dome was present in the summit crater. It continued to grow slowly through 16 January. This prompted AVO to increase the Color Code to ORANGE and the Alert Level to WATCH on 17 January. Strongly elevated surface temperatures were observed in satellite imagery on 19 and 20 January, reflecting growth of a lava dome. The local infrasound array and a second seismic station near Cleveland that had been offline since 23 September 2018, returned data again briefly on 25 January. Weakly elevated surface temperatures were observed in satellite images during the last week of January. A steam plume was observed at the volcano during clear weather on 27 January. Satellite observations collected after 16 January showed the center of the newly emplaced lava dome slowly subsiding. No explosive activity was detected in regional seismic or infrasound data during the last week of the month.
The physically remote location of Cleveland in the Aleutians, and the often-unfavorable meteorological conditions that limit visible satellite observations make the thermal infrared data a valuable component of interpretations of activity. During July 2018 through January 2019 intermittent thermal signals were reported in the MIROVA graph (figure 29). A few of these signals (in September 2018 and January 2019) could be correlated to visual satellite images that confirmed growth of a summit lava dome.
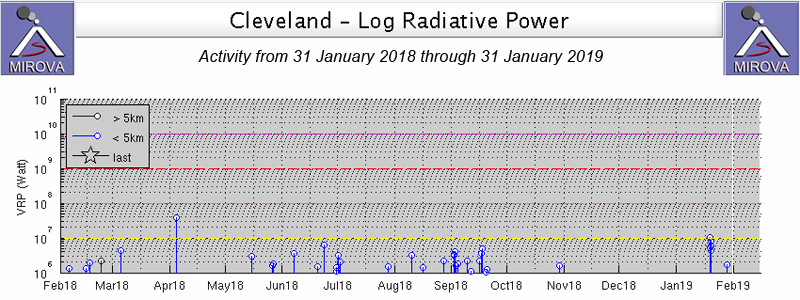 |
Figure 29. MIROVA data for the year ending on 31 January 2019 shows intermittent thermal anomalies at Cleveland volcano. Courtesy of MIROVA. |
Information Contacts: Alaska Volcano Observatory (AVO), a cooperative program of a) U.S. Geological Survey (USGS), 4200 University Drive, Anchorage, AK 99508-4667 USA (URL: https://avo.alaska.edu/), b) Geophysical Institute, University of Alaska, PO Box 757320, Fairbanks, AK 99775-7320, USA, and c) Alaska Division of Geological & Geophysical Surveys (ADGGS), 794 University Ave., Suite 200, Fairbanks, AK 99709, USA (URL: http://dggs.alaska.gov/); Sentinel Hub Playground (URL: https://www.sentinel-hub.com/explore/sentinel-playground); MIROVA (Middle InfraRed Observation of Volcanic Activity), a collaborative project between the Universities of Turin and Florence (Italy) supported by the Centre for Volcanic Risk of the Italian Civil Protection Department (URL: http://www.mirovaweb.it/).
Intermittent thermal anomalies and lava dome subsidence, February 2019-January 2020
Cleveland is a stratovolcano located in the western portion of Chuginadak Island, a remote island part of the east central Aleutians. Common volcanism has included small lava flows, explosions, and ash clouds. Intermittent lava dome growth, small ash explosions, and thermal anomalies have characterized more recent activity (BGVN 44:02). For this reporting period during February 2019-January 2020, activity largely consisted of gas-and-steam emissions and intermittent thermal anomalies within the summit crater. The primary source of information comes from the Alaska Volcano Observatory (AVO) and various satellite data.
Low levels of unrest occurred intermittently throughout this reporting period with gas-and-steam emissions and thermal anomalies as the dominant type of activity (figures 30 and 31). An explosion on 9 January 2019 was followed by lava dome growth observed during 12-16 January. Suomi NPP/VIIRS sensor data showed two hotspots on 8 and 14 February 2019, though there was no evidence of lava within the summit crater at that time. According to satellite imagery from AVO, the lava dome was slowly subsiding during February into early March. Elevated surface temperatures were detected on 17 and 24 March in conjunction with degassing; another gas-and-steam plume was observed rising from the summit on 30 March. Thermal anomalies were again seen on 15 and 28 April using Suomi NPP/VIIRS sensor data. Intermittent gas-and-steam emissions continued as the number of detected thermal anomalies slightly increased during the next month, occurring on 1, 7, 15, 18, and 23 May. A gas-and-steam plume was observed on 9 May.
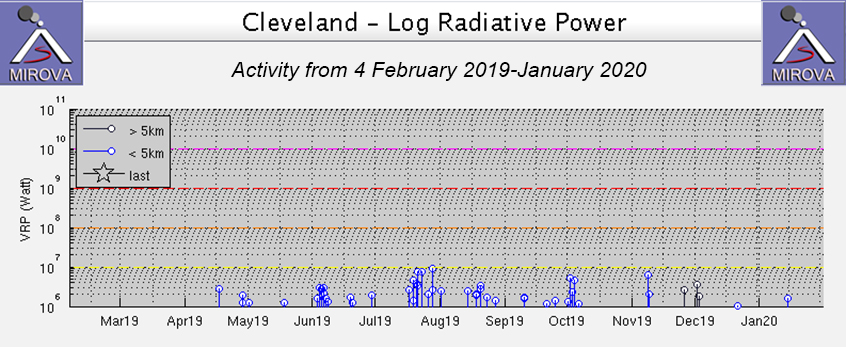 |
Figure 30. The MIROVA graph of thermal activity (log radiative power) at Cleveland during 4 February 2019 through January 2020 shows increased thermal anomalies between mid-April to late November 2019. Courtesy of MIROVA. |
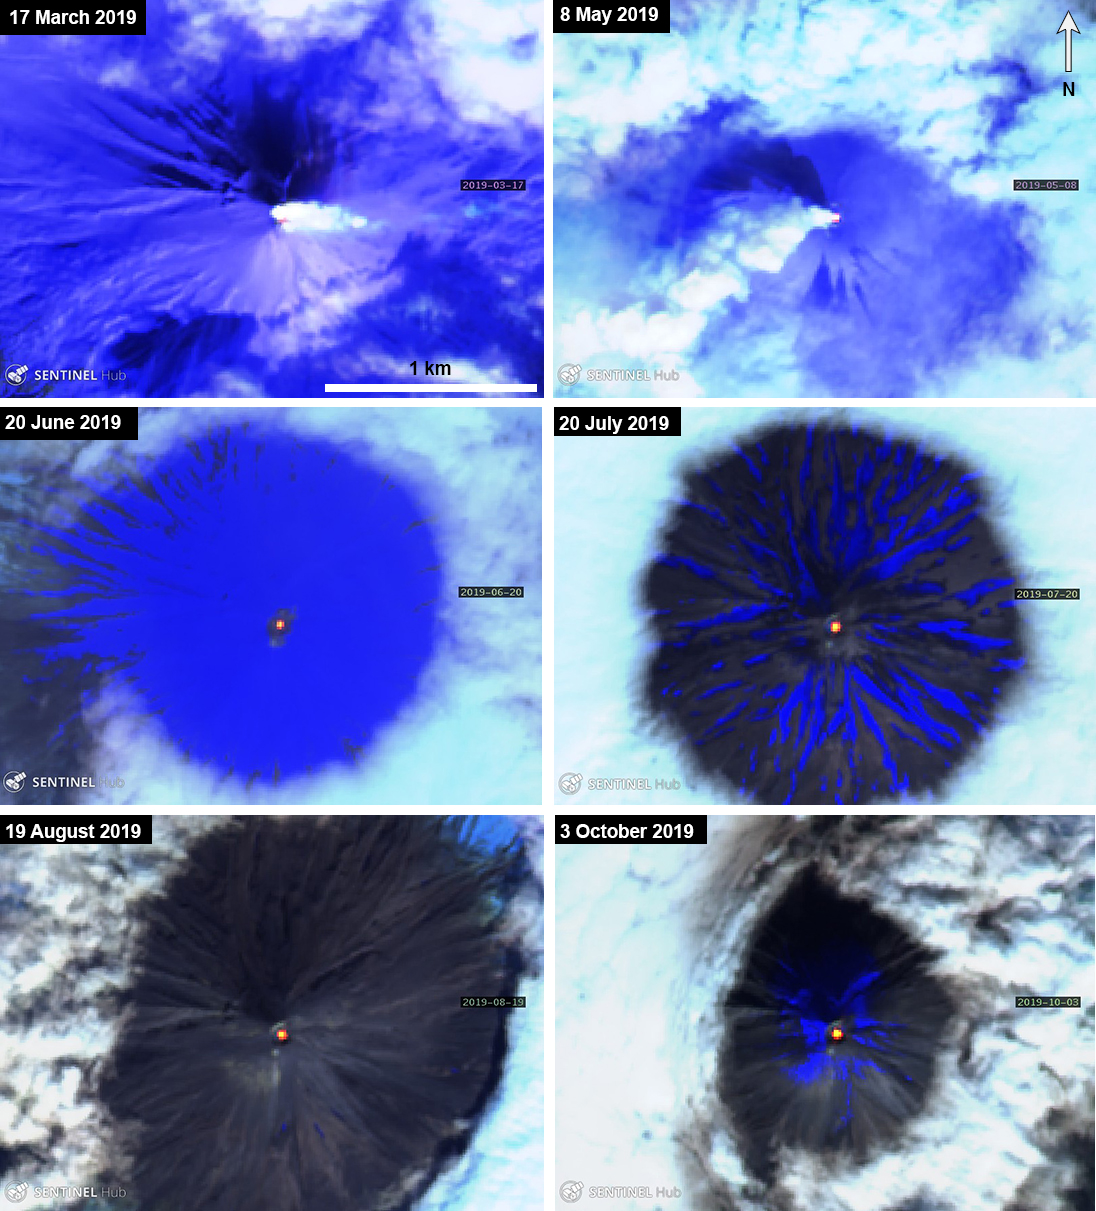 |
Figure 31. Sentinel-2 thermal satellite imagery (bands 12, 11, 8A) confirmed intermittent thermal signatures occurring in the summit crater during March 2019 through October 2019. Some gas-and-steam plumes were observed accompanying the thermal anomaly, as seen on 17 March 2019 and 8 May 2019. Courtesy of Sentinel Hub Playground. |
There were 10 thermal anomalies observed in June, and 11 each in July and August. Typical mild degassing was visible when photographed on 9 August (figure 32). On 14 August, seismicity increased, which included a swarm of a dozen local earthquakes. The lava dome emplaced in January was clearly visible in satellite imagery (figure 33). The number of thermal anomalies decreased the next month, occurring on 10, 21, and 25 September. During this month, a gas-and-steam plume was observed in a webcam image on 6, 8, 20, and 25 September. On 3-6, 10, and 21 October elevated surface temperatures were recorded as well as small gas-and-steam plumes on 4, 7, 13, and 20-25 October.
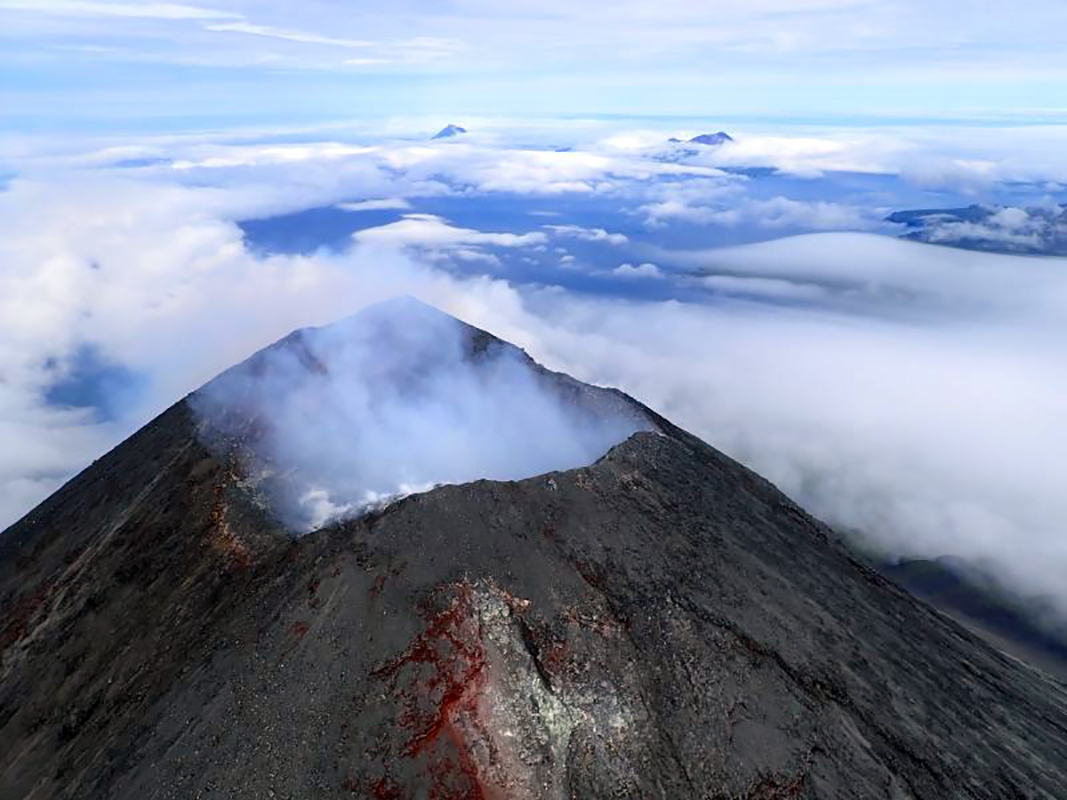 |
Figure 32. Photograph of Cleveland showing mild degassing from the summit vent taken on 9 August 2019. Photo by Max Kaufman; courtesy of AVO/USGS. |
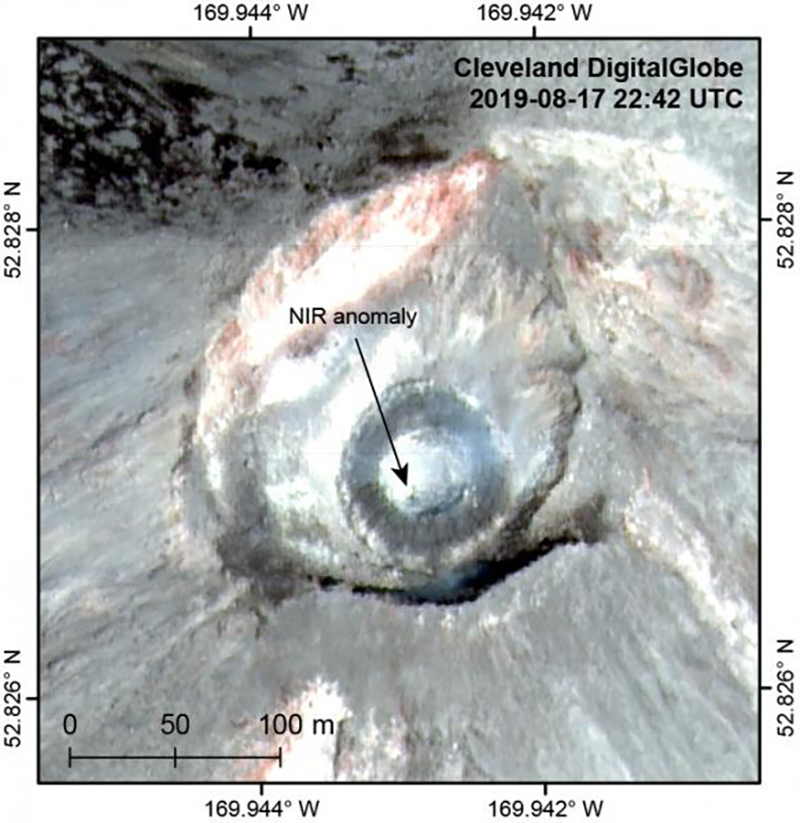 |
Figure 33. Satellite image of Cleveland showing faint gas-and-steam emissions rising from the summit crater. High-resolution image taken on 17 August 2019 showing the lava dome from January 2019 inside the crater (dark ring). Image created by Hannah Dietterich; courtesy of AVO/USGS and DigitalGlobe. |
Four thermal anomalies were detected on 3, 6, and 8-9 November. According to a VONA report from AVO on 8 November, satellite data suggested possible slow lava effusion in the summit crater; however, by the 15th no evidence of eruptive activity had been seen in any data sources. Another thermal anomaly was observed on 14 January 2020. Gas-and-steam emissions observed in webcam images continued intermittently.
MIROVA (Middle InfraRed Observation of Volcanic Activity) analysis of MODIS satellite data shows intermittent weak thermal anomalies within 5 km of the crater summit during mid-April through November 2019 with a larger cluster of activity in early June, late July and early October (figure 30). Thermal satellite imagery from Sentinel-2 also detected weak thermal anomalies within the summit crater throughout the reporting period, occasionally accompanied by gas-and-steam plumes (figure 31).
Information Contacts: Alaska Volcano Observatory (AVO), a cooperative program of a) U.S. Geological Survey, 4200 University Drive, Anchorage, AK 99508-4667 USA (URL: https://avo.alaska.edu/), b) Geophysical Institute, University of Alaska, PO Box 757320, Fairbanks, AK 99775-7320, USA, and c) Alaska Division of Geological & Geophysical Surveys, 794 University Ave., Suite 200, Fairbanks, AK 99709, USA (URL: http://dggs.alaska.gov/); MIROVA (Middle InfraRed Observation of Volcanic Activity), a collaborative project between the Universities of Turin and Florence (Italy) supported by the Centre for Volcanic Risk of the Italian Civil Protection Department (URL: http://www.mirovaweb.it/); Sentinel Hub Playground (URL: https://www.sentinel-hub.com/explore/sentinel-playground); NASA Worldview (URL: https://worldview.earthdata.nasa.gov/).
Explosion on 1 June 2020 produced an ash plume and destroyed the January 2019 lava dome
Cleveland is located in the western portion of Chuginadak Island, a remote island that is part of the east central Aleutians. Recent activity has been dominated by small ash explosions, intermittent lava dome growth, gas-and-steam emissions, and occasional thermal anomalies. The previous report described an ash explosion on 9 January 2019 that was followed by lava dome growth; by February the lava dome had begun to slowly subside (BGVN 45:03). This report covers activity during February-July 2020 using information primarily from the Alaska Volcano Observatory (AVO) and satellite data. According to AVO, local seismic, infrasound, and web camera data were unavailable due to an ongoing equipment failure.
Activity during February-May 2020 was relatively low and mainly consisted of weak gas-and-steam emissions and elevated surface temperatures near the summit, according to AVO. Sentinel-2 thermal satellite imagery highlights both gas-and-steam emissions and these higher surface temperatures near the summit crater (figure 34).
|
Figure 34. Sentinel-2 thermal satellite imagery of Cleveland showing a gas-and-steam plume (top left) and a weak thermal hotspot in the summit crater during late March to April 2020. Images using “Atmospheric penetration” (bands 12, 11, 8A) rendering; courtesy of Sentinel Hub Playground. |
According to AVO, infrasound sensors recorded a small explosion on 1 June at 2232 local time, producing an ash plume that rose to an altitude of 6.7 km and drifted S, though clouds prevented the detection of the ash plume at the time in satellite imagery. The explosion destroyed the January 2019 lava dome and ejected a large amount of material from the summit crater. AVO raised the Volcano Alert Level (VAL) to Watch (second highest of four) and the Aviation Color Code (ACC) to Orange (second highest of four). No significant volcanic activity was noted after the 1 June explosion, although a gas-and-steam plume was visible on 3 June rising from the ash-covered summit (figure 35). As a result, on 17 June AVO lowered the VAL to Advisory and the ACC to Yellow.
|
Figure 35. Photograph of Cleveland on 3 June 2020 (timestamp has been edited out due to new information. (14 Aug 2025)), showing gas-and-steam emissions and ash covering the summit. Photo by Burke Mees, courtesy of AVO. |
A comparison of images from before the 1 June event and afterwards showed initial ash deposits on the S flank on 4 June and ash and debris flow deposits on all flanks on 21 June (figure 36). Analysis of satellite imagery from 22 June revealed that ejecta had traveled as far as 1.4 km from the summit crater (figure 37). By that time volcanic debris flows had carried material 2.9 km down the E flank and more than 2.7 km down the N flank. This event also caused a thermal anomaly detected in the MIROVA (Middle InfraRed Observation of Volcanic Activity) analysis of MODIS satellite data.
|
Figure 36. Sentinel-2 satellite images showing Cleveland before the explosion on 1 June (top) and after the explosion (middle and bottom). The ash plume generated from the event resulted in ashfall dominantly on the SW flank (middle); volcanic debris flows mixed with ash descended all flanks (bottom). Images using “Natural color” (bands 4, 3, 2) rendering; courtesy of Sentinel Hub Playground. |
|
Figure 37. GeoEye-1 satellite image of Cleveland taken on 22 June 2020 (0000) showing the location of the ejected blocks and bombs (orange dots) produced from the 1 June explosion. These ejecta traveled as far as 1.3-1.4 km from the summit crater. Trace ashfall deposits are also observed, dominantly on the N and S flanks. Image prepared by Chris Waythomas, courtesy of AVO. |
Information Contacts: Alaska Volcano Observatory (AVO), a cooperative program of a) U.S. Geological Survey, 4200 University Drive, Anchorage, AK 99508-4667 USA (URL: https://avo.alaska.edu/), b) Geophysical Institute, University of Alaska, PO Box 757320, Fairbanks, AK 99775-7320, USA, and c) Alaska Division of Geological & Geophysical Surveys, 794 University Ave., Suite 200, Fairbanks, AK 99709, USA (URL: http://dggs.alaska.gov/); MIROVA (Middle InfraRed Observation of Volcanic Activity), a collaborative project between the Universities of Turin and Florence (Italy) supported by the Centre for Volcanic Risk of the Italian Civil Protection Department (URL: http://www.mirovaweb.it/); Sentinel Hub Playground (URL: https://www.sentinel-hub.com/explore/sentinel-playground).
|
|
||||||||||||||||||||||||||
There is data available for 22 confirmed eruptive periods.
2020 Jun 1 - 2020 Jun 1 Confirmed Eruption (Explosive / Effusive) VEI: 3
| Episode 1 | Eruption (Explosive / Effusive) | ||||||||||||||
|---|---|---|---|---|---|---|---|---|---|---|---|---|---|---|
| 2020 Jun 1 - 2020 Jun 1 | Evidence from Observations: Reported | |||||||||||||
|
List of 1 Events for Episode 1
|
||||||||||||||
[ 2019 Nov 7 - 2019 Dec 7 (?) ] Uncertain Eruption
| Episode 1 | Eruption (Explosive / Effusive) | ||||
|---|---|---|---|---|
| 2019 Nov 7 - 2019 Dec 7 (?) | Evidence from Observations: Reported | |||
2016 Apr 16 - 2019 Jan 20 ± 4 days Confirmed Eruption (Explosive / Effusive) VEI: 3
| Episode 1 | Eruption (Explosive / Effusive) | Summit crater | ||||||||||||||||||||||||||||||||||||||||||||||||||||||||||||||||||||||||||||||||||||||||||||||||||||||||||||
|---|---|---|---|---|---|---|---|---|---|---|---|---|---|---|---|---|---|---|---|---|---|---|---|---|---|---|---|---|---|---|---|---|---|---|---|---|---|---|---|---|---|---|---|---|---|---|---|---|---|---|---|---|---|---|---|---|---|---|---|---|---|---|---|---|---|---|---|---|---|---|---|---|---|---|---|---|---|---|---|---|---|---|---|---|---|---|---|---|---|---|---|---|---|---|---|---|---|---|---|---|---|---|---|---|---|---|---|---|---|
| 2016 Apr 16 - 2016 Sep 15 ± 5 days | Evidence from Observations: Reported | ||||||||||||||||||||||||||||||||||||||||||||||||||||||||||||||||||||||||||||||||||||||||||||||||||||||||||||
|
List of 20 Events for Episode 1 at Summit crater
|
|||||||||||||||||||||||||||||||||||||||||||||||||||||||||||||||||||||||||||||||||||||||||||||||||||||||||||||
| Episode 2 | Eruption (Explosive / Effusive) | Summit crater | ||||||||||||||||||||||||||||||||||||||||||||||||||||||||||||||||||||||||||||||||||||||||||||||||||||||||||||||||||||||||||||||||||||||||||||||||||||||||||||||||||||||||||||||||||||||||||||||||||||||||||||||||||||||||||||||||||||||||||||||||||||||||||||||||||||||||||||||||||||||||||||||||||||||||||||||||||||||||||||||||||||||||||||||||||||||||||||||||||||||||||||||||||||||||||||||||||||||||||||||||||||||||||||||||||||||||||||||||||||||||||||||||||||||||||||||||||||||||||||||||||||||||||||||||||||||||||||||||||||||||||||||||||||||||||||||||||||||||||||||||||||||||||||||||||||||||||||||||||||||||||||||||||||||||||||||||||||
|---|---|---|---|---|---|---|---|---|---|---|---|---|---|---|---|---|---|---|---|---|---|---|---|---|---|---|---|---|---|---|---|---|---|---|---|---|---|---|---|---|---|---|---|---|---|---|---|---|---|---|---|---|---|---|---|---|---|---|---|---|---|---|---|---|---|---|---|---|---|---|---|---|---|---|---|---|---|---|---|---|---|---|---|---|---|---|---|---|---|---|---|---|---|---|---|---|---|---|---|---|---|---|---|---|---|---|---|---|---|---|---|---|---|---|---|---|---|---|---|---|---|---|---|---|---|---|---|---|---|---|---|---|---|---|---|---|---|---|---|---|---|---|---|---|---|---|---|---|---|---|---|---|---|---|---|---|---|---|---|---|---|---|---|---|---|---|---|---|---|---|---|---|---|---|---|---|---|---|---|---|---|---|---|---|---|---|---|---|---|---|---|---|---|---|---|---|---|---|---|---|---|---|---|---|---|---|---|---|---|---|---|---|---|---|---|---|---|---|---|---|---|---|---|---|---|---|---|---|---|---|---|---|---|---|---|---|---|---|---|---|---|---|---|---|---|---|---|---|---|---|---|---|---|---|---|---|---|---|---|---|---|---|---|---|---|---|---|---|---|---|---|---|---|---|---|---|---|---|---|---|---|---|---|---|---|---|---|---|---|---|---|---|---|---|---|---|---|---|---|---|---|---|---|---|---|---|---|---|---|---|---|---|---|---|---|---|---|---|---|---|---|---|---|---|---|---|---|---|---|---|---|---|---|---|---|---|---|---|---|---|---|---|---|---|---|---|---|---|---|---|---|---|---|---|---|---|---|---|---|---|---|---|---|---|---|---|---|---|---|---|---|---|---|---|---|---|---|---|---|---|---|---|---|---|---|---|---|---|---|---|---|---|---|---|---|---|---|---|---|---|---|---|---|---|---|---|---|---|---|---|---|---|---|---|---|---|---|---|---|---|---|---|---|---|---|---|---|---|---|---|---|---|---|---|---|---|---|---|---|---|---|---|---|---|---|---|---|---|---|---|---|---|---|---|---|---|---|---|---|---|---|---|---|---|---|---|---|---|---|---|---|---|---|---|---|---|---|---|---|---|---|---|---|---|---|---|---|---|---|---|---|---|---|---|---|---|---|---|---|---|---|---|---|---|---|---|---|---|---|---|---|---|---|---|---|---|---|---|---|---|---|---|---|---|---|---|---|---|---|---|---|---|---|---|---|---|---|---|---|---|---|---|---|---|---|---|---|---|---|---|---|---|---|---|---|---|---|---|---|---|---|---|---|---|---|---|---|---|---|---|---|---|---|---|---|---|---|---|---|---|---|---|---|---|---|---|---|---|---|---|---|---|---|---|---|---|---|---|---|---|---|---|---|---|---|---|---|---|---|---|---|---|---|---|---|---|---|---|---|---|---|---|---|---|---|---|---|---|---|
| 2016 Oct 24 - 2018 Sep 28 (on or before) | Evidence from Observations: Reported | ||||||||||||||||||||||||||||||||||||||||||||||||||||||||||||||||||||||||||||||||||||||||||||||||||||||||||||||||||||||||||||||||||||||||||||||||||||||||||||||||||||||||||||||||||||||||||||||||||||||||||||||||||||||||||||||||||||||||||||||||||||||||||||||||||||||||||||||||||||||||||||||||||||||||||||||||||||||||||||||||||||||||||||||||||||||||||||||||||||||||||||||||||||||||||||||||||||||||||||||||||||||||||||||||||||||||||||||||||||||||||||||||||||||||||||||||||||||||||||||||||||||||||||||||||||||||||||||||||||||||||||||||||||||||||||||||||||||||||||||||||||||||||||||||||||||||||||||||||||||||||||||||||||||||||||||||||||
|
List of 124 Events for Episode 2 at Summit crater
|
|||||||||||||||||||||||||||||||||||||||||||||||||||||||||||||||||||||||||||||||||||||||||||||||||||||||||||||||||||||||||||||||||||||||||||||||||||||||||||||||||||||||||||||||||||||||||||||||||||||||||||||||||||||||||||||||||||||||||||||||||||||||||||||||||||||||||||||||||||||||||||||||||||||||||||||||||||||||||||||||||||||||||||||||||||||||||||||||||||||||||||||||||||||||||||||||||||||||||||||||||||||||||||||||||||||||||||||||||||||||||||||||||||||||||||||||||||||||||||||||||||||||||||||||||||||||||||||||||||||||||||||||||||||||||||||||||||||||||||||||||||||||||||||||||||||||||||||||||||||||||||||||||||||||||||||||||||||
| Episode 3 | Eruption (Explosive / Effusive) | Summit crater | ||||||||||||||||||||||||||||||||||||||||||||||||||||||||||||||||||||||||||||||
|---|---|---|---|---|---|---|---|---|---|---|---|---|---|---|---|---|---|---|---|---|---|---|---|---|---|---|---|---|---|---|---|---|---|---|---|---|---|---|---|---|---|---|---|---|---|---|---|---|---|---|---|---|---|---|---|---|---|---|---|---|---|---|---|---|---|---|---|---|---|---|---|---|---|---|---|---|---|---|---|
| 2018 Dec 8 - 2019 Jan 20 ± 4 days | Evidence from Observations: Reported | ||||||||||||||||||||||||||||||||||||||||||||||||||||||||||||||||||||||||||||||
|
List of 14 Events for Episode 3 at Summit crater
|
|||||||||||||||||||||||||||||||||||||||||||||||||||||||||||||||||||||||||||||||
2011 Jul 19 ± 7 days - 2015 Aug 18 Confirmed Eruption (Explosive / Effusive) VEI: 2
| Episode 1 | Eruption (Explosive / Effusive) | Summit crater | ||||||||||||||||||||||||||||||||||||||||||||||||||||||||||||||||||||||||||||||||||||||||||||||||||||||||||||||||||||||||||||||||||||||||||||||||||||||||||||||||||||||||||||||||||||||||||||||||||||||||||||||||||||||||||||||||||||||||||||||||||||||||||||||||||||||||||||||||||||||||||||||||||||||||||||||||||||||||||||||||||||||||||||||||||||||||||||||||||||||||||||||||
|---|---|---|---|---|---|---|---|---|---|---|---|---|---|---|---|---|---|---|---|---|---|---|---|---|---|---|---|---|---|---|---|---|---|---|---|---|---|---|---|---|---|---|---|---|---|---|---|---|---|---|---|---|---|---|---|---|---|---|---|---|---|---|---|---|---|---|---|---|---|---|---|---|---|---|---|---|---|---|---|---|---|---|---|---|---|---|---|---|---|---|---|---|---|---|---|---|---|---|---|---|---|---|---|---|---|---|---|---|---|---|---|---|---|---|---|---|---|---|---|---|---|---|---|---|---|---|---|---|---|---|---|---|---|---|---|---|---|---|---|---|---|---|---|---|---|---|---|---|---|---|---|---|---|---|---|---|---|---|---|---|---|---|---|---|---|---|---|---|---|---|---|---|---|---|---|---|---|---|---|---|---|---|---|---|---|---|---|---|---|---|---|---|---|---|---|---|---|---|---|---|---|---|---|---|---|---|---|---|---|---|---|---|---|---|---|---|---|---|---|---|---|---|---|---|---|---|---|---|---|---|---|---|---|---|---|---|---|---|---|---|---|---|---|---|---|---|---|---|---|---|---|---|---|---|---|---|---|---|---|---|---|---|---|---|---|---|---|---|---|---|---|---|---|---|---|---|---|---|---|---|---|---|---|---|---|---|---|---|---|---|---|---|---|---|---|---|---|---|---|---|---|---|---|---|---|---|---|---|---|---|---|---|---|---|---|---|---|---|---|---|---|---|---|---|---|---|---|---|---|---|---|---|---|---|---|---|---|---|---|---|---|---|---|---|---|---|---|---|---|---|---|---|---|---|---|---|---|---|---|---|---|---|---|---|---|---|---|---|---|
| 2011 Jul 19 ± 7 days - 2012 Aug 19 | Evidence from Observations: Reported | ||||||||||||||||||||||||||||||||||||||||||||||||||||||||||||||||||||||||||||||||||||||||||||||||||||||||||||||||||||||||||||||||||||||||||||||||||||||||||||||||||||||||||||||||||||||||||||||||||||||||||||||||||||||||||||||||||||||||||||||||||||||||||||||||||||||||||||||||||||||||||||||||||||||||||||||||||||||||||||||||||||||||||||||||||||||||||||||||||||||||||||||||
|
List of 72 Events for Episode 1 at Summit crater
|
|||||||||||||||||||||||||||||||||||||||||||||||||||||||||||||||||||||||||||||||||||||||||||||||||||||||||||||||||||||||||||||||||||||||||||||||||||||||||||||||||||||||||||||||||||||||||||||||||||||||||||||||||||||||||||||||||||||||||||||||||||||||||||||||||||||||||||||||||||||||||||||||||||||||||||||||||||||||||||||||||||||||||||||||||||||||||||||||||||||||||||||||||
| Episode 2 | Eruption (Explosive / Effusive) | Summit crater | |||||||||||||||||||||||||||||||||||||||||||||||||||||||||||||||
|---|---|---|---|---|---|---|---|---|---|---|---|---|---|---|---|---|---|---|---|---|---|---|---|---|---|---|---|---|---|---|---|---|---|---|---|---|---|---|---|---|---|---|---|---|---|---|---|---|---|---|---|---|---|---|---|---|---|---|---|---|---|---|---|---|
| 2012 Nov 10 - 2013 Feb 9 (on or after) | Evidence from Observations: Reported | |||||||||||||||||||||||||||||||||||||||||||||||||||||||||||||||
|
List of 11 Events for Episode 2 at Summit crater
|
||||||||||||||||||||||||||||||||||||||||||||||||||||||||||||||||
| Episode 3 | Eruption (Explosive / Effusive) | Summit Crater | |||||||||||||||||||||||||||||||||||||||||||||||||||||||||||||||||||||||||
|---|---|---|---|---|---|---|---|---|---|---|---|---|---|---|---|---|---|---|---|---|---|---|---|---|---|---|---|---|---|---|---|---|---|---|---|---|---|---|---|---|---|---|---|---|---|---|---|---|---|---|---|---|---|---|---|---|---|---|---|---|---|---|---|---|---|---|---|---|---|---|---|---|---|---|
| 2013 May 4 - 2013 Jul 26 ± 5 days | Evidence from Observations: Reported | |||||||||||||||||||||||||||||||||||||||||||||||||||||||||||||||||||||||||
|
List of 13 Events for Episode 3 at Summit Crater
|
||||||||||||||||||||||||||||||||||||||||||||||||||||||||||||||||||||||||||
| Episode 4 | Eruption (Explosive / Effusive) | Summit Crater | |||||||||||||||||||||||||||||||||||||||||||||||||||||||||||||||||||||||||||||||||||||||||||||||||||||||
|---|---|---|---|---|---|---|---|---|---|---|---|---|---|---|---|---|---|---|---|---|---|---|---|---|---|---|---|---|---|---|---|---|---|---|---|---|---|---|---|---|---|---|---|---|---|---|---|---|---|---|---|---|---|---|---|---|---|---|---|---|---|---|---|---|---|---|---|---|---|---|---|---|---|---|---|---|---|---|---|---|---|---|---|---|---|---|---|---|---|---|---|---|---|---|---|---|---|---|---|---|---|---|---|---|
| 2013 Oct 2 - 2014 Mar 6 | Evidence from Observations: Reported | |||||||||||||||||||||||||||||||||||||||||||||||||||||||||||||||||||||||||||||||||||||||||||||||||||||||
|
List of 19 Events for Episode 4 at Summit Crater
|
||||||||||||||||||||||||||||||||||||||||||||||||||||||||||||||||||||||||||||||||||||||||||||||||||||||||
| Episode 5 | Eruption (Explosive / Effusive) | Summit Crater | ||||||||||||||||||||||||||||||||||||||||||||||||||||||||||||||||||||||||||||||
|---|---|---|---|---|---|---|---|---|---|---|---|---|---|---|---|---|---|---|---|---|---|---|---|---|---|---|---|---|---|---|---|---|---|---|---|---|---|---|---|---|---|---|---|---|---|---|---|---|---|---|---|---|---|---|---|---|---|---|---|---|---|---|---|---|---|---|---|---|---|---|---|---|---|---|---|---|---|---|---|
| 2014 Jun 5 - 2015 Mar 27 (on or before) | Evidence from Observations: Reported | ||||||||||||||||||||||||||||||||||||||||||||||||||||||||||||||||||||||||||||||
|
List of 14 Events for Episode 5 at Summit Crater
|
|||||||||||||||||||||||||||||||||||||||||||||||||||||||||||||||||||||||||||||||
| Episode 6 | Eruption (Explosive / Effusive) | Summit Crater | |||||||||||||||||||||||||||||||||||||||||||||||||||||||||||||||||||||||||||||||||||||||||||||||||||||||||||||||||||||||||||||||||||||||||||||||||||||||||
|---|---|---|---|---|---|---|---|---|---|---|---|---|---|---|---|---|---|---|---|---|---|---|---|---|---|---|---|---|---|---|---|---|---|---|---|---|---|---|---|---|---|---|---|---|---|---|---|---|---|---|---|---|---|---|---|---|---|---|---|---|---|---|---|---|---|---|---|---|---|---|---|---|---|---|---|---|---|---|---|---|---|---|---|---|---|---|---|---|---|---|---|---|---|---|---|---|---|---|---|---|---|---|---|---|---|---|---|---|---|---|---|---|---|---|---|---|---|---|---|---|---|---|---|---|---|---|---|---|---|---|---|---|---|---|---|---|---|---|---|---|---|---|---|---|---|---|---|---|---|---|---|---|---|---|
| 2015 Jun 14 - 2015 Aug 18 | Evidence from Unknown | |||||||||||||||||||||||||||||||||||||||||||||||||||||||||||||||||||||||||||||||||||||||||||||||||||||||||||||||||||||||||||||||||||||||||||||||||||||||||
|
List of 29 Events for Episode 6 at Summit Crater
|
||||||||||||||||||||||||||||||||||||||||||||||||||||||||||||||||||||||||||||||||||||||||||||||||||||||||||||||||||||||||||||||||||||||||||||||||||||||||||
[ 2010 Sep 11 - 2010 Sep 12 ] Uncertain Eruption
| Episode 1 | Eruption (Explosive / Effusive) | |||||||||||||||||||||||||||||||||||||||
|---|---|---|---|---|---|---|---|---|---|---|---|---|---|---|---|---|---|---|---|---|---|---|---|---|---|---|---|---|---|---|---|---|---|---|---|---|---|---|---|
| 2010 Sep 11 - 2010 Sep 12 | Evidence from Observations: Satellite (infrared) | ||||||||||||||||||||||||||||||||||||||
|
List of 6 Events for Episode 1
|
|||||||||||||||||||||||||||||||||||||||
2010 May 30 - 2010 Jun 2 (?) Confirmed Eruption (Explosive / Effusive) VEI: 2
| Episode 1 | Eruption (Explosive / Effusive) | Summit crater | ||||||||||||||||||||||||||||
|---|---|---|---|---|---|---|---|---|---|---|---|---|---|---|---|---|---|---|---|---|---|---|---|---|---|---|---|---|---|
| 2010 May 30 - 2010 Jun 2 (?) | Evidence from Observations: Reported | ||||||||||||||||||||||||||||
|
List of 4 Events for Episode 1 at Summit crater
|
|||||||||||||||||||||||||||||
2009 Oct 2 - 2009 Dec 12 (?) Confirmed Eruption (Explosive / Effusive) VEI: 2
| Episode 1 | Eruption (Explosive / Effusive) | ||||||||||||||||||||||||
|---|---|---|---|---|---|---|---|---|---|---|---|---|---|---|---|---|---|---|---|---|---|---|---|---|
| 2009 Oct 2 - 2009 Dec 12 (?) | Evidence from Observations: Reported | |||||||||||||||||||||||
|
List of 3 Events for Episode 1
|
||||||||||||||||||||||||
2009 Jun 25 - 2009 Jun 25 Confirmed Eruption (Explosive / Effusive) VEI: 2
| Episode 1 | Eruption (Explosive / Effusive) | ||||||||||||||||||||||||
|---|---|---|---|---|---|---|---|---|---|---|---|---|---|---|---|---|---|---|---|---|---|---|---|---|
| 2009 Jun 25 - 2009 Jun 25 | Evidence from Observations: Reported | |||||||||||||||||||||||
|
List of 3 Events for Episode 1
|
||||||||||||||||||||||||
2009 Jan 2 - 2009 Jan 21 Confirmed Eruption (Explosive / Effusive) VEI: 2
| Episode 1 | Eruption (Explosive / Effusive) | |||||||||||||||||||||||||||||||||||||||
|---|---|---|---|---|---|---|---|---|---|---|---|---|---|---|---|---|---|---|---|---|---|---|---|---|---|---|---|---|---|---|---|---|---|---|---|---|---|---|---|
| 2009 Jan 2 - 2009 Jan 21 | Evidence from Observations: Reported | ||||||||||||||||||||||||||||||||||||||
|
List of 6 Events for Episode 1
|
|||||||||||||||||||||||||||||||||||||||
2007 Jun 17 (?) - 2008 Aug 12 (?) Confirmed Eruption (Explosive / Effusive) VEI: 2 (?)
| Episode 1 | Eruption (Explosive / Effusive) | |||||||||||||||||||||||||||||||||||||||||||||||||
|---|---|---|---|---|---|---|---|---|---|---|---|---|---|---|---|---|---|---|---|---|---|---|---|---|---|---|---|---|---|---|---|---|---|---|---|---|---|---|---|---|---|---|---|---|---|---|---|---|---|
| 2007 Jun 17 (?) - 2008 Aug 12 (?) | Evidence from Observations: Reported | ||||||||||||||||||||||||||||||||||||||||||||||||
|
List of 8 Events for Episode 1
|
|||||||||||||||||||||||||||||||||||||||||||||||||
2006 Feb 6 - 2006 Oct 28 Confirmed Eruption (Explosive / Effusive) VEI: 3
| Episode 1 | Eruption (Explosive / Effusive) | |||||||||||||||||||||||||||||||||||||||
|---|---|---|---|---|---|---|---|---|---|---|---|---|---|---|---|---|---|---|---|---|---|---|---|---|---|---|---|---|---|---|---|---|---|---|---|---|---|---|---|
| 2006 Feb 6 - 2006 Oct 28 | Evidence from Observations: Reported | ||||||||||||||||||||||||||||||||||||||
|
List of 6 Events for Episode 1
|
|||||||||||||||||||||||||||||||||||||||
2005 Mar 13 (?) - 2005 Nov 27 ± 1 days Confirmed Eruption (Explosive / Effusive) VEI: 2
| Episode 1 | Eruption (Explosive / Effusive) | |||||||||||||||||||||||||||||||||||||||
|---|---|---|---|---|---|---|---|---|---|---|---|---|---|---|---|---|---|---|---|---|---|---|---|---|---|---|---|---|---|---|---|---|---|---|---|---|---|---|---|
| 2005 Mar 13 (?) - 2005 Nov 27 ± 1 days | Evidence from Observations: Reported | ||||||||||||||||||||||||||||||||||||||
|
List of 6 Events for Episode 1
|
|||||||||||||||||||||||||||||||||||||||
2001 Feb 2 (on or before) - 2001 Apr 15 (?) Confirmed Eruption (Explosive / Effusive) VEI: 3 (?)
| Episode 1 | Eruption (Explosive / Effusive) | ||||||||||||||||||||||||||||||||||||||||||||||||||||||
|---|---|---|---|---|---|---|---|---|---|---|---|---|---|---|---|---|---|---|---|---|---|---|---|---|---|---|---|---|---|---|---|---|---|---|---|---|---|---|---|---|---|---|---|---|---|---|---|---|---|---|---|---|---|---|
| 2001 Feb 2 (on or before) - 2001 Apr 15 (?) | Evidence from Observations: Reported | |||||||||||||||||||||||||||||||||||||||||||||||||||||
|
List of 9 Events for Episode 1
|
||||||||||||||||||||||||||||||||||||||||||||||||||||||
1997 May 5 - 1997 May 5 Confirmed Eruption (Explosive / Effusive) VEI: 2 (?)
| Episode 1 | Eruption (Explosive / Effusive) | ||||||||||||||||||||||||
|---|---|---|---|---|---|---|---|---|---|---|---|---|---|---|---|---|---|---|---|---|---|---|---|---|
| 1997 May 5 - 1997 May 5 | Evidence from Observations: Reported | |||||||||||||||||||||||
|
List of 3 Events for Episode 1
|
||||||||||||||||||||||||
1994 Oct 20 - 1994 Oct 20 Confirmed Eruption (Explosive / Effusive) VEI: 1 (?)
| Episode 1 | Eruption (Explosive / Effusive) | ||||||||||||||||||||||||
|---|---|---|---|---|---|---|---|---|---|---|---|---|---|---|---|---|---|---|---|---|---|---|---|---|
| 1994 Oct 20 - 1994 Oct 20 | Evidence from Observations: Reported | |||||||||||||||||||||||
|
List of 3 Events for Episode 1
|
||||||||||||||||||||||||
1994 May 25 - 1994 May 25 Confirmed Eruption (Explosive / Effusive) VEI: 3
| Episode 1 | Eruption (Explosive / Effusive) | |||||||||||||||||||||||||||||
|---|---|---|---|---|---|---|---|---|---|---|---|---|---|---|---|---|---|---|---|---|---|---|---|---|---|---|---|---|---|
| 1994 May 25 - 1994 May 25 | Evidence from Observations: Reported | ||||||||||||||||||||||||||||
|
List of 4 Events for Episode 1
|
|||||||||||||||||||||||||||||
[ 1989 Oct 25 ± 3 days ] Uncertain Eruption
| Episode 1 | Eruption (Explosive / Effusive) | ||||||||||||||||||||||||
|---|---|---|---|---|---|---|---|---|---|---|---|---|---|---|---|---|---|---|---|---|---|---|---|---|
| 1989 Oct 25 ± 3 days - Unknown | Evidence from Unknown | |||||||||||||||||||||||
|
List of 3 Events for Episode 1
|
||||||||||||||||||||||||
1987 Jun 19 - 1987 Aug 28 Confirmed Eruption (Explosive / Effusive) VEI: 3
| Episode 1 | Eruption (Explosive / Effusive) | |||||||||||||||||||||||||||||||||||||||||||||||||
|---|---|---|---|---|---|---|---|---|---|---|---|---|---|---|---|---|---|---|---|---|---|---|---|---|---|---|---|---|---|---|---|---|---|---|---|---|---|---|---|---|---|---|---|---|---|---|---|---|---|
| 1987 Jun 19 - 1987 Aug 28 | Evidence from Observations: Reported | ||||||||||||||||||||||||||||||||||||||||||||||||
|
List of 8 Events for Episode 1
|
|||||||||||||||||||||||||||||||||||||||||||||||||
1986 Apr 28 - 1986 May 27 (on or after) Confirmed Eruption (Explosive / Effusive) VEI: 2
| Episode 1 | Eruption (Explosive / Effusive) | |||||||||||||||||||||||||||||
|---|---|---|---|---|---|---|---|---|---|---|---|---|---|---|---|---|---|---|---|---|---|---|---|---|---|---|---|---|---|
| 1986 Apr 28 - 1986 May 27 (on or after) | Evidence from Observations: Reported | ||||||||||||||||||||||||||||
|
List of 4 Events for Episode 1
|
|||||||||||||||||||||||||||||
[ 1985 Dec 10 ] Uncertain Eruption
| Episode 1 | Eruption (Explosive / Effusive) | |||||||||||||||||||
|---|---|---|---|---|---|---|---|---|---|---|---|---|---|---|---|---|---|---|---|
| 1985 Dec 10 - Unknown | Evidence from Unknown | ||||||||||||||||||
|
List of 2 Events for Episode 1
|
|||||||||||||||||||
1984 Jul 12 - 1984 Jul 12 Confirmed Eruption (Explosive / Effusive) VEI: 1
| Episode 1 | Eruption (Explosive / Effusive) | ||||||||||||||||||||||||
|---|---|---|---|---|---|---|---|---|---|---|---|---|---|---|---|---|---|---|---|---|---|---|---|---|
| 1984 Jul 12 - 1984 Jul 12 | Evidence from Observations: Reported | |||||||||||||||||||||||
|
List of 3 Events for Episode 1
|
||||||||||||||||||||||||
[ 1975 Sep 16 ± 15 days ] Uncertain Eruption
| Episode 1 | Eruption (Explosive / Effusive) | ||||
|---|---|---|---|---|
| 1975 Sep 16 ± 15 days - Unknown | Evidence from Unknown | |||
[ 1953 Jun 25 ] Uncertain Eruption
| Episode 1 | Eruption (Explosive / Effusive) | |||||||||||||||||||
|---|---|---|---|---|---|---|---|---|---|---|---|---|---|---|---|---|---|---|---|
| 1953 Jun 25 - Unknown | Evidence from Unknown | ||||||||||||||||||
|
List of 2 Events for Episode 1
|
|||||||||||||||||||
[ 1951 Nov 1 - 1951 Dec 16 ± 15 days ] Uncertain Eruption
| Episode 1 | Eruption (Explosive / Effusive) | ||||||||||||||
|---|---|---|---|---|---|---|---|---|---|---|---|---|---|---|
| 1951 Nov 1 - 1951 Dec 16 ± 15 days | Evidence from Unknown | |||||||||||||
|
List of 1 Events for Episode 1
|
||||||||||||||
1944 Jun 10 - 1944 Jun 12 Confirmed Eruption (Explosive / Effusive) VEI: 3
| Episode 1 | Eruption (Explosive / Effusive) | ||||||||||||||||||||||||||||||||||||||||||||||||||||||
|---|---|---|---|---|---|---|---|---|---|---|---|---|---|---|---|---|---|---|---|---|---|---|---|---|---|---|---|---|---|---|---|---|---|---|---|---|---|---|---|---|---|---|---|---|---|---|---|---|---|---|---|---|---|---|
| 1944 Jun 10 - 1944 Jun 12 | Evidence from Observations: Reported | |||||||||||||||||||||||||||||||||||||||||||||||||||||
|
List of 9 Events for Episode 1
|
||||||||||||||||||||||||||||||||||||||||||||||||||||||
1938 Confirmed Eruption (Explosive / Effusive)
| Episode 1 | Eruption (Explosive / Effusive) | ||||
|---|---|---|---|---|
| 1938 - Unknown | Evidence from Observations: Reported | |||
1932 Jan 1 Confirmed Eruption (Explosive / Effusive)
| Episode 1 | Eruption (Explosive / Effusive) | |||||||||||||||||||
|---|---|---|---|---|---|---|---|---|---|---|---|---|---|---|---|---|---|---|---|
| 1932 Jan 1 - Unknown | Evidence from Observations: Reported | ||||||||||||||||||
|
List of 2 Events for Episode 1
|
|||||||||||||||||||
[ 1929 Mar ] Uncertain Eruption
| Episode 1 | Eruption (Explosive / Effusive) | ||||||||||||||
|---|---|---|---|---|---|---|---|---|---|---|---|---|---|---|
| 1929 Mar - Unknown | Evidence from Unknown | |||||||||||||
|
List of 1 Events for Episode 1
|
||||||||||||||
1897 Confirmed Eruption (Explosive / Effusive)
| Episode 1 | Eruption (Explosive / Effusive) | ||||
|---|---|---|---|---|
| 1897 - Unknown | Evidence from Observations: Reported | |||
1893 Confirmed Eruption (Explosive / Effusive)
| Episode 1 | Eruption (Explosive / Effusive) | ||||
|---|---|---|---|---|
| 1893 - Unknown | Evidence from Observations: Reported | |||
This compilation of synonyms and subsidiary features may not be comprehensive. Features are organized into four major categories: Cones, Craters, Domes, and Thermal Features. Synonyms of features appear indented below the primary name. In some cases additional feature type, elevation, or location details are provided.
Synonyms |
| Chuginadak |
 This aerial view of Mount Cleveland volcano from a generally eastward direction shows a small crater at the summit of the stratovolcano. Cleveland is one of the most active volcanoes of the Aleutian arc.
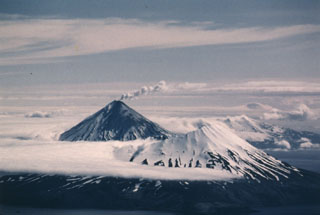 Herbert is a cone containing a 2-km-wide summit caldera that opens to NW. This 23 June 1987 view from the WSW shows a small plume originating from Cleveland in background, with darkened slopes from ashfall produced during an eruption that began on 19 June.
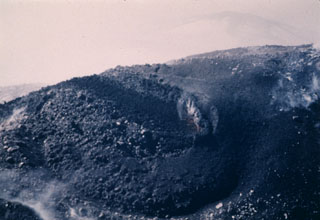 An eruption of Cleveland in 1987 began with explosive activity on 19 June that deposited ash onto snow on the flanks. On 23 June, the date of this photo, a lava flow from the summit eventually extended 2.5 km down the ESE flank. Lava fountaining was observed on 22 July, and on 28 August a large explosive eruption produced an ash plume that reached over 10 km altitude.
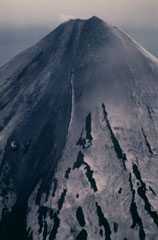 An aerial view of the Cleveland upper east flank taken at about 1100 local time on 24 June 1987 shows an active lava flow. Incandescent lava can be seen at several locations along the flow, which eventually traveled 2.5 km from the summit. The snow-covered flanks are darkened by ash deposition from an eruption that began on 19 June.
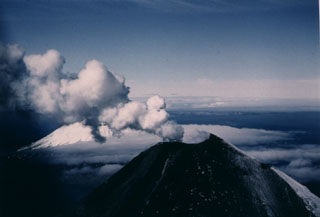 A gas-and-steam plume rises above the summit crater of Cleveland on 23 June 1987. The upper flanks are darkened by ashfall from an eruption that began on 19 June. Lava extrusion began on 23 June and a flow eventually descended 2.5 km down the ESE flank. Lava fountaining was observed on 22 July. A large explosive eruption took place on 28 August, the last day of the eruption. This view from the ENE shows part of Herbert volcano behind the plume to the left.
 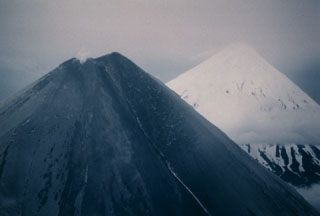 Both Cleveland (left) and Carlisle (right) volcanoes in the Aleutian islands are snow-covered, but the flanks of Cleveland in this 24 June 1987 photo, seen from the ESE, are darkened by ashfall deposits from an explosive eruption that began on 19 June.
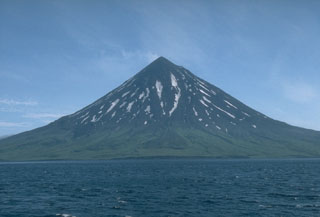 Mount Cleveland forms the western half of Chuginadak Island. This 24 July 1994 view from the west shows the summit region darkened by ashfall that may have originated from an eruption reported on 25 May. Dark lava flows from earlier eruptions can be seen on the flanks.
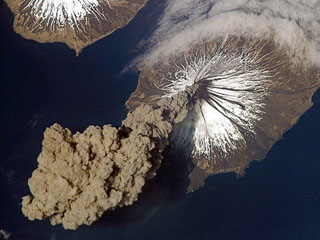 Eruption of Cleveland on 23 May 2006 as photographed from the International Space Station at an orbital altitude of approximately 400 km. The photograph shows the ash plume moving SW from the summit with N at the top and Carlisle Island to the NW.
There are no samples for Cleveland in the Smithsonian's NMNH Department of Mineral Sciences Rock and Ore collection.
| Alaska Volcano Observatory (Link to Cleveland) | The Alaska Volcano Observatory (AVO) is a joint program of the U.S. Geological Survey (USGS), the Geophysical Institute of the University of Alaska Fairbanks (UAFGI), and the State of Alaska Division of Geological and Geophysical Surveys (ADGGS). AVO was formed in 1988, and uses federal, state, and university resources to monitor and study Alaska's hazardous volcanoes, to predict and record eruptive activity, and to mitigate volcanic hazards to life and property. |
| Copernicus Browser | The Copernicus Browser replaced the Sentinel Hub Playground browser in 2023, to provide access to Earth observation archives from the Copernicus Data Space Ecosystem, the main distribution platform for data from the EU Copernicus missions. |
| MIROVA | Middle InfraRed Observation of Volcanic Activity (MIROVA) is a near real time volcanic hot-spot detection system based on the analysis of MODIS (Moderate Resolution Imaging Spectroradiometer) data. In particular, MIROVA uses the Middle InfraRed Radiation (MIR), measured over target volcanoes, in order to detect, locate and measure the heat radiation sourced from volcanic activity. |
| MODVOLC Thermal Alerts | Using infrared satellite Moderate Resolution Imaging Spectroradiometer (MODIS) data, scientists at the Hawai'i Institute of Geophysics and Planetology, University of Hawai'i, developed an automated system called MODVOLC to map thermal hot-spots in near real time. For each MODIS image, the algorithm automatically scans each 1 km pixel within it to check for high-temperature hot-spots. When one is found the date, time, location, and intensity are recorded. MODIS looks at every square km of the Earth every 48 hours, once during the day and once during the night, and the presence of two MODIS sensors in space allows at least four hot-spot observations every two days. Each day updated global maps are compiled to display the locations of all hot spots detected in the previous 24 hours. There is a drop-down list with volcano names which allow users to 'zoom-in' and examine the distribution of hot-spots at a variety of spatial scales. |
|
WOVOdat
Single Volcano View Temporal Evolution of Unrest Side by Side Volcanoes |
WOVOdat is a database of volcanic unrest; instrumentally and visually recorded changes in seismicity, ground deformation, gas emission, and other parameters from their normal baselines. It is sponsored by the World Organization of Volcano Observatories (WOVO) and presently hosted at the Earth Observatory of Singapore.
GVMID Data on Volcano Monitoring Infrastructure The Global Volcano Monitoring Infrastructure Database GVMID, is aimed at documenting and improving capabilities of volcano monitoring from the ground and space. GVMID should provide a snapshot and baseline view of the techniques and instrumentation that are in place at various volcanoes, which can be use by volcano observatories as reference to setup new monitoring system or improving networks at a specific volcano. These data will allow identification of what monitoring gaps exist, which can be then targeted by remote sensing infrastructure and future instrument deployments. |
| Volcanic Hazard Maps | The IAVCEI Commission on Volcanic Hazards and Risk has a Volcanic Hazard Maps database designed to serve as a resource for hazard mappers (or other interested parties) to explore how common issues in hazard map development have been addressed at different volcanoes, in different countries, for different hazards, and for different intended audiences. In addition to the comprehensive, searchable Volcanic Hazard Maps Database, this website contains information about diversity of volcanic hazard maps, illustrated using examples from the database. This site is for educational purposes related to volcanic hazard maps. Hazard maps found on this website should not be used for emergency purposes. For the most recent, official hazard map for a particular volcano, please seek out the proper institutional authorities on the matter. |
| IRIS seismic stations/networks | Incorporated Research Institutions for Seismology (IRIS) Data Services map showing the location of seismic stations from all available networks (permanent or temporary) within a radius of 0.18° (about 20 km at mid-latitudes) from the given location of Cleveland. Users can customize a variety of filters and options in the left panel. Note that if there are no stations are known the map will default to show the entire world with a "No data matched request" error notice. |
| UNAVCO GPS/GNSS stations | Geodetic Data Services map from UNAVCO showing the location of GPS/GNSS stations from all available networks (permanent or temporary) within a radius of 20 km from the given location of Cleveland. Users can customize the data search based on station or network names, location, and time window. Requires Adobe Flash Player. |
| DECADE Data | The DECADE portal, still in the developmental stage, serves as an example of the proposed interoperability between The Smithsonian Institution's Global Volcanism Program, the Mapping Gas Emissions (MaGa) Database, and the EarthChem Geochemical Portal. The Deep Earth Carbon Degassing (DECADE) initiative seeks to use new and established technologies to determine accurate global fluxes of volcanic CO2 to the atmosphere, but installing CO2 monitoring networks on 20 of the world's 150 most actively degassing volcanoes. The group uses related laboratory-based studies (direct gas sampling and analysis, melt inclusions) to provide new data for direct degassing of deep earth carbon to the atmosphere. |
| Large Eruptions of Cleveland | Information about large Quaternary eruptions (VEI >= 4) is cataloged in the Large Magnitude Explosive Volcanic Eruptions (LaMEVE) database of the Volcano Global Risk Identification and Analysis Project (VOGRIPA). |
| EarthChem | EarthChem develops and maintains databases, software, and services that support the preservation, discovery, access and analysis of geochemical data, and facilitate their integration with the broad array of other available earth science parameters. EarthChem is operated by a joint team of disciplinary scientists, data scientists, data managers and information technology developers who are part of the NSF-funded data facility Integrated Earth Data Applications (IEDA). IEDA is a collaborative effort of EarthChem and the Marine Geoscience Data System (MGDS). |