
The eruption at Nyamulagira continued during 3-18 September. Incandescence on the floor of the summit caldera and from active lava flows on the W and NW flanks was visible in satellite images on 3, 8, 13, and 18 September. Weather clouds obscured parts of the summit area and the flanks in all four images.
Source: Copernicus
Lava flows and thermal activity during May-October 2023
Nyamulagira (also known as Nyamuragira) is a shield volcano in the Democratic Republic of Congo with the summit truncated by a small 2 x 2.3 km caldera with walls up to about 100 m high. Documented eruptions have occurred within the summit caldera, as well as from numerous flank fissures and cinder cones. The current eruption period began in April 2018 and has more recently been characterized by summit crater lava flows and thermal activity (BGVN 48:05). This report describes lava flows and variable thermal activity during May through October 2023, based on information from the Observatoire Volcanologique de Goma (OVG) and various satellite data.
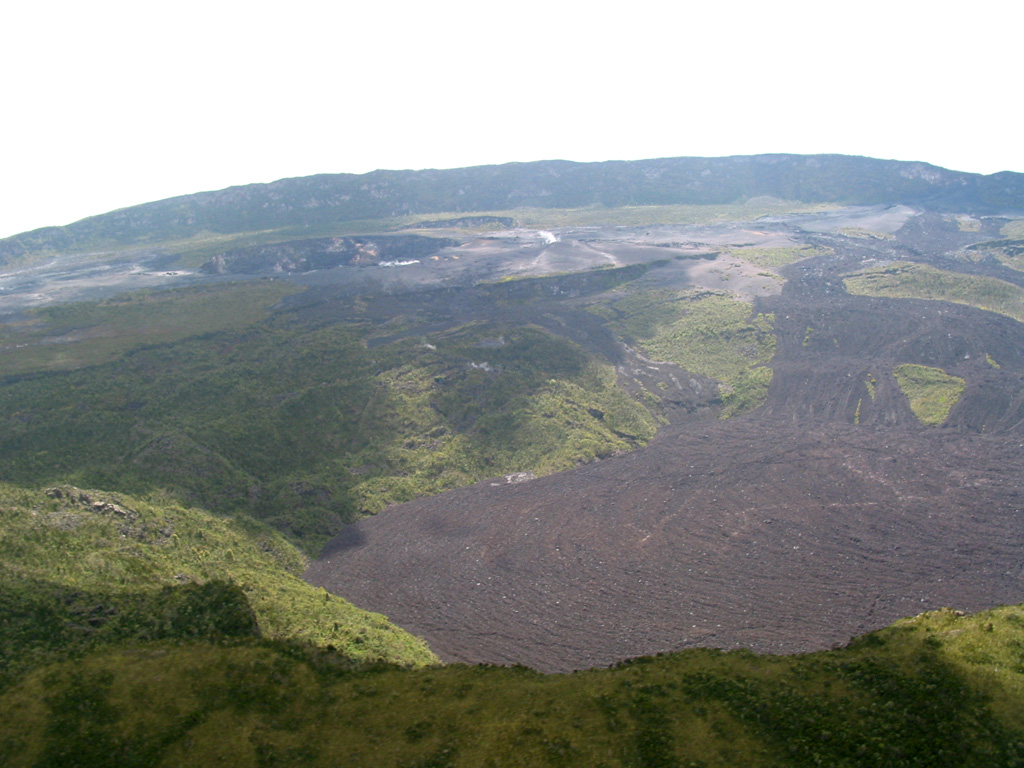
Lava lake activity continued during May. The MIROVA (Middle InfraRed Observation of Volcanic Activity) system recorded moderate-to-strong thermal activity throughout the reporting period; activity was more intense during May and October and relatively weaker from June through September (figure 95). The MODVOLC thermal algorithm, detected a total of 209 thermal alerts. There were 143 hotspots detected during May, eight during June, nine during September, and 49 during October. This activity was also reflected in infrared satellite images, where a lava flow was visible in the NW part of the crater on 7 May and strong activity was seen in the center of the crater on 4 October (figure 96). Another infrared satellite image taken on 12 May showed still active lava flows along the NW margin of the crater. According to OVG lava effusions were active during 7-29 May and moved to the N and NW parts of the crater beginning on 9 May. Strong summit crater incandescence was visible from Goma (27 km S) during the nights of 17, 19, and 20 May (figure 97). On 17 May there was an increase in eruptive activity, which peaked at 0100 on 20 May. Notable sulfur dioxide plumes drifted NW and W during 19-20 May (figure 98). Drone footage acquired in partnership with the USGS (United States Geological Survey) on 20 May captured images of narrow lava flows that traveled about 100 m down the W flank (figure 99). Data from the Rumangabo seismic station indicated a decreasing trend in activity during 17-21 May. Although weather clouds prevented clear views of the summit, a strong thermal signature on the NW flank was visible in an infrared satellite image on 22 May, based on an infrared satellite image. On 28 May the lava flows on the upper W flank began to cool and solidify. By 29 May seismicity returned to levels similar to those recorded before the 17 May increase. Lava effusion continued but was confined to the summit crater; periodic crater incandescence was observed.
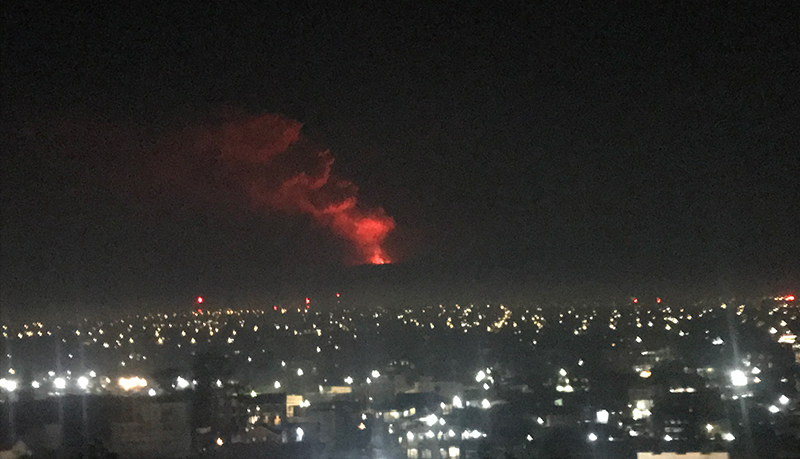 |
Figure 97. Photo of intense nighttime crater incandescence at Nyamulagira as seen from Goma (27 km S) on the evening of 19 May 2023. Courtesy of Charles Balagizi, OVG. |
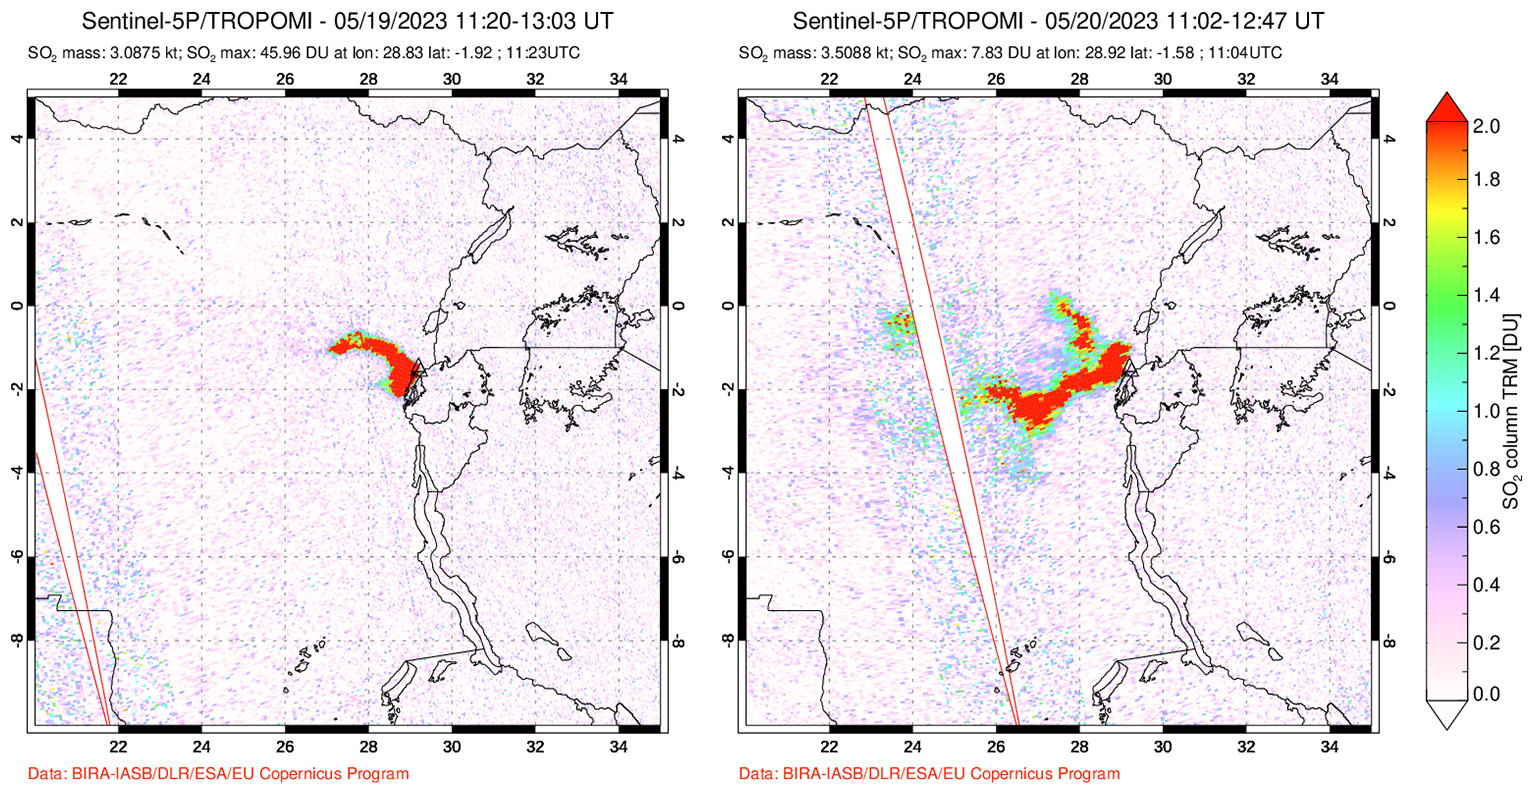 |
Figure 98. Two strong sulfur dioxide plumes were detected at Nyamulagira and drifted W on 19 (left) and 20 (right) May 2023. Courtesy of NASA Global Sulfur Dioxide Monitoring Page. |
Low-level activity was noted during June through October. On 1 June OVG reported that seismicity remained at lower levels and that crater incandescence had been absent for three days, though infrared satellite imagery showed continued lava effusion in the summit crater. The lava flows on the flanks covered an estimated 0.6 km2. Satellite imagery continued to show thermal activity confined to the lava lake through October (figure 96), although no lava flows or significant sulfur dioxide emissions were reported.
Information Contacts: Observatoire Volcanologique de Goma (OVG), Departement de Geophysique, Centre de Recherche en Sciences Naturelles, Lwiro, D.S. Bukavu, DR Congo; Hawai'i Institute of Geophysics and Planetology (HIGP) - MODVOLC Thermal Alerts System, School of Ocean and Earth Science and Technology (SOEST), Univ. of Hawai'i, 2525 Correa Road, Honolulu, HI 96822, USA (URL: http://modis.higp.hawaii.edu/); MIROVA (Middle InfraRed Observation of Volcanic Activity), a collaborative project between the Universities of Turin and Florence (Italy) supported by the Centre for Volcanic Risk of the Italian Civil Protection Department (URL: http://www.mirovaweb.it/); NASA Global Sulfur Dioxide Monitoring Page, Atmospheric Chemistry and Dynamics Laboratory, NASA Goddard Space Flight Center (NASA/GSFC), 8800 Greenbelt Road, Goddard, Maryland, USA (URL: https://so2.gsfc.nasa.gov/); Copernicus Browser, Copernicus Data Space Ecosystem, European Space Agency (URL: https://dataspace.copernicus.eu/browser/); Charles Balagizi, Goma Volcano Observatory, Departement de Geophysique, Centre de Recherche en Sciences Naturelles, Lwiro, D.S. Bukavu, DR Congo.
2025: February
| March
| April
| June
| July
| September
2024: March
| June
| July
| August
| September
| October
| November
| December
2023: February
| March
| May
| June
| September
| November
2022: March
| July
2019: May
| July
2014: January
| June
2013: July
2012: January
2011: November
2010: January
2009: April
| December
2006: November
2005: June
| October
2004: May
2003: February
| April
| December
2002: February
| July
| August
| October
2001: January
| February
| March
The eruption at Nyamulagira continued during 3-18 September. Incandescence on the floor of the summit caldera and from active lava flows on the W and NW flanks was visible in satellite images on 3, 8, 13, and 18 September. Weather clouds obscured parts of the summit area and the flanks in all four images.
Source: Copernicus
Satellite images acquired on 30 July showed continued eruptive activity at Nyamulagira. Thermal anomalies associated with active lava flows were detected on the WNW flank. Additionally, strong thermal anomalies were observed within the summit crater area, partially obscured by rising gas and/or steam plumes.
Sources: Copernicus; MIROVA
A satellite image acquired on 10 June showed continuing eruptive activity at Nyamulagira. Bright thermal anomalies indicated continuing activity at the summit crater and active lava flows on the W and NW flanks, though weather clouds obscured views. A thermal anomaly at the possible end of a lava flow on the NW flank was about 3.3 km from the crater rim.
Source: Copernicus
Satellite images acquired on 21 and 26 April and on 1 May showed continuing activity at Nyamulagira. Though weather clouds particularly obscured the summit area in all three scenes, bright thermal anomalies indicated continuing activity at the summit crater and active lava flows on the W flank.
Source: Copernicus
Satellite images acquired on 17 and 22 March showed continuing activity at Nyamuragira. A bright thermal anomaly just NE of the central part of the summit crater was visible in both images, along with surrounding elevated temperatures on the E half of the crater floor, likely from lava flows. Although weather and volcanic gas plumes obscured most of the W flank, a small incandescent spot from an active lava flow on the upper W flank was visible in the 17 March image.
Source: Copernicus
Satellite images acquired on 20 and 25 February showed continuing activity at Nyamuragira. A thermal anomaly just NE of the central part of the summit crater was visible in the 20 February image, along with smaller thermal anomalies to the NE and SW. Thermal anomalies near the distal end of the lava flow on the WSW flank possibly indicated that it continued to advance; the flow was about 3.3 km long, measured from the W crater rim. Another anomaly was visible about 780 m W of the crater rim. Most of the summit crater and lava-flow field was obscured by weather clouds in the 25 February image, though the end of the active lava flow was visible and had advanced about 80 m.
Source: Copernicus
Satellite images acquired on 21 and 31 January showed continuing activity at Nyamuragira. A thermal anomaly in the summit crater was visible, though weather and/or volcanic emissions obscured most of the crater. A lava flow on the W flank was visible in the 31 January image and was about 890 m long. Dense weather clouds obscured the volcano in a 5 February satellite image.
Source: Copernicus
A 7 December satellite image showed continuing activity at Nyamuragira. A thermal anomaly in the summit crater was visible, though weather and/or volcanic emissions obscured more than half of the crater. The most intense area was just NE of the central part of the crater.
Source: Copernicus
Satellite images in November indicated continuing activity at Nyamuragira. Large strong thermal anomalies in the main crater were visible in 2 and 12 November satellite images, even though weather clouds obscured significant portions of the crater. According to the Observatoire Volcanologique de Goma (OVG) sustained sulfur dioxide emissions identified in satellite data were as high as 7,000 tonnes per day on 7 November; gas emissions were attributed to both Nyamuragira and Nyiragongo.
Sources: Copernicus; Observatoire Volcanologique de Goma (OVG)
The Observatoire Volcanologique de Goma (OVG) reported that lava effusion at Nyamulagira was continuing. According to a special bulletin issued on 2 October, three lava flows were active on the N and W flanks, with the longest reaching 7 km NW from the crater rim. Strong seismicity in the area was also reported in a special bulletin issued on 14 October. During the nights of 13 and 14 October an intense glow was visible in the crater.
Source: Observatoire Volcanologique de Goma (OVG)
A 28 September satellite image showed some minor advancement (around 200 m) of the W branch of Nyamuragira’s NNW lava flow compared to an 18 September image. Small thermal anomalies were concentrated near the end of the NNW lava flow and at the end of the W branch, and a few were located along the flow about of a third of the way up the flank. A thermal anomaly was present the part of the eastern crater floor. A few small thermal anomalies on the W flank flow were visible, though weather clouds obscured most of W flank. Weather clouds also obscured part of the summit crater and the upper NNW flow.
Source: Copernicus
Satellite images from 13 and 18 September indicated continuing activity at Nyamuragira. The end of the NNW lava flow was about 7.6 km from the crater rim based on a 13 September satellite image and had advanced a short distance by 18 September. Lava had branched from the flow in an area about 1.3 km upslope from the end of the flow and traveled about 1.6 km NE. Lava flows that had breached the NNW crater rim traveled W and SW. The farthest end of the W flow was about 5 km from the crater rim and the end of the SW flow was about 3 km from the crater rim. Small thermal anomalies were visible near the ends of the NNW flow and in areas along the W and WSW flows. A larger thermal anomaly was present the part of the eastern crater floor. An 18 September image showed that the thermal anomaly in the main crater had shifted to the NW part of the crater. Scattered thermal anomalies on the flow fields indicated breakouts in areas along the margins of the NNW, W, and SW. Weather clouds slightly obscured the crater and flow field in the 13 September image but obscured most of the flow field and part of the crater in the 18 September image.
Source: Copernicus
In a 3 September satellite image of Nyamuragira part of the end of the lava flow on the WNW flank was visible through weather clouds in a small area about 5.8 km from the center of the caldera. The lava was incandescent, suggesting continued activity. Part of the flow on the NNW flank was visible through the clouds in an area about 3.6 km from the center of the caldera, but it appeared black and was likely cooling.
Source: Copernicus
A 30 July satellite image showed lava flows extending over 5 km NNW of Nyamuragira’s N crater rim and a new flow extending almost 2 km W of the NW crater rim, based on thermal anomalies. Weather clouds obscured parts of the NNW flow, possibly including the furthest extent of the flow. A thermally anomalous area about 800 m E-W and more than 1.1 km N-S was centered over the vent area in the crater.
Source: Copernicus
A 5 July satellite image showed an irregularly shaped thermal anomaly on the NE-central part of Nyamuragira’s crater floor. Weather clouds obscured parts of the crater.
Source: Copernicus
A 25 June satellite image showed an irregularly shaped thermal anomaly on the NE-central part of Nyamuragira’s crater floor. The anomaly was about 600 m E-W and 800 m N-S, though weather clouds obscured most of the crater. A small bluish gas plume rose from a possible central cone.
Source: Copernicus
The Observatoire Volcanologique de Goma (OVG) reported that lava effusion at Nyamulagira was continuing. Thermal anomalies in an area just NE of the central part of the caldera were identified in a 17 March satellite image. A larger thermal anomaly in the same area, though it extended farther SE, was evident in a 7 March image.
Sources: Observatoire Volcanologique de Goma (OVG); Copernicus
An 18 November satellite image of Nyamulagira showed a thermal anomaly in the NE part of the summit crater, likely indicating an active lava lake.
Source: Sentinel Hub
The Observatoire Volcanologique de Goma (OVG) reported that activity at Nyamulagira continued at low levels during 17-24 September based on satellite images.
Source: Observatoire Volcanologique de Goma (OVG)
The Observatoire Volcanologique de Goma (OVG) reported that the eruption at Nyamulagira continued at low levels during 5-11 June based on satellite images.
Source: Observatoire Volcanologique de Goma (OVG)
On 1 June the Observatoire Volcanologique de Goma (OVG) reported that seismicity at Nyamulagira remained at lower levels, similar to those recorded before the 17 May increase in activity. Incandescence above the crater had been absent for the past three days, but satellite imagery showed continuing lava effusion within the summit crater. The recent flows on the flanks covered an estimated 0.6 square kilometers.
Source: Observatoire Volcanologique de Goma (OVG)
On 28 May the Observatoire Volcanologique de Goma (OVG) reported that the lava flows on Nyamulagira’s upper W flank had begun to cool and solidify. By 29 May seismicity had returned to levels similar to those recorded before the 17 May increase in activity. Lava effusion continued but was confined to the summit crater; incandescence above the crater was periodically visible.
Source: Observatoire Volcanologique de Goma (OVG)
The Observatoire Volcanologique de Goma (OVG) reported that lava continued to erupt from vents in Nyamulagira’s summit crater during 17-23 May. Lava flows began moving into the N and NW parts of the crater beginning on 9 May, towards the low point of the crater rim. Intense incandescence from the summit was visible from Goma (27 km S) during the evenings of 17 and 19 May. Satellite images showed a notable sulfur dioxide plume drifting NW and W during 19-20 May. Drone footage acquired on 20 May captured images of narrow lava flows traveling about 100 m down the W flank. Intense incandescence emanating from the summit was again visible from Goma at around 1830. Data from the Rumangabo seismic station indicated a downward trend in activity during 17-20 May and a significant decrease during 20-21 May. Though weather clouds were dense over the summit, hot lava on the NW flank was visible in a 22 May Sentinel-2 infrared (SWIR) image.
Sources: Observatoire Volcanologique de Goma (OVG); Sentinel Hub
The Observatoire Volcanologique de Goma (OVG) reported that the lava lake in Nyamulagira’s summit crater continued to be active during 30 April-6 May. A Sentinel satellite image from 7 May showed active lava flows traveling towards the NW part of the crater. Another image on 12 May showed active flows along the NE margin of the dark and cooler 7 May flows. Weather clouds and possible volcanic emissions obscured parts of the crater.
Sources: Observatoire Volcanologique de Goma (OVG); Sentinel Hub
An 18 March satellite image of Nyamulagira showed a large thermal anomaly, possibly 600 m wide, in the summit crater, indicating that the eruption that had begun on 14 March was continuing.
Source: Sentinel Hub
The Observatoire Volcanologique de Goma (OVG) reported increased activity at Nyamulagira on 13 March. Seismicity indicated magma movement at shallow depths towards the central part of the crater and incandescence above the crater rim was visible beginning at around 1800. The Toulouse VAAC reported at 1130 on 14 March that lava fountains were observed, and an eruption plume rose 1.5 km above the crater rim, based on information from OVG. The VAAC noted that the plume was not identified in satellite images due to weather cloud cover.
Sources: Observatoire Volcanologique de Goma (OVG); Toulouse Volcanic Ash Advisory Centre (VAAC)
The Observatoire Volcanologique de Goma (OVG) reported that the lava lake on Nyamulagira’s crater floor continued to be active during 13-19 February. Seismicity was generally low, characterized by a few long-period earthquakes located up to 15 km deep along the large fracture connecting the Nyamuragira and Nyiragongo. High concentrations of carbon dioxide were measured in the Mazuku areas, and in an area to the W of a camp in the Lac Vert district in Bulengo; OVG warned residents to stay away from those areas.
Source: Observatoire Volcanologique de Goma (OVG)
Thermal anomalies from lava effusion on Nyamulagira’s crater floor were identified in satellite images on 6 and 11 July.
Sources: Observatoire Volcanologique de Goma (OVG); Sentinel Hub
Active lava on Nyamulagira’s crater floor was visible in satellite images during 8-13 March.
Sources: Observatoire Volcanologique de Goma (OVG); Sentinel Hub
The Observatoire Volcanologique de Goma (OVG) reported that collapses of Nyamuragira’s inner crater walls observed in May 2019 continued during 1-31 July. Lava fountaining from a small cone was visible.
Source: Observatoire Volcanologique de Goma (OVG)
The Observatoire Volcanologique de Goma (OVG) reported that during early April Nyamuragira’s lava lake, which had returned in April 2018 after almost a year of quiet, continued to be active. Beginning on 12 April seismic and lava-lake activity both declined. MIROVA data showed that the thermal radiative power was at moderate levels the first half of the month then declined to low levels during the second half.
Source: Observatoire Volcanologique de Goma (OVG)
On 29 June NASA reported that Nyamuragira vented steam and other volcanic gases and there was a glow from the lava lake. NOAA reported that an Ozone Monitoring Instrument (OMI) satellite detected high SO2 concentrations above Nyamuragira. The University of Hawaii reported that Moderate Resolution Imaging Spectroradiometer (MODIS) satellite data detected thermal anomalies and issued six MODVOLC alerts for the volcano’s N side.
Sources: NASA Earth Observatory; NOAA Satellite and Information Service; Hawai'i Institute of Geophysics and Planetology (HIGP) Thermal Alerts Team
According to NASA's Earth Observatory, a satellite image acquired on 29 January showed a gas-and-steam plume rising from Nyamuragira.
Source: NASA Earth Observatory
According to NASA's Earth Observatory, a satellite image acquired on 29 July showed a dense, white plume rising from Nyamuragira likely consisting of large amounts of water vapor.
Source: NASA Earth Observatory
The VolcanoDiscovery Team observed the fissure eruption at Nyamuragira that began on 6 November 2011 during 22-25 January 2012 from the newly formed cinder cones located about 10 km E of the summit crater. They reported three coalescent cones with the largest cone containing a small lava lake. The lake ejected spatter every few seconds as high as 200 m above the summit; individual bombs reached the base of the cone. Lava flows from the vent extended several kilometers N. Numerous small breakouts formed secondary flows, and a large breakout about 2 km N of the cone fed a large lava flow about 20 m wide. Burning forests were reported to the NNE.
Source: VolcanoDiscovery
According to observations by scientists from the Afar Consortium Project, the fissure eruption at Nyamuragira that began on 6 November 2011 continued on 8 January 2012. The initial scoria cone appeared inactive and second cone formed to the N of the first cone. Both cones were about 300 m high. The second cone was extremely active during the duration of the observations (about 15 hours) with fire fountains over twice the height of the cone; lava flowed N. The observers, about 1.5 km away, felt the heat from the eruption as well as lapilli fall.
Source: Afar Rift Consortium
Satellite imagery acquired on 3 January from the Advanced Land Imager (ALI) on NASA's EO-1 satellite showed an active lava flow to the NE of the central vent over the fissure located 11-12 km ENE of Nyamuragira's main crater. A sulfur dioxide-rich plume was also detected.
Source: NASA Earth Observatory
On 18 November, Virunga National Park reported that lava flows from the eruption along a fissure 11-12 km ENE of Nyamuragira's main crater had possibly stalled. An observer aboard an overflight a few days before noted that the lava did not appear to have moved any further N. A photo taken from the Rumangabo headquarters (7.5 km NE of the eruption site) on 16 November showed a tall cinder cone with lava fountains rising above the rim.
Source: Virunga National Park
According to GORISK (an initiative of the National Museum of Natural History, Luxembourg and Royal Museum for Central Africa, Belgium), the eruption at Nyamuragira that began on 6 November, after two days of intense seismic activity, was located along a fissure 11-12 km ENE of the main crater, close to one of the 1989 eruption sites.
Virunga National Park staff had previously been observing the eruption from a hilltop in Rumangabo, but on 9 November the staff and rangers traveled to the site. After a 3-hour hike, the team viewed the eruption from the S and noted roaring and lava fountains, as well as thunder and lightning. The observers also noted that the ground was covered by black pumice. On 11 November about 100 people, including staff, rangers, carpenters, porters, and volcanologists, traveled to a similar but safer location to set up a camp for visitors. The eruption site was described as a flat area with a 500-1,000-m-long fissure, oriented perpendicular to the Albertine (Western) rift. Lava fountains rose as high as 300 m above a cinder cone. Slow-moving lava traveled N.
GORISK noted that radar images acquired on 11 November showed the largest deformation ever detected by the method (InSAR) since the early 1990's over Nyamuragira. A very preliminary analysis of the observed deformation suggested an affected area of more than 250 square kilometers. The ground rose more than 50 cm at the eruptive site where the spatter cone was developing. Another 15 cm of deformation was detected within the Nyamuragira caldera accompanied by deflation on the flanks. Satellite images acquired on 12 November showed that the lava flow had traveled approximately 11.5 km during the six days of the eruption.
Sources: Virunga National Park; GORISK
Virunga National Park reported that on 6 November a fissure eruption from Nyamuragira began low on the flank, producing slow-moving lava flows that traveled into unpopulated areas to the N. The eruption was clearly observed from the park headquarters. Video posted on the park's website showed a fissure eruption with lava fountains.
Source: Virunga National Park
During 27 January-2 February, the MODIS sensor aboard the Earth Observing System (EOS) satellite frequently detected thermal anomalies from Nyamuragira. The Toulouse VAAC reported that a diffuse ash plume was seen on satellite imagery on 29 January.
Sources: Toulouse Volcanic Ash Advisory Centre (VAAC); Hawai'i Institute of Geophysics and Planetology (HIGP) Thermal Alerts Team
Based on analyses of satellite imagery, the Toulouse VAAC reported that on 18 January sulfur dioxide-and-steam plumes from Nyamuragira possibly contained ash. An ash cloud was visible in satellite imagery the next day.
Source: Toulouse Volcanic Ash Advisory Centre (VAAC)
The Washington VAAC reported a large sulfur dioxide plume in the vicinity of Nyamuragira and Nyiragongo during 10-11 January. According to a news article, lava from Nyamuragira continued to flow S and SW on 6 January, and had traveled 21 km to within 7 km of the road between Goma and Sake. On 7 January ashfall was reported in Goma, 30 km S.
Sources: Washington Volcanic Ash Advisory Center (VAAC); Agence France-Presse (AFP); OpEdNews; Toulouse Volcanic Ash Advisory Centre (VAAC)
According to news articles, Nyamuragira erupted on 2 January from a fissure on the SE flank. Park rangers reported hearing a loud explosion in the early morning before seeing flowing lava. By 3 January, the lava flow had traveled 4.6 km, was 15 m wide, and had burned about 10 hectares of forest in a non-populated area of the Virunga National Park.
Sources: CNN; UN News Centre; Agence France-Presse (AFP); UN Organization Mission in the Democratic Republic of the Congo (MONUC)
A recent report from Goma Volcano Observatory (GVO) noted a seismic swarm from Nyamuragira during 23-27 January and increased seismicity along the East African Rift since then. Scientists who visited the Nyiragongo summit crater on 22 and 24 March saw intense fumarolic activity in the summit crater of Nyamuragira through binoculars. The activity was concentrated in the southern area. GVO noted that seismic swarms typically precede eruptions by 3-5 months and that an eruption could occur from the southern side.
Source: Observatoire Volcanologique de Goma (OVG)
Based on satellite imagery, the Toulouse VAAC reported that during 29 November-2 December emissions from Nyamuragira produced ash plumes to altitudes of 3-6.1 km (10,000-20,000 ft) a.s.l. The plumes drifted W and NW. By mid-morning on 2 December, ash plumes were no longer visible.
Source: Toulouse Volcanic Ash Advisory Centre (VAAC)
GVO reported that on 27 November at 2200, incandescence from a new eruption of Nyamuragira was visible from Goma, about 30 km S. The intense red glow suggested lava fountaining and flows. Sustained long-period earthquake activity had been present since 26 October.
Source: Observatoire Volcanologique de Goma (OVG)
Beginning on 23 October, GVO recorded heightened seismic activity along the East African Rift and around the Virunga volcanoes when a swarm of long-period earthquakes occurred N of Nyamuragira. More than 140 events were recorded at a station 19 km E of the volcano. On 27 October at 1500, another swarm of long-period earthquakes began beneath the same area. More than 300 events were recorded until at least 28 October. At 2010, a M 4.5 tectonic earthquake occurred N of Lake Tanganika, which was followed by several aftershocks. GVO noted that this activity reinforces the likelihood of an eruption in the near future, but volcanic activity would not pose a threat to inhabited areas. The Alert Level for the nearby city of Goma remained at Yellow.
Source: Observatoire Volcanologique de Goma (OVG)
GVO reported that a significant seismic crisis occurred at Nyamuragira during several days in late June. The crisis consisted of swarms of mainly long-period earthquakes, which increased in number daily and peaked on 26 and 27 June. The swarms were recorded by the entire seismic network at the volcano, as far away as 90 km S of the volcano. Most of the events occurred within a 10 km radius around Nyamuragira's summit caldera and were aligned roughly N-S. The depths of the earthquakes ranged from 0 to 30 km, with two main areas of concentration; one between 15 and 25 km deep, and the other between 0 and 4 km. Based on precursory activity before previous historical eruptions at Nyamuragira, GVO reported that a new eruption might occur in the next 2-4 months. They stressed that an eruption from Nyamuragira would not threaten the city of Goma or other inhabited areas.
Sources: Observatoire Volcanologique de Goma (OVG); Jacques Durieux, UN Program Manager
The Toulouse VAAC reported that during 26 May to 1 June there were weak but steady emissions from Nyamuragira and neighboring Nyiragongo (~13 km SE from Nyamuragira). The Goma volcano observatory confirmed that ash fell within a radius of 60 km of both volcanoes.
Source: Toulouse Volcanic Ash Advisory Centre (VAAC)
The Toulouse VAAC reported that satellite imagery showed a weak eruption of ash at Nyamuragira on 25 May.
Source: Toulouse Volcanic Ash Advisory Centre (VAAC)
During a flight over Nyamuragira on 12 May scientists noted that volcanic activity remained strong, but stable. The lava lake at the volcano's summit was in a ~15-m-deep pit and its activity had greatly decreased in comparison to observations on 9 May. The lake's surface had crusted over, with three vents exhibiting Strombolian activity (lava spattering and overflows producing short lava flows). In addition, the eruptive fracture on the volcano's NNW flank had four main cones with very active lava fountains reaching heights of 30-50 m. Small lava flows from the cones coalesced into one wide lava flow, covering a large area to a distance of ~12 km. The TOMS (Total Ozone Mapping Spectrometer) Volcanic Emissions Group reported that sulfur-dioxide clouds were visible on TOMS satellite imagery since the eruption began on 8 May, although some of the gas may be attributed to emissions from neighboring Nyiragongo (~13 km SE from Nyamuragira).
Sources: Observatoire Volcanologique de Goma (OVG); OMI Sulfur Dioxide Group
The Goma Volcano Observatory reported that a new eruption at Nyamuragira, which began on 8 May at 0548, was marked by strong volcanic tremor. Activity began in the volcano's summit caldera and later propagated to the N flank. A reconnaissance flight over the volcano on 9 May revealed an active lava lake in the NNE part of the Nyamuragira caldera. The lake was ~300 m in diameter and had four strong lava fountains in it. In addition, a 2-km-long eruptive fracture on the volcano's NNW flank had several lava fountains along it and two cones being built. Lava poured from many vents, forming one main flow towards the NNW. The flows remained within the National Park boundaries and did not threaten populated areas. Ash fell in several villages on the W and N flanks of the volcano.
Sources: Agence France-Presse (AFP); Observatoire Volcanologique de Goma (OVG); Toulouse Volcanic Ash Advisory Centre (VAAC)
During December, seismicity continued at Nyamuragira and may have increased.
Source: Observatoire Volcanologique de Goma (OVG)
A report issued on 2 May noted an inferred renewal of activity on Nyamuragira. Residents living in the villages of Katale and Tongo, the settlements closest to the volcano, reported rumblings on 30 April, in addition to clear noises of individual explosions. At the same time on 30 April the closest seismic station (Katale) recorded 18 clear explosion signals, directly followed by an important tectonic earthquake located beneath the volcano. In the next hours seismometers registered 7 type-C events and another important tectonic earthquake.
Source: Observatoire Volcanologique de Goma (OVG)
A seismic crisis began at Nyamuragira during the evening of 26 February, with an increase in both long-period and tectonic earthquakes and an increase in tremor amplitude. GVO received reports from residents near the volcano of possible eruptive activity, but GVO scientists' view of the volcano was obscured by clouds. Spasmodic tremor was recorded on 19 and 23 February, lasting several tens of minutes. According to GVO, this seismicity was located very close to the surface. They stated that activity at Nyamuragira was changing very rapidly and an eruption may occur in a matter of days or weeks.
Source: Observatoire Volcanologique de Goma (OVG)
During a flight over Nyamuragira on 27 September, researchers confirmed that the eruption had ended. Only fumarolic activity was observed and weak tremor was recorded.
Source: Observatoire Volcanologique de Goma (OVG)
Scientists observing Nyamuragira, following the eruption that began on 25 July, found that on 6 August the lower part of a fracture on the volcano's N flank was active. They saw three very active lava fountains eject scoria about 100 m high and a very fast moving lava flow travel to the NE from a breach in the lowest part of the fracture. They estimated that about 3 million cubic meters of lava was being emitted per day. By the 7th, activity had dropped significantly, with only one weak lava fountain active and a decrease in the amount of tremor recorded.
Sources: Observatoire Volcanologique de Goma (OVG); UN Office for the Coordination of Humanitarian Affairs (OCHA)
Helicopter flights on 1 and 3 August revealed that the eruption that began on 25 July at Nyamuragira continued at a high rate. Two volcanic cones were visible growing on the eruptive fracture. The cones were built by the accumulation of spatter and ash from two very active 100- to 200-m-high lava fountains. Two large lava flows moved quickly and joined below the lowest cone to form a main flow. The main flow (estimated to be 15 km long) moved toward the NNE and changed direction after a few kilometers to move toward the NE. Many lateral overflows were visible on the E side of the main flow. The front of the main flow appeared to be very wide and lava covered a wide area, though it remained within the National Park boundaries. Permanent tremor was registered. The Alert Level remained at Yellow.
Source: UN Office for the Coordination of Humanitarian Affairs (OCHA)
An eruption began at Nyamuragira on the evening of 25 July that produced a cloud composed of steam, gas, and ash, 100- to 200-m-high lava fountains, and lava flows down the volcano's N and S flanks. According to the seismic record, the eruption began on the 25th at about 1310. National Park guards saw "smoke" rising above the volcano about an hour earlier. Around 1700, lava was seen pouring out of a fracture. Scientists who visited the crater later that day saw that the crater had been cut in two parts by a fracture: NW and SE. Sustained 100- to 200-m-high lava fountains were visible along the fracture. One lava flow traveled to the N from the several-km-long fracture, while a smaller one traveled to the S. On the 27th the lava flows were 6-7 km long and ~1 km wide. Neither flow was a threat to inhabited areas, but they caused large amounts of damage to vegetation within the National Park.
Volcanic clouds produced during the eruption were detected by several satellites. Beginning on 26 July around 0000, a steam-and-ash plume was visible on METEOSAT satellite imagery, below 6 km a.s.l., drifting to the WSW. From the 26th to the 28th TOMS detected 125 to 330 kt of SO2 in a cloud that may have come from the neighboring volcano Nyiragongo, but is believed to be from Nyamuragira. A NASA satellite detected a very large plume that was 400 km long, 300 km wide, and extended to the WSW. Nyamuragira is ~20 km NW of Nyiragongo and 40 km NW of the city of Goma, which was devastated by an eruption at Nyiragongo in January 2002. Scientists do not think the eruption of Nyamuragira is a threat to residents of Goma, but the ash cloud may cause respiratory problems, and threaten animals and crops in its path.
Sources: Toulouse Volcanic Ash Advisory Centre (VAAC); TOMS Volcanic Emissions Group; UN Office for the Coordination of Humanitarian Affairs (OCHA); Associated Press; US Air Force Weather Agency
According to news articles, a team of volcanologists from the UN Office for the Coordination of Humanitarian Affairs and the Goma Volcanological Observatory stated that seismicity dramatically increased at Nyamuragira about 25 February. In a statement released to UN headquarters the team of volcanologists said they expect Nyamuragira to erupt within the next several days or weeks. They added that the population near the volcano should not be worried by the warning. Dario Tedesco, a UN volcanology consultant, expressed concerns that seismic activity near Lake Kivu could upset the balanced layers of carbon dioxide and methane in the bottom of the lake, leading to the release of toxic gases. Nyamuragira is ~13 km NW of Nyiragongo and ~30 km NW of the city of Goma, which was devastated by lava flows from Nyiragongo in January 2002. Nyamuragira last erupted in February 2001.
Sources: Reuters; Associated Press
Volcanologists in the D.R. Congo reported that the intensity of the lava flows decreased in March, but there was a large amount of smoke and relatively high seismic activity. While the intensity of the lava flows lessened, registered seismic activity was at similar levels to December, before the eruption began. Volcanologists visited a new 65-m-high cone named Tumayhini that was formed from the eruption. Two other new cones, named Amani and Kadago, grew on the N side of the volcano.
Source: US Agency for International Development / Bureau for Humanitarian Assistance
The eruption at Nyamuragira that began on 5 February continued, with lava flows mainly travelling down the S flank of the volcano. The UN Integrated Regional Information Network reported on 27 February that a UN-government assessment team that visited the town of Goma, ~40 km S of the volcano, determined that ash and lava from the eruption had damaged agriculture and livestock. The team warned that there was an urgent need for food, medicine, and vegetable seeds in the affected areas of Goma, Kitshanga, and Kalungu. According to the Goma Volcanological Observatory, a new eruption began on 2 March with eruptive activity concentrated mainly on the S flank. The Observatory stated that wind had blown ash towards the W and ash fall had destroyed ~50 km2 of pasture and 150 km2 of crops up to 30 km from the volcano in the towns of Rusaya, Kirolirwe, Burungu, Minova, the Masisi territory, and the S part of Kichanga. Ash and gas from the eruption have caused many people in those areas and Goma to experience fever, diarrhea, headache, conjunctivitis, and respiratory problems.
Sources: Reuters; Observatoire Volcanologique de Goma (OVG); IRIN News
According to a Reuters article, the eruption at Nyamuragira that was first observed on 6 February continued at least until 18 February. There were reports of lava flowing from three cones, "flames" rising 100 m above the volcano, and ash falling over an area of 20 to 30 km2 around the volcano. Lava flowed down the S flank of the volcano, threatening to reach roads running N from the town of Goma ~30 km away. Scientists from the Lwiro Natural Science Research Centre in Bukavu said abnormal activity was initially detected in December. There was a report of one injury from the volcanic activity; a man lost his leg after accidentally stepping into a lava flow. Officials said that the effect of ash fall on crops, pastures used for grazing, and the water supply could devastate the region.
Scientists from the University of Hawaii used MODIS to monitor the positions of the lava flows on the volcano. They created hot spot maps that show the positions of thermal anomalies that were detected on 7, 8, 11, and 12 February. An approximately 7x5 km large hot spot was detected on 7 February 7-10 km N of the summit. By 8 February the anomaly had increased in size and was oriented in a SSW-NNE direction; a second hot spot, ~13x6 km in size and oriented towards the E-ESE, was detected SSE of the summit. On 11 and 12 February the NNE-trending NE-flank hot spot reached a maximum distance of ~22 km and the E-trending S-flank hot spot extended ~17 km.
Sources: Reuters; Hawai'i Institute of Geophysics and Planetology (HIGP) Thermal Alerts Team
According to a preliminary report from USAID/OFDA, Nyamuragira began erupting at 0032 on 6 February. Observations made during a flight over the volcano revealed that there were active lava flows. The lava appeared to be flowing from two fissures; one to the W towards the town of Kitchanga, and another to the S in the direction of the town of Mugunga (Sake) and Nyiragongo volcano. Smoke was observed near the volcano and the sound of thunder was heard. Cloudy conditions prevented clear observations of the volcano.
Source: US Agency for International Development / Bureau for Humanitarian Assistance
Reports are organized chronologically and indexed below by Month/Year (Publication Volume:Number), and include a one-line summary. Click on the index link or scroll down to read the reports.
Eruption started on 24 March from the S flank
Card 1161 (29 March 1971) Eruption started on 24 March from the S flank
"An eruption started 24 March 1971 on the south slopes of Nyamuragire volcano."
Information Contacts: Sergio Bottazi, Gisenyi, Rwanda.
Lava flows and widespread tephra deposition
Card 1164 (01 April 1971) Glow from lava flows seen on second night of the eruption
"The first tell-tale glow was detected early on the night of 24 March on the SW slopes of Nyamuragira . . . . The volume of the spill on the second night must have assumed important proportions, judging from the glow, though still rather localized. A vent must have occurred inside the boundaries of the Albert National Park . . . . Noisy thunderstorms occurred on the previous days, as well as periods of sustained wind, which is rather out of season at this time of year."
Card 1187 (30 April 1971) Tephra-fall up to 60 km away damages crops
"The eruption of Nyamuragira probably began on the day of 24 March and rapidly took spectacular proportions. It is within the confines of the Albert National Park. The base can be reached with a walk of 5 hours going and 3 hours returning. The flow of lava is already established as important and flows towards the west. The deposit of volcanic cinders, 'tephra' is very widespread having reached a locality 60 km away and has caused serious damage and trouble to the population and to the breeding of livestock as well as crop cultivation. The observation of the eruption is naturally very spectacular during the night but it is ncecessary to equip yourself with warm clothing for the observation points are found at 3,000 m altitude above sea level."
Information Contacts:
Card 1164 (01 April 1971) Sergio Bottazi, Gisenyi, Rwanda.
Card 1187 (30 April 1971) Sergio Bottazi, Gisenyi, Rwanda.
Lava eruption from new SW flank crater on 23 December
An eruption from a new crater on the SW flank of Nyamuragira began on 23 December. The eruption was not believed to present any danger to life or property.
Information Contacts: Agence France Presse (AFP); Brussels Domestic News Service (DNS).
Additional information about late-December 1976 activity
The eruption of Nyamuragira began at about 1540 ["about 1200" below] on 23 December, from a new flank crater 8 km SW of the summit. Lava fountains 150-200 m high formed a 70-m spatter cone around the vent. Two lava flows were extruded, one that extended about 3 km to the SW, the other about 1 km to the W. The eruption was continuing as of 31 December.
More than 10 times the normal number of volcanic earthquakes were recorded on 11 December from Lwiro (~l00 km SSW of the volcano), and significantly more than the normal number on 12, 21, and 22 December. The March-May 1971 eruption of Nyamuragira took place at Rugarama, on the NW flank (Pouclet and Villeneuve, 1972) rather than the SW flank or the summit crater as reported elsewhere.
Reference. Pouclet, A., and Villeneuve, M., 1972, L'Eruption du Rugarama (Mars-Mai, 1971) au Volcan Nyamuragira: Bulletin Volcanologique, v. 36, p. 200-221.
Information Contacts: S. Ueki, Institute de Recherche Scientifiques Afrique Centrale (IRS).
Lava flows from a new cone on the S flank
At about 1200 on 23 December, an eruption began from the NE end of a 1-km-long, N45°E-trending fissure on the SW flank of Nyamuragira. Explosive activity was concentrated at 3 locations along the fissure, building 3 small cinder cones. The cones were breached to the W and a little lava was extruded in that direction (flow l, figure 1). The next night, activity shifted to the SW end of the fissure and a new pyroclastic cone (Murara) began to grow. Cinders and lapilli fell within a 1 km radius of Murara, and a lava flow (flow 2, figure 1) moved southward from a breach in the SW wall of the crater. Extrusion of flows 3 and 4 had begun by 6 and 10 January 1977 respectively.
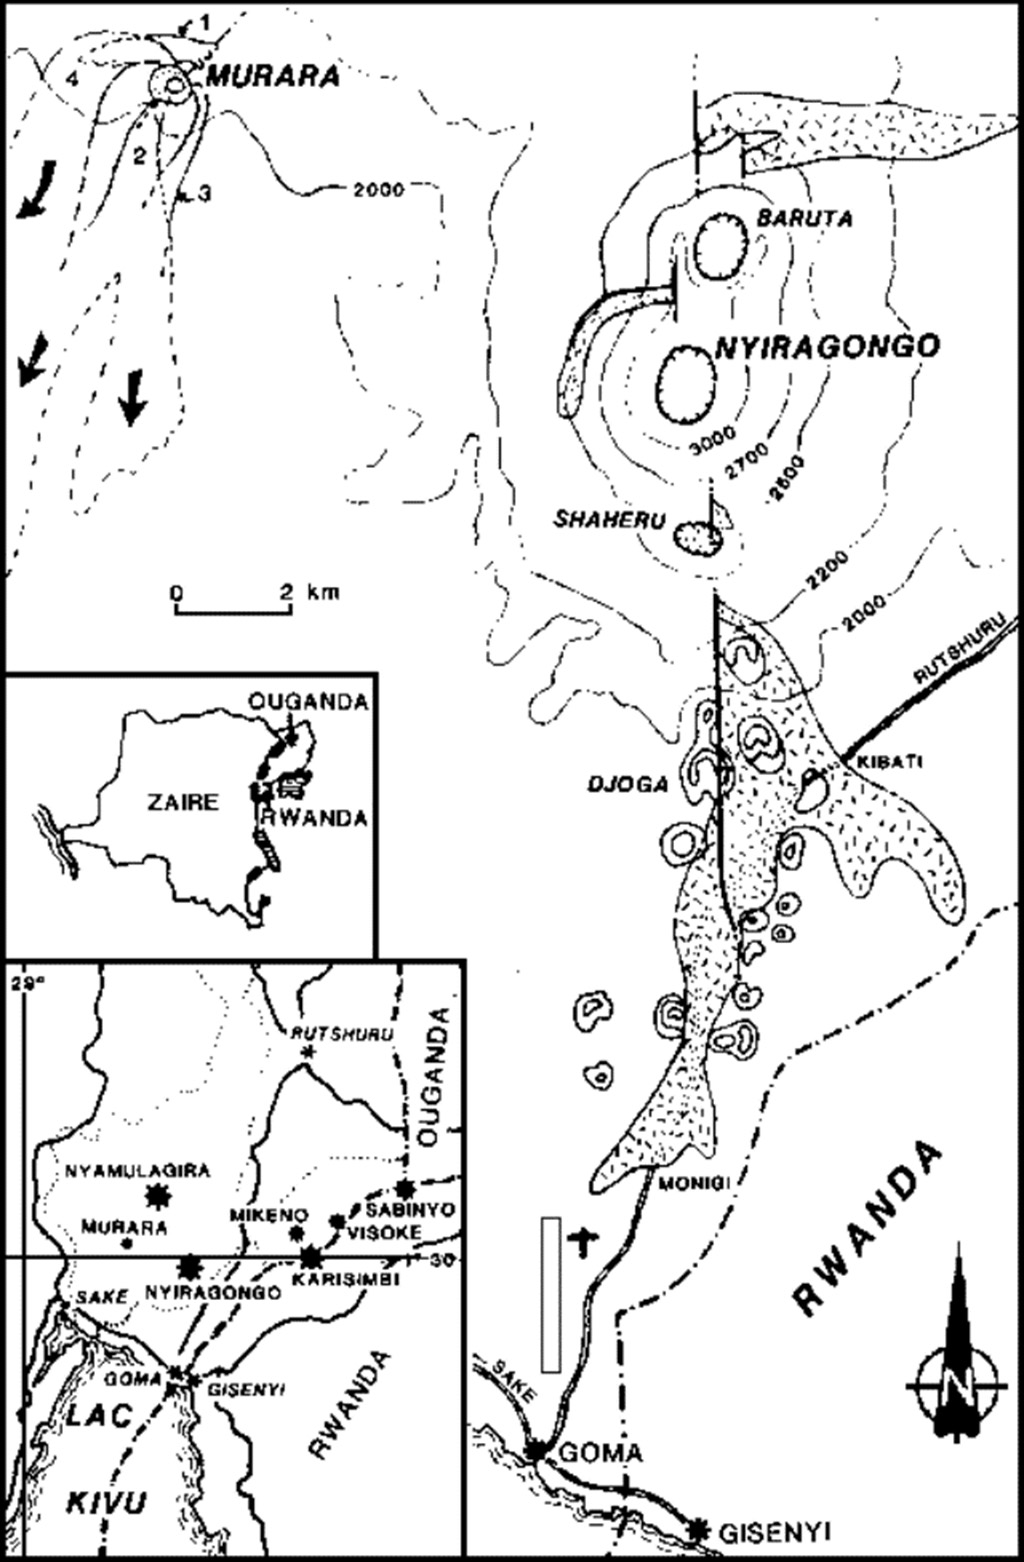 |
Figure 1. Map of eruption sites and lava flows at Nyiragongo and Nyamuragira's 1977 Murara vent. The location of the stippled flow on Nyiragongo was provided by M. Krafft. Courtesy of Y. Pottier. |
On 18 January, Murara was 150 m high, and a flow rate of l0 m/minute was measured 150 m from the vent. The flow rate had slowed to 2-4 m/minute by the next day, and the lava had nearly solidified by evening. Explosions increased in intensity, sending ejecta 500-600 m high every 2 seconds. Lava effusion had resumed from the N foot of Murara by 27 January. On 28 January, six subsidiary craters opened within 200 m of the N foot vent. Lava extruded from these craters rapidly coalesced into a single flow; its front was 6 km from Murara on the 28th. A 60-m-diameter lava lake was observed on 10 February in Murara's crater, and small pahoehoe flows were issuing from the SW foot.
Further Reference. Brousse, R., Cochemé, J.J., Pottier, Y., and Vellutini, P.J., 1979, Eruption and lavas of Murara: new volcano (December 1976-April 1977) in Kivu (Zaire): C.R. Acad. Sci. Paris, serie D, v. 289, p. 809-812.
Information Contacts: Y. Pottier, IRS; M. Krafft, Cernay; H. Tazieff, CNRS.
Lava flowing northward
The Agence Zairoise de Presse (AZAP) news agency reports that an eruption from the N side of Nyamuragira began at 2100 on 30 January. As of 1 February lava was moving northward toward the agricultural community of Mweso at what was described as a "quite rapid" rate. A "considerable" distance and area had been covered by the lava.
Information Contacts: AZAP.
Hot tephra and gases kill livestock and plants
Citing an information bulletin sent to regional authorities by scientists at IRS, AZAP news agency reported that extrusion of a new lava flow began at 1423 on 11 February from the N flank vent active since 30 January. By 20 February the new flow had advanced ~7 km and the extrusion rate had increased. Incandescent tephra and poisonous gas spread by violent winds killed livestock and vegetation, but no loss of human life has been reported.
Information Contacts: AZAP; IRS.
Large lava flows and new cone on N flank
The Lwiro seismological station, 95 km S of Nyamuragira, recorded the onset of volcanic explosions at 1330 on 30 January. A new fissure, trending N20°E, opened on the N flank of the volcano. During the first week of activity, lava was extruded from 150 m of the fissure, with fountain heights exceeding 100 m. Beginning 6 February, the zone of fountaining along the fissure was reduced in length and a new cone (named Gasenyi) began to form 3 km N of the summit at 2,400-2,500 m above sea level and adjacent to an older cone (figure 2).
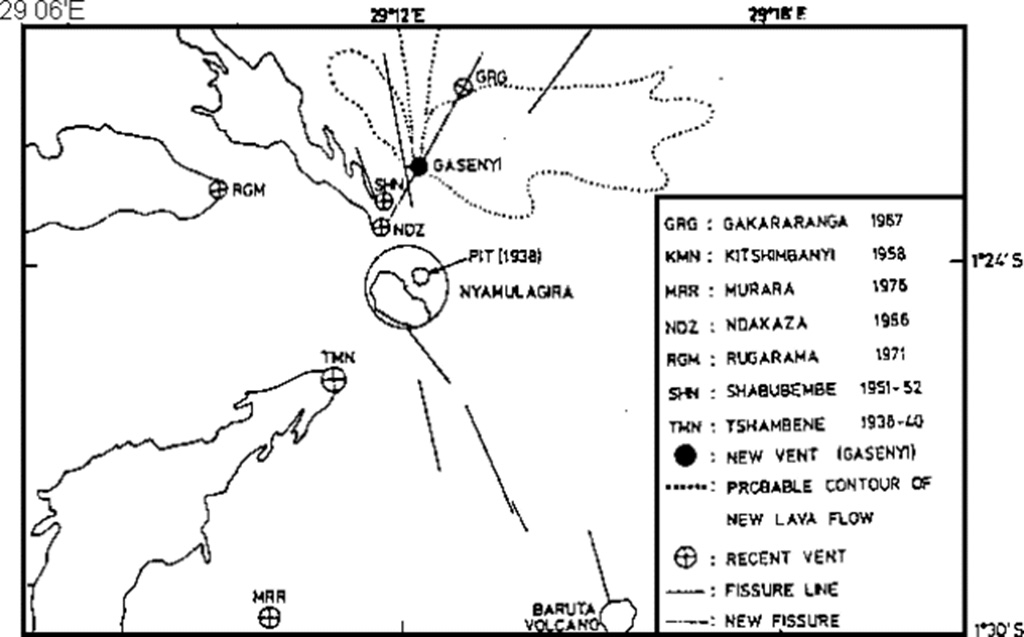 |
Figure 2. Map of Nyamuragira and vicinity showing approximate outlines of major lava flows from the new 1977 cone. Courtesy of N. Zana. |
Lava initially flowed NE, covering an area 2 km long and 0.5 km wide, with a maximum thickness of about 1 m. The second (main) flow moved more than 7 km, then turned in a northeasterly direction, over the 1958 Kitsimbanyi Flow, destroying a 13 km-long section of forest in Rwindi National Park. This flow reached a maximum width of 2.5 km, and was less than 0.5 m thick at its front. Three temporary seismic stations installed by the Geophysical Department of IRS began to record long-period microseisms at 1200 on 10 February.The next day at 1623, a new vent opened at the S end of the new cone, extruding a third lava flow that traveled over 7.5 km in a N70°E direction. This flow was about 1.5 m thick near the vent.
Explosions from the two vents were vigorous and often very noisy. Occasionally, both vents were active simultaneously, but explosions usually alternated between them, building a double cone with estimated dimensions of 100 m height and 200-300 m width by 17 February.
Katia Krafft flew over the eruption on 18 February. Fountains rose about 100 m from the two vents, which were within an active lava lake contained by the double cone. Extrusion of the small lava flows continued. Similar activity was continuing when she reached the volcano on the ground late 20 February. Red glow from the lava moving to the N was visible that night. Fountaining continued 21 February and aa lava was extruded slowly from the base of the N vent. More vigorous fountaining began that evening and a third vent was occasionally active. Lava was ejected to 120 m above the S vent. Discontinuous explosions occurred from the N vent, which overflowed during the night.
Microseismic activity recorded by IRS seismic stations declined sharply on 22 February. By 0300 on 23 February, lava extrusion had stopped and only a few feeble explosions were occurring from the vents. Only weak gas emission was observed the next day. Katia Krafft reports that both aa and pahoehoe flows were observed, and the lavas contained xenoliths of melted granite, pumice and porcellanite, as in most flank eruptions of Nyamuragira.
Further Reference. Brousse, R., Caron, J.P., Kampunzu, A.B., and others, 1981, Eruption et nature de la lave du Gasenyi: un nouveau volcan (Janvier-Fevrier 1980) au Flanc Nord du Nyamulagira (Kivu, Zaire): C.R. Acad. Sci. Paris, serie II, v. 292, p. 1413-1416.
Information Contacts: N. Zana, IRS; K. Krafft, Cernay; Y. Pottier, Univ. Paris-Sud.
Fissure eruption; lava flow and tephra column
A 400-m-long fissure opened before dawn 26 December in the saddle between Nyamuragira and Nyiragongo. The exact location of the fissure was not known at press time, but there are numerous old vents within the 14 km, NNW-trending rift zone between the two volcanoes. Activity began, probably at about 0130, with a strong explosion from the upper end of the fissure (at 2,300 m altitude) that ejected a 3-4 km-high tephra cloud. After the initial explosion, lava was extruded from the lower end of the fissure and flowed N. Residents fled the area. Images from the NOAA 7 satellite showed a large hot area between the volcanoes at 0230 on 27 December that had not been present 24 hours earlier. By the afternoon of 30 December, the lava flow was 15-20 km long, but only 300-400 m wide. Lava fountaining was continuing and a cone was growing at the vent. Tephra ejection was also continuing, preventing aircraft from flying near the active fissure, although it was not as vigorous as during the initial explosion.
Shallow earthquakes occurred 18 November at 1118 and 1234 at 2.11°S, 22.83°E and 2.22°S, 22.52°E, about 725 km ESE of Nyamuragira in an area that is not normally seismically active. Kampala Domestic Service reported a felt earthquake in the Bushenyi district of Uganda, ~150 km NE of Nyamuragira at 0300 on 30 December.
Information Contacts: M. Krafft, Cernay; M. Matson, NOAA; USGS/NEIS; Kampala Domestic Service, Uganda; WCBS Radio, USA.
30 km lava flows; heavy tephra falls
A fissure eruption from the SE foot of Nyamuragira started during the night of 25-26 December. Ground observers first noted activity about 0130 on 26 December, but satellite data indicated that the eruption may have begun as much as 2 hours earlier. According to the satellite data, lava flowed slightly N of E for 6-8 km, then turned more to the N. By 0100 on 26 December, the flow front appeared to be 12-14 km from the vents, but its advance had slowed substantially from the initial rate of 20-24 km/hour to less than 6 km/hour.
The source of the eruption was a 1.5-km-long zone of en echelon fissures, trending roughly N70°W at 2170 m altitude (figure 3). Lava initially fountained from the entire length of the fissure zone, but activity was soon confined to its SE (and lowest) end. After a few days, 400-m-wide lava flows had advanced as much as 30 km, destroying forest in Virunga National Park. A plume of scoria and ash rose 6 km or slightly more. A large quantity of tephra, including Pele's hairs and tears, fell within 25 km of the vents, damaging vegetation and killing many animals (see below).
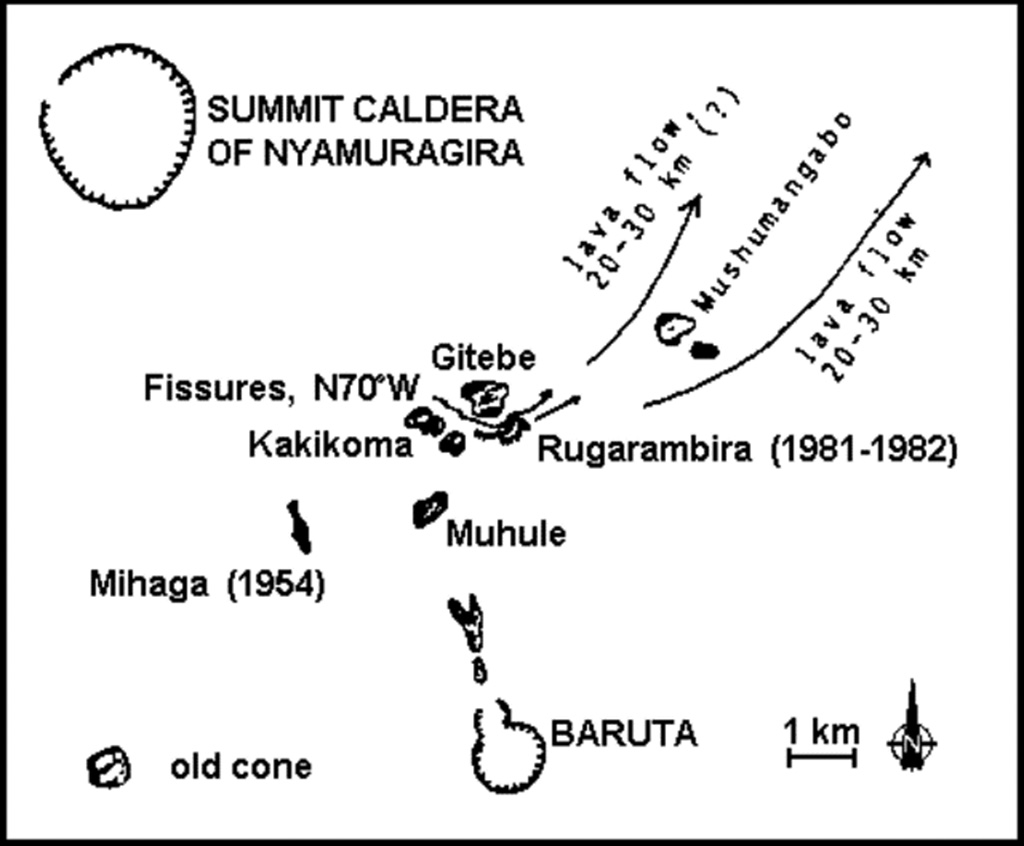 |
Figure 3. Sketch map showing 1981-82 eruption fissures, directions of lava flows, and surrounding older cones. Courtesy of K. Krafft. |
When Katia Krafft began field work at the eruption site 3 January, a pair of lava fountains, 100-200 m high, was emerging from a small lava lake in the asymmetrical cone that had formed over the SE end of the fissure zone. The E wall of the cone, near the dominant vents, was about 100 m high, but the W wall was only about 30 m high. An aa lava flow a few meters wide cascaded from a breach in one wall of the cone and moved downslope at ~20 km/hour, but within 50 m had widened to 10 m and slowed to 7 km/hour as it passed through a channel between 5-m-high blocks. A scoria column rose about 1 km. Fountaining became more vigorous about 2200 on 3 January, but had declined to its previous level by the next morning. A second increase in lava fountaining, to as much as 200 m height, began suddenly about 1300 on 4 January. Scoria up to 5 cm in diameter fell 3 km from the vent, as during the first week of the eruption. Explosions occurred every few seconds during the early afternoon. Shock waves from explosions occasionally shook tents 3 km away, but these could not be correlated with increases in lava fountain heights. Strombolian activity from a third vent, in the NE part of the cone, began abruptly during the early evening. Dark plumes of ash and scoria were occasionally ejected from this vent.
Lava fountaining was much weaker 5 January, but the rate of effusion of the lava flow remained constant that day, then increased during the evening of 6 January. The lava cascade through the breach in the crater wall widened to at least 10 m and lava flowed away at 20 km/hour, but a crust formed over the flow 50 m from the crater. Incandescent fissures appeared in the NE wall of the cone. During the next 24 hours a large quantity of lava was discharged, forming a mass of blocks in a steep 10-m-high crest at the edge of the flow. A small flow, 1-2 m thick, moved toward the E then turned NE for about 1 km; the lava formed slabs near the vent then changed to an aa flow downslope.
A team of Japanese seismologists measured strong seismic activity 6-9 January, then a decrease on the 10th. Residents of Goma, Zaire (30 km from the volcano) and Kigali (the capital of Rwanda, ~120 km away) felt a strong earthquaket 9 January at 1927, but the event was not noticed by geologists near the volcano and was not recorded by the Worldwide Seismic Stations Network (WWSN). The effusion rate and speed of the lava flow remained unchanged 9-11 January, but the height of the lava fountains decreased. The eruption ended during the night of 14-15 January.
Heavy tephra falls occurred N, E, and S of the cone. By the time the eruption ended, 1.5 m of ash and scoria had fallen within 1.5 km of the vents and deposits were more than 0.5 m thick 3-4 km away; only a few cm of tephra fell W of the vents. All shrubs and trees in the area were stripped of leaves and bark. Many birds and rodents similar to small rabbits were killed in the tephra fall area. Within about a dozen km of the cone, the eruption created a microclimate characterized by numerous violent thunderstorms with torrential rains and hail during Krafft's eight days of observations.
The scoria was very vesicular and was not found in large fragments because it exploded upon striking the ground. A few bombs weighing 1-2 kg were thrown as far as 100 m from the cone during Krafft's field work. The lava was a basanite with numerous augite and olivine phenocrysts. Numerous xenoliths, coated with a thin glaze of lava, were ejected during the eruption, both by the explosive activity (in fragments 5-20 cm in diameter) and in the lava flows. The xenoliths were whitish to yellowish, and spongy, consisting primarily of büchite (altered quartzite) and porcellanite (altered argillaceous schist).
[Later analysis of Nimbus-7 satellite data by Krueger and associates revealed the emission of a large SO2 plume at the start of the eruption at the end of 1981. This plume is thought to be the source of the early 1982 "Mystery Cloud" of stratospheric aerosols detected by atmospheric scientists before the much larger March-April 1982 El Chichón eruption.]
Further Reference. Kampunzu, A. B., Lubala, R. T., Brousse, R., and others, 1984, Sur l'eruption du Nyamulagira de Decembre 1981 a Janvier 1982: Cone et Coulee du Rugarambiro (Kivu, Zaire): BV, v. 47, p. 79-105.
Information Contacts: K. Krafft, Cernay; N. Zana, IRS.
Lava flows from NW flank
A NW flank eruption began 23 February at 1013 and was continuing in early March. By the end of February, two lava flows had extended 10 km. More than 25 eruptions have been documented from Nyamuragira since 1882.
Information Contacts: IRS; M. Krafft, Cernay.
Large lava flows and tephra ejection from flank fissure
The NW-flank fissure eruption ended during the evening of 14 March. Lava flows covered a large area and a substantial quantity of tephra was deposited near the vents.
An A-type volcanic earthquake at 0323 on 23 February was followed by volcanic tremor. A fissure trending N100°E began opening gradually from E to W at 1013. Lava issued from the entire fissure during the first day of the eruption, but activity soon concentrated at two vents ~400 m from the E end of the fissure and two others ~1.5 km to the W (A and C on figure 4). About a week later, a new vent (B), ~500 m W of the E vents, began to emit lava, but at a lower rate than the other vents.
Lava extrusion was accompanied by explosions that could be heard 25-30 km away, along the W margin of the rift valley. About 2 m of scoria and many spindle bombs were deposited within 600-800 m S of the E vents. A bomb weighing ~12 kg was found 600 m away. N. Zana judged the volume of ejecta to be much more than in the 1976, 1980, or 1982 eruptions.
When Zana visited the eruption site 8-11 March, activity had ended at the W vents and was declining at the new vent. Both aa and pahoehoe were observed between the new vent and the W vents. Cones at the W vents stood about 80 m above the surface of the lava. At about 2300 on 10 March an aa lava flow from the E vents flooded the area of the new vent and carried away its small cone. This flow was still moving S about 0900 on 11 March. By 11 March the composite cone at the E vents had a basal diameter of 300 m and was ~250 m high, but activity was becoming intermittent.
Eruptive activity, including the explosions, ceased on the evening of 14 March. Night glow disappeared 16-17 March. Lava had flowed 20 km to the W and the lava field had an average width of 2.5 km (figure 5). The new cones have been named Kivandimwe, meaning "things running together."
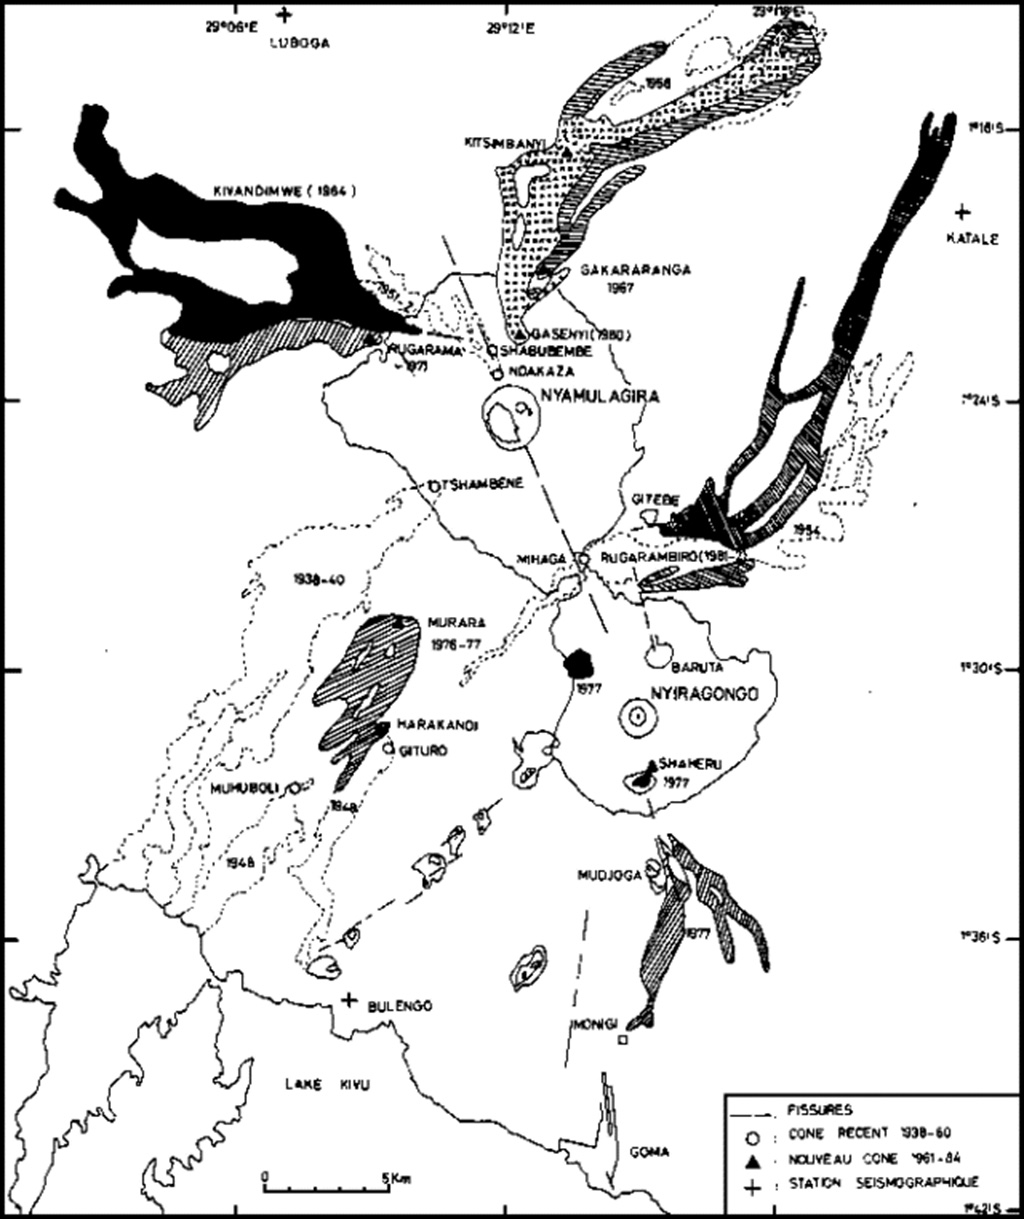 |
Figure 5. Map of the Nyamuragira-Nyiragongo area showing recent vents and lava flows. The 1984 lava flow is shaded solid black. Courtesy of N. Zana. |
Information Contacts: N. Zana, IRS.
Reported S-flank eruption
An eruption began on 16 July at 1500 [but see 11:8] from a fissure near the 1976 eruption site of Harakandi, on the SSW flank at ~2,200 m elevation. High lava fountains produced a lava flow to the SW. By 18 July, lava fountains were still 200 m high, and at the end of one week, the lava flow had extended 10 km SW toward Lake Sake, before ponding and spreading. Degassing was abnormally high from the two vents formed on the eruptive fissure, compared to previous eruptions. Inspection of 11-20 July satellite imagery did not reveal an eruption plume, but heavy weather clouds obscured the area.
Information Contacts: M. Krafft and K. Krafft, Cernay, France; W. Gould, NOAA.
SSW flank fissure eruption feeds 17 km lava flow
An eruption began on 16 July at 1135 from a SSW-flank fissure ~1.5 km long. The fissure trended SW-NE (the orientation of the regional rift axis) and was located at 2,250 m altitude, 3.5 km SW of the S edge of the caldera [but see 12:8], between the three small cones formed during the 1938 (Tschambene) eruption. A pair of lava fountains 200-250 m high emerged from the fissure, building an elongate cinder cone 150 m high, with a breached crater. Lava flowed to the SSW, around the W side of Shove cone, then continued SW, advancing 17 km in two weeks before stopping 2 km N of the Goma-Sake road. At the end of July, continuous fountaining ended and activity declined to intermittent Strombolian explosions, then stopped for ~24 hours on 1 August.
The eruption resumed on 2 August at about 1700, producing a lava fountain 150 m high. A small lava lake filled the crater and cascaded over the S wall of the cone. Minor overflows formed a small lava field, with lava flowing in tubes near the cone, but the main flow had stagnated. Activity briefly declined on 7 August and stopped for 12 hours on the 8th, then a new lava fountain developed the next day. Some strong phreatomagmatic explosions occurred from the previously active vent. Six or seven blocks of lava as large as 100 m across floated on top of the flowing lava, moving downslope at ~2 m/hour. A slow decline in activity began on 13 August, but continued from three small Strombolian vents until the eruption stopped. Since 21 August, only fumarolic activity has been observed.
Lava volume was estimated at 150-200 x 106 m3. In hand specimen, the lava appeared to be a typical Nyamuragira hawaiite.
Information Contacts: M. Krafft, Cernay, France; J. Durieux, GEVA, Lyon, France.
Correction to July 1986 eruption site
New observations show that the July 1986 eruption vent was located 4.5 km S of the caldera's edge at the S foot of Kitazungurwa in Mashiga (figure 6) rather than... 3.5 km SW of the caldera's edge.
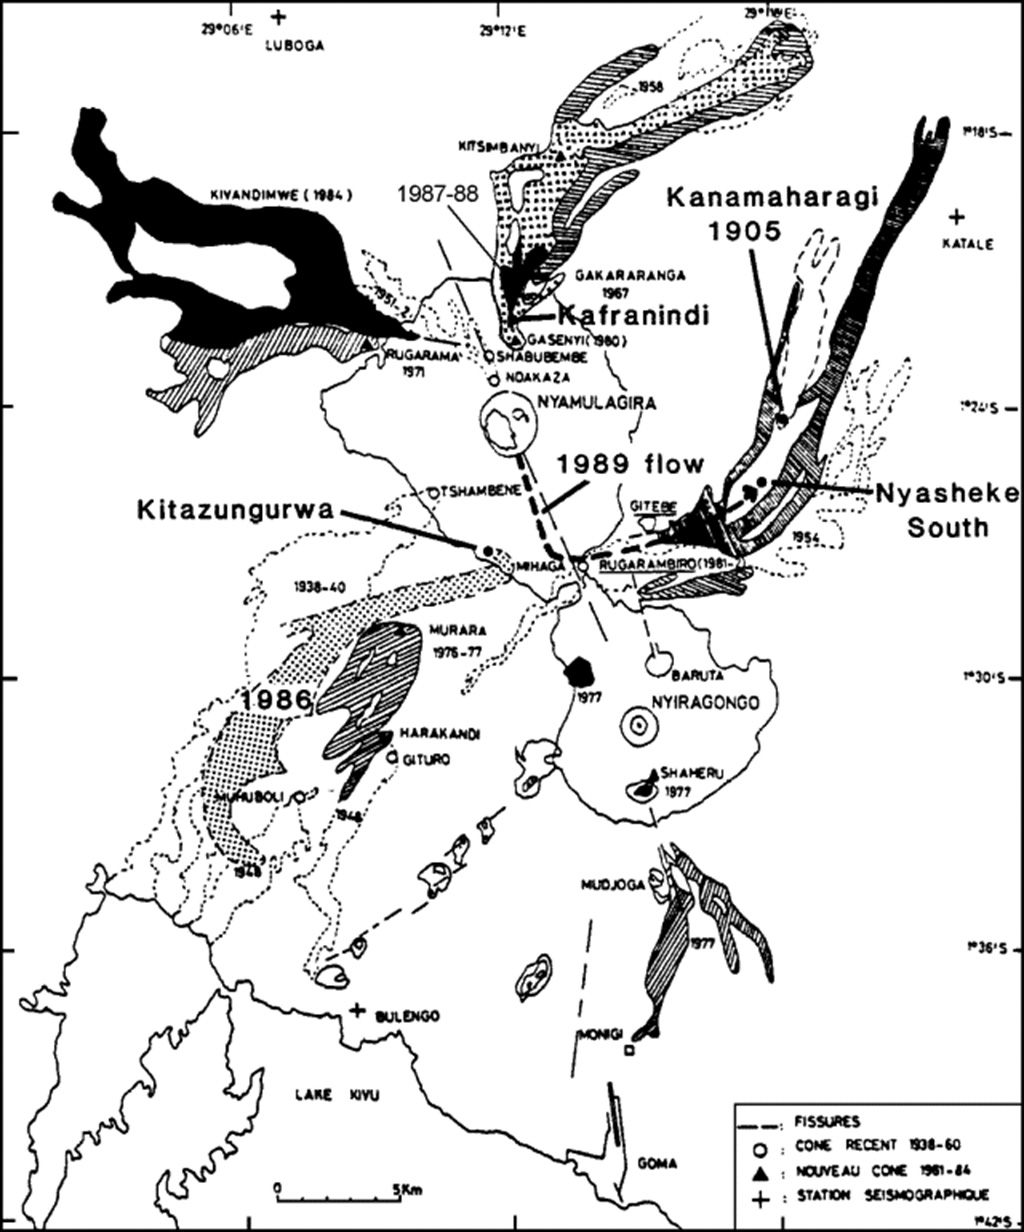 |
Figure 6. Map of the Nyamuragira/Nyiragongo area by N. Zana (1984), appended with vents and flows through 1988. The heavy dashed line indicates the approximate path of the 1989 flow. |
Information Contacts: B. Louant, GEOVAR, Kigali, Rwanda.
Lava flow and fountaining
An eruption began at about 2200 on 30 December from a new vent ~600 m NW of the 1980 Gasenyi Cone [but see 13:2]. A lava flow with an average width of ~500 m extended 2.5 km N. On the morning of 3 January a lava fountain was still intermittently active. Eruptive activity probably stopped that afternoon.
Information Contacts: N. Zana, Institut de Recherche Scientifique, Bukavu; H-L. Hody, GEOVAR, Kigali, Rwanda.
Seismic swarm, then lava flow from N flank fissure vent
Seismic data from the [CRSN] indicated that N-flank lava production began at about [2200] on [30] December and continued until 4 January at about 1400. The new vent[s], named [Gafuranindi], were about [1700 and] 800 m N of the 1980 cone, along a fissure that trended N20°E. New lava, mostly pahoehoe as in 1980, covered an area 2.5 km long and 500-600 m wide (figure 6). The activity built [two small cones] to ~60 m above the lava field. The eruption was preceded by an earthquake swarm on 10-11 October. Seismic activity had then gradually increased until the onset of lava production.
Further Reference. Zana, N., Tanaka, K., Janssen, T., and Mukeng, K., 1988, Seismic behaviour of volcanoes Nyiragongo and Nyamuragira prior and during eruptive episodes: Proceedings, Kagoshima International Conference on Volcanoes, p. 547-550.
Information Contacts: N. Zana, CRSN, Bukavu; H-L. Hody, Kigali, Rwanda.
Lava erupts from summit and E flank
An eruption that began on 23 April in Nyamuragira's summit crater was reported by the Vice Conservator of the Institut Zairois pour la Conservation de la Nature, Parc National des Virunga. On the 24th at 1418, three lava fountains emerged from a fissure on the SSE flank of the volcano. Incandescence was visible from the village of Gisenyi, Rwanda, roughly 30 km from the vent. The resulting lava flow passed between Kitazungurwa and Rugarambiro cones, diverted around Gitebe cone, and flowed along lava erupted in 1981-82 from Rugarambiro (figure 6). By the 26th, the flow had reached Nyasheke-South and was ~6 km from Kakomero, the base camp for climbers at the park entrance.
On the night of the 26th, lava emerged from the W side of the Kanamaharagi cone (formed during the 1905 eruption), building a new parasitic cone (also named Kanamaharagi) at ~1,860 m altitude. Lava fountains up to 200 m high and large amounts of tephra were emitted 30 April-1 May. As of 6 May, the volcano was still erupting.
Information Contacts: S. Peyer and H. Peyer, Gisenyi, Rwanda; H-L. Hody, GEOVAR, Kigali, Rwanda.
Inflation precedes fissure eruption; large lava flows
In August and September 1988, M. Kasahara of Hokkaido Univ and K. Mukeng of the CRSN in Lwiro performed a geodetic survey of the summit crater along eight baselines (figure 7). The measurements showed inflation of the crater in all directions with the principal strain oriented N49°E. [The deformation caused geologists to expect either a rejuvenation of the lava lake or future eruptive activity in the central crater.]
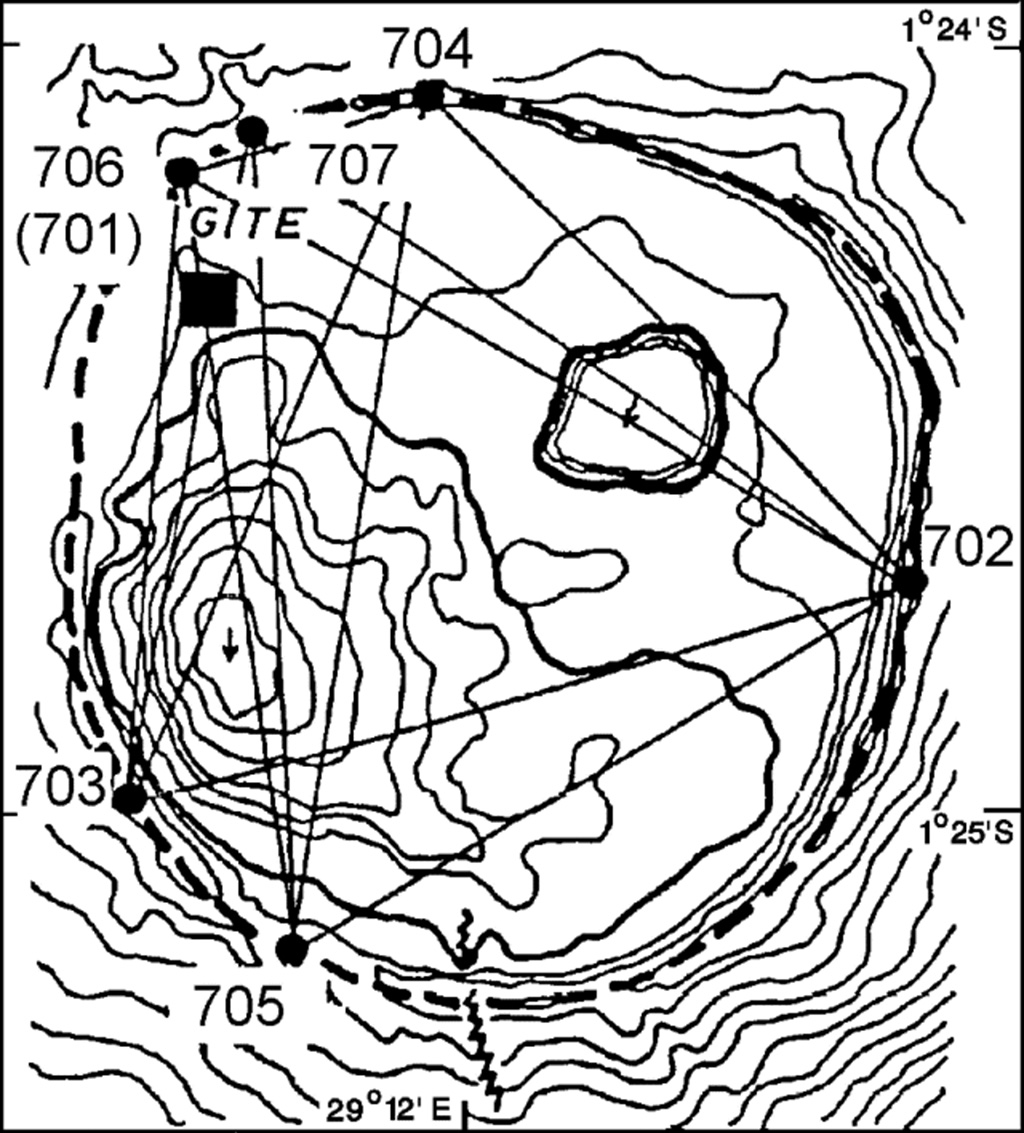 |
Figure 7. August-September 1988 geodetic survey of Nyamuragira's summit crater. Courtesy of M. Kasahara and K. Mukeng. |
On 24 April [1989] at 1325, a small NW-trending fissure opened in the central part of the summit crater, emitting lava that flowed S (figure 8) and a mushroom-shaped ash plume that was observed at Katale seismic station (~20 km from the crater). Thirty minutes later, a second vent opened on the SE slope ~500 m from the crater rim. Activity continued until 26 April, producing a flow 8 km long and 400 m wide.
A third vent (named Kimanura) opened 26 April ~500 m N of the 1905 (Kanamaharagi) cone (1.43°S, 29.3°E, altitude 1,869 m). The vent propagated S and lava production was confined to a zone just W of the 1905 cone. When geologists visited the vent on 14 May, they observed continuous lava fountaining and frequent bomb ejection. A new cone 300-400 m in diameter stood 80 m high and an active lava flow (intermittently forming tubes) extended 20 km N. After 24 May, fountaining became intermittent and activity changed to Strombolian type. Vigorous scoria emission accompanied the initial activity of both the SE flank and Kimanura vents. Scoria deposits extended >5 km W of Kanamaharagi cone.
Information Contacts: N. Zana, CRSN, Bukavu; H-L. Hody, GEOVAR, Kigali, Rwanda.
Landsat data suggest continuing activity at April vent
Data recorded 4 August at about 0930 by the Landsat TM show a hot area (10 km E of the summit crater, near Kimanura cone) with thermal radiation in TM band 7 (2.08-2.35 µm). The hot area occupied ~5 pixels (each 30 x 30 m), with temperatures averaging ~200°C across each pixel. D. Rothery noted that the thermal sources were probably hotter than 200°, but occupied only a fraction of each pixel. Although no flows were detected leaving Kimanura vent, Rothery suggested that it was probably still active. [Rothery adds "Following this report, personal communications from Henry-Luc Hody and Bernard Louant revealed that the radiant pixels were coincident with a fumarole field that was active between at least August 1989 and April 1990. Thus, the Landsat observation is one of the earliest and clearest demonstrations that high surface temperatures associated with fumaroles can be detected by short-wavelength infrared satellite imaging."] The April-May flows were still warm and showed thermal anomalies in the traditional thermal infrared band 6 (10.5-12.5 µm). No thermal radiance was detected at shorter wavelengths.
Information Contacts: D. Rothery, Open Univ.
Lava flows and plumes reported
An eruption . . . apparently began on 20 or 22 September . . . . On 24 September, the Nimbus-7 satellite's TOMS showed an SO2 enhancement, just above detection limits, centered immediately over the volcano. A small amount of SO2 may have been present the previous day, but increased SO2 was not evident 20-22 or 25 September. No additional reports of activity were received until the crew of a British Airways flight observed an eruption cloud rising to ~7.5 km altitude on 15 October at 0555. In a report received 18 October, observers in Goma, Zaire (roughly 30 km S of the summit) described lava flows to the NW and SE [but see 17:1] and an eruption cloud rising to ~3.5 km from a site at 1.28°S, 29.22°E (on the NNE flank) [see slightly revised coordinates in 17:1]. South African Airways reported a plume to ~7.5 km altitude, probably on 20 October.
Information Contacts: ICAO; S. Doiron, GSFC; H-L. Hody, GEOVAR, Kigali, Rwanda.
Earthquake swarm, then fissure eruption feeds lava flows
The following paragraph, from M. Kasahara, K. Tanaka, and N. Zana supplements last month's report.
After 25 months of quiet, an eruption began at 0130 on 20 September, from a N30°E fissure [see slightly revised trend in 17:1] ~15 km NE of the summit caldera and 5 km NE of the 1958 (Kitsimbanyi) eruption site (figure 8). An earthquake swarm began about a week before the eruption (figure 9), but gradually declined between 16 September and eruption's onset, with changing seismic waveforms reflecting a shift to lower frequencies. The start of the eruption was witnessed from ~10 km SE (at Rumangabo) and clearly recognized by the appearance of continuous tremor on a seismograph (BLG) operated by the CRSN 40 km SSW of the eruption site. Tremor amplitude was half its initial value a day after the eruption began, but tremor was continuing in late September (figure 10). Lava fountain activity continued at the N end of the fissure [but see 17:1], producing a new cone and two lava flows. During the first week of the eruption, the new cone (named Mikombe; "many bats") grew to 60-70 m height with basal dimensions of 400 x 300 m (figure 11). Lava extended 6-7 km NE, along and over the 1958, 1967, and 1980 flows. The eruption remained vigorous on 30 September when initial field studies ended.
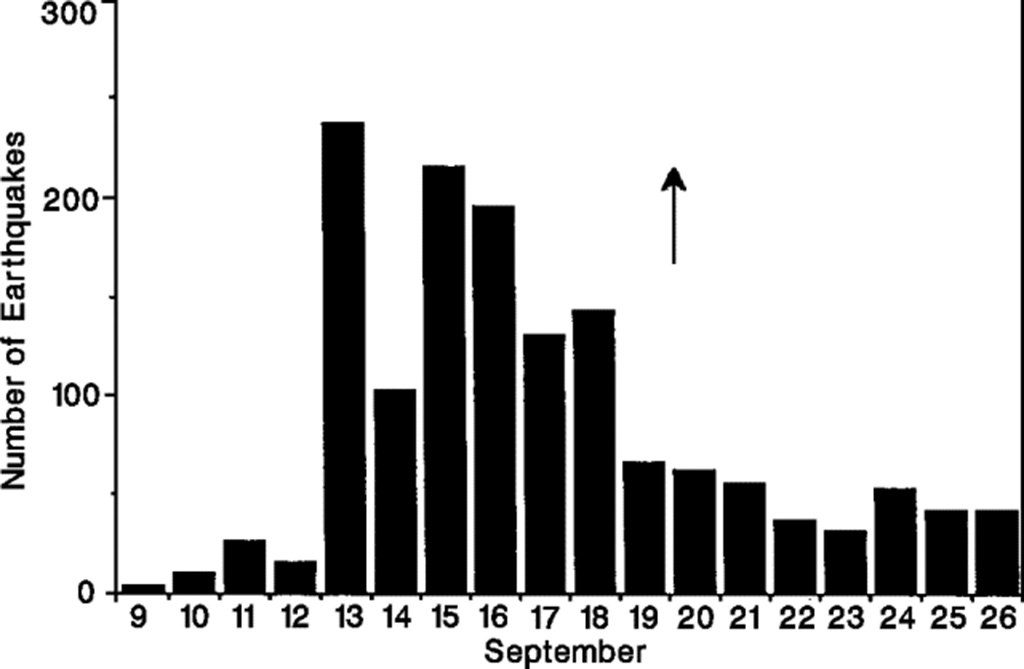 |
Figure 9. Daily number of earthquakes recorded at a seismic station (BLG), ~40 km SW of Nyamuragira's 1991 eruption site, 9-27 September 1991. Courtesy of M. Kasahara. |
Airline flight crews reported plumes to 7.5 km altitude on 15 and 20 October. On 21 October, CRSN geologists reported that activity was increasing, and lava had cut the road to Tongo. A new vent, SW of Mikombe, opened on 23 October [see also 17:1] and, as of 31 October, activity continued to increase at both vents. Pilot reports suggested that the ash cloud was only 200 m high by 2 November.
Given the first week's lava output, geologists expected the total volume to be of the same order as previous eruptions. The current eruption was believed to be a continuation of the highly active period that began with the 1976 eruption. Since then, seven flank eruptions have occurred in 15 years, 2-3 times the 1900-76 rate (Krafft, 1990).
Reference. Krafft, M., 1990, Führer zu den Virunga-Vulkanen: Ferdinand Enke Verlag, Stuttgart, 192 p.
Information Contacts: M. Kasahara and K. Tanaka, Hokkaido Univ; ICAO; H-L. Hody, GEOVAR, Kigali, Rwanda.
More information and map of late-1991 fissure eruption
The following from N. Zana supplements the reports in 16:9-10. The eruption began . . . from a vent at 1.30°S, 29.27°E, 1,530 m asl and ~15 km NE of the summit crater. For the eruption's first two weeks, lava fountaining was confined to the S end of a fissure ~500 m long. When a team from the CRSN visited the eruption site 21-25 September, a cinder cone (cone 1 on figure 8) had already reached 60 m height and lava was fountaining to as much as 180 m above the surrounding lava field. The new vent was ~6 km ENE of the 1958 Kitsimbanyi cone, and thus the northernmost of Nyamuragira's recent eruption sites. The eruptive fissure trended N34°E, similar to fissures from the 1980 (Gasenyi) and 1987 (Gafuranindi) eruptions (figure 8).
When a CRSN team returned . . . on 24 November, the fissure had propagated ~3 km N and had formed seven cones. Only Cone 5 remained active, with lava emission that was intermittent despite its high rate. Ejecta often reached 240 m height, and 2-3-kg bombs fell 600 m from the vent. The sequence of development of the seven vents is not known but several witnesses reported that they became active at random. Geologists concluded that the fissure had been simultaneously active throughout its length. The two main cinder cones (1 and 5 in figure 8) were ~60-80 m high, with basal diameters of 300-350 m.
The Mikombe lava flow and those from associated cones advanced over the 1958 and 1980 lava fields. Most of the new lava was aa, with a few benches of pahoehoe, mainly near the cones. During observations 24-27 November, the active lava flow was fed from a tube at the W foot of cone 5, and extended 2.5 km. Flow velocities 1.5 km from the lava fountain were ~40 m/min.
The eruption was preceded by a seismic swarm observed at nearby stations, with the most vigorous activity 13-18 September, but began after a substantial decrease in seismicity. Observations 24-27 November revealed only microtremors associated with the lava extrusion.
Information Contacts: N. Zana, CRSN, Bukavu.
Continued lava production from fissure vents
Vigorous lava production continued through June . . . . The eruption has built 23 cinder cones along a 2.5-km zone that trends generally NE, ~15 km NE of Nyamuragira caldera and 5 km ENE of the 1957 Kitsimbanyi vent (figure 12 and table 1). The eruption's early phases produced substantial lava flows, but since 20 November activity has been characterized by vigorous ejection of bombs, lava fragments, and ash, with lava flows of only limited extent.
Table 1. Sequence of activity at Nyamuragira's 1991-92 eruption vents. Locations are shown on figure 12. Some small, short-lived vents removed by subsequent lava flows are not listed.
| Cone | First Activity | Comments |
| 1 | 24 Sep 1991 | Named Mikombe. |
| 2 | 24 Oct 1991 | -- |
| 3 | 25 Oct 1991 | Through 3 Feb 1992. |
| 4a, b | 07 Nov 1991 | -- |
| 5a, b, c | 08 Nov 1991 | On 24 November 1991 only cone 5 was active. |
| 6 | 10 Nov 1991 | -- |
| 7 | 11 Nov 1991 | -- |
| 8 | 23 Dec 1991 | -- |
| 9 | 06 Feb 1992 | -- |
| 10a, b | 26 Feb 1992 | -- |
| 11 | 08 Mar 1992 | -- |
| 12 | 10 Mar 1992 | -- |
| 13 | 12 Mar 1992 | -- |
| 14 | 16 Mar 1992 | Still active in May. |
| 15 | 08 May 1992 | -- |
| 16a, b | 10 May 1992 | Cones 14-17 still active through the end of May. |
| 16b | 10 May 1992 | -- |
| 17 | 11 May 1992 | -- |
| 18 | 24 May 1992 | -- |
| 19 | 05 Jul 1992 | Cones 19-21 still intermittently active through August 1992. |
| 20 | 14 Jul 1992 | -- |
| 21 | 19 Jul 1992 | -- |
From 20 September until 5 February, activity was confined to a N32-34°E fissure (cones 1-8). The most persistent activity at a single vent, 25 October-3 February, has made Cone 3 the largest of the eruption, rising ~80 m above the surrounding lava plain. Three new cones developed in February, nos. 9 (6 February), 10a and 10b (26 February). In March, activity resumed at the S end of the fissure along a branch that trended E from the initial vent, successively building cones 11, 12, and 14. Vent 13, 1 km to the N, erupted during the same period.
In early May, activity moved to the N end of the fissure, as a NE branch developed and formed vents 15-17. These vents remained active at the end of May, as did no. 14 at the S end of the fissure, producing intermittent lava fountains. Vent 18, near the middle of the fissure, began to erupt at about 1100 on 24 May. By 8 June it had grown to ~25 m height and its lava flows had extended ~3 km N, eroding away cones 10a and 10b. Activity at the new vent was preceded by an increase in microtremor amplitude recorded at a seismic station (Katale) 12 km E. Amplitude increased significantly from 8 June, indicating movement of new magma from a deeper source. As of 1 July, there was no indication that the eruption was nearing its end. Lava production remained vigorous, with high lava fountains, and strong emission of bombs and other tephra.
Information Contacts: N. Zana, CRSN, Bukavu.
NE-flank fissures continue to produce lava
The eruption . . . was continuing at the end of July 1992. A new vent (no. 19) opened during the night of 4-5 July (figure 12). For several days, the new vent ejected mainly ash and bombs without a significant lava flow, then was the source of intermittent fountaining until 15 July. Several hundred meters E of cone 19, another vent (no. 20) became active on 14 July, producing a voluminous lava flow for the first two days, and high lava fountains that rose 50 m on 21 July. Another new vent (no. 21) developed SE of cone 19 on 19 July, feeding a lava fountain that was visible 5 km away. The amplitude of microtremors remained high through July, suggesting to geologists that ascent of magma from a deep reservoir continued at a significant rate.
Information Contacts: N. Zana, CRSN, Bukavu.
Intermittent lava extrusion and ash emission from several vents
Lava extrusion and ash emissions have continued intermittently during August at vents 19, 20, and 21 that opened in July. Microtremor amplitude has generally been decreasing since early August after remaining high through July.
Information Contacts: N. Zana, CRSN, Bukavu.
Continued lava production from fissure vent
Activity continued in September with intermittent emission of lava and solid ejecta from Vent 20 (figure 12) . . . . During fieldwork on 11 September, lava fountaining was observed every 10-13 minutes. Lava flowed in a channel as much as 6-7 km N. Its front was advancing at 2-3 km/h on 12 September. Microtremor recorded at a nearby seismic station (Katale) had declined significantly.
[Continuous liquid lava extrusion continued until 24 November 1992. Short-lived lava fountaining at 5-10 day intervals took place at a fresh, previously inactive fissure, until 8 February 1993 (Zana and others, 1993; see 19:06).]
Information Contacts: N. Zana, CRSN, Bukavu.
Ash emission from new vent on W flank
[The following was extracted from a combined Nyiragongo/Nyamuragira report.] Nyiragongo . . . is ~18 km N of Goma, the city where the major encampment of Rwandan civil-war refugees is located. Nyamuragira volcano (14 km NW of Nyiragongo) also began erupting on 4 July from W of the crater. This flank fissure eruption . . . has produced lava fountaining, lava flows, and ash emission.
On 4 July, Nyamuragira erupted "small red-hot lava flows," according to one news report. Another report on 22 July stated that the W-flank vent . . . was ejecting thick "black dust" to as high as 100 m above the vent, causing crop damage within a 35 km radius. Press reports through 24 July continued to mention volcanic "smoke" or "dust" falling in the refugee camps.
A preliminary analysis of data from the Meteor-3 TOMS for 5-10 July revealed a small area of very high SO2 over the Nyiragongo/Nyamuragira area. Individual centers of activity could not be resolved because the best ground resolution is 66 km. The SO2 cloud mass was estimated to be 100 kt on 5 July. The next day a much larger cloud extended almost 1,000 km W and had an estimated mass of 500 kt, with the highest values directly over the volcanoes. Data from 7 July were similar, but the cloud extended >1,000 km S. The SO2 cloud mass had decreased to an estimated 300 kt by 8 July and it extended diffusely SW from the volcano. Very high values directly over the volcanoes continued on 9 July, and the diffuse cloud to the W had ~250 kt SO2. By 10 July, values remained high, but were lower over the volcano; estimated SO2 cloud mass was 80 kt.
Reference. Zana, N., Kasahara, M., Kasereka, M., Azangi, M., and Wafula, M., 1993, Surface deformations and seismic activities related to the 1991-1992 Nyamuragira eruption: IAVCEI, Canberra Meeting Abstracts, p. 127.
Information Contacts: H. Hamaguchi and M. Kasereka, Tohoku Univ; M. Akumbi, CRSN, Goma; N. Zana, Centre de Recherche en Géophysique, Kinshasa; J. Durieux, GEVA, Lyon, France; I. Sprod, GSFC; Reuters; AP; Agence France Press.
High lava fountains feed lava flow on NW flank
High lava fountaining in early July took place from a new vent on the W flank, named Kimera. Located ~100 m S of the 1971 Rugarama cone, this vent became active at 2148 on 4 July, but remained active for only 4-5 days. The lava flows generally moved W until at least 10 July, when the flows reached their maximum extent. By 11 July, the small lake (Magera) at the E foot of a Precambrian escarpment was entirely filled and dried by the flow. High SO2 concentrations detected by the TOMS during 5-10 July were most likely caused by this activity at Nyamuragira and not from the lava lake at Nyiragongo. Nyamuragira also emitted levels of SO2 detectable by satellite during 17-19 July 1986 (275-375 ± 30% kt) and on 24 September 1991 (20 kt).
A press report described falls of both ash and Pele's hair during the first half of July in the Mokoto Hills, above the W escarpment of the rift ~20 km from the volcano. Several farmers reported problems caused by cattle eating ash-laden grass.
Long-term monitoring data indicated an apparent acceleration in seismo-geodetic activity in the past 10 years. Seismicity steadily increased from
Information Contacts: N. Zana, Centre de Recherche en Géophysique, Kinshasa; H. Hamaguchi, Tohoku Univ; J. Durieux, GEVA, Lyon, France; G. Benhamou, Libération newspaper, France; T. Casadevall, USGS; I. Sprod, GSFC.
Summit caldera observations
The eruptive activity . . . continued until 27 July, when seismic tremor ended and no more glow was observed. The lava flow moved over the 1971 Rugarama flow and partially filled Lake Magera at the W Precambrian escarpment. Heavy steaming from the unfilled portion of the lake was observed on 23 August during an overflight. Fumarolic activity was also observed along the 1989 fissure (figure 14), and the fresh lava plain in and around the pit crater appeared much larger than before. At the S end of the 1989 fissure a new solfataric area was noticed; a feature not formed during the 1989 or 1991 eruptions. Zairian scientists who visited the crater on 25 August observed ash emission from the 1989 fissure and confirmed that there had been fresh lava extrusion in the central crater. No evidence of lava flows on the S slope of the volcano was observed.
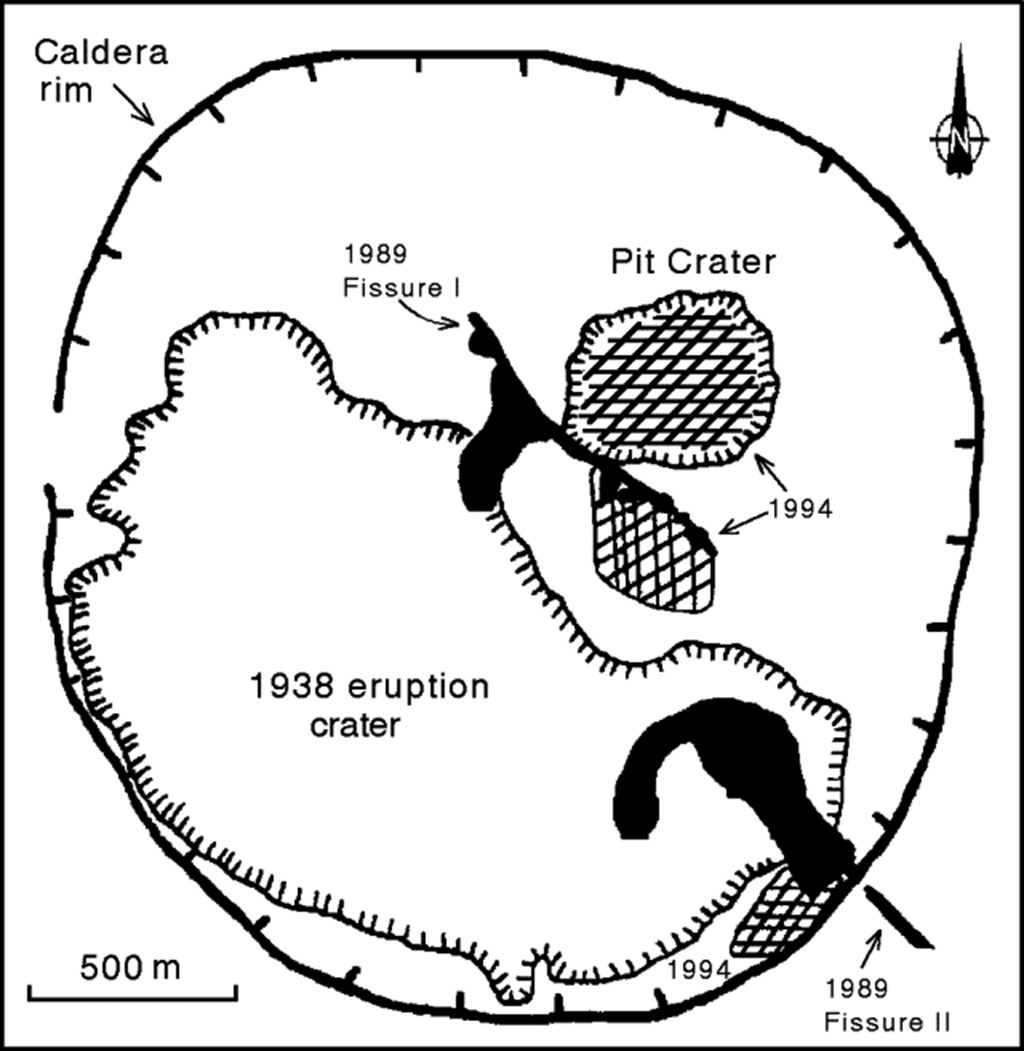 |
Figure 14. Summit caldera of Nyamuragira, 25 August 1994, showing lava flows from 1989 (black) and 1994 (cross-hatched). Courtesy of N. Zana. |
Information Contacts: N. Zana, Centre de Recherche en Géophysique, Kinshasa.
High levels of seismicity during September 1995
Volcanic seismicity in the Nyamuragira/Nyiragongo area during 15-30 September was very high (figure 15). This activity was characterized by A-type (high-frequency) and C-type (low-frequency) events. Hypocenters were principally concentrated ESE of the summit of Nyamuragira, NE of Nyiragongo, at depths of 0-20 km. Depths for all of the earthquakes decreased from W to E and from S to N, suggesting a volcanic conduit rising in a generally NE direction towards the surface on the ESE flank of Nyamuragira. The level of volcanic tremor was very low. The low tremor level does not signify an overall reduction in the Nyiragongo lava lake activity, but no fresh lava was apparent in the crater.
Seismic recordings in the first half of October were severely impaired by frequent power disruptions to the observatory and the regular discharge of the batteries. The number of earthquakes decreased significantly compared to September; events were mainly centered at greater depths (5-30 km) SE of Nyiragongo. Problems with the transmitter at the Kunene seismic station prevented acquisition of better data; scientists were unable to visit the station regularly due to a lack of tires for their vehicle.
Seismicity during 15 November-2 December remained high, mainly consisting of A- and C-type earthquakes, and volcanic tremor. The distribution of hypocenters was similar to that observed during September. Each series of earthquakes was followed by up to several hours of tremor. Five seismic stations were operating during this period, four of them (Kibati, Rusayo, Buhimba, and Kunene) telemetered to the Goma observatory, and the fifth (Mt. Goma) connected by cable. However, the transmitter from Kunene was intermittent. Tremor amplitude remained low.
Monitoring of both active Virunga volcanoes is done from a small observatory building located in Goma, ~18 km S of the Nyiragongo crater. Goma is the city where the major encampment of Rwandan civil-war refugees is located. A previous lava lake in the deep summit crater of Nyiragongo, active since 1894, drained suddenly on 10 January 1977, killing about 70 people. Lava lake activity resumed in June 1982, but had ceased by early 1983. The lava lake was again activated after an eruption that began in June 1994 (BGVN 19:06-19:08). Historical eruptions from Nyamuragira (14 km NW of Nyiragongo) have occurred within the summit caldera and from numerous flank fissures and cinder cones. Twentieth century flank lava flows extend >30 km from the summit. Nyamuragira also began erupting in July 1994, producing lava fountaining, lava flows, and ash emission.
Information Contacts: Wafula Mifundi and Mahinda Kasereka, Goma Volcano Observatory, Departement de Geophysique, Centre de Recherche en Sciences Naturelles, Lwiro, D.S. Bukavu, Zaire.
August seismic buildup and a 1 December eruption
During August, Christoph Weber managed to visit Nyamuragira despite the hazard from armed groups roaming the region around the volcanoes. Although he found Nyamuragira quiet, Weber learned from Mahinda Kasereka of the Goma Volcano Observatory that seismicity had began to increase in August 1996.
An Associated Press story described lava flows escaping the crater on 1 December and reaching 10 km NW that evening. Satellite images in December as late as the 5th indicated reasonably dense plumes to ~12 km altitude. The eruption's impact on people in the region was uncertain. Further details will follow in a subsequent Bulletin.
Historical eruptions from Nyamuragira have occurred within the summit caldera and from numerous flank fissures and cinder cones. Twentieth century flank lava flows extend >30 km from the summit. In July 1994 a W-flank fissure emitted lava fountains, lava flows, and ash. For the past two and a half years this portion of Zaire's border had contained camps with hundreds of thousands of refugees; over a month ago these refugees fled to escape fighting.
Information Contacts: Christoph Weber, Kruppstrasse 171, 42113 Wuppertal, Germany; Wafula Mifundi and Mahinda Kasereka, Goma Volcano Observatory, Departement de Geophysique, Centre de Recherche en Sciences Naturelles, Lwiro, D.S. Bukavu, Zaire; Associated Press.
Flank lava flow in October; TOMS data
Eruptive activity occurred at Nyamuragira volcano beginning on 17 October. During the following week several Strombolian explosions and effusive activity were reported. Lava "gently gushed" from the cone and through a fissure in its side, according to an official at the National Scientific Research Centre (CNRS) quoted in a Reuters news report. On 19 October the central crater opened and the lava flowed into the surrounding forest. Glow was visible at night from the city of Goma, ~30 km SE of the volcano. The flows were still active but diminishing at the time of the last report on 25 October. Scientists are not able to visit the site because of the threat of civil unrest. Virunga National Park has been closed for months.
An SO2 plume was first detected by the Earth Probe Total Ozone Mapping Spectrometer (TOMS) on 18 October. Although the image resolution is not sufficient to differentiate between Nyamuragira and Nyiragongo as a plume source, the former has previously emitted large amounts of sulfur dioxide. Imagery the next day (figures 16 and 17) showed that the plume extended ~700 km SW from the volcano and covered an area of 300,000 km2. Scientists at the Goddard Space Flight Center calculated that this plume contained 115 kilotons (kt) of SO2. An SO2 plume was detected on each day from 18 through 29 October. On 29 October the plume was directed to the N and contained 10 kt of SO2. No SO2 was detected in images taken from 30 October through 4 November. Visible satellite imagery acquired by the Toulouse Volcanic Ash Advisory Center on 20 October did not show any evidence of an ash plume, but convective clouds were obscuring the area.
Information Contacts: C. Akumbi, Goma Volcano Observatory, Departement de Geophysique, Centre de Recherche en Sciences Naturelles, Lwiro, D.S. Bukavu, DR Congo; Stephen J. Schaefer, Joint Center for Earth System Technology (NASA-UMBC), Mail Code 921, NASA Goddard Space Flight Center, Greenbelt, MD 20771 USA; George Stephens, NOAA/NESDIS, E/SP22, 5200 Auth Road, Camp Springs, MD 20746-4304, USA; Robert D. Farquhar, NOAA/NESDIS, FB-4, Suitland, MD 20233-9909 USA; Volcanic Ash Advisory Center (VAAC) Toulouse, Météo-France, 42 Avenue Gaspard Coriolis, F-31057 Toulouse cedex, France; Reuters Limited.
As 27 January eruption began, witnesses assumed they heard artillery fire
This report covers the period 27 January-early February 2000 at Nyamuragira, ~50 km NW of the town of Goma. The following report was prepared by Akumbi Mbiligi with additional notes and explanations provided by Hiroyuki Hamaguchi, who has collaborated on Virungan volcano research for over 20 years.
Mbiligi learned that an eruption began at 0800 (GMT) on 27 January. During that night the volcano expelled incandescent material and rocks. The area where the venting took place was SE of the summit, near Kagano (29.217°E, 1.433°S), a center active during 1989-98 (see map in SEAN 14:05). Investigations were attempted during 28-29 January. The eruption site could not be reached from Rumangabo, the settlement containing Virunga National Park's main office and the observatory's seismic station, because of security problems in the Park. More specifically, the forest surrounding Nyamuragira has been partly occupied by rebel groups since 1994, a situation that has thwarted geological observations. Mbiligi also visited Kakomero, a small village at the park entrance supporting guides and serving as a past base camp for climbers.
Press reports indicated that the eruptive activity spread panic among people near the eastern Congolese rebel stronghold at Goma. The refugees thought they were under attack. According to press reports seen in the early phases of the eruption, the westerly advancing lava flows had not presented Goma with any immediate threat of encroachment. In addition to the lava flow, the eruption was characterized by ejection of bombs, cinders, and ash from the crater and a strong rumbling. According to Mbiligi and his sources, as of 31 January the volcano's activity had decreased notably.
NOAA infrared satellite imagery illustrated the extent of the lava flow as it appeared beginning around the time of the eruption. One image from 2 February showed a distinct thermal signature interpreted as a hot spot (several pixels in extent) and a possible ash plume trailing off towards the W (see, for example, multichannel color-composite image, number D03304: NOAA-14 POES AVHRR GAC; Channels 3,2,1 at 4-km resolution; acquired at 0456 GMT). As of 10 February satellite imagery continued to indicate high thermal fluxes from fresh lava flows. Around the time of the eruption at least one Earth Probe TOMS image indicated elevated sulfur dioxide concentrations (with a few scattered pixels reaching over 15 milliAtm-cm).
Information Contacts: Akumbi Mbiligi, Goma Volcano Observatory, Centre de Recherche en Sciences Naturelle, Lwiro, D.S. Bukavu, Democratic Republic of Congo (formerly Zaire); Hiroyuki Hamaguchi, Research Center for Prediction of Earthquakes and Volcanic Eruptions, Graduate School of Science, Tohoku University, Sendai 980-8578, Japan.
Lava flows began erupting in early February; one injury reported
Nyamuragira, Africa's most active volcano, was the subject of recent reports from USAID/OFDA, volcanic observatories and research centers, Reuters news, and satellite remote-sensing observers. Our last report on Nyamuragira was in late January 2000 (see BGVN 25:01). The volcano is situated about 40 km NE of the city of Goma in an area held by the rebel group Congo Rally for Democracy.
Field reports. A preliminary USAID/OFDA report provided by Jim Smith indicated that Nyamuragira began erupting at 0032 on 6 February. Observations made during a flight over the volcano revealed that there were active lava flows. The lava appeared to be flowing from two fissures; one to the W towards the town of Kitchanga, and another to the S in the direction of both the town of Mugunga (Sake) and Nyiragongo volcano. Smoke was observed near Nyamuragira and thunder was heard. Cloudy conditions prevented clear views of the volcano. These observations were confirmed subsequently by reports received from Hiroyuki Hamaguchi, Tohoku University, and his collaborator, Akumbi Mbilizi, Observatore Volcanologie de Goma.
News reports from Reuters. An 18 February Reuters news article by Jean-Baptiste Kayigamba reported that the volcano spewed large amounts of molten lava from three cones with "flames" rising 100 m above the volcano. The lava flowing down the mountain threatened both the roads running N from Goma and a wide area of the rebel-held territory that lies near the border between the Democratic Republic of Congo (formerly Zaire) and Rwanda.
Reuters noted further that experts at the Lwiro Natural Science Research Centre in Bukavu, S of Goma, said abnormal activity was detected in December. The initial eruption on February 6 gradually increased, and showers of volcanic ash fell on an area estimated at between 20 km2 and 30 km2. Officials say the effect on crops and pastures used for grazing will be devastating, and water supplies are likely to be contaminated over a wide area. The news report mentioned that Noel Kiloha, a volcanologist who worked for the Belgian Institute for Scientific Research in the area before independence, will continue to monitor the situation. He told Reuters: "We believe the eruption will continue for several weeks-we still hear terrible underground rumblings." One casualty was reported; a man lost his leg when he accidentally stepped into a lava flow.
Remote thermal data. Scientists from the University of Hawaii used Moderate Resolution Imaging Spectrometer (MODIS), an instrument carried aboard NASA's Earth Observing System satellites) to image thermal anomalies associated with the eruption. MODIS provides high radiometric sensitivity (12 bit) in 36 spectral bands ranging in wavelength from 0.4 µm to 14.4 µm. Two bands image at a nominal resolution of 250 m at nadir, five bands at 500 m and the remaining 29 bands at 1,000 m.
MODIS observed no hot spots prior to detecting a ~7 x 5 km anomaly centered 7-10 km N of the volcano summit on 7 February. By 8 February, the northern anomaly had increased in size and was orientated in a SSW-NNE direction, and a second anomaly had appeared just to the SSE of the summit. The latter was ~13 x 6 km in size, oriented in an E-ESE direction. On 11 and 12 February, the two anomalies had the same distribution and orientation, both showing an alignment along a SSE-NNW line drawn through the summit. The E-trending S flank hot spot had attained a maximum dimension of ~17 km, while that of the NNE-trending N flank was ~22 km.
Information Contacts: Andy Harris, Eric Pilger, and Luke Flynn, HIGP/SOEST, University of Hawaii, 2525 Correa Road, Honolulu, HI 96822; MODIS, Vincent Salomonson (Team Leader), NASA's Goddard Space Flight Center, Code 974, Greenbelt, MD 20771 USA; Jim Smith, US Agency for International Development / Office of US Foreign Disaster Assistance, 1300 Pennsylvania Ave., NW, Washington, DC 20523-8602 USA (URL: https://www.usaid.gov/who-we-are/organization/bureaus/bureau-democracy-conflict-and-humanitarian-assistance/office-us); Hiroyuki Hamaguchi, Research Center for Prediction of Earthquakes and Volcanic Eruptions, Graduate School of Science, Tohoku University, Sendai 980-8578 Japan; Akumbi Mbilizi, Observatore Volcanologie de Goma, Centre de Recherche en Sciences Natulles (CRSN), Goma, Democratic Republic of Congo; Reuters News Service (URL: http://www.reuters.com/).
Volcanism that began on 6 February 2001 continued into March
Activity began at Nyamuragira with a swarm of volcanic earthquakes at 0032 on 6 February 2001 (BGVN 26:01). Volcanism continued through at least 2 March.
The Goma Volcanological Observatory reported that the Nyamuragira eruption started on 6 February with the opening of two fissures from the summit crater extending to the N and S flanks. Two cones formed at the beginning of the eruption; the northern-most cone grew close to Gasenyi cone (formed in 1980), and the southern-most cone was close to the Kagano (1989) and Ngerageze (2000) cones. During February, lava flows traveled N of the summit towards the Kitsimbanyi (1958) and Mikombe (1991) cones and S towards a 1982 cone (called Rugarambiro) following a 1977 lava flow (called Burata).
The Goma-Rutshuru and Kalengera-Tongo roads were threatened by being cut off by the lava flows. Ash from the eruption blew W, destroying ~50 km2 of pasture land and ~150 km2 of crops in the towns of Rusayo, Kirolirwe, Burungu, the southern part of Kichanga, the Masisi territory, and Minova. Areas up to 30 km from the eruption site, including the highly populated town of Goma, were also affected. In those areas ash and gas caused many people to experience fever, diarrhea, headache, conjunctivitis, and respiratory problems.
On 2 March a new eruption started on Nyamuragira's S flank. During the beginning of March lava flows reached lengths of 10-20 km as they traveled N, SE, and SW (figure 18). By mid-March volcanologists reported that the intensity of the lava flows lessened, but there was still a large amount of smoke visible. By this time, a total of three cones had formed. One cone, named Tumayhini, was 65 m high and still hot when the scientists visited it. The other two cones formed N of the summit and were named Amani and Kadogo. Volcanologists did not have the opportunity to visit the latter cones prior to the publication of this report.
While the intensity of the lava flows decreased in mid-March, registered seismicity was at similar levels to December 2000, shortly before the eruption began. This is an unusual pattern for Nyamuragira; tremor usually ends at the same time as the eruption. Local volcanologists believe this indicates lava and pressure remaining within either Nyamuragira or Nyiragongo, ~15 km to the SE.
TOMS observations. An SO2 cloud probably associated with the February 2001 eruption of Nyamuragira was first detected by the Earth Probe Total Ozone Mapping Spectrometer (TOMS) on 6 February. TOMS image resolution is not sufficient to distinguish between Nyamuragira and nearby Nyiragongo as the source (consequently the images referred to below will provisionally remain associated with both volcanos). The well-defined cloud extended ~800 km NW from the volcano across the Democratic Republic of Congo on 6 February (figure 19a), covering an area of ~160,000 km2, with the highest SO2 values concentrated in a narrow band towards the N edge of the plume. Preliminary analysis indicates that this cloud contained ~230 kilotons (kt) of SO2. TOMS imagery on 7 February showed a diffuse SO2 cloud (estimated SO2 mass ~80 kt) over Cameroon and Congo, and high levels of SO2 WSW of Nyamuragira (truncated by a gap between TOMS swaths; figure 19b). On 8 February, reduced levels of SO2 (estimated mass ~150 kt) were measured in a bifurcating cloud that extended ~500 km WNW and ~200 km SW from the volcano (figure 19c); this appeared to have largely dispersed by the next day. On 10 February TOMS detected a region of dissipating SO2 ~950 km W of Nyamuragira (estimated SO2 mass ~10 kt), and another cloud (detached from the volcano) extending ~250 km SW (estimated SO2 mass ~10 kt). Small, isolated SO2 signals were detected sporadically near the volcano until 6 March.
Information Contacts: Wafula Mifundu, Observatore Volcanologie de Goma (RDC-E), Goma, Democratic Republic of Congo; Jim Smith, US Agency for International Development / Office of US Foreign Disaster Assistance, 1300 Pennsylvania Ave., NW, Washington, DC 20523-8602 USA (URL: https://www.usaid.gov/who-we-are/organization/bureaus/bureau-democracy-conflict-and-humanitarian-assistance/office-us); Simon Carn, Joint Center for Earth Systems Technology (NASA/UMBC), University of Maryland Baltimore County, 1000 Hilltop Circle, Baltimore, MD 21250 USA.
MODIS data for February 2001 eruption; no January 2002 eruption
The eruption that began on 6 February 2001 (BGVN 26:03) continued through at least early April. An update from the Goma Volcanological Observatory since our last report stated that the February eruption was preceded by swarm of low-frequency earthquakes that began on 16 December 2000. The eruption started from the summit caldera of Nyamuragira and formed four cones: two on the N flank, one on the S flank, and one inside the caldera. The two main cones were symmetrical and located on the N (Amani) and S (Tumayhini) flanks, along the fissure connecting Nyamuragira and Nyiragongo. Lava flows extended up to 15 km from the two main cones. Ash fell up to 20 km away, damaging farmland and causing health problems.
The Hawaii Institute of Geophysics and Planetology at the School of Ocean and Earth Science Technology (HIGP/SOEST) tracked the eruption using MODIS (Moderate Resolution Imaging Spectroradiometer) global hot-spot data. No hot spots were seen at Nyamuragira until 7 February 2001. Figures 20 and 21 show examples of the hot spot maps for Nyamuragira during 7-12 February.
As of 10 March, no lava fountains were observed and all flows had stopped. Only very dense "smoke" was observed coming from the cones. Unlike previous eruptions at Nyamuragira, no significant high-frequency earthquakes were observed; these usually signal the end of the eruption.
After 15 March through at least July 2001, the same seismic patterns that preceded the February eruption were observed. During the end of June, the Goma Volcanological Observatory reported that the magnitude of the low-frequency earthquakes and the amplitude of volcanic tremor had increased significantly. Scientists believed this increased activity could signal a large eruption sometime in the near future. The high seismic activity could also be related to regeneration of the Nyamuragira lava lake or to activity of the Nyiragongo lava lake.
False eruption report, January 2002. Rumors of a new eruption at Nyamuragira circulated soon after a 17 January eruption at Nyiragongo (see this Bulletin). Ash was allegedly ejected from the N flank of Nyamuragira on 22 January, but the reports could not be confirmed because of poor visibility. According to the United Nations Office for the Coordination of Humanitarian Affairs (OCHA), volcanologists determined that ash observed in Goma on 22 January originated from the collapse of Nyiragongo's inner crater and not from a new eruption at Nyamuragira.
Information Contacts: Dieudonné Wafula, Observatore Volcanologie de Goma (RDC-E), Goma, Democratic Republic of Congo; Andy Harris, Eric Pilger and Luke Flynn, Hawaii Institute of Geophysics and Planetology at the School of Ocean and Earth Science Technology (HIGP/SOEST), University of Hawaii, 2525 Correa Road, Honolulu, HI 96822; United Nations Office for the Coordination of Humanitarian Affairs (OCHA), United Nations, New York, NY 10017 USA (URL: https://reliefweb.int/).
Eruption began on 25 July and continued through at least early August 2002
According to news articles, a team of volcanologists from the UN Office for the Coordination of Humanitarian Affairs and the Goma Volcanological Observatory stated that seismicity dramatically increased at Nyamuragira around 25 February 2002. In a statement released to UN headquarters that day, the team of volcanologists said they expected an eruption within the following days or weeks, but that residents near the volcano should not be worried.
On the evening of 25 July an eruption produced a cloud of steam, gas, and ash, 100- to 200-m-high lava fountains, and lava flows down the N and S flanks. Seismic records indicated that the eruption began at about 1310. National Park guards saw "smoke" rising above the volcano about an hour earlier. Scientists who observed the crater later that night from both S (on the E-W road heading to Sake) and E (on the N-S road to Rutchuru at Rumangabo National Park headquarters) at a distance of 20 and 7 km, respectively, saw that the crater had been cut by two fractures: a longer one heading NNE and a smaller one heading SSW on the opposite side of the crater. Sustained 100- to 200-m-high lava fountains were visible along the fracture. One lava flow traveled N from the several-kilometer-long fracture, while a smaller one moved S and stopped on the morning of 26 July, when the lava flows were 6-7 km long and ~1 km wide. Neither of the flows threatened inhabited areas, but did cause large amounts of damage to Park vegetation.
Volcanic clouds produced during the eruption were detected by several satellites. Beginning on 26 July around 0000, a steam-and-ash plume was visible on METEOSAT satellite imagery, below 6 km altitude, drifting to the WSW.
According to Simon Carn, the orbit of the Earth Probe Total Ozone Mapping Spectrometer (EP TOMS) satellite was well-placed over the Nyamuragira region at 1138 on 26 July, and an SO2 cloud associated with this eruption was detected (figure 22). Though contemporaneous SO2 emissions from Nyiragongo could not be ruled out, most of the SO2 was thought to originate from Nyamuragira. Preliminary analysis indicated an SO2 mass of ~125-140 kilotons (kt) in the 26 July cloud, with the highest SO2 concentrations (peaking at ~100 milli atm cm or Dobson Units) recorded in a ~400-km-long and ~300-km-wide segment of the plume extending WSW from the volcano across the DR Congo. SO2 concentrations over the volcano were somewhat lower at ~45 milli atm cm. From the distal end of the ~400-km-long segment, a narrower and less distinct portion of the plume (with SO2 concentrations 30 milli atm cm) extended ~500 km NW. At its farthest extent the plume was ~800 km from Nyamuragira.
Earth Probe TOMS did not detect any ash cloud associated with the eruption. At 1050 on 27 July EP TOMS detected ~150 kt of SO2 in a plume extending to the edge of the EP TOMS swath ~500 km W of Nyamuragira (figure 22). The imaged plume was truncated by a data gap at that point, but no SO2 was detected beyond the gap ~600 km farther W. The highest SO2 concentrations (~86 milli atm cm) were recorded immediately W of Nyamuragira. At 1140 on 28 July EP TOMS detected the largest SO2 cloud seen so far during the current activity, containing ~330 kt SO2 in a plume extending unbroken up to ~1,200 km WNW of Nyamuragira (figure 22). At its farthest extent the cloud was ~750 km wide. Continued high SO2 concentrations over Nyamuragira and Nyiragongo (75 milli atm cm) indicated ongoing emissions at the time of the TOMS overpass. A region of elevated SO2 concentrations (~55-58 milli atm cm) was also detected in the cloud ~440 km W of Nyamuragira.
Helicopter flights on 1 and 3 August revealed that the eruption continued at a high rate. Two cones were growing on the eruptive fracture, built by the accumulation of spatter and ash from two very active 100- to 200-m-high lava fountains. Two large lava flows moved quickly and joined below the lowest cone to form a main flow. The main flow (estimated then to be 15 km long) moved NNE and changed direction towards the NE after a few kilometers. Many smaller branching flows were visible on the E side of the main flow. The front of the main flow appeared to be very wide, though it remained within the National Park boundaries. Permanent tremor was registered. The Alert Level remained at Yellow through at least early August.
Information Contacts: Jacques Durieux and Dario Tedesco, United Nations Office for the Coordination of Humanitarian Affairs (OCHA), United Nations, New York, NY 10017, USA (URL: https://reliefweb.int/); Simon A. Carn, TOMS Volcanic Emissions Group, Joint Center for Earth Systems Technology (NASA/UMBC), University of Maryland Baltimore County, 1000 Hilltop Circle, Baltimore, MD 21250, USA (URL: https://jcet.umbc.edu/); Toulouse Volcanic Ash Advisory Center (VAAC), Météo-France, 42 Avenue Gaspard Coriolis, F-31057 Toulouse cedex, France (URL: http://www.meteo.fr/vaac/); Air Force Weather Agency, Offutt AFB, NE 68113-4039, USA; Associated Press; Reuters.
Multi-vent eruption, 25 July-27 September 2002; regional earthquake
An eruption began at Nyamuragira on 25 July 2002 (BGVN 27:07). Flights on 1 and 3 August confirmed that the eruption was continuing at a high rate, but another look on 27 September showed that the eruption had ceased. An unusually large earthquake (Mw 6.1-6.2) and its aftershock (Mw 5.5) struck the region on 24 October 2002.
During 6-8 August a team composed of scientists from the Goma Volcano Observatory (GVO) (Kaseraka Mahinda and François Lukaya) and a UN-OCHA consultant volcanologist (Jacques Durieux) made a survey trip to the active eruption site of Nyamuragira. The team landed by helicopter in the summit caldera, reached the eruption site by foot, and spent 24 hours on the scene.
The team saw the eruption at 0330 on 25 July with lava venting at 3 different fractures, or fracture systems. One fracture was open in the central caldera, and lava flows had covered a major part of the floor and partially filled the pit crater (Crater B). Another fracture was active on the S flank, with lava fountains and one lava flow traveling towards the SW. This fracture was active during the first hours of the eruption only.
N-flank fractures had opened and extended for ~2 km, reaching from the crater rim (2,959 m) down to an elevation of ~2,540 m. At the beginning of the activity, lava fountains appeared along the fractures and spatter accumulated around them. Numerous lava flows (pahoehoe and aa) were emitted from several points of the fracture system. Both the fountaining and the presence of multiple fissure vents followed Nyamuragira's usual eruptive pattern.
On 6 August only the lower part of the fracture was active; a cone (several hundreds meters long, ~70 m high) contained three very active lava fountains ejecting scoria to an altitude of ~100 m. From a breach in the lowest part of the cone (on the S), very fast moving lava flowed NE. At that time the lava extrusion rate was ~3 x 10⁶ m3 per day, a typical value at this volcano. The activity of fountaining and lava emission regained some intensity at the beginning of the night but dropped dramatically during the early morning of 7 August. At that time, only one weak lava fountain remained active in the new crater. Decreasing tremor registered across GVO's seismic network, and low tremor prevailed on the morning of 8 August.
An overflight on 27 September confirmed the end of this eruptive episode when observers failed to see any still-active lava flow and the eruptive cones displayed only fumaroles. At that time, however, weak tremor still consistently registered, with slightly less at Nyamuragira (Katale station) than at Nyiragongo (Rusayo station). Nyamuragira also was the scene of a greater number of high frequency (HF) and long-period (LP) earthquakes.
A large tectonic earthquake (Mw 6.1-6.2; mb 5.8; Ms 6.3), one of the two largest in at least 30 years, occurred on 24 October. A second large-magnitude event (Mw 5.5) occurred about an hour later. For further details on these events, see the text and tables in the section "Regional seismicity" within the report on Nyiragongo in this Bulletin.
Information Contacts: Kasereka Mahinda and François Lukaya, Goma Volcano Observatory, Departement de Geophysique, Centre de Recherche en Sciences Naturelles, Lwiro, D.S. Bukavu, DR Congo; Jacques Durieux, Resident Volcanologist, United Nations Office for the Coordination of Humanitarian Affairs (OCHA), United Nations, New York, NY 10017 USA (URL: https://reliefweb.int/).
Infrared satellite data from the 25 July 2002 eruption
An eruption began at Nyamuragira on 25 July 2002 (BGVN 27:07). Flights on 1 and 3 August confirmed that the eruption was continuing at a high rate, but another look on 27 September showed that the eruption had ceased (BGVN 27:10). The eruption was observed in MODIS thermal satellite imagery (1-km2 pixel size).
Initial activity was detected on 25 July at 2040 UTC, with a large (57-pixel) thermal anomaly on the S and N flanks of the volcano. The anomaly grew in size, with an image on 27 July showing a large anomaly on the N flank and a subordinate anomaly on the S flank. On all subsequent days the anomaly was limited to the N flank. The anomaly reached a maximum size of 78 pixels on 1 August, at which point it extended approximately 12-15 pixels (or around 12-15 km) along its longest dimension (figure 23). After this point the size and intensity of the anomaly rapidly diminished (detected anomalies after mid-August were no more than 8 pixels in size). The last detected anomaly at Nyamuragira occurred on 1 October. Figures 24 and 25 show the number of anomalous pixels and the sum of the radiance for the entire eruptive event.
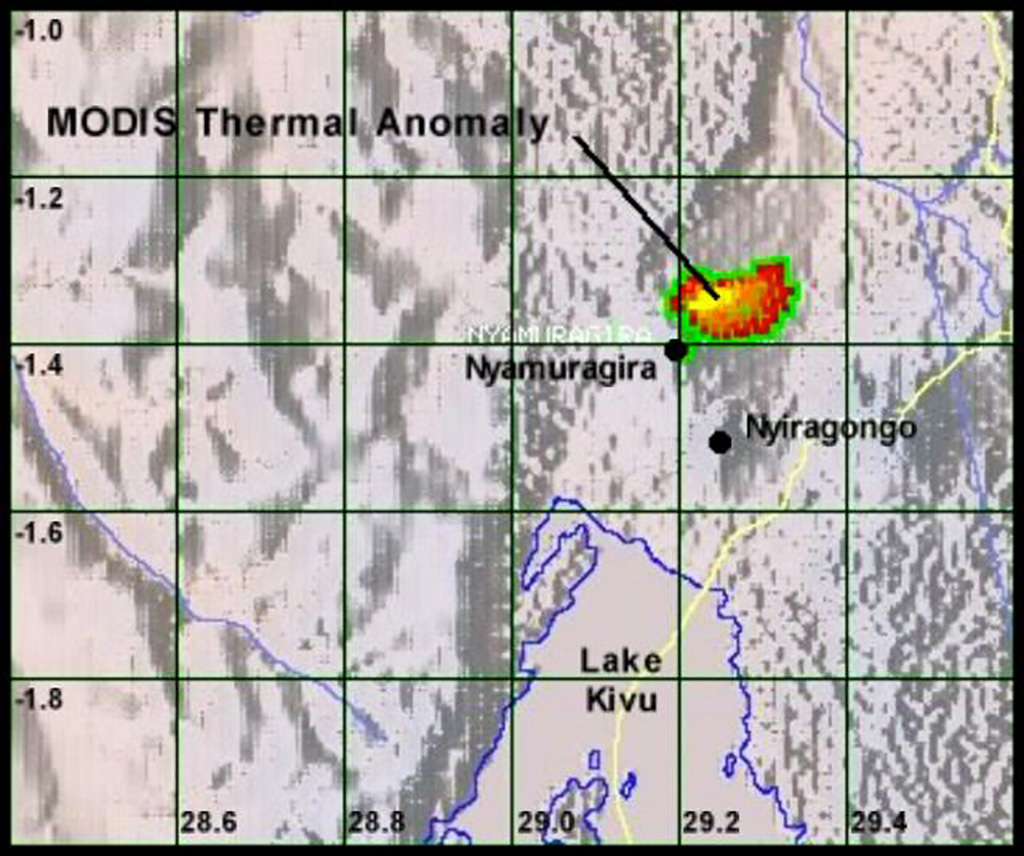 |
Figure 23. MODIS imagery on 1 August 2002 showed the maximum number of anomalous pixels (78) for the July-August eruption at Nyamuragira. Courtesy HIGP/SOEST. |
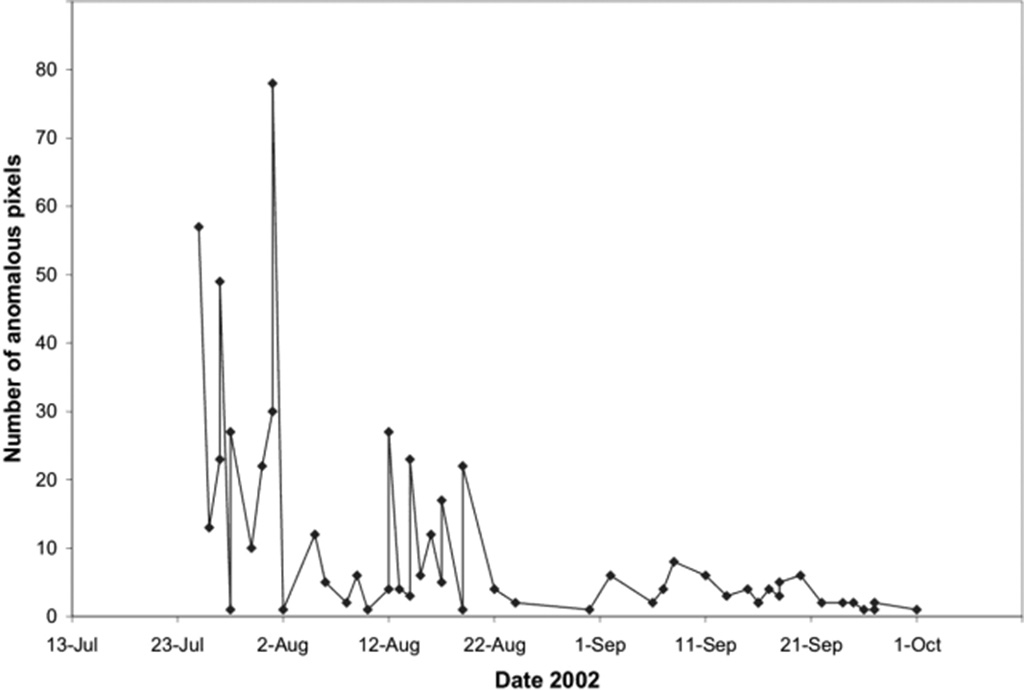 |
Figure 24. Total number of anomalous pixels visible on MODIS imagery during and following the July-August 2002 eruption of Nyamuragira. Courtesy HIGP/SOEST. |
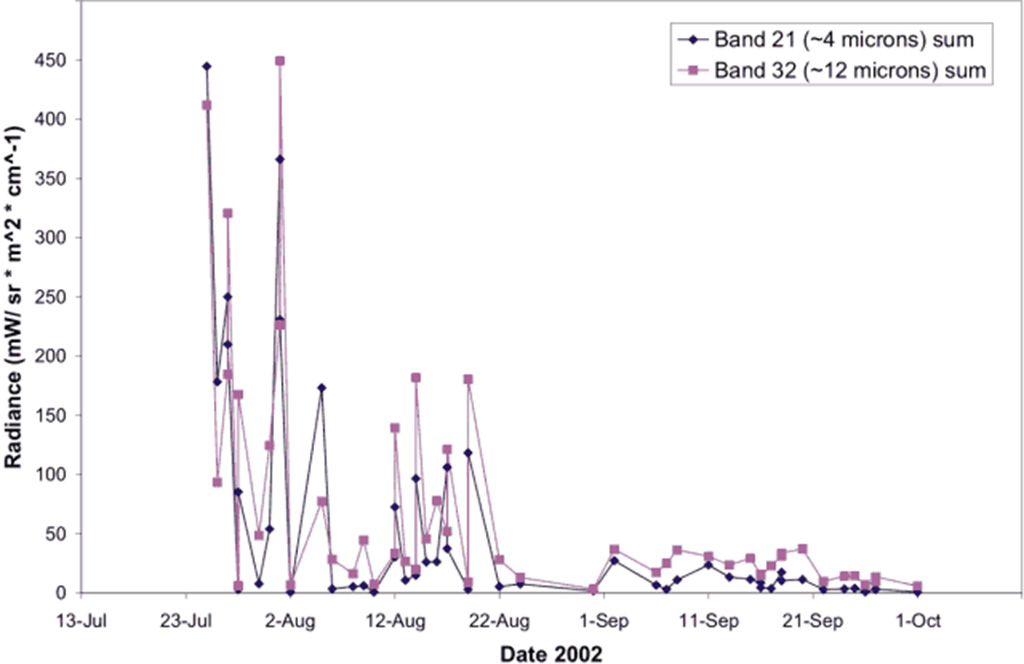 |
Figure 25. Sum of the radiance values for bands 21 and 32 on MODIS imagery during and following the July-August 2002 eruption of Nyamuragira. Courtesy HIGP/SOEST. |
Information Contacts: Matt Patrick, Andy Harris, Luke Flynn, Robert Wright, Harold Garbiel, and Eric Pilger, HIGP/SOEST, University of Hawaii at Manoa, HI 96822 USA.
Rumbling and explosion sounds April-June, but no confirmed eruptions
According to reports from the Goma Volcano Observatory, since late October 2002 tectonic and magmatic seismicity at Nyamuragira has continued. Some of this seismicity was thought to be related to the refilling of a magma chamber emptied by a previous eruption. No eyewitness accounts of activity were reported until 26 February 2003, when a seismic crisis occurred. From 30 April into June 2003, local villagers reported rumblings and sounds of explosions coming from the volcano.
Activity during 27 October-14 December 2002. During 27 October-2 November, seismic data were collected at eight operational stations (Katale, Kibumba, Bulengo, Rusayo, Luboga, Goma, Lwiro, and Kunene). During this time volcanic seismicity was masked by aftershocks from a tectonic earthquake on 24 October 2002. Some rare magmatic events had hypocenters 10-25 km deep. During November 2002 epicenters of magmatic seismicity were concentrated in the NE area where the last eruption took place, an observation consistent with refilling of the magma chamber.
During 3-23 November, magmatic seismicity was more prevalent than tectonic seismicity, the latter dominated by aftershocks of the 24 October earthquake. The distribution of the magmatic earthquakes covered a zone 0-22 km deep, with an earthquake-free zone between approximately 3 and 7 km depth. The latter was interpreted as the location of a magma chamber, the same position as the chamber that fed the 27 July 2002 eruption. The tectonic earthquakes had depths of 0-30 km with an aseismic zone between 12 and 17 km. During the week of 24-30 November both tectonic and magmatic earthquakes were more frequent. Magmatic earthquakes increased at Katale to 348 from 239 during the previous week. High-frequency earthquakes in the E disappeared during the period. High-frequency earthquakes appeared in an isolated area in Virunga and densely NW of Lake Kivu in the area of Kalehe, where a landslide in late April 2003 killed ten people.
During 8-14 December the number of long-period earthquakes fell from to 169 at the Katale station from 239 the previous week, though the number of high-frequency earthquakes increased from 92 to 120. This increase was thought to be related to rifting in the area of the Large African Lakes. In general, volcanic tremors remained omnipresent. The epicenters of these long-period earthquakes were mainly concentrated in the NE of the central crater between 0 and 7 km depths. High-frequency earthquakes were concentrated in the aftershock zone of the 24 October 2002 earthquake in the Territory of Kalehe, NW of Idjwi Island.
Activity during February-March 2003. A seismic crisis started the night of 26 February and continued through the next morning. Seismicity increased greatly at the Goma seismic station; it was mainly tremor, but not at the same high levels of July 2002. Seismograms indicated clear increases in the numbers of both long-period and tectonic earthquakes and an increase in tremor amplitude. Visual observations were limited to the E flank, where the eruption of July 2002 started, but clouds obscured the summit crater.
Although seismic activity and warning phone calls occurred at the same time, there was no visible eruptive activity. Some very minor and brief activity (possibly witnessed) might have occurred in the central crater, which was not visible from the Rumangabo site. Seismic activity in late February included fracturing earthquakes, mainly on the N and NE sides of the volcano. Persistent long-period earthquakes were associated with magma movement. Short-period earthquakes associated with fracturing were observed for the first time.
A fresh outbreak of long-period earthquakes was noted in the NE quadrant during the week of 1-8 March, along with the growing presence of short-period events. Many long-period earthquakes occurred during the week of 16-22 March, including frequent fracture-related earthquakes.
Activity during April-June 2003. From 30 March through 27 April long-period earthquakes were concentrated beneath the NE flank, along with some short-period events. Although the number of long-period earthquakes decreased appreciably in late April and early May, similar seismicity continued through 21 June. The long-period events were distributed along a NW-SE trend, corresponding to the fracture zone towards Nyiragongo.
From 30 April until 1 May, it seemed that there was some renewal of activity, but no eruption was detected. Residents of Katale and Tongo, the closest villages to the volcano, reported some rumblings on 30 April between 1730 and 2130, plus clear sounds of individual explosions. The closest seismic station (Katale) recorded at the same time ~18 distinct explosion signals, directly followed at 1927 by a tectonic earthquake centered under the volcano. Later, seven type-C events followed until 2232. Another tectonic earthquake occurred at 2338.
Residents of Kunene (~12 km SW), Katale (~10 km NE), and Tongo claimed to have heard explosions and growling noises on 9 May. Local tectonic earthquakes from late May through late June were 0-27 km deep, with an aseismic zone at 3-7 km. Seismicity during 22-28 June was dominated by long-period earthquakes concentrated in the NE, in which there was an apparent increase compared to the previous week.
Information Contacts: Goma Volcano Observatory, Departement de Geophysique, Centre de Recherche en Sciences Naturelles, Lwiro, D.S. Bukavu, DR Congo.
Long-period earthquakes and swarms in July 2003
The last eruption at Nyamuragira occurred during 25 July-27 September 2002 (BGVN 27:07, 27:10, and 28:01). Tectonic and magmatic seismicity continued through June 2003, but there has been no confirmed eruptive activity. This report covers activity from early July to the beginning of August 2003. Seismicity generally consisted of long-period (LP) earthquakes on the NE side of the volcano. In addition, earthquake swarms were occasionally observed.
Between 6 and 12 July, seismicity was dominated by LP earthquakes NE of the volcano and SE along the fracture zone between Nyamuragira and Nyiragongo. Two large swarms occurred on 7 and 8 July, with 161 LP earthquakes and 10 short-period earthquakes. The earthquakes at Nyamuragira have been deep, between 15 and 20 km.
During 13-19 July 2003, LP earthquakes NE of the volcano again dominated seismicity. Compared to the previous week, activity was low, with no swarms and only one high-frequency earthquake. The following week, between 20 and 26 July, LP earthquakes continued in the NE and to a lesser extent along the SE fracture zone. Between 19 and 21 July new sequences of earthquakes occurred, with LP events followed by short-period earthquakes, coupled with high-amplitude tremor episodes.
Between 27 July and 2 August, LP earthquakes continued to dominate seismicity NE of the volcano as well as along the SE fracture zone. Seismicity increased from the previous week, with sequences of LP earthquakes coupled with volcanic tremor episodes between 28 and 31 July. Average seismicity doubled to 200 earthquakes with hypocenters between 3 and 20 km deep.
Information Contacts: Goma Volcano Observatory, Departement de Geophysique, Centre de Recherche en Sciences Naturelles, Lwiro, D.S. Bukavu, DR Congo.
Long-period earthquake swarms
During the 3-month period from 2 August to 8 November 2003, seismicity in the Nyamuragira area was dominated by long-period (LP) events localized along a main NNE-SSW fracture between Nyamuragira and Nyiragongo volcanoes. Intermittent swarms of LP events (60-80 events each time) occurred on Nyamuragira two to three times per week. A larger swarm was observed on 23 July (100 LP events). This activity remained fairly stable for the whole period. Earthquakes related to fracturing continued, mainly S of Nyiragongo (N of Lake Kivu ) and NE of Nyamuragira. No noticeable deformation change has been recorded along the fracture system.
Information Contacts: Observatoire Volcanologique de Goma, Departement de Geophysique, Centre de Recherche en Sciences Naturelles, Lwiro, D.S. Bukavu, DR Congo.
Political instability limits field access; growing seismicity
On 15 December 2003, the Goma Volcano Observatory (GVO) reported growing seismicity around Nyamuragira during the past few weeks. Because of political instability, the team lacked access to the field. The seismic observations have been made using the distant seismic network. According to the data they acquired, GVO felt that a new eruption was likely in the next weeks.
Because the volcano is located inside the National Park ~ 40 km NNW of Goma, potential lava flows were not expected to threaten the city. Other areas on the W side of the volcano could be affected by gas and dust clouds or by ash falls.
Information Contacts: Baluku Bajope and Kasereka Mahinda, Observatoire Volcanologique de Goma, Departement de Geophysique, Centre de Recherche en Sciences Naturelles, Lwiro, D.S. Bukavu, DR Congo; Jacques Durieux, UN-OCHA resident volcanologist, c/o UN Office for the Coordination of Humanitarian Affairs, United Nations Geneva , Palais des Nations,1211 Geneva 10, Switzerland (URL: http://www.unog.ch).
New eruption on 8 May spawns cones, lava lake, fountains, and lava flows
The Observatoire Volcanologique de Goma (Goma Volcano Observatory, GVO) reported that a new eruption at Nyamuragira began at 0548 on 8 May 2004. Activity started in the summit caldera and later propagated to the N flank. Since July 2003 Nyamuragira had shown abnormal behavior, having an average of 3 distinct seismic swarms per month (see Bulletin, v. 28, no. 9, 10, and 12). The last of these swarms occurred during 4-6 May 2004. The eruption was also preceded by an important high frequency (HF) earthquake felt in the Virunga area at 0144 on 8 May, localized below the N part of Lake Kivu. This event was followed at 0315 on 8 May by a high-amplitude long-period earthquake located N of Virunga. Unusual and significant fumarolic activity from the Nyamuragira caldera was seen from Goma (~ 40 km S) on 2 May 2004.
On its overpass of Nyamuragira at 1056 on 8 May 2004, the Earth Probe Total Ozone Mapping Spectrometer (EP TOMS) detected large SO2 clouds released by the current eruption of Nyamuragira. However, the situation was complicated by the fact that EP TOMS has recorded SO2 emissions from Nyiragongo (~ 15 km SSE of Nyamuragira) since October 2002, and therefore some SO2 from Nyiragongo was also likely to be present. Daily SO2 amounts observed at Nyiragongo over the past month have been in the range of ~ 5-30 kilotons (kt). An SO2 cloud was detected extending in several directions from Nyamuragira, containing ~ 30 kt of SO2. A data gap over eastern Democratic Republic of Congo (DRC) prevented measurements on 9 May, although there was evidence for some SO2 drifting over northern Tanzania, ~ 720 km from Nyamuragira.
On 10 May at 1055 a broad SO2 cloud extended up to ~ 180 km W, ~ 360 km S, and ~ 260 km ESE of the volcano, completely covering Rwanda and Burundi, with the highest SO2 concentrations detected in a zone directed SSE across Rwanda. This cloud contained ~ 190 kt of SO2. Another data gap on 11 May prevented measurements directly over eastern DRC, but a large SO2 mass (~ 116 kt) was present W of the data gap, ~ 560 km S of Nyamuragira at its maximum extent. No ash was detected in the volcanic clouds by EP TOMS as of 12 May, and the maximum altitude reached by the SO2 was unclear. A number of anomalous pixels indicating a hot spot just N of Nyamuragira were observed at 1030 on 9 May from the MODIS (Moderate Resolution Imaging Spectroradiometer) thermal satellite imagery (URL: http://modis.higp.hawaii.edu/).
Overflights attempted by GVO on 8 May failed because of the rainy season's bad weather, but the quick glimpse suggested a significant lava flow descending the N slope. On 9 and 12 May GVO plane overflights and a field mission in the area located to the volcano's N revealed that one active lava lake appeared an unstated distance NNE of the Nyamuragira caldera. This lake, ~ 300 m in diameter, was located in a pit ~ 15 m deep and fed by 4 strong lava fountains. Activity was much reduced by 12 May. The surface was a solid crust with three vents open through it. All vents displayed Strombolian activity with spatter splashing and short lava overflows; accumulation of spatter tends to build low cones.
An eruptive fracture, ~ 2 km long, was found on the N-NW flank of the volcano. Several lava fountains were very active all along the fracture and 4 main cones were building up to heights estimated as 30-50 m. Lava poured from many vents and turned into a main flow directed towards the N-NW, always within the Virunga National Park boundaries. Flows made an intricate delta below the lower cone, turning onto a very wide lava flow that covered an area with a total length estimated to be ~ 12 km. Although this flow continued to move, it failed to threaten any populated areas. Ashfalls were observed in several villages on the W and N sides of the volcano. The activity remained quite strong and apparently stable in comparison with other documented Nyamuragira eruptions.
Information Contacts: Kasereka Mahinda and Jacques Durieux, Observatoire Volcanologique de Goma (Goma Volcano Observatory), Department de Geophysique, Centre de Recherche en Sciences Naturelles, Lwiro, D.S. Bukavu, DR Congo; Simon Carn, TOMS Volcanic Emissions Group, University of Maryland, 1000 Hilltop Circle, Baltimore, MD 21250, USA (URL: https://so2.gsfc.nasa.gov/).
During 26 May-1 June observers noted weak eruptions and local ashfall
When last reported (BGVN 29:04), Nyamuragira was in the midst of an eruption that had begun on 8 May 2004 and continued through 12 May. The Toulouse Volcanic Ash Advisory Center (VAAC) reported that satellite imagery showed a weak ash eruption on 25 May and that from 26 May to 1 June there were weak but steady emissions from Nyamuragira and neighboring Nyiragongo (~13 km SE of Nyamuragira). The Goma volcano observatory confirmed that ash fell within a radius of 60 km of both volcanoes. VAAC reports on 1 June said that satellite imagery indicated the eruptions at Nyamuragira had ceased.
Information Contacts: Baluku Bajope and Kasereka Mahinda, Observatoire Volcanologique de Goma, Departement de Geophysique, Centre de Recherche en Sciences Naturelles, Lwiro, D.S. Bukavu, DR Congo; Toulouse Volcanic Ash Advisory Center (VAAC), Météo-France, 42 Avenue Gaspard Coriolis, F-31057 Toulouse cedex, France (URL: http://www.meteo.fr/vaac/); TOMS Volcanic Emissions Group (URL: https://so2.gsfc.nasa.gov/).
To the N, swarms of long-period, along-rift earthquakes
Nyamuragira last erupted during May 2004; weak but steady ash emissions continued until 1 June 2004, when satellite imagery indicated that the eruption had ceased (BGVN 29:05). The volcano, whose name is sometimes written as Nyamlagira and Nyamulagira, was the scene of several seismic swarms in middle and late 2005.
On 6 July 2005, the Goma Volcano Observatory (GVO) reported that a significant seismic crisis had occurred at Nyamuragira in late June 2005. The crisis consisted of swarms of mainly long-period earthquakes, which increased in number daily and peaked on 26 and 27 June. Most of the events occurred within a 10 km radius around Nyamuragira's summit caldera and were aligned roughly N-S. The depths of the earthquakes ranged from 0 to 30 km, with two main areas of concentration; one between 15 and 25 km deep, and the other between 0 and 4 km. Based on precursory activity before previous historical eruptions at Nyamuragira, GVO reported that a new eruption might occur in the next 2-4 months. They stressed that an eruption would not threaten the city of Goma or other inhabited areas.
Beginning on 23 October 2005, GVO again recorded heightened seismic activity along the East African Rift and around the Virunga volcanoes when a swarm of long-period earthquakes occurred N of Nyamuragira. More than 140 events were recorded at a station 19 km E of the volcano. On 27 October at 1500, another swarm of long-period earthquakes began beneath the same area. More than 300 events were recorded until at least 28 October. At 2010 on that day, a M 4.5 tectonic earthquake occurred N of Lake Tanganika, followed by several aftershocks. The Alert Level for the nearby city of Goma remained at Yellow.
Information Contacts: Baluku Bajope and Kasereka Mahinda, Observatoire Volcanologique de Goma, Departement de Geophysique, Centre de Recherche en Sciences Naturelles, Lwiro, D.S. Bukavu, DR Congo; Toulouse Volcanic Ash Advisory Center (VAAC), Météo-France, 42 Avenue Gaspard Coriolis, F-31057 Toulouse cedex, France (URL: http://www.meteo.fr/vaac/); TOMS Volcanic Emissions Group, NASA Goddard Space Flight Center, Code 613.3, Greenbelt, MD 20771, USA (URL: https://so2.gsfc.nasa.gov/).
October seismic swarm followed by the eruption of 27 November 2006
Jacques Durieux, the United Nations manager for Volcano Risk Reduction for the Goma Volcano Observatory (GVO), reported that at about 2000 on 26 October 2006 the observatory began to record sustained seismic activity. The activity took place in the Virunga area, located in the central part of Western arm of the East African rift valley. The swarm of long-period earthquakes was located around Nyamuragira and persisted for a month, through 1700 on 27 November 2006. The volcano was the scene of several seismic swarms in middle and late 2005 (BGVN 31:01).
GVO observed the beginning of a new eruption at 2000 on 27 November 2006 (figure 26). Seen from ~ 30 km S of the volcano in Goma, the eruption site appeared to be located on the S flank; intense red glow suggested typical lava fountains and lava flows.
The local security situation prevented closer field observations. GVO was attempting to organize helicopter overflights to collect more information for updates. One concern was that foraging animals could fall ill after eating ash-coated vegetation. In assessing the situation, authorities considered Goma to be safe from any potential lava flows as Mount Nyiragongo would serve as a buffer.
Based on satellite imagery, the Toulouse VAAC reported that during 29 November-2 December 2006 emissions produced ash plumes to altitudes of 3-6.1 km. Those plumes drifted W and NW. By mid-morning on 2 December, ash plumes were no longer reported.
Besides ash and possible lava, the volcano also released extensive sulfur dioxide (SO2), a feature of this volcano that has been mentioned repeatedly in the literature (see some references below). The Ozone Monitoring Instrument (OMI) on NASA's Aura satellite tracked the emission of this gas from the volcano from 28 November to 4 December 2006 (figure 27). The SO2 gas was most concentrated around the eruption site and thinned as it moved away. The plume first traveled W, then curved along an arc progressing in a clockwise direction toward the NE and then E. It remained clearly detectable over NW India, a distance of ~ 9,000 km.
The latest eruption of Nyamuragira was its 15th since 1980. Table 2 shows OMI's estimated SO2 loadings during 28 November to 4 December 2006 as computed by Simon Carn. Carn also presented daily OMI images (like figure 27) during the same date range as table 2.
Table 2. Daily SO2 flux at Nyamuragira, measured by OMI during 28 November to 4 December 2006. Courtesy of Simon Carn.
| Date | Sulfur dioxide, Tg (tetragram = 1012 g) |
| 28 Nov 2006 | 0.21 |
| 29 Nov 2006 | 0.46 |
| 30 Nov 2006 | 0.68 |
| 01 Dec 2006 | 0.77 |
| 02 Dec 2006 | 0.78 |
| 03 Dec 2006 | 0.71 |
| 04 Dec 2006 | 0.59 |
| Total | 4.20 |
References. Carn, S.A., Bluth, G.J.S., and Head, E., (in progress), Virunga Volcanic SO2 Emissions Research (ViSOR) project (discussed at URL: http://userpages.umbc.edu/~scarn/virunga/).
Carn, S.A., 2004, Eruptive and passive degassing of sulfur dioxide at Nyiragongo volcano (D.R. Congo): the 17 January 2002 eruption and its aftermath: Acta Vulcanologica, v. 14-15, p. 75-86.
Carn, S.A., and Bluth, G.J.S., 2003, Prodigious sulfur dioxide emissions from Nyamuragira volcano, D.R. Congo: Geophys. Res. Lett., v. 30, no. 23, p. 2211, doi:10.1029/2003GL018465.
Bluth, G.J.S, and Carn, S.A., (in progress), Exceptional sulphur degassing from Nyamuragira volcano, 1979-2005: Int. J. Remote Sensing.
Tedesco, D., Vaselli, O., Papale, P., Carn, S.A., Voltaggio, M., Sawyer, G.M., Durieux, J., Kasereka, M., and Tassi, F., (in progress), The January 2002 Eruption of Nyiragongo volcano, Democratic Republic of Congo: J. Geophys. Res.
Information Contacts: Jacques Durieux, Observatoire Volcanologique de Goma, Departement de Geophysique, Centre de Recherche en Sciences Naturelles, Lwiro, D.S. Bukavu, DR Congo; NASA, Earth Observatory Natural Hazards website (URL: http://earthobservatory.nasa.gov/NaturalHazards); Simon Carn, Joint Center for Earth Systems Technology (JCET), University of Maryland Baltimore County (UMBC), 1000 Hilltop Circle, Baltimore, MD, USA (URL: https://jcet.umbc.edu/); Toulouse Volcanic Ash Advisory Center (VAAC), Météo-France, 42 Avenue Gaspard Coriolis, F-31057 Toulouse cedex, France (URL: http://www.meteo.fr/vaac/).
November 2006 eruption produces extensive lava flows
Nyamuragira last began erupting on 27 November 2006 (BGVN 32:01). Figure 28 shows lava flows from the November eruption based on available observations as of 2 December 2006. The flows were on the outer SE flank and covered extensive areas.
This map gives only the broad context of the flows' locations and movements; more detailed mapping was curtailed by armed conflict and a lack of security in the region. The flows were also the source of thermal infrared emissions. A recent article by Tedesco and others (2007) included a geologic map of the region (see Nyiragongo report below).
MODVOLC Thermal Alerts. The description of the 2006 eruption in BGVN 32:01 did not report MODIS satellite thermal anomalies for this eruption as the measured anomalies all fell S of the Nyamuragira crater, covering much of the area between Nyamuragira and Nyiragongo. Further analysis of the University of Hawai'i Institute of Geophysics and Planetology (HIGP) MODIS Hotspot Alert website data revealed that most of a year's anomalies (mid-April 2006 to mid-April 2007) between the two volcanos were measured during the period mid-November to mid-December 2006, probably related to the eruption of Nyamuragira that began on 27 November 2006.
A compilation of MODIS thermal anomalies for 1 year, 19 April 2006-16 April 2007 (figure 29), shows both a typical concentration of nearly daily anomalies over Nyiragongo resulting from the lava lake within the volcano's main crater, and also a considerable number of anomalies between Nyiragongo and nearby Nyamuragira (albeit, none over the Nyamuragira crater). Figure 30 shows thermal anomalies measured by MODIS for three 1- month periods: 22 October-18 November 2006; 20 November-18 December 2006; and 20 December 2006-17 January 2007, and 4 December 2006. Most of the anomalies seen between Nyiragongo and Nyamuragira during the year occurred in the mid-November to mid-December 2006 time frame. An analysis of the chronological tabulation of anomaly pixels during this 30-day period showed a concentration from 27 November to 16 December. Typical monthly patterns of thermal anomalies show a concentration over the Nyiragongo crater lava lake.
Anomalies measured on 4 December 2006 (figure 30) appeared along a line nearly perpendicular to a line between the volcanos and about equidistant to the two volcanoes. Rob Wright reported that this linear anomaly corresponded to an extensive lava flow. It was seen for several days prior to and after 4 December in the same region between Nyiragongo and Nyamuragira.
Wright noted that if one looks at the position and orientation of the pattern of thermal anomaly pixels, it seems to vary over the period. This variation could result from a combination of factors, including: (1) clouds?an apparent shape/ orientation of the anomaly can be induced by the fact that some portions of the flow-field may have been obscured at the moment of image acquisition; (2) sensor zenith angle?the data for 4 December 2006 were acquired when the satellite was within 1 to 16° of being directly overhead, whereas on other days (i.e. 1 December 2006) the lava flow field was at the edge of the image swath (i.e. at an angle of about 60°); at these extreme scan angles the pixel geolocation becomes less accurate (and the pixels increase in size, to about 2 by 4 km).
References. Tedesco, D., Badiali, L., Boschi, E., Papale, P., Tassi, F., Vaselli, O., Kasereka, C., Durieux, J., Denatale, G., Amato, A., Cattaneo, M., Ciraba, H., Chirico, G., Delladio, A., Demartin, M., Favalli, G., Franceschi, D., Lauciani, V., Mavonga, G., onachesi, G., Pagliuca, N.M., Sorrentino, D., and Yalire, M., 2007, Cooperation on Congo Volcanic and Environmental Risks, EOS, Transactions, American Geophysical Union, v. 88, no. 16, p. 177, 181.
Information Contacts: Jacques Durieux, United Nations Office for Project Services, Unite de Gestion des Risques Volcaniques, Observatoire Volcanologique de Goma; Hawai'i Institute of Geophysics and Planetology, MODIS Thermal Alert System, School of Ocean and Earth Sciences and Technology (SOEST), University of Hawai'i, 2525 Correa Road, Honolulu, HI, USA (URL: http://modis.higp.hawaii.edu/); Rob Wright, Hawaii Institute of Geophysics and Planetology, University of Hawaii, 1680 East-West Road, Honolulu, HI 96822, USA (URL: http://modis.higp.hawaii.edu/).
January 2010 flank eruption produces a new cone and 12-km-long lava flows
A strong eruption at Nyamuragira (the volcano's name in the Kinyarwanda language, but "Nyamulagira" in other DR Congo languages) (figure 31) began on 2 January 2010, the first reported eruption since November 2006 (BGVN 32:03). It produced extensive lava flows on the outer SSE flank. According to seismic data from the Goma Volcano Observatory (GVO) monitoring network (figure 32), the eruption began on 2 January at 0217.
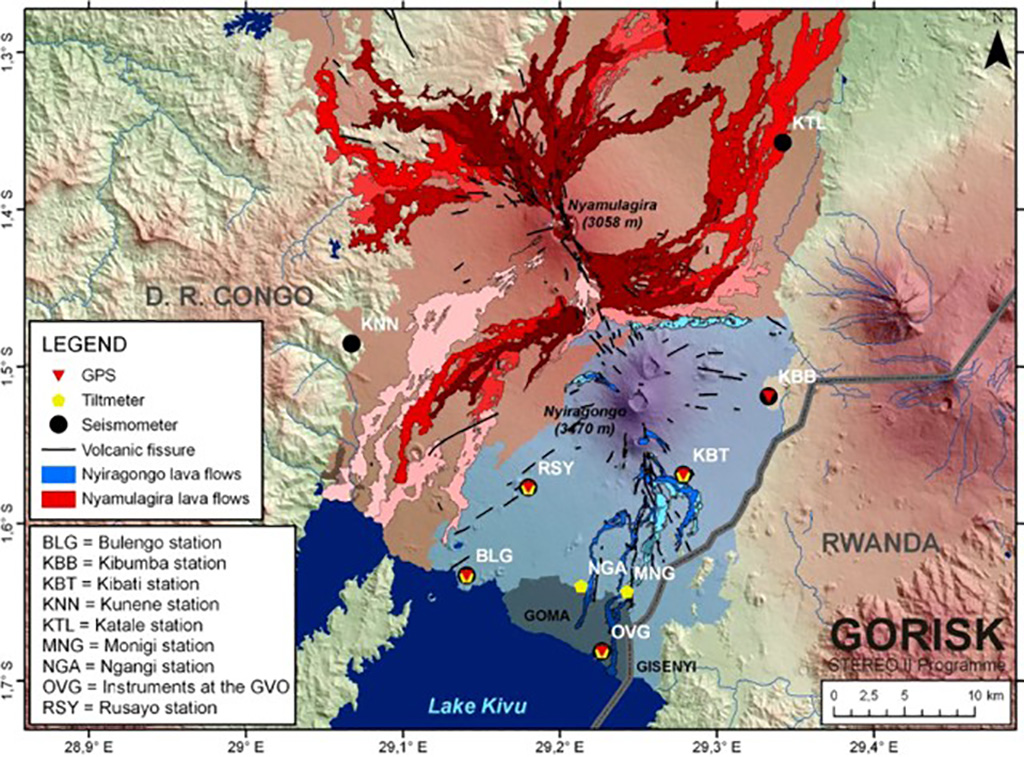 |
Figure 32. Map showing some of the seismic stations surrounding Nyamuragira and Nyiragongo. Courtesy B. Smets, GORISK. |
Benoît Smets, of the Royal Museum for Central Africa (RMCA-NMNH, Tervuren, Belgium), summarized the eruption as follows: "Lava erupted inside the main caldera from the pit crater (located in the NE part of the caldera) and along an ENE-WSW-trending fracture in the S part of the caldera. A 600-m-long fissure opened on the SSE flank of the main edifice, ~1.5 km from the caldera rim. The lava fountains from the flank fissure built a ~150-m-high spatter cone."
Lava flows emanated from the region of the cone and ultimately branched and extended over a large area with the most distal flow front over 10 km from the vent. Additional details, including photographs, are available on the GORISK website (see Information Contacts, below). According to Karume and others (2010) and Smets and others (2010c), the eruption lasted until 27 January 2010.
Thermal data. Data collected early in the eruption, on 4 January, led UNOSAT analysts to suggest that MODIS Aqua thermal anomalies were "likely to represent active fires and lava on the eastern edge of the main crater," which "extended approximately 12 km along the southern slope toward Lake Kivu."
According to MODVOLC data processing, thermal alerts were absent during the entire year 2009 and then were observed in the vicinity of Nyamuragira beginning on 2 January 2010. Large numbers of hotspots covered portions of the summit and areas mostly S on 4, 6-9, 18, 20, and 22 January, and occurred SE of the summit on 11, 13, 15-17, 19, 21, 23-27, 29, and 31 January. Few hotpots were visible SE of the summit on 1 and 2 February, though visual observations by helicopter confirmed that no more lava was emitted. Hotspots were not seen after that through at least 31 August. Clouds may have obscured the view at times.
Seismicity. Several long-period seismic swarms were recorded between the 2006 and 2010 eruptions. A period of particularly high seismic activity occurred during 6 months following a 5.9-magnitude earthquake in Bukavu (128 km SSW) on 3 February 2008. However, there was no noticeable increase in seismic activity in the months preceding the January 2010 eruption. According to Tedesco (2010), both tectonic earthquake (fracturing) and volcanic tremors (magma degassing) occurred simultaneously with the appearance of lava at the surface (figure 33). This observation suggested to Tedesco (2010) that magma was already close to the surface before the eruption.
Initial reports of January 2010 eruption. Agence France-Presse and CNN reported that park rangers heard a loud explosion in the early morning of 2 January before seeing lava flowing from a fissure on the SE flank. By 3 January, the lava flow had traveled 4.6 km, was 15 m wide, and had burned ~11 ha (hectares; 11 x 104 m2) of forest in the Virunga National Park. Agence France-Presse reported that ash fell in Goma (30 km S) on 7 January, and that by 8 January a 200-m-wide lava flow had advanced ~7 km. The BBC reported concerns that the lava flow could destroy habitat occupied by an endangered population of about 40 chimpanzees and other wildlife on the volcano's lower slopes. Congo's 200 critically endangered mountain gorillas were not in danger, as they live ~25 km E on the flanks of the Mikeno volcano (figure 31).
Ground observations. Daily observations were performed by the United Nations Organization Mission in the Democratic Republic of Congo (MONUC) helicopter, and continuous geodetic data were available from nearby GPS and tilt stations located around the city of Goma and Nyiragongo and Nyamuragira (figure 32). Observations were performed by members of the GVO, the United Nations Office for Project Services (UNOPS), the Royal Museum for Central Africa (Belgium), and the National Museum of Natural History of Luxembourg.
Ashfall occurred during the first week of the eruption and affected Goma and villages to the W and SW. During the following days, only a small amount of ash was in the plume. Observers noted damage to crops, including green beans, sweet potatoes, cassava and banana groves.
Lava fountains reached higher than 300 m during the first days of the eruption. Beginning on 11 January, this height began to decrease irregularly to 50-150 m high. The main flows were 10.5-11 km long, and covered portions of the flow from the 2006 eruption (Ushindi) (figure 34).
Smets and others (2010b) estimated the area covered by erupted products using an ASTER thermal image and found it to be 17.65 ? 5.98 x 10⁶ m2 based on the spatial resolution of the image. They also estimated the lava volume at ~53 x 106 m3.At the lower end of this fissure eruption, a volcanic cone grew that was reported by GVO to have been named "Kahinga Kabarinzi" by local people, meaning "customary keeper's cone." GVO reported that the cone emerged 3.2 km SSE of the summit, just to the W of one that erupted in 2000 and practically at the same elevation (figure 35).
Additional satellite imagery. SO2 aerosol data showing significant activity were first captured by the OMI and GOME-2 instruments on 2 and 3 January (figure 36). The Washington VAAC also reported a large sulfur dioxide plume in the vicinity during 10-11 January. The Toulouse VAAC reported that, on 18 January, sulfur dioxide-and-steam plumes from Nyamuragira possibly contained ash. An ash cloud was visible in satellite imagery the next day.
An ASTER image on 18 January showed that the eruption occurred on the SE rift zone and gave rise to two significant lava flows (figure 37), the longest of which extended 12 km. The active hot flows overlapped cooled flows emplaced at the beginning of the eruption. Multispectral capabilities of ASTER also allowed measurement of a massive emission of SO2 from the cone (figure 38). The eruption, although in a declining stage, was still releasing about 16,000 metric tons/day of SO2 that was transported W by the wind. Emissions during the first days of activity were probably an order of magnitude higher.
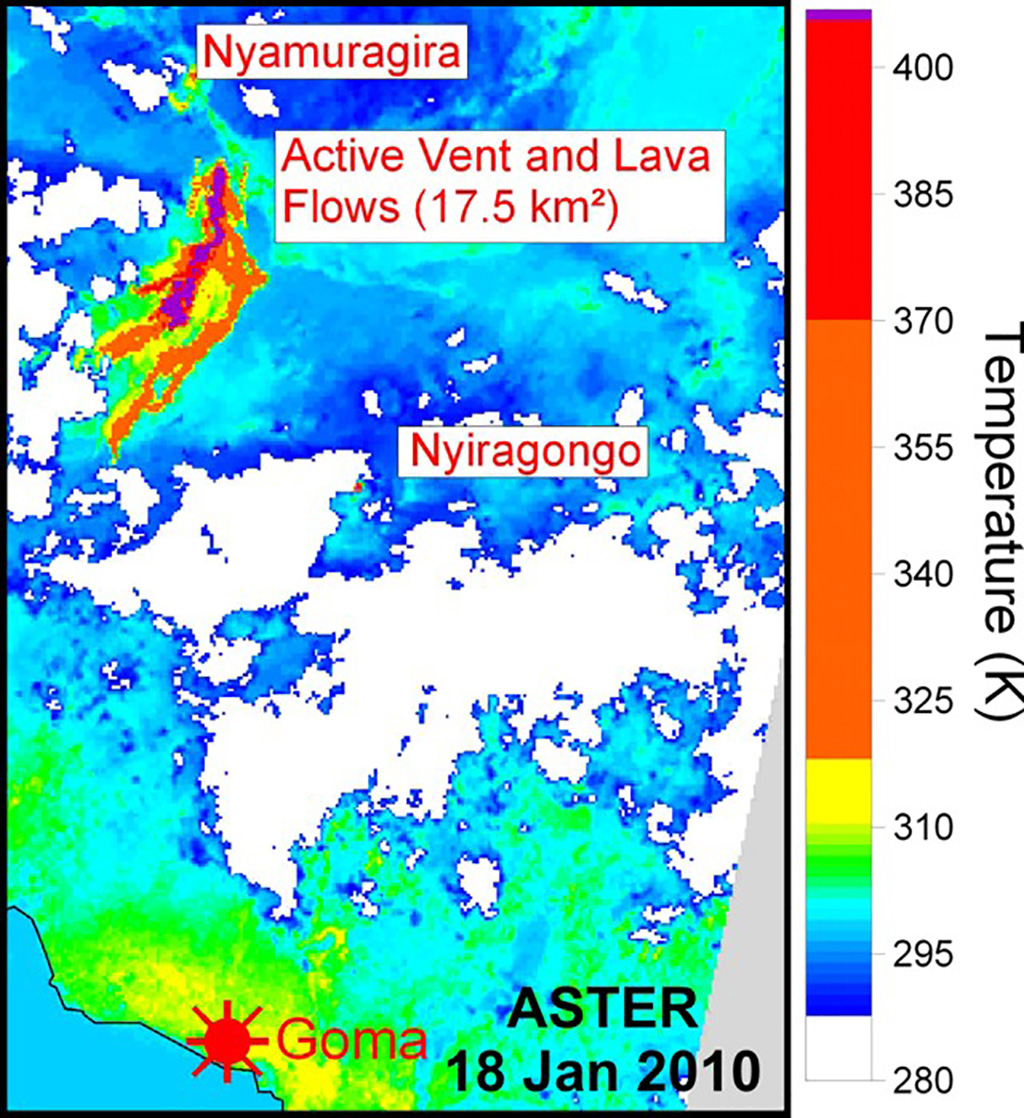 |
Figure 37. ASTER image from 18 January 2010 showing active vent and lava flows at Nyamuragira. Courtesy Robin Campion, Université Libre de Bruxelles (ULB), Belgium. |
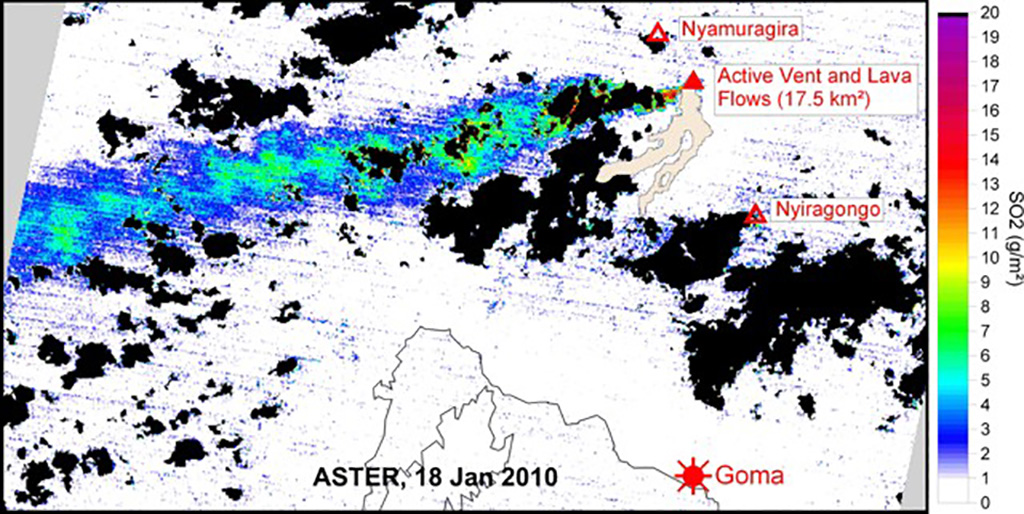 |
Figure 38. ASTER image from 18 January 2010 showing gas plume emitted from Nyamuragira. Courtesy Robin Campion, ULB. |
SAR interferometry. By comparing advanced synthetic aperture radar (ASAR) images acquired over the area before and after the eruption, analysts recognized lava flows in the summit caldera. The National Museum of Natural History of Luxembourg also used this technique, called SAR interferometry, or InSAR, to study the ground deformation during the eruption. These data helped to demonstrate that only Nyamuragira was erupting and dispelled rumors about possible activity at neighboring Nyiragongo.
Real-time monitoring. According to Karume and others (2010), the monitoring and fast response with spaceborne tools allowed the GVO to provide Goma regional authorities and the humanitarian community with daily hazard assessments for the first time.
Smets and others (2010a) reported that lava from the 1938-2010 eruptions cover ~40% (more than 430 km?) of the entire surface of the Nyamuragira lava-flow field (figures 31 and 39). The extent of the last century's lava flows also illustrates the hazard for the densely inhabited area along the NW shoreline of Lake Kivu; three lava flows have reached the lake within the last 100 years, and acid rains and pyroclastic falls have regularly affected crops and urban zones in this area.
In a Nature News Feature, Nayar (2009) discusses Lake Kivu's dissolved gases, some of which are toxic, and others, such as methane, which are potentially valuable economically. As noted in previous reports about the East African Rift (eg. Lake Nyos, SEAN 10:08, 11:08, and 11:09, and BGVN 15:11), a significant disturbance such as a large lava flow entering the lake could destabilize the stratified waters, triggering release of toxic gases from greater depths.
References. Karume, K., Kavotha, D., Kervyn, F., Lukaya, F., D'Oreye, N., Rukeza, B., Smets, B., Tedesco, D., Wauthier, C., and GVO Team, 2010, Description of the January 2010 eruption of Nyamulagira (North Kivu, D.R. Congo): Presented at Cities on Volcanoes 6, Puerto de la Cruz, Tenerife, Canary Islands, Spain, May 31-June 4.
Nayar, A., 2009, A lakeful of trouble: Nature (News Feature), v. 460, p. 321-323 (16 July 2009), Macmillan Publishers Ltd.
Smets, B., Kervyn, M., and Kervyn, F., 2010a, Analysis of historical eruptive activity at Nyamulagira (North Kivu, D.R.C.): Implications for hazards: Presented at Cities on Volcanoes 6, Puerto de la Cruz, Tenerife, Canary Islands, Spain, May 31-June 4.
Smets, B., Wauthier, C., D'Oreye, N., 2010b (in press), A new map of the lava flow field of Nyamulagira (D.R. Congo) from satellite imagery: J. African Earth Sci.
Smets, B., Wauthier, C., D'Oreye, N., 2010c, The combined use of multispectral and radar satellite images to map the lava flow field of Nyamulagira (North Kivu, D.R.C.): Presented at Cities on Volcanoes 6, Puerto de la Cruz, Tenerife, Canary Islands, Spain, May 31-June 4.
Smets, B., Wauthier, C., D'Oreye, N., and van Overbeke, A.-C., 2010d (in press) Volcanological map of Nyamulagira?Virunga Volcanic Province, North Kivu, D.R.C. 1/100.000, Royal Museum for Central Africa: Tervuren, Belgium.
Tedesco, D., 2010, The January 2, 2010 eruption of Mt. Nyamulagira: Field observations, evolution and possible human and infrastructures impact: UNOPS report ? Prevention and Analysis of Volcanic Hazards in North Kivu, DRC, 8 p.
Information Contacts: Katcho Karume and Kavotha Kalendi, Observatoire Volcanologique de Goma, Departement de Geophysique, Centre de Recherche en Sciences Naturelles, Lwiro, D.S. Bukavu, DR Congo; Benoît Smets, Royal Museum for Central Africa, Leuvensesteenweg 13, 3080 Tervuren, Belgium; Nicolas D'Oreye, National Museum for Natural History, 19 rue J. Welter, 7256 Walferdange, GD Luxembourg; Dario Tedesco, University of Napoli 2, Dipartimento di Scienze Ambientali, via Vivaldi 43, 81100 Caserta, Italy; GORISK Scientific Team, International scientific team for the study and monitoring of active volcanoes and their corresponding hazards in the Virunga Volcanic Province (URL: http://terra.ecgs.lu/rnvt/).
Hawai'i Institute of Geophysics and Planetology (HIGP) Thermal Alerts System, School of Ocean and Earth Science and Technology (SOEST), Univ. of Hawai'i, 2525 Correa Road, Honolulu, HI 96822, USA (URL: http://modis.higp.hawaii.edu/); UNOSAT/UNITAR, Palais des Nations CH-1211 Geneva 10, Switzerland (URL: https://unitar.org/unosat/); Toulouse Volcanic Ash Advisory Center, Météo-France, 42 Avenue Gaspard Coriolis, F-31057 Toulouse cedex, France (URL: http://www.meteo.fr/vaac/); Washington Volcanic Ash Advisory Center, Satellite Analysis Branch (SAB), NOAA/NESDIS E/SP23, NOAA Science Center Room 401, 5200 Auth Rd, Camp Springs, MD 20746, USA (URL: http://www.ospo.noaa.gov/Products/atmosphere/vaac/); Gilberto A. Vicente, NOAA/NESDIS/OSDPD/SSD - Product Implementation Branch, E/SP2, NOAA Science Center, Room 510, 5200 Auth Road, Camp Springs, MD 20746; NOAA Satellite and Information Service, National Environmental Satellite, Data, and Information Service, 1335 East-West Highway, SSMC1, 8th Floor Silver Spring, MD 20910, USA (URL: http://www.nesdis.noaa.gov/); NASA Goddard Space Flight Center, Code 974, Greenbelt, MD 20771, USA; NASA Jet Propulsion Laboratory, California Institute of Technology, 1200 East California Boulevard, Pasadena, California 91125, USA.
Robin Campion, Université Libre de Bruxelles, Belgium, Avenue Franklin Roosevelt 50; CP 160/02; 1050 Bruxelles, Belgium; Simon Carn, Michigan Technological Institute (MTU), 1400 Townsend Drive, Houghton, MI 49931, USA (URL: https://so2.gsfc.nasa.gov/); Charles Holliday, U.S. Air Force Weather Agency (AFWA)/XOGM, Offutt Air Force Base, NE 68113, USA; European Space Agency, 8/10 Rue Mario Nikis, 75015 Paris, France (URL: http://www.esa.int/esaCP/SEM6UYKOP4G_index_0.html); Belgian Federal Science Policy Office, Avenue Louise 231 Louizalaan, B-1050 Brussels, Belgium (URL: http://www.belspo.be/); National Research Fund of Luxembourg, 6, rue Antoine de Saint-Exupéry, B.P. 1777, 1017 Luxembourg, Luxembourg (URL: http://www.fnr.lu); Agence France-Presse (URL: http://www.afp.com); CNN (URL: http://www.cnn.com); BBC (URL: http://www.bbc.co.uk).
Eruption during 6 November 2011 into early 2012; pit crater morphology changes
Our last report (BGVN 35:08) described a flank eruption at Nyamuragira during 2-27 January 2010 that produced a new cone and 12-km-long lava flows. The final report of the GORISK Scientific Network (Kervyn and others, 2010) stated that this eruption ended by 27 January 2010. MODVOLC thermal alerts occurred regularly at Nyamuragira through 2 February 2010 and then ceased until early November 2011.
Nyamuragira began to erupt again on its flanks at 1755 on 6 November 2011, according to GORISK, after two days of unspecified "intense seismic activity." This report conveys information from a variety of sources credited below, but largely from Dario Tedesco and the GORISK Scientific Network. GORISK was an initiative of both the National Museum of Natural History (Luxembourg) and the Royal Museum for Central Africa (Belgium). GORISK inferred that the eruption lasted through April 2012 [but only noted degassing from a vent inside the pit crater after late February in their June 2012 eruption summary].
An early synopsis of the eruption that began on 6 November 2011 came from the Virunga National Park. The eruption was visible at Park headquarters. Park staff described the 6 November eruption as coming from a fissure on the volcano's NE flank. It produced slow-moving lava flows that advanced into unpopulated areas to the N. Park staff also took a video of fountaining at night. On 7 November the Park uploaded 39 seconds of their footage on Youtube. During the first week of the eruption the Park staff hiked through the bush, in places having to cut vegetation, crossing young forest and irregular lichen-covered volcanic topography on a 4 hour hike that enabled them to take a closer view.
The hikers described airfall scoria covering the landscape as they approached closer. Their log said that the "...eruption finally came into view, along with the roar of intensely spewing fire and lava, as well as lightning and thunder." The vent area was located 12 km ENE of the crater, close to one of the 1989 eruptive sites. The first fissure was oriented E-W, perpendicular to the rift, and emitted lava fountains up to 300 m high. The eruption site was described as a flat area cut by a 500- to 1,000-m-long fissure. Figure 40 shows a photo from around this time but a topographic high of new material had already grown. NASA Earth Observatory reported that lava flows had advanced as far as 11.5 km by 12 November 2011 (figure 41). On 12 November, the lava flow front was located 5 km from the Kelengera-Tongo road.
For about a month, the park allowed overnight treks to the eruption site. A video featured on Youtube by Piet Schutter contains footage taken on 12 November; some scenes are at close range (looking up towards the eruption). That video shows both daylight and night scenes, features sound, and has people in the foreground, which helps establish scale.
The GORISK Scientific Team reported that satellite radar (InSAR) images acquired on 11 November 2011 revealed major ground deformation features associated with the eruption. Preliminary estimation of the observed deformation signal suggested an affected area spreading over 250 km2. Pressure from the ascending magma caused the ground to rise more than 50 cm at the eruptive site where a spatter cone developed. Another 15 cm deformation was detected within the caldera, which was accompanied by deflation observed on the flanks.
An elongated spatter-and-scoria cone, referred to by scientists as the western cone and by locals as "Umoja," formed along the first fissure (figure 42). In early December 2011, a new cone formed on a new eruptive fracture to the E; this cone was referred to by scientists as the eastern cone and by locals as "Tuungane" (figure 42). During the next few days, the eruptive activity migrated to this new edifice. Satellite images acquired on 3 January 2012 showed fresh lava flowing to the NNE (figures 43 and 44).
According to visiting scientists from the Afar Consortium Project, activity continued on 8 January 2012. The initial scoria cone appeared inactive and a second formed to the N of the first; both cones were about 300 m high. The second cone was extremely active for the duration of the observations (about 15 hours) with fountains over twice the height of the cone; lava flowed N. The observers, about 1.5 km away, felt the heat from the eruption and noted lapilli fall.
A group from Volcano Discovery observed the ongoing fissure eruption during 22-25 January 2012 from the newly formed cinder cones near the fissure. They reported three coalescent cones, the largest containing a small lava lake. The lake ejected spatter every few seconds, rising as high as 200 m above the summit. Some bombs reached the base of the cone. Lava flows from the vent extended several kilometers N. Numerous small breakouts formed secondary flows, and a large breakout ~2 km N of the cone fed a large lava flow ~20 m wide. Burning forests were reported to the NNE.
Preliminary estimates by GORISK for the 2011-2012 eruption indicated a volume of emitted lavas of at least 81.5 x 10⁶ m3. The lava flows did not reach inhabited areas and only affected vegetation in Virunga National Park. The 2011-2012 eruption was the biggest event at Nyamuragira since the 1991-1993 eruption, which lasted nearly 1.5 years and emitted an estimated ~131 x 106 m3 of lava (Smets and others, 2010).
A report by Dario Tedesco stated that in March 2012, a series of explosion earthquakes were recorded by the seismic network of the Goma Volcano Observatory. Following this activity, the fissure eruptions suddenly stopped. Also in March the morphology of the pit crater began to change (figures 45 and 46). Beginning in late February 2012 through at least June 2012, degassing occurred in the caldera. The emission site was located inside the pit crater, but degassing occurred from all fractures inside the caldera. On several occasions, meteorological conditions caused sulfur odors to reach the city of Goma (~30 km S from Nyamuragira's crater).
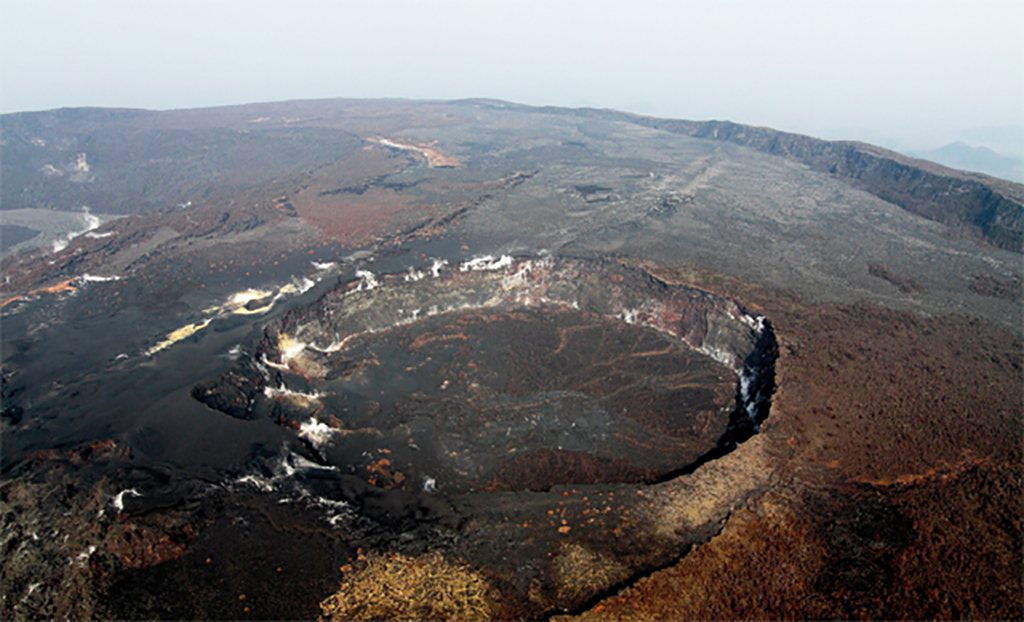 |
Figure 45. View of Nyamuragira's pit crater on 20 January 2012. Direction unknown. Courtesy Dario Tedesco, International Organization of Migrants and Second University of Naples. |
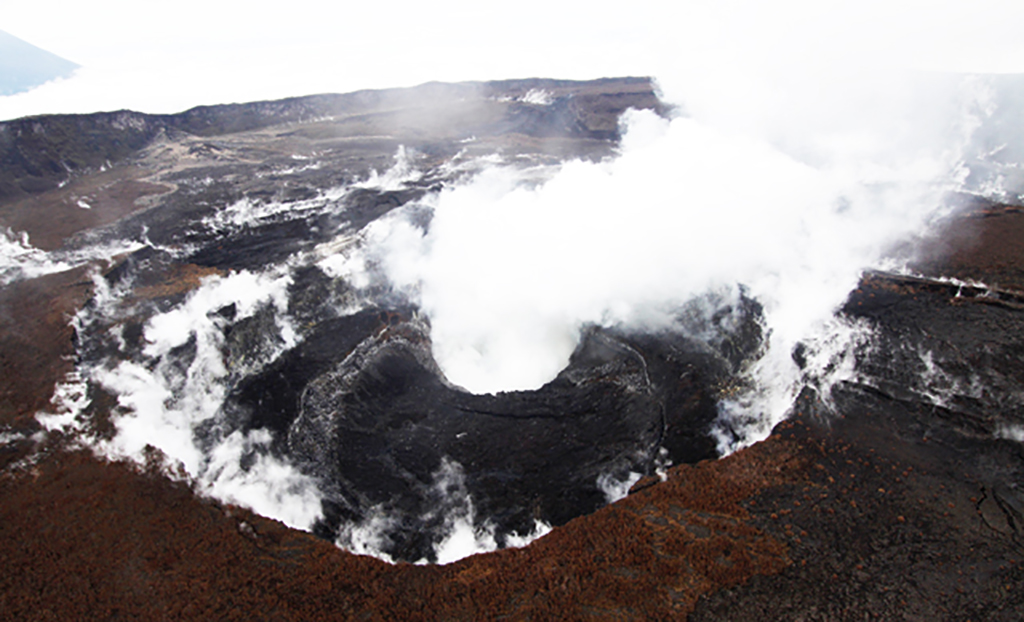 |
Figure 46. View of Nyamuragira's pit crater on 16 April 2012. Direction unknown. Courtesy Dario Tedesco, International Organization of Migrants and Second University of Naples. |
MODVOLC thermal alerts had waned at the fissure area by late March 2012, suggesting the end of the fissure eruption in that time frame. The last alerts around the summit area had occurred on 2 February 2010.
References. Kervyn, F, d'Oreye, N, van Overbeke, A-C, 2010, GORISK: The combined use of Ground-Based and Remote Sensing techniques as a tool for volcanic risk and health impact assessment for the Goma region (North Kivu, Democratic Republic of Congo). Final Report. [Project SR/00/113] (URL: http://www.ecgs.lu/gorisk/wp-content/uploads/2010/11/GORISK_Final_Report_DISSEMINATION.pdf )
Smets, B., Wauthier, C., d'Oreye, N. (2010). A new map of the lava flow field of Nyamulagira (D.R. Congo) from satellite imagery. Journal of African Earth Sciences, 58 (5), 778-786. DOI:10.1016/j.jafrearsci.2010.07.005
Information Contacts: Dario Tedesco, International Organization of Migrants (I.O.M.), Goma, DRC, and Second University of Naples, DISTABIF, Caserta, Italy; GORISK Scientific Team [an International scientific team for the study and monitoring of active volcanoes and their corresponding hazards in the Virunga Volcanic Province] (URL: http://terra.ecgs.lu/rnvt/); Virunga National Park, Democratic Republic of Congo (URL: http://virunga.org/); Jesse Allen and Robert Simmon, NASA Earth Observatory (URL: http://earthobservatory.nasa.gov); Volcano Discovery (URL: http://www.volcanodiscovery.com/); and Afar Consortium Project (URL: http://www.see.leeds.ac.uk/afar/).
April 2011-January 2015: Lava fountains; and by 1 November, a lava lake
This report covers activity at Nyamuragira (also called Nyamulagira) (figure 47), primarily from April 2014 to January 2015, during which time there were intervals with lava fountains, high SO2 fluxes, elevated thermal infrared emissions, and high seismicity. A lava lake was in clear evidence starting in November 2014 and into 2015. In the previous reporting interval (BGVN 39:03) an eruption occurred on 6 November 2011 and continued through April 2012. The reporting below begins with [information provided] by Benoît Smets and scientific colleagues including Nicolas d'Oreye, Nicolas Theys, and Julien Barriere.
Activity during 2012 to early 2015. [The following is from the report submitted by Smets.]
"Starting from early March 2012, i.e. in the final stage of the five month-long eruption on the NE flank of Nyamulagira, SO2-rich gas fumaroles were observed in the summit caldera of the volcano (D. Tedesco, Pers. Comm.). These fumaroles escaped from several fractures and from the 400-m-wide, 50-80-m-deep pit crater located in the NE part of the caldera. During the second half of April 2012, a larger and permanent SO2-rich gas plume started to escape from that pit crater.
"In April 2014, local testimonies reported red glow on top of Nyamulagira. This was accompanied by unusual seismic activity recorded by the Goma Volcano Observatory (GVO). Because of intense degassing, helicopter flights at day and night did not allow detecting any fresh lava at ground surface. This kind of event reappeared on 22 June 2014. This time, helicopter flights and field surveys on 1 and 5 July 2014 did allow observing lava fountains escaping from the lowest inner flanks of the now ~500 m-deep and ~400 x 600 m-wide pit crater [figure 48]. At that time, lava fountains were not vigorous enough to create and sustain a basin of molten lava in the pit crater. This [lava fountaining] was also characterized by large amounts of SO2-rich gas emissions.
"This [lava fountaining] stopped mid-September 2014 and, on 1 November 2014, a small lava lake, i.e. a small bubbling lava basin, appeared in the deepest section of the pit crater (GVO, Pers. Comm.). The related SO2 emissions appeared lower than during lava fountain activity. The lava lake activity at Nyamulagira seems to continue since [1 November 2014 through at least January 2015]. SO2 gas emissions, radiated energy, and seismic activity during the April-December 2014 period illustrate very well the evolution of this new activity and the transition from lava fountaining activity to long-lived lava lake activity [figure 49]."
Labels at the top of figure 49 represent behavior that Smets' team inferred on the basis of field observations. The intervals of quiet are unlabeled. The intervals with lava fountaining correspond with some intervals of high seismicity, high radiance, and pronounced SO2 emissions. The intervals with the lava lake are somewhat similar to the fountaining in terms of seismicity and radiance but the SO2 emissions were subdued.
According to the NASA MEASURES dataset, total atmospheric column SO2 spiked during 19 to 26 June 2014. There was a period of low values during late September to early November 2014. After that and during the rest of the reporting interval, SO2 was often elevated.
Lava lake. Observations of a lava lake were infrequent during much of 2014. Landsat 8 satellite images taken on 30 June 2014 and 29 July 2014 were interpreted by NASA Earth Observatory analysts Jesse Allen and Robert Simmon. They found "very hot surfaces" they interpreted as representing "the lava lake within the summit crater." Smets' team did not observe a lava lake during helicopter missions and an expedition to the volcano in July 2014. The team noted that by 1 November 2014 GVO had seen a small lava lake in the deepest part of the crater.
According to Bobrowski and others (2015) during 25 October to 5 November 2014 the lava lake was "still under formation" and field surveys carried out failed to find evidence for it. On the other hand, lava fountains were clearly observable in a ~350-m-wide crater, originating from an area of ~20 to 40 m2. These fountains ejected materials and exhibited activity that the authors said might evolve into a new lava lake.
Once formed (by 1 November 2014), the lava lake was described as deep-seated and formed in a pit within the caldera's central N to NE area (Campion, 2014; Smets and others, 2014). As mentioned at the top of this report, Smets also noted that the lava lake continued to exist through and beyond January 2015 (the end of this reporting interval).
MIROVA stands for Middle InfraRed Observation of Volcanic Activity, where middle infrared is defined as 0.4-14.4 micrometer wavelengths. The infrared processing system uses source data that comes from the MODIS instrument that flies on the Aqua and Terra satellites. MIROVA makes plots of Volcanic Radiative Power (VRP). These are measurements of the heat radiated by hot volcanic products at the time of satellite acquisition. The VRP is calculated in Watts (W) and represents a combined measurement of the area of the volcanic emitter and its effective radiating temperature. MIROVA calculates the Volcanic Radiative Power (VRP) by using the "MIR method", an approach which was initially introduced by in order to estimate the heat radiated by active fires using satellite data (Wooster et al., 2003).
This approach (also known as Middle InfraRed method) relies on the fact that whenever a hot emitter has an effective radiating temperature higher than 600 K, the excess radiance detected in the MIR region (DLMIR), can be linearly related to the radiative power. Hence, for any individual hot-spot contaminated MODIS pixels, MIROVA calculates the VRP. (VRP = 18.9 x APIX x DLMIR where 18.9 is a best-fit regression coefficient (Wooster and others, 2003), APIX is the pixel size (1 km2 for the MODIS pixels) and DLMIR is the above background MIR radiance of the pixel.) When a hot-spot is detected in more than one pixel, the total VRP is calculated as the sum of all pixels detecting a hot-spot.
Figure 50 is a time-series plot compiled by the MIROVA infrared processing system. All of the events on the plot that correspond to thermal anomalies are in the categories labeled low, moderate, and high. All of the events in the range moderate to high came from sources within 5 km of the crater (blue data points). Thermal emissions increased in June 2014, were minor for a period from late September to early November 2014, and increased once again for an interval extending through January 2015. Note the continuity of more elevated anomalies starting in November 2014, when there was clear evidence of the lava lake.
MODIS instrument infrared data is automatically analyzed with the MODVOLC algorithm, creating alerts for cases with above-threshold thermal emissions. During April-May 2014, there were only six days with thermal alerts. Subsequently, the number of alerts increased in June 2014, in concurrence with the lava fountains. There were heightened periods of activity during 22–29 June and 1–3, 10–12, and 28 July. During August and September 2014, thermal events were once again sparse with occurrences only on three days. No events were observed in October. Consistent with other observations of the formation of a lava lake, alerts increased on 1 November and continued during 6–10 and 22–26 November. Thermal events occurred during 10–15 December and on 22, 24, and 31 December 2014. In January 2015, thermal activity was detected regularly during 9–18 and 25–30 January.
References. Bobrowski, N., Calabrese, S., Giuffrida, G., Scaglione, S., Liotta, M., Brusca, L., D'Alessandro, W., Yalire, M., Arellano, S., Galle, B., Tedesco, D, 2015, Intercomparison of gas emissions from the lava lakes of Nyiragongo and Nyamulagira, DR Congo/ Plume composition and volatile flux from Nyamulagira volcano, (abstract) Geophysical Research Abstracts, 2015 European Geophysical Union Meeting, Vienna, Austria (URL: http://meetingorganizer.copernicus.org/EGU2015/EGU2015-6540.pdf; http://meetingorganizer.copernicus.org/EGU2015/EGU2015-13100-1.pdf)
Campion, R., 2014, New lava lake at Nyamuragira volcano revealed by combined ASTER and OMI SO2 measurements, 7 November 2014, Geophysical Research Letters (URL: http://onlinelibrary.wiley.com/doi/10.1002/2014GL061808/full)
Calabrese, S., Scaglione, S., Milazzo, S., D'Alessandro, W., Bobrowski, N., Giuffrida, G. B., and Yalire, M., 2014, Passive degassing at Nyiragongo (DR Congo) and Etna (Italy) volcanoes. Annals of Geophysics.
ESA Eduspace, date unknown, Nyiragongo and Nyamuragira, based on USGS, European Science Agency (URL: http://www.esa.int/SPECIALS/Eduspace_Disasters_EN/SEMDGLNSNNG_0.html) [accessed in May 2015]
Smets, B., 2015, Renewing activity at Nyamulagira volcano, 30 April 2015, Youtube (URL: https://www.youtube.com/watch?v=w1IHSjsgL48) [accessed in May 2015]
Smets, B., d'Oreye, N., Kervyn, F., 2014, Toward Another Lava Lake in the Virunga Volcanic Field?, 21 October 2014, EOS, Transactions American Geophysical Union (URL: http://onlinelibrary.wiley.com/doi/10.1002/2014EO420001/pdf)
Wooster, MJ, Zhukov, B, Oertel, D, 2003, Fire radiative energy for quantitative study of biomass burning: derivation from the BIRD experimental satellite and comparison to MODIS fire products. Remote Sensing Of Environment, 86(1), 83-107.
Wright, R., Flynn, L.P., Garbeil, H., Harris, A.J.L., Pilger, E., 2004. MODVOLC: near-real-time thermal monitoring of global volcanism. Journal of Volcanology and Geothermal Research 135, 29–49. doi:10.1016/j.jvolgeores.2003.12.008
Information Contacts: Benoît Smets, (a) Center for Geodynamics and Seismology, Walferdange, Luxembourg; (b) Vrije Universiteit Brussel, Department of Geography; Earth System Science, Brussels, Belgium; (c) Royal Museum for Central Africa, Department of Earth Sciences, Natural Hazards and Cartography Service, Tervuren, Belgium; Nicolas d’Oreye, European Center for Geodynamics, and Seismology, Walferdange, Luxembourg and National Museum of Natural History, Geophysics/Astrophysics Department, Walferdange, Luxembourg; Nicolas Theys, Belgian Institute for Space Aeronomy, Brussels, Belgium; and Julien Barriere, European Center for Geodynamics and Seismology, Walferdange, Luxembourg and National Museum of Natural History, Geophysics/Astrophysics Department, Walferdange, Luxembourg; Goma Volcanological Observatory (GVO, aka Observatoire Volcanologique de Goma), Mt. Goma, Goma, Democratic Republic of Congo; Jesse Allan and Robert Simmon, NASA Earth Observatory (URL: http://earthobservatory.nasa.gov); NASA MEASURES (URL: https://so2.gsfc.nasa.gov/); MODVOLC alerts team, Hawai’i Institute of Geophysics and Planetology (HIGP), University of Hawai’i at Manoa, 1680 East-West Road, Post 602, Honolulu, HI 96822, USA (URL: http://modis.higp.hawaii.edu/); and MIROVA, Universities of Turin and Florence, Italy, Centre for Volcanic Risk of the Italian Civil Protection Department (URL: http://www.mirovaweb.it/).
Large SO2 plumes and intermittent lava lake during 2013-2017
The Virunga Volcanic Province (VVP) in the Democratic Republic of the Congo (DRC) is part of the western branch of the East African Rift System (EARS). Nyamuragira (or Nyamulagira), a high-potassium basaltic shield volcano on the W edge of VVP, includes a lava field that covers over 1,100 km2 and contains more than 100 flank cones in addition to a large central crater (see figure 47, BGVN 40:01). A large lava lake that had been active for many years emptied from the central crater in 1938. Numerous flank eruptions have been observed since that time, the last during November 2011-March 2012 on the NE flank. This report covers the substantial SO2 emissions from both Nyamuragira and nearby Nyiragongo (15 km SE) between November 2011 and April 2016, and the onset of eruptive activity, including a new lava lake, at the summit crater beginning in May 2014. Activity is described through April 2017.
On-the-ground information about Nyamuragira is intermittent due to the unstable political climate in the region, but some information is available from the Observatoire Volcanologique de Goma (OVG), MONUSCO (the United Nations Organization working in the area), geoscientists who study Nyamuragira, and travelers who visit the site. The most consistent data comes from satellite – thermal data from the MODIS instrument processed by the MODVOLC and MIROVA systems, SO2 data from the AURA instrument on NASA's OMI satellite, and NASA Earth Observatory images from a variety of satellites.
A substantial flank eruption took place from November 2011 through March 2012. This was followed by a period of degassing with SO2-rich plumes, but no observed thermal activity, from April 2012 through April 2014. Increased seismicity and minor thermal activity was observed at the central crater during April 2014; lava fountains first seen in early July 2014 continued through September. A lava lake in the crater was confirmed on 6 November 2014, and it produced a consistent and strengthening thermal anomaly through the first week of April 2016, when it stopped abruptly. Thermal activity suggesting reappearance of the lava lake began again in early November 2016, and strengthened in both frequency and magnitude into early January 2017, continuing with a strong signal through April 2017.
Activity during November 2011-March 2012. Nyamuragira erupted from cones and fissures on the NE flank between early November 2011 and mid-March 2012 (BGVN 39:03). The vent area, 12 km ENE of the central crater, was an E-W fissure 500-1,000 m long. Lava fountains up to 300 m high produced flows that advanced nearly 12 km N in the first 10 days. Three scoria cones formed adjacent to the fissure during the eruption, and a small lava lake appeared in the center of the largest cone. During January 2012, lava flowed from the vent area and from numerous small breakouts within 2 km of the cones (figures 51 and 52). Dario Tedesco reported that the eruptions ceased in March 2012 after a series of explosion earthquakes recorded by the OVG had ended; the last MODVOLC thermal alert in the area of the eruption was captured on 14 March 2012, and none were reported again until 2014.
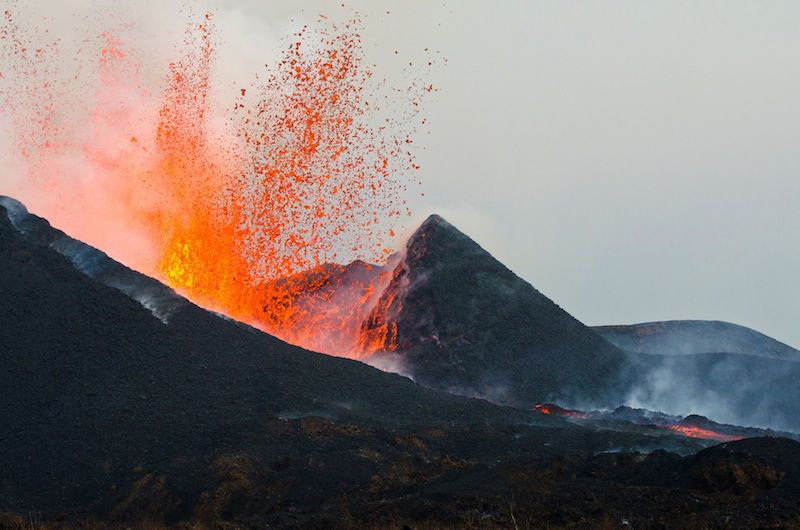 |
Figure 51. Lava fountain and active lava flow emerging from the breach of the erupting flank cone of Nyamuragira volcano on 8 January 2012. Courtesy of Volcano Discovery. |
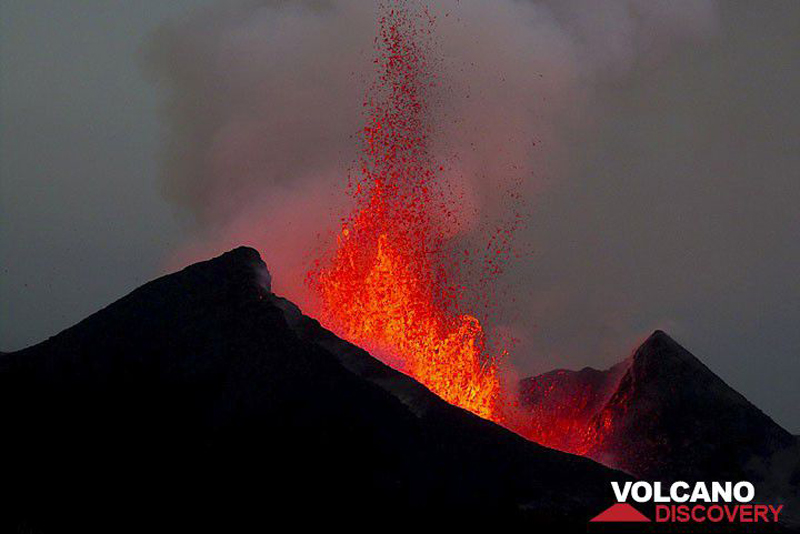 |
Figure 52. Lava fountains around 150 m high erupt on 8 January 2012 from the active flank vent during the 2011-2012 eruption of Nyamuragira. Photo by Lorraine Field, courtesy of Volcano Discovery. |
Activity during April 2012-May 2014. Periodic field surveys at Nyamuragira have been carried out since 2009 by helicopter, thanks to the support of the United Nations Organization Stabilization Mission in the DR Congo (MONUSCO). Since 2013, observations of the crater have also been done once or twice a month by helicopter. The team has included researchers from the OVG, Dario Tedesco, and other international scientists. This area is a high-risk sector due to the presence of armed groups, and it is impossible, due to the lack of security, to make detailed field surveys (Coppola et al., 2016).
Dario Tedesco reported SO2-rich fumaroles in Nyamuragira's central crater beginning in early March 2012, shortly before the NE-flank fissure eruptions ended (BGVN 40:01). A progressive collapse of the 400-m-wide, 50-80 m deep pit crater located in the NE part of the caldera began as soon as the eruptions ended. They noted that during the second half of April, large SO2 plumes continuously emerged from the pit crater.
NASA's Global Sulfur Dioxide Monitoring program captured major SO2 plumes from the area for an extended period between November 2011 and February 2014. The plumes represent combined emissions from both Nyamuragira and Nyiragongo, which are too close together to distinguish the source in the satellite data. Campion (2014), however, noted that SO2 emissions from the VVG increased several fold after the end of the 2011-2012 Nyamuragira eruption; they interpreted that 60-90 % of these emissions should be attributed to Nyamuragira.
Significant areas of SO2 plumes with DU > 2 (shown as red pixels on the Aura/OMI images, figure 53) were captured by the OMI instrument at the beginning of the November 2011 eruption and continued through February 2012. Beginning in April 2012 elevated values occurred more than 20 days per month through December 2012. Values were more variable in both frequency and magnitude during 2013 with a notable surge of activity during 6-19 June 2013 that resulted in daily SO2 plumes. Details of monthly SO2 values are given in the last section of this report (see table 3).
Activity during June 2014-April 2017. Incandescence at the summit and increased seismicity was reported again in April 2014, along with increasing SO2 values. A strong MODVOLC thermal alert signal appeared on 22 June 2014, and a satellite image from 30 June showed clear hotspots at both Nyamuragira and Nyiragongo (figure 54).
An extended series of MIROVA thermal anomaly data beginning in May 2014 clearly shows the episodic periods of active heat flow at Nyamuragira from late May 2014 through April 2017 (figure 55). During the first episode, from late May to early September 2014, lava fountains were observed in early July, and reported to be active through September (BGVN 40.01). Campion (2014) and Smets and others (2014) debated whether the lava lake first appeared in April or not until November. On 6 November 2014 a small lava lake was confirmed at the base of the summit pit when sighted during an OVG helicopter survey. Both MODVOLC and MIROVA thermal anomalies appeared again in early November and persisted through the end of the year.
Thermal anomalies were persistent throughout 2015, with a noted increase in both frequency and magnitude during July (figure 55 C). A NASA Earth Observatory image from 9 February 2015 clearly shows active plumes venting from both Nyamuragira and Nyiragongo (figure 56). MONUSCO-supported summit crater visits by researchers on 2 April 2015, and photographer Oliver Grunwald on 10 July 2015, confirmed the presence of an active lava lake during both visits (figure 57, and video link in Information Contacts).
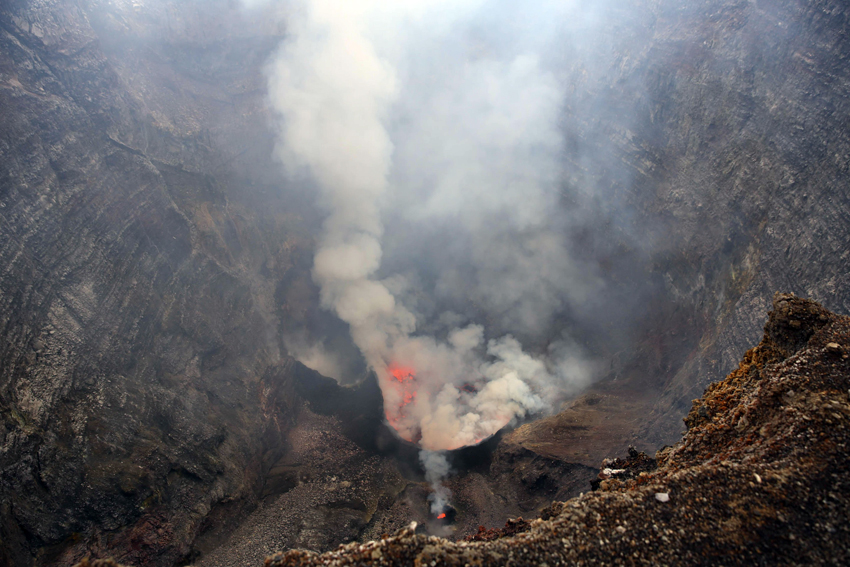 |
Figure 57. An active lava lake at Nyamuragira crater on 2 April 2015. Courtesy of MONUSCO/Abel Kavanagh. |
The MIROVA and MODVOLC thermal anomaly data suggest that the lava lake at Nyamuragira was active until 4 April 2016 when the signals abruptly ended (figure 55 D). This also corresponds closely in time to when the major SO2 emissions captured by NASA also ceased. Observations by Dario Tedesco at the summit on 6 April 2016, during a UNICEF and MONUSCO-sponsored helicopter overflight, showed only an incandescent vent releasing hot gases, and no active lava lake. A small lava lake was again visible in the pit crater on 27 April 2016 when observed by Sebastien Valade of the University of Florence on another MONUSCO-sponsored flight (figure 58).
Thermal anomaly data from MIROVA suggest a pulse of activity during late April through early June 2016 (figure 55 D). This was followed by a period from early June through early November 2016 with no record of activity at Nyamuragira. The MIROVA signal reappeared in early November, followed by intermittent MODVOLC thermal alerts beginning on 27 November. A new pulse of thermal activity, with values similar to those observed during July 2015-April 2016, reappeared in early January 2017 (figure 55 E) and continued through April 2017. On an OVG-sponsored visit to the summit crater on 11 March 2017, independent journalist Charly Kasereka photographed the summit crater with incandescent lava covering the crater floor (figure 59).
Sulfur dioxide and thermal anomaly data. Abundant sulfur dioxide emissions at Nyamuragira during November 2011-April 2017 show large variations in both magnitude and frequency during the period (table 3). A plot of the SO2 data (figure 60) reveals a sharp increase in both the number of days per month with DU greater than 2 and the actual maximum DU value during the active flank eruption between November 2011 and February 2012. After lower values during March 2012, they rise steadily and remain significantly elevated for all of 2013. Values drop briefly in early 2014 and then rise again during April 2014, remaining elevated through February 2016 before dropping off significantly.
A similar plot of the number of monthly MODVOLC thermal alert pixels for Nyamuragira from November 2011 through April 2017 (figure 61) shows that there were no thermal alerts for the period from April 2012-February 2014 when SO2 emissions were large and frequent. In contrast, there were frequent thermal alerts from June 2014-April 2016 when SO2 emissions were also high.
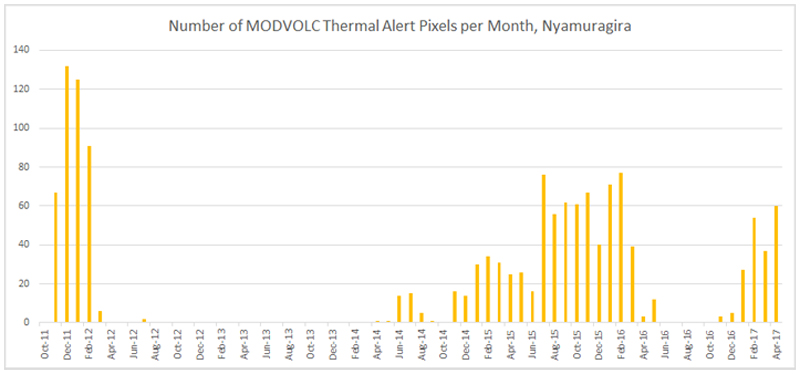 |
Figure 61. Number of MODVOLC thermal alert pixels per month at Nyamuragira from October 2011 through April 2017. Data courtesy of MODVOLC. |
Table 3. Days per month that SO2 values over the Nyamuragira and Nyiragongo area exceeded 2 Dobson Units (DU), October 2011-April 2017, and maximum DU values for each month. Data represent minimum values due to OMI row anomaly missing data (gray stripes), and missing days. SO2 is measured over the entire earth using NASA's Ozone Monitoring Instrument (OMI) on the AURA spacecraft. The gas is measured in Dobson Units (DU), the number of molecules in a square centimeter of the atmosphere. If you were to compress all of the sulfur dioxide in a column of the atmosphere into a flat layer at standard temperature and pressure (0 C and 1013.25 hPa), one Dobson Unit would be 0.01 millimeters thick and would contain 0.0285 grams of SO2 per square meter.
| MONTH | No. days DU > 2 | MAX DU (>2) | Date of Max DU | Comments |
| Oct 2011 | 0 | -- | -- | -- |
| Nov 2011 | 23 | 80.23 | 9 | -- |
| Dec 2011 | 27 | 26.70 | 30 | -- |
| Jan 2012 | 16 | 7.71 | 8 | Only 21 days of data |
| Feb 2012 | 10 | 5.32 | 18 | -- |
| Mar 2012 | 2 | 2.22 | 31 | -- |
| April 2012 | 9 | 5.31 | 27 | Daily >2 values begin ~ 20 April |
| May 2012 | 20 | 27.06 | 8 | Surge, 5-10 May |
| Jun 2012 | 24 | 67.10 | 7 | Large plumes all month |
| Jul 2012 | 25 | 15.91 | 9 | -- |
| Aug 2012 | 17 | 14.27 | 28 | -- |
| Sep 2012 | 24 | 12.78 | 11 | Several days DU>10 |
| Oct 2012 | 24 | 16.86 | 31 | Constant large plumes |
| Nov 2012 | 27 | 21.09 | 1 | Many high DU values |
| Dec 2012 | 26 | 16.69 | 16 | -- |
| Jan 2013 | 11 | 6.80 | 10 | -- |
| Feb 2013 | 7 | 14.34 | 2 | -- |
| Mar 2013 | 14 | 6.15 | 22 | -- |
| Apr 2013 | 15 | 8.93 | 16 | -- |
| May 2013 | 16 | 11.45 | 25 | -- |
| Jun 2013 | 22 | 29.68 | 10 | Big surge 6-14 |
| Jul 2013 | 18 | 11.82 | 12 | -- |
| Aug 2013 | 14 | 6.11 | 29 | -- |
| Sep 2013 | 20 | 9.46 | 25 | -- |
| Oct 2013 | 16 | 4.45 | 28 | -- |
| Nov 2013 | 12 | 6.76 | 10 | -- |
| Dec 2013 | 18 | 17.79 | 14 | -- |
| Jan 2014 | 3 | 4.13 | 27 | -- |
| Feb 2014 | 2 | 5.18 | 10 | -- |
| Mar 2014 | 3 | 4.86 | 11 | -- |
| Apr 2014 | 10 | 6.49 | 10 | -- |
| May 2014 | 0 | -- | -- | -- |
| Jun 2014 | 14 | 18.24 | 29 | Surge begins 24 June |
| Jul 2014 | 23 | 27.40 | 24 | Large plumes most of the month |
| Aug 2014 | 23 | 23.65 | 25 | -- |
| Sep 2014 | 12 | 158.92 | 10 | Big surge begins late Aug – 13 Sep, then stops abruptly. Largest plumes of interval |
| Oct 2014 | 0 | -- | -- | -- |
| Nov 2014 | 11 | 17.86 | 29 | 6-11, 23, 27-30 |
| Dec 2014 | 26 | 22.82 | 22 | 1-27 |
| Jan 2015 | 8 | 6.96 | 18 | -- |
| Feb 2015 | 15 | 23.73 | 19 | -- |
| Mar 2015 | 19 | 8.56 | 28 | -- |
| Apr 2015 | 23 | 17.80 | 29 | -- |
| May 2015 | 25 | 10.78 | 10 | -- |
| un 2015 | 25 | 17.74 | 25 | -- |
| Jul 2015 | 18 | 11.95 | 18 | -- |
| Aug 2015 | 17 | 9.32 | 19 | -- |
| Sep 2015 | 18 | 9.51 | 4 | -- |
| Oct 2015 | 18 | 9.61 | 31 | -- |
| Nov 2015 | 17 | 7.06 | 16 | -- |
| Dec 2015 | 14 | 8.42 | 13 | -- |
| Jan 2016 | 6 | 5.40 | 19 | -- |
| Feb 2016 | 6 | 3.34 | 11 | -- |
| Mar 2016 | 1 | 4.15 | 9 | -- |
| Apr 2016 | 0 | -- | -- | -- |
| May 2016 | 2 | 3.06 | 19 | -- |
| Jun 2016 | 0 | -- | -- | Only 18 days data |
| Jul 2016 | 0 | -- | -- | -- |
| Aug 2016 | 0 | -- | -- | -- |
| Sep 2016 | 0 | -- | -- | -- |
| Oct 2016 | 0 | -- | -- | -- |
| Nov 2016 | 2 | 3.50 | 27 | -- |
| Dec 2016 | 0 | -- | -- | -- |
| Jan 2017 | 0 | -- | -- | -- |
| Feb 2017 | No Data | No Data | -- | -- |
| Mar 2017 | 0 | 1.5 | -- | -- |
| Apr 2017 | 0 | 1.5 | -- | -- |
References: Campion, R., 2014, New lava lake at Nyamuragira volcano revealed by combined ASTER and OMI SO2 measurements, 7 November 2014, Geophysical Research Letters (URL: http://onlinelibrary.wiley.com/doi/10.1002/2014GL061808/full).
Coppola, D., Campion, R., Laiolo, M., Cuoco, E., Balagizi, C., Ripepe, M., Cigolini, C., Tedesco, D., 2016, Birth of a lava lake:Nyamulagira volcano 2011-2015. Bull Volcanol (2016) 78: 20. doi:10.1007/s00445-016-1014-7.
Smets, B., d'Oreye, N., Kervyn, F., 2014, Toward Another Lava Lake in the Virunga Volcanic Field?, 21 October 2014, EOS, Transactions American Geophysical Union (URL: http://onlinelibrary.wiley.com/doi/10.1002/2014EO420001/pdf).
Smets, B., d'Oreye, N., Kervyn, F., Kervyn, M., Albino, F., Arellano, S., Bagalwa, M., Balagizi, C., Carn, S.A., Darrah, T.H., Fernández, J., Galle, B., González, P.J., Head, E., Karume, K., Kavotha, D., Lukaya, F., Mashagiro, N., Mavonga, G., Norman, P., Osodundu, E., Pallero, J.L.G., Prieto, J.F., Samsonov, S., Syauswa, M., Tedesco, D., Tiampo, K., Wauthier, C., Yalire, M.M., 2014. Detailed multidisciplinary monitoring reveals pre- and co-eruptive signals at Nyamulagira volcano (North Kivu, Democratic Republic of Congo). Bull Volcanol 76 (787): 35 pp.
Smets, B., Kervyn, M., Kervyn, F., d'Oreye, N., 2015. Spatio-temporal dynamics of eruptions in a youthful extensional setting: Insights from Nyamulagira volcano (D.R. Congo), in the western branch of the East African Rift. Earth-Science Review 150, 305-328. doi:10.1016/j.earscirev.2015.08.008
Information Contacts: Observatoire Volcanologique de Goma (OVG), Departement de Geophysique, Centre de Recherche en Sciences Naturelles, Lwiro, D.S. Bukavu, DR Congo; NASA Goddard Space Flight Center (NASA/GSFC), Global Sulfur Dioxide Monitoring Page, Atmospheric Chemistry and Dynamics Laboratory, 8800 Greenbelt Road, Goddard, Maryland, USA (URL: https://so2.gsfc.nasa.gov/); NASA Earth Observatory, EOS Project Science Office, NASA Goddard Space Flight Center, Goddard, Maryland, USA (URL: http://earthobservatory.nasa.gov/); Hawai'i Institute of Geophysics and Planetology (HIGP), MODVOLC Thermal Alerts System, School of Ocean and Earth Science and Technology (SOEST), Univ. of Hawai'i, 2525 Correa Road, Honolulu, HI 96822, USA (URL: http://modis.higp.hawaii.edu/); MIROVA (Middle InfraRed Observation of Volcanic Activity), a collaborative project between the Universities of Turin and Florence (Italy) supported by the Centre for Volcanic Risk of the Italian Civil Protection Department (URL: http://www.mirovaweb.it/); Tom Pfeiffer, Volcano Discovery (URL: http://www.volcanodiscovery.com/); Erik Klemetti, Eruptions Blog, Wired (URL: https://www.wired.com/author/erikvolc/); Cultur Volcan, Journal d'un volcanophile (URL: https://laculturevolcan.blogspot.com/); MONUSCO, United Nations Organization Stabilization Mission in the DR Congo (URL: https://monusco.unmissions.org/en/); Oliver Grunewald, Video filmed on 10 July 2015 (URL: https://laculturevolcan.blogspot.fr/2015/07/le-lac-de-lave-du-volcan-nyamuragira.html).
Thermal activity decreases and ends in May 2017
The Virunga Volcanic Province (VVP) in the Democratic Republic of the Congo is part of the western branch of the East African Rift System. Nyamuragira (or Nyamulagira), a high-potassium basaltic shield volcano on the W edge of VVP, includes a lava field that covers over 1,100 km2 and contains more than 100 flank cones in addition to a large central crater (see figure 47, BGVN 40:01). A large lava lake that had been active for many years emptied from the central crater in 1938. Numerous flank eruptions have been observed since that time, the most recent during November 2011-March 2012 on the NE flank. This was followed by a period of degassing with SO2-rich plumes, but no observed thermal activity, from April 2012 through April 2014. Lava fountains at the central crater in July 2014 signaled the return of a lava lake, which was confirmed in November 2014. The lake lasted through April 2016 when its thermal signal abruptly disappeared (see figure 55, BGVN 42:06).
Thermal activity suggesting reappearance of the lava lake began again in early November 2016, and strengthened in both frequency and magnitude into early January 2017, continuing with a strong signal through April 2017 before tapering off during May 2017. No further activity was reported through November 2017. Ground-based observations are scarce due to the unstable political climate, but occasional information is available from the Observatoire Volcanologique de Goma (OVG), MONUSCO (the United Nations Organization working in the area), geoscientists who study Nyamuragira, and travelers who visit the site. The most consistent data comes from satellite: thermal data from the MODIS instrument processed by the MODVOLC and MIROVA systems, SO2 data from the AURA instrument on NASA's OMI satellite, and NASA Earth Observatory images from a variety of satellites.
Thermal MODIS data indicated that a renewed period of activity began in late November 2016 after a period of quiescence since mid-May 2016. The first MODVOLC alert pixels appeared on 27 November. They were intermittent during December, but increased significantly during January-April 2017, with 30-50 alert pixels each month. They stopped abruptly on 2 May 2017. The MIROVA thermal anomaly graph shows a similar pattern of increasing thermal values from January through April 2017, with both the frequency and intensity tapering off during May 2017 (figure 62). No thermal anomalies were reported within 5 km of the summit from June through November 2017.
During the period from December 2016 to April 2017 thermal anomalies were relatively high, but there were no reported SO2 anomalies from the OMI satellite instrument. This is in contrast with the period from April 2014-April 2016 when both SO2 values and thermal anomaly values were high. Very little ground-based data is available to confirm the eruptive activity of 2017. A photograph from an Instagram user of an image reported as Nyamuragira on 26 January 2017 shows the lava lake at the bottom of the summit crater (figure 63). Bubbling lava from the crater was photographed by Charley Kasereka on 11 March 2017 (see figure 59, BGVN 42:06). An image captured in May 2017 shows steam at the summit crater and lava flows around the caldera, with Nyiragongo in the background (figure 64). A photograph posted 16 September 2017 shows volcanologist Dario Tedesco on the crater rim surrounded by plumes of steam (figure 65).
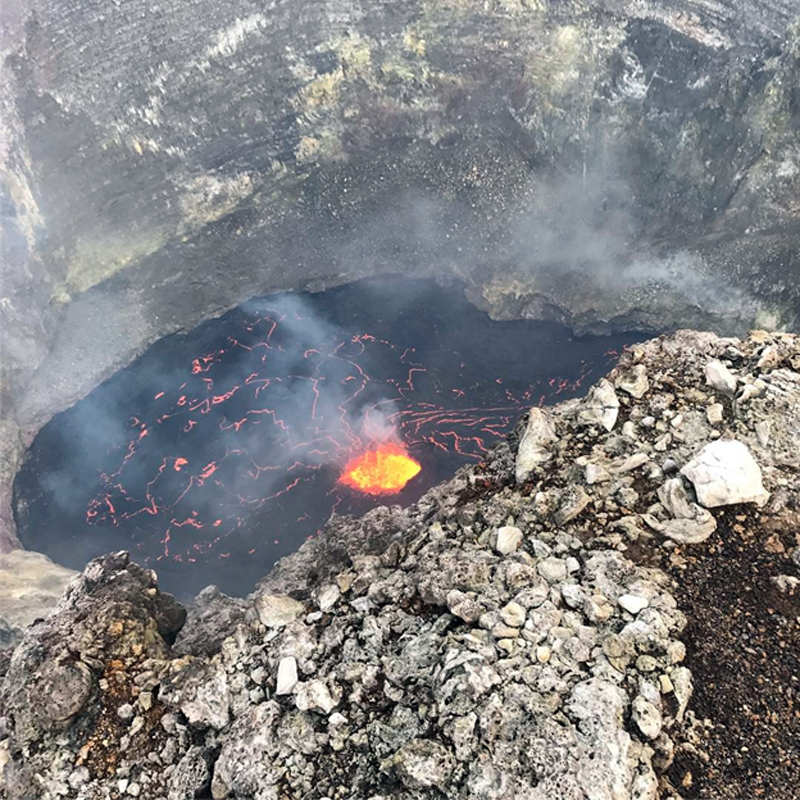 |
Figure 63. Photo of the active lava lake in the summit crater of Nyamuragira on 26 January 2017. Courtesy of Tim Best Direct (posted on Instagram). |
Information Contacts: MIROVA (Middle InfraRed Observation of Volcanic Activity), a collaborative project between the Universities of Turin and Florence (Italy) supported by the Centre for Volcanic Risk of the Italian Civil Protection Department (URL: http://www.mirovaweb.it/); Hawai'i Institute of Geophysics and Planetology (HIGP), MODVOLC Thermal Alerts System, School of Ocean and Earth Science and Technology (SOEST), Univ. of Hawai'i, 2525 Correa Road, Honolulu, HI 96822, USA (URL: http://modis.higp.hawaii.edu/); Observatoire Volcanologique de Goma (OVG), Goma, North Kivu, DR Congo (URL: https://www.facebook.com/Observatoire-Volcanologique-de-Goma-OVG-180016145663568/); Virunga Volcanoes, managed by a Belgian-Luxembourgian (BeLux) scientific consortium mainly coordinated by the Royal Museum for Central Africa, the European Center for Geodynamics and Seismology and the National Museum of Natural History of Luxembourg (URL: http://www.virunga-volcanoes.org/); Vincent Tremeau, Instagram user vtremeau (URL: https://www.instagram.com/p/BZMGqX5Bhwl/); Charly Kasereka, Instagram user charlykasereka (URL: https://www.instagram.com/charlykasereka/); Tropic Air Kenya, Instagram user tropicairkenya (URL: https://www.instagram.com/p/BUXbNzjlh4Q/); Tim Best Direct, Instagram user timbestdirect (URL: https://www.instagram.com/p/BPvUgL9BfaX/).
Lava lake reappears in central crater in April 2018; activity tapers off during April 2019
The Virunga Volcanic Province (VVP) in the Democratic Republic of the Congo is part of the western branch of the East African Rift System. Nyamuragira (or Nyamulagira), a high-potassium basaltic shield volcano on the W edge of VVP, includes a lava field that covers over 1,100 km2 and contains more than 100 flank cones in addition to a large central crater (see figure 56, BGVN 42:06). A lava lake that had been active for many years emptied from the central crater in 1938. Numerous flank eruptions were observed after that time, the most recent during November 2011-March 2012 on the NE flank. This was followed by a period of degassing with unusually SO2-rich plumes from April 2012 through April 2014 (BGVN 42:06). The lava lake reappeared during July 2014-April 2016 and November 2016-May 2017, producing a strong thermal signature. After a year of quiet, a new lava lake appeared in April 2018, reported below (through May 2019) with information provided by the Observatoire Volcanologique de Goma (OVG), MONUSCO (the United Nations Organization working in the area), and satellite data and imagery from multiple sources.
Fresh lava reappeared inside the summit crater in mid-April 2018 from a lava lake and adjacent spatter cone. Satellite imagery and very limited ground-based observations suggested that intermittent pulses of activity from both sources produced significant lava flows within the summit crater through April 2019 when the strength of the thermal signal declined significantly. Images from May 2019 showed a smaller but persistent thermal anomaly within the crater.
Activity from October 2017-May 2019. Indications of thermal activity tapered off in May 2017 (BGVN 42:11). On 20 October 2017 OVG released a communication stating that a brief episode of unspecified activity occurred on 17 and 18 October, but the volcano returned to lower activity levels on 20 October. There was no evidence of thermal activity during the month. The volcano remained quiet with no reports of thermal activity until April 2018 (figure 66).
OVG reported the new lava emissions beginning on 14 April 2018 as appearing from both the lava lake and a small adjacent spatter cone (figure 67). The first satellite image showing thermal activity at the summit appeared on 18 April 2018 (figure 68) and coincided with the abrupt beginning of strong MIROVA thermal signals (figure 69). MODVOLC thermal alerts also first appeared on 18 April 2018. An image of the active crater taken on 9 May 2018 showed the lake filled with fresh lava and two adjacent incandescent spatter cones (figure 70).
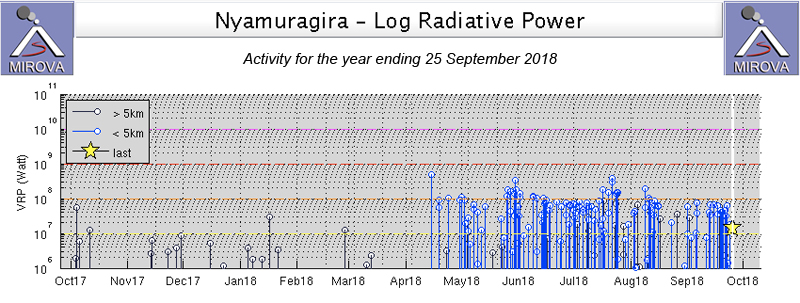 |
Figure 69. A strong thermal signal appeared in the MIROVA graph of Log Radiative Power on 18 April 2018 for Nyamuragira, indicating a return of the lava lake at the summit crater. Courtesy of MIROVA. |
Satellite images confirmed that ongoing activity from the lava lake remained strong during June -September 2018 (figure 71). A mission to Nyamuragira was carried out by helicopter provided by MONUSCO on 20 July 2018; lava lake activity was observed along with gas emissions from the small spatter cone (figure 72). OVG reported increased volcanic seismicity during 1-3 and 10-17 September 2018, and also during October, located in the crater area, mostly at depths of 0-5 km.
Personnel from OVG and MONUSCO (United Nations Organization Stabilization Mission in DR Congo) made site visits on 11 October and 2 November 2018 and concluded that the level of the active lava lake had increased during that time (figure 73). On 2 November OVG measured the height from the base of the active cone to the W rim of the crater as 58 m (figure 74).
Seismicity remained high during November 2018 but decreased significantly during December. Instrument and access issues in January 2019 prevented accurate assessment of seismicity for the month. The lava lake remained active with periodic surges of thermal activity during November 2018-March 2019 (figure 75). Multiple images show incandescence in multiple places within the crater, suggesting significant fresh overflowing lava.
On 12 April 2019 a Ukrainian Aviation Unit supported by MONUSCO provided support for scientists visiting the crater for observations and seismic analysis. Satellite data confirmed ongoing thermal activity into May, although the strength of the signal appeared to decrease (figure 76). MODVOLC thermal alerts ceased after 8 April, and the MIROVA thermal data also confirmed a decrease in the strength of the thermal signal during April 2019 (figure 77).
Information Contacts: Observatoire Volcanologique de Goma (OVG), Departement de Geophysique, Centre de Recherche en Sciences Naturelles, Lwiro, D.S. Bukavu, DR Congo; Katcho Karume, Director; Sentinel Hub Playground (URL: https://www.sentinel-hub.com/explore/sentinel-playground); MIROVA (Middle InfraRed Observation of Volcanic Activity), a collaborative project between the Universities of Turin and Florence (Italy) supported by the Centre for Volcanic Risk of the Italian Civil Protection Department (URL: http://www.mirovaweb.it/); Hawai'i Institute of Geophysics and Planetology (HIGP) - MODVOLC Thermal Alerts System, School of Ocean and Earth Science and Technology (SOEST), Univ. of Hawai'i, 2525 Correa Road, Honolulu, HI 96822, USA (URL: http://modis.higp.hawaii.edu/); MONUSCO, United Nations Organization Stabilization Mission in the DR Congo (URL: https://monusco.unmissions.org/en/, Twitter: @MONUSCO); Cultur Volcan, Journal d'un volcanophile (URL: https://laculturevolcan.blogspot.com), Twitter: @CultureVolcan).
Strong thermal anomalies and fumaroles within the summit crater during June-November 2019
Nyamuragira (also known as Nyamulagira) is a high-potassium basaltic shield volcano located in the Virunga Volcanic Province (VVP) in the Democratic Republic of the Congo. Previous volcanism consisted of the reappearance of a lava lake in the summit crater in mid-April 2018, lava emissions, and high seismicity (BGVN 44:05). Current activity includes strong thermal signatures, continued inner crater wall collapses, and continued moderate seismicity. The primary source of information for this June-November 2019 report comes from the Observatoire Volcanologique de Goma (OVG) and satellite data and imagery from multiple sources.
OVG reported in the July 2019 monthly that the inner crater wall collapses that were observed in May continued to occur. During this month, there was a sharp decrease in the lava lake level, and it is no longer visible. However, the report stated that lava fountaining was visible from a small cone within this crater, though its activity has also decreased since 2014. In late July, a thermal anomaly and fumaroles were observed originating from this cone (figure 78). Seismicity remained moderate throughout this reporting period.
MIROVA (Middle InfraRed Observation of Volcanic Activity) analysis of MODIS satellite data shows strong, frequent thermal anomalies within 5 km of the summit between June through November (figure 79). The strength of these thermal anomalies noticeably decreases briefly in September. MODVOLC thermal alerts registered 54 thermal hotspots dominantly near the N area of the crater during June through November 2019. Satellite imagery from Sentinel-2 corroborated this data, showing strong thermal anomalies within the summit crater during this same timeframe (figure 80).
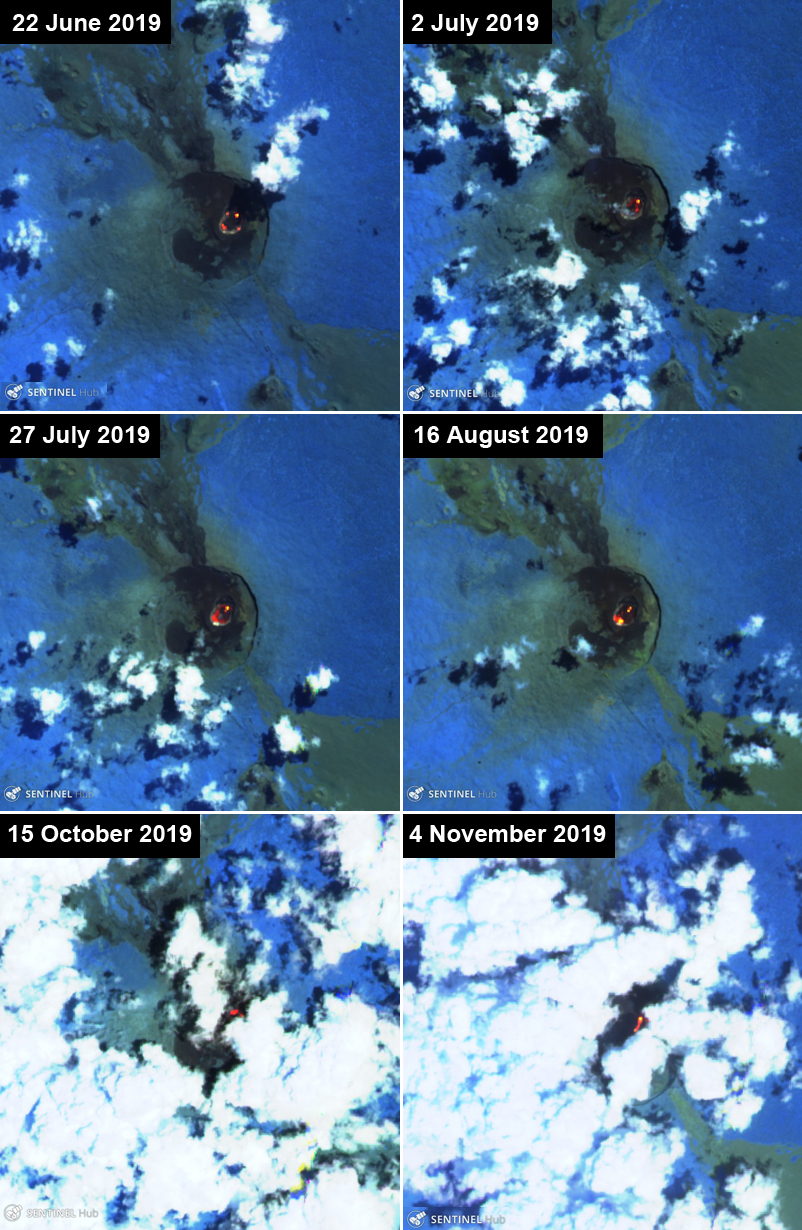 |
Figure 80. Sentinel-2 thermal satellite imagery (bands 12, 11, 8A) confirmed ongoing thermal activity at Nyamuragira into November 2019. Courtesy of Sentinel Hub Playground. |
Information Contacts: Observatoire Volcanologique de Goma (OVG), Departement de Geophysique, Centre de Recherche en Sciences Naturelles, Lwiro, D.S. Bukavu, DR Congo; Sentinel Hub Playground (URL: https://www.sentinel-hub.com/explore/sentinel-playground); MIROVA (Middle InfraRed Observation of Volcanic Activity), a collaborative project between the Universities of Turin and Florence (Italy) supported by the Centre for Volcanic Risk of the Italian Civil Protection Department (URL: http://www.mirovaweb.it/); Sergio Maguna (Facebook: https://www.facebook.com/sergio.maguna.9, images posted at https://www.facebook.com/sergio.maguna.9/posts/1267625096730837).
Intermittent thermal anomalies within the summit crater during December 2019-May 2020
Nyamuragira (also known as Nyamulagira) is located in the Virunga Volcanic Province (VVP) in the Democratic Republic of the Congo and consists of a lava lake that reappeared in the summit crater in mid-April 2018. Volcanism has been characterized by lava emissions, thermal anomalies, seismicity, and gas-and-steam emissions. This report summarizes activity during December 2019 through May 2020 using information from monthly reports by the Observatoire Volcanologique de Goma (OVG) and satellite data.
According to OVG, intermittent eruptive activity was detected in the lava lake of the central crater during December 2019 and January-April 2020, which also resulted in few seismic events. MIROVA (Middle InfraRed Observation of Volcanic Activity) analysis of MODIS satellite data shows thermal anomalies within the summit crater that varied in both frequency and power between August 2019 and mid-March 2020, but very few were recorded afterward through late May (figure 81). Thermal hotspots identified by MODVOLC from 15 December 2019 through March 2020 were mainly located in the active central crater, with only three hotspots just outside the SW crater rim (figure 82). Sentinel-2 thermal satellite imagery also showed activity within the summit crater during January-May 2020, but by mid-March the thermal anomaly had visibly decreased in power (figure 83).
Information Contacts: Information contacts: Observatoire Volcanologique de Goma (OVG), Departement de Geophysique, Centre de Recherche en Sciences Naturelles, Lwiro, D.S. Bukavu, DR Congo; MIROVA (Middle InfraRed Observation of Volcanic Activity), a collaborative project between the Universities of Turin and Florence (Italy) supported by the Centre for Volcanic Risk of the Italian Civil Protection Department (URL: http://www.mirovaweb.it/); Hawai'i Institute of Geophysics and Planetology (HIGP) - MODVOLC Thermal Alerts System, School of Ocean and Earth Science and Technology (SOEST), Univ. of Hawai'i, 2525 Correa Road, Honolulu, HI 96822, USA (URL: http://modis.higp.hawaii.edu/); Sentinel Hub Playground (URL: https://www.sentinel-hub.com/exp.
Numerous thermal anomalies and gas emissions from the lava lake through November 2020
Nyamuragira (also known as Nyamulagira) is a shield volcano in the Democratic Republic of the Congo with a 2 x 2.3 km caldera at the summit. A summit crater lies in the NE part of the caldera. In the recent past, the volcano has been characterized by intra-caldera lava flows, lava emissions from its lava lake, thermal anomalies, gas-and-steam emissions, and moderate seismicity (BGVN 44:12, 45:06). This report reviews activity during June-November 2020, based on satellite data.
MIROVA (Middle InfraRed Observation of Volcanic Activity) analysis of MODIS satellite data showed numerous thermal anomalies associated with the volcano during June-November 2020, although some decrease was noted during the last half of August and between mid-October to mid-November (figure 84). Between six and seven thermal hotspots per month were identified by MODVOLC during June-November 2020, with as many as 4 pixels on 11 August. In the MODVOLC system, two main hotspot groupings are visible, the largest being at the summit crater, on the E side of the caldera.
Sentinel-2 satellite images showed several hotspots in the summit crater throughout the reporting period (figure 85). By 26 July and thereafter, hotspots were also visible in the SW portion of the caldera, and perhaps just outside the SW caldera rim. Gas-and-steam emissions from the lava lake were also visible throughout the period.
Information Contacts: Observatoire Volcanologique de Goma (OVG), Departement de Geophysique, Centre de Recherche en Sciences Naturelles, Lwiro, D.S. Bukavu, DR Congo; MIROVA (Middle InfraRed Observation of Volcanic Activity), a collaborative project between the Universities of Turin and Florence (Italy) supported by the Centre for Volcanic Risk of the Italian Civil Protection Department (URL: http://www.mirovaweb.it/); Hawai'i Institute of Geophysics and Planetology (HIGP) - MODVOLC Thermal Alerts System, School of Ocean and Earth Science and Technology (SOEST), Univ. of Hawai'i, 2525 Correa Road, Honolulu, HI 96822, USA (URL: http://modis.higp.hawaii.edu/); Sentinel Hub Playground (URL: https://www.sentinel-hub.com/exp).
Frequent thermal anomalies within the summit crater during December 2020-May 2021
Nyamulagira (also known as Nyamuragira) is located in the Virunga Volcanic Province (VVP) in the Democratic Republic of the Congo and contains a 2 x 2.3 km caldera at its summit. Its current eruption period began in April 2018 and has recently been characterized by numerous thermal anomalies and gas emissions from an active lava lake (BGVN 45:12). This report covers activity during December 2020 through May 2021 using information from monthly reports by the Observatoire Volcanologique de Goma (OVG) and satellite data.
On 29 September and 1 October 2020, a team of scientists from OVG doing fieldwork at the volcano noted that effusive activity between March and September 2020 had filled the crater with lava (figure 86) and overflowed a fracture which had opened to the E. Some pahoehoe lava flows were also observed in the summit crater (figure 86) along with gas-and-steam emissions.
MIROVA (Middle InfraRed Observation of Volcanic Activity) analysis of MODIS satellite data showed frequent thermal anomalies of variable intensities during December 2020 through May 2021 (figure 87). A pulse of strong thermal activity was detected during late December through mid-January, following a brief break in activity. A total of 31 thermal hotspots identified by MODVOLC were located in the active summit crater on 12 different days: 10, 28, 29, and 31 December 2020; 4, 7, 9, and 22 January; 28 February; 22 April; and 3 and 31 May 2021. The strong thermal activity in late December is also reflected in the MODVOLC algorithm on 28 December with a high hotspot count of twelve. On clear weather days, Sentinel-2 thermal satellite imagery also showed thermal anomalies within the summit crater originating from the NE and SW areas, with an intense anomaly in the SW portion on 22 January (figure 88). In February, both anomalies had decreased in power and on 27 April a thin band of thermal anomalies lined the perimeter of the crater.
Information Contacts: Observatoire Volcanologique de Goma (OVG), Departement de Geophysique, Centre de Recherche en Sciences Naturelles, Lwiro, D.S. Bukavu, DR Congo; MIROVA (Middle InfraRed Observation of Volcanic Activity), a collaborative project between the Universities of Turin and Florence (Italy) supported by the Centre for Volcanic Risk of the Italian Civil Protection Department (URL: http://www.mirovaweb.it/); Hawai'i Institute of Geophysics and Planetology (HIGP) - MODVOLC Thermal Alerts System, School of Ocean and Earth Science and Technology (SOEST), Univ. of Hawai'i, 2525 Correa Road, Honolulu, HI 96822, USA (URL: http://modis.higp.hawaii.edu/); Sentinel Hub Playground (URL: https://www.sentinel-hub.com/explore/sentinel-playground).
Frequent thermal anomalies from the lava lake during June-November 2021
Nyamulagira, also known as Nyamuragira, is a large shield volcano in the Democratic Republic of the Congo near the borders of Uganda and Rwanda. A summit crater in the NE part of the volcano’s caldera has hosted a lava lake, sometimes intermittent, but continuous since April 2018, with associated thermal anomalies and gas emissions (BGVN 44:05, 45:06, 46:06). This report covers activity during June-November 2021, using satellite data.
Satellite-based MODIS instruments detected numerous thermal anomalies during June-November 2021, as shown in both the MODVOLC and MIROVA systems. Sentinel-2 infrared imagery also detected an almost continuous thermal signal from the lava lake in the summit crater. Thermal activity appeared generally to diminish over time during this period. Numerous thermal anomalies were recorded by MIROVA during June-November 2021, but far fewer between mid-July and mid-August and during mid-October (figure 89). MODVOLC thermal alert counts were consistent with this pattern.
Sentinel-2 infrared imagery showed an extensive thermal anomaly within the summit crater during the reporting period as the result of its lava lake, except during a three-week period after 5 August when the thermal signal completely disappeared. By 25 August the strong thermal anomaly was again visible (figure 90). A faint gas emission could sometimes be seen on the S portion of the crater, but on most days during this period weather clouds obscured visibility.
Information Contacts: MIROVA (Middle InfraRed Observation of Volcanic Activity), a collaborative project between the Universities of Turin and Florence (Italy) supported by the Centre for Volcanic Risk of the Italian Civil Protection Department (URL: http://www.mirovaweb.it/); Hawai'i Institute of Geophysics and Planetology (HIGP) - MODVOLC Thermal Alerts System, School of Ocean and Earth Science and Technology (SOEST), Univ. of Hawai'i, 2525 Correa Road, Honolulu, HI 96822, USA (URL: http://modis.higp.hawaii.edu/); Sentinel Hub Playground (URL: https://www.sentinel-hub.com/explore/sentinel-playground).
Summit caldera lava flows and thermal anomalies continue during December 2021-August 2022
Nyamulagira (also known as Nyamuragira) is a shield volcano in the Democratic Republic of the Congo that hosts a lava lake in the summit crater. Recent activity has been characterized by lava effusion, thermal anomalies, seismicity, and gas-and-steam emissions (BGVN 45:12). The current report summarizes activity during December 2021-August 2022 and is based on satellite data.
The MODIS thermal sensors aboard the Aqua and Terra satellites processed using the MODVOLC algorithm (MODIS-MODVOLC) detected numerous hotspots at the volcano, consistent with the persistent lava lake in the summit crater. Days with hotspots increased during the reporting period, with 1-4 days per month during December 2021 through February, 7-8 days during March and April, and 10-12 days during May-August. Every month from May-August had at least one day with 4 pixels. The MIROVA (Middle InfraRed Observation of Volcanic Activity) system also detected numerous hotspots, with the frequency noticeably increasing starting in January 2022 (figure 91).
Throughout the reporting period, hotspots were observed in every Sentinel-2 infrared image during the infrequent days when cloud conditions allowed an observation. Images showed that activity generally intensified over the reporting period, especially beginning in late April when effusive activity and surface lava was detected outside the NE pit crater. Infrared satellite imagery showed multiple areas of lava effusion and flows throughout the S and W parts of the caldera that changed with every available image (figure 92). This increased activity continued through the reporting period.
Information Contacts: MIROVA (Middle InfraRed Observation of Volcanic Activity), a collaborative project between the Universities of Turin and Florence (Italy) supported by the Centre for Volcanic Risk of the Italian Civil Protection Department (URL: http://www.mirovaweb.it/); Hawai'i Institute of Geophysics and Planetology (HIGP) - MODVOLC Thermal Alerts System, School of Ocean and Earth Science and Technology (SOEST), Univ. of Hawai'i, 2525 Correa Road, Honolulu, HI 96822, USA (URL: http://modis.higp.hawaii.edu/); Sentinel Hub Playground (URL: https://www.sentinel-hub.com/explore/sentinel-playground).
Summit crater lava flows and thermal anomalies continue, September 2022-April 2023
Nyamulagira is a shield volcano in the Democratic Republic of the Congo that hosts a lava lake in the large summit crater and contains numerous flank fissures and cinder cones. Recent activity has been characterized by lava effusion, thermal anomalies, seismicity, and gas-and-steam emissions (BGVN 45:12). The current report covers ongoing activity during September 2022-April 2023 based on satellite data.
Although there were some short periods without thermal anomalies detected, active lava flows and a lava lake in the summit crater were persistent on an almost daily basis through April 2023. The MIROVA (Middle InfraRed Observation of Volcanic Activity) system recorded numerous hotspots every month (figure 93) with intensities mostly in the moderate to high range, and a few in the very high range. Throughout the reporting period, hotspots were visible in every Sentinel-2 infrared image during the infrequent days when cloud conditions allowed observations (figure 94). Imagery during September-December 2022 showed multiple areas of lava effusion and flows within the caldera. Activity waned during January and February, with images showing a single clearly visible hotspot.
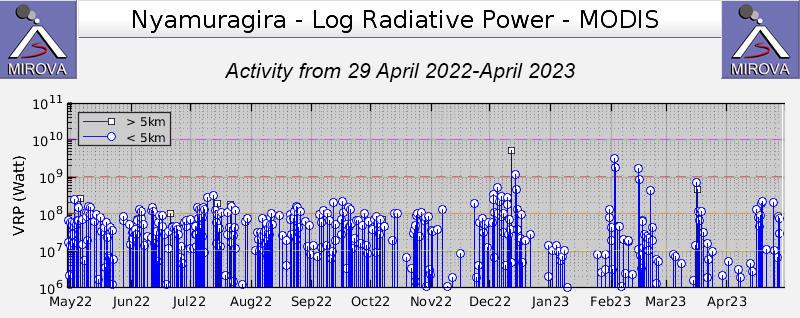 |
Figure 93. Frequent thermal anomalies at Nyamulagira shown on this MIROVA graph (Log Radiative Power) for the year ending 29 April 2023 were mostly of moderate to high intensity. Courtesy of MIROVA. |
Information Contacts: Observatoire Volcanologique de Goma (OVG), Departement de Geophysique, Centre de Recherche en Sciences Naturelles, Lwiro, D.S. Bukavu, DR Congo; MIROVA (Middle InfraRed Observation of Volcanic Activity), a collaborative project between the Universities of Turin and Florence (Italy) supported by the Centre for Volcanic Risk of the Italian Civil Protection Department (URL: http://www.mirovaweb.it/); Sentinel Hub Playground (URL: https://www.sentinel-hub.com/explore/sentinel-playground).
Lava flows and thermal activity during May-October 2023
Nyamulagira (also known as Nyamuragira) is a shield volcano in the Democratic Republic of Congo with the summit truncated by a small 2 x 2.3 km caldera with walls up to about 100 m high. Documented eruptions have occurred within the summit caldera, as well as from numerous flank fissures and cinder cones. The current eruption period began in April 2018 and has more recently been characterized by summit crater lava flows and thermal activity (BGVN 48:05). This report describes lava flows and variable thermal activity during May through October 2023, based on information from the Observatoire Volcanologique de Goma (OVG) and various satellite data.
Lava lake activity continued during May. The MIROVA (Middle InfraRed Observation of Volcanic Activity) system recorded moderate-to-strong thermal activity throughout the reporting period; activity was more intense during May and October and relatively weaker from June through September (figure 95). The MODVOLC thermal algorithm, detected a total of 209 thermal alerts. There were 143 hotspots detected during May, eight during June, nine during September, and 49 during October. This activity was also reflected in infrared satellite images, where a lava flow was visible in the NW part of the crater on 7 May and strong activity was seen in the center of the crater on 4 October (figure 96). Another infrared satellite image taken on 12 May showed still active lava flows along the NW margin of the crater. According to OVG lava effusions were active during 7-29 May and moved to the N and NW parts of the crater beginning on 9 May. Strong summit crater incandescence was visible from Goma (27 km S) during the nights of 17, 19, and 20 May (figure 97). On 17 May there was an increase in eruptive activity, which peaked at 0100 on 20 May. Notable sulfur dioxide plumes drifted NW and W during 19-20 May (figure 98). Drone footage acquired in partnership with the USGS (United States Geological Survey) on 20 May captured images of narrow lava flows that traveled about 100 m down the W flank (figure 99). Data from the Rumangabo seismic station indicated a decreasing trend in activity during 17-21 May. Although weather clouds prevented clear views of the summit, a strong thermal signature on the NW flank was visible in an infrared satellite image on 22 May, based on an infrared satellite image. On 28 May the lava flows on the upper W flank began to cool and solidify. By 29 May seismicity returned to levels similar to those recorded before the 17 May increase. Lava effusion continued but was confined to the summit crater; periodic crater incandescence was observed.
 |
Figure 97. Photo of intense nighttime crater incandescence at Nyamulagira as seen from Goma (27 km S) on the evening of 19 May 2023. Courtesy of Charles Balagizi, OVG. |
 |
Figure 98. Two strong sulfur dioxide plumes were detected at Nyamulagira and drifted W on 19 (left) and 20 (right) May 2023. Courtesy of NASA Global Sulfur Dioxide Monitoring Page. |
Low-level activity was noted during June through October. On 1 June OVG reported that seismicity remained at lower levels and that crater incandescence had been absent for three days, though infrared satellite imagery showed continued lava effusion in the summit crater. The lava flows on the flanks covered an estimated 0.6 km2. Satellite imagery continued to show thermal activity confined to the lava lake through October (figure 96), although no lava flows or significant sulfur dioxide emissions were reported.
Information Contacts: Observatoire Volcanologique de Goma (OVG), Departement de Geophysique, Centre de Recherche en Sciences Naturelles, Lwiro, D.S. Bukavu, DR Congo; Hawai'i Institute of Geophysics and Planetology (HIGP) - MODVOLC Thermal Alerts System, School of Ocean and Earth Science and Technology (SOEST), Univ. of Hawai'i, 2525 Correa Road, Honolulu, HI 96822, USA (URL: http://modis.higp.hawaii.edu/); MIROVA (Middle InfraRed Observation of Volcanic Activity), a collaborative project between the Universities of Turin and Florence (Italy) supported by the Centre for Volcanic Risk of the Italian Civil Protection Department (URL: http://www.mirovaweb.it/); NASA Global Sulfur Dioxide Monitoring Page, Atmospheric Chemistry and Dynamics Laboratory, NASA Goddard Space Flight Center (NASA/GSFC), 8800 Greenbelt Road, Goddard, Maryland, USA (URL: https://so2.gsfc.nasa.gov/); Copernicus Browser, Copernicus Data Space Ecosystem, European Space Agency (URL: https://dataspace.copernicus.eu/browser/); Charles Balagizi, Goma Volcano Observatory, Departement de Geophysique, Centre de Recherche en Sciences Naturelles, Lwiro, D.S. Bukavu, DR Congo.
|
|
||||||||||||||||||||||||||
There is data available for 48 confirmed eruptive periods.
2018 Apr 14 - 2025 Sep 19 (continuing) Confirmed Eruption (Explosive / Effusive)
| Episode 1 | Eruption (Explosive / Effusive) | Summit caldera | |||||||||||||||||||||||||||||||||||||||||||||||||||||||||||||||||||||||||||||||||||||||||||||||||||||||||||||||||||||||||||||||||||||||||||||||||||||||||||||||||||||||||||||||||||||||||||||||||||||||||||||||||||||||||||||||||||||||||||||||||||||||||||||||||||||||||||||||||
|---|---|---|---|---|---|---|---|---|---|---|---|---|---|---|---|---|---|---|---|---|---|---|---|---|---|---|---|---|---|---|---|---|---|---|---|---|---|---|---|---|---|---|---|---|---|---|---|---|---|---|---|---|---|---|---|---|---|---|---|---|---|---|---|---|---|---|---|---|---|---|---|---|---|---|---|---|---|---|---|---|---|---|---|---|---|---|---|---|---|---|---|---|---|---|---|---|---|---|---|---|---|---|---|---|---|---|---|---|---|---|---|---|---|---|---|---|---|---|---|---|---|---|---|---|---|---|---|---|---|---|---|---|---|---|---|---|---|---|---|---|---|---|---|---|---|---|---|---|---|---|---|---|---|---|---|---|---|---|---|---|---|---|---|---|---|---|---|---|---|---|---|---|---|---|---|---|---|---|---|---|---|---|---|---|---|---|---|---|---|---|---|---|---|---|---|---|---|---|---|---|---|---|---|---|---|---|---|---|---|---|---|---|---|---|---|---|---|---|---|---|---|---|---|---|---|---|---|---|---|---|---|---|---|---|---|---|---|---|---|---|---|---|---|---|---|---|---|---|---|---|---|---|---|---|---|---|---|---|---|---|---|---|---|---|---|---|---|---|---|---|---|---|---|---|
| 2018 Apr 14 - 2019 Apr 20 ± 5 days | Evidence from Observations: Reported | |||||||||||||||||||||||||||||||||||||||||||||||||||||||||||||||||||||||||||||||||||||||||||||||||||||||||||||||||||||||||||||||||||||||||||||||||||||||||||||||||||||||||||||||||||||||||||||||||||||||||||||||||||||||||||||||||||||||||||||||||||||||||||||||||||||||||||||||||
|
List of 53 Events for Episode 1 at Summit caldera
|
||||||||||||||||||||||||||||||||||||||||||||||||||||||||||||||||||||||||||||||||||||||||||||||||||||||||||||||||||||||||||||||||||||||||||||||||||||||||||||||||||||||||||||||||||||||||||||||||||||||||||||||||||||||||||||||||||||||||||||||||||||||||||||||||||||||||||||||||||
| Episode 2 | Eruption (Explosive / Effusive) | Summit caldera | ||||||||||||||||||||||||||||||||||||||||||||||||||||||||||||||||||||||||||||||||||||||||||||||||||||||||||||||||||||||
|---|---|---|---|---|---|---|---|---|---|---|---|---|---|---|---|---|---|---|---|---|---|---|---|---|---|---|---|---|---|---|---|---|---|---|---|---|---|---|---|---|---|---|---|---|---|---|---|---|---|---|---|---|---|---|---|---|---|---|---|---|---|---|---|---|---|---|---|---|---|---|---|---|---|---|---|---|---|---|---|---|---|---|---|---|---|---|---|---|---|---|---|---|---|---|---|---|---|---|---|---|---|---|---|---|---|---|---|---|---|---|---|---|---|---|---|---|---|---|---|
| 2019 May 10 ± 5 days - 2025 Sep 19 (continuing) | Evidence from Observations: Satellite (infrared) | ||||||||||||||||||||||||||||||||||||||||||||||||||||||||||||||||||||||||||||||||||||||||||||||||||||||||||||||||||||||
|
List of 22 Events for Episode 2 at Summit caldera
|
|||||||||||||||||||||||||||||||||||||||||||||||||||||||||||||||||||||||||||||||||||||||||||||||||||||||||||||||||||||||
2016 Nov 27 - 2017 May 2 Confirmed Eruption (Explosive / Effusive) VEI: 0
| Episode 1 | Eruption (Explosive / Effusive) | Summit crater | |||||||||||||||||||||||||||||||||||||||||||||||||||||||||||||||||||||||||||||||||||||||||||||||||||||||
|---|---|---|---|---|---|---|---|---|---|---|---|---|---|---|---|---|---|---|---|---|---|---|---|---|---|---|---|---|---|---|---|---|---|---|---|---|---|---|---|---|---|---|---|---|---|---|---|---|---|---|---|---|---|---|---|---|---|---|---|---|---|---|---|---|---|---|---|---|---|---|---|---|---|---|---|---|---|---|---|---|---|---|---|---|---|---|---|---|---|---|---|---|---|---|---|---|---|---|---|---|---|---|---|---|
| 2016 Nov 27 - 2017 May 2 | Evidence from Observations: Reported | |||||||||||||||||||||||||||||||||||||||||||||||||||||||||||||||||||||||||||||||||||||||||||||||||||||||
|
List of 19 Events for Episode 1 at Summit crater
|
||||||||||||||||||||||||||||||||||||||||||||||||||||||||||||||||||||||||||||||||||||||||||||||||||||||||
2014 Jun 22 - 2016 May 14 Confirmed Eruption (Explosive / Effusive) VEI: 0
| Episode 1 | Eruption (Explosive / Effusive) | Summit crater | ||||||||||||||||||||||||||||||||||||||||||||||||||||||||||||||||||||||||||||||||||||||||||||||||||||||||||||||||||||||||||||||||||||||||||||||||||||||||||||||||||||||||||||||||||||||||||||||||||||||||||||||||||||||||||||||||||||||||||||||||||||||||||||||||||||||||||||||||||||||||||||||||||||||||||||||||||||||||||||||||||||||||||||||||||||||||||||||||||||||||||||||||||||||||||||||||||||||||||||||||||||||||||||||||||||||||||||
|---|---|---|---|---|---|---|---|---|---|---|---|---|---|---|---|---|---|---|---|---|---|---|---|---|---|---|---|---|---|---|---|---|---|---|---|---|---|---|---|---|---|---|---|---|---|---|---|---|---|---|---|---|---|---|---|---|---|---|---|---|---|---|---|---|---|---|---|---|---|---|---|---|---|---|---|---|---|---|---|---|---|---|---|---|---|---|---|---|---|---|---|---|---|---|---|---|---|---|---|---|---|---|---|---|---|---|---|---|---|---|---|---|---|---|---|---|---|---|---|---|---|---|---|---|---|---|---|---|---|---|---|---|---|---|---|---|---|---|---|---|---|---|---|---|---|---|---|---|---|---|---|---|---|---|---|---|---|---|---|---|---|---|---|---|---|---|---|---|---|---|---|---|---|---|---|---|---|---|---|---|---|---|---|---|---|---|---|---|---|---|---|---|---|---|---|---|---|---|---|---|---|---|---|---|---|---|---|---|---|---|---|---|---|---|---|---|---|---|---|---|---|---|---|---|---|---|---|---|---|---|---|---|---|---|---|---|---|---|---|---|---|---|---|---|---|---|---|---|---|---|---|---|---|---|---|---|---|---|---|---|---|---|---|---|---|---|---|---|---|---|---|---|---|---|---|---|---|---|---|---|---|---|---|---|---|---|---|---|---|---|---|---|---|---|---|---|---|---|---|---|---|---|---|---|---|---|---|---|---|---|---|---|---|---|---|---|---|---|---|---|---|---|---|---|---|---|---|---|---|---|---|---|---|---|---|---|---|---|---|---|---|---|---|---|---|---|---|---|---|---|---|---|---|---|---|---|---|---|---|---|---|---|---|---|---|---|---|---|---|---|---|---|---|---|---|---|---|---|---|---|---|---|---|---|---|---|---|---|---|---|---|---|---|---|---|---|---|---|---|---|---|---|---|---|---|---|---|---|---|---|---|---|---|---|---|---|---|---|---|---|---|---|---|---|---|---|---|---|---|
| 2014 Jun 22 - 2016 May 14 | Evidence from Observations: Satellite (infrared) | ||||||||||||||||||||||||||||||||||||||||||||||||||||||||||||||||||||||||||||||||||||||||||||||||||||||||||||||||||||||||||||||||||||||||||||||||||||||||||||||||||||||||||||||||||||||||||||||||||||||||||||||||||||||||||||||||||||||||||||||||||||||||||||||||||||||||||||||||||||||||||||||||||||||||||||||||||||||||||||||||||||||||||||||||||||||||||||||||||||||||||||||||||||||||||||||||||||||||||||||||||||||||||||||||||||||||||||
|
List of 84 Events for Episode 1 at Summit crater
|
|||||||||||||||||||||||||||||||||||||||||||||||||||||||||||||||||||||||||||||||||||||||||||||||||||||||||||||||||||||||||||||||||||||||||||||||||||||||||||||||||||||||||||||||||||||||||||||||||||||||||||||||||||||||||||||||||||||||||||||||||||||||||||||||||||||||||||||||||||||||||||||||||||||||||||||||||||||||||||||||||||||||||||||||||||||||||||||||||||||||||||||||||||||||||||||||||||||||||||||||||||||||||||||||||||||||||||||
2011 Nov 6 - 2012 Mar 16 (?) Confirmed Eruption (Explosive / Effusive) VEI: 2
| Episode 1 | Eruption (Explosive / Effusive) | NW flank | |||||||||||||||||||||||||||||||||||||||||||||||||||||||||||||||||||||||||||||||||||||||||||||||||||||||||||||||||||||||||||||||||||||||||||||||||||||||||||||||||||
|---|---|---|---|---|---|---|---|---|---|---|---|---|---|---|---|---|---|---|---|---|---|---|---|---|---|---|---|---|---|---|---|---|---|---|---|---|---|---|---|---|---|---|---|---|---|---|---|---|---|---|---|---|---|---|---|---|---|---|---|---|---|---|---|---|---|---|---|---|---|---|---|---|---|---|---|---|---|---|---|---|---|---|---|---|---|---|---|---|---|---|---|---|---|---|---|---|---|---|---|---|---|---|---|---|---|---|---|---|---|---|---|---|---|---|---|---|---|---|---|---|---|---|---|---|---|---|---|---|---|---|---|---|---|---|---|---|---|---|---|---|---|---|---|---|---|---|---|---|---|---|---|---|---|---|---|---|---|---|---|---|---|---|---|---|
| 2011 Nov 6 - 2012 Mar 16 (?) | Evidence from Observations: Reported | |||||||||||||||||||||||||||||||||||||||||||||||||||||||||||||||||||||||||||||||||||||||||||||||||||||||||||||||||||||||||||||||||||||||||||||||||||||||||||||||||||
|
List of 31 Events for Episode 1 at NW flank
|
||||||||||||||||||||||||||||||||||||||||||||||||||||||||||||||||||||||||||||||||||||||||||||||||||||||||||||||||||||||||||||||||||||||||||||||||||||||||||||||||||||
2010 Jan 2 - 2010 Jan 29 Confirmed Eruption (Explosive / Effusive) VEI: 1 (?)
| Episode 1 | Eruption (Explosive / Effusive) | Summit caldera and SSE flank | ||||||||||||||||||||||||||||||||||||||||||||||||||||||||||
|---|---|---|---|---|---|---|---|---|---|---|---|---|---|---|---|---|---|---|---|---|---|---|---|---|---|---|---|---|---|---|---|---|---|---|---|---|---|---|---|---|---|---|---|---|---|---|---|---|---|---|---|---|---|---|---|---|---|---|---|
| 2010 Jan 2 - 2010 Jan 29 | Evidence from Observations: Reported | ||||||||||||||||||||||||||||||||||||||||||||||||||||||||||
|
List of 10 Events for Episode 1 at Summit caldera and SSE flank
|
|||||||||||||||||||||||||||||||||||||||||||||||||||||||||||
2006 Nov 27 - 2006 Dec 5 (?) Confirmed Eruption (Explosive / Effusive) VEI: 2
| Episode 1 | Eruption (Explosive / Effusive) | South flank | ||||||||||||||||||||||||||||||||||||||
|---|---|---|---|---|---|---|---|---|---|---|---|---|---|---|---|---|---|---|---|---|---|---|---|---|---|---|---|---|---|---|---|---|---|---|---|---|---|---|---|
| 2006 Nov 27 - 2006 Dec 5 (?) | Evidence from Observations: Reported | ||||||||||||||||||||||||||||||||||||||
|
List of 6 Events for Episode 1 at South flank
|
|||||||||||||||||||||||||||||||||||||||
2004 May 8 - 2004 May 28 ± 3 days Confirmed Eruption (Explosive / Effusive) VEI: 2 (?)
| Episode 1 | Eruption (Explosive / Effusive) | Summit and NNW flank | |||||||||||||||||||||||||||||||||||||||||||
|---|---|---|---|---|---|---|---|---|---|---|---|---|---|---|---|---|---|---|---|---|---|---|---|---|---|---|---|---|---|---|---|---|---|---|---|---|---|---|---|---|---|---|---|---|
| 2004 May 8 - 2004 May 28 ± 3 days | Evidence from Observations: Reported | |||||||||||||||||||||||||||||||||||||||||||
|
List of 7 Events for Episode 1 at Summit and NNW flank
|
||||||||||||||||||||||||||||||||||||||||||||
2002 Jul 25 - 2002 Sep 16 (?) ± 15 days Confirmed Eruption (Explosive / Effusive) VEI: 2 (?)
| Episode 1 | Eruption (Explosive / Effusive) | Summit caldera, north & south flanks | ||||||||||||||||||||||||||||||||||||||
|---|---|---|---|---|---|---|---|---|---|---|---|---|---|---|---|---|---|---|---|---|---|---|---|---|---|---|---|---|---|---|---|---|---|---|---|---|---|---|---|
| 2002 Jul 25 - 2002 Sep 16 (?) ± 15 days | Evidence from Observations: Reported | ||||||||||||||||||||||||||||||||||||||
|
List of 6 Events for Episode 1 at Summit caldera, north & south flanks
|
|||||||||||||||||||||||||||||||||||||||
2001 Feb 6 - 2001 Apr 5 ± 4 days Confirmed Eruption (Explosive / Effusive) VEI: 2 (?)
| Episode 1 | Eruption (Explosive / Effusive) | North and SSE flanks | ||||||||||||||||||||||||||||||||||||||||||||||||
|---|---|---|---|---|---|---|---|---|---|---|---|---|---|---|---|---|---|---|---|---|---|---|---|---|---|---|---|---|---|---|---|---|---|---|---|---|---|---|---|---|---|---|---|---|---|---|---|---|---|
| 2001 Feb 6 - 2001 Apr 5 ± 4 days | Evidence from Observations: Reported | ||||||||||||||||||||||||||||||||||||||||||||||||
|
List of 8 Events for Episode 1 at North and SSE flanks
|
|||||||||||||||||||||||||||||||||||||||||||||||||
2000 Jan 27 - 2000 Feb 10 (on or after) Confirmed Eruption (Explosive / Effusive) VEI: 2 (?)
| Episode 1 | Eruption (Explosive / Effusive) | SE flank (Ngerageze) | ||||||||||||||||||||||||||||||||||||||
|---|---|---|---|---|---|---|---|---|---|---|---|---|---|---|---|---|---|---|---|---|---|---|---|---|---|---|---|---|---|---|---|---|---|---|---|---|---|---|---|
| 2000 Jan 27 - 2000 Feb 10 (on or after) | Evidence from Observations: Reported | ||||||||||||||||||||||||||||||||||||||
|
List of 6 Events for Episode 1 at SE flank (Ngerageze)
|
|||||||||||||||||||||||||||||||||||||||
1998 Oct 17 - 1998 Oct 25 (on or after) Confirmed Eruption (Explosive / Effusive) VEI: 2 (?)
| Episode 1 | Eruption (Explosive / Effusive) | ||||||||||||||||||||||||
|---|---|---|---|---|---|---|---|---|---|---|---|---|---|---|---|---|---|---|---|---|---|---|---|---|
| 1998 Oct 17 - 1998 Oct 25 (on or after) | Evidence from Observations: Reported | |||||||||||||||||||||||
|
List of 3 Events for Episode 1
|
||||||||||||||||||||||||
1996 Dec 1 - 1996 Dec 5 (on or after) Confirmed Eruption (Explosive / Effusive) VEI: 3
| Episode 1 | Eruption (Explosive / Effusive) | |||||||||||||||||||||||||||||
|---|---|---|---|---|---|---|---|---|---|---|---|---|---|---|---|---|---|---|---|---|---|---|---|---|---|---|---|---|---|
| 1996 Dec 1 - 1996 Dec 5 (on or after) | Evidence from Observations: Reported | ||||||||||||||||||||||||||||
|
List of 4 Events for Episode 1
|
|||||||||||||||||||||||||||||
1994 Jul 4 - 1994 Aug 25 (on or after) Confirmed Eruption (Explosive / Effusive) VEI: 2 (?)
| Episode 1 | Eruption (Explosive / Effusive) | West flank (Kimera) and summit | |||||||||||||||||||||||||||||||||||||||||||
|---|---|---|---|---|---|---|---|---|---|---|---|---|---|---|---|---|---|---|---|---|---|---|---|---|---|---|---|---|---|---|---|---|---|---|---|---|---|---|---|---|---|---|---|---|
| 1994 Jul 4 - 1994 Aug 25 (on or after) | Evidence from Observations: Reported | |||||||||||||||||||||||||||||||||||||||||||
|
List of 7 Events for Episode 1 at West flank (Kimera) and summit
|
||||||||||||||||||||||||||||||||||||||||||||
1991 Sep 20 - 1993 Feb 8 Confirmed Eruption (Explosive / Effusive) VEI: 3
| Episode 1 | Eruption (Explosive / Effusive) | NE flank 1530 m (Mikombe) | |||||||||||||||||||||||||||||||||||||||||||||||||||||
|---|---|---|---|---|---|---|---|---|---|---|---|---|---|---|---|---|---|---|---|---|---|---|---|---|---|---|---|---|---|---|---|---|---|---|---|---|---|---|---|---|---|---|---|---|---|---|---|---|---|---|---|---|---|---|
| 1991 Sep 20 - 1993 Feb 8 | Evidence from Observations: Reported | |||||||||||||||||||||||||||||||||||||||||||||||||||||
|
List of 9 Events for Episode 1 at NE flank 1530 m (Mikombe)
|
||||||||||||||||||||||||||||||||||||||||||||||||||||||
1989 Apr 24 - 1989 Aug 15 ± 5 days Confirmed Eruption (Explosive / Effusive) VEI: 3
| Episode 1 | Eruption (Explosive / Effusive) | Summit, SE and East flank | ||||||||||||||||||||||||||||||||||||||||||||||||
|---|---|---|---|---|---|---|---|---|---|---|---|---|---|---|---|---|---|---|---|---|---|---|---|---|---|---|---|---|---|---|---|---|---|---|---|---|---|---|---|---|---|---|---|---|---|---|---|---|---|
| 1989 Apr 24 - 1989 Aug 15 ± 5 days | Evidence from Observations: Reported | ||||||||||||||||||||||||||||||||||||||||||||||||
|
List of 8 Events for Episode 1 at Summit, SE and East flank
|
|||||||||||||||||||||||||||||||||||||||||||||||||
1987 Dec 30 - 1988 Jan 4 Confirmed Eruption (Explosive / Effusive) VEI: 1
| Episode 1 | Eruption (Explosive / Effusive) | North Flank (Gafuranindi) | |||||||||||||||||||||||||||||||||||||||||||
|---|---|---|---|---|---|---|---|---|---|---|---|---|---|---|---|---|---|---|---|---|---|---|---|---|---|---|---|---|---|---|---|---|---|---|---|---|---|---|---|---|---|---|---|---|
| 1987 Dec 30 - 1988 Jan 4 | Evidence from Observations: Reported | |||||||||||||||||||||||||||||||||||||||||||
|
List of 7 Events for Episode 1 at North Flank (Gafuranindi)
|
||||||||||||||||||||||||||||||||||||||||||||
1986 Jul 16 - 1986 Aug 20 Confirmed Eruption (Explosive / Effusive) VEI: 2
| Episode 1 | Eruption (Explosive / Effusive) | South flank (near Kitazungurwa) | |||||||||||||||||||||||||||||||||||||||||||||||||||||
|---|---|---|---|---|---|---|---|---|---|---|---|---|---|---|---|---|---|---|---|---|---|---|---|---|---|---|---|---|---|---|---|---|---|---|---|---|---|---|---|---|---|---|---|---|---|---|---|---|---|---|---|---|---|---|
| 1986 Jul 16 - 1986 Aug 20 | Evidence from Observations: Reported | |||||||||||||||||||||||||||||||||||||||||||||||||||||
|
List of 9 Events for Episode 1 at South flank (near Kitazungurwa)
|
||||||||||||||||||||||||||||||||||||||||||||||||||||||
1984 Feb 23 - 1984 Mar 14 Confirmed Eruption (Explosive / Effusive) VEI: 2
| Episode 1 | Eruption (Explosive / Effusive) | NW flank (Kivandimwe) | |||||||||||||||||||||||||||||||||||||||||||||||||||||
|---|---|---|---|---|---|---|---|---|---|---|---|---|---|---|---|---|---|---|---|---|---|---|---|---|---|---|---|---|---|---|---|---|---|---|---|---|---|---|---|---|---|---|---|---|---|---|---|---|---|---|---|---|---|---|
| 1984 Feb 23 - 1984 Mar 14 | Evidence from Observations: Reported | |||||||||||||||||||||||||||||||||||||||||||||||||||||
|
List of 9 Events for Episode 1 at NW flank (Kivandimwe)
|
||||||||||||||||||||||||||||||||||||||||||||||||||||||
1981 Dec 25 - 1982 Jan 14 Confirmed Eruption (Explosive / Effusive) VEI: 3
| Episode 1 | Eruption (Explosive / Effusive) | SE flank (Rugarambiro) | ||||||||||||||||||||||||||||||||||||||||||||||||||||||||||||||||||||||||||||||
|---|---|---|---|---|---|---|---|---|---|---|---|---|---|---|---|---|---|---|---|---|---|---|---|---|---|---|---|---|---|---|---|---|---|---|---|---|---|---|---|---|---|---|---|---|---|---|---|---|---|---|---|---|---|---|---|---|---|---|---|---|---|---|---|---|---|---|---|---|---|---|---|---|---|---|---|---|---|---|---|
| 1981 Dec 25 - 1982 Jan 14 | Evidence from Observations: Reported | ||||||||||||||||||||||||||||||||||||||||||||||||||||||||||||||||||||||||||||||
|
List of 14 Events for Episode 1 at SE flank (Rugarambiro)
|
|||||||||||||||||||||||||||||||||||||||||||||||||||||||||||||||||||||||||||||||
1980 Jan 30 - 1980 Feb 24 Confirmed Eruption (Explosive / Effusive) VEI: 3
| Episode 1 | Eruption (Explosive / Effusive) | North flank (Gasenyi) | ||||||||||||||||||||||||||||||||||||||||||||||||||||||||||
|---|---|---|---|---|---|---|---|---|---|---|---|---|---|---|---|---|---|---|---|---|---|---|---|---|---|---|---|---|---|---|---|---|---|---|---|---|---|---|---|---|---|---|---|---|---|---|---|---|---|---|---|---|---|---|---|---|---|---|---|
| 1980 Jan 30 - 1980 Feb 24 | Evidence from Observations: Reported | ||||||||||||||||||||||||||||||||||||||||||||||||||||||||||
|
List of 10 Events for Episode 1 at North flank (Gasenyi)
|
|||||||||||||||||||||||||||||||||||||||||||||||||||||||||||
1976 Dec 23 - 1977 Jun 15 ± 5 days Confirmed Eruption (Explosive / Effusive) VEI: 1
| Episode 1 | Eruption (Explosive / Effusive) | SSW flank (Murara and Harakandi) | |||||||||||||||||||||||||||||||||||||||||||||||||||||
|---|---|---|---|---|---|---|---|---|---|---|---|---|---|---|---|---|---|---|---|---|---|---|---|---|---|---|---|---|---|---|---|---|---|---|---|---|---|---|---|---|---|---|---|---|---|---|---|---|---|---|---|---|---|---|
| 1976 Dec 23 - 1977 Jun 15 ± 5 days | Evidence from Observations: Reported | |||||||||||||||||||||||||||||||||||||||||||||||||||||
|
List of 9 Events for Episode 1 at SSW flank (Murara and Harakandi)
|
||||||||||||||||||||||||||||||||||||||||||||||||||||||
1971 Mar 24 - 1971 May 5 ± 4 days Confirmed Eruption (Explosive / Effusive) VEI: 3
| Episode 1 | Eruption (Explosive / Effusive) | WNW flank (Rugarama) | |||||||||||||||||||||||||||||||||||||||||||||||||||||||||||||||
|---|---|---|---|---|---|---|---|---|---|---|---|---|---|---|---|---|---|---|---|---|---|---|---|---|---|---|---|---|---|---|---|---|---|---|---|---|---|---|---|---|---|---|---|---|---|---|---|---|---|---|---|---|---|---|---|---|---|---|---|---|---|---|---|---|
| 1971 Mar 24 - 1971 May 5 ± 4 days | Evidence from Observations: Reported | |||||||||||||||||||||||||||||||||||||||||||||||||||||||||||||||
|
List of 11 Events for Episode 1 at WNW flank (Rugarama)
|
||||||||||||||||||||||||||||||||||||||||||||||||||||||||||||||||
1967 Apr 23 - 1967 May 9 Confirmed Eruption (Explosive / Effusive) VEI: 2
| Episode 1 | Eruption (Explosive / Effusive) | North flank (Gakararanga) | |||||||||||||||||||||||||||||||||||||||||||
|---|---|---|---|---|---|---|---|---|---|---|---|---|---|---|---|---|---|---|---|---|---|---|---|---|---|---|---|---|---|---|---|---|---|---|---|---|---|---|---|---|---|---|---|---|
| 1967 Apr 23 - 1967 May 9 | Evidence from Observations: Reported | |||||||||||||||||||||||||||||||||||||||||||
|
List of 7 Events for Episode 1 at North flank (Gakararanga)
|
||||||||||||||||||||||||||||||||||||||||||||
1958 Aug 7 - 1958 Nov 21 Confirmed Eruption (Explosive / Effusive) VEI: 2
| Episode 1 | Eruption (Explosive / Effusive) | North flank (Kitsimbanyi), NNW rift | |||||||||||||||||||||||||||||||||||||||||||||||||||||
|---|---|---|---|---|---|---|---|---|---|---|---|---|---|---|---|---|---|---|---|---|---|---|---|---|---|---|---|---|---|---|---|---|---|---|---|---|---|---|---|---|---|---|---|---|---|---|---|---|---|---|---|---|---|---|
| 1958 Aug 7 - 1958 Nov 21 | Evidence from Observations: Reported | |||||||||||||||||||||||||||||||||||||||||||||||||||||
|
List of 9 Events for Episode 1 at North flank (Kitsimbanyi), NNW rift
|
||||||||||||||||||||||||||||||||||||||||||||||||||||||
1957 Dec 28 Confirmed Eruption (Explosive / Effusive) VEI: 0
| Episode 1 | Eruption (Explosive / Effusive) | Summit caldera and SSE fissure zone | ||||||||||||||||||
|---|---|---|---|---|---|---|---|---|---|---|---|---|---|---|---|---|---|---|---|
| 1957 Dec 28 - Unknown | Evidence from Observations: Reported | ||||||||||||||||||
|
List of 2 Events for Episode 1 at Summit caldera and SSE fissure zone
|
|||||||||||||||||||
1956 Nov 17 - 1956 Nov 18 Confirmed Eruption (Explosive / Effusive) VEI: 1
| Episode 1 | Eruption (Explosive / Effusive) | Summit caldera and NNW fissure zone | |||||||||||||||||||||||
|---|---|---|---|---|---|---|---|---|---|---|---|---|---|---|---|---|---|---|---|---|---|---|---|---|
| 1956 Nov 17 - 1956 Nov 18 | Evidence from Observations: Reported | |||||||||||||||||||||||
|
List of 3 Events for Episode 1 at Summit caldera and NNW fissure zone
|
||||||||||||||||||||||||
1954 Feb 21 - 1954 May 28 Confirmed Eruption (Explosive / Effusive) VEI: 1
| Episode 1 | Eruption (Explosive / Effusive) | SSE fissure zone (Mihaga) | |||||||||||||||||||||||||||||||||||||||||||
|---|---|---|---|---|---|---|---|---|---|---|---|---|---|---|---|---|---|---|---|---|---|---|---|---|---|---|---|---|---|---|---|---|---|---|---|---|---|---|---|---|---|---|---|---|
| 1954 Feb 21 - 1954 May 28 | Evidence from Observations: Reported | |||||||||||||||||||||||||||||||||||||||||||
|
List of 7 Events for Episode 1 at SSE fissure zone (Mihaga)
|
||||||||||||||||||||||||||||||||||||||||||||
1951 Nov 16 - 1952 Jan 16 Confirmed Eruption (Explosive / Effusive) VEI: 2
| Episode 1 | Eruption (Explosive / Effusive) | NNW fissure zone (Shabubembe-Ndakaza) | ||||||||||||||||||||||||||||||||||||||||||||||||||||||||||
|---|---|---|---|---|---|---|---|---|---|---|---|---|---|---|---|---|---|---|---|---|---|---|---|---|---|---|---|---|---|---|---|---|---|---|---|---|---|---|---|---|---|---|---|---|---|---|---|---|---|---|---|---|---|---|---|---|---|---|---|
| 1951 Nov 16 - 1952 Jan 16 | Evidence from Observations: Reported | ||||||||||||||||||||||||||||||||||||||||||||||||||||||||||
|
List of 10 Events for Episode 1 at NNW fissure zone (Shabubembe-Ndakaza)
|
|||||||||||||||||||||||||||||||||||||||||||||||||||||||||||
1951 Jul 25 - 1951 Jul 28 Confirmed Eruption (Explosive / Effusive) VEI: 1
| Episode 1 | Eruption (Explosive / Effusive) | SW flank (Gituro) | |||||||||||||||||||||||
|---|---|---|---|---|---|---|---|---|---|---|---|---|---|---|---|---|---|---|---|---|---|---|---|---|
| 1951 Jul 25 - 1951 Jul 28 | Evidence from Observations: Reported | |||||||||||||||||||||||
|
List of 3 Events for Episode 1 at SW flank (Gituro)
|
||||||||||||||||||||||||
1948 Mar 1 - 1948 Jul 15 ± 5 days Confirmed Eruption (Explosive / Effusive) VEI: 2
| Episode 1 | Eruption (Explosive / Effusive) | SW flank (Gituro, Muhuboli), N flank | ||||||||||||||||||||||||||||||||||||||||||||||||||||||||||
|---|---|---|---|---|---|---|---|---|---|---|---|---|---|---|---|---|---|---|---|---|---|---|---|---|---|---|---|---|---|---|---|---|---|---|---|---|---|---|---|---|---|---|---|---|---|---|---|---|---|---|---|---|---|---|---|---|---|---|---|
| 1948 Mar 1 - 1948 Jul 15 ± 5 days | Evidence from Observations: Reported | ||||||||||||||||||||||||||||||||||||||||||||||||||||||||||
|
List of 10 Events for Episode 1 at SW flank (Gituro, Muhuboli), N flank
|
|||||||||||||||||||||||||||||||||||||||||||||||||||||||||||
1938 Jan 28 - 1940 Jun 25 ± 5 days Confirmed Eruption (Explosive / Effusive) VEI: 1
| Episode 1 | Eruption (Explosive / Effusive) | Summit, SE and SW flanks (Tshambene) | |||||||||||||||||||||||||||||||||||||||||||||||||||||
|---|---|---|---|---|---|---|---|---|---|---|---|---|---|---|---|---|---|---|---|---|---|---|---|---|---|---|---|---|---|---|---|---|---|---|---|---|---|---|---|---|---|---|---|---|---|---|---|---|---|---|---|---|---|---|
| 1938 Jan 28 - 1940 Jun 25 ± 5 days | Evidence from Observations: Reported | |||||||||||||||||||||||||||||||||||||||||||||||||||||
|
List of 9 Events for Episode 1 at Summit, SE and SW flanks (Tshambene)
|
||||||||||||||||||||||||||||||||||||||||||||||||||||||
1921 - 1938 Jan 17 ± 3 days Confirmed Eruption (Explosive / Effusive) VEI: 0
| Episode 1 | Eruption (Explosive / Effusive) | Caldera | ||||||||||||||||||||||||||||
|---|---|---|---|---|---|---|---|---|---|---|---|---|---|---|---|---|---|---|---|---|---|---|---|---|---|---|---|---|---|
| 1921 - 1938 Jan 17 ± 3 days | Evidence from Observations: Reported | ||||||||||||||||||||||||||||
|
List of 4 Events for Episode 1 at Caldera
|
|||||||||||||||||||||||||||||
1920 Confirmed Eruption (Explosive / Effusive) VEI: 0
| Episode 1 | Eruption (Explosive / Effusive) | SSW flank (Lake Kivu) | ||||||||||||||||||
|---|---|---|---|---|---|---|---|---|---|---|---|---|---|---|---|---|---|---|---|
| 1920 - Unknown | Evidence from Observations: Reported | ||||||||||||||||||
|
List of 2 Events for Episode 1 at SSW flank (Lake Kivu)
|
|||||||||||||||||||
1912 Dec 3 - 1913 Apr Confirmed Eruption (Explosive / Effusive) VEI: 3
| Episode 1 | Eruption (Explosive / Effusive) | SW flank (Rumoka), and summit | ||||||||||||||||||||||||||||||||||||||||||||||||||||||||||
|---|---|---|---|---|---|---|---|---|---|---|---|---|---|---|---|---|---|---|---|---|---|---|---|---|---|---|---|---|---|---|---|---|---|---|---|---|---|---|---|---|---|---|---|---|---|---|---|---|---|---|---|---|---|---|---|---|---|---|---|
| 1912 Dec 3 - 1913 Apr | Evidence from Observations: Reported | ||||||||||||||||||||||||||||||||||||||||||||||||||||||||||
|
List of 10 Events for Episode 1 at SW flank (Rumoka), and summit
|
|||||||||||||||||||||||||||||||||||||||||||||||||||||||||||
1909 May - 1909 May Confirmed Eruption (Explosive / Effusive) VEI: 1 (?)
| Episode 1 | Eruption (Explosive / Effusive) | Summit caldera | |||||||||||||||||||||||
|---|---|---|---|---|---|---|---|---|---|---|---|---|---|---|---|---|---|---|---|---|---|---|---|---|
| 1909 May - 1909 May | Evidence from Observations: Reported | |||||||||||||||||||||||
|
List of 3 Events for Episode 1 at Summit caldera
|
||||||||||||||||||||||||
1908 Confirmed Eruption (Explosive / Effusive)
| Episode 1 | Eruption (Explosive / Effusive) | Summit caldera | |||||||||||||
|---|---|---|---|---|---|---|---|---|---|---|---|---|---|---|
| 1908 - Unknown | Evidence from Observations: Reported | |||||||||||||
|
List of 1 Events for Episode 1 at Summit caldera
|
||||||||||||||
1907 Nov 7 - 1907 Dec 5 Confirmed Eruption (Explosive / Effusive) VEI: 3
| Episode 1 | Eruption (Explosive / Effusive) | Summit caldera | ||||||||||||||||||||||||||||
|---|---|---|---|---|---|---|---|---|---|---|---|---|---|---|---|---|---|---|---|---|---|---|---|---|---|---|---|---|---|
| 1907 Nov 7 - 1907 Dec 5 | Evidence from Observations: Reported | ||||||||||||||||||||||||||||
|
List of 4 Events for Episode 1 at Summit caldera
|
|||||||||||||||||||||||||||||
1907 Apr - 1907 May Confirmed Eruption (Explosive / Effusive) VEI: 1
| Episode 1 | Eruption (Explosive / Effusive) | Summit caldera | |||||||||||||||||||||||
|---|---|---|---|---|---|---|---|---|---|---|---|---|---|---|---|---|---|---|---|---|---|---|---|---|
| 1907 Apr - 1907 May | Evidence from Observations: Reported | |||||||||||||||||||||||
|
List of 3 Events for Episode 1 at Summit caldera
|
||||||||||||||||||||||||
[ 1906 ] Uncertain Eruption
| Episode 1 | Eruption (Explosive / Effusive) | Summit caldera | ||||||||||||||||||
|---|---|---|---|---|---|---|---|---|---|---|---|---|---|---|---|---|---|---|---|
| 1906 - Unknown | Evidence from Unknown | ||||||||||||||||||
|
List of 2 Events for Episode 1 at Summit caldera
|
|||||||||||||||||||
1905 Jul 22 - 1905 Sep 25 (on or after) Confirmed Eruption (Explosive / Effusive) VEI: 2
| Episode 1 | Eruption (Explosive / Effusive) | East flank (Kanamaharagi) | ||||||||||||||||||||||||||||||||||||||
|---|---|---|---|---|---|---|---|---|---|---|---|---|---|---|---|---|---|---|---|---|---|---|---|---|---|---|---|---|---|---|---|---|---|---|---|---|---|---|---|
| 1905 Jul 22 - 1905 Sep 25 (on or after) | Evidence from Observations: Reported | ||||||||||||||||||||||||||||||||||||||
|
List of 6 Events for Episode 1 at East flank (Kanamaharagi)
|
|||||||||||||||||||||||||||||||||||||||
1904 Apr - 1904 May 16 (?) Confirmed Eruption (Explosive / Effusive) VEI: 2
| Episode 1 | Eruption (Explosive / Effusive) | SW flank (Nahimbi) | ||||||||||||||||||||||||||||||||||||||
|---|---|---|---|---|---|---|---|---|---|---|---|---|---|---|---|---|---|---|---|---|---|---|---|---|---|---|---|---|---|---|---|---|---|---|---|---|---|---|---|
| 1904 Apr - 1904 May 16 (?) | Evidence from Observations: Reported | ||||||||||||||||||||||||||||||||||||||
|
List of 6 Events for Episode 1 at SW flank (Nahimbi)
|
|||||||||||||||||||||||||||||||||||||||
1902 Apr 22 (?) Confirmed Eruption (Explosive / Effusive) VEI: 0
| Episode 1 | Eruption (Explosive / Effusive) | SSE fissure zone | ||||||||||||||||||
|---|---|---|---|---|---|---|---|---|---|---|---|---|---|---|---|---|---|---|---|
| 1902 Apr 22 (?) - Unknown | Evidence from Observations: Reported | ||||||||||||||||||
|
List of 2 Events for Episode 1 at SSE fissure zone
|
|||||||||||||||||||
1901 Confirmed Eruption (Explosive / Effusive) VEI: 2
| Episode 1 | Eruption (Explosive / Effusive) | East flank (Singiro) | ||||||||||||||||||||||||||||||||||||||
|---|---|---|---|---|---|---|---|---|---|---|---|---|---|---|---|---|---|---|---|---|---|---|---|---|---|---|---|---|---|---|---|---|---|---|---|---|---|---|---|
| 1901 - Unknown | Evidence from Observations: Reported | ||||||||||||||||||||||||||||||||||||||
|
List of 6 Events for Episode 1 at East flank (Singiro)
|
|||||||||||||||||||||||||||||||||||||||
1899 Feb Confirmed Eruption (Explosive / Effusive) VEI: 1
| Episode 1 | Eruption (Explosive / Effusive) | NNW fissure zone | |||||||||||||||||||||||
|---|---|---|---|---|---|---|---|---|---|---|---|---|---|---|---|---|---|---|---|---|---|---|---|---|
| 1899 Feb - Unknown | Evidence from Observations: Reported | |||||||||||||||||||||||
|
List of 3 Events for Episode 1 at NNW fissure zone
|
||||||||||||||||||||||||
1896 Confirmed Eruption (Explosive / Effusive) VEI: 1
| Episode 1 | Eruption (Explosive / Effusive) | |||||||||||||||||||
|---|---|---|---|---|---|---|---|---|---|---|---|---|---|---|---|---|---|---|---|
| 1896 - Unknown | Evidence from Observations: Reported | ||||||||||||||||||
|
List of 2 Events for Episode 1
|
|||||||||||||||||||
1894 Jun Confirmed Eruption (Explosive / Effusive) VEI: 2
| Episode 1 | Eruption (Explosive / Effusive) | ||||||||||||||||||||||||
|---|---|---|---|---|---|---|---|---|---|---|---|---|---|---|---|---|---|---|---|---|---|---|---|---|
| 1894 Jun - Unknown | Evidence from Observations: Reported | |||||||||||||||||||||||
|
List of 3 Events for Episode 1
|
||||||||||||||||||||||||
1882 Confirmed Eruption (Explosive / Effusive)
| Episode 1 | Eruption (Explosive / Effusive) | North flank | |||
|---|---|---|---|---|
| 1882 - Unknown | Evidence from Observations: Reported | |||
1865 Confirmed Eruption (Explosive / Effusive)
| Episode 1 | Eruption (Explosive / Effusive) | ||||
|---|---|---|---|---|
| 1865 - Unknown | Evidence from Observations: Reported | |||
1550 ± 100 years Confirmed Eruption (Explosive / Effusive)
| Episode 1 | Eruption (Explosive / Effusive) | |||||||||||||||||||
|---|---|---|---|---|---|---|---|---|---|---|---|---|---|---|---|---|---|---|---|
| 1550 ± 100 years - Unknown | Evidence from Isotopic: 14C (calibrated) | ||||||||||||||||||
|
List of 2 Events for Episode 1
|
|||||||||||||||||||
This compilation of synonyms and subsidiary features may not be comprehensive. Features are organized into four major categories: Cones, Craters, Domes, and Thermal Features. Synonyms of features appear indented below the primary name. In some cases additional feature type, elevation, or location details are provided.
Synonyms |
||||
| Nyamlagira | Nyamuragira | Namlagira | Girungo-Namlagira | ||||
Cones |
||||
| Feature Name | Feature Type | Elevation | Latitude | Longitude |
| Amani | Cone | |||
| Bihunde | Cone | 1630 m | 1° 21' 0.00" S | 29° 19' 0.00" E |
| Bishusha | Cone | 1° 28' 0.00" S | 29° 11' 0.00" E | |
| Buhubie | Cone | 1° 23' 0.00" S | 29° 8' 0.00" E | |
| Bukoli | Cone | 1° 21' 0.00" S | 29° 14' 0.00" E | |
| Gafuranindi | Cone | |||
| Gakararanga | Cone | |||
| Gasenyi | Cone | |||
| Gashovu | Cone | 2253 m | 1° 22' 0.00" S | 29° 7' 0.00" E |
| Gitebe | Cone | 1° 27' 0.00" S | 29° 15' 0.00" E | |
| Gituro
Kituro |
Cone | 1° 32' 0.00" S | 29° 9' 0.00" E | |
| Harakandi | Cone | |||
| Hembe | Cone | 1° 22' 0.00" S | 29° 10' 0.00" E | |
| Kadogo | Cone | |||
| Kagano | Cone | |||
| Kahinga Kabarinzi | Cone | |||
| Kahongole | Cone | 1° 24' 0.00" S | 29° 8' 0.00" E | |
| Kanamharagi | Cone | 1869 m | 1° 24' 0.00" S | 29° 18' 0.00" E |
| Kimanura | Cone | 1° 26' 0.00" S | 29° 18' 0.00" E | |
| Kimera | Cone | |||
| Kinyamuaga | Cone | 1° 22' 0.00" S | 29° 11' 0.00" E | |
| Kitazungurwa | Cone | |||
| Kitsimbanyi
Kitshimbany |
Cone | 1° 19' 0.00" S | 29° 8' 0.00" E | |
| Kituharu
Kirutale |
Cone | 1° 36' 0.00" S | 29° 6' 0.00" E | |
| Kivandimwe | Cone | |||
| Mashiga | Cone | 1° 27' 0.00" S | 29° 12' 0.00" E | |
| Mashumangabo | Cone | 2062 m | 1° 26' 0.00" S | 29° 17' 0.00" E |
| Mihaga | Cone | 1° 28' 0.00" S | 29° 15' 0.00" E | |
| Mihonga | Cone | 1° 37' 0.00" S | 29° 6' 0.00" E | |
| Mikombe | Cone | 1600 m | 1° 18' 0.00" S | 29° 16' 0.00" E |
| Muhuboli | Vent | 1° 33' 0.00" S | 29° 7' 0.00" E | |
| Murara | Cone | |||
| Muvo | Cone | 2217 m | 1° 21' 0.00" S | 29° 10' 0.00" E |
| Nahimbi | Cone | 1° 31' 0.00" S | 29° 7' 0.00" E | |
| Nyagashole | Cone | 1567 m | 1° 20' 0.00" S | 29° 19' 0.00" E |
| Nyambaramo | Cone | 1844 m | 1° 23' 0.00" S | 29° 18' 0.00" E |
| Nyasheke 1 | Cone | 2005 m | 1° 26' 0.00" S | 29° 18' 0.00" E |
| Nyasheke 2 | Cone | 1788 m | 1° 23' 0.00" S | 29° 19' 0.00" E |
| Nzuru | Cone | 1° 37' 0.00" S | 29° 6' 0.00" E | |
| Rugarama | Cone | |||
| Rugarambiro | Cone | |||
| Rumoka | Cone | 1° 35' 0.00" S | 29° 7' 0.00" E | |
| Shamuhiro | Cone | 2145 m | 1° 25' 0.00" S | 29° 16' 0.00" E |
| Shove
Tshove |
Cone | 1762 m | 1° 33' 0.00" S | 29° 6' 0.00" E |
| Shuli | Cone | 1° 21' 0.00" S | 29° 15' 0.00" E | |
| Singiro | Cone | |||
| Tshambene | Vent | 1° 26' 0.00" S | 29° 10' 0.00" E | |
| Tumayhini | Cone | |||
Craters |
||||
| Feature Name | Feature Type | Elevation | Latitude | Longitude |
| Ndakaza | Crater | 1° 23' 0.00" S | 29° 18' 0.00" E | |
| Shabubembe | Crater | 1° 23' 0.00" S | 29° 12' 0.00" E | |
 This February 1980 photo shows the wall of a pit crater within the summit caldera of Nyamuragira volcano. The rim of the 2 x 2.3 km caldera appears in the distance. Many changes to the morphology of the caldera floor have occurred as a result of the frequent historical eruptions of Nyamuragira since the mid-19th century.
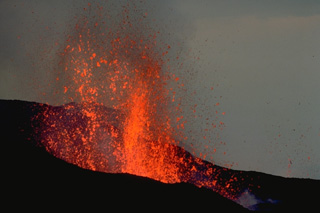 A new cinder cone, named Gasenyi, ejects fragments of incandescent lava in February 1980. The cone was formed during an eruption that began from a north-flank fissure on January 30. A 2-km-long fissure ejected scoria and ash and fed lava flows. In early February lava fountains were localized at the north end of the fissure and built Gasenyi cinder cone. On the 10th, new vents opened at the south flank of the cone. An explosion the next day destroyed this cone and produced a double-cratered cone.
 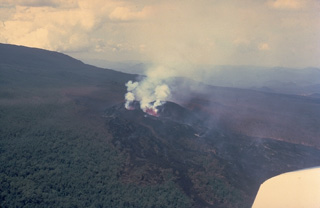 This February 18, 1980 aerial view shows a newly formed cinder cone on the north flank of Nyamuragira volcano. A lava flow traveling to the north (right) cuts through the forest below the cone. The eruption began from a new north-flank fissure between 1900 and 2000 hrs on January 30. Gasenyi cinder cone was formed and fed lava flows that traveled initially to the east. Another flow traveled down the north flank and reached 13 km to the NE. Activity declined on February 23 and ceased the next morning.
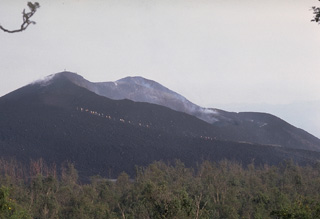 A group of African students on a field expedition ascends Gasenyi cinder cone on Nyamuragira on 23 February 1980, shortly before the end of an eruption that began on 30 January. The cinder cone formed at the beginning of February at the northern end of a 2-km-long fissure on the N flank. Lava flows from the cone traveled to the east, NW, and 13 km down the NE flank.
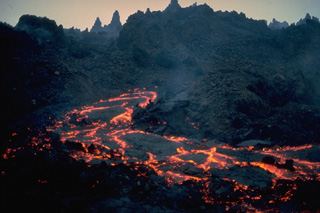 An active incandescent lava channel appears on the spine-covered surface of a rugged aa lava flow at Nyamuragira volcano on January 7, 1982. During this eruption, which began on December 25, 1981, a fissure on the SE flank produced a lava flow that within a few days was 400-m wide. It traveled 26 km through forests on the volcano's NE flanks. This was the longest historical lava flow from Nyamuragira. Substantial tephra emission during the eruption damaged vegetation.
 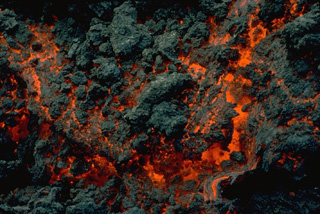 Incandescent lava is visible in the advancing front of an aa lava flow from Nyamuragira on 8 January 1982. The dark irregular areas are already-solidifed masses that can be carried along by the flow and then break off, forming the rough, clinkery surface of aa flows. The December 1981 to January 1982 eruption produced the volcano's longest historical lava flow, which traveled 26 km from its SE-flank vent.
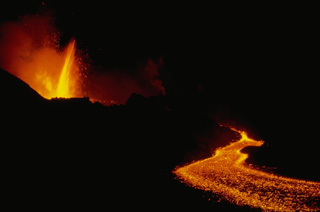 An eruption began on December 25, 1981 from a 1.5-km-long fissure at 2070 m elevation about 7 km SE of the summit caldera of Nyamuragira. Lava fountains were soon confined to the lower end of the fissure. This January 9, 1982 photo shows lava fountaining at the vent, which is feeding a lava flow that traveled 26 km down the NE flank. This marked the longest historical lava flow of Nyamuragira. Tephra fall destroyed vegetation, resulting in the death of cattle and animals, although no villages were damaged. The eruption ended on January 14.
 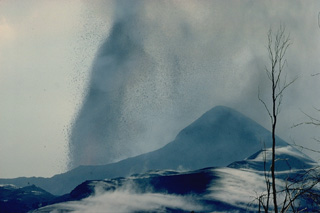 An explosive eruption from a SE-flank vent of Nyamuragira produces a powerful vertical fountain above the vent at the left. Ash and scoria are blown by winds to the right, where they have accumulated to form the rim of a cinder cone. Hot pyroclastic-fall deposits steam in the foreground of this January 1981 photo. This eruption, which began in December 1981 and ended the following month, produced a large aerosol cloud that was tracked around the globe and produced brilliant sunsets in the following months.
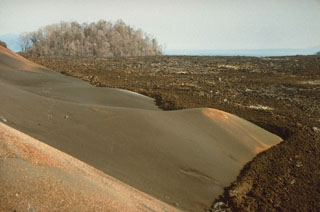 A lava flow from the April-August 1989 eruption around a scoria cone in this 2 December 1989 view. The eruption scorched vegetation on an older cone at the upper left that is now surrounded by the lava. The 1989 lava flow traveled about 20 km to the north.
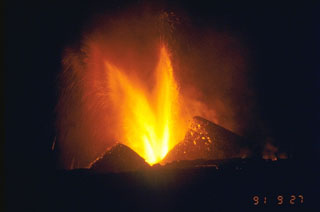 An eruption began on 20 September 1991 on the NE flank, 15 km from the summit. This was the northernmost historical eruption site of Nyamuragira. Lava fountaining from the new Mikombe cone is seen here on 26 September (the 27 September date-time stamp is in Japan Standard Time). Lava flows extended 6-7 km to the NE, cutting the road to Tongo. The eruption became more explosive on 20 November, and by July 1992 had built 26 scoria cones along a NE-trending fissure zone. The eruption continued until 8 February 1993.
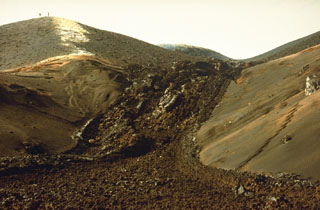 A lava flow from the April-August 1989 eruption on the east flank of Nyamuragira is seen in this December 1989 view. Low levees bank against the side of the cone. People on the cone on the left horizon provide scale.
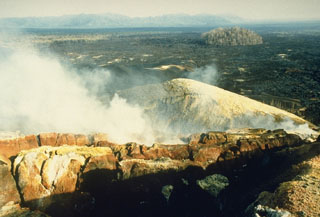 Steam rises from Kimanura scoria cone, which was formed during an eruption from April to August 1989 on the E flank of Nyamuragira. This December 1989 photo looks N across a black lava flow that had traveled about 20 km down the N flank. The flow diverted around a forested "kipuka" of an older cone (upper right), scorching leaves but not burning the trees. The Kimanura vent was the lowest of three that were active in 1989. A small fissure in the summit caldera and another on the upper SE flank also produced lava flows.
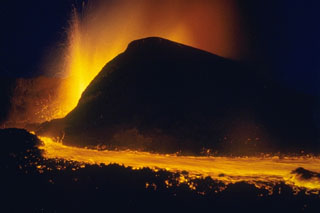 Lava fountains from the new cone of Mikombe on the lower NE flank of Nyamuragira volcano feed the lava flow in the foreground. This photo was taken from the SE on 29 September, nine days after the start of the eruption. During the first week the new cone grew to a height of 60-70 m. Lava flows had traveled 6-7 km NE by the time of this photo. The eruption continued until February 1993, by which time lava flows had traveled 19 km NE.
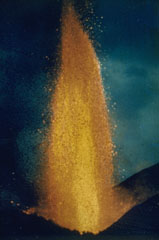 A lava fountain rises above the Kitazungurwa vent on the S flank of Nyamuragira on 1 August 1986. This eruption began on 16 July from a vent 4.5 km from the southern rim of the caldera. It produced lava flows that traveled to the SW to within a few kilometers of Lake Kivu.
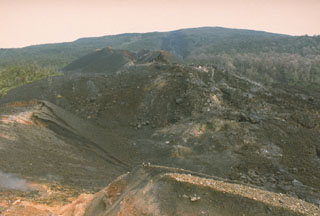 The summit of the broad Nyamuragira shield volcano is seen here in 1990 from a vent on the upper SE flank. Lava flows from Nyamuragira cover 1,500 km2 of the East African Rift. The summit is truncated by a small 2 x 2.3 km summit caldera. Historical eruptions have occurred within the summit caldera and from the numerous fissures and scoria cones on the flanks.
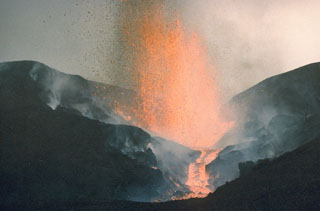 An eruption from a SSW-flank fissure 16 July to 20 August 1986, produced the Kitazungurwa scoria cone and a lava flow that traveled 19 km down the SW flank. The lava flow partially covered the SW-flank lavas from the 1976-77 Murara eruption. On 18 August the eruption changed from continuous lava fountaining to Strombolian activity. Crops were destroyed by hot ejecta and 150 cattle died from ingestion of ash-covered vegetation.
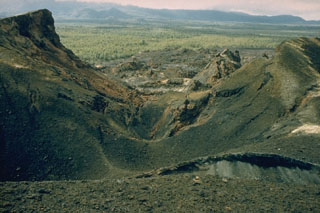 The 1986 Kitazungurwa fissure is seen in this 1987 photo. The south flank eruption produced a scoria cone and a lava flow that traveled 19 km down the SW flank. The flow traveled to within 2 km of the highway along the north shore of Lake Kivu between Goma and Sake.
 Major humanitarian crises in eastern Africa played out in areas near Nyiragongo and Nyamuragira volcanoes. This August 1994 photo of the Kitumba refugee camp shows a Rwandan family living in a lava tube on a flow on the SW flank of Nyamuragira volcano with tarps of other shelters in the densely occupied refugee camp beyond. Nyiragongo volcano appears on the right skyline.
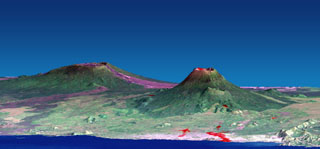 This combined NASA Landsat and Shuttle Radar Topography Mission image shows Nyamuragira (left) and Nyiragongo (right) volcanoes rising north of Lake Kivu in the East African Rift Valley. Red areas on Nyiragongo mark the locations of January 2002 flank-vent lava flows, some of which descended through the city of Goma into Lake Kivu. Historical lavas descend from Nyamuragira shield volcano, some of which also reached the lake. Both volcanoes are truncated by small calderas.
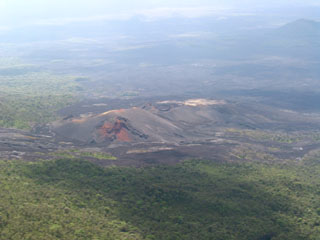 An aerial view of the SE flank of Nyamuragira shows scoria cones that may have formed during an eruption in 2000. The eruption began the morning of 27 January from a fissure on the SE flank near the site of the 1989 eruption, and included explosive activity and lava effusion. Activity diminished by the 31st, but satellite imagery showed thermal anomalies from lava flows on 10 February.
 An evening view from the crater rim of Nyiragongo volcano looks across the floor of the East African Rift at Nyamuragira volcano. The shield volcano is one of Africa's most active volcanoes, producing more than three dozen eruptions since the mid-19th century.
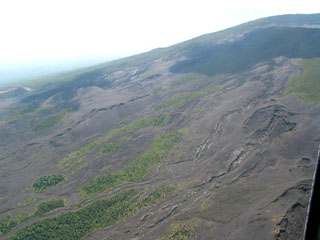 Lava flows from historical eruptions blanket the NW flank of Nyamuragira volcano. Lava flows issuing from radial fissures surround vegetated kipukas. Several major NW-flank eruptions took place in the late-20th century, producing lava flows that reached as far as about 20 km from the summit caldera.
 The summit of Nyamuragira volcano is truncated by 2 x 2.3 km wide caldera whose floor is partially covered by unvegetated historical lava flows. This view from above the SW caldera rim shows a crater on the far side of the caldera (upper left) that was the site of a lava lake, active since at least 1921, which drained in 1938 at the time of a major flank eruption.
 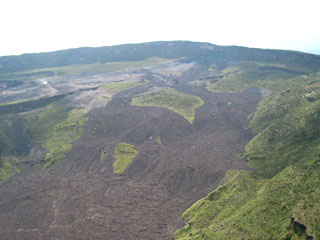 Recent lava flows surround vegetated kipukas on the caldera floor of Nyamuragira volcano in this view from the SW caldera rim. The 2 x 2.3 km wide caldera has walls about 100 m high. A prominent scarp in the middle of the caldera floor at the far left is the rim of a partially buried crater. Historical eruptions have frequently modified the morphology of the caldera floor.
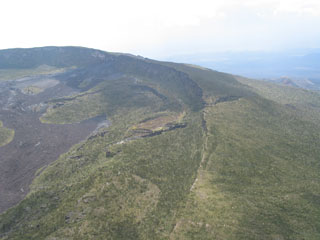 A fissure (center) cuts the SE caldera rim of Nyamuragira. Several historical eruptions have occurred from both summit and flank vents and have produced lava flows that covered portions of the caldera floor and traveled long distances down the flanks of the volcano.
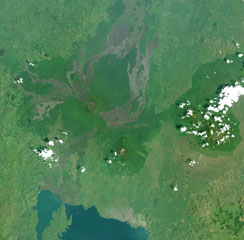 This Landsat image shows a portion of the East African Rift north of Lake Kivu (bottom), with N to the upper left. Unvegetated lava flows descend from vents on the summit and flanks, some reaching the shores of Lake Kivu. The forested volcano below and to the right is Nyiragongo, a volcano that frequently contains an active lava lake. Lava flows from flank fissures in 2002 cut across the city of Goma (the light-colored area at the right-hand side of the lake).
The following 63 samples associated with this volcano can be found in the Smithsonian's NMNH Department of Mineral Sciences collections, and may be availble for research (contact the Rock and Ore Collections Manager). Catalog number links will open a window with more information.
| Catalog Number | Sample Description | Lava Source | Collection Date |
|---|---|---|---|
| NMNH 109263-1 | Basanite | -- | -- |
| NMNH 109263-2 | Basanite | -- | -- |
| NMNH 109263-3 | Basanite | -- | -- |
| NMNH 109263-4 | Basanite | -- | -- |
| NMNH 109263-5 | Basanite | -- | -- |
| NMNH 109264-1 | Basanite | -- | -- |
| NMNH 109264-10 | Basanite | -- | -- |
| NMNH 109264-11 | Basanite | -- | -- |
| NMNH 109264-12 | Basanite | -- | -- |
| NMNH 109264-13 | Basanite | -- | -- |
| NMNH 109264-14 | Basanite | -- | -- |
| NMNH 109264-15 | Basanite | -- | -- |
| NMNH 109264-2 | Basanite | -- | -- |
| NMNH 109264-3 | Basanite | -- | -- |
| NMNH 109264-4 | Basanite | -- | -- |
| NMNH 109264-5 | Basanite | -- | -- |
| NMNH 109264-6 | Basanite | -- | -- |
| NMNH 109264-7 | Basanite | -- | -- |
| NMNH 109264-8 | Basanite | -- | -- |
| NMNH 109264-9 | Basanite | -- | -- |
| NMNH 109265-1 | Basanite | GITURO | -- |
| NMNH 109265-10 | Basanite | GITURO | -- |
| NMNH 109265-11 | Basanite | GITURO | -- |
| NMNH 109265-2 | Basanite | GITURO | -- |
| NMNH 109265-3 | Basanite | GITURO | -- |
| NMNH 109265-4 | Basanite | GITURO | -- |
| NMNH 109265-5 | Basanite | GITURO | -- |
| NMNH 109265-6 | Basanite | GITURO | -- |
| NMNH 109265-7 | Basanite | GITURO | -- |
| NMNH 109265-8 | Basanite | GITURO | -- |
| NMNH 109265-9 | Basanite | GITURO | -- |
| NMNH 109266-1 | Leucite Basanite | -- | -- |
| NMNH 109266-10 | Leucite Basanite | -- | -- |
| NMNH 109266-11 | Leucite Basanite | -- | -- |
| NMNH 109266-12 | Leucite Basanite | -- | -- |
| NMNH 109266-13 | Leucite Basanite | -- | -- |
| NMNH 109266-14 | Leucite Basanite | -- | -- |
| NMNH 109266-15 | Leucite Basanite | -- | -- |
| NMNH 109266-16 | Leucite Basanite | -- | -- |
| NMNH 109266-2 | Leucite Basanite | -- | -- |
| NMNH 109266-3 | Leucite Basanite | -- | -- |
| NMNH 109266-4 | Leucite Basanite | -- | -- |
| NMNH 109266-5 | Leucite Basanite | -- | -- |
| NMNH 109266-6 | Leucite Basanite | -- | -- |
| NMNH 109266-7 | Leucite Basanite | -- | -- |
| NMNH 109266-8 | Leucite Basanite | -- | -- |
| NMNH 109266-9 | Leucite Basanite | -- | -- |
| NMNH 112508 | Basalt | -- | -- |
| NMNH 112509 | Basalt | -- | -- |
| NMNH 112510 | Basalt | -- | -- |
| NMNH 112511-1 | Basalt | -- | -- |
| NMNH 112511-2 | Basalt | -- | -- |
| NMNH 112512 | Pumice | -- | -- |
| NMNH 112513 | Volcanic Ash | -- | -- |
| NMNH 112514 | Volcanic Ash | -- | -- |
| NMNH 112515 | Glass | -- | -- |
| NMNH 116625 | Volcanic Ash | -- | 6 Jul 1994 |
| NMNH 116691-25 | Volcanic Bomb | FISSURE OF GASENYI CONE | -- |
| NMNH 116691-26 | Leucite Basanite | GASENYI CONE | 1 Feb 1980 |
| NMNH 116691-27 | Limburgite | RUGARAMBIRO CONE | 1 Jan 1982 |
| NMNH 117578-10 | Basalt | -- | -- |
| NMNH 117578-12 | Basalt | -- | -- |
| NMNH 117578-5 | Basalt | Rumoka | -- |
| Copernicus Browser | The Copernicus Browser replaced the Sentinel Hub Playground browser in 2023, to provide access to Earth observation archives from the Copernicus Data Space Ecosystem, the main distribution platform for data from the EU Copernicus missions. |
| MIROVA | Middle InfraRed Observation of Volcanic Activity (MIROVA) is a near real time volcanic hot-spot detection system based on the analysis of MODIS (Moderate Resolution Imaging Spectroradiometer) data. In particular, MIROVA uses the Middle InfraRed Radiation (MIR), measured over target volcanoes, in order to detect, locate and measure the heat radiation sourced from volcanic activity. |
| MODVOLC Thermal Alerts | Using infrared satellite Moderate Resolution Imaging Spectroradiometer (MODIS) data, scientists at the Hawai'i Institute of Geophysics and Planetology, University of Hawai'i, developed an automated system called MODVOLC to map thermal hot-spots in near real time. For each MODIS image, the algorithm automatically scans each 1 km pixel within it to check for high-temperature hot-spots. When one is found the date, time, location, and intensity are recorded. MODIS looks at every square km of the Earth every 48 hours, once during the day and once during the night, and the presence of two MODIS sensors in space allows at least four hot-spot observations every two days. Each day updated global maps are compiled to display the locations of all hot spots detected in the previous 24 hours. There is a drop-down list with volcano names which allow users to 'zoom-in' and examine the distribution of hot-spots at a variety of spatial scales. |
|
WOVOdat
Single Volcano View Temporal Evolution of Unrest Side by Side Volcanoes |
WOVOdat is a database of volcanic unrest; instrumentally and visually recorded changes in seismicity, ground deformation, gas emission, and other parameters from their normal baselines. It is sponsored by the World Organization of Volcano Observatories (WOVO) and presently hosted at the Earth Observatory of Singapore.
GVMID Data on Volcano Monitoring Infrastructure The Global Volcano Monitoring Infrastructure Database GVMID, is aimed at documenting and improving capabilities of volcano monitoring from the ground and space. GVMID should provide a snapshot and baseline view of the techniques and instrumentation that are in place at various volcanoes, which can be use by volcano observatories as reference to setup new monitoring system or improving networks at a specific volcano. These data will allow identification of what monitoring gaps exist, which can be then targeted by remote sensing infrastructure and future instrument deployments. |
| Volcanic Hazard Maps | The IAVCEI Commission on Volcanic Hazards and Risk has a Volcanic Hazard Maps database designed to serve as a resource for hazard mappers (or other interested parties) to explore how common issues in hazard map development have been addressed at different volcanoes, in different countries, for different hazards, and for different intended audiences. In addition to the comprehensive, searchable Volcanic Hazard Maps Database, this website contains information about diversity of volcanic hazard maps, illustrated using examples from the database. This site is for educational purposes related to volcanic hazard maps. Hazard maps found on this website should not be used for emergency purposes. For the most recent, official hazard map for a particular volcano, please seek out the proper institutional authorities on the matter. |
| IRIS seismic stations/networks | Incorporated Research Institutions for Seismology (IRIS) Data Services map showing the location of seismic stations from all available networks (permanent or temporary) within a radius of 0.18° (about 20 km at mid-latitudes) from the given location of Nyamulagira. Users can customize a variety of filters and options in the left panel. Note that if there are no stations are known the map will default to show the entire world with a "No data matched request" error notice. |
| UNAVCO GPS/GNSS stations | Geodetic Data Services map from UNAVCO showing the location of GPS/GNSS stations from all available networks (permanent or temporary) within a radius of 20 km from the given location of Nyamulagira. Users can customize the data search based on station or network names, location, and time window. Requires Adobe Flash Player. |
| DECADE Data | The DECADE portal, still in the developmental stage, serves as an example of the proposed interoperability between The Smithsonian Institution's Global Volcanism Program, the Mapping Gas Emissions (MaGa) Database, and the EarthChem Geochemical Portal. The Deep Earth Carbon Degassing (DECADE) initiative seeks to use new and established technologies to determine accurate global fluxes of volcanic CO2 to the atmosphere, but installing CO2 monitoring networks on 20 of the world's 150 most actively degassing volcanoes. The group uses related laboratory-based studies (direct gas sampling and analysis, melt inclusions) to provide new data for direct degassing of deep earth carbon to the atmosphere. |
| Large Eruptions of Nyamulagira | Information about large Quaternary eruptions (VEI >= 4) is cataloged in the Large Magnitude Explosive Volcanic Eruptions (LaMEVE) database of the Volcano Global Risk Identification and Analysis Project (VOGRIPA). |
| EarthChem | EarthChem develops and maintains databases, software, and services that support the preservation, discovery, access and analysis of geochemical data, and facilitate their integration with the broad array of other available earth science parameters. EarthChem is operated by a joint team of disciplinary scientists, data scientists, data managers and information technology developers who are part of the NSF-funded data facility Integrated Earth Data Applications (IEDA). IEDA is a collaborative effort of EarthChem and the Marine Geoscience Data System (MGDS). |