


Four years of inflation interrupted by deflation
Krafla last erupted in September 1984 (9:8 and 10-11) and slow, intermittent inflation has been recorded since early 1985. Tilt records (figure 12) show three inflationary pulses since January 1988. Each lasted 2-3 months and was accompanied by increased seismicity. The inflation rate was generally 1-2 mm/day at the center of deformation, indicating a magma flow rate of ~1 m3/s into Krafla's shallow magma reservoir. Slow deflation was observed March-May 1989, accelerating 20-30 May to a rate similar to the previous inflation. No unusual seismicity or surface activity was associated with the deflation.
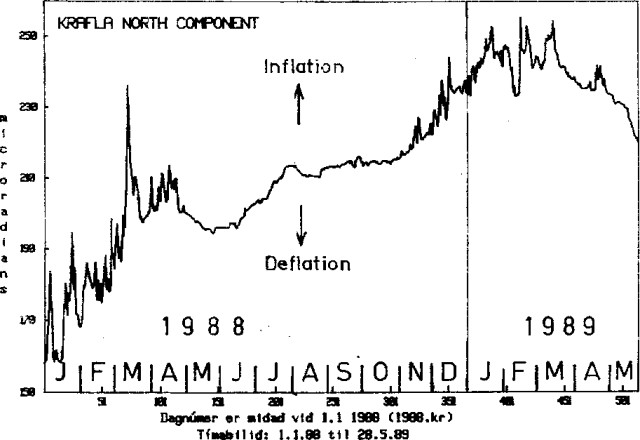 |
Figure 12. North component of tilt recorded January 1988-May 1989 at the Krafla power station, ~1.5 km S of the center of the deformation. Inflation is uplift toward then N. Courtesy of Eysteinn Tryggvason. |
Information Contacts: E. Tryggvason, NVI.
The Global Volcanism Program has no Weekly Reports available for Krafla.
Reports are organized chronologically and indexed below by Month/Year (Publication Volume:Number), and include a one-line summary. Click on the index link or scroll down to read the reports.
Minor steam eruption and lava flow
A minor eruption consisting mainly of steam began at about 1120 on 20 December. A small lava flow also occurred. The eruption was preceded by minor local earthquakes that began at about 1000. A 2-km-long fissure opened, and lava was erupted from three vents. The main lava flow lasted for 1 hour, and the eruption was essentially over by 1700 that same day.
Information Contacts: H. Sigtryggsson, Icelandic Meteorological Office.
Increased seismicity from early July through mid-September
More than 2 m of subsidence occurred in a 2-3 km2 roughly circular area, immediately E of Leirhnjúkur (about 4 km W of Krafla; figure 1), between 20 December 1975, the first day of a minor eruption of Leirhnjúkur, and the end of January, 1976. Subsidence was followed by uplift of about 6.5 mm/day, beginning in February and continuing to the present (figure 2).
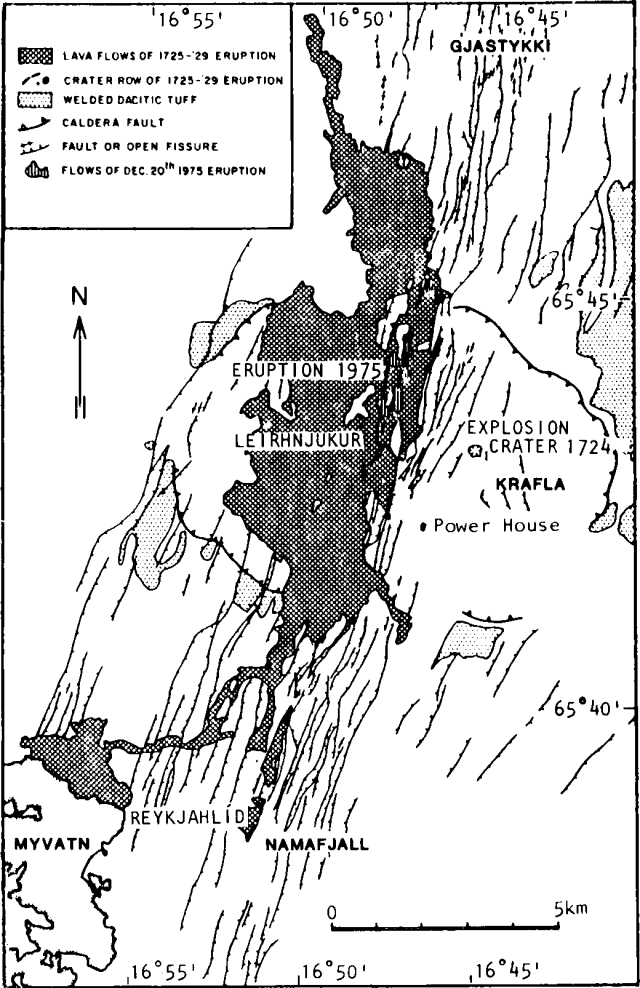 |
Figure 1. Outline geologic map of Krafla caldera and the associated fault swarm. Note that Leirhnjúkur is a feature within tha caldera and that Lake Mývatn intercepts a portion of the fault swarm. From Björnsson and others (1977). |
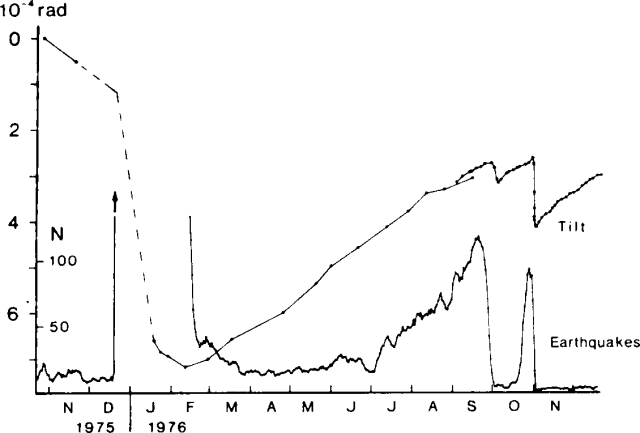 |
Figure 2. Deformation and seismicity at Krafla caldera, November 1975-November 1976. A) N-S component of tilt at the Krafla power house; increasing numbers mean tilt down towards the N. B) 5-day running average of the number of earthquakes per day recorded at the seismic station near Reykjahlíd. Tilt was measured by precision levelling until August 1976, after which a conventional "wet" titlmeter (79 m base) was used. From Björnsson and others (1977). |
The area of subsidence and subsequent uplift is thought to be underlain by a magma chamber about 3 km in diameter with its roof at about 3 km depth. Assuming that the cause of uplift was flow of magma from below into the chamber, velocity of flow was of the order of 4-4.5 m3/s.
The number of earthquakes per day in the area (figure 2) has increased considerably since early July, although remaining an order of magnitude less than the 1500/day experienced in January, then decreased rapidly in the last days of September.
Reference. Björnsson, A., Saemundsson, K., Einarsson, P., Tryggvason, E., and Grönvold, K., 1977, Current rifting episode in north Iceland: Nature, v. 266, p. 318-323.
Information Contacts: H. Sigtryggsson, Icelandic Meteorological Office.
Details of seismicity and deformation associated with 20 January magma intrusion
On 20 January a remarkable intrusion of magma was documented in N Iceland, one of a series of similar events during the last year [September and October/November] that are being carefully studied by virtually all geoscientists in Iceland. For a detailed account see Björnsson and others (1977).
On 20 December 1975, intense earthquake activity began in Krafla caldera, 10 km N of Lake Mývatn in N Iceland. Within half an hour a volcanic eruption had occurred, producing a minor lava flow (1:3). During the following 2 hours, earthquake activity propagated along 40 km of a fissure system N of the caldera. Horizontal ground movement of the order of 1 m and vertical displacement of the same magnitude were recorded within the fissure zone. Within Krafla caldera, a subsidence of 2.5 m was measured by precision levelling relative to Lake Mývatn. A high level of earthquake activity (maximum magnitude 6.3) continued within and N of Krafla caldera until mid-February. In March, significant inflation was recorded within Krafla caldera, and drastic chemical changes were noted in both drillhole and fumarole emissions from the caldera's geothermal field. While inflation continued at a steady rate, earthquake activity remained low and constant until July, when the number of seismic events started to increase. This activity culminated at the end of September, with rapid deflation of the Krafla area, accompanied by harmonic tremor and migration of hypocenters 20 km northward along the fissure system.
Seismic activity discontinued with this deflation event, but inflation started again immediately. When the ground level reached the same position as before the deflation event, seismic activity rapidly increased again. This cycle culminated, at the end of October, with another (and much greater) deflation event, accompanied by the same seismic behavior as before.
As with the two earlier deflations, inflation started immediately, and at the same rate as before. This rate, when combined with the measured amount of deflation, enabled geologists to estimate exactly the timing of the third event, which started shortly after midnight on 20 January, 1977. Tilt measurements indicated a deflation of the order of 100 µrad during 12 hours, accompanied by continuous harmonic tremor and frequent earthquakes that migrated in the same direction as on previous occasions. This deflation, however, lasted for less than 24 hours (in contrast to five days for the September and two days for the October deflation) and only 12 km of the fissure system was active this time. Surface fissures to 40 cm in width were measured in the snow, and fuming (water only) was observed along the active zone. After deflation, surface geothermal activity was limited to the end of the 12 km fissure system farthest from Krafla caldera.
The last major eruption in the area, the Mývatn fires, occurred in 1724-29. The activity culminated during the last two years of the 5-year period with voluminous outpouring of basaltic lava covering 35 km2. Contemporary descriptions of these events indicate some similarities with the current behavior at Krafla. Using the same "inflation" approach they used successfully in November, Icelandic geologists are predicting the next deflation event on 20 March 1977.
Information Contacts: G. Sigvaldason, NVI.
Inflation begins again along with an increase in seismicity
After the deflation event of 20 January 1977, the Krafla caldera started inflating gain. The rate of uplift near the center was about 10 mm/day. Earthquake activity was at a minimum after the 20 January deflation. During the first week of March the earthquake activity increased again, and during March there have been 100-150 earthquakes per day compared to 100/day prior to the January deflation event, all confined within the caldera. The largest earthquakes are of magnitude 3.6. This increase in seismic activity was predicted two weeks in advance based on the inflation rate of 20 January. One of the fissures monitored during the last few months showed significant widening during the last two inflation periods and contraction during deflation. This fissure is now widening at a slowly increasing rate (Björnsson and others, 1977).
Information Contacts: K. Grönvald, NVI.
Fissure eruption on 27 April causes ashfall and lava flows
Inflation at Krafla continued irregularly until late April, while 100-130 earthquakes were recorded per day (figure 3).
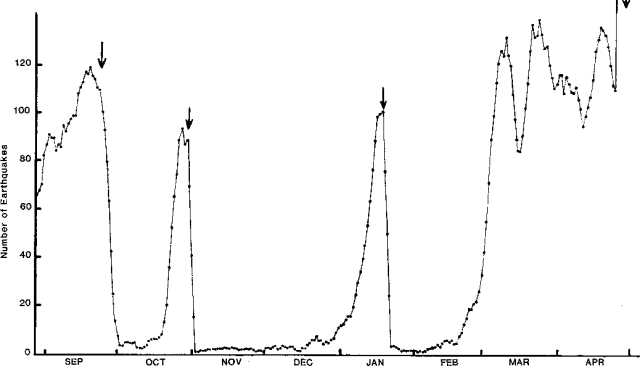 |
Figure 3. Five-day running average of the number of earthquakes per day at Krafla caldera, September 1976-April 1977. Deflation events are shown by down-arrows. Courtesy of Páll Einarsson. |
Harmonic tremor began at 1317 on 27 April, followed at about 1400 by series of earthquakes centered in a fissure swarm S of Krafla. About one magnitude 3.5-4.5 event occurred per minute during the swarm, which culminated at 1830. An eruption from a discontinuous fissure extending 3 km N from Leirhnjúkur (about 4 km W of Krafla) had begun before 1600, when a minor ashfall was recorded in the Mývatn area (about 10 km SW of Krafla). A 200 x 40 m lava flow was extruded from the N end of the fissure and steam and mud along the rest of its length. Tilt measurements indicate a 1-m subsidence of the caldera bottom in 17 hours, then renewed inflation after subsidence ended. New 2-m-wide fissures opened and fumarolic activity began in the Mývatn area, where more than 1 m of vertical displacement occurred, causing damage at a factory. Earthquakes continued on 1 May, but were declining.
Information Contacts: G. Sigvaldason, NVI; P. Einarsson, Univ. of Iceland; H. Sigtryggsson, Icelandic Meteorological Office.
Decline in seismicity following deflation event much less than after prior episodes
Caldera floor inflation of about 1 cm/day resumed on 29 April, two days after the 27 April deflation event. Seismicity has declined to 400-1,000 events per day, in contrast to rapid declines after previous deflation episodes to less than 10 events/day (figure 3). Hydrothermal activity remained higher than before 27 April.
Information Contacts: G. Sigvaldason, NVI; P. Einarsson, Univ. of Iceland.
Steady inflation as seismicity continues to decrease
Inflation has continued at a uniform rate. Seismicity has declined from 400-1,000 earthquakes per day in late May to 100-150/day in late June. All earthquakes have been located S of the caldera, where maximum deformation occurred during the 27 April deflation event.
Information Contacts: G. Sigvaldason, NVI.
Continued inflation; significant increase in gas discharge
"Inflation in the central part of the Krafla caldera continues. The rate is 6-7 mm/day, similar to that of previous inflation periods. In the fault swarm S of the caldera (Námafjall), where maximum deformation occurred during the 27 April deflation, seismicity has decreased still further. Significant increase in gas discharge, accompanied by an increase in CO2, has taken place. So far, there are no signs that the activity in the Krafla area is decreasing."
Information Contacts: K. Grönvold, NVI.
Inflation continues; steam explosions on 2 August
"Inflation continues in the Krafla caldera at a similar rate as before, with seismic activity still at a minimum. During the evening of 2 August, steam explosions started at the northern end of Leirhnjúkur, near the site of the 20 December 1975 eruption (1:3)."
Information Contacts: K. Grönvold, NVI.
Deflation accompanied by a basaltic eruption and fault movements
Krafla caldera deflated on 8 September, accompanied by a short basaltic eruption and large scale movement on faults S of the caldera. Since the 27 April deflation (2:4) the center of the caldera had inflated about 6-7 mm/day, and by 8 September had returned to approximately the pre-27 April elevation. An increase in the number of earthquakes within the caldera, which had preceded earlier deflation events, did not occur prior to the 8 September deflation.
Chronology of [8 September 1977] events. 1547: First appearance on seismographs of continuous harmonic tremor, coinciding with the beginning of deflation.
1800: Effusive eruption began from a 900-m fissure N of the caldera rim, just N of the 27 April eruption site. By just after 2000, lava flows had reached their maximum extent, covering about 0.8 km2. The eruption had ceased by [2230].
[2240]: Beginning of movement on faults in the Námafjall area, S of the caldera and about 14 km from the eruption site. The earthquakes were centered 3-4 km closer to the caldera than during the 27 April event, but many of the same faults were active. A few cubic meters of extremely glassy vesicular scoria were erupted from an 1,134-m drillhole in the Námafjall area during the earthquake swarm.
After two days of deflation, inflation of the caldera resumed and was continuing in late September at the pre-deflation rate. The fault zone in the Námafjall area has widened more than 1 m since August. Old thermal fields show increased activity and new fields have developed. Parts of the diatomite factory near Námafjall were severely damaged and some of the steam drillholes were seriously affected, but there were no accidents or injuries.
Further References. Brandsdottir, B., and Einarsson, P., 1979, Seismic activity associated with the September 1977 deflation of the Krafla central volcano in northeastern Iceland: JVGR, v. 6, p. 197-212.
Larsen, G., Grönvold, K., and Thorarinsson, S., 1979, Volcanic eruption through a geothermal borehole at Námafjall, Iceland: Nature, v. 278, p. 707-710.
Information Contacts: G. Sigvaldason, NVI.
Inflation resumes
After the eruption and deflation of 8 September, inflation of Krafla caldera resumed, and has continued at the pre-8 September rate. Dry tilt measurements indicated a complicated pattern of deformation. Repeated levelling showed that the caldera bottom had reached the pre-8 September elevation by mid-October.
During the 8 September event, magma was injected less than 1,200 m beneath the thermal areas, as shown by one drill hole that ejected tephra for half an hour. Since then, thermal activity at Námafjall has increased conspicuously, making access to the area difficult. This fall farmers in the area literally harvested boiled potatoes!
Remeasuring of geodimeter lines in late October indicated continued rifting of the fissure system, amounting to 20 cm since 15 September. Seismic activity is presently at a minimum, as was the case before the 8 September event. Renewed volcanic activity is expected before the end of November.
Information Contacts: G. Sigvaldason, NVI.
Harmonic tremor, deflation, and increased geothermal activity
"Two continuously recording tiltmeters, of a new type designed and built by the Nordic Volcanological Institute, have been installed in the Krafla-Mývatn area. One, close to the power house in Krafla, has been in operation since August, and replicates the water tiltmeter which has been operated at this location for over a year. A second tiltmeter was installed in late October close to a hotel at Reykjahlid and the recorders are placed at a nearby temporary observatory. This tiltmeter shows inflation towards the SE, confirming inflation between Reykjahlid and Hverfjall (just off figure 1, SE of Reykjahlid and SW of Námafjall) discovered by dry tilt levelling in October.
"At 0600 on 2 November, all seismometers started to show harmonic tremor, the continuous tiltmeter in Krafla showed deflation towards the NW, and the Reykjahlid tiltmeter a slight deflation towards the SE. At about noon, both harmonic tremor and deflation in Krafla had stopped. Total deflation within the caldera was about 3 cm and had been fully reversed by 5 November. The 8 September tilt change at the Krafla power house should be fully reversed by early December. Only a few small earthquakes were recorded, none of which was felt. Increased thermal activity in Gjástykki, N of the 8 September eruption site (2:9), indicated magma intrusion N of the caldera.
"At Lake Mývatn, geothermal activity has increased and steam causes considerable problems in the area. The main road to eastern Iceland passes through the steam field, where visibility is usually only a couple of meters. The Mývatn area is enveloped in fog in calm weather, and, with the advent of winter, telephone and power lines are continuously threatened by accumulating ice. The diatomite factory near Mývatn has now been encircled by a dam 3-4 m high in order to divert lava flows. Equipment for water pumping has been installed on the dam for additional security. Civil defense is in a state of top alertness, access roads have been partially rebuilt to insure that they can be kept passable under any weather conditions, and the telecommunication system has been greatly improved."
Information Contacts: G. Sigvaldason, NVI.
Inflation continues at a rate similar to previous months
Inflation continued at Krafla during December, at a rate similar to that recorded during the previous month. However, the focus of inflation has changed, and, although the amount of inflation significantly exceeds that which triggered earlier deflation events, no deflation had occurred by early January and seismicity remained at a minimum.
Information Contacts: G. Sigvaldason, NVI.
New inflation event 6-22 January
Renewed deflation at Krafla began on 6 January and continued through 22 January. Uplift then resumed and was continuing in early February.
On 6 January at 1700 the continuously recording tiltmeter at Krafla started to show slight deflation towards the N. The next morning at 0700, the rate of deflation increased and half an hour later harmonic tremor began. The rate of deflation (9.4 µrad/hour) was considerably slower than in previous events. In the following hours, it became evident from earthquake locations that magma injection into the fissure system N of Krafla was occurring. Epicenters migrated to 30 km N of Krafla on 7 January and had migrated 10 km farther N by the 9th, affecting the December 1975 rift zone (Björnsson and others, 1977). The number of earthquakes gradually decreased 8-10 January, but magnitudes increased, reaching a maximum of 4.8.
Deflation ended 22 January after subsidence equivalent to about 110 cm had been recorded. Uplift then resumed, but has been interrupted several times, coinciding with periods of volcanic tremor. Earthquakes, many with magnitudes greater than 4, were continuing in early February from the rift zone, 25-50 km N of Krafla. The amount of rifting has not been measured, but about 2 m were added to telephone lines crossing the rift zone. Roads crossing the rift zone became impassable on several occasions, and one farmhouse was seriously damaged due to the opening of a ground fissure beneath it. No marked change in geothermal activity has been observed, and no visible eruption has occurred.
Information Contacts: G. Sigvaldason, NVI.
Inflation continues, after intrusion of 80 x 106 m3 in January
"Since 22 January, the center of Krafla caldera has been inflating at a similar rate as before. It is expected that the level at which previous deflation events were triggered could be reached near the end of June. The center of the January rifting is about 40 km N of the center of Krafla caldera. Large-scale rifting took place as in previous events, but weather conditions have prevented detailed measurements. The volume of magma estimated to have left the central reservoirs below Krafla caldera during this event is 80 x 106 m3. This remained below the surface, since no eruption took place. The site of the main rifting is just S of the area where the main rifting took place following the initial outbreak in December 1975, but is about 10 km N of other events since 1975. This is a marked change in behavior, as all other rifting events along the fault swarm have been centered closer to the caldera. According to newspaper reports, the geothermal power station recently built within Krafla caldera has now started electricity production at 7-8 megawatts."
Information Contacts: K. Grönvold, NVI.
Inflation continues
Inflation has continued through March at about the same rate as before.
Information Contacts: K. Grönvold, NVI.
Inflation continues
Inflation continued through April at about the same rate as before.
Information Contacts: K. Grönvold, NVI.
Deflation event likely this summer; probability of accompanying eruption increasing
"Inflation continued in the Krafla caldera at a similar rate as before, with an estimated magma inflow of about 5 m3/s. In a recently published prediction by the geologists working in the area the following points were made:
"A. Timing of the next deflation event: If inflation continues at the present rate, the ground level reached before the last three deflation events will be reached by 20 June. If inflation slows when this level is approached, as has often happened, the last week of July is the likeliest deflation date. Experience shows that once this level is reached, new events may come immediately or after a maximum delay of 2 months.
"B. Location of the next rifting: Large parts of the fault swarm have already been rifted. There are, however, two segments that still have not been rifted or where lesser rifting has been noted. One is a 10-15 km-long segment centered 20-25 km N of the caldera center. The other is the S part of the fault swarm, from 15 km S of the caldera center onwards.
"C. The probability of a lava eruption: The rifting is most likely approaching its final stages. The flow of magma into the holding chambers beneath the caldera continues at a constant rate. The probability of a basaltic lava eruption is therefore increasing."
Information Contacts: K. Grönvold, NVI.
Inflation irregular; trigger level for previous deflation events is neared
By early July, inflation at Krafla had become irregular, as it neared the level at which previous deflation events were triggered. A new deflation event is expected in the near future, but it is not possible to predict its exact timing.
Information Contacts: K. Grönvold, NVI.
New deflation 10-13 July; magma intrudes fissures N of the caldera
"Krafla deflated again 10-13 July. After the deflation event of 6-21 January, the Krafla area inflated again at the previous rate of about 6-7 mm/day. About 10 June, the inflation slowed down and became somewhat irregular, as had happened shortly before most previous deflation events. Earthquake activity remained low. A new deflation event was anticipated in late June or the following weeks.
"On 10 July at about 1400 slow deflation was recorded at the tiltmeters. The deflation rate increased markedly shortly before 1700 and continuous tremor appeared on seismographs a few minutes later. Maximum deflation rate (11 µrad/hour) and tremor amplitude were reached about 2000. Earthquake activity increased and epicenters migrated northward along the Krafla fault swarm. Maximum earthquake activity occurred early 11 July in the uninhabited area 10-30 km N of Krafla caldera. The largest earthquakes reached magnitude 4.0 and only a few earthquakes were felt.
"The deflation rate decreased gradually during the next two days, and by 2000 on 13 July inflation had resumed. Total subsidence at the center of deflation (Krafla caldera) was about 60 cm. This subsidence is caused by movement of magma from the magma reservoir below the Krafla caldera to a fault swarm to the N. The amount of rifting in the fault swarm remains to be measured but movements on faults of the order of 0.5-1.5 m were observed. No new steam fields were formed but a very substantial increase was observed in the emission of a steam field formed in 1976. The increase occurred in the time interval 0300-0600 on 11 July.
"Inflation now continues at a similar rate as before. Based on previous experience, the next deflation event can be expected in late October or the following weeks."
Information Contacts: K. Grönvold, NVI; P. Einarsson, Univ. of Iceland.
Inflation continues
Inflation has continued through August at the same rate as before (6-7 mm/day).
Information Contacts: K. Grönvold, NVI.
Inflation slows and becomes irregular; new deflation expected in a few weeks
"Since the end of the deflation event of 10-13 July, inflation within Krafla caldera has continued at a similar rate as before. The rate of inflation as recorded on the tiltmeters was very uniform until about 20 September. Since then the inflation has been slower and more irregular. Similar irregularities have generally been observed a few weeks before previous deflation events. It is expected that the land elevation will reach the previous level about the second week of October. After that, a deflation event can be expected within a few weeks.
"Where the magma will go this time is more uncertain. Very significant rifting has now taken place on most parts of the fault swarm N of Krafla and on the S part next to the caldera. Recent predictions have therefore emphasized the possibility of a rifting event in the southernmost part of the fault swarm. However, the possibility of another rifting event to the N, or an eruption, can in no way be excluded."
Information Contacts: K. Grönvold, NVI.
Slow inflation continues; center of uplift higher than levels which triggered earlier deflations
"Inflation in the Krafla caldera continues at a somewhat reduced rate. The land height at the center of the uplift is now higher than at any time previously and deflation is expected within the next few weeks. A geologist is now permanently positioned in the area to advise the Civil Defense authorities. The seismometers and the continuously recording tiltmeters are now watched hourly day and night."
Information Contacts: K. Grönvold, NVI.
New deflation event; intrusion to 25 km N of the caldera
"The deflation expected in the Krafla caldera started on 10 November. Deflation was first noted on tiltmeters at the Krafla power house at about 1000 and about 20 minutes later continuous tremor began on seismometers. The maximum deflation rate (~12 µrad/hour) was reached at about 1500.
"Earthquake epicenters moved northward along the fault swarm and the earthquake activity increased markedly at about 2400. Most of the activity occurred 15-25 km N of the caldera center. The deflation rate decreased gradually, and by midday 15 November inflation had started. At the same time, the earthquake activity began decreasing.
"The maximum subsidence at the center of the caldera was about 70 cm and the volume of magma that moved into the fault swarm from the reservoir below Krafla is estimated at about 40 x 106 m3. Due to difficult weather conditions, it was not possible to look for surface faulting in the active zone and measurements of reference lines await better conditions. Although this deflation event involves twice the volume of the most damaging rifting event of 8 September 1977, it was not felt or noted by the population because of its location in an uninhabited area. It was therefore only observed instrumentally.
"Inflation continues presently at a similar rate as before and the next deflation event is expected in 4 to 6 months."
Information Contacts: K. Grönvold, NVI; P. Einarsson, Univ. of Iceland.
Inflation continues
After the deflation event of 10-15 November, inflation at Krafla resumed and was continuing at a similar rate as before.
Information Contacts: K. Grönvold, NVI.
Inflation continues; deflation event expected after early March
"The ground inflation at the Krafla caldera continues as before. The ground level that preceded the November 1978 event will most probably be reached in early March. After that, a deflation event can be expected, accompanied by rifting as in earlier events, and possibly by a volcanic eruption."
Information Contacts: K. Grönvold, NVI.
New deflation event believed imminent
"The behavior of ground movement in the Krafla area is similar to that shortly before earlier deflation events. In early March, ground level reached the same height as before previous events, then inflation slowed markedly. Earthquake activity remains low, but the number recorded has increased significantly. A new deflation event with associated magma movement is now expected at any time."
Information Contacts: K. Grönvold, NVI.
New deflation event; 1.5 m of rifting N of the calder
"Deflation of Krafla took place 13-18 May. The main features are similar to the previous deflation event. Before this deflation, the volcano had inflated for two months beyond previous maximum levels and a deflation event had been anticipated since March. Earthquake activity above the magma reservoirs increased significantly during this time. This earthquake activity stopped with the first sign of deflation during the early hours of 13 May. The deflation rate increased only gradually, reaching a maximum (~5 µrad/hour at the Krafla powerhouse) during the afternoon of 14 May.
"Small earthquakes occurred N of the volcano and the epicenters moved northward along the fault swarm. The seismic activity increased markedly on 14 May, shortly before midnight. The earthquakes were associated with extensive rifting in the fault swarm 10-20 km N of Krafla. Geodimeter lines in this part of the fault swarm extended up to 1.5 m during the event. Some of those lines have now extended 3.5 m in less than 1 year, in three rifting events.
"Total subsidence of the center of the deflation is estimated at 70-80 cm, corresponding to about 40 x 106 m3 of removed magma. Inflation started again at about 1600 on 18 May and continues. Land elevation is expected to reach the previous maximum in 4-5 months."
Information Contacts: K. Grönvold, NVI; P. Einarsson, Univ. of Iceland.
Inflation slows; trigger level for previous deflations expected late October
"Krafla continues to inflate. As in many previous inflation periods, the rate of inflation as recorded in the Krafla power house was greatest during the weeks following the May deflation event. The rate then slowed, and during August was about 1 µrad/day, 1/3 of the initial rate. The ground level just prior to the May deflation event will at this rate be reached during the second half of October."
Information Contacts: K. Grönvold, NVI.
Deflation event trigger level expected mid-October
The rate of inflation during September was similar to that of August. The ground level at which previous deflation events have been triggered should be reached in mid-October.
Information Contacts: K. Grönvold, NVI.
Inflation slows
"About the middle of October, the inflation of Krafla reached the level at which deflation previously occurred. Since then, the number of earthquakes has increased gradually, but no deflation had begun as of 5 December. The rate of inflation during the last 3 months has been about 1/3 of the rate during the initial inflation period, or less than 1 µrad/day."
Information Contacts: K. Grönvold, NVI.
Minor deflation with little seismicity, then inflation resumes
"The relatively slow but steady inflation of Krafla was interrupted by a minor deflation event 3-10 December. This deflation was very slow and no volcanic tremor was observed. Inflation resumed on 10 December and on 15 December the previous ground level had been reached.
"The number of earthquakes in the vicinity of the magma chambers had increased gradually in November, but during the mini-deflation earthquake activity decreased to background levels. When the previous ground level was exceeded in the second half of December, the number of recorded earthquakes started to increase again. The largest, of estimated magnitude 4, took place on 3 January and was widely felt in the area."
Information Contacts: K. Grönvold, NVI.
Slow inflation continues
Slow, steady inflation has continued through January. Earthquake activity remained at a level similar to that of late December.
Information Contacts: K. Grönvold, NVI.
Small deflation event; magma migrates 7 km S
"The gradual inflation after the minor December event was reversed about 1 February, when very slow deflation began and the earthquake activity associated with inflation stopped. As measured at the Krafla power house, the initial deflation rate of about 0.5 µrad/day increased on 7 February to about 1.3 µrad/day. In the evening of 10 February, a dense microearthquake swarm began near the S rim of the Krafla caldera and started to propagate southward. At about the same time, the deflation rate increased at Krafla, reaching a maximum of 7 µrad/day on 12 February. The rate of deflation decreased gradually thereafter; on 17 February it stopped and on 21 February inflation started again. The total deflation of 40 µrad is somewhat larger than the December deflation but still only about 1/6 of the last major deflation-rifting event in May 1979 (4:5).
"The active zone extended 7 km S from the rim of the caldera. The same part of the fault swarm was activated during two deflation/rifting events in 1977. This time, the earthquakes were significantly deeper in the crust than in the earlier events in that area. No earthquakes reached magnitude 3 but many were felt and heard in villages near Mývatn (~10 km SW of Krafla). Movements of faults over the seismically active area were very minor and the geodimeter lines near the S end of the active zone showed no significant movement."
Information Contacts: K. Grönvold, NVI; P. Einarsson, Univ. of Iceland.
Lava extrustion accompanies major deflation-rifting event
"After a small deflation event in early February Krafla showed a slow but continuous inflation until 16 March, when a new deflation and rifting took place, accompanied by an eruption. At about 1515 the continuously recording tiltmeters showed very rapid deflation and at the same time the seismometers showed intense volcanic tremor.
"The eruption started at about 1620 and the beginning was observed by two NVI staff members doing geodimeter work a few kilometers N of the eruption site. Most of the eruption, which produced very fluid basaltic lava, took place during the first two hours and the final flow faded about 2230 the same night.
"Eight separate lava flows were erupted, covering a total area of about 1.3 km2 with average thickness of about 2 m. The total length of the active fissure is about 4.5 km and the longest continuous eruptive section about 800 m. The northernmost lava extends about 2 km N of the eruption site of September 1977. This fissure, active in April and September 1977, erupted again, but the southernmost new lava came from the fissure active in December 1975.
"Preliminary chemical analyses show a pattern similar to that observed earlier, with more evolved basalt erupted towards the S but less evolved to the N.
"The zone of new rifting, about 15 km long and 1-2 km wide, extends right through the Krafla caldera. Preliminary estimates indicate about 1 m widening of this zone. Most of the rifting apparently took place during the first hours of the deflation but the maximum earthquake activity took place towards the evening in the S parts of the rifted zone towards Námafjall.
"The maximum subsidence over the magma chambers is estimated at 40 to 50 cm and the rate of deflation was greater than that observed in any previous deflation event.
"Inflation resumed early on 17 March at a rate exceeding any previous inflation rate. The rate is still higher than usual and about half the land subsidence was already recovered on 1 April."
Information Contacts: K. Grönvold, NVI.
Inflation rate slows, but remains unusually high
The inflation rate had slowed by early May, but remained unusually high.
Information Contacts: K. Grönvold, NVI.
Inflation continues; deflation event expected
"Krafla continued to inflate in early June, but at a slower rate than initially after the eruption and deflation of 16 March. Ground level over the magma chambers has regained its previous height. From experience of earlier events, another rifting event or eruption can now be expected, possibly within the next few weeks."
Information Contacts: K. Grönvold, NVI.
Phreatic explosions as inflation slows
"The inflation of Krafla continued during June, but at much reduced rates. On 15 June phreatic explosions started at Leirhnjúkur near the S end of the eruptive fissures, last active on 16 March. Similar phreatic activity has taken place previously at a similar phase in the inflation cycle."
Information Contacts: K. Grönvold, NVI.
Large fissure and eruption
"By the end of May, the land level over the magma reservoirs at Krafla had regained the height reached prior to the 16 March deflation and eruption. A new event was therefore expected as tiltmeters showed continuous height increase indicating further magma inflow into the reservoirs.
"On 10 July at about 0800, the continuously recording tiltmeters started to show rapid deflation and about 1 hour later volcanic tremor was noted on the seismometers. Earthquake activity was soon seen to migrate northwards along the Krafla fault swarm. At about 1245 an eruption started about 8 km N of the magma reservoirs. At least four groups of fissures were active extending over about 4 km. Activity was greatest during the first day but then decreased and concentrated in the northernmost crater group. The eruption then continued with decreasing vigor until 18 July when activity faded away in the early morning.
"The eruption took place far away from habitation so damage was minimal. The beginning of the eruption was observed from the air and on the ground by an unsuspecting tourist.
"The eruption was accompanied by large-scale fault movements close to the eruption site. Possibly the most spectacular sight was when large volumes of lava disappeared down into one of the faults about 3 km from the crater. This lasted for a few hours and the width of the falls was about 200 m.
"The lava covers 5-6 km2 and is much thicker than in previous eruptions. Preliminary volume estimates indicate that the volume of erupted lava exceeds that which left the central magma reservoirs. This is the first time during the Krafla rifting episode when no magma appears to have been added to the rift zone.
"Inflation of the magma reservoirs started again on 16 July, before the eruption was over. Inflation now continues at a high rate so that the Krafla rifting and magmatic episode continues."
Information Contacts: K. Grönvold, NVI.
Inflation resumes after last month's eruption
"Inflation of the magma reservoirs at Krafla, as monitored by ground movement, continues. At present,inflation is occurring at about the rate measured at similar ground levels during previous inflation periods, suggesting that the rate of magma supply remains similar. About 70% of the July deflation has now been recovered and the previous maximum ground level is likely to be reached after mid-October."
Information Contacts: K. Grönvold, NVI.
Inflation nearing level that triggered earlier deflations
Continued inflation of the magma reservoirs beneath Krafla had raised the ground level by mid-September to nearly the height at which previous deflation events and eruptions were triggered.
Information Contacts: K. Grönvold, NVI.
Fissure eruption
"Inflation of the magma chambers, as monitored by crustal movement, continued after the eruption of 10-18 July. The previous ground levels were reached about the middle of October when two very minor deflations took place. Early in the morning of 18 October, continuously recording tiltmeters close to the crater row (~600 m) showed rapid inflation while tiltmeters farther away showed no unusual behavior.
"At about 1842 the three tiltmeters close to the magma reservoirs suddenly started to show very rapid deflation and continuous tremor started on the seismometers at 1847.
"At 2203 a fissure eruption started about 1 km N of Leirhnjúkur, near the center of Krafla caldera. The eruptive fissure quickly extended N about 6 km and S towards Leirhnjúkur. The eruptive fissures were discontinuous and extended over a 7 km-long segment of the fissure system. In the early morning of 19 October activity decreased in the S part of the fissure system and finally concentrated on a 200-300-m-long segment near the northernmost original fissure.
"Activity decreased gradually after that until between 1500 and 1600 on 23 October when lava production ceased somewhat abruptly. Some activity remained in the craters until about midnight. During the eruption tiltmeters near the magma reservoirs showed little movement but almost simultaneously with the ceasing of the lava production rapid inflation started again.
"The new lava covers an area of 11-12 km2. The absolute amount of subsidence is not known yet but the amount of tilt recorded by the tiltmeters is only about half of that accompanying the July eruption. This indicates that again the bulk of the magma drained from the magma reservoirs reached the surface. The relatively small deflation and present high inflation rate suggest that previous ground levels could be reached during November or early December, with at least similar probability of a renewed eruption.
"The beginning of the eruption was witnessed by a few observers. The eruption site was closer to the populated area and the Krafla power plant than in previous eruptions and the population had been warned before the eruption started. But with the activity concentrating in the N the hazard quickly ceased."
Information Contacts: K. Grönvold, NVI.
Eruption expected soon
"After the October eruption the magma reservoirs at Krafla inflated rapidly until the last week of November. Ground-level monitoring indicates that at that time land over the magma reservoirs was higher than before the October eruption. During the week or so prior to 3 December, the rate of inflation has been slower and more irregular.
"From the pattern of behaviour so far, an eruption can be expected to take place soon. Evacuation plans and civil defense measures have been strengthened in case of an eruption in the S part of the fissure system, closer to the village near Lake Mývatn."
Information Contacts: K. Grönvold, NVI.
Four days of slow deflation, then inflation resumes
Ground level remained about the same until 25 December when four days of very slow deflation began. Total deflation was about 1/3 the amount recorded during the October eruption (5:10). At the end of the deflation episode, a swarm of small indistinct earthquakes was recorded, with epicenters about 10 km N of the caldera center. Inflation resumed on 29 December, and by 8 January the caldera had nearly returned to its pre-deflation ground level.
Information Contacts: G. Sigvaldason, NVI.
Fissure eruption
". . . The ground level at which previous deflation events and eruptions were triggered was again reached about 10 January, but inflation continued.
"On 30 January at about 0700, slow deflation of the magma reservoirs started, as recorded by tiltmeters at the Krafla power plant. The rate of deflation rapidly increased and at about 0730 tremor appeared on seismometers. Deflation rate and tremor amplitude reached a maximum at about 0900 and declined very gradually thereafter. The earthquake epicenters indicated movement of magma along the fault swarm toward the N. Soon after 1400, a fissure eruption started in the fault swarm 8-9 km N of the center of the magma reservoirs. The fissure soon extended to 2 km length and the lava front quickly moved toward the N. The eruption site was close to those of July and October, 1980 and the eruptive behavior was broadly similar. In the morning of 31 January, the fissure had shortened to about 300-400 m and the lava production rate had decreased somewhat.
"The eruption and very slow deflation were continuing on 2 February. The eruption site is in an uninhabited area and poses no danger to the local population. Observations are hampered due to remoteness and difficult weather conditions."
Information Contacts: K. Grönvold, NVI; P. Einarsson, Univ. of Iceland.
Fissure eruption and intrusion end; inflation resumes
"The initial vigorous phase of the eruption lasted until the early morning of 31 January. Then activity began to decrease, with shortening of the crater row that initially extended 2 km, then decreasing activity in the craters and declining lava production.
"The final activity in the craters died out just after 1400 on 4 February. During the eruption, slow deflation over the Krafla magma reservoirs, 8-9 km to the S, was observed, but inflation started again at about the same time as the eruption ceased. The lava covered 6.3 km2 and appeared to be similar in volume to the two previous eruptions in July and October 1980 (5:7,10).
"Considerable movement of faults extending about 1 km N of the main lava (~8 km N of the craters) was observed. Large volumes of steam emitted from these faults suggest that lava again forced its way down into the faults and then northward. Renewed earthquake activity in this region on 1 February was possibly associated with this fault movement.
"By early March the inflation of the magma reservoirs had regained over half of the deflation that accompanied the eruption. Experience indicates that previous ground levels will be reached about the end of March to early April."
Information Contacts: K. Grönvold, NVI.
Inflation reaches level at which previous eruptions were triggered
"As of 2 April, land elevation over the Krafla magma reservoirs, as indicated by tiltmeters, was about the same as at the time of the eruption that began 30 January. Inflation continued and from past experience an eruption can be expected to take place in the near future, possibly within the next few weeks."
Information Contacts: K. Grönvold, NVI.
Slow inflation continues
Very slow inflation was continuing at Krafla as of 7 May. Tilt measurements indicated that the ground level was substantially higher than it had been just before the 30 January eruption.
Information Contacts: K. Grönvold, NVI.
Slow inflation continues; SO2 measured
As of 10 June, slow inflation continued at Krafla. Dartmouth College geologists visited Iceland 11-19 May and measured SO2 emissions with the cooperation of NVI personnel. At Krafla, SO2 was remotely monitored by COSPEC in the Leirhnjúkur area WNW of Krafla, where the October 1980 fissure eruption occurred (5:10). Significant concentrations of SO2 were directly detected in the area of the January 1981 eruption fissures. The COSPEC detected SO2 north and SW of Hekla's April 1981 lava flows.
Information Contacts: K. Grönvold, NVI; R. Stoiber and S. Williams, Dartmouth College.
Pattern of inflation changes
Inflation has continued through early September. Previous periods of inflation had been characterized by a single center of uplift beneath the caldera, but data gathered by tiltmeters since 4 February has been more complex and may indicate multiple centers of uplift. Because of the changed pattern of inflation, the rate of magma inflow from depth can no longer be calculated, nor can the timing of future deflation events or eruptions be predicted.
Information Contacts: K. Grönvold, NVI.
Fissure eruption
"The 30 January-4 February eruption (6:1-2) was followed by a rapid recovery of land elevation. Tiltmeters indicated that previous land levels had been reached by the end of March. After that the rate of tilt change was very slow. There are, however, indications that the rate of tilt change as recorded by the continuously recording tiltmeters did not reflect the land elevation changes as closely as in earlier inflation periods.
"On 18 November at 0036 seismometers started to show continuous tremor, and the continuously recording tiltmeters simultaneously showed the onset of very rapid deflation. Warnings of an imminent eruption were issued, and at 0152 an eruption broke out. Weather conditions were unfavourable, with strong wind and poor visibility. The eruption started about 1.5 km N of the hill Leirhnjúkur (near the center of Krafla caldera), the same place as the October 1980 eruption (5:10).
"In about 25 minutes the eruption extended S to Leirhnjúkur, about 0.5 km farther S than in previous eruptions. At the same time the eruptive fissure extended N. When the first planes flew over the area about 0400, the eruptive fissures had extended to 8 km, and were displaying a more or less continuous curtain of fire. The fissure consisted of several segments, slightly offset with respect to each other, but the width of the fissure zone was always less than 100 m. The craters were situated very close to or coincided with those of the October 1980 eruption. The rate of deflation reached a maximum between 0115 and 0135, and the rate of lava production had apparently already reached maximum by 0400. Most of the lava flowed W (figure 4). Lava production was highest from the N half of the fissure.
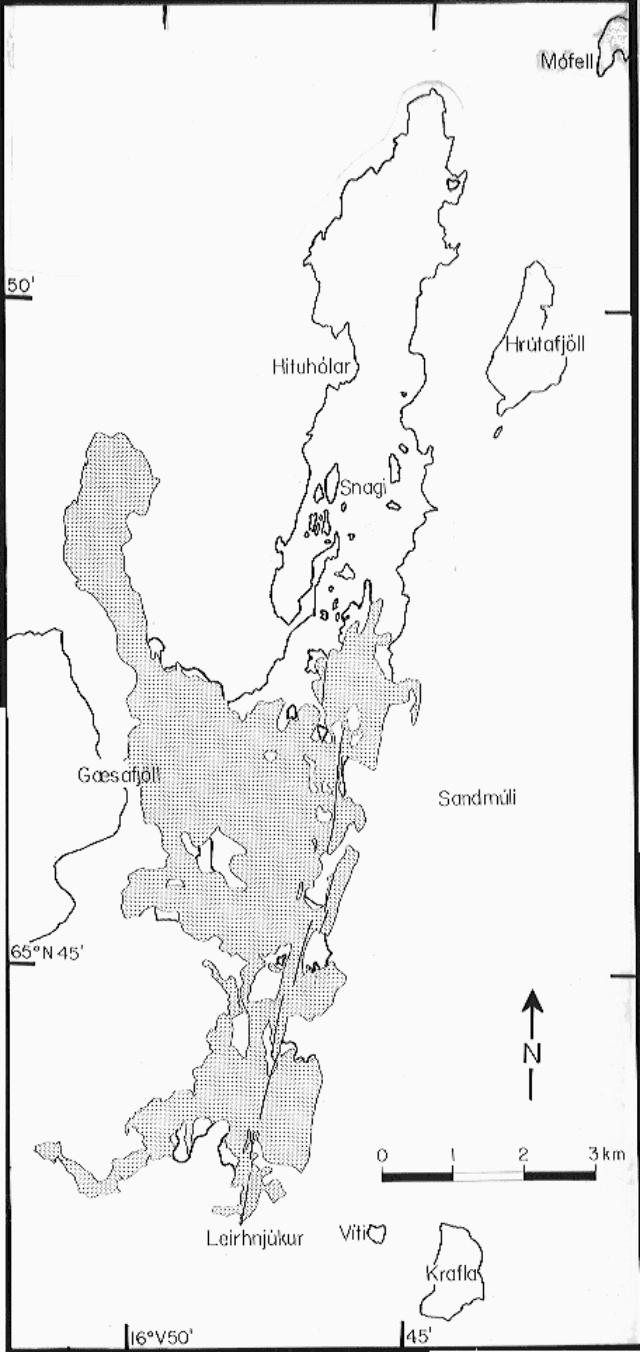 |
Figure 4. Krafla 16-23 November 1981 lava (stippled area) and eruption fissures (N-S-trending lines within stippled area). The area covered by lava from the December 1975-January 1981 eruptions is outlined. [Originally in 7:4]. |
"The initial tremor amplitude was higher in the caldera region than in most previous eruptions. The tremor was mixed with earthquakes, but low-frequency events began about 1 hour after the onset of tremor. The characteristics of the seismic activity changed when the eruption broke out. The irregular, high-frequency, intrusion tremor gave way to more regular, low-frequency, eruption tremor. Low-frequency earthquakes continued for about 1 hour after the outbreak of the eruption, but after that the eruption tremor was the only seismic disturbance seen on the seismographs.
"By about 0600 the force of the eruption was already decreasing. In the afternoon land deflation stopped and inflation resumed. Segments of the fissure stopped activity and the active segments gradually shortened. Activity in individual craters or crater groups decreased and became more pulsating. Substantial lava production lasted longest in craters about 5 km N of Leirhnjúkur. Activity on these craters increased rather suddenly on 20 November, doubling from an estimated 50 m3/s. During the same afternoon tiltmeters showed deflation lasting a few hours. But inflation resumed and about noon on 21 November lava production decreased rather suddenly to about 30 m3/s. By the morning of 22 November activity in these craters ceased. Activity continued in the initial S crater until 23 November, but lava production was minimal. About 0900 the activity stopped but resumed for about 15-20 minutes around 1700. After that no activity was recorded.
"After inflation resumed, the tiltmeters showed inflation rates similar to those following previous eruptions. The area covered by the new lava is estimated at about 15 km2 and the maximum land subsidence at 45-50 cm."
Information Contacts: K. Grönvold, NVI; P. Einarsson, Univ. of Iceland.
Magma reservoirs inflated to pre-eruption level
"According to tiltmeters, the inflation of the Krafla magma reservoirs had by early January reached similar levels as before the November eruption (6:11). The inflation rate was slowing somewhat as is usually observed after the initial rapid recovery. This recovery rate was similar to the fastest rate observed after previous eruptions and deflations. There were therefore still no signs that the Krafla episode is nearing its end or final phases."
Further Reference. Tryggvason, E., 1984, Widening of the Krafla fissure swarm during the 1975-1981 volcano-tectonic episode: BV, v. 47, p. 47-71.
Information Contacts: K. Grönvold, NVI.
Slow inflation continues; previous activity summarized
"Rifting in the Krafla area with associated magmatic and eruptive activity has continued since December 1975. During the early phase of the episode, rifting and underground magma movement were the main features. Rifting occurred in individual relatively short events, the most recent in March 1980. Some of the rifting events were accompanied by eruptions but the volumes of the lavas were very small compared with the volumes of magma moving underground to fill the rifting segments. After March 1980 the character of the activity changed. Basaltic fissure eruptions are now the major feature but rifting is much less significant. A zone that now extends over 80 km has been rifted about 5-7 m.
"Since July 1980 there have been four basaltic fissure eruptions, each lasting 5-7 days. The lavas cover 30 km2 and their estimated volume is about 0.2 km3. The eruptive fissures extend 11 km N from Leirhnjúkur, which is situated right above the magma reservoirs and the center of inflation. In each eruption, only part of the eruptive fissures are active. Lava production has so far been dominantly from the N half of the fissure system. The most productive part of the fissure system is therefore situated near the center of the 80-km-long rifted zone, but the magma reservoirs that deflate during the eruptions are situated at the S end of the eruptive fissures. The chemical composition of the glasses indicates a more complex pattern than simple magma reservoirs draining magma to the surface.
"The pattern of inflation of the magma reservoirs between eruptions, and deflation during eruptions, has remained very regular (figure 5). Eruptions take place only after the inflation of the magma reservoirs has reached well over the level of the previous inflation. After the most recent eruption in November 1981 the magma reservoirs inflated again and the previous ground levels were reached in early January. At present, inflation continues very slowly and an eruption at any time during the next few months would come as no surprise."
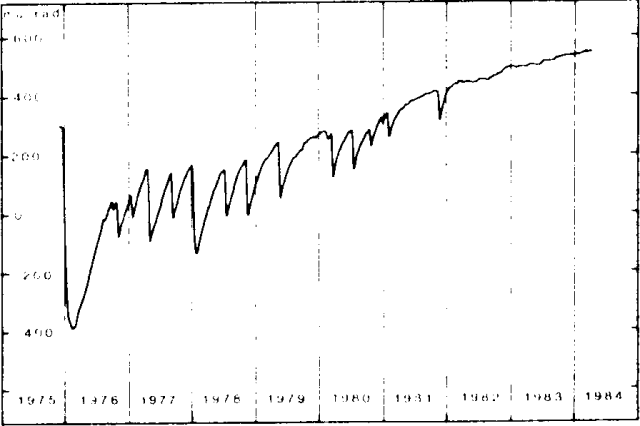 |
Figure 5. Inflation/deflation sequence in the Krafla region, 1975-82, as measured by the N-S component of the water-tube tiltmeter in the Krafla power station, ~1.5 km S of the center of inflation/deflation. One µrad of tilt corresponds to ~3.4 mm of vertical ground displacement at the center of inflation/deflation. From Tryggvason (1984). [Not in original SEAN report.] |
Information Contacts: K. Grönvold, NVI; K. Saemundsson, National Energy Authority.
Ground level high but no eruption
Ground level over Krafla's magma reservoirs remained high as of 4 June. No eruption has occurred since lava emerged from fissures N of the caldera 18-23 November (6:11).
Information Contacts: K. Grönvold, NVI.
Inflation stops without eruption
Slow inflation continued through the spring. As of early July, however, no change in tilt had occurred over the magma reservoirs for several weeks and no eruption had taken place.
Information Contacts: K. Grönvold, NVI.
Eruption from 8.5-km fissure
"After a quiet interval of 2 years and 9 months, an eruption broke out at Krafla on 4 September 1984. The eruption in November 1981 (6:11) and associated deflation of magma reservoirs below Leirhnjúkur were followed by inflation, reaching previous levels in early 1982. Since then slow and intermittent inflation has continued, accompanied by earthquakes in the reservoir roof.
"Rapid deflation over the magma reservoirs followed by volcanic tremor began 4 September at about 2025, but the eruption broke out at 2349. The beginning of the eruption was observed from the air by alerted scientists and a television reporter. The first fissure segment opened about 6 km N of Leirhnjúkur, followed within a minute by another about 3 km to the S. The fissures quickly joined and in 1 hour reached their full length of 8.5 km, extending from Leirhnjúkur to the N. During the first hours lava was erupted along the whole fissure, advancing on broad fronts.
"Already in the early hours of the morning, the activity had decreased and lava production on various sections of the fissures had faded out. By midday on 5 September, inflation had resumed. By 6 September, eruption on the S part of the fissure had ceased except on one crater, which then changed into phreatic activity.
"By 8 September, inflation rates over the magma chambers diminished and slow deflation started [but see 9:11]. On the northernmost part of the fissure, activity continued as of the morning of 12 September with significant lava production.
"As in previous eruptions, lava production was highest on the northern part of the fissure and has so far not constituted any threat to inhabited areas."
Information Contacts: K. Grönvold, NVI; P. Einarsson, Univ. of Iceland.
Satellites detect SO2-rich plume from September eruption
The eruption continued in the northernmost part of the fissure system for nearly two weeks, before stopping on 18 September between 1600 and 1700. Inflation began again only a few hours after the end of the eruption.
Plumes from the eruption were detected by the NOAA 6 polar orbiting satellite and by the TOMS instrument on the Nimbus-7 polar orbiter. A NOAA 6 visible-band image [on] 5 September at 0841, about 9 hours after the eruption started, shows a plume extending about 180 km E from Krafla. From a point source, the plume broadened, reaching about 35 km width roughly 90 km from the volcano and remaining about that wide farther downwind.
The TOMS instrument detected large areas of SO2 enhancement at approximately local noon on 5, 6, and 7 September (figure 6). The plume extended ESE from the volcano on the 5th. Twenty four hours later, it was detected as a coherent body over Norway (roughly 1,300 km ESE of Krafla), and another 24 hours later over Estonia (roughly 2,200 km ESE of Krafla). NASA's preliminary estimate of the amount of SO2 in the plume is 35,000 metric tons. An SO2 ground monitor at Norrköping, Sweden (58°N, 16°E, about 1,900 km ESE of Krafla) detected a 40 milliatmosphere-cm anomaly on 7 September. The TOMS instrument detected smaller areas of SO2 enhancement on 10 September—again extending ESE from the vicinity of Krafla—and 18 September—NW of and detached from the volcano (figure 7). On other days between 4 and 19 September there were no SO2 enhancements detected by TOMS near Iceland.
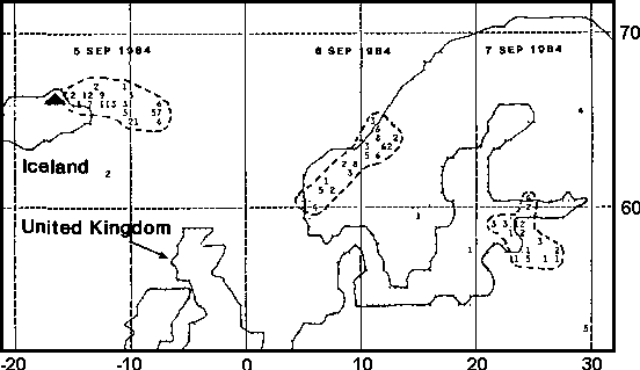 |
Figure 6. Preliminary SO2 data from the TOMS instrument on the Nimbus-7 polar orbiting satellite. The areas of enhanced SO2 values at local noon on 5, 6, and 7 September 1984 are outlined. Krafla is marked by a triangle. NW Europe is outlined. Each number represents the average SO2 value within an area 50 km across. Values above 9 are represented by A. B, etc. Courtesy of Arlin Krueger. |
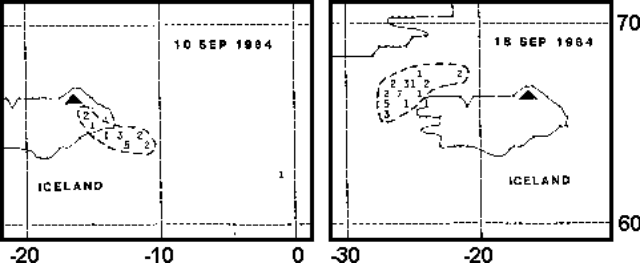 |
Figure 7. Areas of enhanced SO2 values detected in the vicinity of Iceland 10 and 18 September 1984 by the TOMS instrument on the Nimbus-7 satellite. Krafla is marked by a triangle. Each number represents the average SO2 value within an area 50 km across. Values above 9 are represented by A. B, etc. Courtesy of Arlin Krueger. |
Information Contacts: A. Krueger, NASA/GSFC; M. Matson, NOAA/NESDIS; K. Grönvold, NVI.
End of eruption described; tilt data; lava flows mapped
"The early phase of the September eruption (9:8) was very similar to previous eruptions. Maximum eruptive activity was reached within about 1 hour, and while the whole 8.5-km-long fissure was active thin fluid lava advanced along the entire zone (figure 8). In the early hours of the eruption's first morning, 5 September, activity decreased rapidly, dying out on many of the fissure segments, especially in the southern half. By 6 September only one crater remained active, just S of the N end of the original fissure.
 |
Figure 8. Sketch map of the Krafla area by Kristjan Saemundsson (NVI) made with the aid of airphotos by Oddur Sigurdsson at the same institute. Lava flows from the September 1984 eruption are shown in a stipple pattern. Courtesy of Karl Grönvold. |
"By midday 5 September, while activity was dying out along most of the fissure, deflation over the magma reservoirs below Leirhnjúkur stopped and inflation began (figure 9). This situation changed on 9 September when deflation resumed. Around the same time, activity at the one remaining crater increased. Deflation and relatively vigorous eruption continued until the afternoon of 18 September when activity at the crater died out and inflation resumed. The inflation pattern since then is similar to that following previous eruptions.
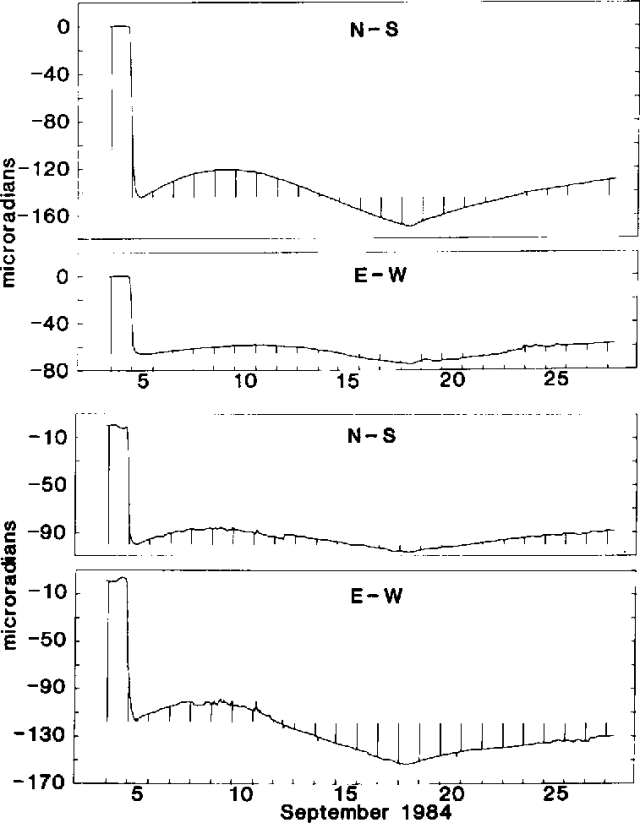 |
Figure 9. Tilt at the Krafla powerhouse (Kröfluvirkjun), top, and Víti (~3 km NE of the powerhouse), bottom, 4-27 September 1984. Vertical lines are time signals at midnight. Courtesy of Gudmundur Sigvaldason. |
"The new lava covers about 24 km2 and the total area now covered by Krafla lava is about 36 km2. As in some of the previous eruptions lava was observed flowing into older fissures, causing secondary rifting. Sometimes this lava reemerged farther along the fissures. Flames from burning gas were widely observed near the flow margin."
Further Reference. Tryggvason, E., 1986, Multiple magma reservoirs in a rift zone volcano: ground deformation and magma transport during the September 1984 eruption of Krafla, Iceland: JVGR, v. 28, p. 1-44.
Information Contacts: K. Grönvold and G. Sigvaldason, NVI; P. Einarsson, Univ. of Iceland.
No net inflation in 1985; small deflation episode in July
The following is from the NVI.
"The inflation of Krafla after the September 1984 eruption (9:8, 10-11) apparently came to a halt during January 1985. Recording tiltmeters at Krafla and Víti showed no significant inflation from January through late May although the conventional winter noise would have prevented detection of a miniscule inflation. After the winter noise subsided in April 1985, a very slight tilt, indicating deflation, prevailed in the Krafla power station, where the tilt rate was ~6 µrad/month.
"On 21 May, however, significant inflation started at Krafla with a tilt rate of ~10 µrad/month. This corresponds to an inflation rate of about 1 mm per day at Leirhnjúkur. This inflation continued until 1 July. A noticeable subsidence was recorded 1-3 July on the Krafla and Víti tiltmeters. The tilt at Krafla in the conventional subsidence direction was about 14-17 µrad, corresponding to land subsidence of about 5 cm at Leirhnjúkur. The Víti tiltmeter showed about 12 µrad of tilt toward the WSW, the usual subsidence tilt direction. This corresponds to a removal of 2 x 10⁶ m3 of magma from the Krafla magma reservoir.
"After 3 July no noticeable inflation or deflation was observed at Krafla or Víti, although minimal inflation may have occurred during November. An apparent deflation at Krafla in July and early August was probably caused by thermal stress, but similar tilt was observed in July and August 1983 and 1984. This signifies an annual cycle in tilt at this station. Dry-tilt measurements during the last days of May and again in late October indicate subsidence centered near Leirhnjúkur between those dates. The maximum subsidence was about 4.5 cm, similar to that indicated by the Krafla tiltmeter on 1-3 July.
"Although obvious ground deformation occurred 21 May-3 July, the net ground movement throughout the year was near zero and only further measurements in 1986 will show if any measurable deformation is in progress. Measurements of ground deformation at Krafla in 1985 do not allow any conclusion regarding the present progress or expected continuation of the activity. The inflation, if any, is slower than during any previous one-year period after 1975. The small subsidence event of 1-3 July is different from all earlier events, as no inflation was observed after the subsidence. Thus the behavior of Krafla is greatly different from what it has been during the previous 9 years and the experience from those years is of no use in predicting the continuation of activity at Krafla."
Information Contacts: E. Tryggvason, Univ. of Iceland.
Gradual inflation during late 1986, early 1987
"Gradual inflation began in November 1986 after almost two years of insignificant ground deformation. Extensive tilt measurements in late October 1986 and late April 1987, and several measurements in late February and early March 1987 show that the inflation affected the same area as it did in 1976-82. The observed tilt agrees reasonably with a single point source model. Tilt measurements in late February and early March 1987 indicated a maximum uplift of 17.8 cm since late October 1986 with a point source at 2.5 km depth. The observations in late April 1987 (figure 10) indicated a maximum uplift of 22.0 cm and a point source depth of 2.7 km.
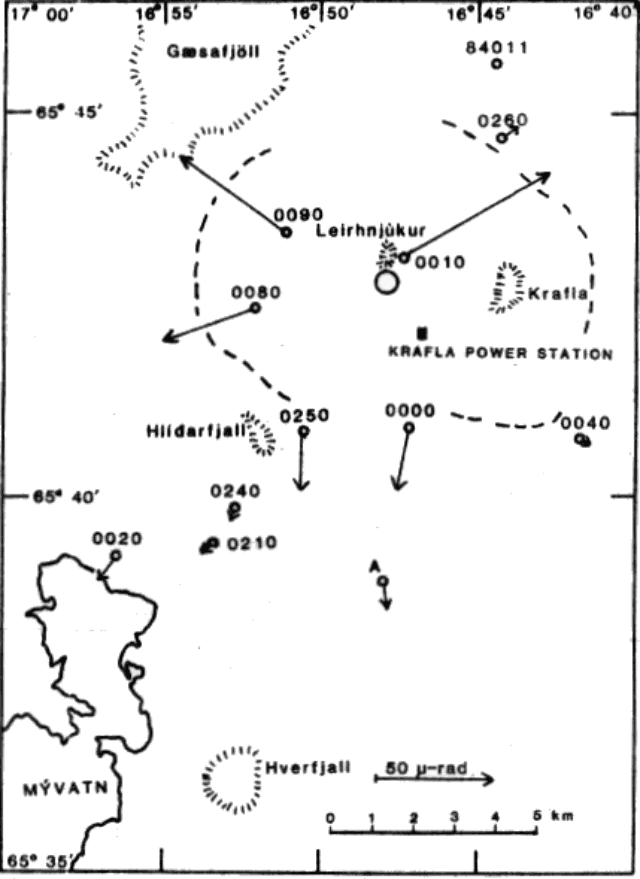 |
Figure 10. Observed tilt at eleven optical level tilt stations near Krafla during the November 1986-March 1987 inflation. The open circle S of Leirhnjúkur shows the location of a single point source that can explain most of the observed ground deformation if source depth is 2.5-2.7 km. The dashed line marks the caldera boundary. |
"Extensive distance measurements in the Krafla region in late February and early March 1987 were compared with measurements of March 1986. Lines inside the Krafla caldera had increased up to 70 ppm in length. Comparison with a point source model showed best agreement if the point source was at 2.7 km depth and the central uplift was 19.5 cm.
"Thus, both tilt measurements and distance measurements agree on the depth of a point source and the maximum uplift. Geographic coordinates of the indicated point source are about 65°42.8'N, 16°47.6'W if distance measurements are considered but about 0.6 km farther W if tilt measurements are considered. This discrepancy is apparently caused by systematic anomalies in the azimuth of tilt at several stations, making the coordinates obtained from distance measurements more reliable. The recording tiltmeters at the Krafla power station (figure 11) indicated a constant rate of inflation from early November 1986 until the end of March 1987, when inflation ceased. Seismic activity in the Krafla region increased slightly during this inflation period and reached its highest value in late February and March, 1987."
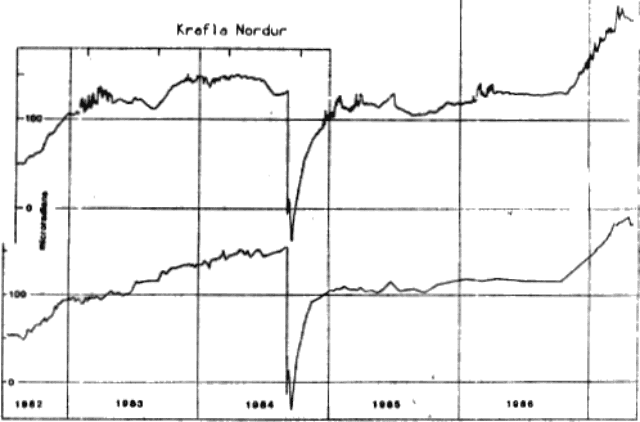 |
Figure 11. North component of tilt at the Krafla power station from mid-1983 to early May 1987. Up on the graph is uplift towards the N. The electronic tiltmeter (upper curve) shows high noise level during winter and minima in July or August, both caused by surface strain of thermal origin. The record of the water tube tiltmeter (lower curve) is less disturbed by thermal strain. |
Further References. Tryggvason, E., 1986, Vertical ground movement in the Krafla region 1977-1986: Nordic Volcanological Institute, Univ of Iceland, no. 8602, 31 p.
Tryggvason, E., 1987, Myvatn lake level observations 1984-1986 and ground deformation during a Krafla eruption: JVGR, v. 31, p. 131-138.
Information Contacts: E. Tryggvason, NVI.
Four years of inflation interrupted by deflation
Krafla last erupted in September 1984 (9:8 and 10-11) and slow, intermittent inflation has been recorded since early 1985. Tilt records (figure 12) show three inflationary pulses since January 1988. Each lasted 2-3 months and was accompanied by increased seismicity. The inflation rate was generally 1-2 mm/day at the center of deformation, indicating a magma flow rate of ~1 m3/s into Krafla's shallow magma reservoir. Slow deflation was observed March-May 1989, accelerating 20-30 May to a rate similar to the previous inflation. No unusual seismicity or surface activity was associated with the deflation.
|
Figure 12. North component of tilt recorded January 1988-May 1989 at the Krafla power station, ~1.5 km S of the center of the deformation. Inflation is uplift toward then N. Courtesy of Eysteinn Tryggvason. |
Information Contacts: E. Tryggvason, NVI.
|
|
||||||||||||||||||||||||||
There is data available for 23 confirmed Holocene eruptive periods.
1984 Sep 4 - 1984 Sep 18 Confirmed Eruption (Explosive / Effusive) VEI: 0
| Episode 1 | Eruption (Explosive / Effusive) | Leirhnjúkur to 8.5 km north | ||||||||||||||||||||||||||||||||||
|---|---|---|---|---|---|---|---|---|---|---|---|---|---|---|---|---|---|---|---|---|---|---|---|---|---|---|---|---|---|---|---|---|---|---|---|
| 1984 Sep 4 - 1984 Sep 18 | Evidence from Observations: Reported | ||||||||||||||||||||||||||||||||||
|
List of 5 Events for Episode 1 at Leirhnjúkur to 8.5 km north
|
|||||||||||||||||||||||||||||||||||
1981 Nov 18 - 1981 Nov 23 Confirmed Eruption (Explosive / Effusive) VEI: 0
| Episode 1 | Eruption (Explosive / Effusive) | Leirhnjúkur to 9 km north | |||||||||||||||||||||||||||||||||||||||
|---|---|---|---|---|---|---|---|---|---|---|---|---|---|---|---|---|---|---|---|---|---|---|---|---|---|---|---|---|---|---|---|---|---|---|---|---|---|---|---|---|
| 1981 Nov 18 - 1981 Nov 23 | Evidence from Observations: Reported | |||||||||||||||||||||||||||||||||||||||
|
List of 6 Events for Episode 1 at Leirhnjúkur to 9 km north
|
||||||||||||||||||||||||||||||||||||||||
1981 Jan 30 - 1981 Feb 4 Confirmed Eruption (Explosive / Effusive) VEI: 0
| Episode 1 | Eruption (Explosive / Effusive) | 6-8 km N of Leirhnjúkur | ||||||||||||||||||||||||||||||||||
|---|---|---|---|---|---|---|---|---|---|---|---|---|---|---|---|---|---|---|---|---|---|---|---|---|---|---|---|---|---|---|---|---|---|---|---|
| 1981 Jan 30 - 1981 Feb 4 | Evidence from Observations: Reported | ||||||||||||||||||||||||||||||||||
|
List of 5 Events for Episode 1 at 6-8 km N of Leirhnjúkur
|
|||||||||||||||||||||||||||||||||||
1980 Mar 16 - 1980 Oct 23 Confirmed Eruption (Explosive / Effusive) VEI: 0
| Episode 1 | Eruption (Explosive / Effusive) | Leirhnjúkur to 11 km north | |||||||||||||||||||||||||||||||||||||||||||||||||
|---|---|---|---|---|---|---|---|---|---|---|---|---|---|---|---|---|---|---|---|---|---|---|---|---|---|---|---|---|---|---|---|---|---|---|---|---|---|---|---|---|---|---|---|---|---|---|---|---|---|---|
| 1980 Mar 16 - 1980 Oct 23 | Evidence from Observations: Reported | |||||||||||||||||||||||||||||||||||||||||||||||||
|
List of 8 Events for Episode 1 at Leirhnjúkur to 11 km north
|
||||||||||||||||||||||||||||||||||||||||||||||||||
1977 Apr 27 - 1977 Sep 8 Confirmed Eruption (Explosive / Effusive) VEI: 1
| Episode 1 | Eruption (Explosive / Effusive) | 3 km north of Leirhnjúkur | |||||||||||||||||||||||||||||||||||||||||||||||||||||||||||
|---|---|---|---|---|---|---|---|---|---|---|---|---|---|---|---|---|---|---|---|---|---|---|---|---|---|---|---|---|---|---|---|---|---|---|---|---|---|---|---|---|---|---|---|---|---|---|---|---|---|---|---|---|---|---|---|---|---|---|---|---|
| 1977 Apr 27 - 1977 Sep 8 | Evidence from Observations: Reported | |||||||||||||||||||||||||||||||||||||||||||||||||||||||||||
|
List of 10 Events for Episode 1 at 3 km north of Leirhnjúkur
|
||||||||||||||||||||||||||||||||||||||||||||||||||||||||||||
1975 Dec 20 - 1975 Dec 20 Confirmed Eruption (Explosive / Effusive) VEI: 0
| Episode 1 | Eruption (Explosive / Effusive) | 1.5-2.5 km north of Leirhnjúkur | ||||||||||||||||||||||||||||||||||||||||||||
|---|---|---|---|---|---|---|---|---|---|---|---|---|---|---|---|---|---|---|---|---|---|---|---|---|---|---|---|---|---|---|---|---|---|---|---|---|---|---|---|---|---|---|---|---|---|
| 1975 Dec 20 - 1975 Dec 20 | Evidence from Observations: Reported | ||||||||||||||||||||||||||||||||||||||||||||
|
List of 7 Events for Episode 1 at 1.5-2.5 km north of Leirhnjúkur
|
|||||||||||||||||||||||||||||||||||||||||||||
1746 Jul 10 - 1746 Jul 10 (?) Confirmed Eruption (Explosive / Effusive) VEI: 1
| Episode 1 | Eruption (Explosive / Effusive) | Leirhnjúkur crater row | ||||||||||||||||||||||||||||||||||
|---|---|---|---|---|---|---|---|---|---|---|---|---|---|---|---|---|---|---|---|---|---|---|---|---|---|---|---|---|---|---|---|---|---|---|---|
| 1746 Jul 10 - 1746 Jul 10 (?) | Evidence from Observations: Reported | ||||||||||||||||||||||||||||||||||
|
List of 5 Events for Episode 1 at Leirhnjúkur crater row
|
|||||||||||||||||||||||||||||||||||
1729 Jun 30 - 1729 Sep 25 ± 5 days Confirmed Eruption (Explosive / Effusive) VEI: 2
| Episode 1 | Eruption (Explosive / Effusive) | Leirhnjúkur crater row | ||||||||||||||||||||||||
|---|---|---|---|---|---|---|---|---|---|---|---|---|---|---|---|---|---|---|---|---|---|---|---|---|---|
| 1729 Jun 30 - 1729 Sep 25 ± 5 days | Evidence from Observations: Reported | ||||||||||||||||||||||||
|
List of 3 Events for Episode 1 at Leirhnjúkur crater row
|
|||||||||||||||||||||||||
1728 Dec 18 Confirmed Eruption (Explosive / Effusive) VEI: 2
| Episode 1 | Eruption (Explosive / Effusive) | Leirhnjúkur crater row | |||||||||||||||||||
|---|---|---|---|---|---|---|---|---|---|---|---|---|---|---|---|---|---|---|---|---|
| 1728 Dec 18 - Unknown | Evidence from Observations: Reported | |||||||||||||||||||
|
List of 2 Events for Episode 1 at Leirhnjúkur crater row
|
||||||||||||||||||||
1728 Apr 18 Confirmed Eruption (Explosive / Effusive) VEI: 2
| Episode 1 | Eruption (Explosive / Effusive) | Leirhnjúkur, Hrossadalur, Bjarnarflag | ||||||||||||||||||||||||
|---|---|---|---|---|---|---|---|---|---|---|---|---|---|---|---|---|---|---|---|---|---|---|---|---|---|
| 1728 Apr 18 - Unknown | Evidence from Observations: Reported | ||||||||||||||||||||||||
|
List of 3 Events for Episode 1 at Leirhnjúkur, Hrossadalur, Bjarnarflag
|
|||||||||||||||||||||||||
1727 Aug 21 Confirmed Eruption (Explosive / Effusive) VEI: 2
| Episode 1 | Eruption (Explosive / Effusive) | North end of Leirhnjúkur | |||||||||||||||||||
|---|---|---|---|---|---|---|---|---|---|---|---|---|---|---|---|---|---|---|---|---|
| 1727 Aug 21 - Unknown | Evidence from Observations: Reported | |||||||||||||||||||
|
List of 2 Events for Episode 1 at North end of Leirhnjúkur
|
||||||||||||||||||||
[ 1725 Jan 11 ] Discredited Eruption
1724 May 17 - 1724 May 18 Confirmed Eruption (Explosive / Effusive) VEI: 2
| Episode 1 | Eruption (Explosive / Effusive) | Víti (1.5 km east of Leirhnjúkur) | ||||||||||||||||||||||||||||||||||||||||||||
|---|---|---|---|---|---|---|---|---|---|---|---|---|---|---|---|---|---|---|---|---|---|---|---|---|---|---|---|---|---|---|---|---|---|---|---|---|---|---|---|---|---|---|---|---|---|
| 1724 May 17 - 1724 May 18 | Evidence from Observations: Reported | ||||||||||||||||||||||||||||||||||||||||||||
|
List of 7 Events for Episode 1 at Víti (1.5 km east of Leirhnjúkur)
|
|||||||||||||||||||||||||||||||||||||||||||||
1300 ± 200 years Confirmed Eruption (Explosive / Effusive) VEI: 2 (?)
| Episode 1 | Eruption (Explosive / Effusive) | Crater south of Víti | ||||||||||||||||||||||||
|---|---|---|---|---|---|---|---|---|---|---|---|---|---|---|---|---|---|---|---|---|---|---|---|---|---|
| 1300 ± 200 years - Unknown | Evidence from Correlation: Tephrochronology | ||||||||||||||||||||||||
|
List of 3 Events for Episode 1 at Crater south of Víti
|
|||||||||||||||||||||||||
0850 (?) Confirmed Eruption (Explosive / Effusive) VEI: 0
| Episode 1 | Eruption (Explosive / Effusive) | Daleldar, Svortuborgir | |||||||||||||||||||
|---|---|---|---|---|---|---|---|---|---|---|---|---|---|---|---|---|---|---|---|---|
| 0850 (?) - Unknown | Evidence from Correlation: Tephrochronology | |||||||||||||||||||
|
List of 2 Events for Episode 1 at Daleldar, Svortuborgir
|
||||||||||||||||||||
0250 ± 300 years Confirmed Eruption (Explosive / Effusive) VEI: 0
| Episode 1 | Eruption (Explosive / Effusive) | Kerlingarholar | |||||||||||||||||||
|---|---|---|---|---|---|---|---|---|---|---|---|---|---|---|---|---|---|---|---|---|
| 0250 ± 300 years - Unknown | Evidence from Correlation: Tephrochronology | |||||||||||||||||||
|
List of 2 Events for Episode 1 at Kerlingarholar
|
||||||||||||||||||||
0050 BCE (?) Confirmed Eruption (Explosive / Effusive) VEI: 2
| Episode 1 | Eruption (Explosive / Effusive) | Holseldar | |||||||||||||||||||||||||||||
|---|---|---|---|---|---|---|---|---|---|---|---|---|---|---|---|---|---|---|---|---|---|---|---|---|---|---|---|---|---|---|
| 0050 BCE (?) - Unknown | Evidence from Correlation: Tephrochronology | |||||||||||||||||||||||||||||
|
List of 4 Events for Episode 1 at Holseldar
|
||||||||||||||||||||||||||||||
0500 BCE ± 300 years Confirmed Eruption (Explosive / Effusive) VEI: 0
| Episode 1 | Eruption (Explosive / Effusive) | North of Hverfjall | |||||||||||||||||||
|---|---|---|---|---|---|---|---|---|---|---|---|---|---|---|---|---|---|---|---|---|
| 0500 BCE ± 300 years - Unknown | Evidence from Correlation: Tephrochronology | |||||||||||||||||||
|
List of 2 Events for Episode 1 at North of Hverfjall
|
||||||||||||||||||||
0650 BCE (?) Confirmed Eruption (Explosive / Effusive) VEI: 4
| Episode 1 | Eruption (Explosive / Effusive) | Hverfjall, Jarbadsholar | ||||||||||||||||||||||||||||||||||
|---|---|---|---|---|---|---|---|---|---|---|---|---|---|---|---|---|---|---|---|---|---|---|---|---|---|---|---|---|---|---|---|---|---|---|---|
| 0650 BCE (?) - Unknown | Evidence from Correlation: Tephrochronology | ||||||||||||||||||||||||||||||||||
|
List of 5 Events for Episode 1 at Hverfjall, Jarbadsholar
|
|||||||||||||||||||||||||||||||||||
3050 BCE (?) Confirmed Eruption (Explosive / Effusive) VEI: 0
| Episode 1 | Eruption (Explosive / Effusive) | Hvannstód | |||||||||||||||||||
|---|---|---|---|---|---|---|---|---|---|---|---|---|---|---|---|---|---|---|---|---|
| 3050 BCE (?) - Unknown | Evidence from Isotopic: 14C (uncalibrated) | |||||||||||||||||||
|
List of 2 Events for Episode 1 at Hvannstód
|
||||||||||||||||||||
6500 BCE (?) Confirmed Eruption (Explosive / Effusive)
| Episode 1 | Eruption (Explosive / Effusive) | Kröfluhalshraun | ||||||||||||||
|---|---|---|---|---|---|---|---|---|---|---|---|---|---|---|---|
| 6500 BCE (?) - Unknown | Evidence from Correlation: Tephrochronology | ||||||||||||||
|
List of 1 Events for Episode 1 at Kröfluhalshraun
|
|||||||||||||||
6800 BCE (?) Confirmed Eruption (Explosive / Effusive) VEI: 2 (?)
| Episode 1 | Eruption (Explosive / Effusive) | Hveragil | |||||||||||||||||||
|---|---|---|---|---|---|---|---|---|---|---|---|---|---|---|---|---|---|---|---|---|
| 6800 BCE (?) - Unknown | Evidence from Correlation: Tephrochronology | |||||||||||||||||||
|
List of 2 Events for Episode 1 at Hveragil
|
||||||||||||||||||||
6850 BCE (?) Confirmed Eruption (Explosive / Effusive) VEI: 2 (?)
| Episode 1 | Eruption (Explosive / Effusive) | Bondholshraun, Hveragil | ||||||||||||||||||||||||
|---|---|---|---|---|---|---|---|---|---|---|---|---|---|---|---|---|---|---|---|---|---|---|---|---|---|
| 6850 BCE (?) - Unknown | Evidence from Correlation: Tephrochronology | ||||||||||||||||||||||||
|
List of 3 Events for Episode 1 at Bondholshraun, Hveragil
|
|||||||||||||||||||||||||
8500 BCE (?) Confirmed Eruption (Explosive / Effusive) VEI: 0
| Episode 1 | Eruption (Explosive / Effusive) | Gjastykkisbunga | |||||||||||||||||||||||||||||
|---|---|---|---|---|---|---|---|---|---|---|---|---|---|---|---|---|---|---|---|---|---|---|---|---|---|---|---|---|---|---|
| 8500 BCE (?) - Unknown | Evidence from Correlation: Tephrochronology | |||||||||||||||||||||||||||||
|
List of 4 Events for Episode 1 at Gjastykkisbunga
|
||||||||||||||||||||||||||||||
This compilation of synonyms and subsidiary features may not be comprehensive. Features are organized into four major categories: Cones, Craters, Domes, and Thermal Features. Synonyms of features appear indented below the primary name. In some cases additional feature type, elevation, or location details are provided.
Cones |
||||
| Feature Name | Feature Type | Elevation | Latitude | Longitude |
| Gjastykkisbunga | Shield volcano | 65° 47' 0.00" N | 16° 46' 0.00" W | |
| Hverfjall | Tuff ring | 420 m | 65° 36' 0.00" N | 16° 53' 0.00" W |
Craters |
||||
| Feature Name | Feature Type | Elevation | Latitude | Longitude |
| Bjarnarflag
Jardbadsholar Bjarnargigar |
Crater Row | 65° 38' 0.00" N | 16° 51' 0.00" W | |
| Daleldar | Crater Row | 65° 39' 0.00" N | 16° 49' 0.00" W | |
| Dalfjall
Hlidarsel |
Fissure vent | 65° 40' 0.00" N | 16° 50' 0.00" W | |
| Gaesafjallarani | Fissure vent | |||
| Holseldar | Crater Row | 65° 42' 0.00" N | 16° 43' 0.00" W | |
| Hrafntinnuhryggur | Fissure vent | 706 m | ||
| Hrossadaliur
Hrossagigar Horossadal Brunaborg |
Crater Row | 65° 39' 0.00" N | 16° 51' 0.00" W | |
| Hvannstod | Crater Row | 600 m | 65° 44' 0.00" N | 16° 52' 0.00" W |
| Hveragil | Crater | 65° 42' 0.00" N | 16° 46' 0.00" W | |
| Kerlingarholar | Fissure vent | 240 m | 65° 58' 0.00" N | 16° 43' 0.00" W |
| Kroflueldar | Crater Row | 65° 43' 0.00" N | 16° 47' 0.00" W | |
| Leirhnjukur
Leirhnukur Leirhnukagigar |
Crater Row | 65° 44' 0.00" N | 16° 49' 0.00" W | |
| Myvatnseldar | Crater Row | 65° 44' 0.00" N | 16° 49' 0.00" W | |
| Namafjall-Kröfluhals | Crater Row | 65° 38' 0.00" N | 16° 49' 0.00" W | |
| Svortuborgir | Crater Row | 65° 38' 0.00" N | 16° 49' 0.00" W | |
| Viti
Helviti |
Maar | 620 m | 65° 43' 0.00" N | 16° 45' 0.00" W |
Domes |
||||
| Feature Name | Feature Type | Elevation | Latitude | Longitude |
| Hágöng | Dome | |||
| Hlídarfjall | Dome | |||
| Jörundur | Dome | |||
Thermal |
||||
| Feature Name | Feature Type | Elevation | Latitude | Longitude |
| Námafjall | Thermal | 374 m | 65° 38' 0.00" N | 16° 51' 0.00" W |
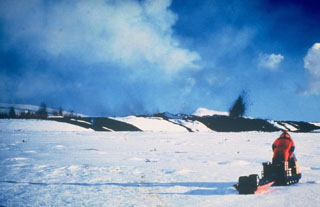 Two scientists of the Nordic Volcanological Institute doing monitoring fieldwork on 16 March 1980 were able to document the onset of activity when deflation started and an eruption began. Small dark lava fountains can be seen in a line on the left, indicating the location of a fissure, with a single larger fountain on the right which may represent a vent on the end of the fissure. Dark lava flows can be seen on the snow. A few minutes after this photo was taken a lava flow rapidly advanced in their direction, prompting them to retreat on their snowmobiles.
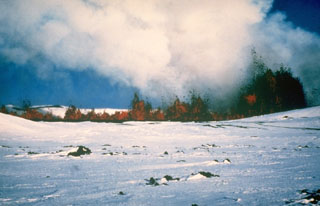 Lava fountains rise above an eruptive fissure cutting the snow-covered floor of Krafla caldera on 16 March 1980. This eruptive episode, the first of four during 1980, lasted only six hours. The fissure was active along a total length of 4.5 km, although the longest continually active segment was 800 m long. Most of the lava effusion took place during the first two hours. Eight separate lava flows were erupted, covering an area of 1.3 km2 to a depth of 2 m.
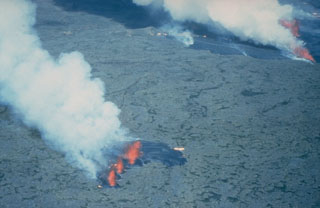 The third of four eruptive periods at Krafla during 1980 began on 10 July. The July eruption was preceded by the onset of rapid inflation, which was detected by monitoring instruments of the Nordic Volcanological Institute four hours prior to the start of surface activity. This allowed planes to be in the air to take this photo only 30 seconds after the onset of the eruption. Lava fountains rise over several newly opened eruptive fissures, and dark lava flows begin to pour over lighter-colored flows from previous eruptions.
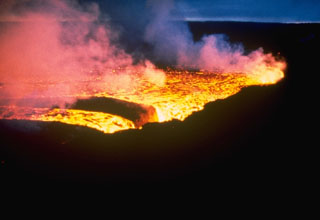 One spectacular feature of the July 1980 eruption at Krafla was the cascading of a 200-m-wide lava flow into an open preexisting fissure. Lava flowed into the fissure for several hours without filling it.
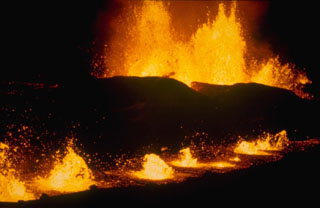 The last phase of the 1980 Krafla eruption began on 18 October, after a three-month period of quiescence. By the second night of the eruption, photographed here, activity was concentrated along two parallel eruptive fissures. Powerful lava fountains rose above the background fissure. The fissure in the foreground was less active but contained an elongated lava pond above which a row of small lava fountains formed.
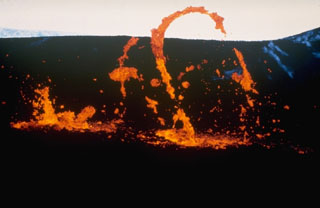 Ribbons of molten lava are thrown from a vent at Krafla volcano in October 1980 during a period of low-intensity activity. Four eruptive episodes occurred at Krafla during 1980. One of these, a brief episode of phreatic activity on 15 June, was explosive. The other three eruptive phases, in March, July, and October, were dominantly effusive.
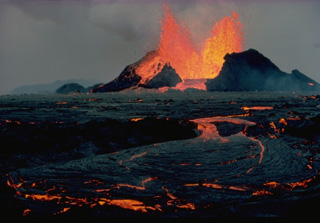 Lava fountains feed an incandescent lava flow at Krafla in September 1984. The eruption began on September 4, following a quiet interval of 33 months, from fissures extending 8.5 km north from Leirhnjukúr. Lava production was highest at the northern end of the fissure. The eruption lasted until September 18, and marked the end of an intermittent eruptive episode at Krafla that began in 1975.
 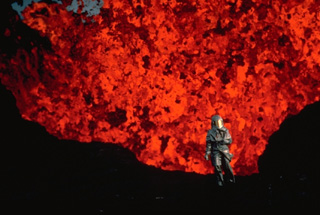 In 1984, Volcanologist Katia Krafft, wearing reflective heat-resistant gear, observes an incandescent lava fountain from Krafla volcano at close hand. The 1984 eruption marked the end of an intermittent decade-long eruptive episode from Krafla that began in 1975.
 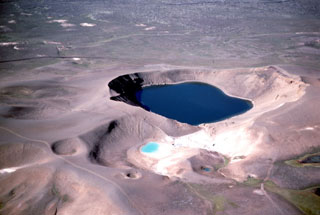 An explosive eruption in 1724 during which the 350-m-diameter Viti Crater and 14 other smaller craters formed marked the start of a five-year-long period of rifting and eruptions known as the "Myvatn Fires." Viti and neighboring smaller craters, seen here from the east, were formed during a brief eruption on 17-18 May 1724. The eruption and accompanying earthquakes caused people living on farms east of Myvatn lake to flee.
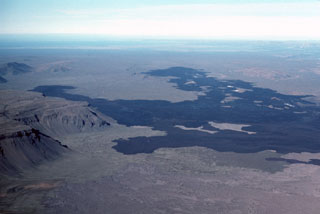 The dark lava flow field of the 1975-1984 rifting episode of Krafla extends about 16 km N into the distance, and reached the base of the eastern Gæsafjöll cliffs (left). One of Iceland’s table mountains, Gæsafjöll formed as a result of repeated eruptions through a glacial icecap.
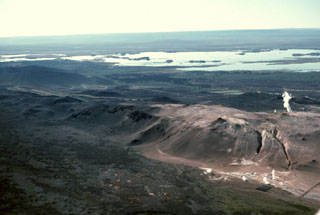 The Námafjall hyaloclastic ridge, formed as a result of subglacial eruptions, cuts diagonally across the foreground of the photo, with Mývatn lake in the middle distance to the SW. The discoloration of the ground on and around the ridge is due to the geothermal activity causing alteration in the rocks. Steam plumes can be seen both in front and behind the ridge from geothermal sites. The site in the foreground at the bottom of the ridge is Hverir, a geothermal tourist attraction.
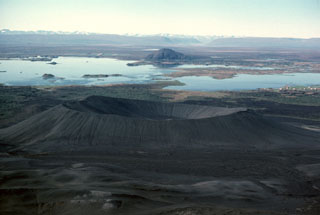 The Hverfjall tuff ring (foreground) developed during phreatomagmatic explosions at the southern end of a 23-km-long fissure. This tuff ring is the largest of the Krafla volcanic system, with a crater about 1 km wide. Lava-dammed Mývatn lake, in the background to the west, provides wildlife habitat and is renowned for its diversity of bird life. The lake has formed on lava flows from nearby Heiðarsporðar volcano, which surround Vindbelgjarfjall, the dome seen on the far side of the lake.
 The 350-m-diameter Viti Crater (right center) and 14 other smaller craters were formed during 1724 at the start of a five-year period of rifting and eruptions known as the "Myvatn Fires." Krafla mountain, located east of Viti (upper left), is composed of hyaloclastic rocks formed during subglacial eruptions. It is one of the most prominent features in the Krafla caldera. The 1724 eruption forming Viti maar produced tephra fall over 12 km.
 This power plant (lower right) is part of a large geothermal development south of the Krafla caldera. The Krafla ridge in the background is seen from the SW, with steam rising from the geothermal wells. The northeastern caldera rim forms the horizon on the left.
 Lava fountains erupting along a fissure at Iceland's Krafla volcano early in the morning on 5 September 1984. A gas plume is visible along the length of the fissure. During the first hours of the eruption, which began just before midnight on the 4th, two eruptive fissures joined to become active along a total length of 8.5 km.
 A steam plume rises above a line of small lava fountains on 5 September 1984, the day after the onset of an eruption from an 8.5-km-long fissure extending north from Leirhnjúkur. During the first hours of the eruption, the fissure was active along its entire length, producing a sheet of pahoehoe lava, but later activity was concentrated at a single vent near the northern end of the fissure. This fissure eruption was the last of a decade-long series of Krafla eruptions beginning in 1975 that accompanied an episode of crustal spreading.
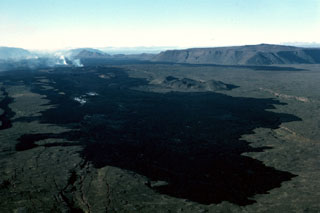 At their northern terminus the 1984 flows form a dark lava field north of Krafla caldera. The northernmost eruptive vents can be seen steaming at the upper left on 10 September 1984, about halfway through the two-week eruption. The flat-topped peak at the upper right is Gæsafjöll, one of Iceland's many table mountains, which formed as a result of repeated eruptions through a glacial icecap. The Hliðarfjall dome can be seen as a peak in the middle-background, and Bláfjall and Sellandafjall table mountains are on the horizon on the left, about 50 km away.
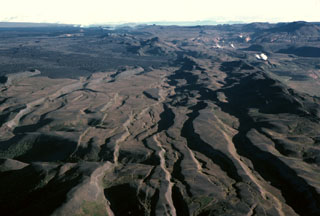 This north-looking view along fissures cutting Iceland's Krafla volcano illustrates crustal spreading processes where the Mid-Atlantic Ridge rises above sea level. The prominent horst-and-graben structures seen here are the result of repeated episodes of extensional rifting during which crustal blocks moved east and west, perpendicular to the line of faults. A period of pronounced crustal rifting occurred from 1975 to 1984, accompanied by nine small fissure eruptions. Steam can be seen in the upper left, rising above an active eruptive fissure in this September 1984 photo.
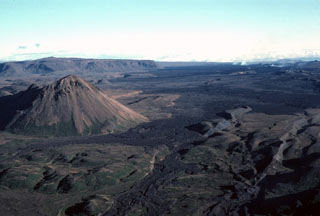 The Krafla central volcano, located NE of Mývatn lake, is a topographically indistinct 9-km-wide caldera that is cut by a N-S-trending fissure system. This view from the south looks toward the center of the caldera with the rhyolitic lava dome of Hlidarfjall on the left and prominent fissures cutting across the caldera at the right.
 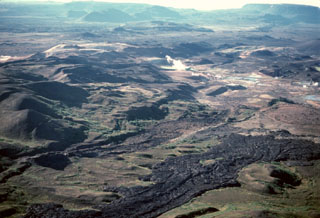 The dark lava flows in the foreground were emplaced during a series of eruptions known as the "Myvatn Fires" between 1724 and 1729. Lava flows covered much of the western floor of Krafla caldera and extended beyond the caldera to the north, and south into Myvatn lake. It is these southern flows seen here, with small lakes and a steam plume in the Namafjall and Myvatn geothermal areas at their distal end (center). The Hverfjall cone is just out of view to the top right.
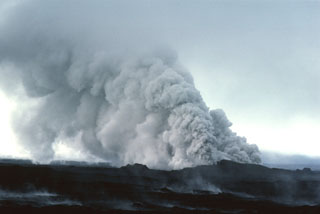 On 13 September 1984 groundwater gained access to the eruptive fissure at Krafla, producing these clouds of steam and ash. The two-week eruption, which began on 4 September 1984, was dominantly effusive, and produced 0.12 km3 of lava flows from an 8.5-km-long fissure.
 Three generations of an Icelandic family view the 1984 eruption of Krafla volcano as minor lava fountaining can be seen at the spatter cone in the background. The two-week eruption drew visitors from the nearby Myvatn area as well as other parts of Iceland to observe spectacular lava fountaining and slowly advancing lava flows.
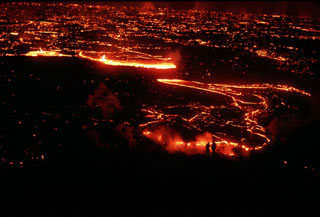 Scientists investigating a lava flow from Krafla volcano are silhouetted (lower right) against the glowing margin of the slowly advancing flow. This photo was taken on 5 September 1984, the day after the onset of an eruption from the Leihrnjúkur fissure. Cracks on the surface of the advancing flow reveal the still-molten interior.
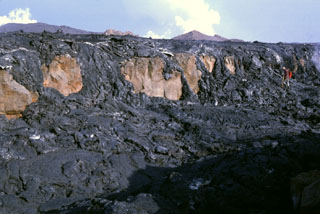 Fresh black pahoehoe lava flows from the 1984 eruption of Krafla drape the Gjastikki fault, whose escarpment forms the brownish cliff surfaces. Note the geologist at the upper right for scale (with red backpack). The still-steaming lava flow, photographed here on 7 September, is only days old and partially buries the fault, which was produced during a previous rifting episode. The steaming cones in the background indicate the location of the vents.
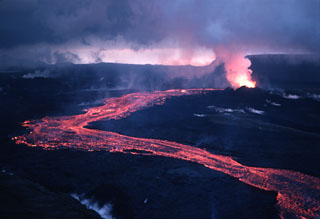 An incandescent lava flow travels downslope from the vent at the upper right during a September 1984 eruption from Krafla volcano. The eruption initially began on 4 September along an 8.5-km-long fissure; during later stages activity was localized along singular vents such as the one seen in this 15 September photo. A plume of gas is concentrated over the vent, but steam is also seen rising across much of this photograph, from recent lava flows.
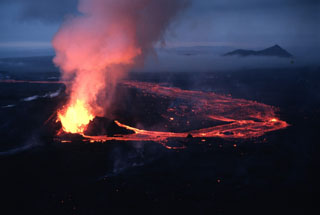 Lava fountains rising from a vent along an eruptive fissure at Krafla feed an incandescent lava flow that travels east and then turns toward the north. This 15 September 1984 photo was taken near the end of a two-week eruption. An 8.5-km-long fissure, initially active along its entire length, fed lava flows that covered 24 km2. The peak rising above the clouds on the right is Eilifur, which likely formed in the Pleistocene.
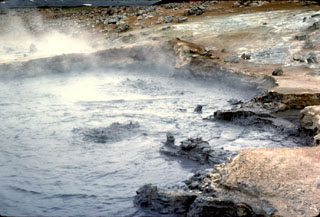 The Námafjall and Myvatn geothermal areas contains boiling mudpots such as these, numerous fumaroles, hot pools, and extensive areas of hydrothermally altered ground (the lighter-colored ground surface). Thermal activity keeps the ground warm enough in nearby areas so that there is no risk of frost at night. Farmers have taken advantage of this natural heat source to grow potatoes in an area of northern Iceland where that would normally not be possible.
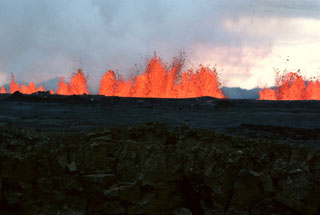 Incandescent lava fountains rise from an eruptive fissure at Krafla volcano in NE Iceland on 6 September 1984. After a quiet interval of 33 months, an eruption began on 4 September along a fissure extending from Leirhnjúkur 8.5 km N. Initially, the fissure was active along its entire length, but later lava production was highest at the northern end.
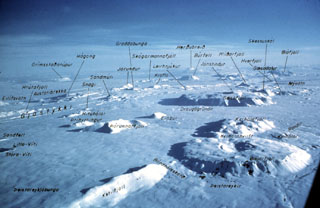 An aerial view from the north shows features of the Theistareykjabunga and Krafla volcanic systems. The low-relief Theistareykjabunga volcano, with the Stora-Viti and Litla-Viti summit craters, appears at the lower left. The topographically indistinct Krafla caldera (center) is cut by prominent fissure swarms. The flat, mesa-like areas at the right and other topographically prominent features throughout the photo are table mountains and ridges formed during Pleistocene subglacial eruptions.
The following 6 samples associated with this volcano can be found in the Smithsonian's NMNH Department of Mineral Sciences collections, and may be availble for research (contact the Rock and Ore Collections Manager). Catalog number links will open a window with more information.
| Catalog Number | Sample Description | Lava Source | Collection Date |
|---|---|---|---|
| NMNH 115380-1 | Lava | -- | -- |
| NMNH 115380-2 | Lava | -- | -- |
| NMNH 115380-3 | Lava | -- | -- |
| NMNH 115380-4 | Lava | -- | -- |
| NMNH 115380-5 | Lava | -- | -- |
| NMNH 115380-6 | Lava | -- | -- |
| Catalogue of Icelandic Volcanoes (Link to Krafla) | The Catalogue of Icelandic Volcanoes is an interactive, web-based tool, containing information on volcanic systems that belong to the active volcanic zones of Iceland. It is a collaboration of the Icelandic Meteorological Office (the state volcano observatory), the Institute of Earth Sciences at the University of Iceland, and the Civil Protection Department of the National Commissioner of the Iceland Police, with contributions from a large number of specialists in Iceland and elsewhere. This official publication is intended to serve as an accurate and up-to-date source of information about active volcanoes in Iceland and their characteristics. The Catalogue forms a part of an integrated volcanic risk assessment project in Iceland GOSVÁ (commenced in 2012), as well as being part of the effort of FUTUREVOLC (2012-2016) on establishing an Icelandic volcano supersite. |
| Copernicus Browser | The Copernicus Browser replaced the Sentinel Hub Playground browser in 2023, to provide access to Earth observation archives from the Copernicus Data Space Ecosystem, the main distribution platform for data from the EU Copernicus missions. |
| MIROVA | Middle InfraRed Observation of Volcanic Activity (MIROVA) is a near real time volcanic hot-spot detection system based on the analysis of MODIS (Moderate Resolution Imaging Spectroradiometer) data. In particular, MIROVA uses the Middle InfraRed Radiation (MIR), measured over target volcanoes, in order to detect, locate and measure the heat radiation sourced from volcanic activity. |
| MODVOLC Thermal Alerts | Using infrared satellite Moderate Resolution Imaging Spectroradiometer (MODIS) data, scientists at the Hawai'i Institute of Geophysics and Planetology, University of Hawai'i, developed an automated system called MODVOLC to map thermal hot-spots in near real time. For each MODIS image, the algorithm automatically scans each 1 km pixel within it to check for high-temperature hot-spots. When one is found the date, time, location, and intensity are recorded. MODIS looks at every square km of the Earth every 48 hours, once during the day and once during the night, and the presence of two MODIS sensors in space allows at least four hot-spot observations every two days. Each day updated global maps are compiled to display the locations of all hot spots detected in the previous 24 hours. There is a drop-down list with volcano names which allow users to 'zoom-in' and examine the distribution of hot-spots at a variety of spatial scales. |
|
WOVOdat
Single Volcano View Temporal Evolution of Unrest Side by Side Volcanoes |
WOVOdat is a database of volcanic unrest; instrumentally and visually recorded changes in seismicity, ground deformation, gas emission, and other parameters from their normal baselines. It is sponsored by the World Organization of Volcano Observatories (WOVO) and presently hosted at the Earth Observatory of Singapore.
GVMID Data on Volcano Monitoring Infrastructure The Global Volcano Monitoring Infrastructure Database GVMID, is aimed at documenting and improving capabilities of volcano monitoring from the ground and space. GVMID should provide a snapshot and baseline view of the techniques and instrumentation that are in place at various volcanoes, which can be use by volcano observatories as reference to setup new monitoring system or improving networks at a specific volcano. These data will allow identification of what monitoring gaps exist, which can be then targeted by remote sensing infrastructure and future instrument deployments. |
| Volcanic Hazard Maps | The IAVCEI Commission on Volcanic Hazards and Risk has a Volcanic Hazard Maps database designed to serve as a resource for hazard mappers (or other interested parties) to explore how common issues in hazard map development have been addressed at different volcanoes, in different countries, for different hazards, and for different intended audiences. In addition to the comprehensive, searchable Volcanic Hazard Maps Database, this website contains information about diversity of volcanic hazard maps, illustrated using examples from the database. This site is for educational purposes related to volcanic hazard maps. Hazard maps found on this website should not be used for emergency purposes. For the most recent, official hazard map for a particular volcano, please seek out the proper institutional authorities on the matter. |
| IRIS seismic stations/networks | Incorporated Research Institutions for Seismology (IRIS) Data Services map showing the location of seismic stations from all available networks (permanent or temporary) within a radius of 0.18° (about 20 km at mid-latitudes) from the given location of Krafla. Users can customize a variety of filters and options in the left panel. Note that if there are no stations are known the map will default to show the entire world with a "No data matched request" error notice. |
| UNAVCO GPS/GNSS stations | Geodetic Data Services map from UNAVCO showing the location of GPS/GNSS stations from all available networks (permanent or temporary) within a radius of 20 km from the given location of Krafla. Users can customize the data search based on station or network names, location, and time window. Requires Adobe Flash Player. |
| DECADE Data | The DECADE portal, still in the developmental stage, serves as an example of the proposed interoperability between The Smithsonian Institution's Global Volcanism Program, the Mapping Gas Emissions (MaGa) Database, and the EarthChem Geochemical Portal. The Deep Earth Carbon Degassing (DECADE) initiative seeks to use new and established technologies to determine accurate global fluxes of volcanic CO2 to the atmosphere, but installing CO2 monitoring networks on 20 of the world's 150 most actively degassing volcanoes. The group uses related laboratory-based studies (direct gas sampling and analysis, melt inclusions) to provide new data for direct degassing of deep earth carbon to the atmosphere. |
| Large Eruptions of Krafla | Information about large Quaternary eruptions (VEI >= 4) is cataloged in the Large Magnitude Explosive Volcanic Eruptions (LaMEVE) database of the Volcano Global Risk Identification and Analysis Project (VOGRIPA). |
| EarthChem | EarthChem develops and maintains databases, software, and services that support the preservation, discovery, access and analysis of geochemical data, and facilitate their integration with the broad array of other available earth science parameters. EarthChem is operated by a joint team of disciplinary scientists, data scientists, data managers and information technology developers who are part of the NSF-funded data facility Integrated Earth Data Applications (IEDA). IEDA is a collaborative effort of EarthChem and the Marine Geoscience Data System (MGDS). |