Partial dome collapse triggers a pyroclastic flow
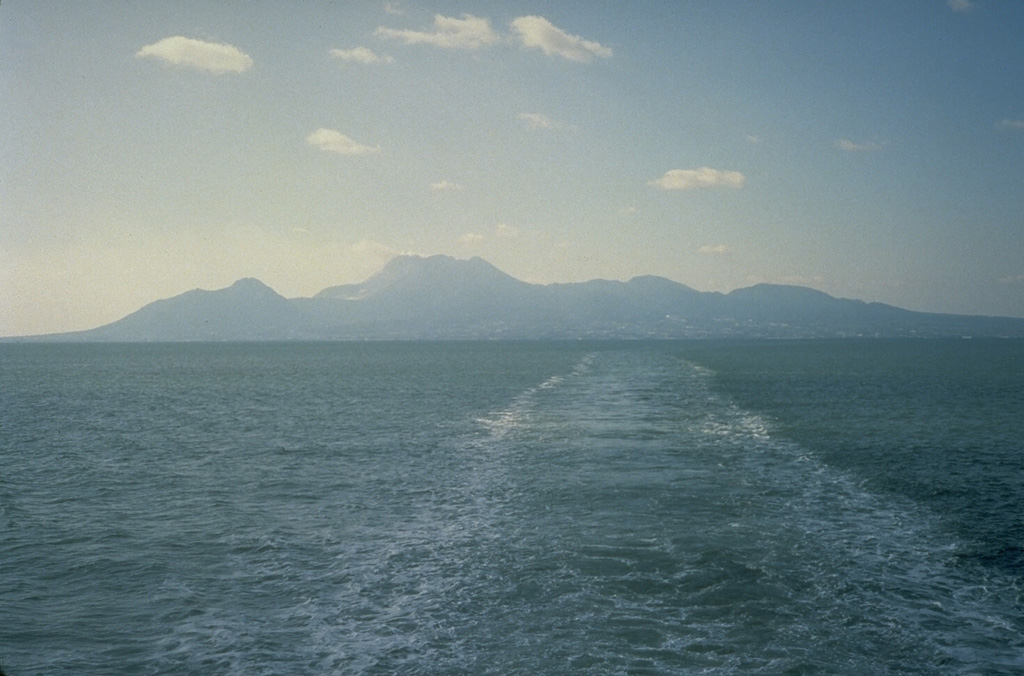
On 1 May a pyroclastic flow was triggered by the partial collapse of an unstable lava dome. Dome collapse causing pyroclastic flows was a common occurrence during the 1990-1995 eruption. Pyroclastic flows began again in February, and tremor was recorded in March. The large Unzen volcanic complex covers much of the Shimabara Peninsula E of Nagasaki. Mayu-yama lava dome was the source of a devastating 1792 avalanche and tsunami.
Information Contacts: Japan Meteorological Agency (JMA), Volcanological Division, Seismological and Volcanological Department, 1-3-4 Ote-machi, Chiyoda-ku, Tokyo 100, Japan.
The Global Volcanism Program has no Weekly Reports available for Unzendake.
Reports are organized chronologically and indexed below by Month/Year (Publication Volume:Number), and include a one-line summary. Click on the index link or scroll down to read the reports.
Earthquake swarm
Local seismic activity, which had increased since May, peaked in August when 6,370 seismic events, including 409 felt events, were recorded (figure 1). During the evening of 6 August the number of recorded earthquakes increased rapidly (table 1). Two large felt shocks and several minor felt shocks occurred within 10 minutes, causing 10 landslides and injuring two persons. Seismic activity has since declined, but remained above normal as of 26 September.
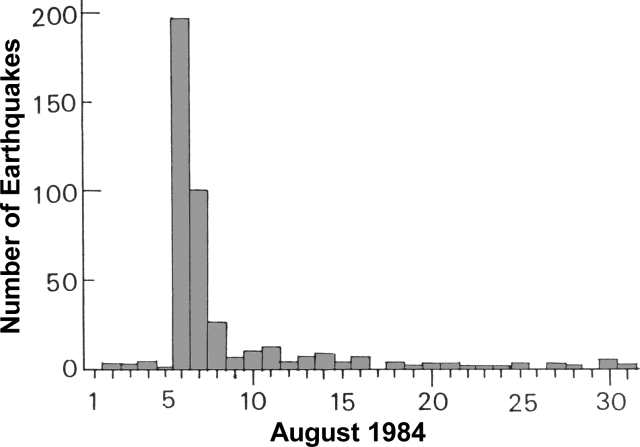 |
Figure 1. Daily number of felt earthquakes at Unzen Volcano, August 1984. Courtesy of JMA. |
Table 1. Earthquakes of M >= 4.0, 6 August 1984. Intensities are measured at the JMA Unzendake Weather Station, using the JMA scale (0-VII).
| Time | Magnitude | Depth of Focus | Intensity |
| 1728 | 4.8 | 6 km | IV |
| 1730 | 5.7 | 7 km | I |
| 1735 | 4.0 | 15 km | I |
| 1738 | 5.0 | 11 km | V |
| 1841 | 4.1 | 10 km | IV |
| 1949 | 4.0 | 8 km | IV |
Epicenters of the swarm, determined by the JMA seismic network, were concentrated on the W coast of Shimabara Peninsula about 8 km W of Fuken-dake, the most recently active peak of the Unzen Volcano Complex (figure 2). The depth of seismic sources deepened from E to W (figure 2, inset). The characteristic hypocenter distribution coincides with previous results from the University of Kyoto and JMA. Earthquake swarms without eruption have often occurred at Unzen.
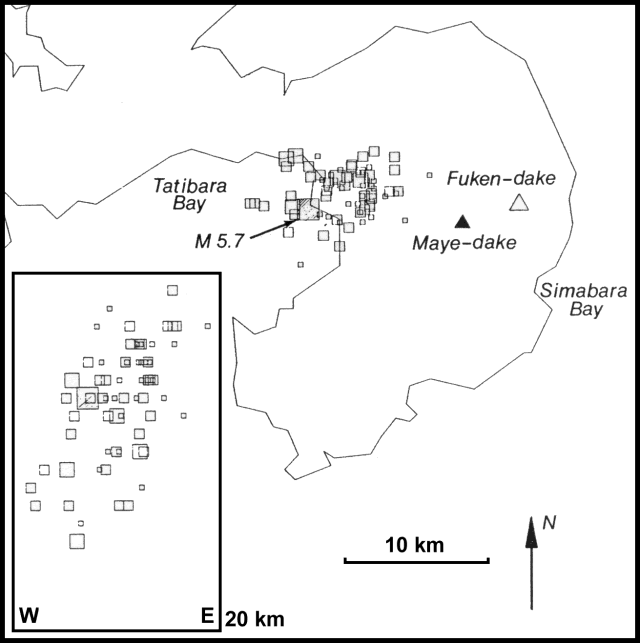 |
Figure 2. Map of Shimabara Peninsula. The Unzen Volcanic Complex occupies most of the peninsula. Fuken-dake (open triangle), Maye-dake (solid triangle) and epicenters of events, 6 August, 1300-7 August, 0325 (open squares) are shown. The E-W cross-section (inset) shows a depth range from the surface to 20 km. Courtesy of JMA. |
No eruptive activity has been observed since 1792, when explosions at Fuken-dake in February were followed by lava extrusion in March, and earthquakes and landslides in April and May. On 21 May an avalanche from Maye-dake (near the E coast), caused by an earthquake, created a major tsunami in Shimabara Bay that caused [15,000] fatalities and much destruction.
Further Reference. Sawada, Y., 1978, Seismic activity at Unzen-dake volcano and the unusual number of its occurrence and frequency: Papers in Meteorology & Geophysics, v. 29, p. 83-96.
Information Contacts: JMA, Tokyo; Kyodo News Service, Tokyo.
397 events recorded during two-day earthquake swarm; weak volcanic tremor episodes
A M 3.9 earthquake struck 3 km W of Hugendake, the summit peak of Unzen, on 7 July. An earthquake swarm began on 24 July and continued the next day. During the two-day swarm, 397 events were recorded and 26 shocks were felt [at UWS]. The strongest swarm event, M 2.3, occurred at 2206 on 24 July. The monthly number of recorded earthquakes was 922 (figure 3), 34 of which were felt. Most of the earthquakes were centered 5-10 km W of the summit.
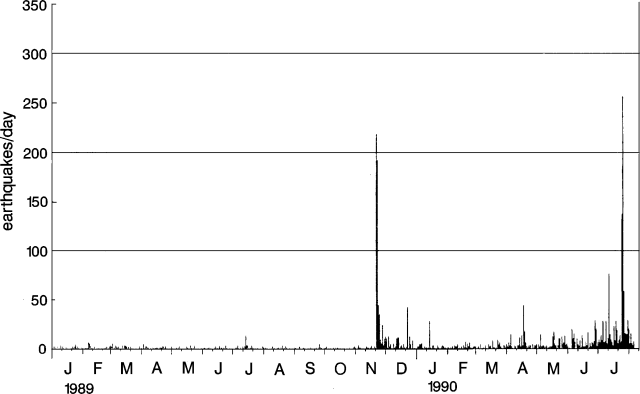 |
Figure 3. Daily number of earthquakes at Unzen, January 1989-5 August 1990. Courtesy of JMA. |
Weak volcanic tremor episodes were recorded on 4, 5, and 30 July, and 1, 5, and 6 August. Each episode lasted between 20 and 100 seconds. [No volcanic tremor had been recorded since the beginning of seismic observation in 1966.]
Further Reference. Shimizu, H., and Matsuo, N., 1988, Seismic activity and tectonic stress in the Unzen volcanic region: Proceedings, Kagoshima International Conference on Volcanoes, p. 339-341.
Information Contacts: JMA.
Seismicity declines slightly
Seismicity declined in August, but remained at high levels (345 earthquakes) . . . . Five earthquakes were felt [at UWS] and 56 tremor episodes were recorded (an increase from 11 in July). Tremor amplitude ranged from 0.2 to 0.9 [µm] (figure 4).
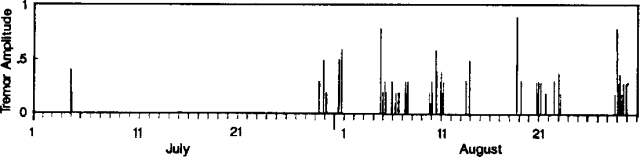 |
Figure 4. Amplitude of volcanic tremor at Unzen, July-August 1990. Courtesy of JMA. |
Information Contacts: JMA.
Seismicity declines, but still at high levels
Seismicity declined during September (248 earthquakes, from 345 in August), but remained at high levels (figure 5). Two earthquakes were felt [3.9] km SW of the volcano (at UWS) and 49 tremor episodes were recorded (a decrease from 56 in August). Tremor amplitude also decreased slightly, from 0.2-0.9 µm in August to 0.1-0.6 µm in September.
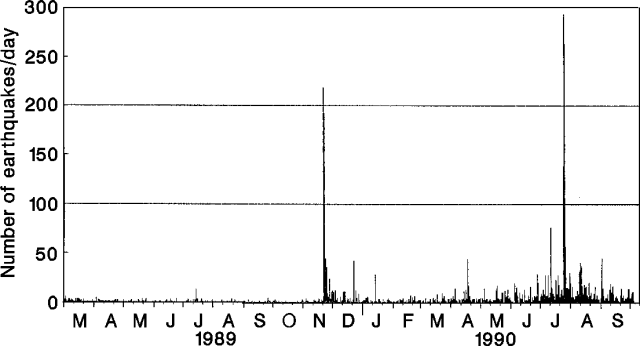 |
Figure 5. Daily number of earthquakes at Unzen, March 1989-early October 1990. Courtesy of JMA. |
Information Contacts: JMA.
Small gas/ash eruption follows several months of increased seismicity
Seismicity increased during October, with a monthly total of 549 recorded events (up from 251 in September); 15 shocks were felt 3.9 km SW of the volcano (at UWS). Earthquake swarms occurred on the 17th, 23rd, and 31st, and during the night of 13-14 November, when four shocks were felt at the weather station. Epicenters were located roughly in two groups, one in the central part of the Shimabara peninsula, the other in the sea about 15 km W of the summit (figure 6). The seismicity in the central part of the peninsula was the first there since July. Previous swarms were generally centered at sea.
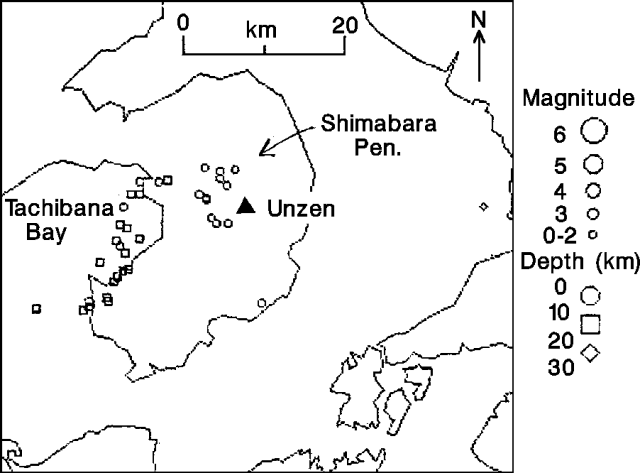 |
Figure 6. Epicentral distribution of earthquakes around Unzen, October 1990. Courtesy of JMA. |
Tremor resumed on 10 October after 20 days of absence, and as many as 10 episodes/day were recorded through the end of the month. The monthly total of 81 tremor episodes was an increase from 42 in September. Tremor amplitudes were similar to previous months.
Weak, continuous tremor started on seismographs near the volcano at 0322 on 17 November. By dawn (around 0600), an eruption had already begun and residents saw a white plume rising from the volcano; the exact start time of the eruption was unknown. An air and ground survey by JMA and Kyushu Univ revealed that two steam plumes were being continuously erupted from new E flank vents; one was [650] m E of the summit (Fugen-dake), the other about 100 m S of the first vent. The steam plumes were about 300 m high and occasionally contained ash. Weak ashfall was noted downwind. No explosion sounds were heard, and no clear shocks were recorded by seismographs. The amplitude of continuous tremor gradually declined during the day, fading away at around 1900. Steam was still being erupted from one of the vents the next day, and was continuing, but declining, through 19 November. Seismicity was unchanged after the eruption. No damage was reported.
Information Contacts: JMA.
Small gas/ash eruption from two new vents; continued seismicity
The following supplements the preliminary report of 17 November activity in 15:10.
Ground and aerial surveys [after the eruption began] by JMA and Kyushu Univ revealed that steam plumes were being continuously erupted from two new craters ~650 m E of the summit (Fugen-dake). One was at the E end of Jigoku-ato crater, the other was 100 m S of Jigoku-ato at the E end of Tsukumo-jima crater; the older craters were larger than the new active vents. The steam plumes were about 300-400 m high, occasionally containing ash on 17-18 November; weak ashfall was noted downwind. No explosion sounds were heard and no clear shocks were recorded. The amplitude of continuous tremor gradually declined, and tremor faded away at around 1900. Steam emission from the vent at Jigoku-ato crater stopped on 18 November, but a steam plume continued to rise from the vent at Tsukumo-jima crater through early December, gradually declining to a few tens of meters in height (figure 7). No damage was reported but a ropeway and an area within 2 km of the active vents were closed to tourists on the morning of 17 November.
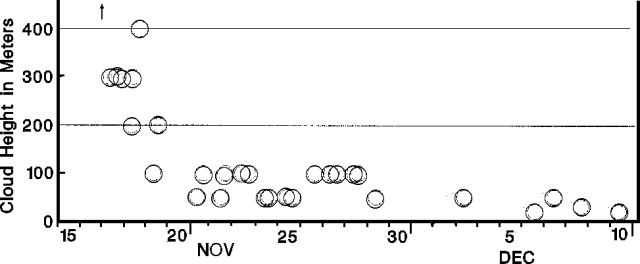 |
Figure 7. Estimated plume heights from Unzen, 17 November-10 December 1990. Courtesy of JMA. |
Earthquakes and tremor episodes had begun in July, with the strongest burst of activity on 25-26 July, and continued at relatively high levels September-November (tables 2 and 3). Seismic activity was almost unchanged before and after the eruption, although seismicity was somewhat stronger in November than during the three previous months. Earthquake swarms occurred at the volcano on 5, 13, 20, and 23 November, contributing to the month's total of 843 recorded events, up from 549 in October and 248 in September. Eighteen shocks were felt in November [at UWS], compared to 15 in October and two in September. The distribution of earthquakes (figure 8) was unchanged from October; most were about 5 km W of the summit at shallow depth. Normal seismicity continued weakly in the Tachibana Bay area about 15 km W of the summit. Few tremor episodes were recorded in the first half of November, but tremor increased in the second half of the month to levels similar to active periods in previous months. Tremor episodes totaled 46 in November, down from 81 in October, while amplitudes were similar to those of previous months. Earthquakes declined in early December, and as of 14 December, no tremor episodes had been recorded since 27 November.
Table 2. Earthquake swarms at Unzen, 1990. Courtesy of JMA.
| Date | Recorded Earthquakes | Felt Earthquakes |
| 07 Jul-08 Jul 1990 | 35 | 2 |
| 24 Jul-25 Jul 1990 | 432 | 26 |
| 09 Aug-11 Aug 1990 | 108 | 3 |
| 17 Oct 1990 | 56 | 0 |
| 23 Oct 1990 | 112 | 8 |
| 31 Oct 1990 | 115 | 2 |
| 05 Nov-06 Nov 1990 | 87 | 0 |
| 13 Nov 1990 | 76 | 4 |
| 20 Nov 1990 | 134 | 11 |
| 23 Nov 1990 | 136 | 1 |
Table 3. Monthly number of earthquakes and tremor episodes at Unzen, 1990. December data are through the 14th. Courtesy of JMA.
| Month | Recorded Earthquakes | Felt Events | Tremor Episodes |
| Jan 1990 | 74 | 0 | 0 |
| Feb 1990 | 53 | 1 | 0 |
| Mar 1990 | 66 | 0 | 0 |
| Apr 1990 | 162 | 1 | 0 |
| May 1990 | 149 | 2 | 0 |
| Jun 1990 | 208 | 1 | 0 |
| Jul 1990 | 922 | 34 | 11 |
| Aug 1990 | 345 | 6 | 56 |
| Sep 1990 | 248 | 2 | 45 |
| Oct 1990 | 549 | 15 | 81 |
| Nov 1990 | 843 | 18 | 46 |
| 01-14 Dec 1990 | 140 | 2 | 0 |
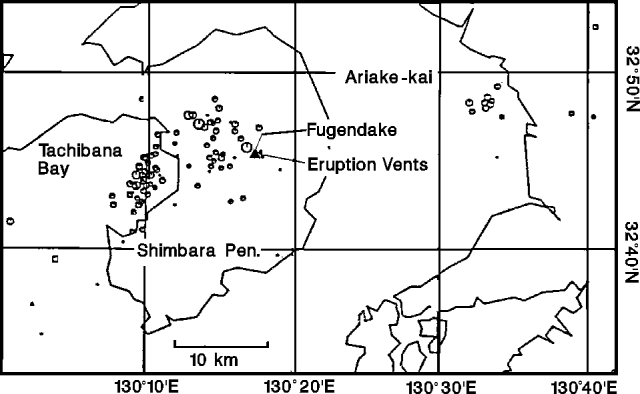 |
Figure 8. Earthquake epicenters in the vicinity of Unzen, July-November 1990. Seismicity typically occurs in Tachibana Bay, but began W of the summit (Fugen-dake) in July. Dots near Fugen-dake mark the 17 November eruption vents. Courtesy of JMA. |
Information Contacts: JMA.
Weak steam emissions from 17 November vent; decreased seismicity
Steam emission continued in December from the new vent in the E flank's Tsukuno-jima crater . . . . The emissions were 50-100 m high and included no ash. The monthly number of recorded earthquakes was 340 (no swarms were recorded), a drop from 843 in November (figure 9). Three shocks were felt, on 9 and 29 December. Epicenter distributions were unchanged from previous months, mainly concentrated on the W flank of the volcano.
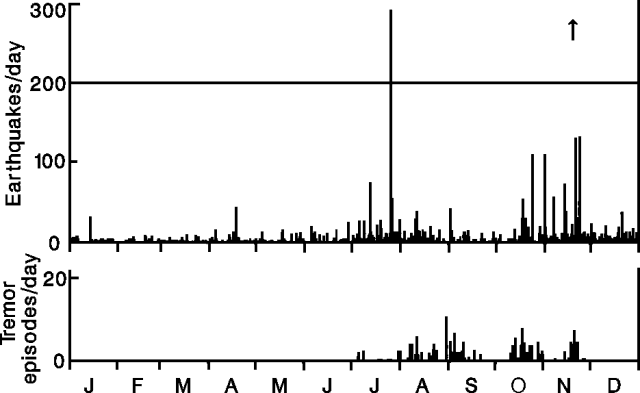 |
Figure 9. Daily number of earthquakes (top) and tremor episodes (bottom) at Unzen, 1990. An arrow marks the 17 November eruption. Courtesy of JMA. |
Information Contacts: JMA.
Ash eruption from new vent
Unzen began to erupt on the morning of 12 February for the first time since 17 November . . . . No explosion sounds were heard, and no clear shocks were detected by seismometers. The first reported eruption plume was noted around 0700 on 12 February, but the exact time of the eruption's onset is not known. Steam containing ash rose continuously throughout the day, reaching a maximum height of 500 m. Slight ashfall was recognized downwind in inhabited areas, reaching 7 km SE from the vent.
The eruption occurred from a new 50-m-long NW-SE line of small vents (named Byobu-iwa) 500 m E of Fugen-dake peak and 170 m WSW of Jigoku-ato crater, one of two that erupted on 17 November. By 1030 on 12 February, ash and lapilli deposits were 30 cm thick at an uninhabited shrine 10 m E of the vent's rim. No incandescence was seen and no juvenile material was detected in the ash. The eruption was considered to be phreatic. Emission of steam containing ash continued at similar levels throughout 13 February and persisted through the morning of 14 February.
The steam plume from Tsukumo-jima crater, emitted since 17 November, steadily declined in height through January and early February. Weak steam emission, reaching 10 m height, began in the middle of January in Jigoku-ato crater, which had been quiet since December.
Seismicity. An earthquake swarm took place on 15 January after 2 months of relative quiet (figure 10). Three shocks were felt during the swarm at UWS . . . . Another swarm took place at night on 13 February, and five shocks were felt at the station. Earthquakes were at shallow depth about 5 km W of Fugen-dake peak in January and February, the same epicentral zone as in previous months.
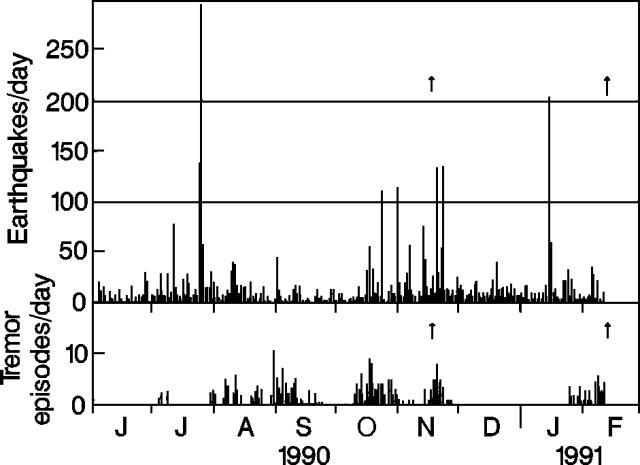 |
Figure 10. Daily number of recorded earthquakes (top) and tremor episodes (bottom) at Unzen, June 1990-early February 1991. Arrows mark small eruptions on 17 November and 12 February. Courtesy of JMA. |
Tremor began to be detected on 25 January . . . . Tremor characteristics were similar to July-November 1990; durations ranged from about 30 to 60 seconds and amplitudes were from 0 to 2 µm, a little larger than those of July-November (figure 11). Tremor occurrence was unchanged before and after the eruption.
 |
Figure 11. Amplitudes of tremor episodes at Unzen, June 1990-early February 1991. Arrows mark small eruptions on 17 November and 12 February. Courtesy of JMA. |
Information Contacts: JMA.
Ash emission declines; continued strong seismicity
No incandescence has been seen and no juvenile material has been detected in ash from the eruption that began on 12 February. Ash was present in steam plumes until the end of February. Near the vent, ash was 2-3 m thick by the end of February. Slight ashfall extended about 10 km downwind in February but there have been no reports of ashfall in early March. Steam emission gradually declined through early March (figure 12). Tsukumo-jima and Jigoku-ato craters, active in the November eruption remained quiet.
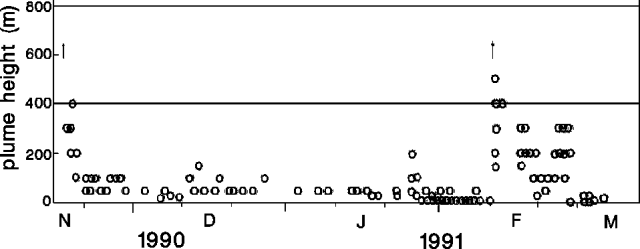 |
Figure 12. Height of steam cloud from Unzen, 17 November 1990-13 March 1991. Arrows mark eruptions on 17 November 1990 and 12 February 1991. Courtesy of JMA. |
Seismicity was at high levels and no changes were associated with the February eruption. Earthquake swarms were recorded on 13 and 27 February, and on 3 March (figure 13). Felt earthquakes appear in table 4. The 27 February swarm was the strongest since the initial swarm occurred on 25 July 1990. A seismometer near the summit recorded 937 earthquakes in February, up from 572 in January. Epicenters were concentrated 3-5 km W of the summit, unchanged from previous months. About five tremor episodes were recorded/day beginning 25 January. On 18 February, 22 episodes were recorded, the highest total since the first tremor episode in July 1990.
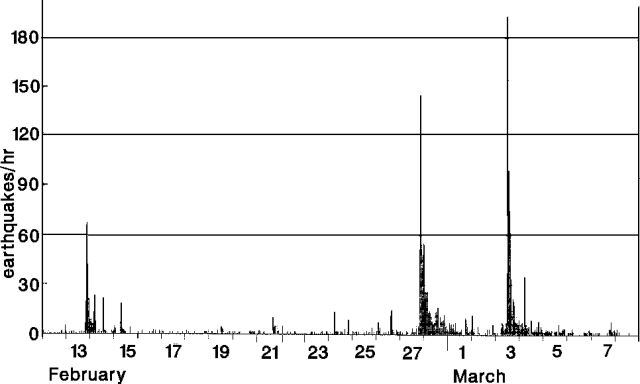 |
Figure 13. Hourly number of recorded earthquakes at Unzen, 12 February-8 March 1991. Courtesy of JMA. |
Table 4. Number of earthquakes felt at Unzendake Weather Station, 3.6 km SW of the summit, February-March 1991. Courtesy of JMA.
| Date | Felt Earthquakes |
| 05 Feb 1991 | 1 |
| 08 Feb 1991 | 1 |
| 13 Feb 1991 | 4 |
| 25 Feb 1991 | 1 |
| 26 Feb 1991 | 3 |
| 27 Feb 1991 | 28 |
| 28 Feb 1991 | 8 |
| 01 Mar 1991 | 2 |
| 03 Mar 1991 | 11 |
| 07 Mar 1991 | 1 |
| 10 Mar 1991 | 1 |
| 13 Mar 1991 | 1 |
| 17 Mar 1991 | 2 |
| 25 Mar 1991 | 1 |
| 28 Mar 1991 | 2 |
Information Contacts: JMA.
Ash emissions continue from three vents
Steam and ash emissions from the vent (Byobu-iwa) formed during the 12 February eruption continued through mid-April (table 5). Maximum plume heights were 300 m in March and 500 m in early April (figure 14). Ash had been erupted 16-20 March after steam emission increased. Simultaneous eruptions at Byobu-iwa and the two vents formed in the 17 November eruption (Jigoku-ato and Tsukumo-jima) were observed on 29 March and 3 and 9 April. All previous emissions had been confined to Byobu-iwa following the February eruption.
Table 5. Dates of ash emissions at Unzen, November 1990-12 April 1991. Courtesy of JMA.
| Eruption Date | Plume Height | Main Vent |
| 17-23 Nov 1990 | 400 m | Tsukumo, Jigoku-ato |
| 12-27 Feb 1991 | 500 m | Byobu-iwa |
| 16-20 Mar 1991 | 300 m | Byobu-iwa |
| 23 Mar 1991 | 200 m | Byobu-iwa |
| 29 Mar 1991 | 200 m | Byobu-iwa |
| 03 Apr 1991 | 300 m | Byobu-iwa |
| 09 Apr 1991 | 500 m | Jigoku-ato |
| 12 Apr 1991 | 200 m | Byobu-iwa |
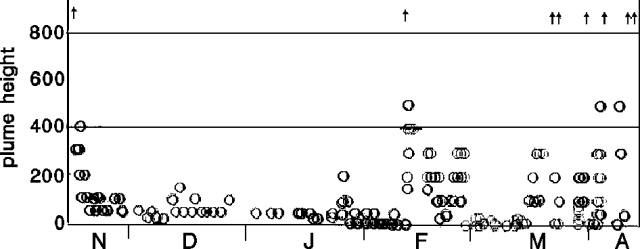 |
Figure 14. Plume heights at Unzen, November 1990-early April 1991. Arrows mark eruptions. Courtesy of JMA. |
A swarm of 298 earthquakes, including 11 felt [at UWS], was recorded on 3 March (figure 15). March seismicity totaled 734 recorded earthquakes and 21 felt shocks (see table 4). Most were located a few kilometers W of Fugendake peak, the primary epicentral area since July 1990. Tremor episodes declined from 137 in February to 99 in March, ranging from 0-8/day (figure 15).
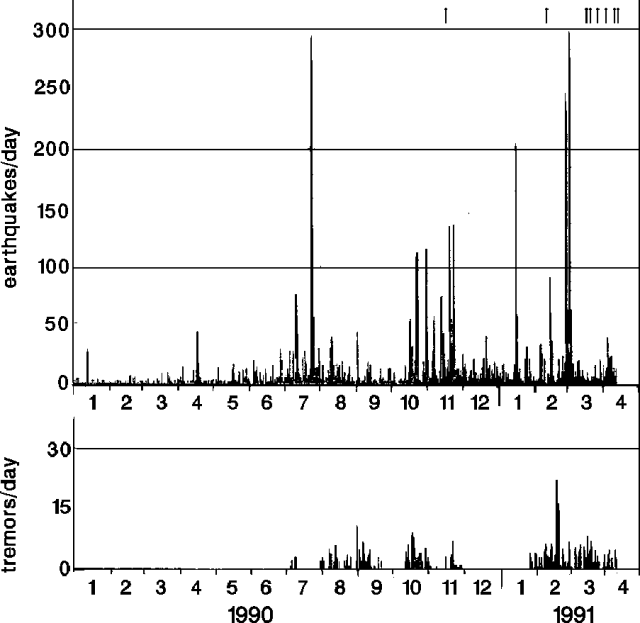 |
Figure 15. Daily number of recorded earthquakes (top) and tremor episodes (bottom) at Unzen, January 1990-early April 1991. Arrows mark eruptions. Courtesy of JMA. |
Information Contacts: JMA; AP.
Ash emission from two vents; frequent seismicity; lava dome extruded into summit crater
Frequent, almost continuous, ash emissions (500 m high) continued in April from two vents. In mid-April, the most intense activity switched from Byobu-iwa vent . . . to Jigoku-ato vent . . . . No earthquake swarms were recorded in April, but seismicity remained high. A total of 733 earthquakes was recorded and 27 felt . . . compared to 734 recorded and 21 felt in March. Most of the events were located a few kilometers W of Fugen-dake peak . . . . The number of tremor episodes increased in April (181, compared to 99 in March), as did amplitudes and durations (figure 16).
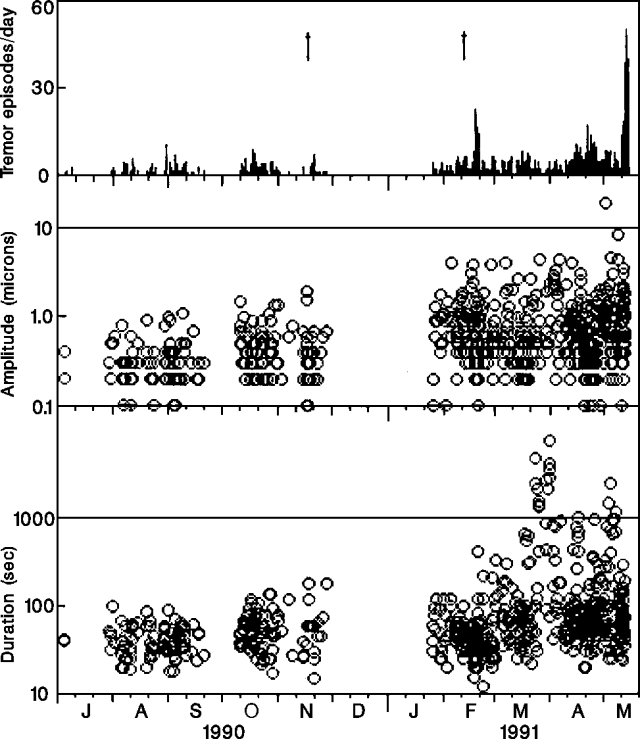 |
Figure 16. Daily number (top), amplitude (middle), and duration (bottom) of tremor episodes at Unzen, July 1990-early May 1991. Arrows at top mark eruptions on 17 November 1990 and 12 February 1991. Courtesy of JMA. |
A swarm of microearthquakes, the first since July 1990, began 13 May and continued as of 17 May. Ash emissions were at low levels during this period. Heavy rains on recently fallen tephra caused lahars in at least one flank valley. The press reported that more than 1,200 people were evacuated on 19 May. A lava dome was extruded into the summit crater before dawn on 21 May. Small ash emissions occurred from the dome and fissures exposed its interior.
Information Contacts: JMA; H. Glicken, Tokyo Metropolitan Univ; AP.
41 killed by pyroclastic flow from lava dome
On 3 June a large pyroclastic flow formed near the summit of Fugen-dake cone and moved down the E flank, reaching the outskirts of Kita-Kamikoba, 3 km from the 20 May lava dome. Forty people were killed, including volcanologists Harry Glicken, and Maurice and Katia Krafft. The pyroclastic flow and accompanying fires destroyed more than 56 houses and portions of Shimabara were blanketed with wet ash. A larger pyroclastic flow, on 8 June, destroyed an additional 73 houses in Shimabara and Fukae, but no injuries were reported. On 11 June, ejecta from an explosive event, not associated with pyroclastic-flow activity, damaged houses and car windows in Shimabara. Ashfall was reported 250 km to the NE. Dome extrusion and pyroclastic-flow activity at Unzen continued as of 24 June.
Premonitory activity and small ash emission. Increased seismicity was initially centered in Chijiiwa Bay, 13 km W, in November 1989, and gradually migrated E in July-October 1990, when seismicity increased further and the first volcanic tremor was recorded. Following several earthquake swarms, including one on 13-14 November (centered 5 km W of the summit at shallow depth), the volcano erupted on 17 November, weakly emitting ash to heights of 300-400 m from two newly formed vents (Jigoku-ato and Tsukumo-jima) within existing craters roughly 650 m E of the summit (figure 17). Ash emissions, tremor, and swarm activity quickly ceased, but steam emission continued and seismicity remained at high levels. An earthquake swarm occurred on 15 January and tremor resumed on 25 January (figure 18).
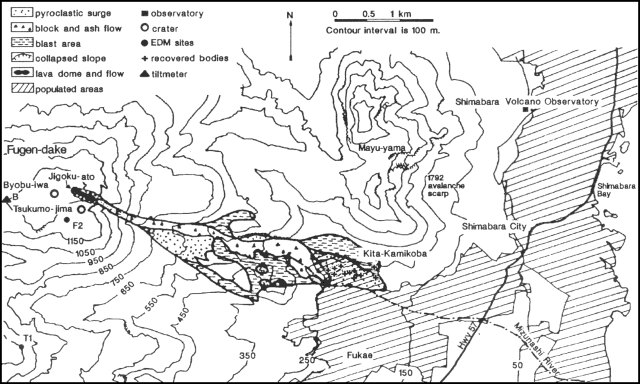 |
Figure 17. Map showing the distribution of the three facies of the 3 June pyroclastic flow at Unzen. Crosses represent locations of recovered bodies. Data from Kyushu and Kagoshima universities. Body locations from The Japan Times. Courtesy of JMA. |
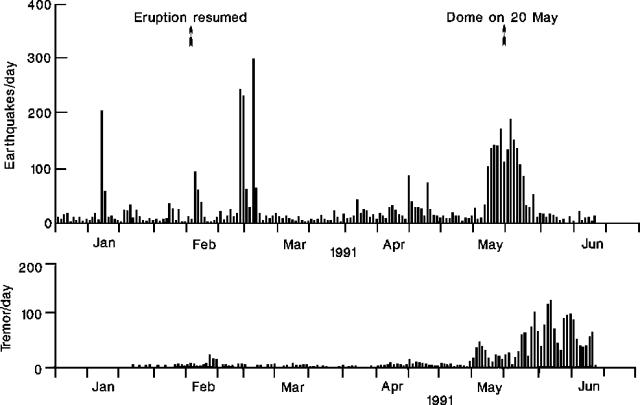 |
Figure 18. Daily number of earthquakes (top) and tremor episodes (bottom) at Unzen, January-18 June 1991. Arrows represent resumption of explosive activity on 12 February and dome appearance on 20 May 1991. Courtesy of JMA. |
Phreato-magmatic activity, February-May. A second eruption on 12 February produced 500-m ash plumes from a new 50-m-long line of small vents (named Byobu-iwa) 170 m WSW of Jigoku-ato crater and 500 m E of the summit. Deposits of ash and lapilli reached 30 cm thick (10 m E of the vent) but no incandescence was seen and no juvenile material was detected in the ash. Frequent small ash emissions continued from Byobu-iwa vent and seismicity remained at high levels.
In early April, ash emissions resumed at Jigoku-ato vent, which widened and began to eject bombs. By mid-April, Jigoku-ato was the site of the most intense activity. The Geographic Survey Institute detected a summit offset of 11 cm to the W on 12 April.
Juvenile volcanic glass was first recognized on 12 May, although emissions remained small. Shallow microseismicity beneath Jigoku-ato rose sharply the next day, and EDM measurements showed rapid inflation of the summit region.
Debris flows, 15 and 19 May. Heavy rains on accumulated ash deposits triggered debris flows along the Mizunashi River on 15 and 19 May that destroyed two bridges and caused the temporary evacuation of about 1,300 people from Shimabara.
Lava extrusion, 20-23 May. On 20 May, high-silica dacite (table 6) lava extrusion began in Jigoku-ato crater. By the following day large fractures had appeared and the dome had separated into four parts. Debris flows along the Mizunashi River continued; after the fourth debris flow, at 0252 on 21 May, about 1,100 people were evacuated. Water level in the river dropped following a debris flow at 0445, and people were allowed to return home at 0555.
Table 6. Chemical composition of eruptive products from Unzen. Sample 1 - block from 24 May 1991 pyroclastic flow. Sample 2 - surface of lava dome 1 June 1991. Sample 3 - pumice block from 8 June 1991 pyroclastic flow. Sample 4 - 1792 lava flow. Total Fe as Fe2O3. Analyses performed by XRF at Kyushu Univ, normalized anhydrous.
| Component | Sample 1 | Sample 2 | Sample 3 | Sample 4 |
| SiO2 | 65.92 | 66.03 | 66.18 | 66.1 |
| TiO2 | 0.66 | 0.64 | 0.65 | 0.65 |
| Al2O3 | 15.46 | 15.47 | 15.46 | 15.8 |
| Fe2O3* | 4.18 | 4.14 | 4.07 | 4.28 |
| MnO | 0.09 | 0.08 | 0.08 | 0.09 |
| MgO | 2.39 | 2.37 | 2.34 | 2.24 |
| CaO | 4.90 | 4.98 | 4.86 | 4.56 |
| Na2O | 3.85 | 3.77 | 3.80 | 3.78 |
| K2O | 2.39 | 2.35 | 2.41 | 2.39 |
| P2O5 | 0.16 | 0.17 | 0.16 | 0.13 |
| Total | 100.02 | 100.00 | 100.01 | 100.02 |
The dome continued to grow, reaching about 110 m diameter and 44 m height (a few tens of meters above the crater rim) on 23 May, when material began spalling from its margins down the steep outer slopes. Large blocks, to 5 m in diameter (60-70 m3 volume), were observed falling from the dome, and explosive events produced grayish clouds to 100 m height. The Geological Society of Japan reported that Fugen-dake cone had expanded 89 cm from 10 to 22 May (figure 19), and that the lava dome front was moving E at 70-80 cm/hour.
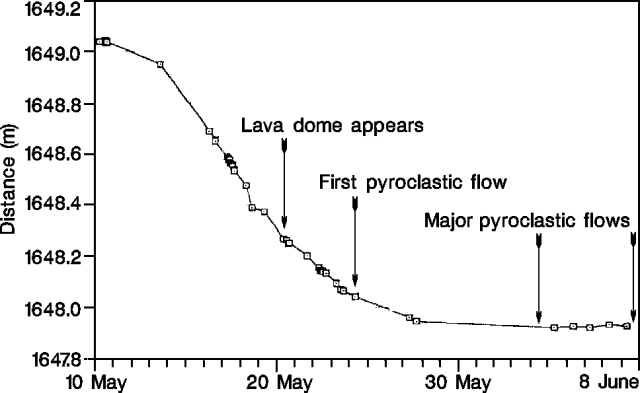 |
Figure 19. Results of EDM measurements between points T1 and F2 on the S flank of Fugen-dake cone at Unzen, 10 May-8 June. Shortening of this line reflects expansion of the cone as F2 moves toward T1. Data from the GSJ. Courtesy of JMA. |
Pyroclastic flows begin, 24 May. At 0810 on 24 May, a large explosion was heard as a portion of the lava dome collapsed, producing a pyroclastic flow that traveled about 1 km down the E flank to within 2 km of Kita-Kamikoba. The flow discolored trees and transported blocks 10 m in diameter. Smaller collapse/pyroclastic flow events occurred at 1755 and 1920.
About 1,300 people were evacuated on 24 May because of increasing mudflow hazard along the Mizunashi River, as volcanic debris accumulated and heavy rains continued. During the evening, workers dredged material from above a dam (2 km from the summit) constructed after the November 1990 eruption to reduce the mudflow danger. By 0600 the following morning the evacuation recommendation was withdrawn and residents were allowed to return home.
Heavy rain on 25 May made observation difficult, but dust and ash from a pyroclastic flow was seen at around 1145. The lava dome continued to grow at an estimated rate of 80,000 m3/day. Rain continued on 26 May, and ash plumes 600 m high were reported, but little is known about activity at the dome.
At 1130 on 26 May, a pyroclastic flow traveled into the Mizunashi valley, injuring a worker (2.6 km from the crater) who had climbed up from the dredging area for better views of the volcano. The flow traveled 3 km, to within 600 m of Kita-Kamikoba, and deposited ash 5 km E on Shimabara. Bursts of tremor accompanied this flow and the prior pyroclastic flow at 1113, suggesting that the tremor signal could be used to detect and count pyroclastic flows (figure 20).
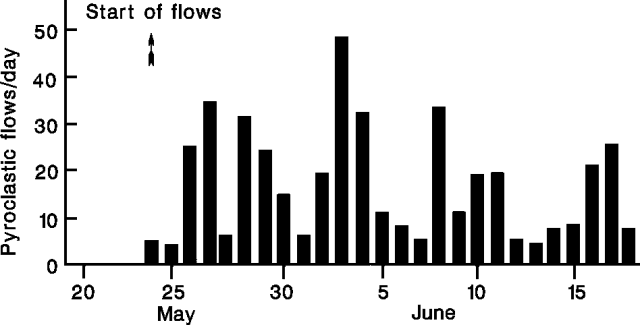 |
Figure 20. Daily number of pyroclastic flows determined seismically at Unzen, 20 May-18 June 1991. Number represents counts of tremor lasting >30 seconds with amplitudes larger than an empirical threshold. Courtesy of JMA. |
The 1130 pyroclastic flow, and the continued accumulation of debris in the river channel, prompted the evacuation of around 3,500 people from the surrounding valley. Several mudflows were reported during that evening, and rain soaked previously-deposited dust and ash to create more mud. Many people were allowed to return home the next day when the rain ceased.
Observations of the dome (27 May) revealed a v-shaped vent, from which a 60-m-wide tongue of lava was being extruded. Pyroclastic flows spawned from the margins of the lava tongue traveled along E and SE paths that joined at mid-flank. On 28 May, fluid (no longer blocky) lava overflowed the crater's E rim and moved down the outer flank, reaching about 700 m elevation by midnight.
The 26 May evacuation order was extended. Pyroclastic flows continued to form, reaching to within 500 m of Kita-Kamikoba on the 29th, and within 200 m on the 30th. Trees in the valley were burned to charcoal, suggesting that flow temperatures had increased. On 31 May, lava was observed emerging from the vent, and then avalanching 1 km down the steep slope in 30 seconds, producing a roaring sound that was heard 6 km E in Shimabara.
Pyroclastic flow kills 41, 3 June. At about 1610 on 3 June, an audible explosion and 6 minutes of recorded tremor signaled the collapse of a portion of the summit dome and lava flow. The resulting large pyroclastic flow moved down the Mizunashi River at reported speeds of up to 100 km/hour and entered Kita-Kamikoba. The core of the pyroclastic flow traveled about 3.2 km (figure 17) over a vertical drop of 1,000 m. An ash cloud surge apparently detached from the flow and traveled an additional 0.8 km, knocking down trees, burning houses, and leaving deposits up to 30 cm thick. Blasted zones occurred in places along the margins of the flow and surge. The volume of the deposits was estimated to be 7.3 x 10⁵ m3.
All of the casualties were within an evacuated "forbidden" zone and all were caused by the detached surge. The victims consisted of: 15 members of the Japanese press, three volcanologists, four taxi drivers, a few local residents, and members of police and fire brigades. Of the 41 people listed dead, 27 bodies were recovered, four remain missing and are presumed dead, and 10 died in hospitals from burns.
Pyroclastic flows continued over the next several days, hampering rescue and recovery efforts, but were less frequent. Lava effusion occurred at a constant rate of around 105 m3/day, producing a tongue 70-80 m wide and 100 m long by 5 June. Periodic explosions produced gas/ash columns 100 m high. One helicopter was grounded due to ash-related engine problems on 6 June. On 7 June, the evacuated zone was widened to include an additional 1,500 people, bringing the total number of evacuees to more than 7,200, and a fine of $75 was imposed on people entering the evacuated area. Observers reported that despite continued growth of the dome it had not yet recovered half of its pre-3 June size.
Large pyroclastic flow, 8 June. An increase in pyroclastic flow activity occurred in the afternoon of 8 June, with numerous small flows over a 5-hour period leading to a larger flow at 1723. The evacuation zone was again widened, to include parts of Fukae, bringing the total number evacuated to about 8,500. Multiple pyroclastic flows began at 1930. Finally, from 1951 to 2016, a continuous series of pyroclastic flows traveled 5.5 km down the Mizunashi River, through parts of Shimabara and Fukae, to within 50 m of Highway 57 (2 km from the sea). Deposits reached 100 m wide and had an estimated volume of ~1.0 x 10⁶ m3. The flows destroyed 73 houses, but no injuries were reported.
Activity continued, with an explosion (detected by infrared camera) at 2007 and a small pyroclastic flow at 2120. Ashfall from the explosion was deposited 90 km NE (in Hida) and 80 km N (in Fukuoka). Clasts 5 cm in diameter fell to 5 km.
Evacuation zones were expanded on 9 June and again on 10 June, to a total of 9,800 people. Mudflow hazards were considered high given the more than 1 x 10⁶ m3 of debris that completely filled the Mizunashi River channel and covered the surrounding valley.
Large explosive event, 11 June. By 11 June, a 50-m-wide dome partly filled the large horseshoe-shaped depression that formed 8 June on the E side of the summit dome. A large explosive ash emission, not associated with pyroclastic-flow formation, occurred at 2359-0003, accompanied by strong tremor and sharp deflation (10 µrad; figure 21). Houses, car windows, and two helicopters were damaged by tephra clasts (d = 1.0-2.0 g/cm3) >=15 cm in diameter that fell to 3.5 km (figure 22). Ash was deposited to 130 km NE (Oita) and 250 km NE (Matsuyama, Shikoku Is.). Two hours after the explosion, 25 µrad of inflation was recorded over a 10-hour period, suggesting rising magma.
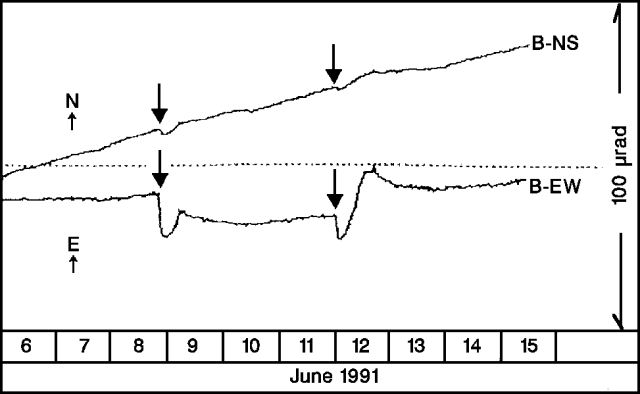 |
Figure 21. Change of ground tilt 850 m W of Unzen's dome, 6-15 June, 1991. Arrows represent large eruptive events on 8 and 11 June. E up corresponds to inflation of the summit area. Data from the Joint Monitoring Group of National Universities. Courtesy of JMA. |
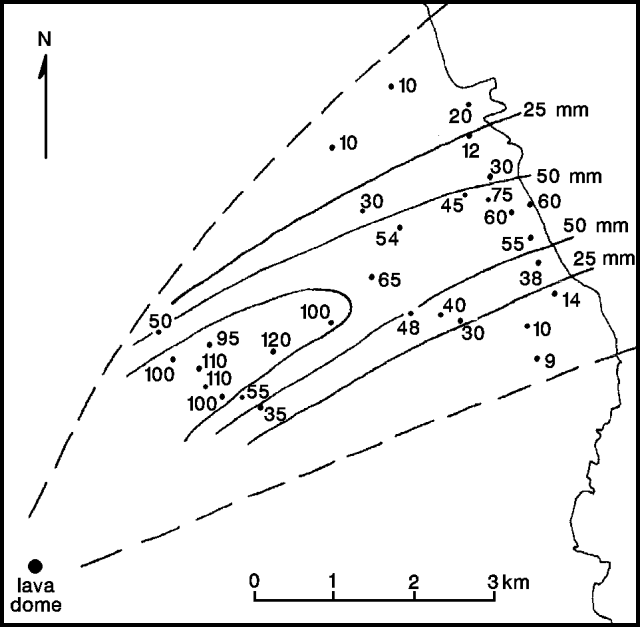 |
Figure 22. Isopleth map of maximum pumice clast sizes from the explosion at Unzen on 11 June at 2359. Data from Kyushu and Kagoshima universities. Courtesy of JMA. |
Continued activity. Dome extrusion and pyroclastic-flow formation continued at Unzen as of 24 June. On 14 June, the dome was 100 m wide and 50 m high; it grew another 20 m in height by 16 June. Cracks in the dome emitted gas to 200-300 m height, and periodic explosions produced 1-km-high ash columns. The evacuation area was again expanded on 17 June, bringing the total number of evacuees to more than 10,000.
Actions by Coordinating Committee. The following is from Daisuke Shimozuru, Chairman of the Coordinating Committee for the Prediction of Volcanic Eruptions. "The Japan Meteorological Agency (JMA) dispatched an observation team in mid-October to intensify seismic observation, assisting JMA's local observatory. Early in November, volcanic tremors were observed. We were very worried about an impending eruption, and asked the Ministry for financial aid for observations by university scientists. On 9 November, the Ministry decided to provide financial aid for observations by 6 universities. The university team set up seismic and deformation nets, in cooperation with Shimabara Volcano Observatory of Kyushu Univ." A chronology of Unzen's activity and statements and warnings issued by the Coordinating Committee is shown in table 7 (see following report).
Information Contacts: JMA; D. Shimozuru, Tokyo Univ of Agriculture; H. Kamata, GSJ; Public Works Research Institute, Ministry of Construction; K. Uto, USGS; M. Takahashi, SI; Kyodo News Service; The Japan Times; Asahi Shinbun; Yomiuri Shinbun; AP; UPI; Reuters.
Continued lava dome growth; debris flows to 7.5 km destroy houses; evacuations prevent more casualties
Lava extrusion from Jigoku-ato crater began on 20 May. As growth of the dome continued, its E side, advancing down the steep upper flank, became structurally unstable, and collapse episodes triggered pyroclastic flows that traveled E down the Mizunashi River beginning 24 May. Pyroclastic flows were frequent in June, and continued as of mid-July (table 7). A large pyroclastic flow on 3 June traveled 4.6 km, reaching Kita-Kamikoba (a district of Shimabara), where 41 people were killed, and many houses destroyed. On 8 June, a pyroclastic flow advanced 5.5 km (the largest as of 24 July; figure 23), reaching the coast highway (57) and destroying additional houses. Evacuations prevented any injuries. An explosion from the crater at 2359 on 11 June ejected pumice, up to 10 cm in diameter, that fell 10 km NE. Ashfall was reported 250 km NE (at Matsuyama, Shikoku Is.). No further explosions had occurred by 24 July.
Table 7. Volcanic activity at Unzen along with injuries and major damage, and actions taken by the Coordinating Committee for the Prediction of Volcanic Eruptions, November 1990-24 July 1991. Courtesy of D. Shimozuru.
| Date | Volcanic Activity and Action by Committee |
| 17 Nov 1990 | Minor phreatic eruption; Official statement issued. |
| early Dec 1990 | Surface activity declines. |
| 12 Dec 1990 | Official statement issued, warning of future activity based on seismicity. |
| 13 May 1991 | Shallow earthquakes begin beneath crater. |
| 17 May 1991 | Official statement issued, warning of the appearance of lava. |
| 20 May 1991 | Lava appears in crater. |
| 24 May 1991 | First minor pyroclastic flow observed. |
| 26 May 1991 | Official statement issued, warning of debris flows and pyroclastic flows. One person injured by pyroclastic flow. |
| 31 May 1991 | Committee meeting held evaluating activity; setup of advanced HQ at Shimabara Volcano Obs. proposed to deal with rapid changes in activity. |
| 03 Jun 1991 | Pyroclastic flow kills 41 people, injures 11 people, and destroys 49 houses. |
| 08 Jun 1991 | Pyroclastic flow destroys 70 houses. |
| 11 Jun 1991 | Official statement issued from Shimabara. Block fall damages 11 houses and 53 cars. |
| mid-Jun 1991 | Continuous ash emission. |
| 19 Jun 1991 | Increase in pyroclastic-flow rate for 2 hours. |
| 30 Jun 1991 | Heavy rainfall caused large debris flow, destroying 87 houses and injuring one person. |
| 01-24 Jul 1991 | Dome growth, partial collapse, and pyroclastic flows continued. Flows became smaller and less frequent. Continuous ash emission from crater since 13 July. |
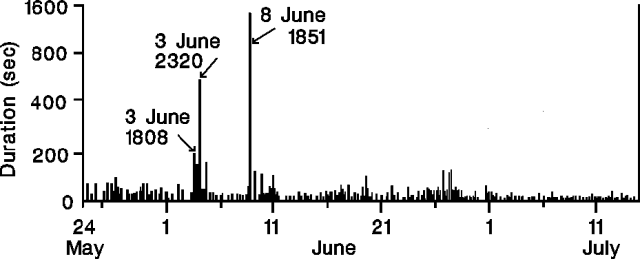 |
Figure 23. Seismically-recorded durations of pyroclastic-flow events at Unzen, May-mid July 1991. Courtesy of JMA. |
The pyroclastic-flow rate increased briefly on 19 June (between 1400 and 1600) with some of the larger flows traveling 2 km E. Larger pyroclastic flows were reported by the press on 26 and 27 June (~2.5 and 3.5 km in length, respectively). Ash elutriated from pyroclastic flows fell to the NE in June and July. By the end of June, the crater dome was about 150 x 250 m and 80 m thick, and pyroclastic flows were recorded seismically 10-20 times daily (figure 24).
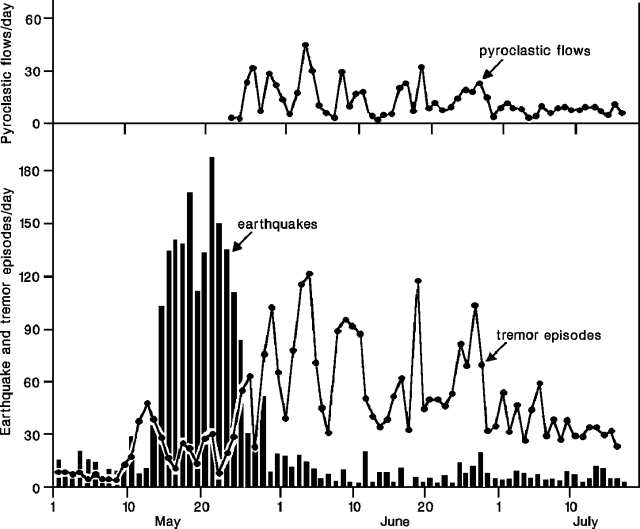 |
Figure 24. Daily number of earthquakes (bars), tremor episodes (lower curve), and pyroclastic-flow events (upper curve) at Unzen, May to mid-July 1991. Courtesy of JMA. |
On 30 June, heavy rainfall caused a large debris flow down the Mizunashi River, injuring one person, and destroying 87 houses [a total of 202 were damaged] near the coast (7.5 km E). The area affected by the flow was entirely within the evacuation zone designated in early June (a 5 x 5 km zone E of the summit, including parts of Shimabara and Fukae), with a pre-evacuation population of 12,395.
The dome continued to grow E, reaching 150 x 530 m and 80 m thick by 21 July. The eruption rate calculated from dome and pyroclastic deposit volumes was 0.3 x 10⁶ m3/day in June and July, although the rate of dome growth was higher in July. Continuous ash emission to 1,000 m height began 13 July, echoing a similar period in mid-June.
By mid-July, the month's longest pyroclastic flows had advanced
Summit seismicity was at lower levels in June and July than in May, with 230 earthquakes recorded in June, compared to 1959 in May. The monthly number of tremor episodes increased dramatically in June, apparently associated with small dome collapses.
An earthquake swarm, from 23 June to early July, was centered 18 km SW of the summit, at 10 km depth (figure 25). Nine of the earthquakes were felt. However, seismicity near the volcano and to its W (in Tachibana Bay) was lower in June and July than in previous months.
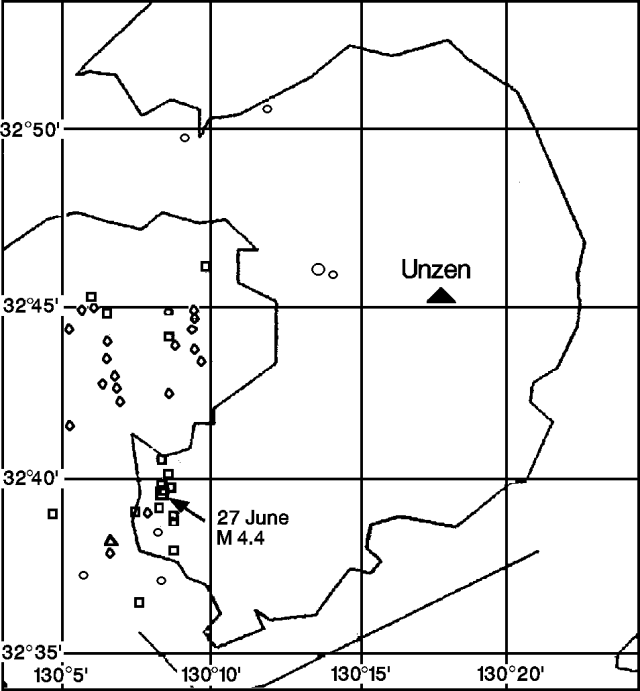 |
Figure 25. Epicenters of earthquakes near Unzen, June-mid July, 1991. A triangle marks the summit. Courtesy of JMA. |
Information Contacts: JMA; S. Nakada, Kyushu Univ; Kyodo News Service, Tokyo.
Continued dome growth and pyroclastic flow generation; dome history reviewed
The dome in Jigoku-ato crater continued to grow in an easterly direction in July, at a rate of 0.3 x 10⁶ m3/day (figure 26). The magma supply rate remained unchanged in August, but the direction of growth became westerly. By 15 August, the dome was estimated to be 650 x 250 m and 130 m thick. On 19 July it had been 520 x 260 m, with a volume of 5.9 x 10⁶ m3.
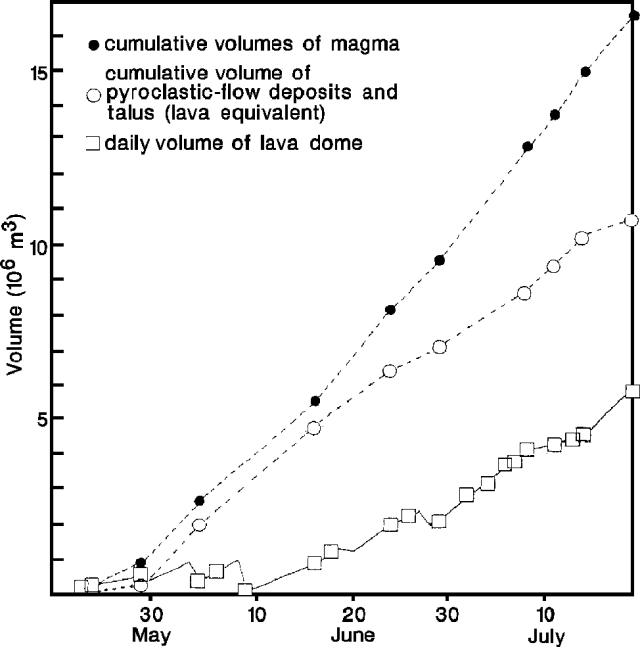 |
Figure 26. Cumulative volumes of magma erupted from Unzen, May-July 1991. Courtesy of S. Nakada. |
The number of seismically-detected pyroclastic flows and avalanches from the dome decreased in July (compared to June), showed a gradual increase late July-early August, then decreased suddenly on 12 August to only a few events/day. A total of 326 pyroclastic flows were recorded in July (down from 482 in June), and 155 during 1-15 August. Event durations were shorter than in previous months when flow signals occasionally lasted more than 300 seconds. The longest events lasted 140 seconds in July and 150 seconds in August.
Pyroclastic flows continued to travel as much as 2 km E down the Mizunashi River. None of the flows reached the evacuated areas of Shimabara and Fukae, which remained closed with 12,395 inhabitants relocated. Ash clouds from the larger pyroclastic flows rose 2 km, with ash falling mainly NE on Shimabara. Prevailing winds remained unchanged since May. Continuous ash emission from vents in the crater near the dome occurred in mid-July (16:06), and on 5-6, and 12 August, when the ash cloud rose 1.5 km. Explosive ejections of incandescent blocks to 100 m height were observed from midnight to 0200 on 12 August, presumably from a vent on the W end of the dome that continuously emitted ash throughout the day.
In contrast to the drop in pyroclastic flows on 12 August, the number of summit earthquakes and tremor episodes increased sharply on 11 August. This followed reduced seismic activity in June (230 recorded earthquakes) and July (133), compared to April (1959). More than 460 earthquakes had already been recorded in August by the 15th. Earthquake magnitudes were small and no shocks were felt, nor were changes in ground deformation detected by tiltmeters or EDM lines near the summit. Following the peak on 12 August, seismicity began to decrease. The increase in seismicity may be related to the incandescent ejections on 12 August, the active continuous ash emission, and the westward growth of the dome.
A man died on 8 August from burns suffered on 3 June, bringing the total casualties to 39 dead and three missing.
The following is a report from Setsuya Nakada on dome growth and morphology in June. "Large pyroclastic flows occurred on 3 and 8 June (figure 27), with volumes of about 0.7 x 10⁶, and 1 x 10⁶ m3, respectively. The E half of the lava dome collapsed during the eruption of the 3 June pyroclastic flow, leaving a 150-m-wide horseshoe-shaped depression opening to the E (figure 28). The volume of dome material left behind (referred to as W dome) was about 0.48 x 10⁶ m3. A new lava dome formed within the depression by 8 June, obtaining pre-3 June volumes.
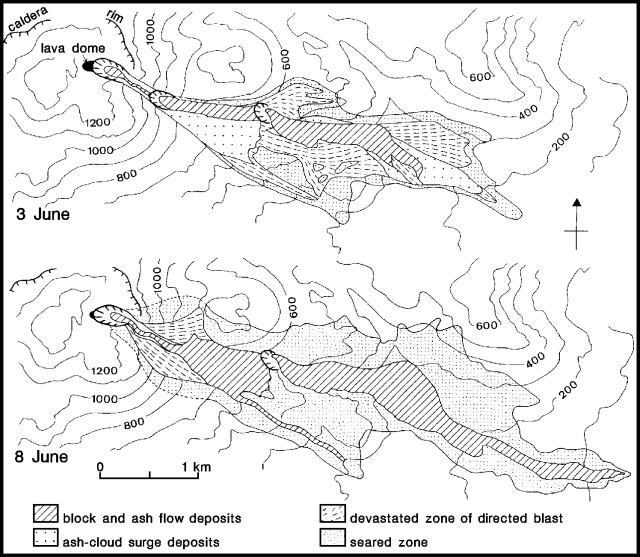 |
Figure 27. Distribution of the 3 and 8 June 1991 pyroclastic flow deposits at Unzen. From Nakada and Kobayashi (1991). |
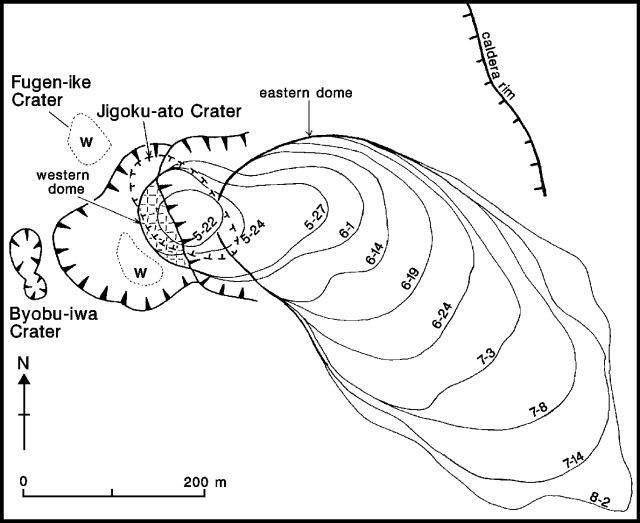 |
Figure 28. Growth pattern of the lava dome in Jigoku-ato Crater at Unzen, May-August, 1991. From Nakada and Kobayashi (1991). |
"Some of the 8 June pyroclastic flows, which reached 5.5 km beyond the crater, resulted from the direct eruption of magma from the vent. An extensive area of trees was burnt by the accompanying ash clouds. Pyroclastic surge (ash-cloud surge) deposits, such as those in the deposits from 3 June, were not clearly identified. Breadcrust bombs 5 cm in diameter were ejected to 3 km NE of the crater. Half of the W dome and the entire E dome (post-3 June material) were destroyed, widening the horseshoe-shaped depression to 200 m. About 0.15 x 10⁶ m3 of the W dome remained.
"Vulcanian explosions on 11 June ejected breadcrust and cauliflower bombs, up to 46 cm long, to 3 km distance. As a result, a depression 20-30 m in diameter formed within the crater, just above the former Jigoku-ato crater. On 17 June a continuous eruption column was observed rising from the W dome, for the first time since the start of lava extrusion.
"The E dome continued to grow and collapse along its E margin, filling a steep valley on the E slope of Jigoku-ato crater, then growing over the valley-fill deposits, a gentler surface than the original valley floor. The surface of the lava dome had the form of a petal with two lobes. These were created by extrusion near the summit of the E dome. After the middle of June, the lava surface traveled SE at a rate of 40 m/day, but the dome only lengthened a maximum of 10 m/day. By the end of June the horseshoe-shaped depression was filled with dome material, and lava blocks began to overflow NE onto the caldera floor."
Reference. Nakada, S., and Kobayashi, T., 1991, Lava dome and pyroclastic flows of the 1991 eruption at Unzen volcano: Bulletin of the Volcanological Society of Japan, v. 36, in press.
Information Contacts: JMA; S. Nakada, Kyushu Univ.
Continued lava dome extrusion and pyroclastic flows
Lava extrusion continued at Jigoku-ato crater through mid-September, generating destructive pyroclastic flows that advanced down two valleys. More than 12,000 people remained evacuated and no new casualties were reported.
A summit seismic swarm that began 11 August peaked 12-13 August (figure 29), then gradually declined through the 19th. Incandescent block ejection was seen between 0000 and 0200 on 12 August, followed by continuous ash emission through the day. The number of seismically detected pyroclastic flows from the lava dome decreased suddenly to a few events daily on 12 August. A new lava dome, first recognized from the air on 13 August, emerged W of the former dome, and began to produce pyroclastic flows on 25 August. Pyroclastic flows had previously traveled down the Mizunashi River valley but those from the new dome (C dome; see below) moved ENE down the Oshigatani Valley, which extends N of and parallel to the Mizunashi, then joins it several kilometers downstream. Some of the larger pyroclastic flows from the new dome advanced 3 km down the Oshigatani valley from late August through mid-September, and pyroclastic surges burned vegetation. The mayor of Shimabara city ordered the evacuation of about 500 people from an area (Senbongi) 3.5 km NE of the dome on 31 August. Frequent pyroclastic flows during the afternoon of 3 September included one of about 1 x 10⁵ m3 volume that advanced down the Oshigatani Valley at 1611. The accompanying cloud rose about 1,500 m and ash fell to the N part of Shimabara city. Ashfalls from pyroclastic flow elutriation clouds disrupted traffic around Shimabara city throughout the following day; the cloud from a flow at 1311 was 2,500 m high.
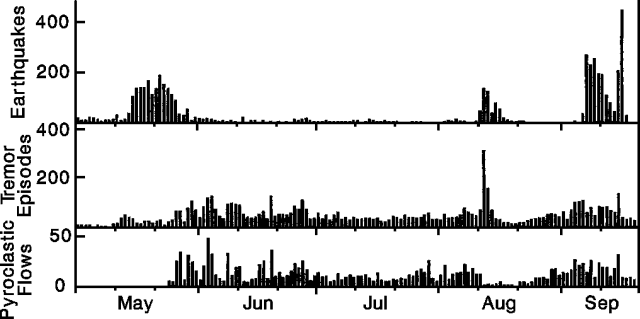 |
Figure 29. Daily numbers of earthquakes (top), tremor episodes (middle), and pyroclastic-flow events (bottom) recorded at Unzen, 1 May-20 September 1991. Courtesy of JMA. |
Another seismic swarm began beneath the crater on 6 September, and a pyroclastic flow that evening at 2121 advanced about 3.5 km down the Oshigatani Valley. Hypocenters and seismic wave characteristics were similar to those of mid-August, although the September swarm was more vigorous.
By 12 September, the lava dome had broken into numerous small blocks. Seismic activity declined through 14 September but increased again on the 15th. Seismometers near the summit began to record larger pyroclastic flows, with longer durations than any since 8 June, on 15 September at 1644 (150 seconds) followed by others at 1759 (120 seconds), 1842 (360 seconds), and the largest at 1854 (670 seconds). The latter moved down the Oshigatani valley, entered the Mizunashi valley, and continued to within 500 m of highway 57, a total of 5.5 km. The main body of the pyroclastic flow turned east into the Mizunashi valley, where it damaged 50 houses in Shimabara city, but the pyroclastic surge continued about 800 m southward, destroying 26 houses and 74 other buildings including those of a primary school (in Onokoba district, Fukae town). All of the affected area had previously been evacuated, so there were no casualties. The largest pyroclastic flow was associated with the collapse of a section of the new lava dome about 250 m wide, 300 m long, and 50 m thick, a volume exceeding 3 x 10⁶ m3. This is about 20% of the total volume of lava domes erupted to date, and 3 times the volume of material removed by the 8 June pyroclastic flow. Two days later, a new lobe had grown to 100 x 200 m and 30 m high (0.3 x 10⁶ m3/day), about twice the June-August extrusion rate (see below).
A total of 292 pyroclastic-flow events was recorded in August, down from 326 in July, but the more frequent episodes toward mid-September raised that month's total to 310 as of the 17th. September earthquake counts had reached 2075 through the 17th, up from 559 in August and 133 in July.
The following, from Setsuya Nakada, describes eruption products through early September.
The size and frequency of pyroclastic flows had decreased until July, and travel distances were almost always <2 km. However, collapse episodes from the E lava dome remained frequent and lava blocks had filled the narrow headwaters of the Mizunashi River, along which the 3 and 8 June pyroclastic flows had descended. As a result, cliffs along the valley disappeared, and valley-fill deposits (talus) became thick enough to act as a cushion to soften the shock of falling blocks. The E dome flowed southeastward on the valley-fill deposits. After the end of June, the horseshoe-shaped depression had filled with dome materials, and lava blocks began to fall northeastward onto the floor of Myoken caldera (figure 30). They filled the E end of the floor with talus, which overflowed the caldera rim at the end of July. Lava blocks then fell down the E and NE flanks as pyroclastic flows and their paths widened northeastward. Some reached the N bank of the Mizunashi River. The E margin of the E dome widened; because the NE slope under the dome was steeper than the SE slope, the northern half of the E dome migrated northeastward, while the southern half did not move and solidified. By the middle of August, the caldera rim NE of the dome had been eroded away by the falling lava blocks.
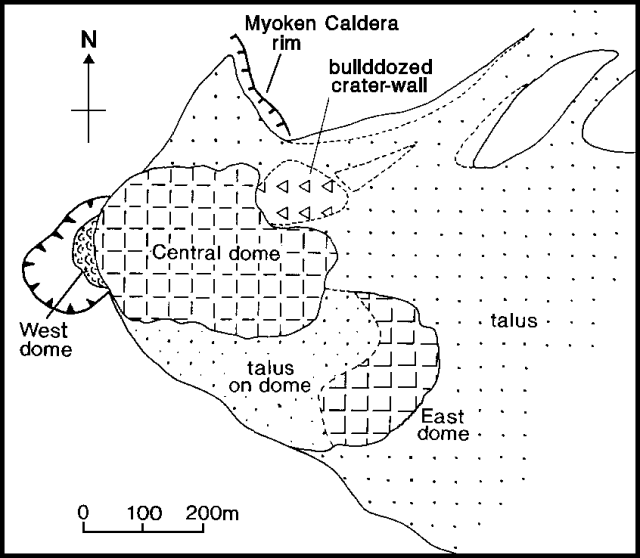 |
Figure 30. Sketch map of Unzen's lava dome, 8 September 1991. Courtesy of Setsuya Nakada. |
At the beginning of August, the ash-laden plume from the small vent at the northern base of the remnant W dome became stronger, and new lava was extruded on the western part of the E dome. On 5 August, many bubbles were observed coming from an old water-filled crater near the W dome. The small explosions that took place from the W dome on 12 August (see above) enlarged the vent to 20 m across and built a tuff cone around it. The E dome temporarily thickened for a few days prior to the new lava extrusion; the western part of the E dome, just above the former Jigoku-ato Crater, had swelled vertically. By the time new lava appeared 13 August, magma supply into the E dome had stopped, since the E dome did not lengthen and the surface of the dome did not move eastward (figure 31). It was difficult to accurately estimate the change in magma supply rate; talus and pyroclastic flows were deposited over an extensive area with irregular topography, which causes difficulties in calculating volumes of talus plus pyroclastic deposits.
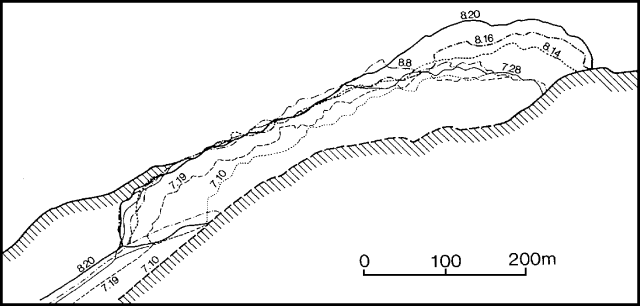 |
Figure 31. Tracings of photographs from a fixed point about 4.4 km from Unzen's E lava dome, illustrating its growth 10 July-20 August 1991. Courtesy of Setsuya Nakada. |
At the end of August, the new dome (central, or C dome) was 375 m long, 275 m wide, and 60-80 m high. The C dome grew eastward and northeastward, keeping a constant thickness. It covered the E dome and talus, plus a part of the old volcanic edifice, which was bulldozed by the growing dome from the former crater wall to the caldera rim. Talus also formed on the E dome. At the end of August, the volume of C dome was about 4 x 10⁶ m3 and the total volume of the domes was about 12 x 106 m3. The resulting dome growth rate is about 0.15 x 10⁶ m3/day for 8 June-28 August.
Lava blocks fell down the E and NE margins of C dome into the Oshigatani Valley, forming pyroclastic flows beginning 25 August. The upstream area of the valley was the source area for lahars on 30 June. The pyroclastic flows traveled a maximum distance of 3 km from the dome, and had associated ash-cloud surge and seared zones like those of 3 and 8 June (figure 32). Flows moving down the Oshigatani Valley changed course southeastward when they encountered a high point dividing the valley and a residential area. Ash-cloud surges climbed the barrier, burning or searing trees, but block-and-ash flows did not. The devastated area was widest for pyroclastic flows that took place within the first week. By mid-September, Oshigatani Valley had been almost filled by pyroclastic-flow deposits.
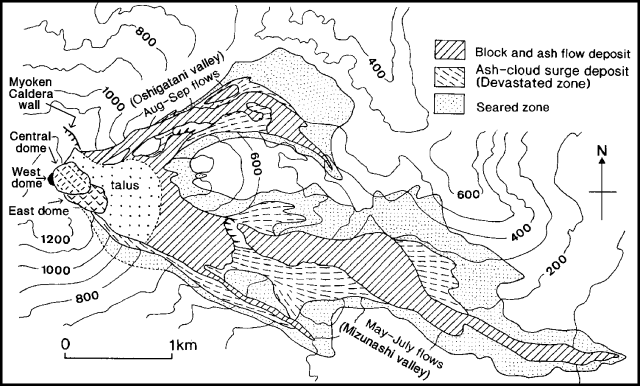 |
Figure 32. Map showing the distribution of pyroclastic flows from Unzen as of 9 September 1991. Deposits from lahars, which occurred mainly on 30 June, are omitted. Courtesy of Setsuya Nakada. |
Average speeds of pyroclastic flows were estimated using travel distances observed by Ground Self-Defense Force radar and durations of tremor signals. The higher the average speed of a pyroclastic flow, the longer its travel distance: about 100 km/hour for flows reaching 3 km distance and 50 km/hour for flows 1 km long. The average speed of a pyroclastic flow at the end of August was estimated at 93 km/hour using the time lag between the start of the tremor signal and the time when the seismometer was broken by the flow.
Information Contacts: JMA; S. Nakada, Kyushu Univ; M. Takahashi, SI; Yomiuri Shinbun, Tokyo.
Dome collapse triggers large pyroclastic flow, then new dome extruded
Lava dome growth continued in Jigoku-ato crater through early October, generating frequent pyroclastic flows by partial dome collapse. A seismic swarm began beneath the crater on 6 September, peaking 7-9 September and again on 15-16 September. Seismicity was similar to that of mid-August when dome 3 (formerly called the central dome, or C-dome) began to grow, although September activity was more vigorous.
Extruded lava pushed the crater wall NE, leading to a collapse of the crater wall and the adjoining dome 3 at 1854 on 15 September. Red-colored ash plumes were observed intermittently earlier in the day, becoming stronger and more frequent by the start of a 2-hour increase in the number and size of pyroclastic flows at 1644. The activity culminated in a major pyroclastic flow that generated an 11-minute seismic signal, the longest since 8 June, composed of 6 successive events including one that lasted 4 minutes beginning at 1857. The pyroclastic flow traveled ENE down the Oshiga Valley, then followed it SE into the Mizunashi River valley, reaching 5.5 km from the dome (figure 33), the same distance as the 8 June flow. An ash cloud surge detached from the flow at the confluence of the Oshiga with the Mizunashi River, continuing SE into the Onokoba area of Fukae city. A car previously burned by June pyroclastic flows was thrown about 60 m by the surge. Although it appeared that the surge rapidly lost force when it detached from the rest of the pyroclastic flow, its temperature remained high. [A total of 218] houses were burned, but the area had already been evacuated and there were no injuries.
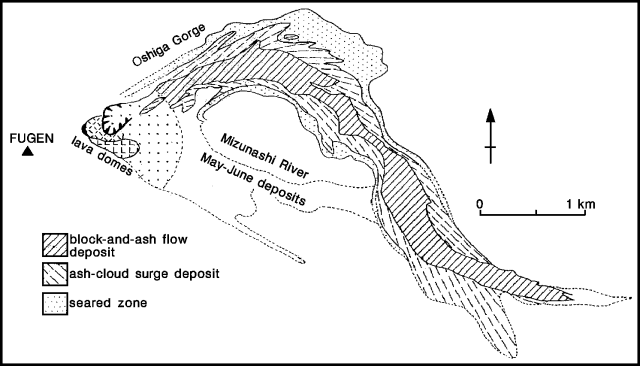 |
Figure 33. Map showing the distribution of the 15 September 1991 pyroclastic-flow deposits at Unzen. Courtesy of Setsuya Nakada. |
The average speed of the pyroclastic flow was estimated at 95 km/hour, using the interval between the start of the flow's seismic signal and its cessation when the flow destroyed the telemeter cable. The volume of collapsed dome lavas and pre-existing summit rock was estimated to be 3.5 x 10⁶ m3, of which 2.5 x 10⁶ m3 was believed to be from the dome. Using aerial photos, the Ministry of Construction estimated the volume of 15 September pyroclastic-flow deposits at 4 x 10⁶ m3, indicating that the main flow was the largest since the start of activity in May. Flow deposits were about 5 m thick, and although the interior was still hot 3 weeks after deposition, no gas-pipe structures were observed. Lava blocks in the deposits were massive, without the breadcrust or cauliflower surfaces seen in the 8 June pyroclastic-flow deposits. The biotite hornblende dacite composition of the blocks was the same as that of lava fragments from the 3 and 8 June flows and the pumice ejected from Jigoku-ato crater on 11 June. Peripheral surge deposits consisted of a lower coarse sand layer, and an upper reddish ash layer.
A total of 448 earthquakes was recorded on 16 September, the most in one day since July 1990, but seismicity rapidly declined, reaching former levels by the following morning. Dome 4 began to grow in the horseshoe-shaped depression (about 300 m wide and 400 m long) formed by the collapse of dome 3 (figure 34). By 20 September, it had grown to about 1.6 x 10⁶ m3, indicating an extrusion rate of about 3.5 x 10⁵ m3/day. The new dome was 350 m long, 250 m wide, and >150 m high on 10 October. Following the pattern of dome 2, the length of dome 4 stopped increasing at the end of September, as continuing collapse of its distal end generated small-scale block-and-ash flows. The upper reaches of the Oshiga valley were filled with debris shed from the domes, and large pyroclastic flows were rare.
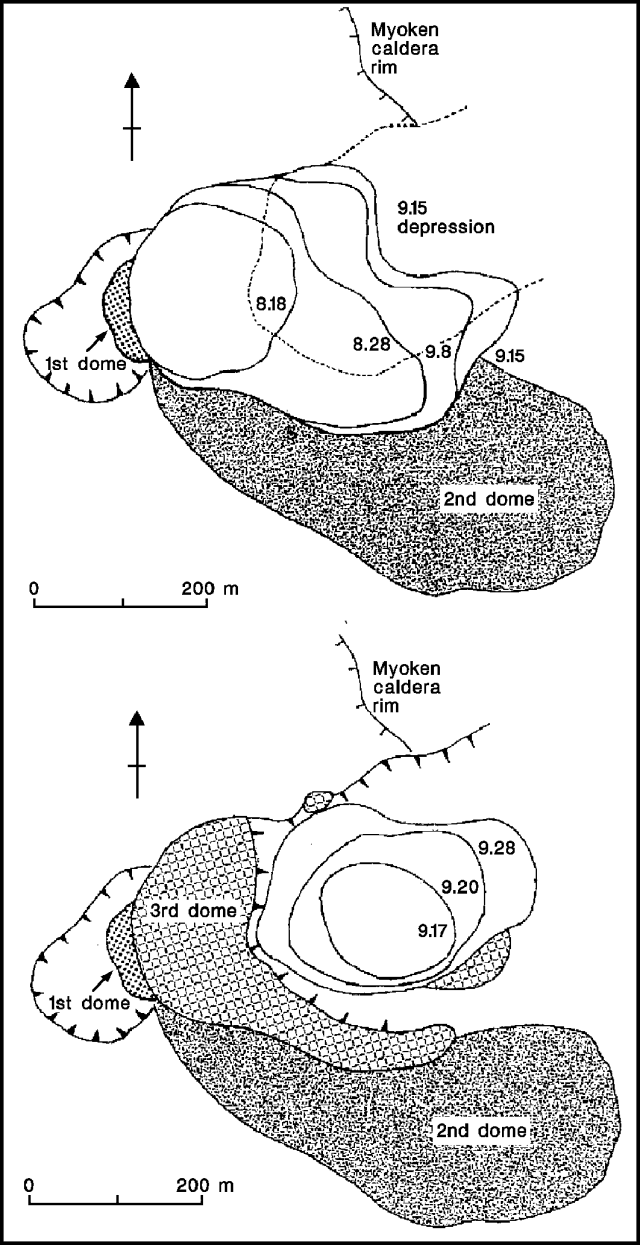 |
Figure 34. Sketch map showing the growth of domes 3 and 4 at Unzen, 13 August-28 September 1991. Numbered outlines show boundaries of dome 3 (upper) and dome 4 (lower) on indicated dates. Dome 4 was extruded within the horseshoe-shaped depression, opening NE, formed on 15 September 1991. Courtesy of Setsuya Nakada. |
A total of 521 seismically determined pyroclastic-flow events and 2102 earthquakes were recorded in September, increases from 292 and 559, respectively, in August. There were no felt shocks in either September or early October.
Information Contacts: JMA; S. Nakada, Kyushu Univ.
Continued lava dome growth and pyroclastic flows
Growth of the lava dome . . . continued through mid-November and partial dome collapses frequently generated pyroclastic flows. Seismicity had declined to relatively low levels since extrusion of dome 4 started in mid-September. A seismic swarm began beneath the dome on 24 October, gradually increasing through mid-November. The seismicity buildup was similar to those of August and September, which culminated in the appearance of domes 3 and 4, respectively, although the rate of increase was slower for the current swarm. Uplift at the boundary between domes 3 and 4, first noted from the air on 25 October, was continuing in mid-November, suggesting magma intrusion under or into dome 4. As of 14 November, dome 4 was 500 m long, 400 m wide, and 250 m high. Dome and pyroclastic flow volumes were used to estimate a total of about 4 x 10⁷ m3 of magma erupted between May and the end of October.
Pyroclastic flows, mainly from dome 4, moved down the Oshiga and Mizunashi valleys, as in September. Most have been relatively small since the eruption's largest pyroclastic flow on 15 September. Ash clouds generated by the larger flows reached about 2 km height. The number of pyroclastic flows, counted seismically, declined gradually through October (to 439, from 521 in September) and markedly since 11 November.
Information Contacts: JMA.
Continued lava extrusion; fewer pyroclastic flows
Lava extrusion has continued . . . with rockfalls from domes frequently causing pyroclastic flows. Extrusion of the 4th in a series of lava domes began after the 15 September collapse of dome 3, which spawned a major pyroclastic flow. A seismic swarm began beneath the crater on 24 October and inflation of the upper part of dome 4 was first noted the next day. Inflation continued through November and seismicity increased gradually until 1 December, then declined. On 3 December, a new lobe emerged on the S side of dome 4, and it was continuing to grow a week later. The number of seismically counted pyroclastic flows was relatively low until late November, when frequent flows resumed. The flows, generated mainly from dome 4 and its early-December lobe, moved down the same valleys (Oshiga and Mizunashi) as in previous months. Ash clouds elutriated from the larger flows reached about 2 km height.
The following information, from Setsuya Nakada, describes November-early December surface activity.
Growth of lava dome 4 has continued in the depression left by the collapse of dome 3 on 15 September. By the end of October, dome 4 was 500 m long, with two lobes forming a crudely petal-shaped structure. Rough pressure ridges, convex downslope and of long wavelength, formed on the surface of dome 4, and thick lava layers piled atop each other were observed on its southern cliffs. New magma reached the surface along the narrow space between domes 2 and 4 and between the head of dome 4 and the remnants of dome 3, where it built new irregularly shaped lobes. Significant intrusion was indicated by swelling of the dome and uplift of the talus between domes 3 and 4. As the uplifted area expanded southward and northward, reddish blocky lava replaced the talus. Older domes were pushed S-SW, causing radial cracking in dome 3, where deformation was continuing in early December. Talus in front of the domes rested at angles as high as 33°, and parts of the dome 4 surface were even steeper.
Dome 4 has advanced little since early November, as frequent rockfalls from the dome front compensated for the additional magma supply. Rockfalls eroded and buried dome 2, but did not develop into pyroclastic flows as often in October and November as in previous months. Pyroclastic flows that traveled >2 km occurred at both the beginning and end of November. The early-November flow started from the head of dome 4, advanced across the dome, then entered the Oshiga valley. The latter flow, videotaped by Ground Self-Defense Force personnel, was generated by failure of ~ 105 m3 of dome-4 lava blocks, which broke into small pieces upon landing on dome 2, crossed a region of talus, then entered a narrow gorge that had not previously been filled by debris. Its average speed was calculated at 14.7 m/s (53 km/hour).
Information Contacts: S. Nakada, Kyushu Univ; JMA.
Continued dome extrusion and pyroclastic flows; vigorous seismicity; more than 8,000 still evacuated
The following is from Setsuya Nakada, with additional information from JMA.
Lava domes continued to grow through early January, with growth occurring both exogenously and endogenously (figures 35 and 36). Talus from the domes buried their SE slopes.
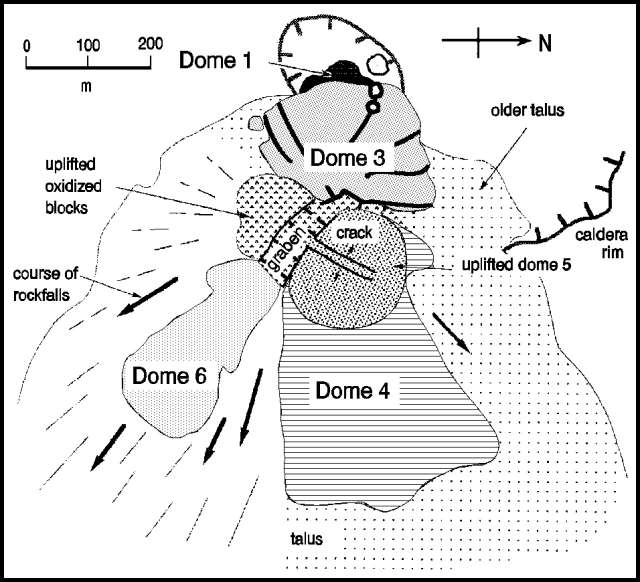 |
Figure 35. Oblique view of the dome complex at Unzen, 7 January 1992. Extrusion of dome 6 began in early December. Courtesy of Setsuya Nakada. |
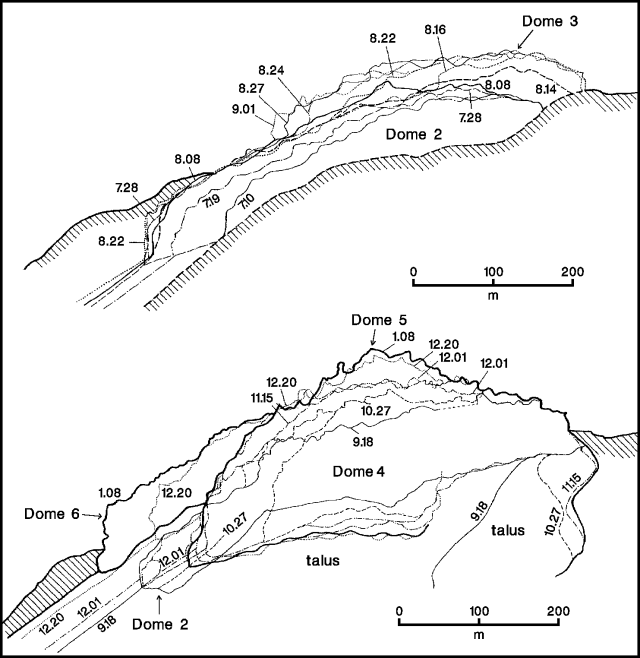 |
Figure 36. Successive dome surfaces traced from photographs taken from a fixed point about 4.4 km N of the dome complex at Unzen, illustrating growth July-early September 1991 (top) and September 1991-early January 1992 (bottom). Courtesy of Setsuya Nakada. |
Extrusion of a new lava dome (6) toward the SE began in early December. By late December, its initial 2-lobed petal structure had become poorly defined and its advance had nearly stopped, as lava blocks began falling directly from the head of the dome, eroding the southern margin of dome 4. On 7 January, dome 6 was about 370 m long, 180 m wide, and 80 m high. Collapsed dome material eroded and buried dome 2, which was no longer visible by mid-December.
Dome 5, emerging since 21 November at the head of dome 4, grew upward about 50 m in mid-December to become the highest of the six 1991 domes. Its peak, at about 1,360 m above sea level, had reached the height of the volcano's summit (Fugen-dake). A crack formed in the top of dome 5, roughly perpendicular to the NW-SE-trending graben that developed on the lava-supply vent and widened in late December.
Pyroclastic flows, generated mainly from dome 6, advanced as much as 2.5 km SE down the Mizunashi and Tansansui valleys. The number of seismically recorded pyroclastic-flow events increased from 149 in November to 395 in December, continuing at a rate of 10-20/day through mid-January (figure 37). Ash clouds generated by pyroclastic flows, reddish brown to dark brown early in the eruption, had become milky colored, and those from the largest flows reached 2 km height. Failure of dome portions as large as 104-105 m3 in volume seldom triggered pyroclastic flows, but remained simple rockfalls. This suggested to geologists a decline in the fragmentation force (and perhaps the auto-explosivity) of falling lava blocks, probably implying a decreased pore pressure.
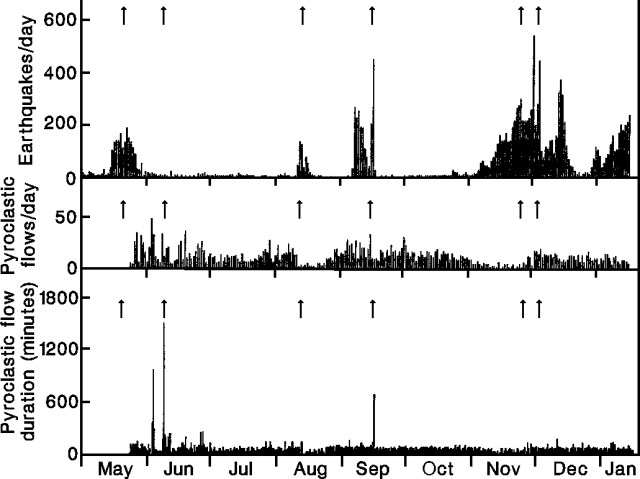 |
Figure 37. Daily number of recorded earthquakes (top), with number (middle) and duration (bottom) of seismically recorded pyroclastic flows at Unzen, May 1991-early January 1992. Arrows represent the first appearance of domes 1-6. Courtesy of JMA. |
Plumes from the NW margin of the former Jigoku-ato Crater had become weaker and less frequent by mid-December, and ash-laden columns were rare. White-bluish, sulfur-rich, acidic gas was discharged continuously from Jigoku-ato through cracks in dome 3. Strong steam-rich gas emission accompanied the bluish plumes, especially the day after heavy rains. The SO2 discharge rate from Jigoku-ato ranged from 50 to 350 metric tons/day (t/d), probably averaging about 200 t/d for June-December 1991. The Cl/SO4 ratio of water-soluble ash components increased from 0.5 in May to 10-15 in early August, then decreased to lower levels (analyses by the Kusatsu-Shirane Volcano Observatory, Tokyo Institute of Technology).
The seismic swarm that began beneath the dome on 24 October was continuing as of mid-January, becoming the longest and most vigorous since lava extrusion began in May. Earthquakes recorded in December totaled 4253, the highest monthly figure since activity began to increase in July 1990 (table 8 and figure 38).
Table 8. Monthly seismicity and number of seismically recorded pyroclastic flow events at Unzen, 1991. Courtesy of JMA.
| Month | Earthquakes | Small tremor episodes | Pyroclastic flows |
| Jan 1991 | 571 | 15 | 0 |
| Feb 1991 | 937 | 139 | 0 |
| Mar 1991 | 735 | 99 | 0 |
| Apr 1991 | 727 | 176 | 0 |
| May 1991 | 1957 | 696 | 143 |
| Jun 1991 | 230 | 1509 | 492 |
| Jul 1991 | 133 | 867 | 326 |
| Aug 1991 | 559 | 1285 | 292 |
| Sep 1991 | 2102 | 1237 | 521 |
| Oct 1991 | 208 | 902 | 438 |
| Nov 1991 | 3933 | 664 | 149 |
| Dec 1991 | 4253 | 1331 | 395 |
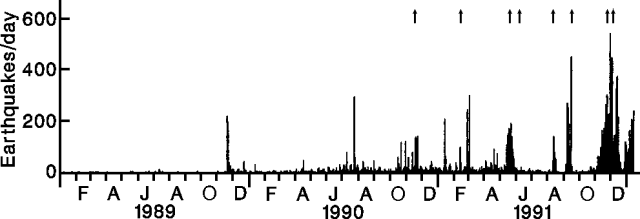 |
Figure 38. Daily number of recorded earthquakes at Unzen, 1989-early January 1992. The first two arrows mark phreatic eruptions on 17 November 1990 and 12 February 1991; the remaining six represent the first appearance of lava domes 1-6. Courtesy of JMA. |
The evacuation zone has remained almost unchanged since September, with a total of 8,125 evacuees in December (5,526 from Shimabara city, 2,599 from Fukae town). Shimabara Railway traffic resumed on 27 December.
Information Contacts: S. Nakada, Kyushu Univ; JMA.
Lava dome growth continues; dome collapses spawn pyroclastic flows
Dome growth continued through early February, mainly endogenously, and pyroclastic flows were generated by collapse from the edges of domes 5 (formed in late November) and 6 (appeared 3 December). Talus from the domes continued to bury the SE slope of the dome complex.
Magma was supplied primarily to the head of dome 6 (370 m long, 180 m wide, and 50 m thick), causing the dome to thicken (to 80 m), especially over the vent area, as it was shortened by collapse. Magma intrusion in dome 6 caused uplift of older dome materials behind the vent, where a small graben had formed earlier. The peak of the resulting cryptodome surpassed the summit of dome 5, previously the highest point in the dome complex (1,375 m elevation). Cryptodome growth pushed dome 5 NE, and caused its partial collapse northeastward and eastward. Rockfalls from dome 5 eroded the surface of dome 4, and began to bury it with talus. A group of parallel to radial cracks developed on the surface of dome 4, forming a central groove that divided it into N and S parts by early February. The N part appeared to be pushed eastward by the movement of dome 5 and the cryptodome.
Pyroclastic flows traveled mainly SE and E from dome 6 and the cryptodome, with ash clouds from the larger flows rising to 2 km. Some small pyroclastic flows and rockfalls occurred NE and E of domes 4 and 5. A total of 308 flow events were recorded seismically in January (compared to 395 in December); activity increased somewhat in early February. Seismicity beneath the dome complex continued at high levels in January, when the highest monthly total (5,337 earthquakes) since the start of dome growth was recorded.
Two blocks at the front of dome 6 (estimated block volume, 3-5 x 10⁵ m3) collapsed on 2 February at 1738, forming a larger-than-normal pyroclastic flow. Associated ash decreased visibility to 30 m in Fukae (4 km ESE) immediately after the flow, and nearby roads were briefly closed. Despite initial estimates from TV-monitor footage and eyewitness accounts that the pyroclastic flow traveled 3 km, the area 2.5-3.0 km from the volcano did not appear devastated and lacked noticeable pyroclastic-flow deposits when viewed during a helicopter overflight 2 days later. The speed of the pyroclastic flows was estimated at about 65 km/hour using a TV monitor. Compared to pre-October pyroclastic flows, more recent ones were less energetic, with lower velocities and a narrower area of devastation. However, the quantity of co-ignimbrite ash had not changed noticeably.
A second series of pyroclastic flows, lasting about 30 minutes, developed on 12 February when a pile of blocks (~ 5 x 10⁵ m3) collapsed on the S margin of dome 6 after being pushed southward by lava emerging from the vent. Small horseshoe-shaped depressions, up to 100 m wide, were created by the rockfalls. The pyroclastic flows all descended along the same path, eroding a narrow v-shaped groove in the accumulated talus, which terminated at the top of a 100-m cliff. The flows spread at the base of the cliff, depositing material on the gentler slopes. Some of the southward-moving flows were deflected by the N face of Iwatoko hill (roughly 1.5 km S of the vent) ~70° towards the E and into the Akamatsu valley. The pyroclastic flows traveled about another 500 m, to a total of 2.2 km from their source.
Information Contacts: S. Nakada, Kyushu Univ; JMA.
Continued dome growth; occasional pyroclastic flows; large debris flow nearly reaches coast
Summit lava dome growth continued through early March, with frequent pyroclastic flows generated by partial dome collapse. Geologists estimated that by late January, the volume of the dome complex was 40 x 106 m3, and that ~ 75 x 106 m3 of lava had been extruded since 20 May 1991. The rate of extrusion was around 3 x 10⁵ m3/day during December-January, a rate that has remained nearly constant since June 1991.
Most of the growth of dome 6 . . . had been endogenous in mid-February through early March, then became dominantly exogenous. The area around the dome swelled upwards, and complicated "petal" structures formed on its surface. Continued thickening of dome 6 forced dome 5 . . . to the NE. The surface of dome 5 was very reddish, implying that it was composed of older, oxidized lavas, and was dominantly a cryptodome. Rockfalls from the E and N faces of dome 5 produced reddish block-and-ash flow deposits and left behind numerous small cliffs (figure 39). Dome 5 in turn pushed dome 4 (split into N and S parts), especially its N part, which moved more than 50 m to the E during mid-February-early March. Much of dome 4 was eroded or buried by material from other domes, bringing the talus slope flush with its top. Incandescence and strong gas emissions were observed along cracks and pit craters in and near dome 3. Emission of ash-laden plumes became continuous from Jigoku-ato Crater in early March.
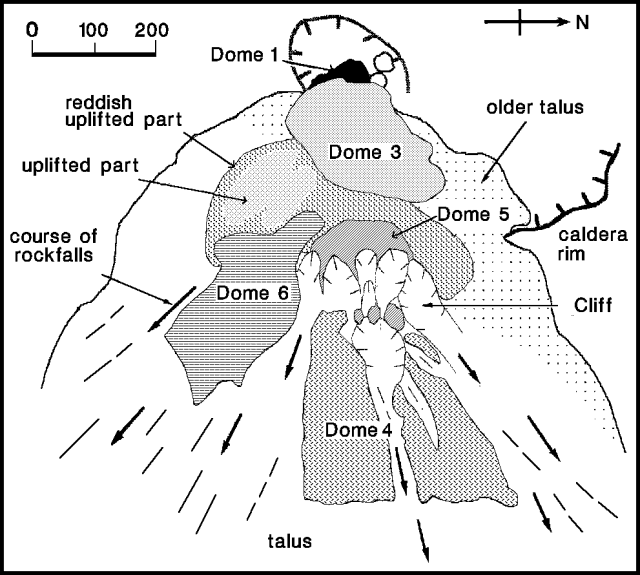 |
Figure 39. Sketch of the lava dome complex at Unzen, 27 February 1992. Courtesy of S. Nakada. |
Lava blocks frequently fell from near the head and front of dome 6, generating pyroclastic flows to the SE and occasionally to the E and NE (figure 40). Clouds of elutriated ash descending to the S sometimes reached the N cliff of Mt. Iwatoko, but the accompanying block-and-ash flows stopped about 300 m short of this point. Thus, trees on the N slope of the cliff were covered by the elutriated ash clouds, but they were neither bent over nor burned. Larger pyroclastic flows occurred on 2 and 12 February. Flows at 2020 and 2028 on 12 February had durations of 290 and 300 seconds, respectively, the longest since 15 September.
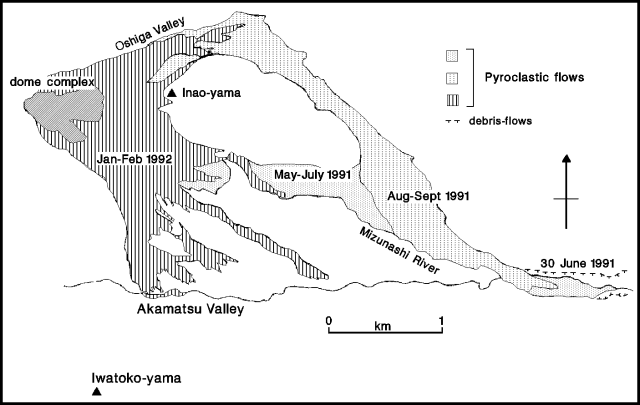 |
Figure 40. Map showing distribution of 1991-92 pyroclastic-flow deposits at Unzen, February 1992. The 1991 pyroclastic-surge deposits are not shown. Courtesy of S. Nakada. |
Heavy rainfall triggered a large debris flow at 0130 on 1 March, along the E flank's Mizunashi River, following the route of the previous large debris flow on 30 June 1991. The flow reached a point 100 m from the coast, 8 km E of the summit, crossing Routes 57 and 251, and burying a 200-m section of the Shimabara Railway. No damage occurred in previously untouched areas, and rail service was resumed within 6 days. As of early March, roughly 7,600 people remained evacuated.
February's 6,434 recorded earthquakes represent the largest monthly total since the eruption began, but seismicity started to decline on 4 March. Seismicity has been at very high levels since October.
Information Contacts: S. Nakada, Kyushu Univ; JMA.
Lava extrusion persists; new dome follows increased seismicity; strong pyroclastic-flow activity
Lava extrusion . . . was continuing in mid-April 1992. Dome 5 . . . swelled by intrusion, pushing the N half of dome 4 eastward, while dome 6 (formed 3 December 1991) thickened by new surface flows (figure 41). The length of dome 6 did not increase significantly, and the complex "petal" surface structures remained close to the vent, now the highest point in the dome complex. Increased seismicity in early April preceded the extrusion of a new dome (7), which was growing rapidly at mid-month.
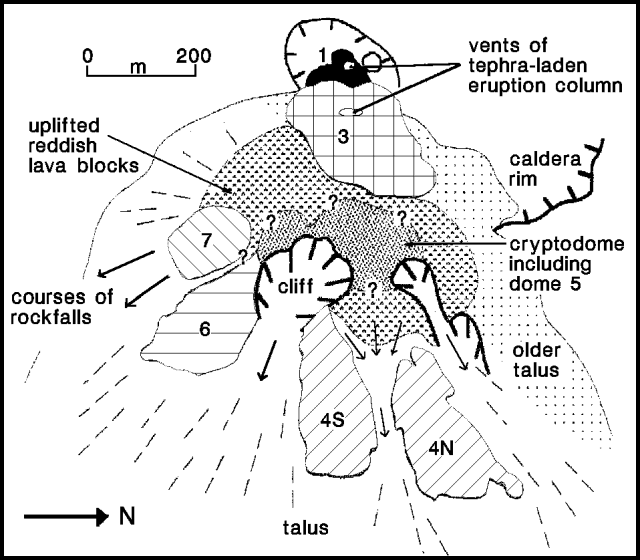 |
Figure 41. Sketch of the dome complex at Unzen, 12 April 1992. Individual domes are numbered. Courtesy of Setsuya Nakada. |
Frequent partial collapse of the front and sides of dome 6, and rarely the E and NE side of dome 5, generated pyroclastic flows that descended SE (toward the Akamatsu River) and sometimes ESE (along the Mizunashi River). During March, 504 pyroclastic flows were seismically recorded, up from 344 in February. The SE slope of the Akamatsu Valley was almost filled by block-and-ash-flow deposits by early April. A large pyroclastic flow, generated by collapse of large blocks between domes 5 and 6 on 1 April, traveled 3 km down the Mizunashi River, reaching the evacuated town of Kita-Kamikoba (where 43 people were killed by the 3 June 1991 flows). The 1 April block-and-ash-flow deposit was thinner, and its ash-cloud surge deposit was thinner and distributed over a much smaller area than those from the 3 June 1991 flows. The 1 April pyroclastic flow was the largest since the 15 September 1991 flows, whose deposit surface and lava blocks continued to steam as of early April. Small pit craters (to 30 cm diameter) were visible on the surface of the September 1991 deposit.
Heavy rainfall triggered three large debris flows in March. The 1 March debris flow reached a point 100 m from the coast (8 km E of the summit) crossing Routes 57 and 251, and burying a 200-m section of the Shimabara Railway. At 1000 on 15 March, 30 mm/hour of rainfall triggered a debris flow of similar size and route. Both highways were crossed, and a 140-m section of the railway was buried by 0.3 m of mud, remaining closed until 14 April. A smaller debris flow occurred along the same route on the morning of 23 March, burying a 30-m section of Route 251. Roughly 7,600 people remained evacuated as of mid-April.
During March, 5,663 earthquakes were recorded on the dome complex, down slightly from 6423 in February. Seismicity declined through mid-March, increased to the highest level of the eruption, and then declined again at the end of the month. The number of earthquakes increased during the first few days of April, before declining once more on 6 April, as a new dome (7) began to emerge. The new dome had grown to 100 x 150 m by 12 April (figure 41).
Information Contacts: S. Nakada, Kyushu Univ; JMA.
Continued lava dome growth; frequent avalanches and pyroclastic flows
Lava dome growth continued through mid-May, accompanied by frequent avalanches and pyroclastic flows produced by partial collapse of the lava dome complex (800 m E-W, 650 m N-S, and 350 m high by mid-April). The youngest dome (7), which first appeared on 6 April, grew slightly faster than material was removed by collapse along the leading edge. Its viscous lava formed "banana peel-like" structures with several radial lobes. These structures had typically been observed on the surfaces of newly extruded lava that overrode older domes (dome 3 over dome 2, and dome 5 over dome 4). By mid-May, dome 7 was about 200 m long, 110 m wide, and 90 m high, and had the highest extrusive vent of the dome complex.
The cryptodome that formed among domes 3, 4, 6, and 7 continued to swell, and small reddish oxidized pieces, probably from its interior, were exposed on the surface. Intrusion and erosion rates were balanced, keeping the peak shape and height nearly stable. Gullies developed around the cryptodome, extensively eroding its ENE side, where rockfalls frequently occurred. The rockfalls commonly traveled E and NE, and rarely N, producing reddish to pink-colored ash clouds. Many cracks appeared on the head of dome 6, pushed by the swelling cryptodome. The foot of dome 6 reappeared from the talus deposits, while dome 4 (E of the cryptodome) was buried by talus. Dome 2 was similarly buried in mid-December 1991. The E part of dome 3 was also pushed, and covered by reddish lava blocks from the cryptodome.
The daily number of seismically recorded pyroclastic flows ranged from 4 to 28, almost unchanged from previous months, totaling 322 in April . . . . Flows originating at dome 7 traveled down the SE flank of the dome complex toward Iwatoko-yama and the Akamatsu River valley. Pyroclastic deposits buried the gentle slope along the Akamatsu River valley. April's longest flow extended 3.5 km E from the dome. Although ash clouds (generally 500-1,000 m high, maximum 1,500 m) extended to > 500 m beyond the main flow deposits, they had only minor effect, neither burning nor toppling the trees that they passed. Geologists suggested that this may indicate a decrease in the auto-explosivity of the lava blocks.
On 22 April, repeated lava-block falls from the toe and sides of dome 7 generated multiple pyroclastic flows that cascaded down the steep SE slope made of pre-1990 volcanics, forming a gully 50 m deep, 100 m wide, and up to 400 m long. By mid-May, the gully had been buried by rockfall talus.
From mid-April to mid-May, blue gas was emitted continuously from dome 3, and sporadically from the heads of domes 6 and 7, and the cryptodome. Ash emission was weak and infrequent. Small earthquakes continued to occur beneath and within the dome complex, fluctuating between 20 and 200/day during April and early May, and totaling 3,053 in April (down from ~ 4,000-6,000 in prior months). Roughly 7,600 people remained evacuated as of early May.
Analyses of lava samples collected from pyroclastic-flow deposits generated by collapse of domes 6 and 7 indicate compositions similar to those of the other domes; ~ 65 weight % SiO2, with ~ 20 volume % of plagioclase, hornblende, and biotite phenocrysts. The samples had specific gravities of 2.1-2.2, also similar to the other domes, implying that vesicularity of the dome lavas has remained nearly constant throughout the 1991-92 eruption. Bombs erupted directly from the magma conduit on 8 and 11 June 1991 had specific gravities of 0.8-2.6.
Information Contacts: S. Nakada, Kyushu Univ; JMA.
Lava-dome growth and pyroclastic flows
Lava-dome growth continued through mid-June, and pyroclastic flows were frequently generated by partial collapse of the dome complex. The new dome (7) which first appeared on 24 March (correction to 17:3-4), continued to grow, reaching 150 m length by the end of May. Lava extrusion formed "banana peel" and sometimes "petal" structures (petal with two lobes). Swelling of the cryptodome raised its summit to 1,390 m elevation, 30 m higher than the pre-eruption summit. Lava blocks on the surface of the cryptodome were reddish in color and small (< 10 m across, commonly a few m across), suggesting to geologists that they had broken into pieces during intrusion. Earthquakes, probably occurring within the dome complex, frequently triggered collapse of the cryptodome, causing it to develop a conical shape with a relatively smooth surface.
Collapses occurred at both sides of the growing lobes on dome 7, as well as at the dome front. One rockfall, measured by the GSJ with a theodolite, was estimated to have a volume of 1.2 x 10⁵ m3. Pyroclastic flows generated from rockfalls traveled primarily down the dome complex's SE flank towards Mt. Iwatoko and into the Akamatsu valley, extensively burying its gentle slope (figure 42). Ash clouds accompanying the flows rose to about 1,000 m, with a maximum height of 1,400 m on 19 May. The pyroclastic-flow-deposit distribution was little changed from previous months. During mid-May to mid-June, 2-3 flows extended > 2 km/day, a flow 2.5 km long occurred every two days, and no flows reached > 3 km from the dome complex. Longer flows had a tendency to erode the steeper, upstream area, then deposit in the middle and downstream areas. The eroded upstream channels were subsequently filled by less-energetic flows. The longer flows tended to follow topographic lows quite closely, and as the saddle in the Akamatsu Valley was filled (~ 2.2 km SE from the front of dome 7), the height of the S cliff decreased from 30 to 10 m by early June. A deposition rate of ~ 35 cm/day was calculated for the mid-May to mid-June period.
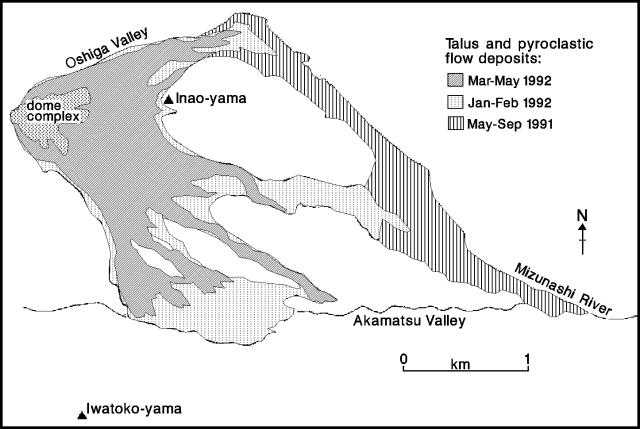 |
Figure 42. Map showing distribution of 1991-92 pyroclastic flow deposits at Unzen, mid-June 1992. 1991 pyroclastic surge deposits are not shown. Courtesy of Setsuya Nakada. |
The magma-supply rate, based on mapping by the Geographical Survey Institute, was estimated to be roughly 2 x 10⁵ m3/day for late February-late April, the lowest value since June 1991 (prior reported rates ranged from 2.5 to 3.5 x 10⁵ m3/day). The low magma-supply rate reflects the low level of activity in April, when the lava domes grew very little, large pyroclastic flows were rare, and seismicity was at low levels. Estimates of magma supply in May-early June suggest that the rate had returned to ~ 3 x 10⁵ m3/day. Geologists believe that the supply rate has probably fluctuated considerably since February. The volume of the dome complex was estimated to be 44 x 106 m3 on 25 April (similar to that of late February); combined pyroclastic flow and avalanche deposits, 50 x 106 m3 (dense rock equivalent); indicating a total erupted volume of ~ 94 x 106 m3.
Continued geomagnetic measurements by Kyoto Univ scientists show that the degree of demagnetization around the dome complex had decreased from mid-March. Demagnetization was strongest when lava first appeared in May 1991, and continued steadily until February 1992. Electronic distance measurements collected by the GSJ also showed the strongest shortening (between the summit and a point ~ 1.5 km away) in May 1991, and steady shortening through recent months, implying continuous swelling of the summit region.
Small earthquakes continued to occur beneath and within the dome complex, with 50-150/day in May-early June. A total of 3,235 earthquakes was recorded in May, similar to April. The daily number of seismically detected pyroclastic flows ranged from 5 to 17, with a total of 337 events, similar to previous months.
The evacuated area E of the volcano, in Shimabara and Fukae town, was reduced somewhat in June, decreasing the number of evacuees from 7,600 in May [to] about 6,750 by 11 June.
Information Contacts: S. Nakada, Kyushu Univ; JMA.
Continued lava dome growth generates pyroclastic flows
Growth of the lava dome continued through early July. Partial collapses of the dome complex frequently generated pyroclastic flows. Dome 7, which had begun to emerge in late March, grew exogenously against dome 6 (figure 43), which was buried and eroded by dome 7's lava blocks. Frequent rockfalls from the front and margins of dome 7 reduced its length (to ~ 200 m) and height (to ~ 50 m). Petal or peel structures, which had always appeared on the dome's surface during periods of rapid lava extrusion, were not evident, perhaps indicating a declining magma supply rate. The cryptodome, including dome 5, grew endogenously, frequently generating small rockfalls that were probably triggered by earthquakes within or beneath the dome complex.
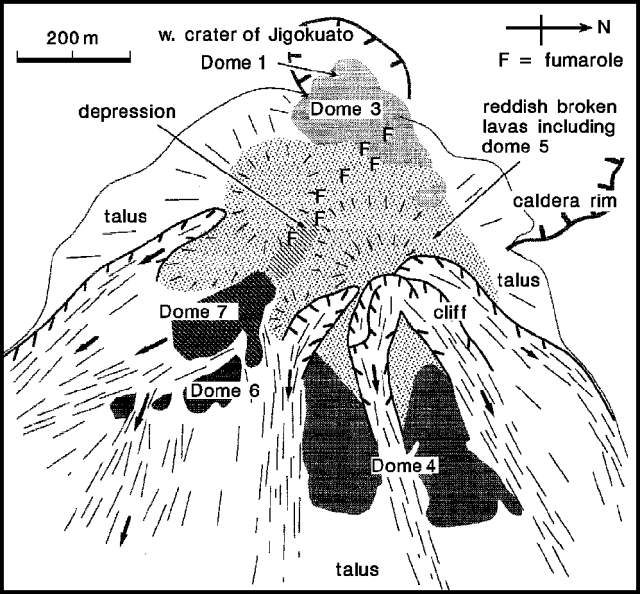 |
Figure 43. Sketch of the dome complex at the summit of Unzen, 8 July 1992. Courtesy of Setsuya Nakada. |
Volcanic gas was emitted continuously from the E part of dome 3, as well as from the depression between domes 3 and 7. The depression divides the cryptodome area into a conical NE section that includes the dome's summit, and a lower SW section with a flat top.
Deposits of the pyroclastic flows that cascade down the SE flank continue to bury the Akamatsu valley. The lowest saddle of the valley's southern cliff remains ~ 10 m high. On 23 June, the ash-cloud surge from a pyroclastic flow struck the saddle, but the main flow did not reach the cliff. The surge toppled brush on the saddle and to ~ 100 m distance, but small cedar trees remained standing. Bark and leaves were not burned, but leaves in the area died. About 10 cm of ash was deposited on the saddle. Thin lead foil, set in a stainless-steel hole to detect the pressure of the ash-cloud surge, was hollowed, and aluminum foil was broken.
Debris flows that have occasionally occurred during the current rainy season eroded pyroclastic flow deposits in the valley. Pyroclastic-flow material was deposited along the valley's N side and in its upper reaches. This deposition pattern, erosion by debris flows, and the declining magma-supply rate delayed the overflow of the lowest part of the saddle by southern-cliff pyroclastic flow deposits. In early July, the Nagasaki prefectural government began to construct a steel fence, 35 m wide and 10 m high, in a stream originating from the saddle, hoping to prevent ash-cloud surges from entering the stream.
JMA reported that the daily number of seismically detected pyroclastic flows ranged from 6 to 21 in June. The total of 373 in June was almost unchanged from previous months. The longest June flow extended 3 km SE from the dome. Most ash clouds generated by the flows rose about 1,000 m, with the highest, to 1,200 m, on 13 and 17 June.
Small earthquakes continued to occur within and beneath the dome complex, at rates of 50-200/day through mid-July. The June total, 3,671 recorded earthquakes, was similar to previous months.
Evacuated areas . . . were somewhat reduced on 11 July, decreasing the number of evacuees from 6,746 to 6,064.
Information Contacts: S. Nakada, Kyushu Univ; JMA.
Dome growth slows, but rockfalls and heavy rain trigger destructive pyroclastic and debris flows
The lava dome complex continued to grow through mid-August (table 9). Viscous lava did not continuously reach the surface, although magmatic intrusion caused some endogenous growth. Changes to the size of the dome complex were small, and the magma-supply rate has decreased to half of its peak of > 300,000 m3/day in late 1991-early 1992. A rough estimate of the late July-early August rate is 110,000-160,000 m3/day. Earthquakes had been frequent during periods of endogenous growth at the higher magma-supply rate, but recently there have been few seismic events in the absence of lava extrusion, implying that magma is no longer being continuously supplied to the dome complex.
Table 9. Chronology of eruptive events at Unzen, July 1990 to mid-August 1992. Courtesy of JMA.
| Date | Volcanic Activity |
| Jul 1990 | Earthquakes and tremor episodes began. |
| 17 Nov 1990 | Phreatic ash eruption. |
| 12 Feb 1991 | Phreatic ash eruption resumed at Byobu-iwa crater. |
| Apr 1991 | Phreatic eruptions at Jigoku-ato crater. |
| 13 May 1991 | Summit seismicity and deformation begin. |
| 20 May 1991 | Lava dome 1 emerged in Jigoku-ato crater. |
| 24 May 1991 | First pyroclastic flow observed. |
| 03 Jun 1991 | Large pyroclastic flow killing 43 people and damaging 179 houses; growth of lava dome 2 began shortly thereafter. |
| 08 Jun 1991 | Large pyroclastic flow, extending 5.5 km and damaging 207 houses. |
| 11 Jun 1991 | Explosion, producing block fall in inhabited areas. |
| 30 Jun 1991 | The largest debris flow, caused by heavy rainfall, damaging 202 houses. |
| 11 Aug 1991 | Summit seismicity began to increase. |
| 12 Aug 1991 | Ejection of incandescent blocks. Continuous ash emission. Sudden decrease in pyroclastic flows. |
| 13 Aug 1991 | Dome 3 recognized, W of dome 2. |
| 25 Aug 1991 | Beginning of pyroclastic flow activity into Oshiga valley. |
| 31 Aug 1991 | Evacuation from Senbongi area, NE of the summit. |
| 06 Sep 1991 | Summit seismicity began to increase. |
| 15 Sep 1991 | The largest pyroclastic flow, extending 5.5 km, damaged 218 houses. |
| 16 Sep 1991 | Peak of summit seismicity. |
| 17 Sep 1991 | Summit seismicity declined. New dome 4 recognized from the air. |
| 24 Oct 1991 | Summit seismicity began to increase. |
| 25 Oct 1991 | Dome inflation recognized from the air. |
| Nov 1991 | Inflation of dome 4. Increase in summit seismicity, and decrease in pyroclastic flow activity. |
| late Nov 1991 | Cryptodome 5 formed. |
| 03 Dec 1991 | Lava dome 6 began to emerge. |
| through Dec 1991 | Continuous growth of dome 6. Pyroclastic flows to SE and ESE (Tansanui and Oshiga valleys). |
| late Dec 1991 | Summit seismicity declined. |
| 27 Dec 1991 | Shimabara Railway traffic resumed. |
| 29 Dec 1991 | Summit seismicity resumed. |
| Jan 1992 | High seismicity at summit. Pyroclastic flows to E and ESE. |
| 02 Feb 1992 | Large pyroclastic flow, extending 3 km; no damage. |
| 12 Feb 1992 | 30-minute pyroclastic flow sequence triggered by partial collapse of dome 6. Many pyroclastic flows to the SE. |
| 22 Apr 1992 | Many pyroclastic flows to the SE. |
| 08 Aug 1992 | Many pyroclastic flows to the SE damage 17 houses; large debris flow damages 72 houses. |
| 12-13 Aug 1992 | Large debris flows destroy 55 houses. |
| 15 Aug 1992 | Debris flow destroys 40 houses. |
Dome 7 (figure 44), which began to emerge in late March, grew exogenously in late July, creating petal and peel structures on its surface. A few days after dome 7 stopped growing, the axis of the petal structures was buried by material that collapsed from the dome above it, and its surface became reddish, implying that magma supply had nearly ceased.
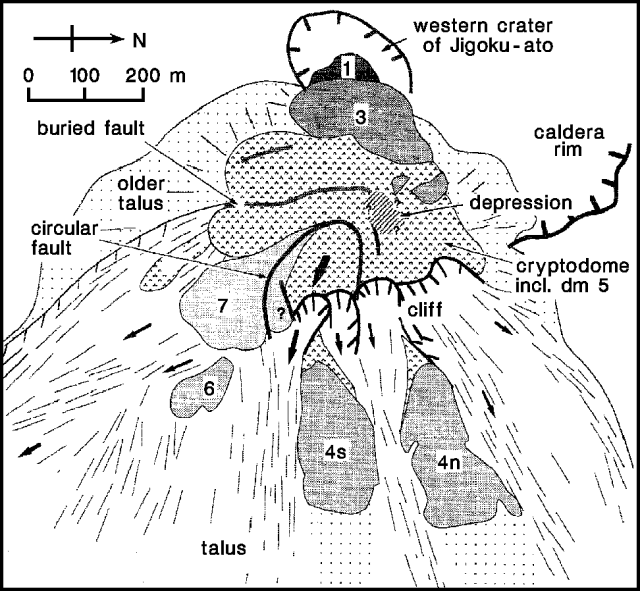 |
Figure 44. Sketch of the dome complex at the summit of Unzen, 7 August 1992. A plug-like lava block surrounded by a circular fault was being slowly pushed eastward, as shown by the arrow on the plug. Arrows on the talus show the directions taken by rockfalls. Volcanic gases were emitted from dome 3 and along the buried fault. Courtesy of Setsuya Nakada. |
In early August, plug-like blocks of the cryptodome, a mass of brown lava surrounded by circular faults, were pushed horizontally eastward at an average rate of ~ 10 m/day. Geologists believe that the plug may represent a magma conduit inclining westward beneath Jigoku-ato crater that was the source of viscous lava when the magma-supply rate was high. A grayish fresh lava surface with step-growth wrinkles appeared along the circular fault.
Rockfalls from the plug and its periphery generated pyroclastic flows along the Mizunashi River (SE of the summit) and Akamatsu Valley (S and SE of the volcano), traveling ~ 3 km from the crater. When a part of the cryptodome collapsed, a reddish ash cloud rose from the rockfalls to ~1,000 m, the highest to 1,300 m on 5 July. Ash frequently fell on inhabited areas around the volcano (including Shimabara city and Fukae town, which extend to within 7 and 4 km of the dome, respectively, and the Unzen spa area).
Small earthquakes continued to occur within and beneath the dome complex, at rates recorded by JMA of 50-400/day in July and the first half of August. Rates in late July were the highest since March, and the July total of 5,614 was also the largest since March.
Seismometers began to record a burst of pyroclastic flows, the most vigorous since 22 April, on 8 August at 0823. Sixteen were recorded by 1030, including events with durations of 180 seconds at 0945, 130 seconds at 0953, and 170 seconds at 1000. Heavy rains and dense clouds from a typhoon, which passed near the volcano that morning, obscured the volcano and prevented determination of pyroclastic-flow lengths and directions. Pyroclastic flows traveling along the Akamatsu Valley ~ 3.5 km from the dome burned 17 houses in an area (Minami-Kamikoba, Fukae town) that had been evacuated since June 1991. An additional house burned on 9 August at about 1330, but the cause of the fire was not known. No houses had been burned by pyroclastic flows since the destruction of 218 on 15 September 1991.
Typhoon rains fell at rates to 60 mm/hour on 8 August, triggering debris flows that produced distinctive signatures on seismic records. Debris flows were frequent along the Mizunashi River on 8 August between 0730 and 0900. The largest extended 7 km E of the dome, burying highways and the Shimabara railway, and damaging 72 houses in Shimabara city and Fukae town. Rain that fell from about noon on 12 August until the next morning caused 2 more large debris flows, at about 1930 on the 12th and 0400 on the 13th. Peak precipitation rates were 30 mm/hour and 10 mm/hour at two nearby rain gauges. The flows again traveled along the Mizunashi river, burying highways and the railway, and destroying 55 houses along both sides of the river's lower reaches. Structural damage from the August debris flows was the first since 30 June 1991. Highways were reopened by the evening of 13 August, but railway traffic was still halted as of 16 August. Forty more houses were destroyed along the Mizunashi River by a rain-induced debris flow early on 15 August. Another typhoon . . . was expected to reach the Unzen area late on 18 August.
Weather prevented observations of changes in dome morphology, as the succession of large pyroclastic flows and debris flows occurred for about a week in mid-August. When geologists examined the debris flows, they were steaming vigorously, and contained hot fragments of lava blocks derived from the youngest pyroclastic flows. A few hours after a debris flow was deposited, surface and interior temperatures of one of its lava blocks were about 80°C and 300°C, respectively. Debris flows were generated in the middle sections of the Oshiga (NE flank) and Akamatsu valleys. The middle portion of the Mizunashi valley was always covered by a sequence of new pyroclastic-flow deposits when visited by geologists.
The evacuated areas . . . were unchanged as of mid-August, and 6,054 residents remained evacuated. None were reported injured by the activity.
Information Contacts: S. Nakada, Kyushu Univ; JMA.
Continued dome growth; dome 8 extruded; pyroclastic and debris flows damage many buildings
Endogenous (cryptodome) and exogenous growth in August produced a new dome (8), which began to emerge 11 August at the upper part of dome 7. Collapses reduced the size of the dome complex until mid-August, then volume increased again, mainly from endogenous growth. Based on digital mapping by the Geographical Survey Institute, the volume of the dome complex is estimated at 5 x 10⁷ m3, with the total amount of magma erupted since 20 May 1991 estimated at 11 x 107 m3. Although the magma-supply rate has not been constant, the average from late April to early August is ~ 1.4 x 10⁵ m3/day.
Dome 7 resumed growth in mid-August as new lava extruded from the magma-supply vent joined lava emerging from the circular fault that appeared on the east-central part of the cryptodome in early August. Dome 8, created from this fresh lava along the circular fault, grew to ~ 300 m long, 150 m wide, and 100 m high. A NW-SE-trending graben up to 50 m wide formed on dome 8 in late August along part of the former circular fault. Upward growth of dome 8 in early September increased the width of the graben until the graben wall collapsed. The growth of dome 8 caused the W half of dome 7 to collapse as a series of rockfalls on 14-15 August. The E half of dome 7 was pushed E until it hung over dome 6.
Partial collapses of the dome complex often generated pyroclastic flows. One SE-flank pyroclastic flow burned 17 houses from 0830 to 1030 on 8 August. Heavy rains triggered debris flows along the Mizunashi River . . . 8-15 August, damaging 240 houses (table 10; note change in the number of damaged houses from previous report). No additional damage had been caused by pyroclastic flows as of mid-September. Pyroclastic flows from Jigokuato crater in late August traveled almost 4 km along the Mizunashi River, longer than the fatal 3 June 1991 flow and the longest since 15 September 1991. The rockfalls of 14-15 August generated pyroclastic flows along the Akamatsu Valley (S and SE of the volcano). The flows frequently struck the N cliff of Mt. Iwatoko (on the S side of the Akamatsu valley), just reaching the top of its lowest saddle, and ash clouds entered a small valley extending 300 m from the saddle. Since mid-August, pyroclastic flows moving NE from the cryptodome overflowed from the Oshiga Valley (extending NE from the summit) into another small valley (north of Taruki Height). The Height is a barrier between the Oshiga Valley and Shimabara city, and the small valley is the headwater of a river flowing into the city. The upper portion of the Oshiga Valley near the head of Taruki Height had been completely filled with pyroclastic-flow deposits until small debris flows eroded them. Cut off by debris flows in early August, the Shimabara railway resumed operation on 1 September.
Table 10. Summary of damage from volcanic activity at Unzen, 1991-92, showing inhabited houses totally and partially destroyed or inundated, uninhabited houses damaged, deaths, and injuries. Data from the Fire Defence Agency; courtesy of JMA.
| Date | Activity Type | Houses Totally Destroyed | Houses Partially Destroyed | Houses Inundated | Uninhabited Houses Damaged | Deaths | Injuries |
| 15 May 1991 | Debris flow | 0 | 0 | 0 | 1 | 0 | 0 |
| 26 May 1991 | Pyroclastic flow | 0 | 0 | -- | 0 | 0 | 1 |
| 03 Jun 1991 | Pyroclastic flow | 49 | 0 | -- | 130 | 43 | 9 |
| 08 Jun 1991 | Pyroclastic flow | 70 | 2 | -- | 135 | 0 | 0 |
| 11 Jun 1991 | Falling ejecta | 11 houses damaged, along with 53 cars and 2 helicopters (on land) | |||||
| 30 Jun 1991 | Debris flow | 49 | 28 | 21 | 104 | 0 | 1 |
| 15 Sep 1991 | Pyroclastic flow | 53 | 0 | -- | 165 | 0 | 0 |
| 08 Aug 1992 | Pyroclastic flow | 5 | 0 | -- | 12 | 0 | 0 |
| 08-15 Aug 1992 | Debris flow | 28 | 31 | 104 | 77 | 0 | 0 |
| Total | Pyroclastic flow | 177 | 2 | -- | 442 | 43 | 10 |
| Total | Debris flow | 77 | 59 | 125 | 182 | 0 | 1 |
Seismically detected pyroclastic flows varied from 4 to 26/day in August, for a total of 357 during the month, similar to previous months. Ash clouds from these flows usually rose ~ 1 km; maximum heights were 1.2 km on 8 and 13 August. Ash fell to the E on Shimabara city, Fukae town, and Unzen spa. The number of evacuees was halved to 3,017 on 9 September. Volcanic gas was emitted from dome 3 and a graben area. Gas from a vent in Jigokuato crater was at ~ 800°C, constant since May 1992, according to a direct temperature-probe measurement by Kyushu University's Shimabara Earthquake and Volcano Observatory.
A total of 3,125 earthquakes was recorded in August, at rates of 20-200 per day. The 632 events recorded on 11 September were a new high for the current activity. Earthquake swarms were detected on 13-14, 17, and 31 August. These were located 20 km W of the summit at ~ 15 km depth in Tachibana Bay, in the westernmost area of previous seismicity there. Seismic activity in Tachibana Bay had been low since August 1991. Five shocks from the swarms were felt at UWS . . ., the first felt there since 1 April. The largest shock was M 4.5 at 0912 on 13 August.
Information Contacts: S. Nakada, Kyushu Univ; JMA.
Continued lava-dome growth; collapses generate pyroclastic flows
The period mid-September to mid-October was characterized by exogenous growth of dome 8 on the SE part of the lava-dome complex. Lava emerged from the SE end of an arc-shaped crack (described as a circular fault in 17:08), piled up near the vent, and repeatedly collapsed from the flow front, ~ 100 m away. This short flow-length implied high-viscosity lava due to a low magma-supply rate, estimated at ~ 105 m3/day from helicopter observations. In 1991, lava domes extended up to 400 m from vents when magma-supply rates exceeded 3 x 10⁵ m3/day. The part of dome 8 that formed along the crack in mid-August and subsequently stopped growing has been uplifted and pushed E.
Rockfalls continued to occur on the E flank (figure 45), increasing the thickness of talus deposits around the dome complex. Domes 7 and 8 generated many pyroclastic flows, mainly toward the SE (Akamatsu Valley), with others to the E (Mizunashi Valley) and NE (Oshiga Valley). Most of the pyroclastic flows traveled 1-2 km, but some extended > 3 km. Ash clouds from the flows rose about 0.5-1 km. Relatively large pyroclastic flows generated by rockfalls from dome 7, which was pushed above dome 6 during the growth of dome 8 in mid-August, occurred at 0918 on 27 September, 1550 on 3 October, and 1944 on 10 October. These pyroclastic flows reached the Kita-Kamikoba and Kami-Onokoba (Fukae town) areas, after traveling 3.4 km along the Mizunashi Valley (3 October) and 3.6 km down the Akamatsu Valley (10 October) from the toe of the dome (~ 400 m from Jigokuato Crater). No damage was done, and the surrounding forest was not burned or destroyed. The rockfall volume that generated these pyroclastic flows was estimated at 0.5-1.0 x 10⁵ m3. Seismic duration of the flow was 160 seconds. Vertical drop during travel was ~ 1 km. The main block-and-ash flows were the longest in 1992 and traveled slightly farther than those of 3 June 1991 . . . .
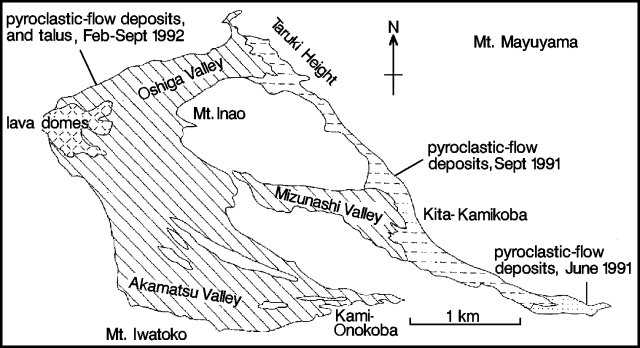 |
Figure 45. Lava dome complex and distribution of pyroclastic-flow deposits at Unzen, mid-September 1992. Deposits from larger pyroclastic flows in late September and early October are not shown. Courtesy of S. Nakada. |
The 27 September pyroclastic flow was videotaped from a helicopter by the Ground Self-Defense Force. The frontal 1/3 of dome 7 (~ 105 m3; 140 m wide, 80 m high, and 20 m deep) suddenly fell away, developing into pyroclastic flows along the divide between the Mizunashi and Akamatsu valleys. The main flow split in two after striking a large block. One portion traveled 3.5 km along the Akamatsu Valley, equaling the 8 August flow (17:08). The videotape showed ash clouds moving steadily (rather than surging) on the ground in the area S and SW of Kami-Onokoba. An inspection from the air 6 hours later showed thick ash covering trees and houses. New damage might be impossible to detect because most of the area had already been destroyed by the 8 August flows and covered with ash.
The frequency of pyroclastic flows detected seismically by JMA ranged from 4 to 36 in September, for a monthly total of 395. Small earthquakes continued both beneath and within the dome complex at rates of 50-600/day and totaled 5,947 for September. Seismicity was most active in mid-September, with 632 events recorded on the 11th. The number of evacuees from Shimbara city and Fukae town was reduced to 3,017 from 6,054 on 9 September. Mayors of the two towns decided on 9 October to leave that number unchanged through the end of the year.
Lava composition has been constant throughout the current activity, which began in May 1991; a 65 wt.% SiO2 dacite with hornblende and biotite phenocrysts. With the exception of volcanic bombs ejected by Vulcanian eruptions on 8 and 11 June 1991, the specific gravity of the lava has remained constant. An ash-laden eruption column was observed on 1 October coming from cracks in dome 3 and filling Jigokuato Crater. The only other ash column observed this year was on 3 April. Volcanic gas activity was strong during this period.
Information Contacts: S. Nakada, Kyushu Univ; JMA.
Continued dome growth, at about half of last year's rate; dome collapses generate pyroclastic flows
Lava domes 5 and 8 continued to grow through October and mid-November. The dome-growth rate was estimated at ~ 0.1-2.0 x 10⁶ m3/day in September-October, approximately half of last year's rate. Pyroclastic flows were frequently generated by partial collapse of the dome complex, mainly towards the SE . . ., but also towards the E . . . and NE . . . . Ash clouds from the flows rose ~ 0.5-1 km. Most of the pyroclastic flows traveled 1-2 km. Two large flows were generated on 3 and 10 October. The 3 October flow (at 1549) traveled 3.5 km E along the Mizunashi Valley with a seismic duration of 260 seconds. On 10 October (at 1944) the second flow moved 3.5 km SE along the Akamatsu Valley, continuing for 130 seconds on seismic instruments. Both were smaller than the 27 September pyroclastic flow.
The monthly total of seismically detected flows reached 284, with a daily rate of 3-16. A total of 2,948 earthquakes occurred in October, the fewest in a month since October 1991. Daily frequency ranged from 50 to 150. The number of evacuees from Shimabara city and Fukae town has remained unchanged since being reduced to 3,017 on 9 September.
Information Contacts: JMA.
Continued dome growth spawns more pyroclastic flows
Lava extrusion continued to build dome 8 through mid-November. A depression 150 m across had developed in the center of the lava-dome complex by late October, with dome 8 at the SE edge. Dome growth was dominantly endogenous from mid-November through early December, as older blocks of lava were uplifted into mounds at the NNE and S edges of the depression. The S mound grew eastward and was divided by a NE-trending graben in which a new lava dome (dome 9) appeared on 3 December (figure 46). By 9 December, the dome had grown to ~ 200 m long, 100 m wide, and 30 m high. The light-gray lava from this vent was viscous, blocky, and developed a crude "peel structure" at the vent site. The SE mound near dome 9 continued to grow eastward as of mid-December, implying both endogenous and exogenous growth.
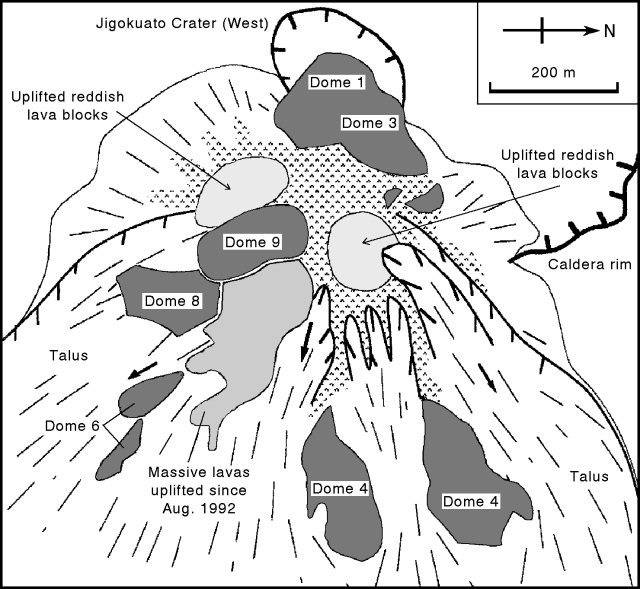 |
Figure 46. Sketch map of the lava dome complex on 9 December 1992. Note that N is to the right. Courtesy of S. Nakada. |
Relatively small-scale pyroclastic flows from dome 8 traveled 1-2.5 km SE into the Akamatsu Valley in mid-November. Ash clouds from the flows rose 0.5-1 km. Small pyroclastic flows to the E and NE generated by the collapse of older lava blocks from the NNE mound sometimes overflowed from the middle of the Oshiga Valley into a northern valley. Rockfalls decreased in frequency during the period of endogenous growth from late November to early December, but resumed on the E sides of the mounds a few days after dome 9 appeared. The frequency of seismically detected pyroclastic flows declined on 13 November and remained at a low level (a few events/day) for more than a month. There were 255 recorded pyroclastic flows in November . . . .
Based on digital mapping by the Geographical Survey Institute, the volume of the lava dome complex is estimated at 47 x 106 m3, with 120 x 106 m3 of magma erupted since 20 May 1991. The volume of the complex is almost the same as in August, implying that the volume of collapsed lava blocks approximately equaled new magma production during this period. The average magma-supply rate from early August to mid-November was ~ 1.3 x 10⁶ m3/day. Field observations suggest that the rate was as much as 2.5 x 10⁶ m3/day in mid-August and declined to < 0.5 x 10⁶ m3/day by late November. The rate increased to ~ 1 x 10⁶ m3/day after extrusion of dome 9 in early December.
Gas emission decreased in November, but gases remained at a temperature of ~ 800°C, based on direct measurement by SEVO. Ash-laden eruption columns were observed in mid-November for the first time since early October. Small earthquakes beneath and within the dome complex continued to occur at rates of 100-400/day. A total of 4,865 earthquakes occurred in November, a significant increase from the 2,948 recorded in October. Seismicity continued at a similar rate through mid-December. The number of evacuees . . . has remained unchanged since being reduced to 3,017 on 9 September.
Information Contacts: S. Nakada, Kyushu Univ; JMA.
Continued dome growth; brief burst of vigorous pyroclastic flows
A new lava dome (dome 9) began to emerge in the central part of the complex on 3 December. The frequency of seismically detected pyroclastic flows had declined in mid-November and remained low through December. Only 86 pyroclastic flows were recorded in December, down from 255 in November and 300-500 in the previous months (table 11). Pyroclastic flows moved mainly towards the SE . . . and E . . . . Most traveled 1-2 km, although the largest flow advanced E ~ 3 km on 20 December at 0926, with a seismic duration of 170 seconds. Ash clouds from the flows rose ~ 0.5-1 km during December, causing ashfalls on inhabited areas.
Table 11. Monthly seismicity and number of seismically recorded pyroclastic flow events at Unzen, 1992. Courtesy of JMA.
| Month | Earthquakes | Pyroclastic flows |
| Jan 1992 | 5337 | 308 |
| Feb 1992 | 6423 | 344 |
| Mar 1992 | 5623 | 504 |
| Apr 1992 | 3053 | 332 |
| May 1992 | 3234 | 337 |
| Jun 1992 | 3671 | 373 |
| Jul 1992 | 5614 | 342 |
| Aug 1992 | 3125 | 357 |
| Sep 1992 | 5947 | 395 |
| Oct 1992 | 2948 | 286 |
| Nov 1992 | 4864 | 255 |
| Dec 1992 | 3558 | 86 |
Small earthquakes beneath and within the dome complex continued to occur at high rates, declining slightly in late December. Daily numbers ranged from 60 to 180 (figure 47). A total of 3,558 occurred in December . . . (table 11). Seismicity around the volcano was low. The number of evacuees . . . was reduced on 31 December from 3,017 to 2,008, the first reduction since 9 September.
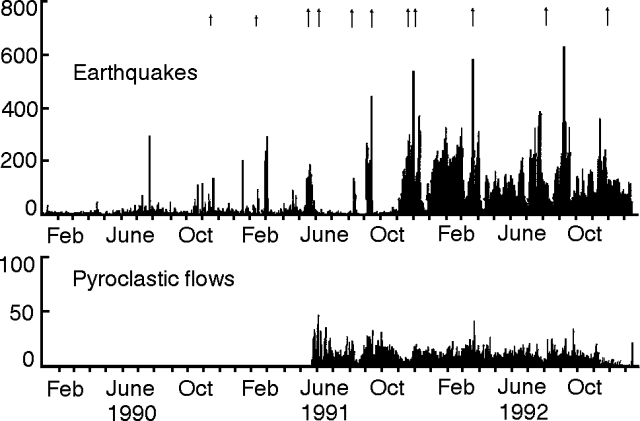 |
Figure 47. Daily number of earthquakes (top) and seismically counted pyroclastic flows (bottom) at Unzen, 1 January 1990-16 January 1993. Larger arrows indicate the first appearance of each of the nine lava domes; smaller arrows represent pre-extrusion explosive activity. Courtesy of JMA. |
The frequency of seismically detected pyroclastic flows remained low (0-2 events/day) until 15 January, when there was a burst of flows that began at 1648 with a seismic signal of 100 seconds, and continued until 1944. Two large flows lasting 300 and 390 seconds were generated at 1925 and 1931, respectively. During the three hours of increased activity, 23 flows were detected, the most activity since 8 August 1992 when 17 houses were burned. The flows traveled towards the SE and E, causing no damage. Lengths and volumes were not known. Ash from the flows fell heavily on southern Shimabara and northern Fukae, at the volcano's ESE foot. Highways and a railway were closed for a few hours due to the ash. At 1730, the UWS alerted concerned organizations and the media to the activity with a Volcanic Activity Information statement. This statement is the highest level of their three kinds of volcanic alerts and the first since 24 June 1992.
Pyroclastic-flow frequency returned to a low level (2 events/day) after the burst, and remained low as of 17 January. Seismicity was unchanged before and after the burst, with 50 to 120 earthquakes/day through 17 January.
Information Contacts: JMA.
Continued dome growth generates pyroclastic flows and avalanches
The lava dome complex's shape remained relatively unchanged throughout December and January. On 1 February, fresh, massive lava blocks began to appear from the west-central part of the dome complex, which had continued to swell during the last week of January. The swelling event was accompanied by frequent volcanic earthquakes. The lava blocks grew to form a new lava dome (dome 10) by 3 February (figure 48). Peel structure, consisting of thick multiple lava lobes extruded from the center, characterized the new dome. Dome 10 grew from 150 x 100 m wide and 25 m high on 4 February, to 200 x 150 m wide and 50 m high on 10 February. It's summit reached 1,400 m elevation, the highest of the 10 domes. The eruption rate was estimated at 105 m3/day 1-10 February, twice the rate of December and January. Dome 10 lava emerged just above Jigokuato Crater, where dome 1 appeared and explosions occurred on 8 and 11 June 1991. Small avalanches from dome 10 traveled N and SW on 9 February, covering old lava domes (1 and 3). Previous avalanches, May 1991-January 1993, went NE, E, and SE. Strong ash-laden eruption clouds rose intermittently. On 10 February, small-scale pyroclastic flows were seen moving to the SW and W from dome 10.
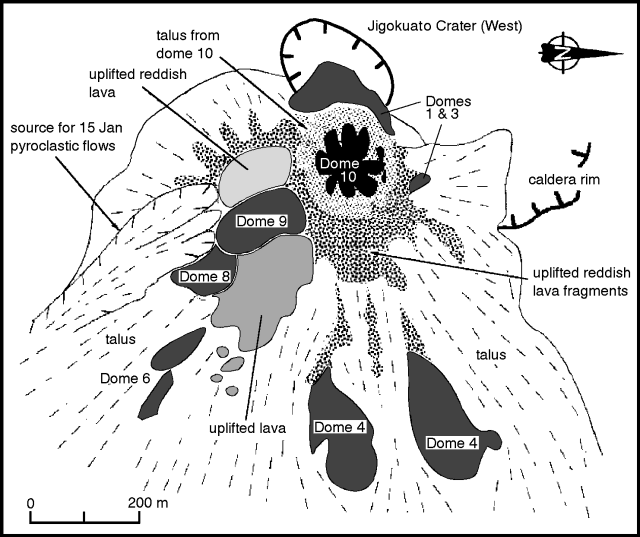 |
Figure 48. Sketch map of the lava-dome complex on 5 February 1993. Note that north is to the right. Courtesy of Setsuya Nakada. |
The frequency of seismically detected pyroclastic flows had declined since mid-November, with the exception of bursts on 20 December and 15 January, and remained low through early February. The flows are thought to be generated by partial collapse of the dome complex. The 20 December flow traveled 3.7 km from the source, the largest of 1992. The flow front was ~ 300 m beyond the point where 43 people were killed by a pyroclastic surge 3 June 1991. The source material for the 20 December pyroclastic flow is thought to be large lava blocks extruded about one month earlier. Field reports showed that the deposits tapered and thinned to the front. The block-and-ash-flow deposits were not accompanied by pyroclastic surge deposits. Lava blocks found in the pyroclastic flow were massive and dense. Geologists considered two alternative models for the source of the ash: 1) it originated at the source of the pyroclastic flow, or 2) it formed from the disintegration of collapsed lava blocks. The 15 January flow traveled SE, eroding talus and pyroclastic flow deposits. Only 35 pyroclastic flows were recorded in January, down from 86 in December and 255 in November. The flows moved mainly towards the SE into the Akamatsu Valley. Ash clouds from the flows rose ~ 0.5 km.
Small earthquakes beneath and within the dome complex continued to occur at high rates. A total of 3,147 occurred in January, down slightly from 3,558 in December. Seismicity around the volcano was low. Frequency of earthquakes and pyroclastic flows were unchanged from January through early February. The number of evacuees from Shimbara city and Fukae town was unchanged at 2,008.
Information Contacts: JMA; S. Nakada, Kyushu Univ.
Dome complex continues to grow; large pyroclastic flow
Dome 10 . . . grew at a faster rate (1-2 x 10⁵ m3/day) than the dome complex grew during November-January. This rate, nearly equal to the magma supply rate, is less than half of the maximum value recorded at Unzen of ~ 5 x 10⁵ m3/day. The dome is significantly less silicic, 63.5 wt.% SiO2, than the earlier domes, which had 65 wt.% SiO2. It eventually covered the gas-emitting sites and most of the remaining surfaces of domes 1 and 3 in the topographically lower area to the N. Because dome 10 grew on the nearly flat surface of the older domes (figure 49), collapses seldom occurred, and the observed frequency of pyroclastic flows and the monthly total of seismically recorded pyroclastic flows remained low (figure 50). Relatively large collapses, though still less than 5 x 10⁵ m3 in volume, started just after the dome began overflowing the top. During February, pyroclastic flows traveled ~ 2 km to the E, NE, and SE.
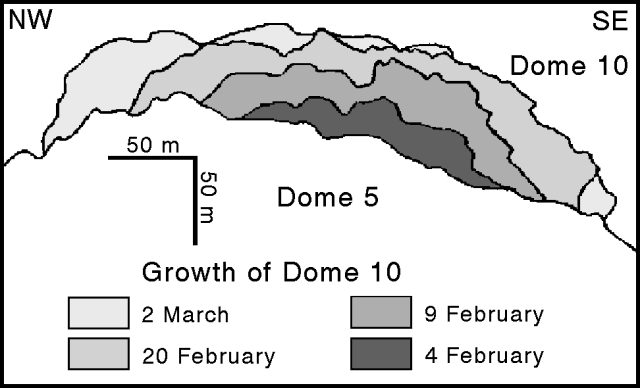 |
Figure 49. NE-looking view of the lava dome complex at Unzen based on theodolite measurements October 1992-March 1993. Courtesy of Setsuya Nakada. |
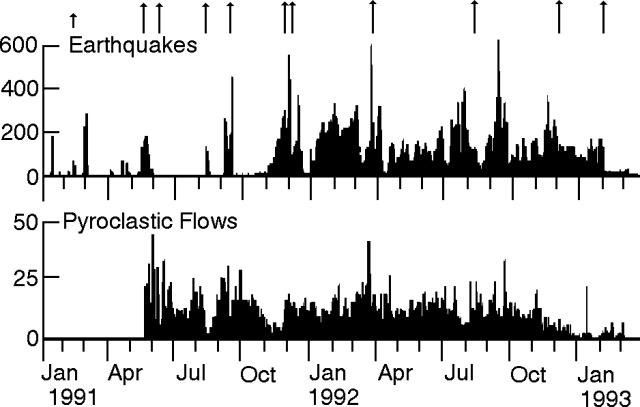 |
Figure 50. Daily count of earthquakes (top) and pyroclastic flows (bottom) at Unzen, 1 January 1991 to 8 March 1993. The 10 longer arrows at the top mark the onset of each of the domes; the short arrow indicates a phreatic eruption. Courtesy of JMA. |
A pyroclastic flow at 1642 on 9 March descended between two wings of dome 4 (figure 48). Part of the flow traveled 3.5 km E into the Mizunashi Valley. The other part traveled NE through the Oshiga Valley with an overflow out of the valley to the N. The remainder moved to the SE, eventually rejoining the Mizunashi Valley flow. It was the longest flow since 20 December and the first flow to pass through the Oshiga Valley since 15 September 1991, that flow being the largest of the current eruption. The seismic duration of the 9 March flow, 190 seconds, was the longest since 15 January. The flow remained in the evacuated area and caused no damage although a section of highway, 6 km E of the volcano, was temporarily closed. The ash cloud from the flow rose 1.5 km above the summit, the highest since April 1992. Ash fell heavily on the E foot of the volcano in Shimbara and Fukae. Kumamoto, 40 km E, received a small ashfall. Additional pyroclastic flows occurred 12 March.
The steam plume, occasionally mixed with ash, continued to rise a few hundred meters above the dome complex. The height has gradually declined since the summer of 1991 (figure 51). Mid-February work by the Tokyo Institute of Technology indicated that the SO2 flux from the dome complex remained at the low level measured at the end of 1992 (during endogenous growth) and the temperature of gases in the crater was as high as 800°C.
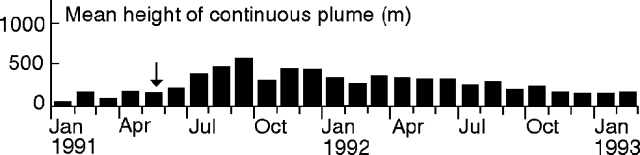 |
Figure 51. Monthly mean height of the continuous steam plume from Jigokuato crater, Unzen, January 1991 to February 1993. The arrow indicates the onset of dome growth. Courtesy of JMA. |
The number of small earthquakes beneath the dome complex declined rapidly in early February and has remained low (figure 50). The monthly total of recorded earthquakes dropped from more than 3,000 to 542. Seismicity around the volcano remained low.
Information Contacts: JMA; S. Nakada, Kyushu Univ.
Dome 11 extruded; endogenous dome growth deforms old crater rim
Dome 10 continued exogenous growth on the top of the dome complex until mid-March when its NE half began collapsing, generating relatively large pyroclastic flows that traveled 4 km E into Kitakamikoba, an evacuated area, (9 March) and 3.5 km E (12 and 16 March). A 17 March overflight revealed a new lava dome, number 11, growing on the resulting collapse-cliff on the E slope of dome 10 (figure 52). From late March through early April, endogenous growth of the dome complex and exogenous growth of dome 11 occurred simultaneously. Despite frequent collapses, dome 11 was 200 m long, 150 m wide, and 70 m thick by mid-April, and dome 10 reached 1,440 m elevation, 80 m above Mt. Fugen, Unzen's previous summit peak. The endogenous growth resulted in cracks radiating out from the epicentral location of the magma supply vent on dome 10. The estimated magma supply rate increased . . . to 1-3 x 10⁵ m3/day during mid-March to mid-April.
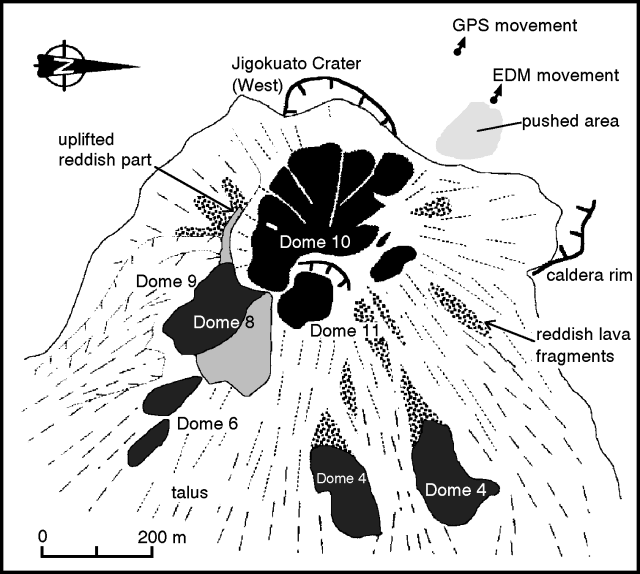 |
Figure 52. Sketch map of Unzen lava-dome complex on 2 April 1993. Note that N is to the right. Dome 11 began growing on a collapse-cliff of dome 10. EDM and GPS stations on the old crater wall NW of the dome complex (upper right) have moved as much as 2 m NW as a result of endogenous dome growth. Courtesy of S. Nakada. |
A portion of the NW crater wall was moved out from the dome complex as a result of the endogenous growth (figures 52 and 53). EDM measurements by the GSJ and GPS measurements by SEVO showed up to 2 m of NW movement at a point roughly 150 m NW of the dome complex. The affected area of the crater wall had many small, steaming cracks trending towards dome 10, and small-scale pressure ridges had formed on its surface near the dome complex.
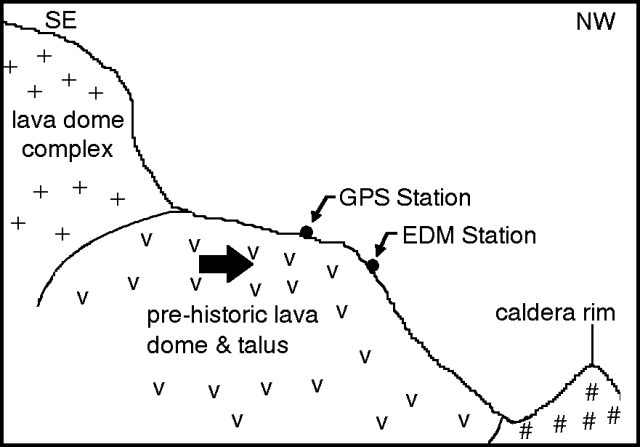 |
Figure 53. Cartoon representing a SE-NW cross-section of the "pushed area" on the NW side of the dome complex at Unzen. Endogenous growth of the lava-dome complex has pushed out the prehistoric lava dome and talus that formed a portion of the old crater rim (indicated by the large arrow). Courtesy of Setsuya Nakada. |
The frequency of pyroclastic flows generated by partial dome collapses gradually increased from 1 to 10/day in the first half of March. The frequency of flows had been low since mid-November, the longest lull of the current eruption (figure 54). The total of seismically recorded flows in March was 171, 4x that recorded in February. Collapses from domes 10 and 11 in late March to mid-April resulted in pyroclastic flows that typically traveled 1-3 km E and NE. The rate of pyroclastic flows remained at ~ 10/day.
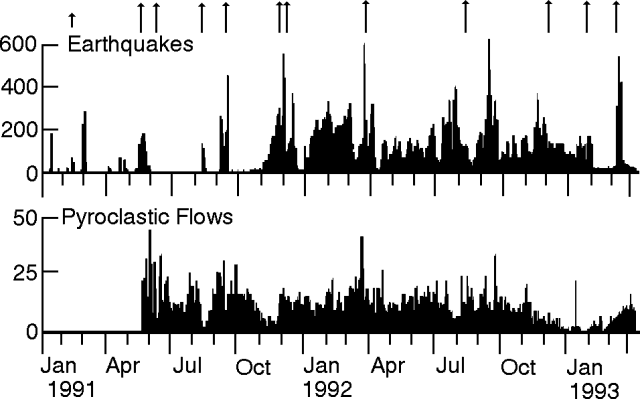 |
Figure 54. Daily count of earthquakes (top) and pyroclastic flows (bottom) at Unzen, 1 January 1991 to 15 April 1993. The 11 longer arrows at the top mark the onset of each of the domes; the short arrow indicates a phreatic eruption. Courtesy of JMA. |
The low seismicity of the dome complex since early February continued until an earthquake swarm slowly developed on 9 March (figure 54). After reaching a peak of 492 events on 14 March, activity declined to background by 17 March. The number of recorded earthquakes rose . . . to 2,985 in March.
As in previous months, a steam plume, occasionally containing ash, continued to rise a few hundred meters above the dome complex.
Information Contacts: JMA; S. Nakada, Kyushu Univ.
Pyroclastic flows increase in number; heavy rainfall produces large debris flows
The swelling of dome 10 and local deformation of the basement rocks N of the dome complex had stopped by mid-April. Large blocks of dome 10 that overhung to the W and N collapsed and scattered around Jigokuato crater, filling it and covering a part of the 1663 lava flow.
Exogenous growth of dome 11 continued. The volume of dome 11 remained constant, implying that the volume of magma supplied to the dome was equal to that lost because of collapses. By mid-May, dome 11 was 150 m long, 150 m wide, and 70 m high.
The seismic network recorded ~ 10 pyroclastic flows/day until 27 April. On 28 and 29 April (both rainy days), 39 and 26 pyroclastic flows were detected, respectively. These were the highest daily totals since 25 September 1992. The monthly total of flows was 352, twice that of March.
The pyroclastic flows, almost all generated by collapses of dome 11, descended mainly E into Mizunashi Valley, NE into Oshiga Valley, and only rarely SE (figure 55). Several flows traveled through Oshiga Valley and entered the Mizunashi River, and some flows entered a headwater of the Nakao River, the upper stream of the Senbongi district. The limit of the flow deposits has been moving slowly N. The longest flow of the month occurred at 1016 on 29 April, traveling 3.5 km E from the dome complex and having a seismic duration of 160 seconds. Ash clouds from the flows rose ~ 1 km above the dome complex, generally higher than those of the past 4 months. The highest cloud rose 1.3 km on 26 April. A pilot reported a very dense, dark-gray column rising to 900 m above the summit and drifting SSE at 1818 on 25 April. The pyroclastic flows caused no damage.
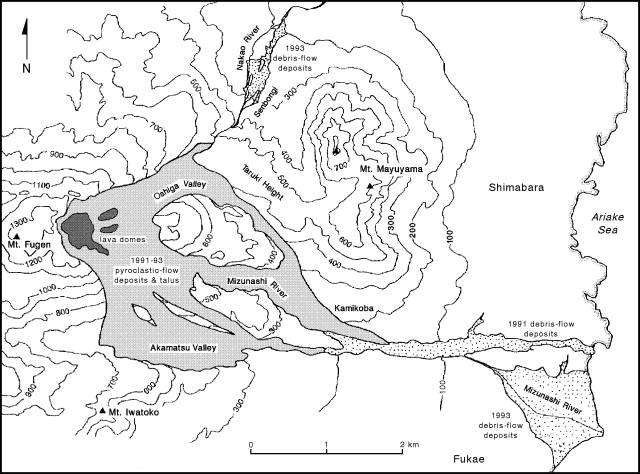 |
Figure 55. Map showing distribution of pyroclastic-flow and debris-flow deposits at Unzen, May 1993. Courtesy of S. Nakada. |
Heavy rainfall on 28-29 April and 2 May generated the largest debris flows of the current eruption, both along the Mizunashi and Nakao rivers. Flows traveled E across highways 57 and 251, and the Shimabara railway, damaging about 500 houses. Prior to the flows, ~ 7,000 people had been asked to evacuate, and no injuries were reported. People were able to return after the rains. The highways were reopened 4 May after the sediment was removed, but the railway remained buried as of mid-May. The Civil Engineer of Nagasaki Prefectural Government estimated the total volume of debris in the Mizunashi River to be > 106 m3.
The number of microearthquakes detected under the dome complex declined . . . to 656 in April. A weak swarm occurred 19-24 April when daily totals increased by a factor of 5. Seismicity near the volcano was low.
The Geographical Survey Institute estimated the total volume of magma erupted from May 1991 to early-March 1993 to be 0.13 km3, and the volume of the dome complex to be 0.05 km3 based on digital mapping data. Over 2,000 residents remain evacuated from Shimabara and Fukae.
Information Contacts: JMA; S. Nakada, Kyushu Univ; ICAO.
Exogenous growth of lava dome complex; pyroclastic flows destroy houses
Exogenous growth of lava dome 11 and frequent pyroclastic flows characterized the period from mid-April to mid-May. Dome 11 grew every day, covering parts of dome 4 (figure 56). When dome 11 was first observed, on 17 March, the surrounding topography was too steep for flowage of viscous lava. Instead, the growing dome collapsed repeatedly, eventually producing a gentle slope that the lava could flow down. Theodolite measurements revealed a 10-20 m subsidence of the vent site. In early June, dome 11 was ~ 360 m wide, 340 m long, and 30-80 m thick. This dome is now probably as large as dome 4, which reached a length of ~ 400 m, and was the largest dome of this eruption. Viscous lava flowed from the vent site to create a large ramp structure. Growth was continuing through mid-June. Volcanic tremor was almost absent during this period of continuous growth.
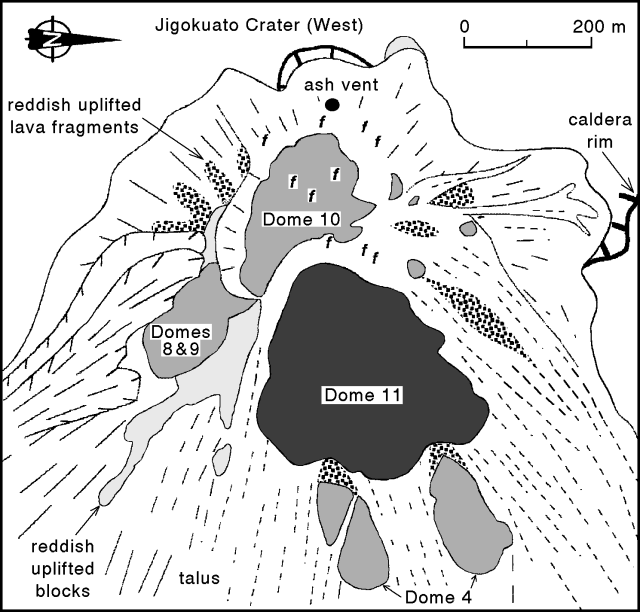 |
Figure 56. Sketch map of the lava dome complex at Unzen, early June 1993. Large solid dot is ash vent, "f" indicates fumarole locations. Note that N is to the right. Courtesy of Setsuya Nakada. |
Collapses from dome 11 generated pyroclastic flows NE down the Nakao River starting on 21 May. Five pyroclastic flows traveled about 3 km, reaching residential areas of Senbongi District 21-24 May. On the evening of 23 May, one pyroclastic flow stopped near the abandoned houses destroyed by the April-May debris flows after following the same course. There were 281 seismically detected pyroclastic flows in May . . . . The longest pyroclastic flow of May traveled 3.5 km E down the Mizunashi River and had a seismic duration of 150 seconds. Ash clouds from the pyroclastic flows rose about 1-2 km, generally higher than previous months. Pyroclastic surges associated with these debris flows extended only tens of meters beyond the river's edge. The volume of the pyroclastic flow was estimated to be ~ 2 x 10⁵ m3. It caused no damage.
Volcanic gas emissions continued from around dome 10 . . . . An ash-laden plume was emitted on 2 June from a re-opened vent in the crater (figure 56). Plumes had not been observed since February, when all of the former vents were covered by talus from dome 10. COSPEC measurements in mid-May by the Kusatsu-Shirane Volcano Observatory, Tokyo Institute of Technology, showed an SO2 flux of 100-300 t/d, with an average of 200 t/d. Values in December and February were < 100 t/d; the maximum since 1990 was about 350 t/d.
SiO2 content of the dome 11 lavas is ~ 64.0-64.5 wt. %, close to the values for the 1991 to mid-1992 lavas (64.5-65.5%). Lava erupted from late 1992 to early 1993 was significantly less silicic (down to 63.5% SiO2). The magma-supply rate for the period mid-April to mid-May was ~ 1-2 x 10⁵ m3/day.
Seismicity at the dome complex was above normal 14-28 May, but was not correlated with any significant changes in dome features. Based on locations of the events, the increase may have been caused by the northward growth of dome 11. A total of 3,037 microearthquakes was recorded in May, a large increase from 656 in April.
The mayor of Shimabara enlarged the evacuated area 24 May because of the pyroclastic-flow activity, increasing the number of evacuees from 2,008 to 2,336. This number was reduced on 26 May to 2,132 when areas along the Mizunashi River 5 km E of the dome complex were reoccupied.
Similar activity continued through mid-June. Debris flows triggered by heavy rainfall buried roads on 2 and 13 June, causing temporary evacuation of ~ 5,000 residents. There were 25 pyroclastic flows counted on 13 June, the largest daily total since 29 April. Press reports indicate that early on 23 June, two pyroclastic flows traveled ~ 4.5 km down the Nakao River, destroying an estimated 50 buildings and killing one man.
Information Contacts: JMA; S. Nakada, Kyushu Univ; AP.
Pyroclastic flows destroy houses; one person killed; dome growth continues
Exogenous growth of lava dome 11 continued from mid-June to mid-July, with relatively large-scale collapses resulting in pyroclastic flows in late June that burned houses and killed one man. Dome 11 has grown to 600 m long, 500 m wide, and 500 m high, and has overridden both parts of dome 4, which had been pushed and separated during endogenous growth in early 1992. This is now the longest dome since 1991, with an estimated volume of 8 x 10⁶ m3. Such enlargement may have been possible because the dome 4 remnants provided support and prevented major collapses.
Heavy rainfall caused large debris flows along the Nakao and Mizunashi rivers on 2, 12-13, 18-19, and 22 June. Temporary evacuation recommendations were issued to 5,000-9,000 residents along those rivers. The largest debris flow (18 June) destroyed a large concrete bridge over the Mizunashi River, burying many roads and damaging 207 houses. Debris flows damaged 391 houses in June and the first half of July, bringing the total to 1,326 since May 1991 (table 12). The rainy season is expected to be over by the end of July.
Table 12. Summary of damage from debris flows and pyroclastic flows at Unzen, 15 May 1991-15 July 1993. Courtesy of JMA.
| Date | Activity Type | Direction | Damage |
| 15 May 1991 | Debris flow | -- | 1 house damaged. |
| 03 Jun 1991 | Pyroclastic flow | E | 43 people killed; 179 houses burned. |
| 08 Jun 1991 | Pyroclastic flow | E | 207 houses burned. |
| 30 Jun 1991 | Debris flow | -- | 202 houses damaged. |
| 15 Sep 1991 | Pyroclastic flow | E | 218 houses burned. |
| 08 Aug 1992 | Pyroclastic flow | E | 17 houses burned. |
| 08-15 Aug 1992 | Debris flow | -- | 244 houses damaged. |
| 28 Apr-2 May 1993 | Debris flow | -- | 488 houses damaged. |
| 12-23 Jun 1993 | Debris flow | -- | 366 houses damaged. |
| 23-24 Jun 1993 | Pyroclastic flow | NE | 1 person killed; 187 houses burned. |
| 04-05 Jul 1993 | Debris flow | -- | 25 houses damaged. |
The S part of dome 11 began to collapse on 21 June (table 13), and the N side on 23 June. The pyroclastic flows descended 4.5 km E along the Mizunashi River and 4.0 km NE along the Nakao River. Large pyroclastic flows that descended the Mizunashi River at 0421 on 21 June, and at 0503 the next day, removed ~ 500,000 m3 of material but caused no damage.
Table 13. Larger pyroclastic flows at Unzen, June 1993. Courtesy of JMA.
| Date | Time | Seismic Duration (seconds) | Direction | Length (km) | Damage |
| 21 Jun 1993 | 0421 | 200 | E | >3 | -- |
| 22 Jun 1993 | 0503 | 200 | E | >3 | -- |
| 22 Jun 1993 | 1607 | 150 | -- | -- | -- |
| 23 Jun 1993 | 0252 | 230 | NE | 4 | Houses burned |
| 23 Jun 1993 | 1114 | 130 | NE | 4 | 1 man killed, houses burned |
| 23 Jun 1993 | 1359 | 140 | NE | 4 | -- |
| 23 Jun 1993 | 1437 | 120 | -- | -- | -- |
| 24 Jun 1993 | 0525 | 180 | NE | 4 | Houses burned |
| 25 Jun 1993 | 0213 | 130 | E | >3 | -- |
| 26 Jun 1993 | 0115 | 160 | E | 5.2 | Crossed Route 57 |
Pyroclastic flows at 0252 and 1114 on 23 June were accompanied by pyroclastic surges that exited a narrow gorge of the Nakao River and swept ~ 1 km into the residential Senbongi district of Shimabara City. Houses were damaged and burned, and trees were toppled. The area had been evacuated since August 1991, and the restricted zone was enlarged on 24 May. Most of the block-and-ash deposits were near the exit from the river. Three people entered the evacuated area after the first pyroclastic flow to watch their houses burn; one man was killed by the second pyroclastic flow. This was the first death at Unzen since 43 people were killed by a pyroclastic flow on 3 June 1991. Additional pyroclastic flows at 0525 on 24 June traveled 4 km down the Nakao River and were observed by S. Nakada from a helicopter. The pyroclastic flow, moving against the wind, included pyroclastic ground surges with powerful brown clouds that changed to white soon after they stopped moving. When the clouds blew away, it was revealed that houses enveloped by the clouds were burning. These three pyroclastic flows of 23-24 June burned a total of 187 houses.
By 24 June, an estimated 1.5 x 10⁶ m3 of material had been removed from the S side of dome 11, and 2.0 x 10⁶ m3 from the N side, leaving horseshoe-shaped collapse craters on each side of dome 11 and remnants of dome 4. Another pyroclastic flow at 0115 on 26 June traveled 5.2 km along the Mizunashi River, crossed a road (closed at night), and extended beyond the evacuated zone to within ~ 2.5 km of the beach. Field inspections by local authorities showed that the temperatures at the front of the block-and-ash flow deposits were not high enough to melt vinyl ropes along the road or burn nearby houses.
Seismicity at the dome complex remained unchanged before and during the pyroclastic flows. There were 295 seismically detected pyroclastic flows in June . . . . A total of 506 microearthquakes was recorded at the lava-dome complex in June, greatly reduced from the 3,037 recorded in May.
Evacuated areas along the Nakao and Mizunashi Rivers were enlarged between 24 June and 6 July because of the pyroclastic-flow activity, increasing the number of evacuees to 3,614.
Information Contacts: JMA; S. Nakada, Kyushu Univ.
Exogenous dome growth continues; increased seismicity
Exogenous growth at dome 11 . . . continued through early August (figure 57). Partial collapses generated about 10 pyroclastic flows/day to the E and NE, leaving a relatively stable part of dome 11 over the remnants of dome 4. No damage was caused by pyroclastic flows in July. Ash-laden plumes from the former Jigokuato crater, rising as high as 1 km, have frequently been observed since mid-July. Volcanic tremor at the summit area increased after 22 July, but no surface changes have been observed.
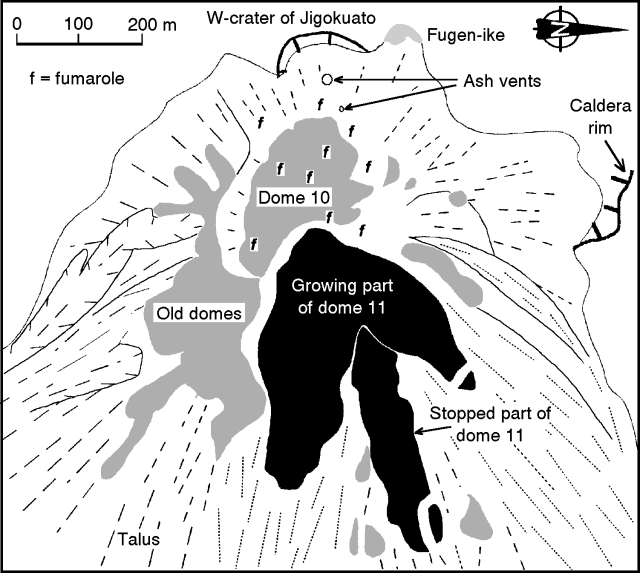 |
Figure 57. Sketch map of the lava dome complex at Unzen, early August 1993. Note that N is to the right. Courtesy of S. Nakada. |
During growth of dome 11, the E part was pushed outward and has collapsed frequently. A ramp structure formed, and lavas were successively overridden by later flows, like dominoes. The thickness of dome 11 decreased toward the front and lengthened, maintaining the ramp structure. This implies that stretching and sliding along the basal plane are the main reasons for the lengthening of the dome. The E arm of the dome was 400 m long, 150 m wide, and 50 m thick by the end of July, and had grown to 500 m in length by 7 August. Geologists estimated a growth rate of ~200,000 m3/day, with the eruption rate close to 250,000 m3/day.
On 19 July, 32 seismically recorded pyroclastic flows moved E along the Mizunashi Valley, the largest daily count in the month. The series began at 0354 and continued until midnight, including larger flows with seismic durations of 130 seconds at 0415 and 0428, 150 seconds at 0405 and 1131, and 170 seconds at 1700. The largest pyroclastic flow of the series occurred at 1821, with a duration of 190 seconds, and traveled 5.3 km E, crossing Route 57 (figure 58). The road was closed in late June after another pyroclastic flow crossed it. The front of the pyroclastic flow extended 100 m beyond the road, which is the farthest distance a pyroclastic flow has traveled from the active crater during the current period of activity. The longest pyroclastic flows, from W of dome 11, traveled 5.5 km on 8 June and 15 September 1991. There were a total of 353 seismically detected pyroclastic flows in July . . . . The number of evacuees from Shimabara and Fukae has remained unchanged at 3,617 since early July.
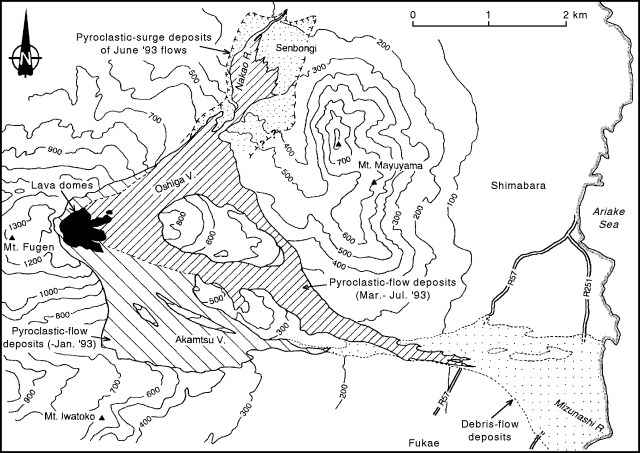 |
Figure 58. Map showing distribution of pyroclastic-flow and debris-flow deposits at Unzen from 1991 through early August 1993. Courtesy of S. Nakada. |
The frontal part of the 19 July pyroclastic-flow deposit was as narrow as a few tens of meters, and as long as 1 km (figure 58). Deposits were distributed along a narrow gully within older pyroclastic-flow and debris-flow deposits. A video taken of the 19 July pyroclastic flow showed that the front lobes of the growing ash cloud protruded intermittently from the main mass of the ash cloud for the last 1 km. Ground vibrations, usually recorded by seismometers during movement of block-and-ash flows, had stopped before this event. Deposits at the front of this flow were deficient in large lava blocks, which are common 2 km closer to the source, indicating that these may be a type of pyroclastic-surge deposit.
Seismicity at the lava dome complex was unchanged before and during the pyroclastic-flow activity. Low seismicity at the dome complex, about 20 events/day, was followed by a burst of activity that began on 26 July and culminated with 2,604 events on 7 August, the highest daily count in the present period of volcanism. The previous high was 632 on 11 September 1992. Seismicity gradually declined through 11 August, but remained high at about 800 events/day. Aerial inspections on 3, 5, and 8 August showed no unusual changes on the surface of the dome complex, which continued growing at a rate of 2-3 x 10⁵ m3/day. A total of 1,034 microearthquakes was recorded in July, more than double the total of 506 in June.
Heavy rainfall during the rainy season has frequently caused debris flows along the Nakao and Mizunashi rivers. Debris flows on 4-5 July damaged 25 houses, and another 83 houses were damaged on 16-18 July. Debris flows during the current activity have damaged 1,409 houses. During periods of heavy rainfall, mayors of Shimabara and Fukae issued temporary evacuation orders to 5,000-9,000 residents along the rivers.
Information Contacts: JMA; S. Nakada, Kyushu Univ.
Lobe 11 continues exogenous growth; increasing seismicity
Starting with this report, terminology for lava domes at Unzen will be changed. The numbered "lava domes" will be called lobes, and the "lava dome complex" will be referred to as the lava dome.
Growth of the lava dome continued through early September. Lobe 11, which appeared in mid-March, grew to 640 m long, 200 m wide, and 50-100 m thick by the end of August, when it had an estimated volume of 6 x 10⁶ m3. This is the same approximate size reached before the large collapses in late June. Geologists estimate that the daily rate of dome growth was ~2-3 x 10⁵ m3, much higher than last December-January, but less than in 1991. The magma-supply vent, in the same location since March, now has ~100 m of lava above it, decreasing to several tens of meters to the E. As the lobe advanced, it covered the flanking talus slope formed by earlier collapse of the margins. By mid-September, the lobe had grown 100 m longer and 150 m wider, making it the largest lobe since May 1991. Older lobes reached a maximum length of ~400 m, which was surpassed by lobe 11 in June, when it attained 600 m in length. The growth pattern of lobe 11 is different than that observed for previous lobes. Growth of lobe 11 occurred as new slices of lava (several tens of meters thick) advanced over older slices. Movement of the frontal part (the lowest slice) was the slowest, while the newest, topmost slice moved the fastest. As a result of this pattern of growth, the slope at the front of the lobe became as steep as 45°. Each lava slice (20-30 m thick) consists of convex-downward layers as thin as several meters.
Partial collapses of lobe 11 generated about five pyroclastic flows/day to the E and NE, and have eroded both the sides and surface of the lobe. There were 134 seismically detected pyroclastic flows in August, compared to 353 in July (figure 59), none of which caused any damage. The longest flow of the month, detected at 1748 on 31 August, was caused by collapse of older lava blocks from dome 11 that had survived the June collapses. This pyroclastic flow was registered for 190 seconds on seismometers, and descended 3.5 km NE through the Oshiga Valley before entering the Mizunashi Valley and the Kita-kamikoba area; the ash cloud rose 2,500 m above the summit, the highest of the month. Since early March, several pyroclastic flows have followed the same route. Vents on the lava dome continuously emitted steam and ash to heights of 1 km (~2.5 km altitude), normal for the current eruption. Ash was present in about one-third of the emissions. Average cloud height from both pyroclastic flows and vent emissions has increased from earlier in the year (figure 60). The number of residents evacuated because of the threat of pyroclastic flows remained at 3,617, unchanged since early July.
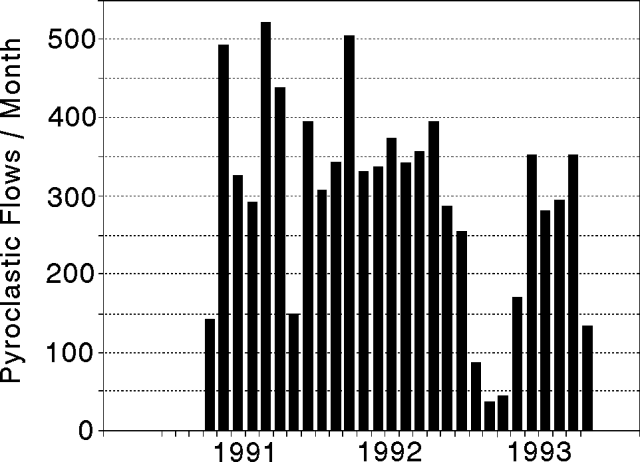 |
Figure 59. Monthly count of pyroclastic flows at Unzen, May 1991 to August 1993. Data courtesy of JMA. |
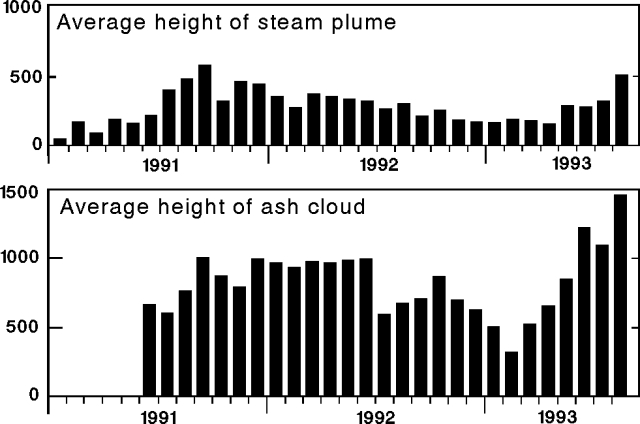 |
Figure 60. Monthly mean height at Unzen of the continuous steam plume from Jigokuato crater (top), and the ash cloud from pyroclastic flows (bottom), January 1991 to August 1993. Courtesy of JMA. |
The rainy season continued through August this year, with 772 mm of precipitation measured 3.5 km W of the summit, ~2-3x average. The rainfall total in July was 977 mm, after 1,165 mm of precipitation in June. The heavy rains since April have caused frequent debris flows along the Mizunashi and Nakao Rivers on the E flank of the volcano. Seismometers detected 13 debris flows in August. Most of these debris flows were small, but six houses were damaged on the 19th, bringing the total number of houses damaged to 1,415. Residents along the rivers have been issued temporary evacuation orders during periods of heavy rainfall.
Microearthquake activity at the lava dome complex began increasing on 26 July, peaking at 2,604 events on 7 August, the highest daily count since the current activity began. The previous high was 632 on 11 September 1992. By 17 August, activity had declined to the usual level of 10 events/day, and remained low through early September. Even so, a total of 12,946 microearthquakes was recorded in August, . . . the largest monthly count yet recorded (figure 61). The increased seismicity in July and early August caused no visible changes on the surface of the lava dome complex.
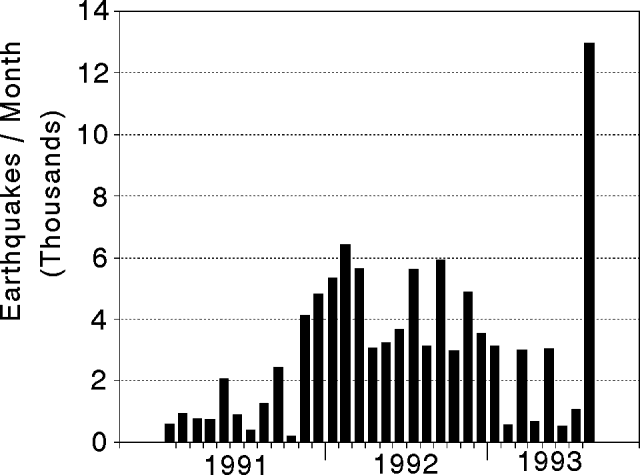 |
Figure 61. Monthly count of earthquakes at Unzen, January 1991 to August 1993. Data courtesy of JMA. |
Information Contacts: JMA; S. Nakada, Kyushu Univ.
Growth of lobe 11 generates pyroclastic flows; seismicity decreases
Exogenous growth of lobe 11 . . . continued through early October (figure 62). The dome reached an approximate length of 900 m and width of 700 m with a maximum height difference of ~450 m from the top of lobe 10 (1,420 m) and the lower edge of lobe 11 (970 m). The eruption rate during this period was 1-2 x 10⁵ m3/day.
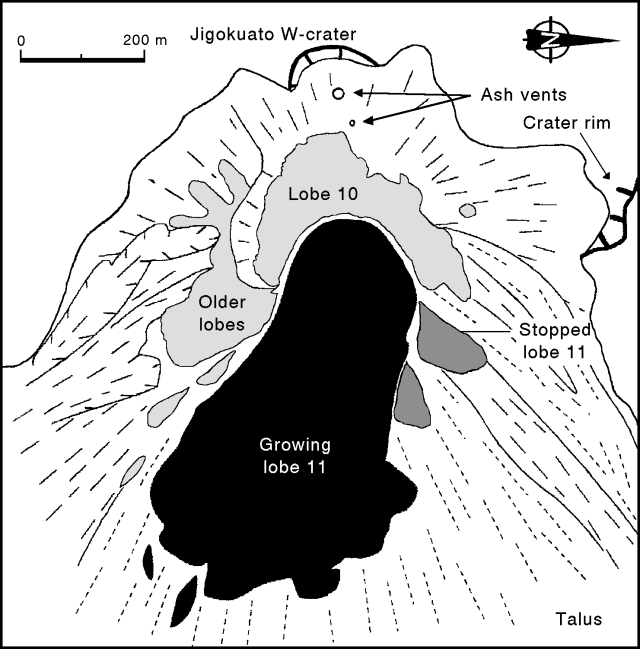 |
Figure 62. Sketch map of the lobes at Unzen, September 1993. Note that N is to the right. Courtesy of S. Nakada. |
Lobe 11 grew exogenously to the E, becoming ~800 m long and 400 m wide in mid-October and maintaining its ramp structure as it advanced forward. The frontal part of the lobe became steeper and the lava over the vent area gradually thickened. The front of the lobe was buried with its own collapsed material but still continued moving forward. The lobe widened as new lava was squeezed out along both sides, pushing older lava lobes around it and generating rockfalls and pyroclastic flows.
The monthly total of seismically counted pyroclastic flows was 138 in September, at similar levels to August (134). Growth at lobe 11 generated pyroclastic flows from partial collapses to the E and NE at a rate of about five events/day. However, no new property damage was caused by the flows. The largest flow of the month traveled 3 km NE in the Oshiga valley on 9 September with a seismic duration of 100 seconds. The highest ash cloud of the month, generated by a pyroclastic flow, rose 1,700 m above the summit on 16 September. Seismicity at the lava dome was relatively low in September with 1,032 small shocks recorded, significantly reduced from 12,946 in August. The number of residents evacuated . . . remained at 3,617, unchanged since early July.
Information Contacts: S. Nakada, Kyushu Univ; JMA.
Lava production and pyroclastic-flow activity decrease
Lava production decreased in October, although lobe 11 continued to grow both endogenously and exogenously. The lobe, growing to the ESE, was ~800 m long and 450 m wide in mid-November, slightly wider than in mid-October. A crude peel structure formed over the lobe-11 vent, and reddish lava blocks from lobe 10, close to the vent, were uplifted. Minor inflation around lobe 10 caused small-scale collapses to the W and SW, and slight tilting of large blocks towards the W. Pyroclastic flows to the N were generated by partial collapses of lobe 10.
The Geographical Survey Institute of Japan analyzed aerial photographs taken on 13 October. The analysis indicated that the volume of the lava dome was 90 x 106 m3 and the pyroclastic-flow deposits contained 80 x 106 m3 of material, for a total of 170 x 106 m3 erupted since the beginning of the current activity in May 1991. Over the 29 months of this eruption, the average eruption rate has been ~5.9 x 10⁶ m3/month, and the average rate of lava-dome growth has been ~2.7 x 10⁶ m3/month. The average daily eruption rate from 5 March to 13 October was 0.16 x 10⁶ m3/day. A rate of 0.10 x 10⁶ m3/day was reported by the same Institute for the period from late November 1992 to early March 1993. Daily eruption rates were lower than these averages during December 1992 to January 1993, and higher during February-April and July-August 1993. The average rate in late October had decreased to 0.05 x 10⁶ m3/day.
Partial collapses of lobe 11 generated 2-3 pyroclastic flows/day, mainly to the E and NE. There were 80 seismically counted pyroclastic flows in October, a decrease from the 138 detected in September. The longest pyroclastic flows traveled 2.5 km NE down the Oshiga and Nakao valleys on 1, 11, 16, 18, 20, and 27 October, with seismic durations of 100-140 seconds each. Some of the pyroclastic flows generated ash clouds as high as 1,200 m above the summit. The pyroclastic-surge deposits spread into a fan shape upon exiting the gorge, and extended several hundred meters beyond the block-and-ash flow deposits near the exit. Rockfalls and smaller pyroclastic flows to the E and SE were generated by partial collapses of lava from the vent area. No damage was caused by any of the pyroclastic flows. Seismicity at the lava dome remained at low levels with 1,101 small shocks, similar to September (1,032 events). The number of residents evacuated from the E slopes because of the threat of pyroclastic flows has remained unchanged at 3,617 since early July.
Information Contacts: JMA; S. Nakada, Kyushu Univ.
Only 32 pyroclastic flows, a seismic swarm, and remarkable dome inflation
For mid-November through the first week of December, dome building injections into lobe 11 mainly produced inflation, with no new material ejected to the lobe's surface. This purely inflationary (endogenous) dome growth contrasts with the pattern of exogenous growth typically seen at Unzen in earlier months. As a consequence, the measured inflation on the SW side of Jigoku-ato crater was the largest since May 1991. The previous vent area on lobe 11 underwent inflation, but elsewhere the dome surface changed little in form (figure 63).
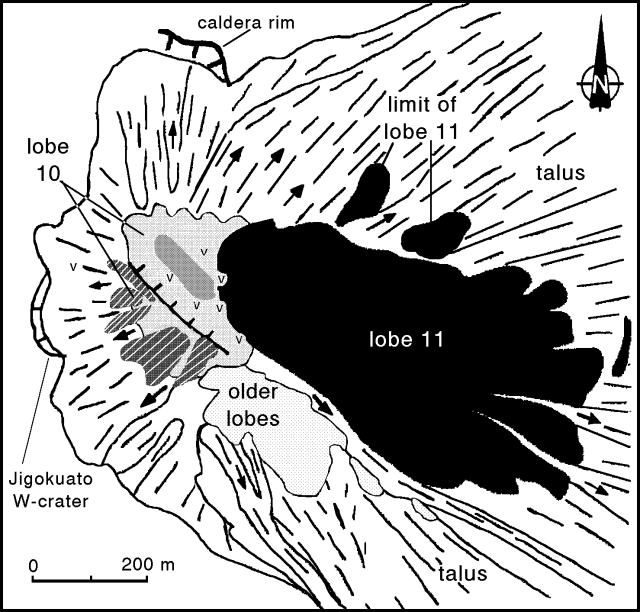 |
Figure 63. Sketch map of Unzen's crater and lobes in early December 1993. Arrows indicate the main direction of rockfalls, "v" indicates gas vents. Lobe 10 is partly decorated by shading patterns that depict uplifted lava fragments (lighter), and uplifted lava fragments of reddish color (darker). Courtesy of Setsuya Nakada. |
In early- to mid-November inflation extended to an area on the W flanks of lobe 11 and also migrated to the northern portions of lobe 10 (figure 63). The SW limit of uplifted area on lobe 10 was confined by a normal fault (indicated by a hachured line). The SW portion of lobe 10 generated rockfalls, and small pyroclastic flows, and in this area radial cracks underwent extension. The N side of the uplifted area produced frequent rockfalls. The uplifted area has become the dominant zone for gas vents ("v", figure 63); earlier vents now lie covered and sealed beneath fresh talus deposits. An infrared camera survey was made by SEVO. They found the highest temperatures in the reddish uplifted lava blocks to the W of lobe 11.
Inflation caused the W sides of lobes 10 and 11 to exhibit remarkable structural changes: normal faults and simple cracks without previous noteworthy displacement opened as much as 1 m. These structural changes may have been somewhat local as they were not found on the NW portion of the dome. However, a GPS survey detected dome motion on the NW. Dome motion was larger on the W, and largest on the SW where it was estimated to be 50 cm/day. At latest report, the SW dome motion continued at the same rate from late November through mid-December, but the motion on the other flanks appears to have stopped.
Field inspection SW of the dome by the SEVO found multiple small-scale reverse faults in thick deposits of ash. These faults were of low angle and associated with pressure ridges, implying compression from the dome. Similar features were recognized this past April, located to the NW of the dome.
The present dome deformation was apparently not translated to the larger edifice; tiltmeters 5 km from the dome show angular stability. The present dome deformation episode is the third since lava extrusion began in May 1991. The first deformation began on 12 May 1991 and was followed by lava extrusion 8 days later. As of 13 December deformation continued, inferred to be centered beneath the dome.
Pyroclastic flows at Unzen are detected seismically. For 1993, they were most common in the interval from April-July (averaging 320 flows/month), and least common in November (32). They decreased in number presumably due to the comparatively static dome morphology. Traveling NE and E, the flows reached ~2.5 km in length. They were basically similar to those in October, although the heights of associated ash clouds may have been lower. The flows caused no damage, however, their potential hazard resulted in additional residents being evacuated in July 1993, bringing the total to 3,617.
Seismicity began to increase on 19 November, when 77 microearthquakes were recorded, up from an average of 20 events/day earlier in the month. The seismicity gradually increased to 400 events/day toward the end of the month (figure 64). By 13 December earthquakes rose to the level of a major swarm with 1,500 events/day. (Figure 64 does not show the December seismic data.) The monthly total rose from 1,101 events in October to 2,662 events in November. During November through mid-December typical earthquakes were dominantly composed of high-frequency signals. In contrast, past swarms within and beneath the dome were dominantly composed of low-frequency signals.
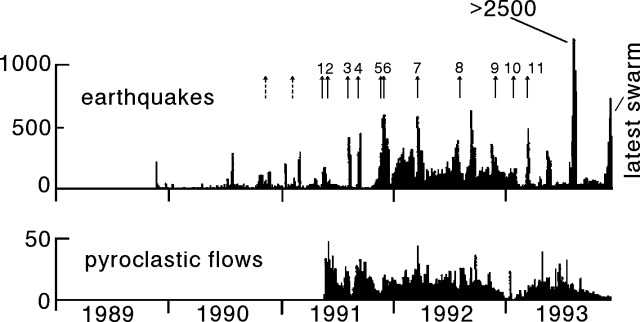 |
Figure 64. Earthquakes and seismically detected pyroclastic flows at Unzen for the interval 1 January 1989 through 6 December 1993; each bar represents the sum for 4 days. Dashed arrows indicate phreatic explosions, and solid arrows indicate the onset of dome extrusion events numbered 1 to 11. Courtesy of JMA. |
Information Contacts: JMA; S. Nakada, Kyushu Univ.
Continued ground deformation and seismicity; fewer pyroclastic flows
Strong endogenous growth started in mid-December in the SW part of the lava dome (figure 65). The N half of lobe 10, which uplifted during November, subsided about 30 m in early December at the same time that swelling on the SW part of the dome began. Faults, cracks, and pressure ridges were observed on the WSW floor around the dome during strong endogenous growth, similar to those observed during lava-dome growth at Mount St. Helens. These deformation phenomena were all a result of pressure from the dome. This type of surface deformation was previously observed in May 1991 when lava first appeared, and in March and April 1993 during partly endogenous growth. Lobe 11, covering the top and E slope of the dome, moved little during December and early January, implying that there was no magma-supply into the lobe.
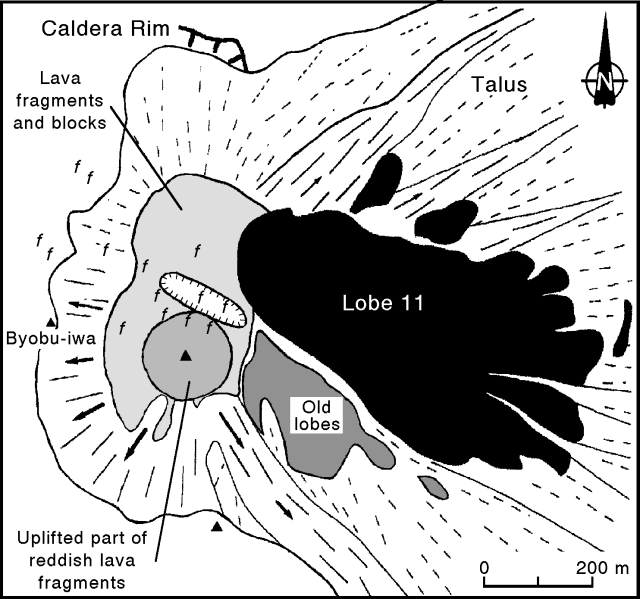 |
Figure 65. Sketch map of the lava dome at Unzen, early January 1994. Arrows indicate the main direction of rockfalls, "f" indicates fumarole locations, and the hachured line indicates a depression. The remains of lobe 10 consist of lava fragments and blocks just W of lobe 11. Courtesy of S. Nakada. |
The volume of lava added from beneath during mid-December to early January was estimated to be ~9 x 10⁶ m3, based on results of theodolite and laser-distance measurements. The endogenous eruption rate reached ~0.3 x 10⁶ m3/day in mid-December, and remained at that level until early January when it decreased to ~0.1 x 10⁶ m3/day. Earthquakes as large as M 3 occurred when the eruption rate was high. The SW talus slope of the dome rapidly advanced outward by about 150 m. Talus has now covered the western Jigokuato crater.
Rockfalls frequently traveled W and SW from the growing part of the dome (figure 65). The talus and pyroclastic-flow deposits covered much of the SW floor, and pyroclastic flows threatened to cascade down the S slope of Mt. Fugen. A small shrine situated on the rim of western Jigokuato crater, near a steep cliff of the prehistoric Byobu-iwa lava dome, was deeply buried under large lava blocks. The shrine had already been broken and half-buried by bombs and ash in 1991. Few pyroclastic flows were generated by collapse from the lava dome in December. Large earthquakes caused collapses on the SW side of the dome, generating a few small pyroclastic flows to the SW. No collapses took place from the E side of the dome, the dominant area of collapse until October.
Seismicity beneath the lava dome began on 19 November. A significant increase in the number of microearthquakes occurred in December, exceeding 1,000/day by mid-month. The magnitude of the earthquakes also gradually increased after 10 December. After 15 December, some of the larger earthquakes (M 2-3) were felt at the UWS, 4 km SW. The total number of earthquakes in December was 25,340, including 170 felt events. This is almost double the previous high monthly total during this eruption (12,946 events in August 1993), and represents almost half of the earthquakes recorded in all of 1993 (54,988). As of 5 January, there had been 27 felt earthquakes in 1994.
The ground deformation that began in early November continued through December. EDM measurements SW of the dome taken by the GSJ revealed 50 m of horizontal displacement to the SW between early November and late December, at a rate ~1 m/day. Upward displacement during this period was 17 m at a point near the dome. Theodolite measurements indicated that the lava dome gradually grew >100 m to the SW. Ground deformation and larger earthquakes had both ceased by 5 January.
Information Contacts: JMA; S. Nakada, Kyushu Univ.
New lava lobe is extruded; seismicity decreases
Microearthquakes beneath the lava dome, which increased in mid-December, suddenly decreased to 20-50/day after 6 January 1994. The ground deformation that began in early November ceased in early January, based on EDM measurements by the Geological Survey of Japan, at the same time that seismicity decreased. A new lobe (lobe 12) appeared in a graben at the top of the dome on 15 January (figure 66). The peak of the lobe, where lava was extruding, was at 1,420 m elevation. During endogenous growth the graben deepened and lobe 12 swelled to the SW, allowing lava extrusion from the base. The new lobe grew at a rate of ~0.1 x 10⁶ m3/day during the first week, reaching dimensions of ~140 m long, 110 m wide, and 30 m high. The lobe was composed of lava blocks, reflecting the low eruption rate. Lava samples of lobe 12 have SiO2 contents of about 64 wt.%, almost the same as previous lobes.
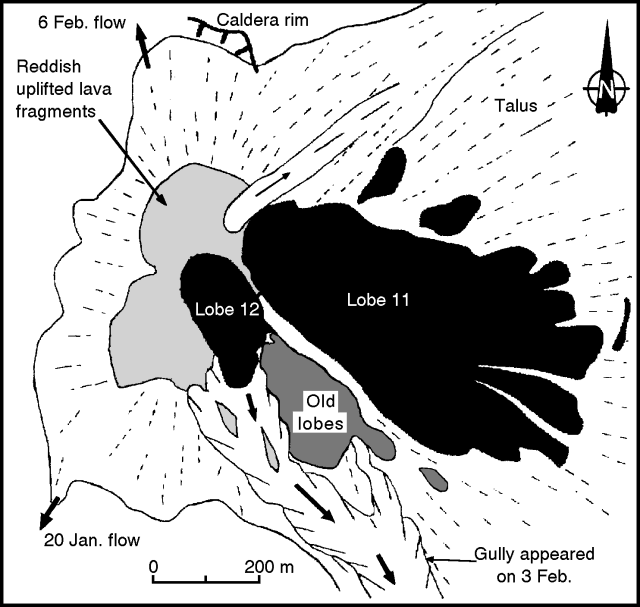 |
Figure 66. Sketch map of the lava dome at Unzen, early February 1994. Arrows indicate the main direction of pyroclastic flows and rockfalls from mid-January to mid-February. Courtesy of Setsuya Nakada. |
A pyroclastic flow on 20 January traveled 1.5 km SW, reaching the small Akamatsu valley. The pyroclastic flow was due to partial collapse of both lava blocks S of lobe 12 and talus deposits from previous collapses that had filled the crater floor S of the dome. The flow descended a gully, incorporating prehistoric deposits from the gully walls. The gully had developed during rainy seasons since the start of the 1991 eruption, and was the source for debris-flow material. The pyroclastic flow burned trees in the valley and produced ashfall a few kilometers away from the dome. Tremor caused by this event lasted 910 seconds, much longer than most previous pyroclastic flows. This long tremor duration is thought to have been caused by successive small-scale collapses from the dome. The estimated volume of the pyroclastic-flow deposits is several hundred thousand cubic meters.
Collapses generated a total of 75 pyroclastic flows in January, the most since October 1993. The flows eroded deeply into the basement rocks (pyroclastic-flow deposits of ~4 Ka) on the SE margin of the talus apron. A pyroclastic flow on 31 January, from lobe 12, traveled 2.5 km SE, the longest distance in January. Fresh, gray-colored lava from lobe 12 appeared within the horseshoe-shaped crater formed by the collapses. By 3 February, the total volume of lobe 12 and adjacent talus that had collapsed was ~1 x 10⁶ m3. Rockfalls occurred mainly to the NW.
Pyroclastic flows on 3 February traveled about 3.5 km from their source. A field inspection the next day showed that the resulting deposits contained larger amounts of cooled oxidized blocks and mud-coated blocks, derived from older lobes and prehistoric basement deposits, respectively. The amount of juvenile materials in these deposits (fresh, hot blocks and fragments) was as low as 10%. On 6 February, pyroclastic flows descended NNW beyond the notch of the caldera rim, from which andesitic lava flowed N in 1663. Previously, talus and pyroclastic-flows that moved N had remained within the caldera.
The growth rate of lobe 12 declined to3/day in early February, and no fresh lava appeared on the lobe surface. Endogenous growth then started; upward swelling produced NW-SE trending cracks on the surface of the lobe. The entire lava dome also started to expand NW at a rate of ~1 m/day in early February. Field inspection by staff of the SEVO showed pressure ridges and low-angle reverse faults in the NW crater floor near the dome, implying pressure from the dome. These phenomena resembled those during the endogenous events of March-April and November-December 1993.
The monthly total of microearthquakes in January was 1,863, a significant decrease from December (25,340) and November (2,662) (18:11-12). There have not been any earthquakes felt at the UWS in early February. Only 27 earthquakes were felt in January, compared to 170 in December (18:12).
Information Contacts: JMA; S. Nakada, Kyushu Univ.
Fewer pyroclastic flows; deformation on the N flank
The new lobe (##12) that appeared in mid-January (19:01) began endogenous growth in early February. The lava supply rate from early February to early March was several tens of thousands of m3/day. A spine-like cone that appeared just W of lobe 12 in early February moved 3 m/day to the NW and grew 1.5 m higher each day. By early March the cone was about 200 m across and 80 m high. The elevation of this cone reached 1,485 m, 235 m above the crater floor around the dome. During growth of the cone, the lava dome was swelling to the NW; lava blocks on the N talus slope moved 1.2 m/day.
Due to swelling of the dome, rockfalls went primarily to the NNW, advancing the foot of the talus slope 50 m since the beginning of the year. The crater floor around the NW side of the dome underwent strong deformation, due to pressure from the growing cone; thrusts, pressure ridges, and open cracks developed. The degree of deformation decreased with distance from the dome, and extended about 200 m from the talus front. The thrusts and pressure ridges developed sub-parallel to the talus front. Thrusted slabs were up to 100 m long and 50 m wide. Small-scale grabens (~10 m wide) and collapse holes (a few meters across) appeared in areas with a high density of open cracks. Both grabens and open cracks were roughly oriented towards the cone.
A GPS survey by the SEVO showed that five observation points on the floor of the dome moved away from the cone. The greatest movement was recorded at a point in the E-most block of the deformed area. This fast-moving block (200 m wide by 300 m long), bounded by lateral and reverse faults, had moved N at a speed of 50-70 cm/day since late January. Displacements along the faults increased over time until they could easily be recognized from the ground and from a helicopter.
Crest line measurements determined by theodolite from the UWS documented deformation on the W side of the dome (figure 67). Between 10 February and 6 March the lava dome was uplifted by ~50 m. Vertical growth was continuing at a rate of 1-2 m/day as of mid-March. An EDM survey by the GSJ revealed 20 m of shortening on the N flank at a rate of 50 cm/day in February and 80 cm/day in early March.
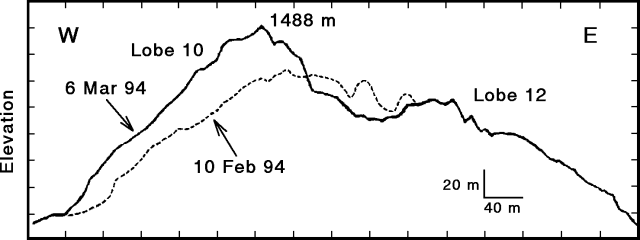 |
Figure 67. Profile of the Unzen lava dome on 10 February and 6 March determined by theodolite measurements from ~2 km SSW of the dome. Courtesy of JMA. |
Pyroclastic flows generated by lava-dome collapses on 2-3 February traveled 3-3.5 km SE, reaching the small town of Fukae-cho. On 6 February another pyroclastic flow went 500 m to the N. If lava extrusion and ground deformation continue, pyroclastic flows caused by collapse of part of the lava dome could travel >4 km down the N flank. The number of pyroclastic flows gradually decreased after 6 February; none were detected 11-27 February. Seismicity during the first three weeks of February consisted of 40-50 microearthquakes/day. Seismic activity gradually increased to >100 events on the 23rd. Pyroclastic flows in February totaled 80, and there were 1,726 microearthquakes recorded. These values are similar to January.
Information Contacts: JMA; S. Nakada, Kyushu Univ.
Endogenous growth of lava dome; seismicity increases
Endogenous growth of the lava dome continued in March, with no new lava extrusion since late January. The eruption rate has remained at ~50,000 m3/day. Dome growth was toward the N, NW, and W; other parts of the dome remained stable. The spine-like cone that appeared near lobe 12 in February reached an elevation of 1,490 m by early April, 240 m above the crater floor. This cone moved NW in March and W in early April, settling just above the former Jigokuato Crater, from which the first lobe emerged in May 1991. The migrating cone created a depression 20-30 m deep behind it to the E, which was emitting volcanic gas (figure 68). The growing cone consisted of a massive-lava core surrounded by crumbled breccia. The core was composed of older brown lava that had solidified within the dome. Crest line measurements determined by theodolite from the UWS showed that the W part of the dome continued to uplift and move W at a rate of 2-3 m/day. As of 9 April, the peak had move ~80 m W and risen ~ 5-10 m from its location on 6 March.
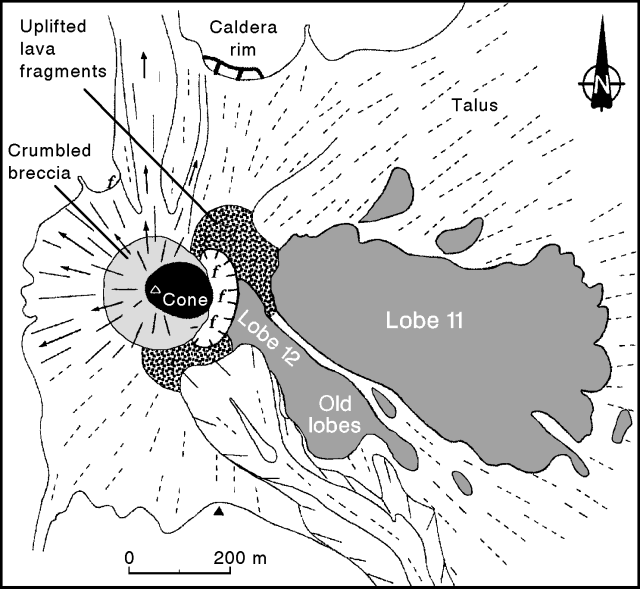 |
Figure 68. Sketch map of the lava dome at Unzen, early April 1994. Arrows indicate the main direction of pyroclastic flows and rockfalls. Solid and dashed lines represent slope dip directions of new and old talus deposits, respectively. Volcanic gas emission points are shown by "f" symbols. Courtesy of S. Nakada. |
Only 10 pyroclastic flows occurred in March, the lowest monthly total since they began in 1991. Some pyroclastic flows generated on 19 March by collapse of part of the dome traveled 1.5 km NNW. Residents living about 4 km from the summit in this direction are not staying in their homes at night. These flows went N because the caldera floor in that direction has now been completely filled by talus. Pyroclastic-flow deposits were
Rockfalls mainly went in the direction of the moving cone, advancing the talus front NW and W at a rate of 2-3 m/day. There is now a thick cover of talus on the Byobu-iwa craters, from which phreatic eruptions took place in February-May 1991. Rockfalls also forced seismic and GPS stations of the SEVO to repeatedly move farther away. Many mirrors installed for EDM measurements near the dome by the GSJ have been destroyed.
Strong deformation extended NW and W of the dome for 50-100 m away from the talus front. The ground had a wavy surface and had been uplifted as high as a few tens of meters. Many open cracks, up to 1 m wide, were radially oriented towards the growing cone; smaller cracks had various orientations. This ground deformation, which began in late January, had ceased by the end of March. EDM measurements revealed that the distance between a point immediately below the dome and a point on the N flank had shortened by about 30 m during February and March.
Microearthquakes increased to a total of 5,110 in March, compared to 1,726 in February. After 20 March, > 200 events/day were recorded.
Information Contacts: JMA; S. Nakada, Kyushu Univ.
High seismicity but few pyroclastic flows; continued dome deformation
At Unzen the output of lava remained about the same as in previous months, yet the edifice first inflated then deflated, the direction of dome growth reversed, and the paths of pyroclastic flows changed. Recently, seismicity remained high while the number of seismically detected pyroclastic flows remained unusually low (figure 69).
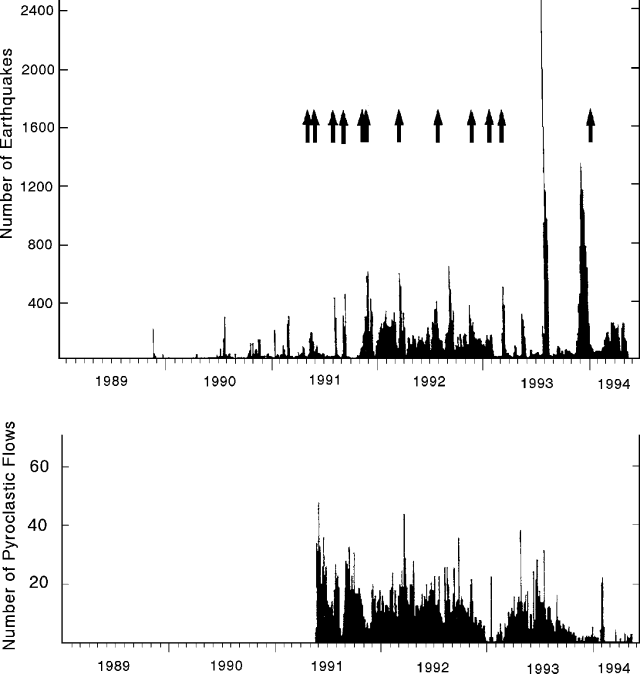 |
Figure 69. (Top) Plot of earthquakes at Unzen versus time; arrows indicate first appearance of lobes 1-12 of the summit dome complex. (Bottom) Plot of pyroclastic flows versus time. Time interval covered is January 1989 through 15 May 1994. Courtesy of JMA. |
Dome growth shifted direction between late-April, when the dome continued to expand northward, and early-May, when it began to expand southward. The late-April growth involved both the upper surface of the dome (the carapace) and the adjacent talus; they both moved nearly horizontally toward the NNW at about 1-2 m/day. The later, southerly motion also reached a similar speed.
Crest-line measurements determined by theodolite from the UWS documented deformation on the W side of the dome (figure 70). These three sequential profiles of the lava dome illustrate the subhorizontal, westward movement of the W dome margin.
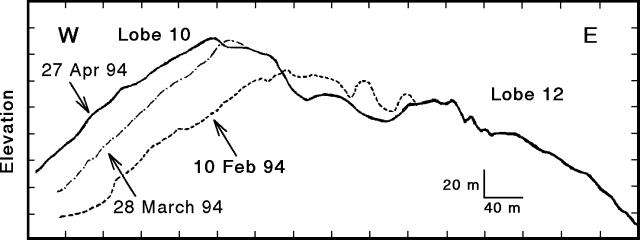 |
Figure 70. Profile of the Unzen lava dome determined by theodolite measurements from about 2 km SSW of the dome. Courtesy of JMA. |
In mid-May a split in the dome top formed an E-W trending graben: 200 m long, 50 m wide, and 20 m deep. The graben severed and offset the dome; the dome's S part moved S while the N part subsided. Rockfalls frequently bounded down the dome's upper slopes, chiefly from the unstable, advancing face of the dome. During the shift in growth direction there was neither high seismicity nor a break in the rate of eruption (which remained below ~50,000 m3/day).
A spiny cone sprouted in February 1994. It underwent rapid growth, reaching the top of the talus pile in early April (19:2-3). It subsequently began a day-by-day collapse.
EDM measurements by the GSJ recorded Unzen's inflation and deflation. On the S flank no clear pattern emerged. In contrast, the distance between sites on the dome floor (100-150 m NW of talus) and Unzen's NW flank indicated that the volcano inflated until 29 April, when it suddenly began deflating. Deflation continued until at least mid-May. This inflation followed by deflation took place a few days prior to the shift in the growth direction of the dome, suggesting a possible relationship.
During mid- to late-April pyroclastic flows were similar in number to March. Attributed to partial collapse of the N part of the dome, the flows frequently descended the N flank.
On 26 April several of these N-directed pyroclastic flows traveled a horizontal distance of 2.1 km from their source. For the distal 0.8 km of their path, these flows were guided by two valleys with widths of tens of meters. Observers inspected the resultant deposits the next day from a helicopter. The deposits contained large blocks only as far as the heads of the small valleys; these block-rich facies were associated with a zone of toppled trees that extended ahead of the deposits. Above the valleys, a seared zone extended 100-200 m beyond the deposits. In the valleys, the seared zone only continued several tens of meters beyond the deposits. The portions of the flows guided by valleys are thought to have behaved as pyroclastic surges, conveyed in a manner similar to that seen along the Mizunashi and Nakao rivers in June and July 1993. Since early February, N-directed pyroclastic flows have had an estimated maximum total volume of 1.2 million m3.
Although pyroclastic flows traveling N were also common in late-April, beginning in the evening of 2 May they ceased and flows began to travel SE instead. One such SE-directed flow, on 3 May, followed the Akamatsu Valley. Later, in mid-May, SW-directed pyroclastic flows became common. Rockfalls occurred in Unzen's southern quadrant but they failed to develop into pyroclastic flows because the prehistoric lava dome broke their descent. On 12 May pyroclastic flows cascaded for ~1 km, moving down the length of a large gully S of the volcano. They came to a halt at the lower end of the gully, having retraced a route not used since 20 January.
In April, a high number of microearthquakes occurred beneath the lava dome. A large number of earthquakes also took place in March (5,110) and April (4,606) (figure 69). Over 3,000 people have remained evacuated since the eruption and associated pyroclastic flows began 1991, an interval of more than 1,000 days.
Information Contacts: S. Nakada, Kyushu Univ; JMA.
Endogenous growth continues; seismicity declines
Endogenous dome growth to the W and NW . . . had ceased by the end of April. However, the dome began to grow in a SW direction in mid-May. This SW growth continued through at least mid-June at a rate of 1-2 m/day. EDM measurements taken by the GSJ revealed that a line on the N flank had shortened between January and April, implying that inflation of the entire mountain had ceased by the end of April, but the same line showed elongation in May.
Elevations of lava-dome peaks have steadily increased since the eruption began (figure 71). The highest peak in early June was 250 m above the level of the Jigokuato crater floor. Peaks were commonly formed just above the magma-supply vent during both exogenous and endogenous growth, but no lava extrusion has taken place above 1,420 m elevation.
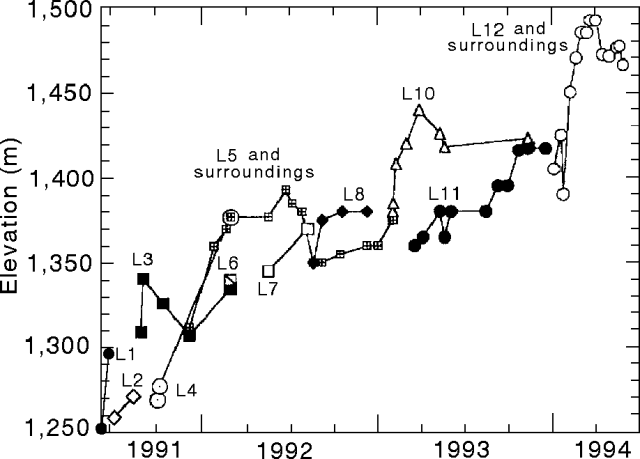 |
Figure 71. Elevation of lava-dome peaks at Unzen, 20 May 1991-June 1994. The highest peak as of June 1994 is lobe 12 (L12); base elevation shown (1,250 m) is for the Jigokuato crater. Different lobes are indicated by symbols and lobe numbers. All measurements were made using a theodolite and mirror-less laser distance meter by geologists from the Joint University Research Group. Courtesy of S. Nakada. |
A time plot of the eruption rate shows two pulses of magma during the current eruption (figure 72). The first pulse (May 1991-December 1992) was characterized mainly by exogenous growth. The second pulse (December 1992), which started with lobe 9, was dominated by exogenous growth early (first half of the pulse), but then changed to endogenous growth. The volume of magma erupted during the first pulse, 1.3 x 10⁸ m3, is roughly double that erupted during the second pulse (0.6 x 10⁸ m3). Total volume of the lava dome, based on analysis of aerial photos by the GSJ, was 90 x 106 m3 as of 9 April. The lava extrusion rate between 7 February and 9 April was 60,000 m3/day (figure 72). The eruption rate declined in May to3/day as determined by the Joint University Research Group. No fresh lava has been extruded onto the dome surface since February.
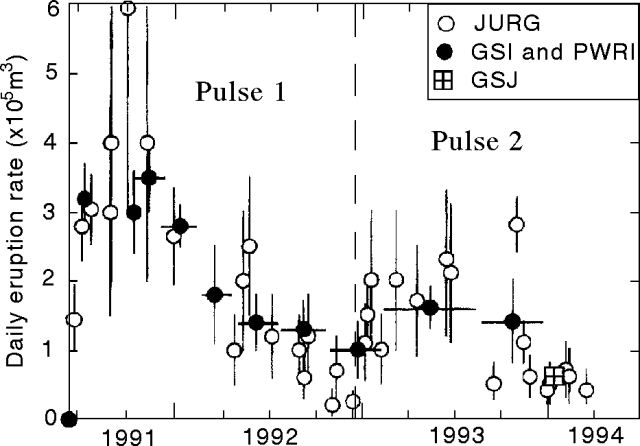 |
Figure 72. Daily eruption rate at Unzen, 20 May 1991-June 1994, showing two distinct pulses of magma-supply. Eruption rates were estimated by the Joint University Research Group (JURG) using photographs from daily helicopter inspections and theodolite surveys. Only aerial photographs were used by the Geographical Survey Institute (GSI), the Public Works Research Institute (PWRI), and the Geological Survey of Japan (GSJ) to calculate the volume change of eruption products. Courtesy of S. Nakada. |
Most pyroclastic flows traveled down the SW and SE flanks, only rarely did they descend N of the dome. The longest pyroclastic flow of the month went 2.5 km on 3 May. Pyroclastic flows are detected seismically at a station ~1 km WSW of the dome. Real-time monitoring of both the dome and pyroclastic flows is conducted from the Unzen Weather Station using four visible and thermal infrared video cameras. Microearthquakes beneath the dome averaged >100/day. The total of 3,171 earthquakes in May continues the decline in seismicity . . . .
The Coordination Committee for Prediction of Volcanic Eruption had a meeting on 3 June. A statement issued after the meeting noted that both the lava dome and the entire volcanic edifice were very unstable, and that pyroclastic flows generated by collapse of lava might occur despite the decline in lava extrusion. As of 31 May, 3,307 people remained evacuated.
Information Contacts: S. Nakada, Kyushu Univ; JMA.
New lava lobe appears; number of pyroclastic flows increases
Endogenous dome growth towards the SW... continued through the end of June at a decreased rate, and then changed direction towards the N. EDM measurements by the GSJ showed that the N flank shortened rapidly in late June at a rate of several tens of centimeters/day, and that shortening continued through mid-July. When deformation of the N flank was observed during January-March, a few sets of measurement lines were shortened. During recent measurements, however, only one set of lines shortened, suggesting movement of a small block on which a set of EDM mirrors is installed.
The growth of a new lava lobe (no. 13) on the morning of 12 July was observed from the air by geologists from SEVO. It is likely that the new lobe, on the SE shoulder of the endogenous dome, began growing on 10 July. The site of lobe 13 was at ~1,380 m elev; the endogenous dome itself reached 1,480 m in early July. Lobe 13 appeared at almost the same position as the previous lobe. It consisted of fresh gray-colored lava blocks up to several meters long, and had a diameter of ~70 m with a thickness of 30 m on 14 July; the volume was ~5 x 10⁴ m3. The eruption rate during 10-14 July, taking into account lava blocks removed as rockfalls and lava intruded into the endogenous dome, was roughly estimated as several tens of thousand cubic meters/day. The rate has remained consistently low in recent months, in contrast to the large new lobes that exhibited high effusion rates during 1991-93.
This event resembled the mid-January appearance of lobe 12 in a depression behind the endogenous dome. Lobe 13 appeared on the backside of the endogenous dome, although not in a depression. The emergence points of both lobes were below 1,400 m elevation. These facts indicate that extrusion of lobes during the endogenous stage may be controlled by the height and condition of the dome carapace (thinning or breaking), and not by an abrupt change of eruption rate.
The number of pyroclastic flows caused by collapse of the lava dome increased in mid-June. In total, 105 pyroclastic flows were detected seismically at the station ~1 km WSW of the dome. Pyroclastic flows mainly descended in the direction of lava dome growth; most traveled SW, but since 24 June the dominant direction was NNW. The longest pyroclastic flow of the month traveled ~2 km NNW on 24 June. Rockfalls began to move SE at the end of June. Pyroclastic flows that moved SE (Akamatsu Valley) traveled ~1.5 km from the source in early July. Lava blocks continuously collapsed from the toe of the lobe and descended as pyroclastic flows to the SE. Breccias of gray-colored fresh lava covered the slope down to several hundred meters below lobe 13. Pyroclastic flows descending N continued after the appearance of lobe 13, and a peak of the endogenous dome was moving N at a rate of 1.6 m/day; implying that endogenous growth continued during growth of the new lobe. On the N slope, a 1663 andesite lava flow has been buried by recent talus and pyroclastic-flow deposits; a 1792 lava flow on the NE slope has been partially covered.
According to a hotel owner in the Unzen spa area, water temperature rose suddenly at a 4-m-deep hot spring beneath the hotel, having increased by ~10°C since early May. Information was also received about another hot spring that had increased in temperature by a few degrees. Although the relationship between hot spring temperatures and volcanism is not clear or confirmed, continuous temperature measurement of the hot spring by JMA began on 15 June. Microearthquakes beneath the dome, which totalled 3,279 in June (table 14), were registered at a rate of >150/day through the first half of the month, and then decreased to
Table 14. Monthly number of seismic events at Unzen, January 1993-June 1994. Monthly totals for 1991-92 can be found in 17:12. Courtesy of JMA.
| Year/Month | Earthquakes | Pyroclastic Flows |
| 1990 | 4,018 | -- |
| 1991 | 19,101 | 2,756 |
| 1992 | 53,400 | 3,918 |
| Jan 1993 | 3,147 | 37 |
| Feb 1993 | 542 | 44 |
| Mar 1993 | 2,985 | 171 |
| Apr 1993 | 656 | 352 |
| May 1993 | 3,037 | 281 |
| Jun 1993 | 506 | 295 |
| Jul 1993 | 1,034 | 353 |
| Aug 1993 | 12,946 | 134 |
| Sep 1993 | 1,032 | 138 |
| Oct 1993 | 1,101 | 80 |
| Nov 1993 | 2,662 | 32 |
| Dec 1993 | 25,340 | 34 |
| Jan 1994 | 1,863 | 75 |
| Feb 1994 | 1,725 | 80 |
| Mar 1994 | 5,110 | 10 |
| Apr 1994 | 4,606 | 16 |
| May 1994 | 3,171 | 33 |
| Jun 1994 | 3,279 | 105 |
Steve O'Meara observed Unzen for ~13 hours on the night of 28 May and morning of 29 May from 4 km SE of the summit near Highway 57. The tallest feature that could be observed was a double-peaked spine. At least three strongly active regions on the dome released long plumes of steam; no reddish glow could be seen. Just after midnight, a large red flame-shaped incandescent gas plume was emitted from the W side of the dome's summit. The plume rose about 100 m and flickered, keeping its flame-like shape for ~15 seconds before fading and shrinking back to the dome. This emission was accompanied by a glowing red cloud that moved NW down the dome. Similar events occurred 10 more times before noon. Most of them were small reddish-brown ash releases either from the vent on the W side of the dome, or perhaps from collapses of the spine.
Information Contacts: S. Nakada, Kyushu Univ; JMA; Stephen O'Meara, Sky & Telescope.
Lava lobe 13 grows endogenously but then nearly stops growing in late-July
Lobe 13 . . . grew endogenously at slow rates until late-July. Its final size was ~80 m long, 70 m wide, and 30 m high; it lies hidden behind the roughly 10x longer lobe 11, which forms the prominent bulge on figures 73 and 74.
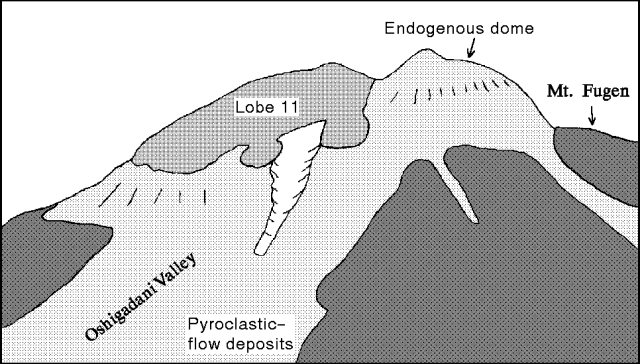 |
Figure 73. Sketch of the Unzen lava done showing features of the 22 July photograph (figure 74); view is roughly [from] the N. Vegetated surfaces are shown in black, undifferentiated dome, talus, pyroclastic-flow, and other deposits shown lightly shaded. Courtesy of S. Nakada. |
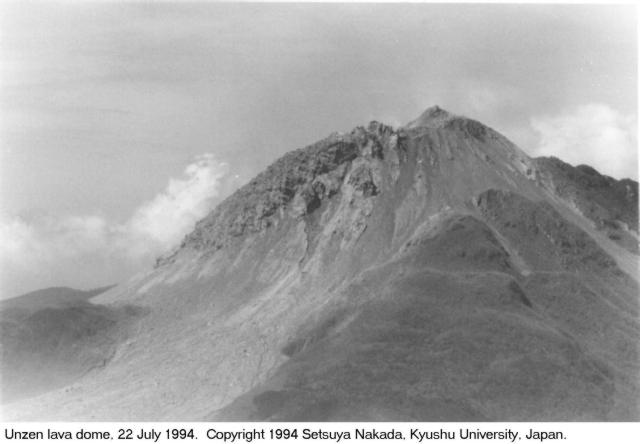 |
Figure 74. Photograph of the lava dome at Unzen, 22 July 1994. Taken from a helicopter looking [from] approximately N. Courtesy of S. Nakada. |
In Unzen's summit area, the endogenous dome developed three E-W trending ridges along its top. The highest (central) ridge uplifted in early-July between two other ridges. The central ridge and a N ridge moved to the N at a rate of ~2 m/day during July, leaving behind the S ridge and increasing the width of a graben between them. The central ridge also rose vertically at a rate of <1 m/day. The E part of the central ridge consisted of brown-colored massive lava that was rounded, convex upward, and relatively smooth. The ridge was composed of massive lava squeezed from the interior of the dome, an effect also seen in April. When the lava reached the top of the ridge it broke and collapsed.
The ridges stopped moving N at the end of July. Occasionally there were small, low-density rockfalls to the SW in early- to mid-August. Owing to fragmentation, the massive lava of the central ridges decreased its height by ~20 m during the first two weeks in August, and at the same time the talus slope hardly advanced in any direction. These observations imply that for this two-week period in August an extremely low eruption rate (estimated at 4m3/day) prevailed.
During mid-July to early-August a continuous rain of N-directed rockfalls occurred when the N ridge became exposed at the cliff top. These rockfalls transformed into small pyroclastic flows, generally with run-out distances under 1 km. Pyroclastic flows were detected seismically at a station 1 km WSW of the dome and real-time monitoring of the dome was accomplished by four sets of visible and thermal infrared video cameras. During July this system detected 44 pyroclastic flows.
During most of July, microearthquakes beneath the dome generally took place <80 times a day. The total number of earthquakes in July was 2,488, roughly a 20% drop from the previous two months.
EDM by the JMA and the GSJ found that during late-June through mid-July the radial distance to one reflector on Unzen's N flank shortened rapidly, by tens of centimeters/day. The lack of confirmation from other reflectors suggested that the area in motion was of limited size.
Information Contacts: S. Nakada, Kyushu Univ; JMA.
Slow endogenous growth of the lava dome; pyroclastic flows continue
The lava dome grew endogenously SE to SW during mid- to late-August. The S ridge on the dome top 0moved S by ~1 m/day and rose vertically by ~0.5 m/day; the central ridge decreased in height. Crest-line measurements from 3.5 km SE of the dome confirmed the endogenous growth. EDM measurements by the JMA in cooperation with the GSJ were hampered by poor weather conditions and volcanic ash. The eruption (magmatic extrusion) rate remained at a low level. The GSJ calculated the average eruption rate from early-April to mid-July as 60,000 m3/day, based on aerial photographs. This value is similar to those for February-April, although no values for the calculation error were given.
The N and S parts of the presently growing dome had no room for talus deposition (figure 75). Therefore, the advancing dome easily triggered rockfalls in both directions that moved straight downward as pyroclastic flows. Most parts of lobe 13 collapsed during 15-29 August, generating pyroclastic flows to the SW, S, and SE, which reached the Akamatsu valley. Pyroclastic flows detected seismically at a station ~1 km WSW of the dome totaled 264 during August. Real-time monitoring of pyroclastic flows is also conducted at the UWS using four sets of visible and thermal-infrared video cameras. In late August, JMA recorded the second largest daily number of pyroclastic flows since 20 May 1991, based on signals registered at the seismic station SW of the dome. This large number of events reflected smaller distances between pyroclastic flow routes and the seismic station than was previously the case.
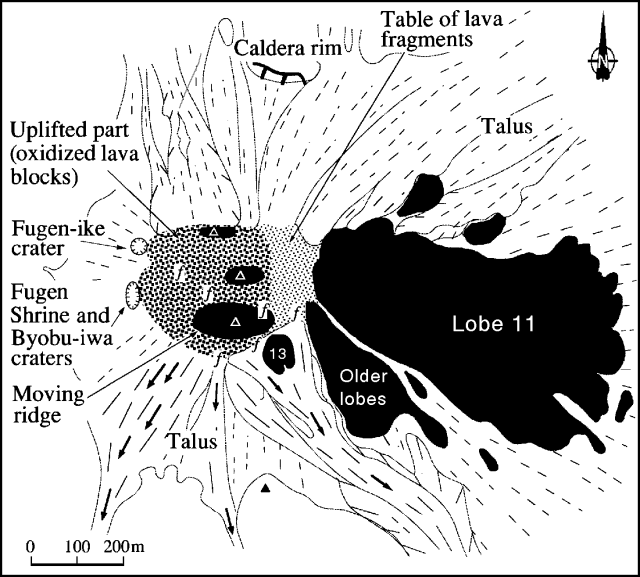 |
Figure 75. Sketch map of the lava dome at Unzen, late August 1994. Solid dome rock is shown as black. Arrows indicate the main direction of pyroclastic flows and rockfalls. Solid and dashed lines represent slope dip directions of new and old talus deposits, respectively. Volcanic gas emission points are shown by "f" symbols. Courtesy of S. Nakada, Kyushu Univ. |
On the nights of 15 and 16 August, pyroclastic flows descended SE ~400 m through a deep gully, which developed during rainy seasons at the S margin of the Akamatsu valley floor. Field inspection on 24 August showed that the 15-16 products were block-and-ash-flow deposits consisting of multiple layers each ~2 m thick. The deposits included still-hot lava blocks up to 3 m across in an ash matrix, and were covered with an ashfall layer ~10 cm thick. No associated surge deposits were evident. Gently sloped depressions ~2 m across, indicating underlying fumarolic pipes, were found on the surface of the 15-16 August deposits. The depression surfaces were reddish to yellowish brown, and lava pebbles (3. Density has increased roughly with time during this eruption (1.8 to 2.5 g/cm3); there has been a roughly negative correlation between density of lava blocks and eruption rate. The SiO2 contents of new samples were 64.7-65.1 wt.%, remaining roughly constant with previous lavas (63.5-65.5%). These results indicate that the vesicularity (porosity) of lava blocks probably decreased with time.
Pyroclastic flows moving SW passed through a gully in the S slope of the dome, crossed the Akamatsu valley floor, and came against the N wall of Mt. Iwatoko, generating frequent ash clouds. A pyroclastic flow late on 27 August traveled 2.0 km SE and produced a signal that lasted for almost 30 minutes, the longest duration since pyroclastic flows began in May 1991. Many pyroclastic flows in the last 10 days of the month had long durations, but all were considered to be triggered by small-scale collapses. On 29 August, pyroclastic flows again moved SE through the gully in the Akamatsu valley; the horizontal travel distance was ~3 km from the source. The volume of the largest pyroclastic-flow deposits during this period was estimated to be ~100,000 m3.
Microearthquakes beneath the lava dome were registered at a rate of ~50/day during the first half of August, and gradually increased in number later in the month. On 28 August, 474 earthquakes were detected at a seismic station 3.6 km SW of the dome. In total, 7,306 earthquakes were registered during August.
Information Contacts: S. Nakada, Kyushu Univ; JMA.
Endogenous dome growth slows; erosion of talus slopes
Almost no advancement of the talus slopes took place from September to October. However, small pyroclastic flows and rockfalls occurred to the S during September and to the N during October (figure 76). These collapses resulted in the formation of small horseshoe-shaped craters on the talus slopes. The top of the dome decreased in elevation from 1,490 m in July, to 1,470 m in August, and to 1,460 m by October. The top of the endogenous dome, which was cone-shaped, exhibited a flat morphology by August with gentle depressions in some parts, including the E-W-trending ridges. These morphological changes were accompanied by a decrease in eruption rate to3/day.
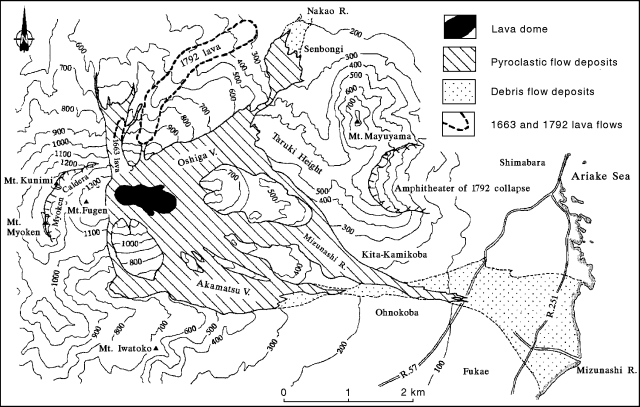 |
Figure 76. Map showing distribution of pyroclastic-flow and debris-flow deposits at Unzen from 1991 through early October 1994. Directions of recent pyroclastic flows were limited to either N or S of the dome. The 1663 andesitic lava flow has been eroded and completely covered by new pyroclastic-flow deposits. Courtesy of Setsuya Nakada. |
Pyroclastic flows caused by lava dome collapse, detected seismically ~1 km WSW of the dome, totaled 128 in September. Most of the pyroclastic flows occurred during 11-13 September, and none took place late in the month. The pyroclastic flows moved SW and SE, reaching the Akamatsu Valley; the longest of the month traveled 2.5 km SE.
On 1 September, 439 microearthquakes beneath the lava dome were registered at a seismic station ~3.6 km SW, but they gradually decreased in number throughout the month to 20/day. The total number of earthquakes for September was 3,260. Crest-line theodolite measurements from the UWS revealed that endogenous growth almost stopped in mid-September. EDM on the N flank by the JMA and GSJ indicated shortening of 10 mm/day during the second half of September.
Information Contacts: S. Nakada, Kyushu Univ; JMA.
Relative quiet on the 4th anniversary of the current eruption
The 4th anniversary of Unzen's current eruptive episode took place on 17 November. During the first half of November, Unzen's surface activity reached the lowest level seen in the course of 3.5 years of lava dome growth; earthquakes also reached a low level. From mid-October through mid-November the eruption had a low rate of lava extrusion (<104 m3/day) and a low frequency of pyroclastic flows.
During November, only the N slope moved, and the dome's slow endogenous growth produced velocities as low as a few meters in several tens of days. During mid-October to mid-November the top of the endogenous dome occupied an area 400 x 300 m that was covered with oxidized lava fragments and blocks. During this interval the dome's top became flat to partly convex downward. A small spine 20 m across sprouted near the center of the flat dome top in early October. Extrusion during October caused the spine to rise at the rate of 1 m/day, double the November rate. By mid-November the spine had reached ~50 m high.
Small rockfalls originated at the uppermost NE slopes on the endogenous dome. They typically took place episodically, with many falls confined to a few days during intervals of 2-3 weeks. Some of them developed into pyroclastic flows with travel distances <2 km. During mid-October through mid-November pyroclastic flows lacked accompanying pyroclastic surges. On 26 and 27 October, partial collapses of lava blocks from old lobes generated pyroclastic flows, which traveled ~2.5 km SE and ~2.2 km NE. No pyroclastic flows took place in early to mid-November, which probably reflects the low extrusion rate during this period; in contrast to earlier large Merapi-type pyroclastic flows that seemed to result from large collapses driven by high extrusion rates.
COSPEC analysis by the Tokyo Institute of Technology in late September showed that SO2 flux from the dome had remained at the low value of ~40 t/d since February 1994. Based on air-photograph measurements by the Geographical Survey Institute of Japan, the total volume of magma erupted from May 1991 to September 1994 was 0.20 km3 (dense-rock-equivalent value), twice the volume of the current dome (0.10 km3). The average eruption rate from February until the beginning of September (7 months) was 6 x 10⁴ m3/day (±2 x 10⁴ m3/day).
During October, microearthquakes detected 3.6 km W of the dome (station A) totaled 993; seven pyroclastic flows were caused by dome collapse. The pyroclastic flows were detected remotely using a seismic station 1 km WSW of the dome and four sets of visible and infrared video cameras.
Information Contacts: S. Nakada, Kyushu Univ; JMA.
Endogenous lava-dome growth continues at low rate; few pyroclastic flows
The period from mid-November through mid-December was characterized by a low eruption rate (~104 m3/d) and low frequency of pyroclastic-flow events. A theodolite survey indicated that lava blocks (a spine and the surrounding area) in the center of the endogenous dome had moved upward at a rate of <0.5 m/day. Movement of talus slopes on the dome was hardly detected during this period. Some geophysicists proposed that the upward movement of the spine and the surrounding area was related directly to microearthquakes, which occurred periodically within the dome in recent months. It is difficult to test this hypothesis because of the slow movement and poor weather conditions. The endogenous dome was the highest point in early December, reaching ~220 m above the former Jigokuato Crater. The height of the dome has varied but generally increased with time, and had reached 245 m in April 1994.
Oxidized lava blocks (several meters across) on the dome surface tumbled NE and SE due to inclination of the surface around the uplifting part; some developed into pyroclastic flows. During October, eight pyroclastic flows were observed to travel <=2 km SE. The Geological Survey of Japan reported that the average volume of pyroclastic-flow deposits in November was ~100 m3/day, which is the lowest since May 1991. Volume estimates were made using pyroclastic-flow seismic records (amplitude and duration of signal).
During November, microearthquakes detected 3.6 km W of the dome (station A) totaled 436, roughly half the number seen in October (993). Since mid-October, the number of hourly earthquakes has been periodic, with 38-40 hours between cycles. A corresponding periodic character was also found in tilt data at the N caldera rim, but the mechanism remains unknown. COSPEC analysis by the Tokyo Institute of Technology in late November showed that SO2 flux from the dome was ~20 t/d; half of the value in late September. The value of SO2 flux . . . is roughly concordant with the lava eruption rate throughout the last 3.5 years.
Information Contacts: S. Nakada, Kyushu Univ; JMA.
Endogenous dome growth increases summit to 1,500 m
Theodolite crest-line measurements from the UWS revealed continued steady endogenous growth of the center of the dome up towards the W at a rate of ~0.7 m/day. The elongated lava-block spine reached 1,500 m elevation in early January 1995 (figure 77). [This is ~140 m higher than the summit of Fugen-dake, previously the highest peak of the Unzen volcanic complex.] Thickness of the dome above the original crater floor increased to 250 m. Three periods of vertical growth have taken place during this endogenous event that started in the end of 1993: January-March 1994, June-July, and November-January 1995. After each uplift event, a new part of the dome increased in height while the old peak subsided.
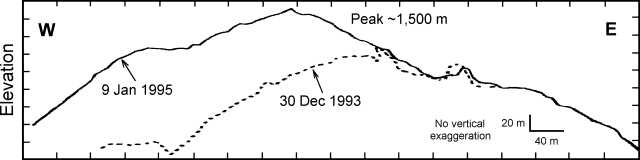 |
Figure 77. Profile of the Unzen lava dome, 30 December 1993 and 9 January 1995, determined by theodolite measurements from ~2 km SSW. Courtesy of JMA. |
Microearthquakes beneath the lava dome totaled 329 in December (less than 35/day) at a seismic station ~3.6 km SW of the dome (table 15). The number of daily events beneath the dome varied, but generally decreased in early 1995. For the first time since 5 January 1994, an earthquake beneath the dome on 28 December was felt at the UWS. Collapse of the lava dome caused 12 pyroclastic flows in December that went NE and SE; the longest traveled 2 km SE.
Table 15. Monthly number of seismic events at Unzen, 1994. Monthly totals for 1991-92 can be found in 17:12, and for 1993 in 19:6. Courtesy of JMA.
| Year/Month | Earthquakes | Pyroclastic Flows |
| 1990 | 4,018 | -- |
| 1991 | 19,101 | 2,756 |
| 1992 | 53,400 | 3,918 |
| 1993 | 54,987 | 1,951 |
| 1994 | 34,566 | 782 |
| Jan 1994 | 1,863 | 75 |
| Feb 1994 | 1,725 | 80 |
| Mar 1994 | 5,110 | 10 |
| Apr 1994 | 4,606 | 16 |
| May 1994 | 3,171 | 33 |
| Jun 1994 | 3,279 | 105 |
| Jul 1994 | 2,488 | 44 |
| Aug 1994 | 7,306 | 264 |
| Sep 1994 | 3,260 | 128 |
| Oct 1994 | 993 | 7 |
| Nov 1994 | 436 | 8 |
| Dec 1994 | 329 | 12 |
Information Contacts: S. Nakada, Univ of Tokyo; JMA.
Eruption rate, seismicity, and number of pyroclastic flows all very low
The magma eruption rate during December and January was estimated to be3/day. During the first half of February the eruption rate was almost zero, and the number of volcanic earthquakes and rockfalls declined. The theodolite survey indicated little growth of the endogenous dome during January and the first half of February. Movement has been limited to the central part of the endogenous dome since October 1994, with the E-W oriented spine (dike) moving very slowly through mid-January, and the E part of the dike slowly swelling at a rate of 1-2 m/month (figure 78). This swelling generated multiple small pyroclastic flows toward the NE in late January. The dike surface was reddish brown, and fumaroles were fringed with yellowish sulfur deposits.
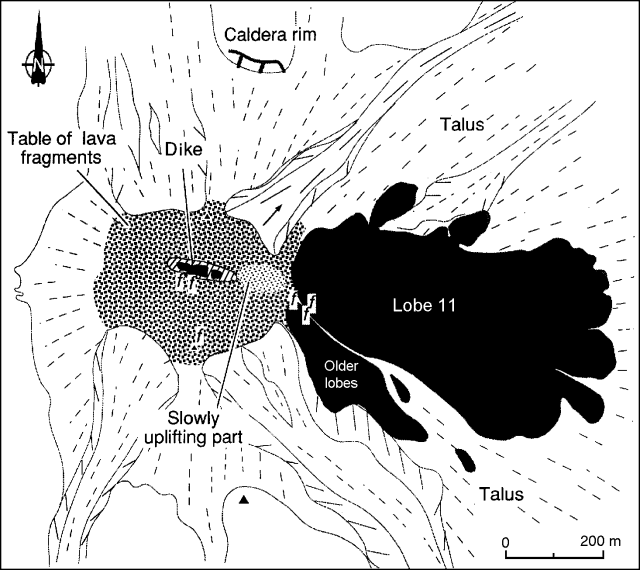 |
Figure 78. Sketch map of the lava dome at Unzen, early February 1995. Solid dome rock is shown as black. The arrow indicates the direction of rockfalls in late January and early February. Solid and dashed lines represent slope dip directions of new and old talus deposits, respectively. Volcanic gas emission points are shown by "f" symbols. Courtesy of Setsuya Nakada, University of Tokyo. |
Microearthquakes beneath the lava dome were generally registered at a rate of <20/day at a station 3.6 km SW, for a total of 322 in January. However, there were 36 events on the 26th and 56 on the 27th. Larger events were felt on 11, 13, 16, and 20 January at the Unzen Weather Station (4 km SW). Only two pyroclastic flows were detected seismically in January; one on the 5th traveled ~5 km SE.
The Coordination Committee for Prediction of Volcanic Eruption met on 6 February to assess the current activity. A statement was issued noting that: 1) lava-dome growth was continuing but the magma supply had decreased since mid-1994; 2) although seismicity has been very low, there have been periodic changes in the number of events since October, which is a new phenomenon; and 3) monitoring and warning systems are still needed during this time of very low activity because volcanism could increase again.
Information Contacts: Setsuya Nakada, Volcano Research Center - Earthquake Research Institute, University of Tokyo, Yayoi 1-1-1, Bunkyo-ku, Tokyo 113, Japan; Volcanological Affairs Office, Seismological and Volcanological Dept, Japan Meteorological Agency (JMA), 1-3-4 Ote-machi, Chiyoda-ku, Tokyo 100 Japan.
Isolated tremors, but no eruptive activity or pyroclastic flows
Activity during February-March was characterized by almost no magma supply to the dome. The dike at the top of the endogenous dome had almost stopped moving in late January. No changes at the dome were observed during either helicopter or ground-based inspections. No large rockfalls or pyroclastic flows have occurred since early February. Emissions of SO2 from the dome declined to below the COSPEC detection limit, according to SEVO (Shimabara Earthquake and Volcano Observatory, Kyushu University).
Dome outlines observed from several fixed points using theodolite by both SEVO and JMA showed no change during February. EDM measurements by the Geological Survey of Japan indicated that mirrors located on the upper NW to SW flanks near the dome moved little, except one 500 m SW of the dome. The distance between the latter mirror and a point ~1.5 km S has been decreasing at a steady rate of ~0.3 mm/day during the last four years (there were no data prior to dome extrusion).
Except for a swarm of 55 events on 4 February, microearthquakes beneath the lava dome occurred at a rate of <5/day. A total of 81 events registered in February at the seismic station 3.6 km SW of the dome. However, there have been isolated tremors, but these were much smaller and scarcer that those that preceded dome extrusion in 1991. Only two pyroclastic flows were detected at a seismic station 1 km WSW of the dome, both of which traveled ~500 m SE.
Information Contacts: Setsuya Nakada, Volcano Research Center - Earthquake Research Institute, University of Tokyo, Yayoi 1-1-1, Bunkyo-ku, Tokyo 113, Japan; Volcanological Affairs Office, Seismological and Volcanological Dept, Japan Meteorological Agency (JMA), 1-3-4 Ote-machi, Chiyoda-ku, Tokyo 100 Japan.
No lava dome growth, small rockfalls, rare tremors
No lava dome growth was revealed by theodolite surveys, helicopter inspections, or fieldwork during March and April. Rare rockfalls in March, 1-2/week, traveled 5m3. However, little lava was supplied after mid-February (figure 79). Theodolite survey results indicated that the endogenous dome started to shrink a little (1-2 m maximum) in April, compared with the data from February.
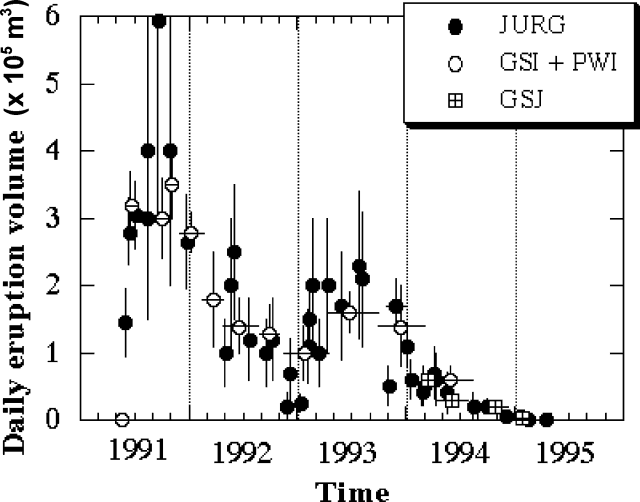 |
Figure 79. Daily eruption volume at Unzen, May 1991-April 1995, showing two distinct pulses of magma-supply. No effusion of lava has been observed since mid-February 1995. The total volume of magma erupted during this 4-year period was ~0.20 km3. Eruption volumes were estimated by Geological Party, Joint University Research Group (JURG), using photographs from daily helicopter inspections and theodolite surveys. Only aerial photographs were used by the Geographical Survey Institute (GSI), the Public Works Research Institute (PWRI), and the Geological Survey of Japan (GSJ) to calculate the volume changes. Courtesy of Setsuya Nakada. |
Volcanic gas emission decreased in April, such that no fume was observed from distant sites. Scientists from the Shimabara Earthquake and Volcano Observatory (SEVO), Kyushu University, installed mirrors for EDM and GPS stations near the top of the endogenous dome during April fieldwork. A sample from the dike on the top of the endogenous dome, which extruded at the end of 1994 and is the latest juvenile material, had a composition similar to lobe-13 samples collected in August 1994 (~65 wt.% SiO2); the specific gravity was ~2.46.
Only 15 microearthquakes beneath the dome and 10 tremor events were detected in March at the Japan Meteorological Agency seismograph 3.6 km SW of the dome. The same station detected 29 earthquakes and 18 tremor events in April. No pyroclastic flows were detected in March or April, but tiltmeters recorded upward movement of the summit on 9 and 24 March. SEVO noted small tremors on 8 and 15 April that were associated with minor tiltmeter changes; epicenters were several hundred meters W of the dome.
Information Contacts: Setsuya Nakada, Volcano Research Center - Earthquake Research Institute, University of Tokyo, Yayoi 1-1-1, Bunkyo-ku, Tokyo 113, Japan; Volcanological Division, Seismological and Volcanological Department, Japan Meteorological Agency (JMA), 1-3-4 Ote-machi, Chiyoda-ku, Tokyo 100 Japan.
Low seismicity, and minor, tremor-related tiltmeter changes
During ground-based inspections of the dome in June no new changes were noted. During June, 33 microearthquakes took place beneath the lava dome. No pyroclastic flows were detected in June, but there were 10 minor tiltmeter changes recorded associated with tremors.
Information Contacts: Volcanological Division, Seismological and Volcanological Dept, Japan Meteorological Agency (JMA), 1-3-4 Ote-machi, Chiyoda-ku, Tokyo 100 Japan.
Increased seismicity, but pyroclastic flows and dome growth absent
Although Unzen's activity has generally waned during the past 7 months, during July the number of earthquakes (measured at Station A, 3.6 km SW of the dome) increased (table 16). For July, the total number of earthquakes was 61, and tremors, 31. On 12 July, 22 micro-earthquakes were recorded beneath the dome. One earthquake was felt at the Unzen Weather Station. Neither pyroclastic flows nor any dome growth were evident throughout July, despite four minor tiltmeter changes associated with the increased seismicity.
Table 16. Summary of Unzen's monthly earthquakes, tremors, and pyroclastic flows during 1995.
| Month | Total Earthquakes | Felt Events | Tremors | Pyroclastic Flows |
| Jan 1995 | 322 | 4 | 60 | 2 |
| Feb 1995 | 81 | -- | 16 | 2 |
| Mar 1995 | 15 | -- | 10 | 0 |
| Apr 1995 | 29 | -- | 18 | 0 |
| May 1995 | 22 | -- | 12 | 0 |
| Jun 1995 | 33 | -- | 39 | 0 |
| Jul 1995 | 61 | 1 | 31 | 0 |
Information Contacts: Volcanological Division, Seismological and Volcanological Department, Japan Meteorological Agency (JMA), 1-3-4 Ote-machi, Chiyoda-ku, Tokyo 100, Japan.
Multiple small block-and-ash flows; the first since February 1995
On 10 February, a pyroclastic flow took place that was caused by collapse of the dome's lobe 7 or 8. No pyroclastic flows had been observed since 11 February 1995. In the next five days, six more small block-and-ash flows occurred; the highest plume reached 500 m.
According to the Shimabara Earthquake and Volcano Observatory, the pyroclastic flows descended SE, traveling ~1 km from the source. The resulting deposits were reddish brown and based on infrared camera measurements hosted lava blocks with temperatures > 60°C. The ash-clouds accompanied by these flows were similar to those of pyroclastic (block-and-ash) flows that took place frequently during 1991-94. Simple rockfalls (without ash-clouds) also occurred simultaneously and reached ~1.5 km from the source, beyond the front of the block-and-ash flows.
Neither volcanic earthquakes nor near-dome tiltmeter perturbations occurred before or after the pyroclastic flows. The collapses may have been due to stresses from either cooling-related or seasonal temperature changes.
Unzen is a large volcanic complex that covers much of the Shimabara Peninsula E of Nagasaki. The Mayu-yama lava dome was the source of a devastating 1792 avalanche and tsunami. Partial dome collapses have continued following Unzen's 1990-93 eruption.
Information Contacts: Japan Meteorological Agency (JMA), Volcanological Division, Seismological and Volcanological Department, 1-3-4 Ote-machi, Chiyoda-ku, Tokyo 100, Japan; Shimbara Earthquake and Volcano Observatory (SEVO), Kyushu University, Shimabara-shi, Nagasaki-ken 855 Japan; Setsuya Nakada, Volcano Research Center, Earthquake Research Institute, University of Tokyo, Yayoi 1-1-1, Bunkyo-ku, Tokyo 113, Japan (URL: http://www.eri.u-tokyo.ac.jp/VRC/index_E.html).
Tremor associated with minor tilt changes
Volcanic tremor on 24 March was associated with minor tiltmeter changes. A pyroclastic flow on 10 February (BGVN 21:02) was the first in a year. Dome growth followed by collapses that generated pyroclastic flows was a common occurrence during the 1990-95 eruption.
Information Contacts: Japan Meteorological Agency (JMA), Volcanological Division, Seismological and Volcanological Department, 1-3-4 Ote-machi, Chiyoda-ku, Tokyo 100, Japan.
Partial dome collapse triggers a pyroclastic flow
On 1 May a pyroclastic flow was triggered by the partial collapse of an unstable lava dome. Dome collapse causing pyroclastic flows was a common occurrence during the 1990-1995 eruption. Pyroclastic flows began again in February, and tremor was recorded in March. The large Unzen volcanic complex covers much of the Shimabara Peninsula E of Nagasaki. Mayu-yama lava dome was the source of a devastating 1792 avalanche and tsunami.
Information Contacts: Japan Meteorological Agency (JMA), Volcanological Division, Seismological and Volcanological Department, 1-3-4 Ote-machi, Chiyoda-ku, Tokyo 100, Japan.
|
|
||||||||||||||||||||||||||
There is data available for 11 confirmed eruptive periods.
1996 Feb 10 - 1996 May 1 Confirmed Eruption (Explosive / Effusive) VEI: 2
| Episode 1 | Eruption (Explosive / Effusive) | Fugen-dake | |||||||||||||||||||||||
|---|---|---|---|---|---|---|---|---|---|---|---|---|---|---|---|---|---|---|---|---|---|---|---|---|
| 1996 Feb 10 - 1996 May 1 | Evidence from Observations: Reported | |||||||||||||||||||||||
|
List of 3 Events for Episode 1 at Fugen-dake
|
||||||||||||||||||||||||
1990 Nov 17 - 1995 Feb 16 ± 15 days Confirmed Eruption (Explosive / Effusive) VEI: 1
| Episode 1 | Eruption (Explosive / Effusive) | Fugen-dake | ||||||||||||||||||||||||||||||||||||||||||||||||||||||||||||||||||||||||||||||||||||||||
|---|---|---|---|---|---|---|---|---|---|---|---|---|---|---|---|---|---|---|---|---|---|---|---|---|---|---|---|---|---|---|---|---|---|---|---|---|---|---|---|---|---|---|---|---|---|---|---|---|---|---|---|---|---|---|---|---|---|---|---|---|---|---|---|---|---|---|---|---|---|---|---|---|---|---|---|---|---|---|---|---|---|---|---|---|---|---|---|---|---|
| 1990 Nov 17 - 1995 Feb 16 ± 15 days | Evidence from Observations: Reported | ||||||||||||||||||||||||||||||||||||||||||||||||||||||||||||||||||||||||||||||||||||||||
|
List of 16 Events for Episode 1 at Fugen-dake
|
|||||||||||||||||||||||||||||||||||||||||||||||||||||||||||||||||||||||||||||||||||||||||
[ 1798 Nov 13 - 1798 Dec ] Uncertain Eruption
| Episode 1 | Eruption (Explosive / Effusive) | Fugen-dake | |||||||||||||||||||||||
|---|---|---|---|---|---|---|---|---|---|---|---|---|---|---|---|---|---|---|---|---|---|---|---|---|
| 1798 Nov 13 - 1798 Dec | Evidence from Unknown | |||||||||||||||||||||||
|
List of 3 Events for Episode 1 at Fugen-dake
|
||||||||||||||||||||||||
1792 Feb 10 - 1792 Jul 22 Confirmed Eruption (Explosive / Effusive) VEI: 2
| Episode 1 | Eruption (Explosive / Effusive) | Fugen-dake (summit, NNE), Mayu-yama | ||||||||||||||||||||||||||||||||||||||||||||||||||||||||||||||||||||||||||||||
|---|---|---|---|---|---|---|---|---|---|---|---|---|---|---|---|---|---|---|---|---|---|---|---|---|---|---|---|---|---|---|---|---|---|---|---|---|---|---|---|---|---|---|---|---|---|---|---|---|---|---|---|---|---|---|---|---|---|---|---|---|---|---|---|---|---|---|---|---|---|---|---|---|---|---|---|---|---|---|---|
| 1792 Feb 10 - 1792 Jul 22 | Evidence from Observations: Reported | ||||||||||||||||||||||||||||||||||||||||||||||||||||||||||||||||||||||||||||||
|
List of 14 Events for Episode 1 at Fugen-dake (summit, NNE), Mayu-yama
|
|||||||||||||||||||||||||||||||||||||||||||||||||||||||||||||||||||||||||||||||
[ 1690 - 1692 ] Uncertain Eruption
| Episode 1 | Eruption (Explosive / Effusive) | ||||||||||||||
|---|---|---|---|---|---|---|---|---|---|---|---|---|---|---|
| 1690 - 1692 | Evidence from Unknown | |||||||||||||
|
List of 1 Events for Episode 1
|
||||||||||||||
1663 Dec 11 - 1663 Dec 27 (on or after) Confirmed Eruption (Explosive / Effusive) VEI: 2 (?)
| Episode 1 | Eruption (Explosive / Effusive) | NE flank of Fugen-dake (1200 m) | ||||||||||||||||||||||||||||
|---|---|---|---|---|---|---|---|---|---|---|---|---|---|---|---|---|---|---|---|---|---|---|---|---|---|---|---|---|---|
| 1663 Dec 11 - 1663 Dec 27 (on or after) | Evidence from Observations: Reported | ||||||||||||||||||||||||||||
|
List of 4 Events for Episode 1 at NE flank of Fugen-dake (1200 m)
|
|||||||||||||||||||||||||||||
1663 Apr - 1663 May Confirmed Eruption (Explosive / Effusive) VEI: 2 (?)
| Episode 1 | Eruption (Explosive / Effusive) | Fugen-dake (Tsukumo-jima Pond) | ||||||||||||||||||
|---|---|---|---|---|---|---|---|---|---|---|---|---|---|---|---|---|---|---|---|
| 1663 Apr - 1663 May | Evidence from Observations: Reported | ||||||||||||||||||
|
List of 2 Events for Episode 1 at Fugen-dake (Tsukumo-jima Pond)
|
|||||||||||||||||||
[ 1657 ] Discredited Eruption
[ 0860 ] Uncertain Eruption
| Episode 1 | Eruption (Explosive / Effusive) | ||||
|---|---|---|---|---|
| 0860 - Unknown | Evidence from Unknown | |||
1150 BCE ± 500 years Confirmed Eruption (Explosive / Effusive)
| Episode 1 | Eruption (Explosive / Effusive) | Fugendake-Sancho | |||||||||||||
|---|---|---|---|---|---|---|---|---|---|---|---|---|---|---|
| 1150 BCE ± 500 years - Unknown | Evidence from Radiogenic: Thermoluminescence | |||||||||||||
|
List of 1 Events for Episode 1 at Fugendake-Sancho
|
||||||||||||||
1450 BCE ± 500 years Confirmed Eruption (Explosive / Effusive)
| Episode 1 | Eruption (Explosive / Effusive) | Fugen-dake (Kazaana) | |||||||||||||
|---|---|---|---|---|---|---|---|---|---|---|---|---|---|---|
| 1450 BCE ± 500 years - Unknown | Evidence from Radiogenic: Thermoluminescence | |||||||||||||
|
List of 1 Events for Episode 1 at Fugen-dake (Kazaana)
|
||||||||||||||
2150 BCE ± 800 years Confirmed Eruption (Explosive / Effusive)
| Episode 1 | Eruption (Explosive / Effusive) | Mayu-yama (Tengu-yama) | |||||||||||||
|---|---|---|---|---|---|---|---|---|---|---|---|---|---|---|
| 2150 BCE ± 800 years - Unknown | Evidence from Radiogenic: Thermoluminescence | |||||||||||||
|
List of 1 Events for Episode 1 at Mayu-yama (Tengu-yama)
|
||||||||||||||
2640 BCE ± 500 years Confirmed Eruption (Explosive / Effusive)
| Episode 1 | Eruption (Explosive / Effusive) | Mayu-yama (Shichimen-zan) | ||||||||||||||||||
|---|---|---|---|---|---|---|---|---|---|---|---|---|---|---|---|---|---|---|---|
| 2640 BCE ± 500 years - Unknown | Evidence from Isotopic: 14C (calibrated) | ||||||||||||||||||
|
List of 2 Events for Episode 1 at Mayu-yama (Shichimen-zan)
|
|||||||||||||||||||
2720 BCE ± 300 years Confirmed Eruption (Explosive / Effusive)
| Episode 1 | Eruption (Explosive / Effusive) | Fugen-dake | ||||||||||||||||||
|---|---|---|---|---|---|---|---|---|---|---|---|---|---|---|---|---|---|---|---|
| 2720 BCE ± 300 years - Unknown | Evidence from Isotopic: 14C (calibrated) | ||||||||||||||||||
|
List of 2 Events for Episode 1 at Fugen-dake
|
|||||||||||||||||||
4050 BCE ± 3000 years Confirmed Eruption (Explosive / Effusive)
| Episode 1 | Eruption (Explosive / Effusive) | Fugen-dake (Shimanomine) | ||||||||||||||||||
|---|---|---|---|---|---|---|---|---|---|---|---|---|---|---|---|---|---|---|---|
| 4050 BCE ± 3000 years - Unknown | Evidence from Radiogenic: Fission track | ||||||||||||||||||
|
List of 2 Events for Episode 1 at Fugen-dake (Shimanomine)
|
|||||||||||||||||||
This compilation of synonyms and subsidiary features may not be comprehensive. Features are organized into four major categories: Cones, Craters, Domes, and Thermal Features. Synonyms of features appear indented below the primary name. In some cases additional feature type, elevation, or location details are provided.
Synonyms |
||||
| Simabara | Unsen-dake | Onsen-dake | Unzen | ||||
Cones |
||||
| Feature Name | Feature Type | Elevation | Latitude | Longitude |
| Biwanokuba | Vent | 670 m | ||
| Fugendake
Hugen-dake |
Stratovolcano | 1360 m | ||
| Hachinokubo | Vent | 980 m | ||
| Hando-iwa | Vent | 1190 m | ||
| Kinugasa | Stratovolcano | 860 m | ||
| Kusenbu | Stratovolcano | 1062 m | ||
| Myoken-dake | Stratovolcano | |||
Craters |
||||
| Feature Name | Feature Type | Elevation | Latitude | Longitude |
| Jigoku-ato | Crater | 1250 m | ||
| Tsukumo-jima | Crater | 1220 m | ||
Domes |
||||
| Feature Name | Feature Type | Elevation | Latitude | Longitude |
| Azuma-yama | Dome | 868 m | ||
| Fugendake-sancho | Dome | |||
| Hachimaki-yama
Hatimaki-yama |
Dome | 638 m | ||
| Inao-yama | Dome | |||
| Kazaana | Dome | |||
| Kunumi-dake | Dome | 1240 m | ||
| Mayu-yama
Maye-yama Mae-dake |
Dome | 819 m | ||
| Myoken-dake | Dome | 1220 m | ||
| No-dake | Dome | 1147 m | ||
| Saruha-yama | Dome | 392 m | ||
| Shimanomine | Dome | |||
| Takaiwa-yama | Dome | 881 m | ||
| Taruki-Higashi | Dome | |||
| Torikabuto-yama | Dome | 822 m | ||
| Ya-dake | Dome | 960 m | ||
Thermal |
||||
| Feature Name | Feature Type | Elevation | Latitude | Longitude |
| Obama | Thermal | |||
| Shimabara | Thermal | |||
| Unzen | Thermal | |||
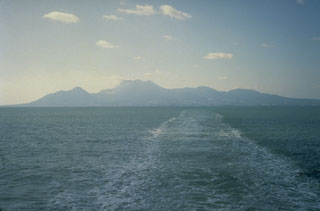 The Unzen volcanic complex comprises much of the Shimabara Peninsula east of Nagasaki, seen here looking to the W from across Shimabara Bay. Three large edifices are visible: Kinugasa to the N, Fugendake in the E-center, and Kusenbu on the S. Historical eruptive activity has occurred at the summit and flanks of Fugendake. Activity during 1990-95 formed a lava dome at the summit that produced pyroclastic flows (block-and-ash flows).
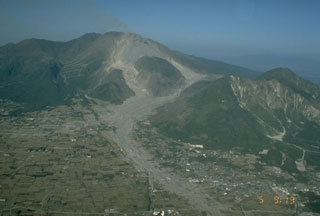 Shichimenzan and Mayuyama are two lava domes that form the forested peaks in this 5 November 1991 view from the SW. Mayuyama, the closest dome, has an E-facing scarp resulting from a major debris avalanche in 1792 that swept into the Ariake Sea. The avalanche produced a catastrophic tsunami that swept the coast of Shimabara Peninsula and traveled across the bay, causing nearly 15,000 fatalities. The light-colored areas in the foreground are 1991 block-and-ash flow deposits.
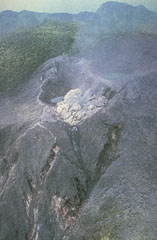 A new lava dome at the summit of Unzendake’s Fugendake is viewed from the air on 20 May 1991, the first day of dome growth that continued until February 1995. The blocky light-colored dacite lava was extruded into Jigokuto crater that formed during explosive activity on the first day of the 1990-95 eruption (17 November). Forested areas around the vents have been defoliated by the explosions, but at this early date undamaged forest remains in the background.
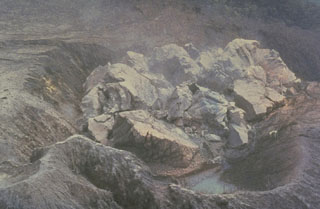 This closeup view on 20 May 1991 shows the first lava extrusion of the 1990-95 dome of Unzen volcano in Japan. The dome was extruded in the Jigokuato crater, which was formed by an explosion on the first day of the eruption, 17 November 1990. By 23 May the dome had reached a height of 44 m with a diameter of 110 m. It proceeded to grow over the east crater rim (upper right). Periodic collapse of the steep front of the dome produced pyroclastic flows that traveled progressively farther down the Mizunashi valley.
 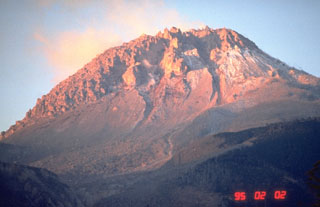 The 1990-95 eruption of Unzen volcano, in Kyushu, southern Japan, produced a lava dome at the summit. The rising sun colors the dome, seen here from the NE on 2 February 1995, near the end of the eruption. By this time the dome had grown to about 200 m above the pre-eruption surface. Periodic collapse of the growing lava dome had produced pyroclastic flows that devastated areas on the SE and NE flanks, resulting in the evacuation of thousands.
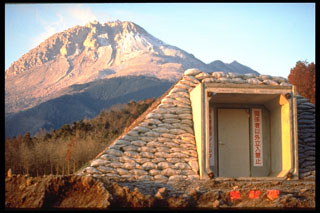 Starting in 1991 a lava dome grew at the summit of Fugendake in the Unzen volcanic complex. By the time the eruption ended in February 1995 the dome had grown to a height of 1,500 m, about 200 m above the pre-eruption surface. This 3 February 1995 photo from the NE shows a bunker in the foreground for emergency protection from block-and-ash flows that were produced by collapse of the growing lava dome.
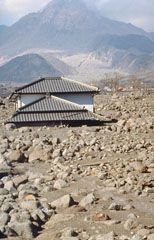 A house on the SW flank of Unzen volcano is buried to its eaves by lahar deposits. Redistribution of material that collapsed from the lava dome (background) produced lahars that devastated populated areas near the volcano. Dome growth, which had begun in May 1991, ceased at about the time of this 3 February 1995 photo.
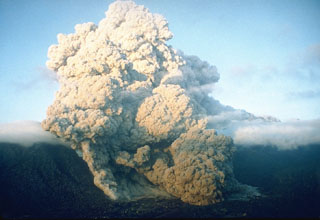 A pyroclastic flow on 23 June 1993 at Unzen volcano in southern Japan travels down the flanks of the volcano into the Senbongi residential district of Shimabara city. Pyroclastic flows had been occurring at Unzen since May 1991 as a result of partial collapse of the lava dome growing at the summit of Fugendake. This pyroclastic flow traveled 1 km through inhabited areas that had been evacuated since August 1991. One resident who had returned to watch his house burn was killed by a second pyroclastic flow.
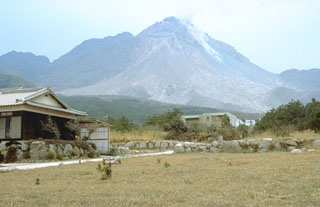 A small avalanche descends the east flank of the growing Fugendake lava dome on 23 March 1993. By this time the dome, which had begun growing in May 1991, had reached a height of nearly 1,440 m. This was 60 m higher than the former summit of Fugendake, the previous high point of the Unzen volcanic complex.
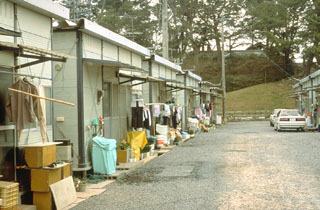 Up to 12,000 people were evacuated at various times because of the lengthy eruption of Unzen that began in 1990. Several thousand people faced long-term evacuation that resulted in living in government-constructed resettlement houses such as these.
 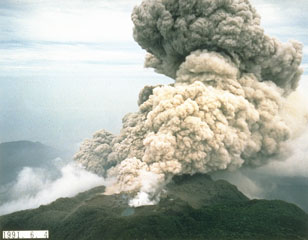 An ash plume rises from the summit crater of Fugendake on 4 June 1991, the day following deadly pyroclastic flows produced by collapse of a portion of the growing lava dome. The small pond in the foreground fills a crater formed by earlier exposions during the eruption that began in November 1990.
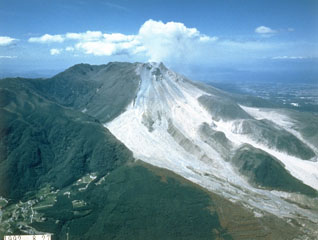 The light-colored area is composed of block-and-ash flow deposits produced by multiple collapse events of the growing lava dome at Unzen. By the time of this 28 August 1992 photo, taken from the SE, pyroclastic flows were traveling down both the Mizunashi valley (center) and the Oshigatani valley (right). Dome growth began in 1991 and continued into 1995.
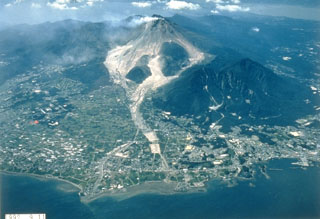 Light-colored block-and-ash flow deposits below the growing Fugendake lava dome are shown in this 11 September 1992 view from the E. Explosive activity began in November 1990 and preceded lava dome growth that began in May 1991. This was accompanied by pyroclastic flows that continued until February 1995 and caused disruption for villages and towns on the outskirts of Shimabara City in the foreground. The two lava domes of Shichmenzan and Mayuyama form the vegetated peaks to the right.
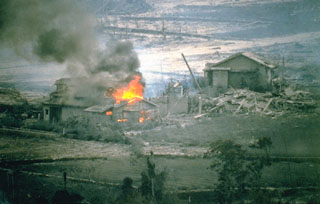 A house that was ignited by a hot block-and-ash flow burns in the Nakao River valley in June 1993. This marked the first destruction of property in drainages NE of Unzen. Pyroclastic flows on 23 June traveled 4 km down the NE flank and resulted in devastation across 1 km of a residential district on the outskirts of Shimabara City. The area had been evacuated since August 1991. One person who had entered the evacuated area to watch their house burn was killed by a second pyroclastic flow.
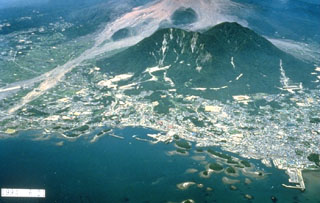 The forested islands in Shimabara harbor in the foreground were created by a massive debris avalanche in 1792 from Mayuyama, the left-most of the two forested lava domes behind the city. The high-velocity avalanche traveled 6.5 km from Mayuama and swept several kilometers out to sea. Impact of the debris into the ocean produced a devastating tsunami that swept 77 km of the shore of Shimabara Peninsula and caused nearly 15,000 fatalities. The light-colored area behind Mayuyama are block-and-ash flow deposits from the 1990-95 eruption.
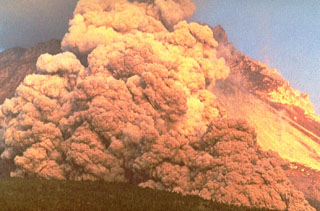 A block-and-ash flow travels down the flank of Fugendake in 1991. These were created by collapse of a lava dome that began on 24 May. The size of the flows gradually increased and on 3 June the largest flow of the eruption to that point swept 3 km down the Mizunashi River valley into Kita-Kamikoba village, killing 43 people and destroying many houses. On 8 June block-and-ash flows traveled 5.5 km to within 50 m of a major highway and destroyed an additional 73 houses.
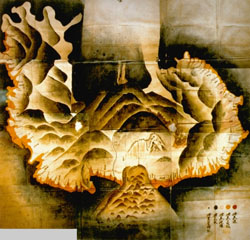 This 18th century watercolor map of Unzen volcano on the Shimabara Peninsula shows the extent of the catastrophic landslide from Mayuyama (lower center) in 1792 that swept into the Ariake Sea at the bottom of the map. The irregular orange-colored area along the coast delineates the extent of runup of the tsunami that was created when the avalanche entered the sea. The tsunami swept a 77-km length of the peninsula and caused nearly 15,000 fatalities here and along the coastlines.
The following 7 samples associated with this volcano can be found in the Smithsonian's NMNH Department of Mineral Sciences collections, and may be availble for research (contact the Rock and Ore Collections Manager). Catalog number links will open a window with more information.
| Catalog Number | Sample Description | Lava Source | Collection Date |
|---|---|---|---|
| NMNH 101499 | Unidentified | AZUMA-YAMA | -- |
| NMNH 112942 | Hornblende Andesite | -- | -- |
| NMNH 112942 | Hornblende Andesite | -- | -- |
| NMNH 112942 | Hornblende Andesite | -- | -- |
| NMNH 112943 | Hornblende Dacite | -- | -- |
| NMNH 112943 | Hornblende Dacite | -- | -- |
| NMNH 112943 | Hornblende Dacite | -- | -- |
| Copernicus Browser | The Copernicus Browser replaced the Sentinel Hub Playground browser in 2023, to provide access to Earth observation archives from the Copernicus Data Space Ecosystem, the main distribution platform for data from the EU Copernicus missions. |
| MIROVA | Middle InfraRed Observation of Volcanic Activity (MIROVA) is a near real time volcanic hot-spot detection system based on the analysis of MODIS (Moderate Resolution Imaging Spectroradiometer) data. In particular, MIROVA uses the Middle InfraRed Radiation (MIR), measured over target volcanoes, in order to detect, locate and measure the heat radiation sourced from volcanic activity. |
| MODVOLC Thermal Alerts | Using infrared satellite Moderate Resolution Imaging Spectroradiometer (MODIS) data, scientists at the Hawai'i Institute of Geophysics and Planetology, University of Hawai'i, developed an automated system called MODVOLC to map thermal hot-spots in near real time. For each MODIS image, the algorithm automatically scans each 1 km pixel within it to check for high-temperature hot-spots. When one is found the date, time, location, and intensity are recorded. MODIS looks at every square km of the Earth every 48 hours, once during the day and once during the night, and the presence of two MODIS sensors in space allows at least four hot-spot observations every two days. Each day updated global maps are compiled to display the locations of all hot spots detected in the previous 24 hours. There is a drop-down list with volcano names which allow users to 'zoom-in' and examine the distribution of hot-spots at a variety of spatial scales. |
|
WOVOdat
Single Volcano View Temporal Evolution of Unrest Side by Side Volcanoes |
WOVOdat is a database of volcanic unrest; instrumentally and visually recorded changes in seismicity, ground deformation, gas emission, and other parameters from their normal baselines. It is sponsored by the World Organization of Volcano Observatories (WOVO) and presently hosted at the Earth Observatory of Singapore.
GVMID Data on Volcano Monitoring Infrastructure The Global Volcano Monitoring Infrastructure Database GVMID, is aimed at documenting and improving capabilities of volcano monitoring from the ground and space. GVMID should provide a snapshot and baseline view of the techniques and instrumentation that are in place at various volcanoes, which can be use by volcano observatories as reference to setup new monitoring system or improving networks at a specific volcano. These data will allow identification of what monitoring gaps exist, which can be then targeted by remote sensing infrastructure and future instrument deployments. |
| Volcanic Hazard Maps | The IAVCEI Commission on Volcanic Hazards and Risk has a Volcanic Hazard Maps database designed to serve as a resource for hazard mappers (or other interested parties) to explore how common issues in hazard map development have been addressed at different volcanoes, in different countries, for different hazards, and for different intended audiences. In addition to the comprehensive, searchable Volcanic Hazard Maps Database, this website contains information about diversity of volcanic hazard maps, illustrated using examples from the database. This site is for educational purposes related to volcanic hazard maps. Hazard maps found on this website should not be used for emergency purposes. For the most recent, official hazard map for a particular volcano, please seek out the proper institutional authorities on the matter. |
| IRIS seismic stations/networks | Incorporated Research Institutions for Seismology (IRIS) Data Services map showing the location of seismic stations from all available networks (permanent or temporary) within a radius of 0.18° (about 20 km at mid-latitudes) from the given location of Unzendake. Users can customize a variety of filters and options in the left panel. Note that if there are no stations are known the map will default to show the entire world with a "No data matched request" error notice. |
| UNAVCO GPS/GNSS stations | Geodetic Data Services map from UNAVCO showing the location of GPS/GNSS stations from all available networks (permanent or temporary) within a radius of 20 km from the given location of Unzendake. Users can customize the data search based on station or network names, location, and time window. Requires Adobe Flash Player. |
| DECADE Data | The DECADE portal, still in the developmental stage, serves as an example of the proposed interoperability between The Smithsonian Institution's Global Volcanism Program, the Mapping Gas Emissions (MaGa) Database, and the EarthChem Geochemical Portal. The Deep Earth Carbon Degassing (DECADE) initiative seeks to use new and established technologies to determine accurate global fluxes of volcanic CO2 to the atmosphere, but installing CO2 monitoring networks on 20 of the world's 150 most actively degassing volcanoes. The group uses related laboratory-based studies (direct gas sampling and analysis, melt inclusions) to provide new data for direct degassing of deep earth carbon to the atmosphere. |
| Large Eruptions of Unzendake | Information about large Quaternary eruptions (VEI >= 4) is cataloged in the Large Magnitude Explosive Volcanic Eruptions (LaMEVE) database of the Volcano Global Risk Identification and Analysis Project (VOGRIPA). |
| EarthChem | EarthChem develops and maintains databases, software, and services that support the preservation, discovery, access and analysis of geochemical data, and facilitate their integration with the broad array of other available earth science parameters. EarthChem is operated by a joint team of disciplinary scientists, data scientists, data managers and information technology developers who are part of the NSF-funded data facility Integrated Earth Data Applications (IEDA). IEDA is a collaborative effort of EarthChem and the Marine Geoscience Data System (MGDS). |

