Due to the US Government shutdown, the Smithsonian is temporarily closed. The Global Volcanism Program website will remain available but will not be monitored or updated. Status updates will be available on the Smithsonian homepage.


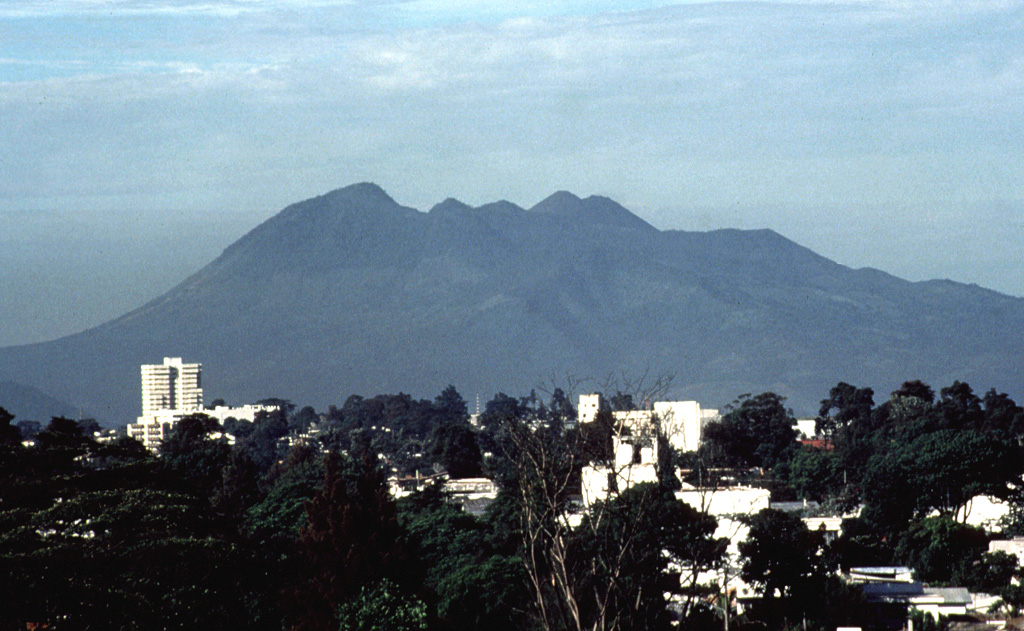
INSIVUMEH reported that white-to-blue gas-and-steam emissions rose as high as 600 m above Pacaya’s Mackenney crater and drifted as far as 2 km S, SW, and N during 18-25 August. Seismic stations recorded some weak explosion and degassing events on 18 August.
Source: Instituto Nacional de Sismologia, Vulcanologia, Meteorologia, e Hidrologia (INSIVUMEH)
Lava flow activity ceases mid-May 2021; last ash explosion reported on 13 August 2021
Extensive lava flows, bomb-laden Strombolian explosions, and ash plumes from Mackenney crater have characterized persistent activity at Pacaya since 1961. The latest eruptive period began with intermittent ash plumes and incandescence in June 2015; the growth of a new pyroclastic cone inside the summit crater was confirmed later that year and continued, producing frequent loud Strombolian explosions and ash emissions through May 2021. In addition, flank fissures were the source of multiple kilometer-long lava flows during 2019-2021. A significant increase in both effusive and explosive activity that began in February 2021 continued through mid-May, decreased later that month, and was followed by minor ash emissions in June and August 2021. Activity during June-November 2021 is covered in this report with information provided primarily by Guatemala's Instituto Nacional de Sismologia, Vulcanologia, Meteorologia e Hydrologia (INSIVUMEH).
The last lava flow from the major eruptive events of 2020 and 2021 had begun on 29 April and grown to over 2 km long before activity at the fissure ceased on 17 May (figure 185, BGVN 46:06). Periodic ash emissions continued for the remainder of May, with the last reported ashfall on 26 May. Although no further significant eruptive activity was reported in terms of flows, incandescent ejecta, or ashfall from plumes, minor ash emission events were reported over the next few months. The MIROVA radiative power data for the period of January-November 2021 shows the high to very high levels of heat flow during the period of multiple active flows from January through mid-May, with an abrupt decline in energy after that. Cooling flows were the likely source of low levels of heat during July (figure 186).
Sporadic ashfall was reported around Mackenney crater on 8 June 2021. The Washington VAAC reported a possible ash emission on 11 June drifting SW 35 km from the summit at 3 km altitude. No ash emissions, flows, or incandescent ejecta were reported during July. INSIVUMEH issued a Special Bulletin on 4 August reporting on three moderate explosions that produced ash plumes that rose to 3.5 km altitude and drifted N about 12 km; ashfall was reported in Mesías Altas, Mesías Bajas, and Villa Canales. The large pyroclastic cone that had nearly filled the inside of Mackenney crater was largely destroyed and had its own crater nearly the width of the cone about 100 m deep when viewed by researchers from the University of Bristol at the end of July (figure 187). Two explosions on 13 August produced ash plumes that drifted 1 km S.
Though INSIVUMEH noted the presence of ash in emissions on 14 September 2021, there was no significant plume or ashfall. For the remainder of October and November 2021 steam and gas emissions rose 150-400 m above the crater rim and drifted up to 1.5 km S or SW; there were no further reports of ash, ejecta, lava flows, or incandescence from Mackenney crater. A comparison of Sentinel 2 satellite images from February 2020 and November 2021 shows the extent of some of the new lava flows produced during the heightened activity of that period (figure 188).
Information Contacts: Instituto Nacional de Sismologia, Vulcanologia, Meteorologia e Hydrologia (INSIVUMEH), Unit of Volcanology, Geologic Department of Investigation and Services, 7a Av. 14-57, Zona 13, Guatemala City, Guatemala (URL: http://www.insivumeh.gob.gt/ ); MIROVA (Middle InfraRed Observation of Volcanic Activity), a collaborative project between the Universities of Turin and Florence (Italy) supported by the Centre for Volcanic Risk of the Italian Civil Protection Department (URL: http://www.mirovaweb.it/); Sentinel Hub Playground (URL: https://www.sentinel-hub.com/explore/sentinel-playground).
2021: January
| February
| March
| April
| May
| June
| August
2020: January
| March
| April
| May
| June
| July
| August
| September
| October
| November
| December
2019: February
| March
| June
| July
| August
| September
| November
2018: January
| February
| April
| May
| June
| July
| August
| September
| October
| November
| December
2017: January
| February
| March
| April
| May
| August
| September
| October
| November
| December
2016: June
| July
2015: January
| February
| June
| August
| September
2014: January
| February
| March
| April
| June
| July
| August
| September
2013: January
| February
| March
| April
| May
| June
| July
| August
| September
| November
| December
2012: March
| December
2011: January
2010: January
| February
| May
| June
| July
| September
| October
| December
2009: January
| March
| April
| June
| July
| August
| September
| October
| November
| December
2008: January
| February
| May
| June
| July
| August
| October
| November
| December
2007: January
| March
| April
| May
| July
| September
| December
2006: January
| March
| April
| July
| August
| September
| November
2005: January
| March
| April
| May
| June
| July
| September
2004: September
| October
2003: July
2002: May
| June
2001: February
INSIVUMEH reported that white-to-blue gas-and-steam emissions rose as high as 600 m above Pacaya’s Mackenney crater and drifted as far as 2 km S, SW, and N during 18-25 August. Seismic stations recorded some weak explosion and degassing events on 18 August.
Source: Instituto Nacional de Sismologia, Vulcanologia, Meteorologia, e Hidrologia (INSIVUMEH)
INSIVUMEH reported that gas emissions rose as high as 1.1 km above Pacaya’s summit and drifted as far as 1 km S and SW during 10-17 August. Two explosions produced ash plumes that drifted S on 13 August.
Source: Instituto Nacional de Sismologia, Vulcanologia, Meteorologia, e Hidrologia (INSIVUMEH)
INSIVUMEH reported that explosions at Pacaya were recorded at 0905, 1340, and 1421 on 4 August, a departure from the low levels of activity observed during the previous four months. The explosions produced ash plumes that rose about 1 km above the summit and drifted 12 km N, causing ashfall in Mesías Altas, Mesías Bajas, and Villa Canales. The report noted that the cinder cone in Mackenney Crater had been destroyed during the previous eruption phase and the crater was about 100 m deep. Cracks were seen around the crater indicating areas of instability at the summit. Steam-and-gas plumes rose as high as 1 km above the summit and drifted as far as 3 km in multiple directions during 5-10 August. No explosions were heard or visually observed, though the seismic network recorded weak explosion signals during 6-7 August.
Source: Instituto Nacional de Sismologia, Vulcanologia, Meteorologia, e Hidrologia (INSIVUMEH)
INSIVUMEH reported that during 15-22 June white gas plumes rose as high as 600 m above Pacaya’s Mackenney Crater and drifted as far as 5 km NW, W, and SW. Some weak explosions were recorded by the seismic network during 17-18 June.
Source: Instituto Nacional de Sismologia, Vulcanologia, Meteorologia, e Hidrologia (INSIVUMEH)
In a special 15 May bulletin INSIVUMEH noted that lava effusion at Pacaya ceased and activity instead was characterized by explosive activity at the summit crater. Ash-and-gas plumes rose 1 km and drifted downwind, causing ashfall in San Francisco de Sales, Concepción El Cedro, Aldea El Patrocinio, and San Miguel Petapa. Explosions ejected material up to 100 m above the summit. Ash plumes rose around 500 m above the summit and drifted 5-10 km N, NW, SW, and S during 18-21 and 24-25 May. Some explosions were recorded by the seismic network during 22-23 May; white-and-blue gas plumes rose 300-700 m and drifted 5 km W during 23-24 May.
Source: Instituto Nacional de Sismologia, Vulcanologia, Meteorologia, e Hidrologia (INSIVUMEH)
INSIVUMEH reported that during 12-18 May the cone on Pacaya’s N flank (near Cerro Chino) continued to be active, feeding lava flows and occasionally ejecting incandescent material as high as 40 m. The lava flow slowly advanced mainly W, though remained about 2.4 km long. The flow also spread laterally and shed incandescent blocks, especially along the flow margins and where the flow travels down steep slopes. Gas-and-ash plumes visible almost daily rose as high as 900 m above the summit and drifted W, SW, and S. Ashfall was reported in El Rodeo (4 km WSW) during 15-16 May and in El Patrocinio (about 5 km W) during 15-17 May.
Source: Instituto Nacional de Sismologia, Vulcanologia, Meteorologia, e Hidrologia (INSIVUMEH)
INSIVUMEH reported that during 4-11 May the lava flow on Pacaya’s N flank continued to advance, lengthening from 2.1 to 2.4 km, and spreading laterally in some areas. Incandescent blocks detached from the flow, especially along the flow margins and steep slopes. Occasional explosions at the vent (near Cerro Chino) ejected incandescent material as high as 100 m. Around 0600 on 6 May explosions at the summit produced ash plumes that drifted S. Dense ash plumes were visible drifting W and SW during 7-9 May. On 11 May an advancing lava flow on the SW flank was 2.3 km long.
Source: Instituto Nacional de Sismologia, Vulcanologia, Meteorologia, e Hidrologia (INSIVUMEH)
INSIVUMEH reported that during 27-29 April occasional explosions at Pacaya’s Mackenney Crater ejected incandescent material as high as 250 m above the summit. On 27 April a lava flow emerged from a new fissure on the upper SE flank traveled 200 m. At around 0500 on 29 April the seismic network recorded signals indicating a change from mostly explosive to mostly effusive activity. At around 0645 a new fissure opened on the N flank, producing a lava flow that rapidly traveled N towards Cerro Chino and then turned S and spread W and SW. Explosive activity at the fissure was minor during 29-30 April. By 3 May the flow was almost 2.1 km long, and continued to advanced W and SW at least through 4 May.
Source: Instituto Nacional de Sismologia, Vulcanologia, Meteorologia, e Hidrologia (INSIVUMEH)
INSIVUMEH reported that during 20-21 April explosions at Pacaya’s Mackenney Crater generated minor gas-and-ash plumes that rose 250 m above the summit and drifted S and SW. The lava flow on the SW flank continued to be active, though did not advance. White gas plumes were visible the next day rising as high as 200 m. On 23 April lava effusion ceased. The lava flows on the SW flank remained hot and gas plumes rose from parts of the flow; no advancement was visible through 27 April. Gray-and-white emissions were visible during 24-27 April, rising 100-200 m above the summit and dispersing S and SW. Occasional minor explosions ejected incandescent material 50-150 m high during 26-27 April.
Source: Instituto Nacional de Sismologia, Vulcanologia, Meteorologia, e Hidrologia (INSIVUMEH)
INSIVUMEH reported that the eruption at Pacaya’s Mackenney Crater continued during 7-13 April. Explosions during 6-7 April produced ash plumes that rose 1 km above the summit and drifted 10 km W and SW. Ballistics were ejected 50-150 m above the summit. Explosions during 8-9 and 11-12 April produced ash plumes that rose as high as 1 km and drifted as far as 10 km NE, W, and SW.
The lava flow on the W and SW flanks was 3.7 km long and continued to be fed. Incandescent lava blocks were spalled from the flow front and vegetation was set on fire. The lava advanced W onto the La Breña farm and SW towards El Patrocinio and El Rodeo, near the Campo Alegre farm. On 12 April the flows burned La Breña coffee and avocado plantations. By 13 April the lava flows were 3.8 km long, and within 370 m of houses in El Patrocinio. Another flow front was 250 m E of El Rodeo, and obstructed the road that connects El Rodeo, El Caracol, and Los Pocitos.
Sources: Instituto Nacional de Sismologia, Vulcanologia, Meteorologia, e Hidrologia (INSIVUMEH); Coordinadora Nacional para la Reducción de Desastres (CONRED)
INSIVUMEH reported that explosions at Pacaya’s Mackenney Crater during 30-31 March produced gas-and-ash plumes that rose 1.8 km above the summit and drifted up to 50 km S, SW, W, and NW. Explosions ejected blocks as high as 150 m above the summit. Lava flows on the W flank advanced to 3 km long and were near La Breña; the flows overtook an unoccupied building on the Campo Alegre farm that was used for monitoring and visitor services. The flow front was about 500 m from the town of El Patrocinio. Incandescent blocks detached from the end of the lava flow and set fire to vegetation. During 31 March-2 April explosions ejected incandescent blocks as high as 225 m above the summit. Ash plumes rose 500 m and drifted 20 km S and SW. The SW-flank lava flows remained active. Explosions continued during 3-6 April, with ash plumes rising as high as 1 km and drifting 6-20 km W, SW, and S. The lava flow continued to be active on the SW flank, setting fire to local vegetation. Strombolian activity ejected material 300 m high during 5-6 April.
Source: Instituto Nacional de Sismologia, Vulcanologia, Meteorologia, e Hidrologia (INSIVUMEH)
INSIVUMEH reported moderate to strong explosions at Pacaya’s Mackenney Crater during 24-30 March, accompanied by abundant ash plumes that rose to 2.9-4.5 km (9,500-13,000 ft) a.s.l. and drifted in multiple directions as far as 15-20 km. Resulting ashfall was reported in El Pepinal (7 km N), San Francisco de Sales (5 km N), El Cedro (9 km NNW), Calderas (3 km N), Mesías Altas, Mesías Baja (5 km NE), El Rodeo (4 km WSW), El Patrocinio (5 km W), and San Vicente Pacaya (5 km NW). The lava flow that began on 18 March was 2.5 km long, continuing down the SW flank; the height of the flow was 2.5 m with a width of 400 m, but the advancing front was 250 wide and set fire to nearby vegetation. Incandescent material ejected 150-300 m above the rim fell around the crater on 25 and 27 March. On 30 March ash plumes drifted 7 km S, causing ashfall in El Chupadero (2-2.5 km S) and Los Pocitos (5.5 km S).
Source: Instituto Nacional de Sismologia, Vulcanologia, Meteorologia, e Hidrologia (INSIVUMEH)
INSIVUMEH reported periods of intense activity at Pacaya’s Mackenney Crater during 17-18 March. Explosions produced dense ash plumes that rose 500-1,000 m above the crater rim and drifted 25-30 km S, SW, W, NW, and N. Incandescent material was ejected 300-500 m above the crater and fell within a 600 m radius of the crater. Lava flows on the S flank were 1.5 km long and set fire to vegetation at the advancing edge. Two new lava flows were visible; one traveled 400 m E and the other traveled 500 m S. Ashfall was reported in El Rodeo (4 km WSW), Patrocinio (about 5 km W), El Cedro (9 km NNW), San Francisco de Sales (5 km N), Amatitlán (12 km N), and Villa Nueva (16 km N).
Strong explosions during 21-23 March generated dense ash plumes that rose as high as 1.5 km above the summit. The plumes drifted 25-30 km NE, E, SE, and S, causing ashfall in Los Llanos, Los Pocitos (5 km S), Los Dolores (6 km SE), El Rodeo, Patrocinio, Mesías Alta and Mesías Baja, and Santa Elena Barillas (6 km ENE). Incandescent material was ejected 500 m above the crater and fell within 300-600 m of the crater. A lava flow on the SW flank was 1.5 km long, a flow on the S flank was 300 m long, and the E-flank lava flow had lengthened to 500 m. On 23 March ash plumes drifted 50 km NW, N, and NE, causing ashfall in Pepinal San Francisco de Sales, Los Pocitos, Los Dolores, Mesías Altas and Mesías Bajas, Santa Elena Barillas, Villa Nueva, and in the capital of Guatemala City (25-30 km NNE). Ash fell at Guatemala's international airport, Aeropuerto Internacional La Aurora, 50 km N of Pacaya, causing the airport to close. Soldiers swept ash off of the runway and incoming flights were diverted to El Salvador.
Sources: Instituto Nacional de Sismologia, Vulcanologia, Meteorologia, e Hidrologia (INSIVUMEH); CNN
INSIVUMEH and CONRED reported that pulses of moderate-to-strong Strombolian explosions at Pacaya’s Mackenney Crater were commonly recorded during 9-16 March. Frequent ash plumes rose as high as 2 km and drifted as far as 30 km W, SW, and S. On 10 March lapilli (2 mm to 6 cm in length) fell in El Caracol (3 km SW), and ash fell in El Patrocinio (about 5 km W) and likely in other areas downwind. Ash plumes caused daily ashfall in variable places during 11-16 March, including El Patrocinio, San José El Rodeo, the municipality of San Vicente Pacaya (5 km NW), San Francisco de Sales (5 km N), San José el Bejucal (4 km N), San Antonio el Pepinal (7 km N), Concepción El Cedro (9 km NNW), San José Calderas, and the municipalities of Amatitlán (12 km N), Villa Nueva (16 km N), and Mixco (30 km N). Lapilli as long as 2 cm fell in El Patrocinio, San José El Rodeo and Concepción El Cedro on 16 March.
Strombolian explosions and periodic lava fountaining ejected incandescent material as high as 800 m above the summit; tephra fell within a 500 m radius of Mackenney Crater. Explosions and ash emissions also rose from fissures on the S flank, 300 m below Mackenney Crater. The lava flow on the S flank had two branches and was 1 km on 10 March, but had lengthened to 1.8 km by 16 March. Block avalanches from the summit traveled down the S flank.
Sources: Instituto Nacional de Sismologia, Vulcanologia, Meteorologia, e Hidrologia (INSIVUMEH); Coordinadora Nacional para la Reducción de Desastres (CONRED)
INSIVUMEH and CONRED reported that during 2-6 March strong Strombolian explosions at Pacaya’s Mackenney Crater produced ash plumes that rose as high as 1 km above the summit and drifted W, SW, and S. Tephra fell in areas downwind including El Patrocinio (5 km W), El Rodeo (4 km WSW), San Francisco de Sales (5 km N), El Cedro (9 km NNW), Calderas (3 km N), and Las Jazmines (5 km W), and in the municipalities of Palín (10 km WNW) and Escuintla (22 km SW). Periods of lava fountaining were visible, and incandescent material was ejected 300-1,000 m high. Three lava flows were active and all had several branches; one traveled SSW, one traveled S, and one on the SE flank was 800-1,200 m long. During 6-8 March strong explosions ejected material as high as 500 m and produced dense ash plumes that rose up to 1 km. Lava flows continued to be active, sometimes producing block avalanches from the ends. On 8 March the S-flank flow was about 850 m long and continued to generated block avalanches. Strong explosions during 8-9 March ejected ballistics 300-500 m away from the crater. Dense ash plumes rose up to 1.5 km and drifted 30 km SW and S. The lava flow on the S flank was 900 m long and shed blocks from the end.
Sources: Instituto Nacional de Sismologia, Vulcanologia, Meteorologia, e Hidrologia (INSIVUMEH); Coordinadora Nacional para la Reducción de Desastres (CONRED)
INSIVUMEH and CONRED reported that during 23-25 February explosions at Pacaya’s Mackenney Crater ejected incandescent material as high as 200 m. A lava flow, originating from a vent 300 m below the summit crater, was about 1.1 km long and produced incandescent blocks from the flow front that descended 300 m. more intense pulses of activity at the summit produced dense ash plumes that drifted more than 30 km S and SW. Ashfall was noted in areas downwind including Los Pocitos, Pacaya, El Rodeo, and El Patrocinio. Explosions continued during 26-29 February, although weather conditions sometime prevented visual confirmation.
RSAM data values notably increased during the morning of 1 March, reflecting an increase in Strombolian activity. Moderate-to-strong explosions ejected ballistics as high as 500 m above the summit. Ash plumes rose 1 km above the summit and drifted W and SW, causing ashfall at least in El Patrocinio. Incandescent material was ejected 150 m high, and ash plumes drifted W; ashfall was reported in El Patrocinio. The lava flow on the SSW flank was about 700 m long. On 2 March gas and ash plumes rose 150 m and drifted 2 km S. A lava flow on the SSW flank was 150 m long.
Sources: Instituto Nacional de Sismologia, Vulcanologia, Meteorologia, e Hidrologia (INSIVUMEH); Coordinadora Nacional para la Reducción de Desastres (CONRED)
INSIVUMEH reported that seismicity at Pacaya increased around 0900 on 18 February. Incandescent material was ejected 200 m above Mackenney Crater and explosions produced gas-and-ash plumes that rose 450 m and drifted mostly NE and S. An active lava flow on the SSW flank was 1.1 km long and generated hot block avalanches from the flow front. A lava flow emerged on the SW flank on 19 February. During 19-20 February periods of increased activity lasted 3-5 hours; moderate-to-loud explosions were accompanied by rumbling and sounds resembling trains. Ballistics were ejected 300- 500 m from the crater and ash plumes rose as high as 450 m and drifted SW. Ashfall was reported in areas downwind including El Rodeo and El Patrocinio. A lava flow on the S flank was 800 m long and produced incandescent blocks from the flow front that descended 500 m.
Strombolian activity increased on the morning of 20 February but fluctuated throughout the day. Ash plumes, that were dense during periods of heightened activity, rose 450 m and drifted 10-25 km S, SW, and W. As it grew darker lava fountains were visible rising 300-400 m and ballistics were ejected as far as 500 m from the crater. The lava flow on the S flank had lengthened to 1.1 km. Strombolian explosions continued during 21-22 February, ejecting incandescent material 100-175 m high. Ash plumes rose 450-800 m above the summit and drifted possibly as far as 15 km NW, W, and SW, causing ashfall in areas downwind including San Francisco de Sales, El Cedro, El Rodeo, and El Patrocinio. Ballistics were ejected as far as 500 m from the crater. Blocks from the front of the lava flow descended 300 m. Weak explosions during 22-23 February ejected incandescent material as high as 100 m above the summit. A 900-m-long lava flow was active on the SSW flank. Ash plumes drifted 5 km S.
Source: Instituto Nacional de Sismologia, Vulcanologia, Meteorologia, e Hidrologia (INSIVUMEH)
INSIVUMEH reported that a during 9-10 February Strombolian explosions at Pacaya’s Mackenney Crater ejected material 200-300 high and away from the crater. Ash clouds occasionally rose as high as 650 m and drifted 10 km W and SW. A 1.3-km-long lava flow was active on the S flank; block avalanches from the front of the lava flow descended 200 m. Activity increased around 1600 on 10 February. Strombolian explosions ejected incandescent material 500 m above the crater rim and produced gas-and-ash plumes that drifted W. Ashfall was reported in the villages of El Patrocinio (about 5 km W) and El Rodeo (4 km WSW). During 11-12 February material was ejected 300-500 m above the crater. Ash plumes rose 950 m and drifted N, causing ashfall in San Francisco de Sales (5 km N), San Jose Calderas, and Concepción el Cedro (9 km NNW).
Seismic data recorded pulses of increased activity during the morning of 12 February and again around 1400 on 13 February. Explosions ejected material 300-500 m above the crater. Ash-and-gas plumes rose almost 500 m and drifted 6 km W, N, and NE, causing ashfall in Santa Elena Barillas (6 km ENE), Mesillas Bajas (5 km NE), and Mesillas Altas. Another pulse of activity was recorded at 1145 on 14 February. Material was ejected as high as 250 m. Ash plumes rose less than 400 m and drifted 5 km E. A 650-m-long lava flow in the SSW flank was active on 15 February. Explosions continued to ejected material as high as 250 m above the vent.
Source: Instituto Nacional de Sismologia, Vulcanologia, Meteorologia, e Hidrologia (INSIVUMEH)
On 6 February INSIVUMEH reported increased Strombolian activity and a higher number of explosions at Pacaya’s Mackenney Crater. The explosions rattled nearby houses and ejected ballistics as far as 500 m from the crater. Ash plumes rose as high as 650 m above the summit and drifted 5 km W, NW, and N. Ashfall was reported in areas downwind including San Francisco de Sales, El Cedro, Calderas, El Bejucal, and Mesías Altas. Lava effusion also increased and two active lava flows, 800 and 1,200 m long, were advancing. On 8 February ash plumes rose almost 600 m and drifted 30 km NW and W, and 10 km N. Explosions ejected ballistics as far as 300 m from the crater.
Source: Instituto Nacional de Sismologia, Vulcanologia, Meteorologia, e Hidrologia (INSIVUMEH)
Strombolian activity and lava effusion continued at Pacaya during 19-26 January. Explosions from the cone in Mackenney Crater ejected material as high as 200 m above the vent. Occasionally ash plumes rose no higher than 200 m above the summit and drifted as far as 10 km W, SW, and S. Moderate-to-strong Strombolian explosions on 22 January generated ash plumes that drifted NW and caused ashfall in the regions of San Francisco de Sales and San Vicente Pacaya. The explosions rattled nearby structures. Lava flows were active on the S and SW flanks; avalanches from the S flow front reached the base on the volcano and the SW lava flow traveled as far as 1.7 km by 25 January.
Source: Instituto Nacional de Sismologia, Vulcanologia, Meteorologia, e Hidrologia (INSIVUMEH)
INSIVUMEH reported that the lava flow that began on 2 January from a vent on the SW flank, 200 m below Pacaya’s Mackenney Crater, formed 3-4 branches and was 400 m long by 6 January. Avalanches of material descended the W, SW, and S flanks. Strombolian explosions produced ash plumes that rose 100-150 m above the cone and drifted 10 km S and SW. Explosions on 7 January produced ash plumes that rose 300-500 m above the crater and ejected ballistics 300 m away from the crater. Explosions rattled structures in nearby villages. Two new lava flows emerged on the N flank at 0740; one traveled 50 m and the other 200 m. Active lava flows on the W and SW flanks were 550 m long. Overnight during 7-8 January a new lava flow on the SW flank descended 425 m. During 9-12 January Strombolian explosions continued to ejected material up to 300 m above the cone. The lava flow on the SW flank reached a length of 1.2 km on 9 January and 1.5 km by 10 January; it remained active through 12 January. Ash plumes drifted 10 km W during 10-11 January, and avalanches form the crater area descended the SW and S flanks.
Sources: Instituto Nacional de Sismologia, Vulcanologia, Meteorologia, e Hidrologia (INSIVUMEH); Coordinadora Nacional para la Reducción de Desastres (CONRED)
INSIVUMEH reported that Strombolian activity and lava effusion continued at Pacaya during 29 December-5 January. Explosions from the cone in Mackenney Crater ejected material as high as 300 m above the vent and away from the crater. Lava flows on the SW and W flanks were active and varied in length between 400 and 650 m; the lava flow on the SW flank had numerous branches. Activity was most notable on 1 January; gas-and-ash plumes rose 100-300 m above the summit and drifted 10 km NW, and explosions that were sometimes strong rattled nearby houses.
Source: Instituto Nacional de Sismologia, Vulcanologia, Meteorologia, e Hidrologia (INSIVUMEH)
INSIVUMEH reported that on 9 December a new lava flow emerged from a vent S of Cerro Chino, NNW of Pacaya’s summit, and traveled as far as 250 m WSW. The branched lava flow which had opened in October on the WSW flank was active, with lengths between 400 and 600 m. Avalanches of material from the new flow and the SW-flank lava flows descended 100 m. Strombolian explosions from the cone in Mackenney Crater were visible on most days during 9-15 December and ejected material as high as 150 m above the vent. Gray ash plumes were occasionally visible drifting S, SW, and W at generally low altitudes. On 12 December strong winds picked up ash deposits and created ash curtains that drifted 1.5 km away and dispersed. Lava flows on the SW flank varied in length between 500 m and 1,000 m. The NW-flank lava flow ceased effusing by 13 December.
Source: Instituto Nacional de Sismologia, Vulcanologia, Meteorologia, e Hidrologia (INSIVUMEH)
INSIVUMEH reported that Strombolian activity and lava effusion continued at Pacaya during 10-17 November. Explosions from the cone in Mackenney Crater ejected material as high as 300 m above the vent. Lava flows on the SW flank varied in length between 800 and 1,200 m during 11-13 November. Visual observations overnight during 13-14 November revealed a new lava flow from a vent higher up on the SW flank. In a special report issued on 15 November CONRED and INSIVUMEH stated that lava effusion had increased on the SW flank. Avalanches of material traveled as far as 500 m and generated plumes of ash; a white-and-blue gas plume rose 450 m above the summit. Strong explosions at the summit crater ejected material 300 m high. The two parallel flows, 300-1,000 m long, were active through 17 November.
Source: Instituto Nacional de Sismologia, Vulcanologia, Meteorologia, e Hidrologia (INSIVUMEH)
INSIVUMEH reported that Strombolian activity and lava effusion continued at Pacaya during 27 October-3 November. Explosions from the cone in Mackenney Crater ejected material as high as 250 m above the vent. Lava flows were 20 m and 1 km long on the NE and SW flanks, respectively. The lava flow on the NE flank was no longer active by 28 October, though parts of the SW-flank lava flow continued to advance through 3 November.
Source: Instituto Nacional de Sismologia, Vulcanologia, Meteorologia, e Hidrologia (INSIVUMEH)
INSIVUMEH reported that Strombolian activity and lava effusion continued at Pacaya during 7-13 October. Explosions from the cone in Mackenney Crater intensified on 8 October, ejecting material 200-300 m above the vent. At least four lava flows were active on the N and E flanks and all were 250-300 m long. By the next day three lava flows, on the NE, N, and W flanks were 200-400 m long. During 9-13 October explosions ejected material as high as 150 m. Lava flows were periodically active on NE, N, and W flanks, traveling 100-300 m.
Source: Instituto Nacional de Sismologia, Vulcanologia, Meteorologia, e Hidrologia (INSIVUMEH)
On 13 September INSIVUMEH reported that during the previous week activity at Pacaya’s Mackenney Crater was characterized by lava-flow effusion and Strombolian explosions that ejected material as high as 200 m above the vent. Ejected material landed within 50 m of the cone. An active lava flow that had traveled NE was 1,250 m long; another on the N flank was as long as 300 m. Explosive activity rattled houses within a 4-km radius. Lava flows continued to be active during 13-15 September; reaching 600 m long on the NE flank, 300 m long on the N flank, and 400-425 m long (and most active) on the S flank. Strombolian explosions continued to ejected material as high as 200 m.
Source: Instituto Nacional de Sismologia, Vulcanologia, Meteorologia, e Hidrologia (INSIVUMEH)
INSIVUMEH reported that during 26 August-1 September Strombolian explosions at Pacaya’s Mackenney Crater ejected material as high as 150 m above the crater rim. By 30 August lava flows advanced 300 and 650 m on the NE and N flanks, respectively. A continually active 300-m-long lava flow originated from a vent on the NW flank. By 31 August no fumes rose from the NE lava flow, suggesting it was no longer advancing. Two lava flows, 50 and 350 m long, advanced N on 1 September.
Source: Instituto Nacional de Sismologia, Vulcanologia, Meteorologia, e Hidrologia (INSIVUMEH)
INSIVUMEH reported that during 29 July-3 August Strombolian explosions at Pacaya’s Mackenney Crater ejected material as high as 150 m above the crater rim. No active lava flows were visible.
Source: Instituto Nacional de Sismologia, Vulcanologia, Meteorologia, e Hidrologia (INSIVUMEH)
INSIVUMEH reported that during 15-21 July Strombolian explosions at Pacaya’s Mackenney Crater ejected material as high as 100 m above the crater rim. Lava-flow effusion ceased during 14-19 July, though flows may have continued to advance or be active on the SW, NW, N, and NE flanks. On 20 July lava emerged from a fissure or vents at the NW base of the cone, near Cerro Chino, and traveled SE.
Source: Instituto Nacional de Sismologia, Vulcanologia, Meteorologia, e Hidrologia (INSIVUMEH)
INSIVUMEH reported that during 7-14 July Strombolian explosions at Pacaya’s Mackenney Crater ejected material as high as 100 m above the crater rim. Lava flows traveled as far as 1.2 km on the N and NE flanks. Lava flows also headed SW, W, and NW during 13-14 July.
Source: Instituto Nacional de Sismologia, Vulcanologia, Meteorologia, e Hidrologia (INSIVUMEH)
INSIVUMEH reported that during 1-7 July Strombolian explosions at Pacaya’s Mackenney Crater ejected material as high as 100 m above the crater rim; explosions were audible as far away as 5 km during 4-5 July. Lava flows 150-500 m long were active on the N, NW, and SW flanks.
Source: Instituto Nacional de Sismologia, Vulcanologia, Meteorologia, e Hidrologia (INSIVUMEH)
INSIVUMEH reported that during 24-30 June Strombolian explosions at Pacaya’s Mackenney Crater ejected material as high as 200 m above the crater rim and were sometimes audible as far away as 5 km. Lava flows on the SW flank were mostly 100-600 m long but advanced to 2 km by 30 June. Lava advanced to 100 m on the S flank during 25-26 June and to 200 m on the NW flank during 27-29 June.
Source: Instituto Nacional de Sismologia, Vulcanologia, Meteorologia, e Hidrologia (INSIVUMEH)
INSIVUMEH reported that during 17-19 June Strombolian explosions at Pacaya’s Mackenney Crater ejected material as high as 100 m above the crater rim and continued to build a cone in the crater. Active lava flows were 250 m long on the N flank and 200 m long on the S flank by 19 June. In a special report INSIVUMEH noted that increased on 20 June accompanying active lava flows that traveled 650 m SW and 200 m NW by the next day. During 20-23 June Strombolian explosions ejected incandescent material as high as 200 m above the summit and produced ash plumes that rose 100 m. The explosions were heard in areas up to 5 km away.
Source: Instituto Nacional de Sismologia, Vulcanologia, Meteorologia, e Hidrologia (INSIVUMEH)
INSIVUMEH reported that during 19-26 May Strombolian explosions at Pacaya’s Mackenney Crater ejected material as high as 100 m above the crater rim. Active lava flows were 200 m long on the NW flank during 21-22 May and 300 m long on the NE flank during 25-26 May.
Source: Instituto Nacional de Sismologia, Vulcanologia, Meteorologia, e Hidrologia (INSIVUMEH)
INSIVUMEH reported that during 22-28 April Strombolian explosions at Pacaya’s Mackenney Crater ejected material as high as 100 m above the crater rim. Lava flows were active during 26-27 April, traveling about 150 m SW. Seismicity increased at 2140 on 27 April, and a lava flow on the SW flank lengthened to 400 m. Later investigation of a linear “fuming area” on the NE flank identified a forest fire as the cause.
Source: Instituto Nacional de Sismologia, Vulcanologia, Meteorologia, e Hidrologia (INSIVUMEH)
INSIVUMEH reported that during 17-24 March Strombolian explosions at Pacaya’s Mackenney Crater ejected material as high as 100 m above the crater rim. Multiple lava flows (as many as four per day) traveled 100-300 m NW, W, and SW flanks.
Source: Instituto Nacional de Sismologia, Vulcanologia, Meteorologia, e Hidrologia (INSIVUMEH)
INSIVUMEH reported that during 15-21 January Strombolian explosions at Pacaya’s Mackenney Crater ejected material as high as 100 m above the crater rim, building a small cone. Multiple lava flows, some short-lived, traveled as far as 150 m W and S, and down the NW flank towards Cerro Chino.
Source: Instituto Nacional de Sismologia, Vulcanologia, Meteorologia, e Hidrologia (INSIVUMEH)
INSIVUMEH reported that during 20-26 November Strombolian explosions at Pacaya’s Mackenney Crater ejected material as high as 75 m above the crater rim. Lava flows traveled as far as 400 m down NW flank and produced block avalanches from the flow fronts.
Source: Instituto Nacional de Sismologia, Vulcanologia, Meteorologia, e Hidrologia (INSIVUMEH)
A special report from INSIVUMEH noted that seismic activity at Pacaya continued to increase, with RSAM values reaching 8,000 units by 18 September, coincident with an intensification of explosive activity at Mackenney Crater. Explosions from a growing cone in the crater ejected material as high as 100 m above the cone. Lava effusion increased; several lava flows (300-500 m long) advanced on the N and NW flank towards Cerro Chino and produced avalanches of blocks up to 1 m in diameter from the flow fronts. Strombolian explosions during 19-24 September ejected material 5-25 m above the cone, though on 21 September material was ejected as high has 100 m. Two lava flows traveled SW on 21 September.
Source: Instituto Nacional de Sismologia, Vulcanologia, Meteorologia, e Hidrologia (INSIVUMEH)
A special report from INSIVUMEH noted that seismic activity at Pacaya had increased on 8 September, with RSAM values reaching 7,000 units by 13 September, coincident with increased explosive activity at Mackenney Crater. Explosions from a growing cone in the crater ejected material as high as 75 m above the cone. Lava effusion increased; lava flows advancing on the N and NW flank towards Cerro Chino were about 500 m long. Avalanches of blocks up to 1 m in diameter were produced by the flow front. Similar activity was observed during 15-16 September.
Source: Instituto Nacional de Sismologia, Vulcanologia, Meteorologia, e Hidrologia (INSIVUMEH)
INSIVUMEH reported that during 28 August-3 September Strombolian explosions at Pacaya’s Mackenney Crater ejected material as high as 30 m above the crater rim. Lava flows on the N and NNW flanks continued to advance, producing minor avalanches from the flow fronts.
Source: Instituto Nacional de Sismologia, Vulcanologia, Meteorologia, e Hidrologia (INSIVUMEH)
INSIVUMEH reported that during 17-23 July Strombolian explosions at Pacaya’s Mackenney Crater ejected material as high as 25 m above the crater rim. As many as four lava flows traveled down the NW and N flanks; two of the flows were 300 m long. Minor avalanches of material from the lava flow fronts descended the flanks.
Source: Instituto Nacional de Sismologia, Vulcanologia, Meteorologia, e Hidrologia (INSIVUMEH)
INSIVUMEH reported that during 15-18 June Strombolian explosions at Pacaya’s Mackenney Crater ejected material as high as 30 m above the crater rim. A lava flow divided into two branches and traveled 300 m down the NW and W flanks, advancing towards Cerro Chino. Minor avalanches of material from lava flow fronts descended the flanks.
Source: Instituto Nacional de Sismologia, Vulcanologia, Meteorologia, e Hidrologia (INSIVUMEH)
INSIVUMEH reported that during 28 March-1 April Strombolian explosions at Pacaya’s Mackenney Crater ejected material as high as 75 m above the crater rim. A lava flow traveled down the N flank, producing minor avalanches of material from the lava-flow front.
Source: Instituto Nacional de Sismologia, Vulcanologia, Meteorologia, e Hidrologia (INSIVUMEH)
INSIVUMEH reported that during 7-12 February Strombolian explosions at Pacaya’s Mackenney Crater ejected material as high as 25 m above the crater rim. Multiple lava flows traveled 10-250 m down the NW flank, advancing towards Cerro Chino, and on the E flank. Minor avalanches of material from lava-flow fronts descended the flanks.
Source: Instituto Nacional de Sismologia, Vulcanologia, Meteorologia, e Hidrologia (INSIVUMEH)
In a special notice posted on 13 December INSIVUMEH reported that rumbling at Pacaya was heard within a radius of 8 km, and weak Strombolian explosions at Mackenney Crater ejected material as high as 50 m above the crater rim. Active lava flows were 200-300 m in length and traveled down the NW flank, generating avalanches of blocks that were as large as 1 m in diameter. The report also noted that the cone in the crater continued to grow, filling the crater, and was 75 m above the crater rim. During 15-16 December lava continued to flow NW and Strombolian explosions ejected material 5-25 m high.
Source: Instituto Nacional de Sismologia, Vulcanologia, Meteorologia, e Hidrologia (INSIVUMEH)
INSIVUMEH reported that during 24-27 November Strombolian explosions at Pacaya’s Mackenney Crater ejected material as high as 25 m above the crater rim. As many as three lava flows were active on the NW flanks, advancing towards Cerro Chino. Minor avalanches of material descended the SE flank during 26-27 November.
Source: Instituto Nacional de Sismologia, Vulcanologia, Meteorologia, e Hidrologia (INSIVUMEH)
INSIVUMEH reported that during 11-15 October Strombolian explosions at Pacaya’s Mackenney Crater ejected material as high as 25 m above the crater rim, and gas plumes rose 200-700 m. A lava flow that first emerged on 11 October traveled NW towards Cerro Chino, and by 15 October was 250 m long.
Source: Instituto Nacional de Sismologia, Vulcanologia, Meteorologia, e Hidrologia (INSIVUMEH)
INSIVUMEH reported that during 17-18, 20-21, and 24-25 September Strombolian explosions at Pacaya’s Mackenney Crater ejected material as high as 25 m above the crater rim. As many as four lava flows originating from Mackenney Crater traveled 50-250 m NW.
Source: Instituto Nacional de Sismologia, Vulcanologia, Meteorologia, e Hidrologia (INSIVUMEH)
Based on information from INSIVUMEH, CONRED reported a slight increase in explosive activity at Pacaya, with 3-5 explosions per hour recorded by the seismic network. A 600-m-long lava flow originating from Mackenney Crater was visible on NW flank.
Source: Instituto Nacional de Sismologia, Vulcanologia, Meteorologia, e Hidrologia (INSIVUMEH)
INSIVUMEH reported that during 12-14 August Strombolian explosions at Pacaya’s Mackenney Crater ejected material as high as 30 m above the crater rim. A 300-m-long lava flow originating from Mackenney Crater was visible on NW flank.
Source: Instituto Nacional de Sismologia, Vulcanologia, Meteorologia, e Hidrologia (INSIVUMEH)
INSIVUMEH reported that during 19-20 and 23-24 July Strombolian explosions at Pacaya’s Mackenney Crater ejected material as high as 30 m above the crater rim. A 200-m-long lava flow originating from Mackenney Crater was visible on NW flank.
Source: Instituto Nacional de Sismologia, Vulcanologia, Meteorologia, e Hidrologia (INSIVUMEH)
INSIVUMEH reported that during 5-10 July Strombolian explosions at Pacaya’s Mackenney Crater ejected material as high as 30 m above the crater rim. White gas plumes drifted SW. A lava flow originating from Mackenney Crater traveled 500 m down the N flank during 7-8 July, reaching the volcano’s base.
Source: Instituto Nacional de Sismologia, Vulcanologia, Meteorologia, e Hidrologia (INSIVUMEH)
INSIVUMEH reported that during 28-29 June and 1-3 July Strombolian explosions at Pacaya’s Mackenney Crater ejected material as high as 30 m above the crater rim. White gas plumes drifted S.
Source: Instituto Nacional de Sismologia, Vulcanologia, Meteorologia, e Hidrologia (INSIVUMEH)
INSIVUMEH and CONRED reported that during 13 and 16-18 June Strombolian explosions at Pacaya’s Mackenney Crater ejected material as high as 50 m above the crater rim. An ash plume rose 3.5 km above the summit and drifted 10 km N and NE.
Sources: Instituto Nacional de Sismologia, Vulcanologia, Meteorologia, e Hidrologia (INSIVUMEH); Coordinadora Nacional para la Reducción de Desastres (CONRED)
INSIVUMEH and CONRED reported that on 6 June a lava flow emerged from a vent on La Meseta (the Mesa) on Pacaya’s NW flank and traveled 200 m over a period of six hours. Strombolian explosions ejected material as high as 50 m above the crater rim during 7-10 June.
Sources: Instituto Nacional de Sismologia, Vulcanologia, Meteorologia, e Hidrologia (INSIVUMEH); Coordinadora Nacional para la Reducción de Desastres (CONRED)
INSIVUMEH reported that during 1-2 May Strombolian explosions at Pacaya’s Mackenney Crater ejected material as high as 50 m above the crater rim. A 500-m-long lava flow advanced NW towards Cerro Chino. Nighttime crater incandescence was visible, and rumbling was heard in areas within 2-3 km. Activity increased on 4 May, with explosions ejecting tephra as high as 80 m. The lava flow continued to advance and by 6 May was 600 m long. Strombolian explosions ejected material 15 m above the crater rim, and nighttime incandescence continued to be present.
Source: Instituto Nacional de Sismologia, Vulcanologia, Meteorologia, e Hidrologia (INSIVUMEH)
INSIVUMEH and CONRED reported that during 27-28 April seismicity at Pacaya had increased, and moderate-to-strong explosions ejected material as high as 150 m above the crater rim. Lava originating from the 2010 fissure traveled about 500 m NW, towards Cerro Chino. The report noted that ejected material has filled the crater.
Sources: Instituto Nacional de Sismologia, Vulcanologia, Meteorologia, e Hidrologia (INSIVUMEH); Coordinadora Nacional para la Reducción de Desastres (CONRED)
INSIVUMEH reported increased activity at Pacaya’s Mackenney Crater during 18-19 April. Strombolian explosions ejected material as high as 50 m above the crater rim, and four lava flows traveled 200-500 m down the SW, W, and NW flanks. Strombolian explosions continued to be detected during 21-23 April.
Source: Instituto Nacional de Sismologia, Vulcanologia, Meteorologia, e Hidrologia (INSIVUMEH)
INSIVUMEH reported that during 7-10 April Strombolian explosions at Pacaya’s Mackenney Crater ejected material as high as 40 m above the crater rim. Lava flows had traveled 250 m down the NW flank, 200 m down the W flank, and 150 m down the SW flank.
Source: Instituto Nacional de Sismologia, Vulcanologia, Meteorologia, e Hidrologia (INSIVUMEH)
INSIVUMEH reported that during 27-28 February and 3-5 March Strombolian explosions at Pacaya’s Mackenney Crater ejected material as high as 20 m above the main cone. Lava flows [advanced to 250 m elevation].
Source: Instituto Nacional de Sismologia, Vulcanologia, Meteorologia, e Hidrologia (INSIVUMEH)
INSIVUMEH reported that during 7-13 February Strombolian explosions at Pacaya’s Mackenney Crater ejected material 30 m above the main cone. Lava flows were at most 150 m long on the SW and W flanks.
Source: Instituto Nacional de Sismologia, Vulcanologia, Meteorologia, e Hidrologia (INSIVUMEH)
INSIVUMEH reported that during 18-19 January Strombolian explosions at Pacaya’s Mackenney Crater ejected material 25 m above the main cone. In a special report from 20 January INSIVUMEH noted that the Strombolian activity had been cyclically building and destroying a cone within the crater. Scientists at the Observatorio del Volcan de Pacaya (OVPAC) observed a 400-m-long lava flow descending the W flank, spalling off material from the front. Strombolian explosions continued during 20-21 January, and a 200-m-long lava flow was advancing down the SW flank.
Source: Instituto Nacional de Sismologia, Vulcanologia, Meteorologia, e Hidrologia (INSIVUMEH)
INSIVUMEH reported that during 4-9 January Strombolian explosions at Pacaya’s Mackenney cone ejected material as high as 50 m above the main cone.
Source: Instituto Nacional de Sismologia, Vulcanologia, Meteorologia, e Hidrologia (INSIVUMEH)
INSIVUMEH reported continuing Strombolian explosions at Pacaya’s Mackenney cone during 31 December 2017-1 January 2018.
Source: Instituto Nacional de Sismologia, Vulcanologia, Meteorologia, e Hidrologia (INSIVUMEH)
INSIVUMEH reported that during 24-26 December Strombolian explosions at Pacaya’s Mackenney cone ejected material as high as 50 m above the main cone. A 100-m-long lava flow on the W flank was visible.
Source: Instituto Nacional de Sismologia, Vulcanologia, Meteorologia, e Hidrologia (INSIVUMEH)
INSIVUMEH reported that during 12-19 December Strombolian explosions at Pacaya’s Mackenney cone ejected material as high as 100 m above the main cone. A 75-m-long lava flow on the NW flank was visible.
Source: Instituto Nacional de Sismologia, Vulcanologia, Meteorologia, e Hidrologia (INSIVUMEH)
INSIVUMEH reported that during 9-12 December Strombolian explosions at Pacaya’s Mackenney cone ejected material as high as 25 m above the main cone. Lava flows traveled 100 m NW towards Cerro Chino cone, and 75 m SE.
Source: Instituto Nacional de Sismologia, Vulcanologia, Meteorologia, e Hidrologia (INSIVUMEH)
On 28 November INSIVUMEH reported that 6-8 Strombolian explosions per hour at Pacaya’s Mackenney cone ejected material as high as 25 m above the main cone. A lava flow traveled 30 m down the NW flank of the cone.
Source: Instituto Nacional de Sismologia, Vulcanologia, Meteorologia, e Hidrologia (INSIVUMEH)
INSIVUMEH reported that during 4-7 November Strombolian explosions at Pacaya’s Mackenney cone ejected material as high as 40 m above the crater rim.
Source: Instituto Nacional de Sismologia, Vulcanologia, Meteorologia, e Hidrologia (INSIVUMEH)
INSIVUMEH reported that during 13-14 October Strombolian explosions at Pacaya’s Mackenney cone ejected material as high as 25 m above the crater rim.
Source: Instituto Nacional de Sismologia, Vulcanologia, Meteorologia, e Hidrologia (INSIVUMEH)
INSIVUMEH reported that during 21-22 September Strombolian explosions at Pacaya’s Mackenney cone ejected material as high as 100 m above the crater rim. During 23-24 September the seismic network recorded Strombolian explosion signals.
Source: Instituto Nacional de Sismologia, Vulcanologia, Meteorologia, e Hidrologia (INSIVUMEH)
INSIVUMEH reported that during 21-28 August Strombolian explosions at Pacaya’s Mackenney cone ejected material as high as 75 m above the crater rim, and during 27-28 August as far as 100 m onto the W flank. Cloud cover sometimes prevented visual observations; explosions could be heard within a 5-km radius.
Source: Instituto Nacional de Sismologia, Vulcanologia, Meteorologia, e Hidrologia (INSIVUMEH)
INSIVUMEH reported that during 20-22 August Strombolian explosions at Pacaya’s Mackenney cone ejected material as high as 75 m above the crater rim and onto the flanks, generating avalanches mainly on the W flank.
Source: Instituto Nacional de Sismologia, Vulcanologia, Meteorologia, e Hidrologia (INSIVUMEH)
On 12 August INSIVUMEH reported that Strombolian explosions at Pacaya’s Mackenney cone were observed. During 12-13 August the number of Strombolian explosions increased to a rate of 5-7 per hour, and ejected incandescent material was mainly visible at night. Explosions vibrated structures in communities within a 5-km radius. Activity continued at a similar level on 15 August.
Source: Instituto Nacional de Sismologia, Vulcanologia, Meteorologia, e Hidrologia (INSIVUMEH)
INSIVUMEH reported nighttime crater incandescence and small Strombolian explosions at Pacaya’s Mackenney cone during 27-28 May.
Source: Instituto Nacional de Sismologia, Vulcanologia, Meteorologia, e Hidrologia (INSIVUMEH)
INSIVUMEH reported that incandescence from Pacaya’s Mackenney cone was visible at night and at dawn during 6-11 April. Weak explosions accompanied by rumbling was sometimes noted.
Source: Instituto Nacional de Sismologia, Vulcanologia, Meteorologia, e Hidrologia (INSIVUMEH)
In a special report from 24 March INSIVUMEH noted that lava fountains 25-50 m high rose from a new cone forming in the crater of Pacaya’s Mackenney’s cone. The accumulated material had been filling up the cone, causing lava to flow through the crater breach formed in 2010. During 25-28 March small Strombolian explosions ejected material as high as 30 m above the cone.
Source: Instituto Nacional de Sismologia, Vulcanologia, Meteorologia, e Hidrologia (INSIVUMEH)
INSIVUMEH reported small Strombolian explosions at Pacaya’s Mackenney during 16-20 March. Lava traveled 30 m W, and sometimes crater incandescence was visible at night and at dawn.
Source: Instituto Nacional de Sismologia, Vulcanologia, Meteorologia, e Hidrologia (INSIVUMEH)
INSIVUMEH reported that during 2-3 and 6-7 March weak Strombolian explosions at Pacaya’s Mackenney cone ejected material 5-10 m above the crater rim. Crater incandescence was visible at night and at dawn during 4-5 March.
Source: Instituto Nacional de Sismologia, Vulcanologia, Meteorologia, e Hidrologia (INSIVUMEH)
INSIVUMEH reported that during 21-28 February weak Strombolian explosions at Pacaya’s Mackenney cone ejected material as high as 20 m above the crater rim. Lava flows traveled 150 m NW towards Cerro Chino cone, and 75 m W.
Source: Instituto Nacional de Sismologia, Vulcanologia, Meteorologia, e Hidrologia (INSIVUMEH)
INSIVUMEH reported that during 14-21 February small Strombolian explosions at Pacaya’s Mackenney cone periodically generated small lava flows (200 m long on 21 February) that were active for hours at a time. CONRED noted that at night on 15 February residents in Los Positos in Villa Canales (13 km NE), and in Mesillas Altas and Bajas in Amatitlán (12 km N) reported vibrations and rumbling.
Source: Instituto Nacional de Sismologia, Vulcanologia, Meteorologia, e Hidrologia (INSIVUMEH)
On 9 February INSIVUMEH reported that moderate explosions at Pacaya’s Mackenney cone had been detected during the previous few days. Incandescent material was ejected 30-50 m high and filled a large part of the crater; lava spilled over the crater rim and traveled 300 m down the NW flank. Incandescent material was ejected as high as 30 m during 11-12 February. Small Strombolian explosions were visible on 13 February. The lava flow continued to advance the next day.
Source: Instituto Nacional de Sismologia, Vulcanologia, Meteorologia, e Hidrologia (INSIVUMEH)
INSIVUMEH reported that at night during 21-22 January incandescence was reflected from emissions above Pacaya’s Mackenney cone. In a 24 January report, INSIVUMEH noted that gas-and-ash emissions had continued, with deposits filling in the crater on top of the cone. Nighttime incandescence continued to be observed.
Source: Instituto Nacional de Sismologia, Vulcanologia, Meteorologia, e Hidrologia (INSIVUMEH)
INSIVUMEH reported that during 23-24 July Strombolian explosions at Pacaya's Mackenney cone ejected material 75 m above the crater. During 24-26 July blue and white fumarolic plumes drifted S and N, and faint crater incandescence was visible at night and in the early morning.
Source: Instituto Nacional de Sismologia, Vulcanologia, Meteorologia, e Hidrologia (INSIVUMEH)
INSIVUMEH reported some weak explosions and fumarolic emissions at Pacaya during 16-18 July. Incandescence from the crater was visible at night or early in the morning.
Source: Instituto Nacional de Sismologia, Vulcanologia, Meteorologia, e Hidrologia (INSIVUMEH)
INSIVUMEH reported that Strombolian explosions from Pacaya's Mackenney cone were observed during 7-10 July. During 11-12 July weather conditions prevented visual observations of the crater, although weak crater incandescence was visible at night.
Source: Instituto Nacional de Sismologia, Vulcanologia, Meteorologia, e Hidrologia (INSIVUMEH)
Based on visual observations and seismic data, INSIVUMEH reported that gas plumes rose from Pacaya during 30 June-5 July. Incandescence from the crater was visible at night.
Source: Instituto Nacional de Sismologia, Vulcanologia, Meteorologia, e Hidrologia (INSIVUMEH)
INSIVUMEH reported that the seismic network at Pacaya recorded weak explosions during 23-28 June. During 23-25 June blue and white fumarolic plumes rose 100 m and drifted S and SW. Faint incandescence from the crater was visible on some nights; abundant incandescence was noted during 27-28 June.
Source: Instituto Nacional de Sismologia, Vulcanologia, Meteorologia, e Hidrologia (INSIVUMEH)
On 15 June CONRED reported that activity at Pacaya had increased, characterized by an increase in seismic amplitude, signals indicating explosions, and nighttime crater incandescence; based on INSIVUMEH notices, the activity continued through 23 June.
Sources: Coordinadora Nacional para la Reducción de Desastres (CONRED); Instituto Nacional de Sismologia, Vulcanologia, Meteorologia, e Hidrologia (INSIVUMEH)
INSIVUMEH reported that during 30 September-1 October and 3-6 October fumarolic plumes rose from Pacaya's Mackenney cone and drifted S. Low-frequency tremor was detected and incandescence from the crater was visible at night. Weak explosions were detected during 5-6 October.
Source: Instituto Nacional de Sismologia, Vulcanologia, Meteorologia, e Hidrologia (INSIVUMEH)
INSIVUMEH reported that during 17-19 September white-and-blue fumarolic plumes rose from Pacaya's Mackenney cone and drifted W and S. Tremor was detected and incandescence from the crater was visible at night. Weak explosions on 22 September generated an ash plume that rose 900 m above the crater and drifted W. Tremor continued to be recorded.
Source: Instituto Nacional de Sismologia, Vulcanologia, Meteorologia, e Hidrologia (INSIVUMEH)
CONRED reported that tremor at Pacaya which began on 16 June continued to be elevated at least through 18 August. INSIVUMEH reported that white-and-blue gas plumes were accompanied by a small gas emission on 1 September; the plume drifted W.
Sources: Coordinadora Nacional para la Reducción de Desastres (CONRED); Instituto Nacional de Sismologia, Vulcanologia, Meteorologia, e Hidrologia (INSIVUMEH)
INSIVUMEH reported a gradual increase of tremor amplitude at Pacaya during 17-18 June. Observers noted that small ash ejections from Mackenney cone were dispersed around the crater. Tremor continued to be detected during 20-22 June. Ash emissions continued to be confined to the crater area during 21-22 June, and incandescence from the crater was visible at night.
Source: Instituto Nacional de Sismologia, Vulcanologia, Meteorologia, e Hidrologia (INSIVUMEH)
INSIVUMEH reported that during 7-8 June white and blue fumarolic plumes rose above Pacaya's Mackenney cone. Ash emissions were observed about every 3-4 hours, and the seismic network detected signals indicating collapsed within the crater along with ash emissions.
Source: Instituto Nacional de Sismologia, Vulcanologia, Meteorologia, e Hidrologia (INSIVUMEH)
INSIVUMEH reported that during 12-13 February a series of weak explosions from Pacaya's Mackenney Crater generated dark gray ash plumes that rose 500-700 m above the crater and, along with fumarolic plumes, drifted 1.5 km S. During 14-15 February weak explosions continued to generate ash plumes; ash and fumarolic plumes drifted 800 m SE. The next day fumarolic and ash plumes drifted S and SW at a low altitude. During 16-17 February fumarolic plumes with small amounts of ash rose 100 m and drifted E.
Source: Instituto Nacional de Sismologia, Vulcanologia, Meteorologia, e Hidrologia (INSIVUMEH)
INSIVUMEH reported that during 5-10 February fumarolic plumes from Pacaya's Mackenney Crater drifted 700-800 m S and SW.
Source: Instituto Nacional de Sismologia, Vulcanologia, Meteorologia, e Hidrologia (INSIVUMEH)
In a special notice INSIVUMEH reported that on 28 January ash emissions originating from Pacaya's Mackenney Crater drifted 4 km S and SW. During field observations, scientists saw a defined central crater, 40-50 m in diameter, and ash emissions. Gas plumes rose from an area on the S flank. Seismic data was characterized by tremor and low-frequency events. In a report from 1 February, INSIVUMEH stated that low-altitude water vapor plumes with minor amounts of ash drifted W and SW. During 1-2 February fumarolic plumes rose 50 m and drifted 600 m S.
Source: Instituto Nacional de Sismologia, Vulcanologia, Meteorologia, e Hidrologia (INSIVUMEH)
In a special notice from 14 January INSIVUMEH reported that seismic data indicated weak ash emissions at Pacaya's Mackenney Crater during recent days. White and blue fumarolic plumes drifted S during 16-20 January, and seismic data continued to indicate small-to-moderate explosions.
Source: Instituto Nacional de Sismologia, Vulcanologia, Meteorologia, e Hidrologia (INSIVUMEH)
During 10-16 September INSIVUMEH reported that a weak fumarolic plume was frequently visible rising 50-75 m above the summit of Pacaya. The plume tended to drift 500-600 m S, SW, and W. On 14 September, B-type earthquakes were detected associated with gas emissions.
Source: Instituto Nacional de Sismologia, Vulcanologia, Meteorologia, e Hidrologia (INSIVUMEH)
During 3-9 September INSIVUMEH reported that a weak fumarolic plume was frequently visible rising to 50 m above the summit. The plume tended to drift 400-500 m E and SW. On 4 September, B-type earthquakes were detected associated with gas emissions.
Source: Instituto Nacional de Sismologia, Vulcanologia, Meteorologia, e Hidrologia (INSIVUMEH)
INSIVUMEH reported that during 27 August-2 September white and blueish white fumarolic plumes rose 50-75 m above Mackenney Crater at Pacaya and drifted 400-500 m E, S, W and SW. On 28 August small plumes of gray ash rose 200-600 m above the crater and drifted S and SW.
Source: Instituto Nacional de Sismologia, Vulcanologia, Meteorologia, e Hidrologia (INSIVUMEH)
INSIVUMEH reported that during 20-26 August white and blueish white fumarolic plumes rose 50-150 m above Mackenney Crater at Pacaya and drifted 500-800 m S and SW. On 25 August small bursts of gray ash rose 300-700 m above the crater and drifted S.
Source: Instituto Nacional de Sismologia, Vulcanologia, Meteorologia, e Hidrologia (INSIVUMEH)
INSIVUMEH reported that during 13-19 August white and blueish white fumarolic plumes rose 50 m above Mackenney Crater at Pacaya and drifted 400-500 m NW, W, SW, and S.
Source: Instituto Nacional de Sismologia, Vulcanologia, Meteorologia, e Hidrologia (INSIVUMEH)
INSIVUMEH reported that during 6-12 August white fumarolic plumes rose 50-75 m above Mackenney Crater at Pacaya and drifted 400-500 m NW, W, SW, and S.
Source: Instituto Nacional de Sismologia, Vulcanologia, Meteorologia, e Hidrologia (INSIVUMEH)
INSIVUMEH reported that during 30 July-5 August, white to light blue fumarolic plumes rose 50 m above Mackenney Crater at Pacaya and drifted up to 600 m W, SW, and S.
Source: Instituto Nacional de Sismologia, Vulcanologia, Meteorologia, e Hidrologia (INSIVUMEH)
INSIVUMEH reported that during 23-29 July white to white-and-blue fumarolic plumes rose 50-75 m above Mackenney Crater at Pacaya and drifted up to 800 m NW, W, SW, and S.
Source: Instituto Nacional de Sismologia, Vulcanologia, Meteorologia, e Hidrologia (INSIVUMEH)
INSIVUMEH reported that during 16-22 July, white to white-and-blue fumarolic plumes rose 50-75 m above Mackenney Crater at Pacaya and drifted up to 600 m W, SW, and S.
Source: Instituto Nacional de Sismologia, Vulcanologia, Meteorologia, e Hidrologia (INSIVUMEH)
INSIVUMEH reported that on most days during 30 June-13 July, fumarolic plumes rose above Pacaya and drifted up to 1 km W, SW, and S. Associated seismicity was notable on 4, 6, 9-11, and 13 July. Elevated seismicity on 10 July corresponded to minor explosions from Mackenney Crater.
Source: Instituto Nacional de Sismologia, Vulcanologia, Meteorologia, e Hidrologia (INSIVUMEH)
INSIVUMEH reported that on most days during 25-29 June [fumarolic plumes] rose 50 m above Pacaya and drifted 400-500 m N and S.
Source: Instituto Nacional de Sismologia, Vulcanologia, Meteorologia, e Hidrologia (INSIVUMEH)
INSIVUMEH reported that during 9-10 April an explosion from Pacaya generated an ash plume that rose 50 m and drifted 1 km SSE. During 9-11 and 13-15 April white plumes from Mackenney Crater drifted S and N.
Source: Instituto Nacional de Sismologia, Vulcanologia, Meteorologia, e Hidrologia (INSIVUMEH)
INSIVUMEH reported that during 6-7 and 9-10 March small explosions from Pacaya generated diffuse ash plumes. Minor avalanches descended the W flank. During 8-9 March lava flows were active, and white and gray steam plumes rose 200 m above the crater and drifted SE.
Source: Instituto Nacional de Sismologia, Vulcanologia, Meteorologia, e Hidrologia (INSIVUMEH)
INSIVUMEH reported that during 27-28 February gas-and-vapor plumes from Pacaya rose 400-500 m above the crater. Ejected tephra drifted 600 m S and SW. INSIVUMEH and CONRED noted increased activity on 2 March; at 0515 Strombolian activity at Mackenney Crater ejected material as high as 800 m and lava flows descended the W flank. Explosions produced dense ash plumes that rose 2.5 km and drifted 15 km S, SW, and W. Ashfall was reported in El Rodeo (4 km WSW), Patrocinio (about 5 km W), and Francisco de Sales (5 km N). By the next day activity had decreased, but lava flows traveled as far as 1.3 km S. Ejected tephra again drifted 600 m S and SW.
Source: Instituto Nacional de Sismologia, Vulcanologia, Meteorologia, e Hidrologia (INSIVUMEH)
INSIVUMEH reported that during 16-20 January gas plumes rose from Pacaya and a lava flow on the S flank remained active. A report on 21 January noted that the S-flank lava flow was 3.6 km long and continued to slowly advance, burning vegetation between the Rodeo and Los Pocitos roads. Volcanologists observed that the cone in Mackenney Crater had been completely destroyed, leaving a deep crater that produced fumarolic activity.
Source: Instituto Nacional de Sismologia, Vulcanologia, Meteorologia, e Hidrologia (INSIVUMEH)
INSIVUMEH reported that during 9-10 January explosions at Pacaya ejected lapilli up to 70 m above the crater. White and blue fumarolic plumes drifted SE, and the seismographs recorded constant tremor. On 11 January Strombolian activity was observed, and new craters on the E, S, and W flanks produced lava flows as long as 1.5 km. Activity from the main crater increased; explosions ejected tephra 75 m high and gas plumes rose 200-600 m. CONRED reported evacuations from Villa Canales (14 km NW), El Chupadero (2-2.5 km S), and San Vicente Pacaya (5 km NW). INSIVUMEH noted that RSAM values decreased throughout the day. Activity further decreased on 12 January. Explosions ejected tephra 100 m above the crater and gas plumes rose 200-300 m. Lava effusion, Strombolian activity, and seismicity declined. During 12-13 January lava effusion remained low and lava flows reached 2.8-3 km long. Bluish-white gas plumes rose 300 m. During 13-14 January Strombolian activity ejected lapilli as high as 70 m, and blue and white plumes drifted S.
Sources: Instituto Nacional de Sismologia, Vulcanologia, Meteorologia, e Hidrologia (INSIVUMEH); Coordinadora Nacional para la Reducción de Desastres (CONRED)
INSIVUMEH reported increased Strombolian activity at Pacaya on 5 December. A series of explosions at MacKenney Crater generated ash plumes that rose 2.7 km and drifted 3-5 km, and ejected pyroclastic material that was deposited around the cone. During 8-9 December weak explosions were occurring every 5 seconds, with moderate explosions occurring every minute that ejected bombs and lapilli. Diffuse blue gas plumes drifted SE. During 9-10 December blue gas plumes rose 700 m and drifted W. Tephra was ejected 25 m above the crater.
Source: Instituto Nacional de Sismologia, Vulcanologia, Meteorologia, e Hidrologia (INSIVUMEH)
On 28 November INSIVUMEH reported that activity at Pacaya remained unchanged; weak explosions, gas emissions, and the ejection of tephra continued. Pilots reported that ash plumes rose 2.5-2.7 km and drifted 10 km SW.
Source: Instituto Nacional de Sismologia, Vulcanologia, Meteorologia, e Hidrologia (INSIVUMEH)
INSIVUMEH reported that during 10-11 September explosions at Pacaya generated diffuse ash plumes that rose 150 m and drifted 150 m NW. There were no direct visual observations during 11-12 September, though the seismic network recorded tremor and small explosions. Explosions during 12-13 September ejected material 50-100 m high. White and blue plumes rose 300 m and drifted N. In a special notice on 13 September INSIVUMEH noted that the cone in MacKenney Crater had already grown above the crater rim; incandescence from the cone was visible from many areas around the volcano, including the capital.
Weak-to-moderate explosions generated rumbling during 14-15 September. An increased number of explosions were detected during 15-16 September. Material was ejected above the crater and ash plumes drifted 3 km W and SW. The seismic network recorded tremor and explosions that occurred about every 5 minutes.
Source: Instituto Nacional de Sismologia, Vulcanologia, Meteorologia, e Hidrologia (INSIVUMEH)
INSIVUMEH reported that on 26 August Strombolian explosions from Pacaya's MacKenney Crater ejected incandescent material 50 m above the crater. Seismicity remained high. During 26-27 August explosions were detected at intervals between 10 seconds and 4 minutes. Incandescent material was ejected 75 m high. A lava flow 150-200 m long was active on the W flank.
Source: Instituto Nacional de Sismologia, Vulcanologia, Meteorologia, e Hidrologia (INSIVUMEH)
INSIVUMEH reported that during 13-14 August the seismic network at Pacaya recorded weak tremor and explosions, although no ash plumes were observed. Incandescence from the crater was visible at night during 14-15 August. White and blue plumes rose from the crater on 15 August. A Strombolian eruption occurred on 16 August from 1915 to 2245, producing a 300-m-long lava flow that traveled W from MacKenney Crater. The seismic network recorded a few gas explosions and intermittent tremor during 17-18 August. Seismicity increased on 19 August; tremor and explosions were detected. On 20 August white plumes rose to low heights and drifted N.
Source: Instituto Nacional de Sismologia, Vulcanologia, Meteorologia, e Hidrologia (INSIVUMEH)
INSIVUMEH reported that during 7-8 August white vapor plumes rose 200 m above Pacaya and drifted E. On 9 August seismicity increased, and Strombolian explosions ejected tephra 200 m above MacKenney Crater and onto the flanks, 400 m away from crater. The next day the number and magnitudes of explosions increased, and seismic signals indicating fluid movement were recorded. Tephra was again ejected 400 m away from MacKenney Crater, causing small avalanches of volcanic material on the flanks. On 12 August fumarolic plumes rose 50 m. Cloud cover prevented observations of the crater on 13 August; however, the seismic network recorded a few gas explosions and tremor.
Source: Instituto Nacional de Sismologia, Vulcanologia, Meteorologia, e Hidrologia (INSIVUMEH)
In a special bulletin on 24 July, INSIVUMEH noted that the eruption at Pacaya had been changing during the previous few days, especially the seismic pattern. Seismic signals indicating explosions and ejections of material lasted up to seven minutes; the events were low frequency and long duration. The cone continued to grow and was 30 m high earlier in the week. By 24 July the cone was 4 m above the MacKenney crater rim. Seismicity again increased. On 25 July weak explosions and incandescence from the cone were observed at night. Rumbling was heard. On 29 July incandescence from the crater was observed for a few hours in the morning, and a plume rose at most 100 m and drifted S. An eruption on 30 July included a high-energy phase that lasted for four hours and incandescent material that was ejected 250 m above the cone. A diffuse ash plume drifted 2 km N, causing ashfall in areas downwind, and another ash plume drifted 5 km S. Activity then declined considerably; explosions were not observed and seismicity decreased, although signals indicating fluid movement continued to be detected.
Source: Instituto Nacional de Sismologia, Vulcanologia, Meteorologia, e Hidrologia (INSIVUMEH)
INSIVUMEH reported that blue-colored emissions from Pacaya were visible drifting SW and W at low altitudes on 26 June. Strombolian activity was observed from MacKenney cone the following day; weak-to-moderate explosions ejected small amounts of tephra 8 m above the crater that were then deposited on the W flank. Audible explosions were noted up to 5 km away. Incandescence was visible at night on 27 June. White fumarolic plumes rose 300 m above the cone on 28 and 30 June; white and blue fumarolic plumes drifted SW during 1-2 July. A recent investigation of MacKenney cone determined that a 15 m high cone had been the source of recent explosive activity.
Source: Instituto Nacional de Sismologia, Vulcanologia, Meteorologia, e Hidrologia (INSIVUMEH)
INSIVUMEH reported that incandescence from Pacaya's crater was observed late at night on 28 May. Weather conditions prevented observations the next day. On 30 May a small effusive eruption occurred for about two hours. A small explosion ejected ash and lapilli 200 m above the crater that was then deposited within 400 m of the crater. Inclement weather prevented observations the rest of the day; however, the seismic network detected tremor and weak explosions.
Source: Instituto Nacional de Sismologia, Vulcanologia, Meteorologia, e Hidrologia (INSIVUMEH)
INSIVUMEH reported that during 22-23 May weak Strombolian activity at Pacaya's MacKenney cone was detected by the seismic network. On 24 May white plumes rose 600 m and drifted S. In a special bulletin on 25 May, INSIVUMEH noted that the eruptive pattern had changed during the previous few days. Explosions were more continuous and energetic, and were detected 3-5 minutes apart. Explosions ejected bombs and generated rumbles heard 4 km away. Cloud cover mostly prevented views on 27 May, but blue gas plumes were observed. Occasional weak glow from the crater was observed on 28 May.
Source: Instituto Nacional de Sismologia, Vulcanologia, Meteorologia, e Hidrologia (INSIVUMEH)
INSIVUMEH reported that weak incandescence from Pacaya's MacKenney cone was observed through the night during 15-16 May. Blue and white plumes rose 800 m and drifted S. On 17 May white plumes drifted W and NW. Incandescence from the crater was again observed at night during 19-21 May. On 20 and 21 May Strombolian activity ejected material 25 m above the crater.
Source: Instituto Nacional de Sismologia, Vulcanologia, Meteorologia, e Hidrologia (INSIVUMEH)
INSIVUMEH reported that on 23 April fumarolic plumes from Pacaya's MacKenney cone rose 100 m and drifted N. On 24 April tephra was ejected 25 m high by weak explosions. Incandescence from the crater was observed through the night, and explosions were detected the next day. Incandescence and explosions were again detected on 29 April.
Source: Instituto Nacional de Sismologia, Vulcanologia, Meteorologia, e Hidrologia (INSIVUMEH)
INSIVUMEH reported that during 13-14 and 16-18 March weak gas-and-ash plumes rose from Pacaya and drifted N, NW, and S. A diffuse white plume rose less than 500 m and drifted E on 19 March.
Source: Instituto Nacional de Sismologia, Vulcanologia, Meteorologia, e Hidrologia (INSIVUMEH)
INSIVUMEH reported that during 8-12 March diffuse white plumes rose from Pacaya and drifted N, E, S, and SW.
Source: Instituto Nacional de Sismologia, Vulcanologia, Meteorologia, e Hidrologia (INSIVUMEH)
INSIVUMEH reported that on 5 March a gas-and-ash plume rose from Pacaya's MacKenney cone and drifted S.
Source: Instituto Nacional de Sismologia, Vulcanologia, Meteorologia, e Hidrologia (INSIVUMEH)
Based on INSIVUMEH notices, CONRED reported that explosions at Pacaya detected on 13 February were accompanied by rumbling. No material was ejected. The next day a diffuse white plume rose 200 m and drifted W and SW. Rumbling was heard in San Francisco de Sales (5 km N) and San Vicente Pacaya (5 km NW).
Sources: Instituto Nacional de Sismologia, Vulcanologia, Meteorologia, e Hidrologia (INSIVUMEH); Coordinadora Nacional para la Reducción de Desastres (CONRED)
INSIVUMEH reported that on 2 January a few hours of increased fumarolic activity at Pacaya generated steam emissions that rose 450 m above MacKenney cone. During 3-4 January plumes only rose 100-150 m. White steam plumes drifted S during 5-8 January.
Source: Instituto Nacional de Sismologia, Vulcanologia, Meteorologia, e Hidrologia (INSIVUMEH)
INSIVUMEH noted in a special report that on 28 December patterns of activity from Pacaya's MacKenney cone changed; three explosions detected at 1150 generated plumes that rose less than 500 m and drifted 5 km W and SW. During 30 December-1 January bluish-white plumes rose 50 m and drifted S and SW.
Source: Instituto Nacional de Sismologia, Vulcanologia, Meteorologia, e Hidrologia (INSIVUMEH)
INSIVUMEH noted in a special report that on 20 March patterns of seismicity and emissions from Pacaya's MacKenney cone changed, although remained characteristic of normal behavior for the volcano. On 26 March avalanches were detected and during 26-27 March gas plumes drifted S and SW. The report noted that after the eruption on 27 May 2010 only fumarolic emissions, mainly composed of water vapor, rose from MacKenney cone.
Source: Instituto Nacional de Sismologia, Vulcanologia, Meteorologia, e Hidrologia (INSIVUMEH)
INSIVUMEH reported on 20 January that a blue plume rose from the base of the NW flank of Pacaya's MacKenney cone. The Pacaya National Park authority was advised to not allow tourists near the area with the new plume. During 21-24 January fumarolic activity in the crater had variable intensity.
Source: Instituto Nacional de Sismologia, Vulcanologia, Meteorologia, e Hidrologia (INSIVUMEH)
INSIVUMEH reported that during 5-6 January steam-and-gas plumes, white and blue in color, rose 200 m above Pacaya's MacKenney cone. Seismic activity was consistent with gas emissions.
Source: Instituto Nacional de Sismologia, Vulcanologia, Meteorologia, e Hidrologia (INSIVUMEH)
On 8, 13, and 14 December, INSIVUMEH reported that gas-and-steam plumes rose from Pacaya's MacKenney cone and drifted SE, SW, and S, respectively.
Source: Instituto Nacional de Sismologia, Vulcanologia, Meteorologia, e Hidrologia (INSIVUMEH)
During 21-22 and 26 October, INSIVUMEH reported Strombolian explosions originating from Pacaya's MacKenney crater, although the explosions were not visually observed.
Source: Instituto Nacional de Sismologia, Vulcanologia, Meteorologia, e Hidrologia (INSIVUMEH)
INSIVUMEH reported that during 2 and 4-5 October steam-and-gas plumes rose from Pacaya's MacKenney cone and drifted S.
Source: Instituto Nacional de Sismologia, Vulcanologia, Meteorologia, e Hidrologia (INSIVUMEH)
INSIVUMEH reported that during 1-2 September steam plumes rose from Pacaya's MacKenney cone and drifted NE and W.
Source: Instituto Nacional de Sismologia, Vulcanologia, Meteorologia, e Hidrologia (INSIVUMEH)
On 30 July INSIVUMEH reported that explosions from Pacaya's MacKenney cone were detected by the seismic network. Inclement weather prevented visual observations. During 2-3 August explosions produced ash plumes that rose 400-800 m above the crater and drifted S, causing fine ash to fall in areas 5 km away.
Source: Instituto Nacional de Sismologia, Vulcanologia, Meteorologia, e Hidrologia (INSIVUMEH)
INSIVUMEH reported that on 20 July Strombolian explosions from Pacaya's MacKenney cone ejected ash that fell in neighboring areas. During 20-21 July there were 90 explosions recorded by the seismic network. Based on information from INSIVUMEH, the Washington VAAC reported that on 22 July a plume rose to an altitude of 4.6 km (15,000 ft) a.s.l. and drifted N. A weak thermal anomaly was seen in subsequent images. The next day, ash plumes drifted N at an altitude of 4.1 km (13,500 ft) a.s.l. and produced ashfall in areas within 10 km. On 25 July, INSIVUMEH noted that Strombolian explosions ejected tephra 100 m above the crater, and generated ash plumes that rose 300 m above the crater and drifted 10 km SW. Ejected blocks fell onto the flanks.
Sources: Washington Volcanic Ash Advisory Center (VAAC); Instituto Nacional de Sismologia, Vulcanologia, Meteorologia, e Hidrologia (INSIVUMEH)
INSIVUMEH reported that, after an increase in Pacaya's activity on 13 July, a decrease in seismicity was noted on 14 July. Strombolian explosions occurred on 14 July at 5-10 minute intervals, and occasional small pyroclastic flows traveled S. Gray ash plumes rose 500 m and drifted WSW. On 19 July, fumarolic plumes rose 100 m above MacKenney crater and drifted N. The seismic network had recorded a total of 120 explosions within the previous 24 hours. On 20 July Strombolian explosions generated ash plumes that rose 100 m and drifted 2 km N.
Source: Instituto Nacional de Sismologia, Vulcanologia, Meteorologia, e Hidrologia (INSIVUMEH)
On 7 and 9 July, INSIVUMEH reported that white plumes rose from Pacaya's MacKenney cone and drifted N. Small explosions were detected by the seismic network on 7 July. According to a CONRED notice, INSIVUMEH reported that an explosion on 13 July generated an ash plume that rose 300 m above the crater and drifted SW. Ash and tephra fell in nearby areas, and 150 people were evacuated.
Sources: Coordinadora Nacional para la Reducción de Desastres (CONRED); Instituto Nacional de Sismologia, Vulcanologia, Meteorologia, e Hidrologia (INSIVUMEH)
INSIVUMEH reported that during 16-22 June Pacaya's MacKenney cone emitted white-and-blue fumarolic plumes that rose 50-400 m high. Ash emissions were occasionally observed. INSIVUMEH also noted that the lava flows on the SE flank were advancing more slowly and exhibited fewer areas of incandescence.
Source: Instituto Nacional de Sismologia, Vulcanologia, Meteorologia, e Hidrologia (INSIVUMEH)
INSIVUMEH reported that during 9-10 June Pacaya's MacKenney cone emitted white-and-blue fumarolic plumes that rose 300 m high, and generated sounds audible up to 5 km away that resembled airplane engines. Occasional ash plumes drifted 2 km NW. Lava flows continued to be active on the SE flank and moved at a speed of about 1 m per hour. Explosions continued from a lateral crater.
Source: Instituto Nacional de Sismologia, Vulcanologia, Meteorologia, e Hidrologia (INSIVUMEH)
INSIVUMEH reported that on 3 June Strombolian activity from Pacaya ejected material 200 m into the air. During 5-6 June no explosions or ash emissions were noted, and seismic energy remained stable. Bluish-white plumes rose 700 m and drifted W. On 7 June an explosion ejected ash 100 m above the crater resulting in an ash plume that drifted 2 km NW. Blue-and-white plumes continued to rise from MacKenney cone. Multiple lava flows remained active and had traveled as far as 3.5 km by 6 June.
Source: Instituto Nacional de Sismologia, Vulcanologia, Meteorologia, e Hidrologia (INSIVUMEH)
A Strombolian eruption from Pacaya's MacKenney cone that began on 27 May was characterized in a report from CONRED as having constant explosions that ejected material 500 m into the air. Ash plumes rose 1.5 km above the crater and drifted W and SW, causing ashfall in multiple areas. The community of El Patrocinio (about 5 km W) evacuated and residents in El Rodeo (4 km WSW) were ordered to evacuate. Due to extensive tephra fall, authorities recommended that residents clean off ash from their roofs and refrain from driving.
INSIVUMEH reported a continuing series of explosions 5-10 seconds apart that ejected black ash up to 1 km above the crater on 28 May. Seismic signals reflected the explosions in addition to tremor. Ash plumes drifted 20-30 km NW, causing ashfall in areas downwind, including in Guatemala City, about 30 km NNE. CONRED reported a short time later that about 1,600 people had been evacuated from six towns 3-4 km W, NNW, N, and NNE, and that Aurora International Airport was closed. According to a map posted by CONRED, blocks fell in areas as far away as 12 km NE and ash was reported in areas E of Chinautla, 37 km NNE. News media reported that one person (a reporter) died and three children were missing.
On 29 May, a 90-m-wide lava flow that traveled SSE at an estimated rate of 100 m per hour burned three houses on the Pacaya Grande ranch. The lava was within 450 m of some other properties including El Chupadero, located 2-2.5 km S of the crater, and disrupted an access road from El Caracol (3 km SW) and Los Pocitos (5.5 km S). Explosions ejected ash 300-500 m above the crater. INSIVUMEH reported on 1 June that the Strombolian activity continued. Explosions ejected ash as high as 700 m above the crater and ash plumes drifted NW. Two lava flows were seen traveling SW and SE.
Sources: Reuters; Coordinadora Nacional para la Reducción de Desastres (CONRED); Instituto Nacional de Sismologia, Vulcanologia, Meteorologia, e Hidrologia (INSIVUMEH)
On 20 May, INSIVUMEH reported that small explosions and incandescence from Pacaya's MacKenney cone were accompanied by white and blue plumes. Multiple lava flows traveled as far as 1.6 km down the SW flank.
Source: Instituto Nacional de Sismologia, Vulcanologia, Meteorologia, e Hidrologia (INSIVUMEH)
INSIVUMEH reported that on 26 February explosions from Pacaya ejected tephra 150 m high. Bluish-white plumes drifted N and a lava flow traveled 800 m E.
Source: Instituto Nacional de Sismologia, Vulcanologia, Meteorologia, e Hidrologia (INSIVUMEH)
On 10 February, INSIVUMEH reported that lava flows from Pacaya, descending the flanks since April 2006, continued to flow down the E flank onto part of the meseta. During 11-16 February, lava flows 100-400 m long descended the E and NE flanks. Avalanches of blocks from the lava-flow fronts set fire to local vegetation.
Source: Instituto Nacional de Sismologia, Vulcanologia, Meteorologia, e Hidrologia (INSIVUMEH)
INSIVUMEH reported that activity from Pacaya consisting of effusion of lava flows, the source of which had migrated towards the S from the N flank since April 2006, ceased on 30 January 2010. On 5 February, Strombolian explosions from MacKenney cone ejected material 30 m into the air and lava from the crater moved down the flank. The activity was heard in the village of San Francisco de Sales, 5 km N. A new lava flow originating from a depression on the NE flank was seen on 6 February.
Source: Instituto Nacional de Sismologia, Vulcanologia, Meteorologia, e Hidrologia (INSIVUMEH)
On 8, 11, and 12 January, INSIVUMEH reported that white and blue fumarolic plumes from Pacaya's MacKenney cone rose up 400 m and drifted S and SW. Multiple lava flows on the S, SW, and W flanks traveled 25-200 m. Incandescence was noted at night from one of the inter-crater cones on 8 January and from MacKenney cone on 11 and 12 January.
Source: Instituto Nacional de Sismologia, Vulcanologia, Meteorologia, e Hidrologia (INSIVUMEH)
On 11, 14, and 15 December, INSIVUMEH reported that white and blue fumarolic plumes from Pacaya's MacKenney cone rose up 100 m and drifted S. Multiple lava flows on the S flank traveled 25-350 m. Incandescence from one of the inter-crater cones was noted.
Source: Instituto Nacional de Sismologia, Vulcanologia, Meteorologia, e Hidrologia (INSIVUMEH)
On 20 and 24 November, INSIVUMEH reported that white and blue plumes from Pacaya's MacKenney cone rose up to 400 m and drifted SSW. Multiple lava flows on the S and SW flanks traveled 100-250 m SE and SW. Incandescence at night was noted.
Source: Instituto Nacional de Sismologia, Vulcanologia, Meteorologia, e Hidrologia (INSIVUMEH)
On 23 and 26 October, INSIVUMEH reported that white and blue plumes from Pacaya's MacKenney cone rose 50-150 m and drifted W and SW. Multiple lava flows on the S flank traveled 75-350 m SSW.
Source: Instituto Nacional de Sismologia, Vulcanologia, Meteorologia, e Hidrologia (INSIVUMEH)
On 11 and 14 September, INSIVUMEH reported that white and blue plumes from Pacaya's MacKenney cone rose 300 m and drifted NW, S, and SW. Multiple lava flows 75-250 m long traveled W.
Source: Instituto Nacional de Sismologia, Vulcanologia, Meteorologia, e Hidrologia (INSIVUMEH)
On 28 August and 1 September, INSIVUMEH reported that white and blue plumes from Pacaya's MacKenney cone drifted S and SW. Multiple lava flows 15-200 m long traveled S and SW.
Source: Instituto Nacional de Sismologia, Vulcanologia, Meteorologia, e Hidrologia (INSIVUMEH)
On 31 July and 3 August, INSIVUMEH reported that white and blue plumes from Pacaya's MacKenney cone drifted S and SW. Multiple lava flows 50-300 m long traveled S and SW.
Source: Instituto Nacional de Sismologia, Vulcanologia, Meteorologia, e Hidrologia (INSIVUMEH)
On 10 and 14 July, INSIVUMEH reported that fumarolic plumes from Pacaya's MacKenney drifted S and gas plumes rose 300 m. Multiple lava flows 150-600 m long traveled SW.
Source: Instituto Nacional de Sismologia, Vulcanologia, Meteorologia, e Hidrologia (INSIVUMEH)
On 5, 8, and 9 June, INSIVUMEH reported that fumarolic plumes from Pacaya's MacKenney cone rose 50-200 m and drifted W and SW. During the reporting period, two to four lava flows, each 150-300 m long, were emitted from an area on the lower S flank, SW from the main edifice.
Source: Instituto Nacional de Sismologia, Vulcanologia, Meteorologia, e Hidrologia (INSIVUMEH)
On 24 and 28 April, INSIVUMEH reported gas emissions from Pacaya's MacKenney cone; occasional ash explosions ejected tephra 15-25 m high. The seismic network detected tremor and explosions. A small spatter cone being built in the S part of the crater was 4 m high. Rumbling noises were heard 3-5 km away and degassing produced sounds resembled airplane engines. Lava flows traveled 50-400 m down the SW flank and fumarolic plumes drifted S.
Source: Instituto Nacional de Sismologia, Vulcanologia, Meteorologia, e Hidrologia (INSIVUMEH)
INSIVUMEH reported that explosions in March ejected greater amounts of material that was deposited in the crater, enlarging the cones there. On 23 March, visual and audible changes in Strombolian activity were noted. Vigorous degassing produced sounds resembled airplane engines. In a report issued on 3 April, INSIVUMEH stated that Strombolian explosions from MacKenney cone during the previous few days ejected material 25 m into the air. On 2 April, lava flow volume increased, sending four lava flows W and one SW; the flows traveled 25-200 m. The seismic network detected tremor and explosions. On 6 April, lava flows on the W flank traveled 150-300 m, causing lava to pile up on the SW flank. Activity from MacKenney cone was continuous; one cone emitted gas and explosions about every 5-10 minutes, and a second cone ejected tephra 25 m high. On 7 April, one lava flow traveled 150 m W and one traveled 200 m SW. INSIVUMEH recommended that CONRED coordinate with authorities in Pacaya National Park to restrict visitors from climbing Pacaya.
Source: Instituto Nacional de Sismologia, Vulcanologia, Meteorologia, e Hidrologia (INSIVUMEH)
On 12, 16, and 17 March, INSIVUMEH reported that fumarolic plumes from Pacaya's MacKenney cone drifted S at a low altitude. Lava flows, 25-200 m long, traveled S, SW, and W.
Source: Instituto Nacional de Sismologia, Vulcanologia, Meteorologia, e Hidrologia (INSIVUMEH)
INSIVUMEH reported that on 30 January and 3 February white and blue fumarolic plumes from Pacaya's MacKenney cone drifted S and SW at a low altitude. One lava flow, 75-100 m long, traveled down the SW flank.
Source: Instituto Nacional de Sismologia, Vulcanologia, Meteorologia, e Hidrologia (INSIVUMEH)
On 12 December INSIVUMEH reported that fumarolic plumes from Pacaya's MacKenney cone drifted NE at a low altitude. Three lava flows, 150, 250, and 800 m long, were observed from the S. Seismic data indicated small explosions at the crater.
Source: Instituto Nacional de Sismologia, Vulcanologia, Meteorologia, e Hidrologia (INSIVUMEH)
On 20 November INSIVUMEH reported that fumarolic plumes from Pacaya's MacKenney cone drifted S at a low altitude. Ash occasionally entrained by strong winds drifted S. Multiple lava flows on the S, W, and SW flanks of the cone traveled 50-300 m during 20-21 and 25 November.
Source: Instituto Nacional de Sismologia, Vulcanologia, Meteorologia, e Hidrologia (INSIVUMEH)
Based on analysis of satellite imagery, the Washington VAAC reported that on 2 November a possible ash-and-gas plume was emitted from Pacaya and drifted E. On 3 November, INSIVUMEH reported that fumarolic plumes drifted S at a low altitude. Ash occasionally entrained by strong winds drifted S. Multiple lava flows on the S and SW flanks of MacKenney cone traveled a maximum distance of 400 m on 3 and 4 November, and continued to fill in the area between the cone and Cerro Chino crater to the N. Fumarolic plumes drifted E on 4 November.
Sources: Washington Volcanic Ash Advisory Center (VAAC); Instituto Nacional de Sismologia, Vulcanologia, Meteorologia, e Hidrologia (INSIVUMEH)
INSIVUMEH reported that, during 8-14 October, multiple lava flows on the W and SW flanks of Pacaya's MacKenney cone traveled a maximum distance of 250 m and continued to fill in the area between the cone and Cerro Chino crater to the N. Avalanches occurred from the lava-flow fronts on 8 October. Fumarolic plumes drifted SW.
Source: Instituto Nacional de Sismologia, Vulcanologia, Meteorologia, e Hidrologia (INSIVUMEH)
INSIVUMEH reported that during 21-26 August, fumarolic plumes from Pacaya's MacKenney cone rose to an altitude of 3.2 km (10,500 ft) a.s.l. and drifted W and SW. Incandescence from the crater was occasionally seen at night. Lava flows on the SW flank branched and traveled a maximum of 300 m; lava continued to fill in the area between MacKenney cone and Cerro Chino crater to the N. Avalanches occurred from the lava-flow fronts on 26 August.
Source: Instituto Nacional de Sismologia, Vulcanologia, Meteorologia, e Hidrologia (INSIVUMEH)
INSIVUMEH reported that during 9-16 July, Strombolian activity from Pacaya's MacKenney cone was mainly characterized by explosions approximately 2-3 minutes apart. Pyroclastic material was ejected about 25 m above the crater. Lava flowed 100-200 m down the NW flank and continued to slowly fill in the area between MacKenney cone and Cerro Chino crater to the N. On 16 July, fumarolic plumes drifted SW.
Source: Instituto Nacional de Sismologia, Vulcanologia, Meteorologia, e Hidrologia (INSIVUMEH)
During 18-24 June, INSIVUMEH reported that white fumarolic plumes from Pacaya's MacKenney cone drifted S and W. Lava flows traveled 50-100 m NW in the area between MacKenney cone and Cerro Chino crater to the N. Incandescence in the crater was observed at night.
Source: Instituto Nacional de Sismologia, Vulcanologia, Meteorologia, e Hidrologia (INSIVUMEH)
INSIVUMEH reported that during 19-20 May white fumarolic plumes from Pacaya's MacKenney cone drifted W. Lava flows from the base of the NW flank traveled 100 m NW in the area between MacKenney cone and Cerro Chino crater to the N. The seismic network recorded small explosions and occasional tremor.
Source: Instituto Nacional de Sismologia, Vulcanologia, Meteorologia, e Hidrologia (INSIVUMEH)
INSIVUMEH reported that during 6-19 February white and blue fumarolic plumes from Pacaya's MacKenney cone rose to altitudes of 2.6-2.7 km (8,500-8,900 ft) a.s.l. and drifted S, SW, and W. About two to five lava flows per day traveled about 50-200 m to the W and NW, slowly filling in the area between MacKenney cone and Cerro Chino crater to the N. Explosions on 8 February propelled fragments 100 m above the summit.
Source: Instituto Nacional de Sismologia, Vulcanologia, Meteorologia, e Hidrologia (INSIVUMEH)
INSIVUMEH reported on 24 January that white and blue fumarolic plumes from Pacaya's MacKenney cone drifted S and SW. Four lava flows traveled about 100 m to the W. Based on reports from INSIVUMEH, CONRED reported on 28 January that the Alert Level was lowered to Green.
Sources: Coordinadora Nacional para la Reducción de Desastres (CONRED); Instituto Nacional de Sismologia, Vulcanologia, Meteorologia, e Hidrologia (INSIVUMEH)
INSIVUMEH reported on 11 January that continuous effusion of lava on Pacaya's W flank resulted in a 150-200 m-long lava flow. Fumaroles produced white and blue plumes that drifted S, and incandescence at night was observed from the summit. CONRED reiterated that the Alert Level remained at Yellow.
Sources: Coordinadora Nacional para la Reducción de Desastres (CONRED); Instituto Nacional de Sismologia, Vulcanologia, Meteorologia, e Hidrologia (INSIVUMEH)
According to CONRED, a 17 December INSIVUMEH report noted changes in Pacaya's behavior. On 19 December, CONRED issued a bulletin noting that INSIVUMEH reported observations of white and blue "smoke" plumes. The plumes rose to an altitude of 2.8 km (9,200 ft) a.s.l. and drifted S. Lava flows were unchanged from previous days. Based on these reports, CONRED raised the Alert Level to Yellow in surrounding communities.
Source: Coordinadora Nacional para la Reducción de Desastres (CONRED)
INSIVUMEH reported that during 12-17 December constant lava flows on the W flank of Pacaya's MacKenney cone were about 100-200 m in length. Based on seismic interpretation, a small explosion occurred in the crater on 12 December. Fumaroles produced plumes that drifted S and SW and incandescence at night was observed from the summit.
Source: Instituto Nacional de Sismologia, Vulcanologia, Meteorologia, e Hidrologia (INSIVUMEH)
On 7 September, INSIVUMEH reported that lava flows on the W flank of Pacaya's MacKenney cone were about 150 m in length. During the week prior, fumaroles in the crater produced white and blue plumes that drifted S and SW. Incandescence was observed from the summit.
Source: Instituto Nacional de Sismologia, Vulcanologia, Meteorologia, e Hidrologia (INSIVUMEH)
On 13 July, INSIVUMEH reported that lava on the NE flank of Pacaya's MacKenney Cone branched into three flows. Two flows traveled 100 m and 200 m to the N and one traveled 300 m to the NE. Incandescence was observed from a hornito in the summit crater. White plumes were observed.
Source: Instituto Nacional de Sismologia, Vulcanologia, Meteorologia, e Hidrologia (INSIVUMEH)
INSIVUMEH reported that on 31 May, and 1 and 5 June, lava from the NE flank of Pacaya's MacKenney Cone continued to flow and pooled between the base of the volcano and the plateau. Gas plumes from the summit drifted N and SW and rose to altitudes of 2.8 km (9,200 ft) a.s.l. on 5 June. Small pyroclastic explosions from the N part of MacKenney Cone were occasionally observed.
Source: Instituto Nacional de Sismologia, Vulcanologia, Meteorologia, e Hidrologia (INSIVUMEH)
The Washington VAAC reported that an ash plume from Pacaya was visible on satellite imagery drifting SSE on 6 April.
Source: Washington Volcanic Ash Advisory Center (VAAC)
INSIVUMEH reported that on 9 and 12 March, fumurolic activity from Pacaya's MacKenney Cone produced plumes that rose to 3 km (9,800 ft) a.s.l. and drifted S and SW. Incandescence was reflected in the plumes on 9 March. A lava flow from a crater on the NE flank was visible on 12 and 13 March to distances of 300 m.
Source: Instituto Nacional de Sismologia, Vulcanologia, Meteorologia, e Hidrologia (INSIVUMEH)
INSIVUMEH reported that during 4-5 January, Strombolian eruptions from Pacaya produced incandescent material that was expelled at 2-40-second intervals, up to 100 m above the crater. Gas clouds reached an altitude of 2.7 km (8,900 ft) a.s.l. and drifted S. A lava flow 50 m in length pooled near the NE edge of MacKenney Cone.
Source: Instituto Nacional de Sismologia, Vulcanologia, Meteorologia, e Hidrologia (INSIVUMEH)
INSIVUMEH reported that on 15 and 17 November lava flows from Pacaya traveled about 100-150 m N and NE. On 17 November, fumarolic emissions produced a white cloud that surrounded the S flank of MacKenney Cone.
Source: Instituto Nacional de Sismologia, Vulcanologia, Meteorologia, e Hidrologia (INSIVUMEH)
Lava flows have continued at Pacaya during 14-29 September, as reported by INSIVUMEH. The flows slowly advanced W towards Cerro Chino and NE towards Cerro Grande. White fumarolic emissions continued to rise from the MacKenney Cone.
Source: Instituto Nacional de Sismologia, Vulcanologia, Meteorologia, e Hidrologia (INSIVUMEH)
The Washington VAAC reported that emissions from Pacaya with possible ash content were visible on satellite imagery on 28 August. The plumes reached altitudes of ~3 km (~10,000 ft) a.s.l. and drifted W. A thermal anomaly was identified on the imagery.
Source: Washington Volcanic Ash Advisory Center (VAAC)
Fumarolic emissions from Pacaya's Mackenney Cone drifted S and SW on 16 and 21 August. Lava flows advanced N and NW towards Cerro Chino, NE towards Cerro Grande, and SW from Mackenney Cone during 16-21 August.
Source: Instituto Nacional de Sismologia, Vulcanologia, Meteorologia, e Hidrologia (INSIVUMEH)
A white- and blue-colored "smoke" plume from Pacaya was observed on 5 and 7 July and drifted NW and W, and a white gas cloud on 10 July reached 800 m above the crater (11,000 ft a.s.l.) and drifted SW. Lava flows toward the NW reached lengths of 800 m. Incandescence was observed on 7 July.
Source: Instituto Nacional de Sismologia, Vulcanologia, Meteorologia, e Hidrologia (INSIVUMEH)
On 17 April, lava flowed from Pacaya from a parasitic crater at the NE base of a volcanic cone. Fumaroles were active at the volcano's central crater.
Source: Instituto Nacional de Sismologia, Vulcanologia, Meteorologia, e Hidrologia (INSIVUMEH)
During 22-28 March, incandescent volcanic material was ejected tens of meters above Pacaya and lava flows extended ~100 m down the volcano's S flank. On the 28th, a new lava flow was emitted from the SW edge of the active crater. The flow reached ~150 m and avalanches occurred from the lava-flow fronts.
Source: Instituto Nacional de Sismologia, Vulcanologia, Meteorologia, e Hidrologia (INSIVUMEH)
Strombolian explosions at Pacaya on 9 March occurred at intervals of 10-30 seconds and threw volcanic material 50-100 m above the volcano. On the evening of 12 March, there was an increase in Strombolian activity, with material reaching 150-250 m above Mackenney Cone.
Source: Instituto Nacional de Sismologia, Vulcanologia, Meteorologia, e Hidrologia (INSIVUMEH)
Weak incandescence was noted from the Pacaya crater during 18-24 January. A white- and blue-colored fumarolic gas plume rising from the crater frequently extends many kilometers downwind.
Source: Instituto Nacional de Sismologia, Vulcanologia, Meteorologia, e Hidrologia (INSIVUMEH)
During 7-11 September, occasional Strombolian activity occurred at Pacaya. Volcanic bombs were emitted from two craters, reaching up to 30 m above their rims. Incandescence from lava flows on the volcano's SE flank was visible on several nights.
Source: Instituto Nacional de Sismologia, Vulcanologia, Meteorologia, e Hidrologia (INSIVUMEH)
During 13-18 July, a lava flow that traveled down Pacaya's SW flank extended about 300 m. Also, avalanches of incandescent volcanic blocks produced small ash clouds to low levels.
Source: Instituto Nacional de Sismologia, Vulcanologia, Meteorologia, e Hidrologia (INSIVUMEH)
During 6-11 July, lava flows traveled 200-300 m down Pacaya's SW flank. Small plumes emitted from the volcano's central crater rose to low altitudes.
Source: Instituto Nacional de Sismologia, Vulcanologia, Meteorologia, e Hidrologia (INSIVUMEH)
By 27 June a lava flow extended ~300 m down the SW flank. A white column reached ~150 m (8,860 ft a.s.l.) over the central crater and extended SW. Incandescent lava expulsions reached a height of 15-50 m. On the night of 27 June two rivers of lava were observed in front of the Chinese hill, and were 75 and 150 m long. A constant expulsion of pyroclastic material was observed to reach 20-30 m above the crater.
Source: Instituto Nacional de Sismologia, Vulcanologia, Meteorologia, e Hidrologia (INSIVUMEH)
During 1-6 June, incandescent lava was ejected as high as ~75 m above Pacaya's crater (8,600 ft a.s.l.). An intra-crater lava flow extended ~300 m from the SW base of the central cone. On 6 June, a lava flow traveled ~200 m down the volcano's W flank.
Source: Instituto Nacional de Sismologia, Vulcanologia, Meteorologia, e Hidrologia (INSIVUMEH)
Incandescent lava was ejected ~50 m from Pacaya's crater on 17 May and an intra-crater lava flow extended ~300 m from the SW base of the central cone. On 20 May a thin plume rose ~500 m above the volcano's crater (~10,000 ft a.s.l.).
Source: Instituto Nacional de Sismologia, Vulcanologia, Meteorologia, e Hidrologia (INSIVUMEH)
Reports on 10 and 13 May indicated continued ejection of incandescent material from the crater. Lava flows moving towards the SW and W in the direction of Cerro Chino reached lengths of 150-250 m.
Source: Instituto Nacional de Sismologia, Vulcanologia, Meteorologia, e Hidrologia (INSIVUMEH)
Lava emission continued at Pacaya during 4-9 May. Earlier in the period, on 4 May, three lava flows were active, extending up to 100 m down the SW flank and 150 m W in the direction of Cerro Chino. On 9 May two flows from the base of the intracrater cone were active, reaching 200 m down the W flank. Plumes from the MacKenney Cone rose as high as 800 m above the crater.
Source: Instituto Nacional de Sismologia, Vulcanologia, Meteorologia, e Hidrologia (INSIVUMEH)
Small explosions occurred at Pacaya during 21-25 April. A ~250-m-long lava flow was on the volcano's W flanks.
Source: Instituto Nacional de Sismologia, Vulcanologia, Meteorologia, e Hidrologia (INSIVUMEH)
During 2-8 March, lava flows from Pacaya traveled as far as 200 m down the volcano's SW flank.
Source: Instituto Nacional de Sismologia, Vulcanologia, Meteorologia, e Hidrologia (INSIVUMEH)
During 24-25 January, lava flows from Pacaya traveled as far as 150 m down the volcano's SW flank.
Source: Instituto Nacional de Sismologia, Vulcanologia, Meteorologia, e Hidrologia (INSIVUMEH)
INSIVUMEH reported that activity at Pacaya during 14-18 October had not significantly changed in 2 months. Weak glow was visible from MacKenney cone, variable tremor was recorded, and white plumes rose to ~200 m above the crater.
Source: Instituto Nacional de Sismologia, Vulcanologia, Meteorologia, e Hidrologia (INSIVUMEH)
During 15-21 September, INSIVUMEH reported that Pacaya displayed weak glow from the MacKenney Cone and variable tremor. White plumes rose to heights 500-700 m from the central crater.
Source: Instituto Nacional de Sismologia, Vulcanologia, Meteorologia, e Hidrologia (INSIVUMEH)
On 5 July at 0715 a very thin ash and/or gas plume was visible at Pacaya on satellite imagery at a height of ~3 km a.s.l. extending ~7.5 km SW. By 1430 the plume was no longer visible, possibly obscured by thunderstorm clouds in the area, and the Guatemala Volcano Observatory reported that only steam was emitted from Pacaya.
Source: Washington Volcanic Ash Advisory Center (VAAC)
The Washington VAAC reported that on 17 June at 0815 satellite imagery showed a very thin SW-drifting plume of unknown composition emitted from Pacaya. In addition, satellite imagery showed a faint hotspot at the volcano's summit.
Source: Washington Volcanic Ash Advisory Center (VAAC)
The Washington VAAC received a report from Guatemala City indicating that Pacaya was active on 30 May. Satellite imagery showed possible low-level ash near the volcano's summit.
Source: Washington Volcanic Ash Advisory Center (VAAC)
The agency responsible for monitoring active volcanoes in Guatemala, INSIVUMEH, observed several indications of renewed eruptive vigor at Pacaya. A local seismometer recorded over 700 earthquakes per day in comparison to 100 earthquakes per day recorded approximately 2 weeks earlier. SO2 gas emissions increased from 253 tons/day to 550 tons/day. In addition, lava was visible in the summit region at MacKenny Crater.
Source: Instituto Nacional de Sismologia, Vulcanologia, Meteorologia, e Hidrologia (INSIVUMEH)
Reports are organized chronologically and indexed below by Month/Year (Publication Volume:Number), and include a one-line summary. Click on the index link or scroll down to read the reports.
Elevated activity in late 1969; strong eruption on 7 January
Card 0843 (8 January 1970) Elevated activity in late 1969; strong eruption on 7 January
The following cable was received from Guatemala City on 9 January 1970. The Pacaya volcano began a strong eruption last night and caused unrest in a vast zone. Long tongues of fire rose into the darkness and the light gave the impression of a huge fire. The volcano has frequently been the epicenter of strong seismic movements.
The following report is from Richard Stoiber. The magnitude of the eruption . . . has been increasing for the past several months. On 15 December, I observed a regular eruption which included ejecta, bombs, and scoria coming out of MacKenney Cone, and reaching a height above the summit. No ash was observed.
Information Contacts: Samuel Bonis, Instituto Geografico Nacional, Guatemala; Richard Stoiber, Dartmouth College, USA.
Lava flow from a new vent on the NW flank
Card 1356 (17 February 1972) Lava flow from a new vent on the NW flank
The following report was received by R. Stoiber from Sam Bonis, Instituto Geografico Nacional, Guatemala, on 16 February. The report was the result of observations by Sam Bonis, Tom Loucks of Dartmouth College, and of Alexander Ritchie of the University of Texas. "2 February a lava flow started from at least one of the three new vents on the south flank of Cerro Chino cinder cone forming part of the Volcan Pacaya complex lying on the NW flank of the currently active Volcan Pacaya. 4 February it had traveled ~1.5 km in a westerly direction. At this time it was flowing from only the lowest vent at an elevation of about 2,500 m. By 11 February the volume of the flow and advance had greatly diminished. An ash eruption, probably from the main Pacaya cone, accompanied the earlier stages of the lava flow and covered the Pacaya area to a depth of 2 cm."
Information Contacts: Samuel Bonis, Instituto Geografico Nacional, Guatemala; Richard Stoiber, Dartmouth College, USA.
Lava flow from SW flank still active
Card 1519 (27 December 1972) Lava flow from SW flank still active
Volcano Pacaya has renewed eruptive activity. The present phase started with ash eruptions from MacKenney Cone on or about 15 October 1972. This was followed by a lava flow issuing from the lower southwest flank and still continues. The flow has reached a length of about 1.5 km. Observations by teams of Instituto Geografico and Dartmouth geologists continue.
The present period of activity was initiated on 2 February 1972 with lava flows from new vents and fissures on the northwestern flank of the principal Pacaya Cone as well as from lower vents on the south flank of the adjacent Cerro Chino, a subsidiary sister cone. This activity continued for about a month and produced a lava flow approximately 1.5 km long. Slow collapse engulfment and resulting enlargement of the active McKenny Crater of Pacaya became noticeable in early September, leading to the current activity. All flows and ashes have been of the basaltic composition.
Information Contacts: Samuel Bonis, Instituto Geografico Nacional, Guatemala; Richard Stoiber, Dartmouth College, USA.
Ash eruptions and lava emission
Card 1539 (19 January 1973) Ash eruptions and lava emission
"Volcano Pacaya resumed ash eruptions from MacKenney Cone 13 January 1973. Eruptions occurred at 4-5 minute intervals. Lava continued to issue from the vent on the lower southwest flank but increased in amount concurrently with the ash eruption phase, from approximately 20 m3 per minute (12 January) to approximately 60 m3 per minute. At 1330 lava started issuing from a formerly active vent approximately 15 m above the lower vent at a rate of 96 m3 per minute.
Summit activity was not apparent on 14 January but lava continued to issue from both vents at approximately the same rate as the previous day. The flows continue to be olivine basalt. Pacaya has been issuing lava since mid-October 1972. A preliminary ground-based infrared thermal survey revealed no anomalously hot areas other than those associated with present and recent vents.
Information Contacts: Ian Lange, University of Montana, USA; Richard Birnie, Harvard University, USA; Thomas R. McGetchin, Massachusetts Institute of Technology, USA.
Black steam cloud on 4 February; summit observations
"Pacaya, inactive since the October 1975 lava flow, resumed activity for at least 1 day prior to the 4 February earthquake. Black steam clouds from MacKenney Crater were seen in Guatemala City. A group camped at Pacaya on the morning of the 4 February earthquake reported that a black steam cloud was discharged from MacKenney Crater immediately after the event. Eruptions continued until sunrise. Primarily ash and steam with very few small blocks were discharged. At sunrise the eruptions ceased and Pacaya remained quiet until sunset when similar activity resumed. A group from Dartmouth College and IGN visited Pacaya on 16 February. There were no eruptions, but earth tremors of several seconds duration were felt during the 18 hours that the party was on the summit. Gas condensate samples were collected from a fumarole with a temperature of 138°C on the rim of MacKenney Crater.
"The summit crater of Pacaya was cut by at least seven steaming fractures that described a radial pattern. These fractures had been noted on visits to the summit in November 1975 and January 1976. A thermal infrared map was made of the W flank of Pacaya on the early morning of 18 February from a station near El Patrocinio. A large zone approximately 100 m square, at an elevation of 2,250 m, contained apparent surface temperatures 10° above ambient with a maximum apparent surface temperature of 40° above ambient. This zone bears watching as the possible locus of a future lava flow. An earth tremor of 10 seconds duration was felt while making the thermal map at 0620. At 0903 a dark cloud was erupted from MacKenney Crater. Six more similar eruptions took place in the next hour before the summit was obscured by clouds. Despite the absence of a favorable wind direction, ash from the eruptions fell near El Patrocinio, 2,200 m from the vent. The eruption clouds rose approximately 500 m above the summit and rocks were heard cascading down the slopes."
Information Contacts: Sam Bonis, IGN; Richard Birnie and Bradley Dean, Dartmouth College.
Felt seismicity and moderate ash eruptions
Residents living near the volcano reported that in mid-May Pacaya's activity consisted of seismic movements and eruptions of moderate amounts of ash.
Information Contacts: S. Bonis, IGN.
Ash eruptions on 19-20 and 27 August
After a month of increasing steam emission, a 1-day series of ash eruptions occurred on 27 August from MacKenney Crater, the active vent of the 1965-75 eruption. Although the eruptions were conspicuous, the amount of ash ejected was not large, and was carried W by the wind. Small eruptions were also reported 19 August (black ash) and 20 August, accompanied by a strong sulfur odor near the volcano.
Information Contacts: S. Bonis, IGN; R. Stoiber, Dartmouth College; P. Newton, Antigua.
Steam and ash emission increase
Steam and ash emission from Pacaya increased in October, and was continuing at the end of the month.
Information Contacts: S. Bonis, IGN; R. Stoiber, Dartmouth College.
Strong, continuous steam emission unabated since February
The strong continuous steam emission that began in late 1977 from MacKenney Crater was still underway when Pacaya was visited on 16 November 1978, unabated in intensity since February.
Information Contacts: W. Rose, Jr., Michigan Tech. Univ.
Gas emission continues
Pulsating gas emission from MacKenney Crater was continuous during observations 22 January-10 February 1980. The activity was similar in intensity to that observed January-March and November, 1978.
Information Contacts: W. Rose, Jr., Michigan Tech. Univ.
Small cinder cone grows within MacKenney Crater
A very small cinder cone had grown inside MacKenney Crater in the last 2 months. A large gas plume rose continuously from the summit.
Information Contacts: R. Stoiber, S. Williams, H. R. Naslund, L. Malinconico, and M. Conrad, Dartmouth College; S. Bonis, IGN.
Strombolian activity and lava flows
Pacaya displayed weak Strombolian activity during a visit by Michigan Tech. Univ. geologists on 14 February, the first Strombolian activity observed at Pacaya since 1975. Gas emissions have characterized the activity since late 1977.
Lava was fountaining to 200 m at 10-second to 1-minute intervals from two coalesced spatter vents in the center of MacKenney Crater, high on the WNW flank. Four subsidiary vents, two N of the spatter vents and two W of them (in the direction of the volcano summit), also ejected lava. New pahoehoe lava flows, some of which were moving, had filled the N half of the crater floor to the rim. The fountaining was interspersed with intense, pulsating gas emission from the spatter vents.
By 20 February, when Robert Hodder climbed Pacaya, one lava flow had traveled a quarter of the way (about 200 m) down the N flank of MacKenney Crater cone, over one of the September 1969 flows. Within the crater, cracks and pressure ridges in the lava crust indicated continued lava movement. Strombolian activity was occurring at about 30-minute intervals. Patches of sublimate were visible on the SE crater wall.
During a second climb on 28 February Hodder observed that aa lava had flowed about 750 m from the crater rim to the base of MacKenney Crater cone, into the trough between it and the rim of the older Pacaya edifice. The level of lava in the crater had risen. The 2 vents observed on 14 February had totally coalesced and had built cones about 15 m high. The lava crust seemed solid, but incandescence showed through surface cracks at night. Strombolian activity occurred about every 20 minutes. Large cow-dung bombs, hurled as high as 100 m, fell onto the cones and the lava crust. Bomb ejection was sometimes preceded by a puffy steam cloud at least 300 m high. Sublimate solidly coated the SE crater wall. Hodder noted that this eruption seemed similar to that of 1969.
Information Contacts: W. Rose, Jr., T. Bornhorst, and C. Chesner, Michigan Tech. Univ.; R. Hodder, Univ. of Western Ontario.
Lava flows and Strombolian activity
Newspapers reported that vigorous magmatic activity had begun at Pacaya on 9 February. According to newspapers, activity peaked 18 February at 1730 as lava overflowed the N rim of the crater and began to move down Pacaya's N flank.
Michigan Tech. Univ. geologists climbed Pacaya again on 5 March. Since their last visit 14 February, the level of the lava lake in MacKenney Crater had risen considerably, the two coalesced spatter vents had grown, and an additional small spatter vent had formed in the S part of the crater on the lava lake surface. The new S vent continuously extruded two pahoehoe lava flows but was not the source of any Strombolian explosions. A few small pahoehoe flows were also moving across the E side of the crusted lava lake surface. Nearly continuous weak Strombolian activity occurred from the two older vents. The smaller N vent had many small Strombolian explosions at intervals of 10-20 seconds. From the larger vent, activity was cyclical, consisting of a 1-5-second explosion that ejected spatter to 200-300 m above the vent, followed almost instantly by a large increase in gas emission that peaked in about 1 minute, decreased slowly, then dropped sharply about 30 seconds before the next explosion. Gases above the vent had an intense blue color. The alignment of the three vents in MacKenney Crater indicated that the activity may have been from a fissure trending approximately N-S.
The geologists estimated that the lava flow descending the N flank had a volume of about 2 x 10⁴ m3 on 5 March. They estimated the total volume of 1981 lava at about 1 x 10⁶ m3, for an average eruption rate of about 4 x 10⁴ m3/day. The lava was petrologically similar to lavas from eruptions since 1970, consisting of basalt with abundant plagioclase phenocrysts and sparse olivine phenocrysts.
Information Contacts: T. Bornhorst and C. Chesner, Michigan Tech. Univ.
Lava flows from flank hornito
Geologists climbed to Pacaya's summit on 12 February. During their observations, lava from a 10-m-high hornito at about 2,100 m altitude on the SW flank flowed into a lava tube that extended about 0.5 km downslope. Lava emerged from the end of the tube and continued several kilometers farther down the SSW flank, forming an aa flow about 10 m wide, incandescent in daylight, that was bordered by levees. Two smaller subflows branched from the main flow 0.5-1 km below the end of the lava tube. Lava flowing through the tube appeared to be of pahoehoe type when viewed through a skylight just upslope from its distal end. A considerable quantity of blue fume escaped through the skylight. Near the active hornito, two smaller ones, each a few meters high, were no longer emitting lava. Loud booming from the area of the hornitos was heard every few seconds. According to a security guard working on Pacaya, activity from the hornitos had begun about 3 weeks earlier.
Since geologists visited Pacaya in March 1981, several additional lava flows had spilled over the rim and moved down the flank. Residents of the area said that lava effusion had stopped a few months prior to the February 1982 visit but Strombolian explosions had continued until activity began at the SW flank hornitos in early 1982. In February 1982, MacKenney Crater contained a single spatter cone, elongate NE-SW, 50-60 m in diameter, and 30-35 m high, breached on the NE side by a fissure that was vigorously emitting vapor. Lava had apparently flowed through this breach in the past. No incandescent rock was visible within the spatter cone, which had a crater no more than 50 m deep. Considerable sublimate deposition had occurred on the spatter cone's NW side. Intense booming from within the spatter cone occurred every 10-15 seconds, occasionally causing felt shaking on parts of the cone for a few seconds, but was not accompanied by any obvious increase in vapor emission.
Information Contacts: T. Casadevall, USGS.
Flank lava effusion continues
Rodolfo Alvarado reported that as of 4 March lava continued to flow from a hornito on the upper SW flank.
Information Contacts: R. Alvarado, Inst. Nacional de Electrificación; T. Casadevall, USGS.
Minor flank lava emission
Maurice Krafft climbed Pacaya 28-29 January and observed lava emerging sluggishly from the SW flank vent that had been much more vigorously active in early 1982. The lava formed a single flow, about 3-4 m thick and less than 50 m long, that advanced only about 1 m/day. When Alfredo MacKenney had climbed the volcano 3 weeks earlier, the same vent had been feeding 3 aa flows, each about 2-3 m wide and 20 m long. None of these tiny flows were still active in late January. Moderate degassing continued from summit vents.
Information Contacts: M. Krafft, Cernay, France; A. MacKenney, Guatemala City.
Strombolian bursts and lava flows in summit crater
In March 1983, small Strombolian explosions began in MacKenney Crater, 50 m in diameter and 30 m deep. Similar activity continued through June. Activity increased on 17 July when explosions were heard and glow seen from nearby towns. By 31 July, the crater was completely filled with blocks and ash. A pyramidal cone 30 m in diameter and 20 m high, with a small upper crater, was present within the summit crater on 21 August. On 4 September, activity increased again as lava flowed from a hornito on the upper S flank of the newly formed cone. On 11 September, the cone was 25 m high and 50 m in diameter with three active vents trending N and two lava flows emerging from its W flank. The two upper vents produced continuous explosions on 15 September, and lava flowed about 200 m downslope from a hornito on the N flank of the summit crater.
Information Contacts: A. MacKenney, Guatemala City.
Strombolian activity; lava flow
Geologists from Michigan Tech. Univ. and the Instituto Geográfico Militar (IGM) visited the volcano 13 and 16 November. Cloudy weather on the 13th allowed only brief glimpses of the crater; activity appeared to be weak but some spattering may have been occurring. On 16 November, the geologists noted that the active cone, centered on the S edge of MacKenney Crater, had grown to more than 100 m in height and filled 1/3-1/2 of the crater. Several Strombolian bursts per minute occurred from a vent at the top of the cone, ejecting spatter to 20 m height. Bombs reached 30 cm in maximum dimension. Aa lava emerged from below the base of the active cone, flowed down the crater's NW flank, and was beginning to pond in the saddle between MacKenney Crater and an older cone (Cerro Chino).
Information Contacts: S. Halsor, Michigan Tech. Univ.
Summit-area lava production continues
During December 1983 and the next 2 months, activity increased and the new cone grew in height and diameter. Many lava flows emerged from below its N base. In March, two lava flows were extruded from the cone's S base while activity declined in its upper crater. On 15 May, people living near the volcano heard strong explosive activity. When the volcano was visited on 20 May, half of the active cone had been destroyed. Small pyroclastic explosions were occurring and a great quantity of vapor was being emitted. On 10 June, several lava flows were emerging in the saddle between the active crater and Cerro Chino (figure 1). In July, lava continued to fill this area and flowed W. On 5 August, Strombolian activity had increased in the upper crater. In August and early September lava emerged slightly SE of the June-July vents. On 2 September, minor pyroclastic activity was occurring from MacKenney Crater.
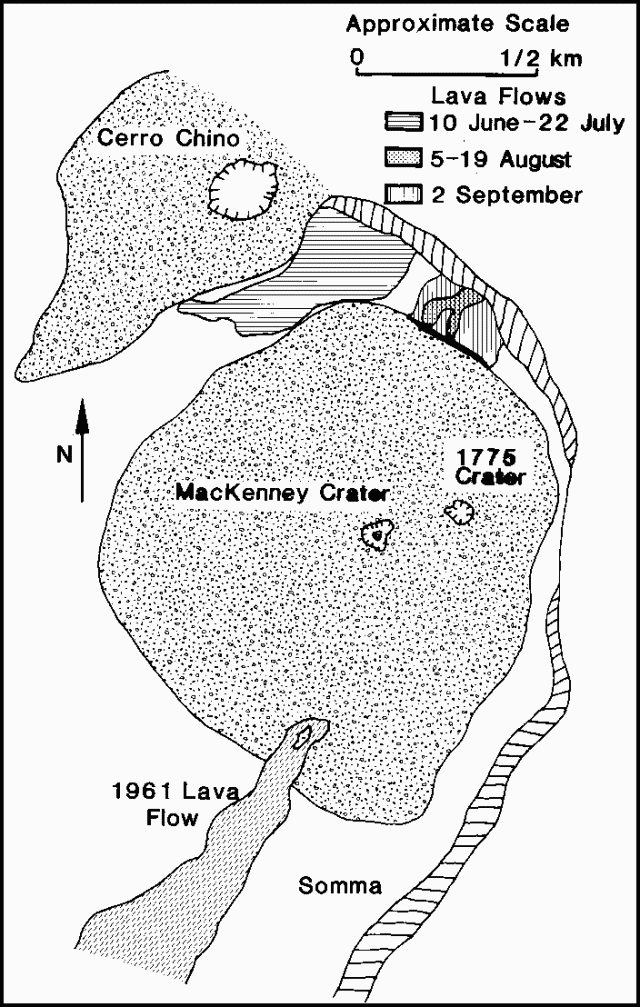 |
Figure 1. Sketch map of the summit area of Pacaya, showing 1984 lava flows. Courtesy of Alfredo MacKenney. |
Information Contacts: A. MacKenney, Guatemala City.
Lava emission in saddle area stops; lava flow and tephra from small cone in MacKenney Crater
Lava flows from the saddle vent that began erupting on 5 August 1984 remained active until 6 February 1985 and built a cone approximately 50 m high.
On 1 January, minor pyroclastic activity, which could only be seen from the crater rim, resumed at MacKenney Crater. By 10 February, a steep-sided lava cone about 6 m high had developed within the crater. Pyroclastic material was ejected from the top of the small cone, a lava flow emerged from its E flank, and a lava spine had grown on its W flank. On 17 March, the cone was approximately 20 m high and another explosion crater had formed on its E flank. By mid-March, the activity had begun to be visible from Guatemala City (about 40 km E) on clear days.
Information Contacts: A. MacKenney, Guatemala City.
Strombolian activity ejects scoria and Pele's Hair
David Harlow climbed Pacaya during the night of 10 February and observed a slow-moving lava flow emerging from a vent between MacKenney Crater and the August 1984 lava NNE of the crater. When Enrique Molina and Randy White visited the volcano at the end of February, two vents were active in MacKenney Crater: the W vent had built a hornito and was spattering every second or two; only steam was emerging from the E vent, but it was glowing red at 6 m depth. By 17 March, a new cone over these vents had grown to 20 m height.
Enrique Molina and Michael Carr climbed Pacaya 24 April and observed continuing activity from the new cone. Small Strombolian explosions ejected tephra to 20 m height about every 7 minutes from one or both of a pair of vents 6-7 m apart. Activity was more vigorous from the W vent; only minor spattering occurred from the E vent. A steep lava tower, 3-4 m high, had grown over the E vent. Most of the ejecta were black scoria, as large as 1/3 m in diameter, that contained a few small plagioclase, olivine, and pyroxene phenocrysts. Considerable quantities of Pelé's Hair were found near the vents. The lava flow that was emerging from the E flank of the cone in February was no longer active. Farmers reported an active lava flow on the W flank of Pacaya, but the geologists did not visit the area.
Further Reference. Eggers, A.A., 1983, Temporal gravity and elevation changes at Pacaya volcano, Guatemala: JVGR, v. 19, p. 223-238.
Information Contacts: E. Molina, INSIVUMEH, Guatemala City; M. Carr, Rutgers Univ.; D. Harlow and R. White, USGS.
Explosive activity builds new cones; lava flows
Pacaya has been almost continuously active since 1965. Strombolian activity, sometimes accompanied by lava flows, began in February 1981 and increased in March 1983 [from 11:12]. By the end of 1983 a large cone had been built in MacKenney Crater. Lava emerged from various vents between there, an older cone to the north (Cerro Chino), and the nearby somma wall through early 1985.
Alfredo MacKenney reported that between 5 May and 28 July, 1985, the two cones that had formed earlier that year (one within MacKenney Crater and the other on the E wall) had increased substantially in size because of the continuous moderate explosive activity. On two occasions (30 June and 28 July) lava flows emerged toward the N and SW. On 11 August, another crater had formed between the two earlier cones, which maintained strong explosive activity until 13 October. From 19 October until 10 December, renewed activity occurred from the E cone, building a perfectly-shaped cone that reached the height of Pacaya Crater (2,500 m). Between 9 December 1985 and 16 February 1986, a large upper crater formed in this cone, which maintained strong constant pyroclastic explosions visible from Guatemala City (~ 25 km NNE). On 19 January a small lava dome had formed at the W base of MacKenney Crater, and from there lava flows extended N, S, and W. On 2 February, a large lava flow was moving W and on 2 March another was advancing S. As of 9 March, explosive activity continued to eject scoria and gases from the upper crater of the new cone, and lava flowed from its NW base.
Information Contacts: A. MacKenney, Guatemala City.
Two small new cones in MacKenny Crater; flank lava flows
Two cones have been growing within MacKenney Crater in October and November. On 18 and 23 November, explosions alternated at about 30-60-second intervals from the two cones, 3 and 5 m high and about 10 m apart. Ejecta from the new cones fell on the outer flanks of MacKenney Cone on 23 November. Narrow lava flows on the W flank of MacKenney Cone were observed on 16 November. The highest vent feeding the flows was about 300 m below the summit. Lava extended as much as 500 vertical meters downslope.
Information Contacts: A. MacKenney, Guatemala City; R. Stoiber, R. Pool, D. Barnett, and other geologists, Dartmouth College.
Ejected blocks cause at least 12 injuries, damage roofs
On 21 January at 1520 lapilli and blocks were ejected onto the N flank [see also 12:1]. In the town of Calderas (roughly 3 km N of the vent), 12 people were injured, the zinc roofs of 25 houses were perforated, and coffee crops were damaged by 1/4-kg blocks about 25 cm in diameter. Residents of Calderas quoted by UPI said that blocks obstructed roads to flank villages. Blocks also caused several grass fires and killed some animals. In Santa Elena Barillas (roughly 6 km NE of the vent), Mesillas Bajas (roughly 5 km NE), and Mesillas Altas (roughly 4 km NNE), 3 cm of ash fell. Newspapers reported that rescue workers were trying to evacuate about 100 residents from a sparsely populated area near the volcano. As of the morning of 22 January the volcano was quiet.
Information Contacts: E. Sánchez and Edgar Quevec, INSIVUMEH; UPI; AP.
Cloud to 8 km; large tephra damages houses; lava flows
The explosion that ejected lapilli and blocks onto the N flank on 21 January was preceded by about 24 hours of low-level tremor, which strengthened about 15 minutes before the explosion. Tephra fell to the NE, with the 5 mm isopach about 15 km from the vent. Ash reached Chiquimula, 180 km to the ENE. Geologists visited the volcano and found a new crater about 160 m in diameter within MacKenney Cone. The small spatter cones that had been growing there in October and November had been destroyed.
A second explosion on 25 January was also preceded by about a day of tremor, initially banded, then increasingly vigorous for about 12 hours. During the 2.5 hours before the explosion, peak-to-peak amplitude reached 8 mm. The explosion, at about 1730, ejected a column that rose to 8 km altitude and was blown south by 70 km/hour winds. Many houses in El Caracol (3 km SW of the vent), El Patrocinio (3.5 km W), and Los Pocitos (6 km SSE) were hit by 25-cm blocks. The 5-cm isopach was about 4 km S of the crater. Tephra volume was probably less than 5 x 10⁶ m3. Lava flowed S but remained far from villages. The press reported at least 15 injuries (but only one that required hospitalization) and as many as 3,000 evacuees. The next day the head of the National Emergency Committee said that 600 people remained evacuated, 63 homes were damaged, and many cattle and pigs had been killed. As of mid-February, typical Strombolian activity had resumed, and no additional strong explosions had been reported.
Information Contacts: E. Sánchez, INSIVUMEH; Norman Banks and Michael Doukas, USGS; Prensa Libre, Guatemala City; Agence France-Presse; UPI.
Strong ash emission; lava flows; 600 evacuated
Beginning 30 May, Strombolian eruptions ejected ash clouds from MacKenney Crater [see also BGVN 12:07]. Explosions occurred twice/minute and were accompanied by rumbling. Lava flows were observed on the N flank.
After about 3 hours of increasingly vigorous harmonic tremor, a strong eruption occurred on 14 June at 1930. At El Caracol, 3 km SW of the crater, 10 cm of ash fell in 3 hours, collapsing the roofs of two houses. About 600 residents were evacuated. Lava flowed SW and was continuing to advance two days later. As of 16 June, an ash column rose 2-3 km above the crater and tremor of 15 mm amplitude was continuing.
Information Contacts: E. Sánchez, Edgar Quevec, and Enrique Molina, INSIVUMEH; Norman Banks, USGS.
Strombolian activity, seismicity precede June explosion
A strong 14 June explosive eruption was preceded by continuing Strombolian activity. During May, weak to moderate explosions from MacKenney Crater ejected pyroclastic material and gas in a dark column that sometimes rose 40-50 m and was carried S by the wind. Most of the pyroclastics fell within the crater. At the end of May, 80-100 explosions were occurring/hour, interspersed with some periods of quiet. Explosions continued at that rate through early June, decreasing to 40-60/hour after 4 June. Some periods of increased activity were recorded until 13 June, when a clear increase was observed.
During May, a lava flow emerged from the N flank of the cone, 80 m below the active crater. It moved down one or two narrow, well-defined channels to the saddle between MacKenney Cone and an older cone just to the N (Cerro Chino), where it spread, then continued SW over older flows to 1,800 m altitude. In some places, flow thickness reached 10 m. On steep slopes, the lava advanced at 3 m/minute. Hours before the 14 June eruption, an observer reported that an explosion occurred from the lava flow vent.
The eruption began at about 2000. A column of ash, cinders, lapilli, and small scoria fragments rose to 3,000 m above sea level (500 m above the summit) and was carried SW by the wind. An elliptical area of 4.4 km2 was covered by 6-10 cm of sand-sized tephra and lapilli. Cinder falls were reported 100 km S of Pacaya. The amount of material ejected was less than in the 21 January explosion and may have been similar to the volume of 25 January tephra.
Seismic activity associated with the eruption was recorded by several stations of the National Seismic Network. Stations PGC (1 km N of the crater) and TER (6 km SSW) registered an increase 15 hours before the eruption, and the increase was evident 5 hours before the eruption at REC station (6 km NE). At GCG (24 km N), the maximum seismic amplitude lasted 45 minutes, longer than for the 21 and 25 January explosions.
An alarm was given to the Comité Nacional de Emergencia (CONE) 2 hours before the eruption. The town of El Caracol (3 km SW) was evacuated by CONE. There were no casualties. After the 14 June eruption, activity declined rapidly. Lava emission stopped and the number of explosions registered on station PGC dropped to 20-30/day, continuing at that rate through the end of June.
Information Contacts: E. Sánchez, INSIVUMEH.
Lava production resumes; Strombolian activity
During the first 20 days of July, activity was weak, limited to sporadic explosions from MacKenney Crater. No lava flows had been observed since the strong 14 June explosive eruption. Activity increased on 23 July, to 5-10 explosions/15 minutes from MacKenney Crater as recorded by seismic instruments. About 26 July, a new lava flow was observed emerging from MacKenney Crater and advancing W. Two small vents were observed within MacKenney Crater, ejecting gas, dark gray ash and pyroclastics. Most fell back into the crater, but fresh bombs were found on the older summit cone about 100 m to the south.
Information Contacts: E. Sánchez, INSIVUMEH.
Cone destruction and subsequent growth; lava flows
Alfredo MacKenney provided the following observations of activity between 14 June and 22 November 1987.
14 June: From 0800-0900 an intense eruption sent an ash column to approximately 8 km. Lava flows descended N. MacKenney Cone was partially destroyed (figure 2). 5 July: A small cone was forming on the crater floor as its four craters ejected scoria and ash. 2 August: The new cone surpassed the borders of MacKenney Crater and was visible from the summit of Pacaya. Lava began flowing SW from the base of the new cone. 30 August: The growth of the new cone was noticeable. It had four active vents. 13 September: The new cone had continued growing. 25 October: The new cone occupied almost all of MacKenney Crater. Explosive activity persisted in the cone's 3 upper craters. From the E base the cone had reached 50 m height. 22 November: The new cone had surpassed the height of the previous cones that had, in 1775, reached the altitude of Pacaya's summit crater. Lava continued to flow SW from the base of the new MacKenney cone (figure 2).
Information Contacts: A. MacKenney, Guatemala City.
Strombolian activity continues; two small lava flows
Strombolian activity continued in January. Explosions accompanied block ejections and two small lava flows to the S. The active cone has been growing steadily since an intense eruption on 14 June 1987 that partially destroyed it.
Information Contacts: E. Sánchez, INSIVUMEH.
Frequent Strombolian explosions; lava flow still active
The geologic team that visited Tacaná on 27-28 January climbed Pacaya on 31 January. From the summit of Cerro Chino at 1330, they saw frequent ejections of steam and ash, and, less frequently, bluish gas plumes emerging from MacKenney Crater.
Periodic observations of Pacaya's activity were made during February by scientists listed below. Strombolian explosions ejected blocks and incandescent bombs from MacKenney Crater every few minutes, accompanied by detonations. During the evening of 13 February, detonations were audible from Guatemala City, 25 km NNE. Although the SW flank lava flow was not visible from Pacaya's summit, observation of nighttime incandescence on 22 February (from the road below San Vicente Pacaya) indicated that it remained active.
Information Contacts: James Vallance, Jorge Girón, Francisco Alvarez, Lee Siebert, and Gerardo Sánchez Rubio, Estación Regional del Centro, Instituto de Geología, UNAM, Guanajuato, México; A. MacKenney, Guatemala City.
Strombolian activity and lava flows
Strombolian eruptions accompanied by lava extrusion continued at Pacaya during 1988. The SW flank lava flow observed in February remained active for about 2 months. In March and April lava extrusion began from new vents about 200-400 m below the summit. Lava effusion stopped in May, but resumed 26 May from new vents on the SW flank and continued into June, feeding flows that traveled about 1 km down the W, WSW, SW, SSW, and S flanks. Counts of explosions derived by Otoniel Matías from INSIVUMEH seismic records (figure 3) indicate that explosions increased from a few hundred/day in early June to about 2,000/day in mid-June. Ash fell 2.5 km from the volcano on 11 June. Explosions dropped to a few hundred/day in July and lava effusion stopped from all but one vent. Activity remained low in August, although a SW flank lava flow was emitted on 23 August. A lava flow formed on the NW flank at about 2330 on 6 September, and was active until 18-19 September. When the seismograph resumed operation in mid-September, daily explosion counts ranged from about 1,500 to 2,300. On 20 September a new lava flow began on the S flank at about 2,100 m altitude. Activity increased late September to early October, when some seismic events were felt on Cerro Chino (on the NW somma rim) and rumblings were heard in the S part of Guatemala City. A new lava flow was emitted 4-5 October from a vent at 2,070 m on the SW flank. The daily number of explosions peaked at 3,300 on 5 October, and gradually decreased after 10 October to fewer than 1,000 by 29 October, when lava emission ceased.
During fieldwork 12-26 November on the S side of Pacaya, geologists observed MacKenney Crater during another period of increased activity. On 20 November the active vent was seen from the summit of the 1775 cone. More or less continuous weak Strombolian explosions ejected bombs to a few tens of meters above the crater rim. These were punctuated several times a minute to every few minutes by detonations from stronger explosions that ejected incandescent bombs and blocks to 100-200 m height from a vent at the NW end of MacKenney Crater. Some incandescent blocks rolled 400 vertical meters down the flanks of the cone as far as the moat between MacKenney Crater and the N somma rim. Incandescent ejecta was sometimes visible in daylight from the somma rim in contrast to the less vigorous February activity, and daytime explosions could also be seen from Guatemala City, 25 km NNE.
An area of active fumaroles was located on the N flank about 100 m below the summit. The accumulation of near-vent ejecta in the absence of major explosions since February had considerably narrowed the crater's width and recently raised MacKenney cone to an altitude slightly above that of the 1775 cone, which had formed the highest point on Pacaya at 2552 m. A lava flow originated in early November from a vent high on the SW flank at about the elevation of the saddle between the two summit cones. Lava flowed in several channels to about 2,000 m altitude on the SW flank, and extrusion was continuing on 26 November.
Information Contacts: Otoniel Matías, Jorge Girón, and Enrique Molina, INSIVUMEH; Jim Vallance, Michigan Tech; Lee Siebert, SI.
Strong explosions; ashfall to coast; two flank lava flows
Vigorous explosive activity from Pacaya 7-10 March deposited ash to the S coast (more than 50 km away), and lava flows advanced several kilometers from two flank vents. Activity at Pacaya in recent months had been characterized by moderate summit Strombolian activity and production of small lava flows from upper flank vents. About 1600 seismic events/day were recorded through most of February. A slight increase in seismicity was observed 25-27 February, and the number of events varied from 1700 to 2300, 28 February-6 March. A logarithmic increase began 7 March at about 0600, continuing until the onset of the main eruption at about 1300 (figures 4 and 5).
On 7 March at about 1030 Pacaya was erupting normally, with small Strombolian bursts every 2 minutes from MacKenney Cone. At around 1100, fumaroles on the E face of MacKenney were emitting about 5-10 times as much vapor as usual. A large white steam plume emerged from MacKenney Cone at about 1130 and was carried NE by the wind. Strombolian explosions had stopped. Explosions from MacKenney crater at about 1230 ejected a reddish-brown ash cloud, consisting of lithic fragments produced during crater enlargement, that rose about 1,000 m. At about 1300, MacKenney Cone began to erupt dense dark ash that rose 2,000-3,000 m above the vent and was carried NE. During the afternoon, incandescent tephra rose to an estimated sustained height of 2,000 m, punctuated by explosions that ejected black ash and block-sized tephra to 3,000 m above the crater. Sheet-like flows of incandescent material and other debris, apparently fed by column collapse, moved about 200 m down the upper flanks on all sides of the summit area, exhibiting serrated fronts. Light ashfall mixed with rain occurred at Cerro Grande, El Chipilinar, San Carlos, and Santa Elena Barillas (all within 7 km and NE of the crater). At 1930, light ashfall was reported in the Barberena and Cuilapa areas (30-35 km SE). Lapilli and ash began to fall in the El Caracol area (3.5 km SW of MacKenney crater) at 1945. Bombs and blocks as much as 1.5 m in diameter fell in the La Meseta area 1-1.5 km N of the vent, forming impact craters up to 3-4 m in diameter and 1-1.5 m deep. By 2000, the ash plume was rising 2,400 m above MacKenney crater. Small pyroclastic flows were observed at that time on the SW flank, descending to about 2,000 m elevation. Explosive activity declined after 2000 and no more pyroclastic flows were observed.
Between 1230 and 1245, Zurgen Philipp observed a bulge forming on the N flank at about 2,200 m elevation, about 20 m E of the post-1983 hornito on the somma floor. As vigorous ash emission began from MacKenney Cone at about 1300, lava broke out from the bulge and flowed W (figure 6), ponding to about 10 m depth on the somma floor before overflowing toward the town of El Patrocinio (3.5 km W of the summit). At least two more vents opened at about 1,900 m elevation between Pacaya and Cerro Chino, contributing lava to the flow. Five lobes of aa, 2-3 m thick, advanced along a front about 0.4 km wide at a mean velocity of 20 m/hour. The flow burned trees and young coffee plants along its N side and cut a small road, but did not approach any houses. By 2000, the flow was ~ 1 km E of El Patrocinio and was moving W at 4-7 m/hour. Temperature measurements by thermocouple on 7 and 8 March yielded flow temperatures that varied between 860° and 1,018°C. The Comité Nacional de Emergencia and INSIVUMEH evacuated the 120 residents of El Caracol. Evacuation of El Patrocinio (population 900) was considered, but the flow's rate of advance had slowed to about 1 m/hour by 1500 on 8 March and officials decided not to require its evacuation. The Comité de Reconstrucción Nacional is relocating the people of El Caracol to a new village site.
On 8 March at about 0815, activity increased again. Explosions from MacKenney crater fed an ash cloud that rose 1,000-3,000 m above the crater. Strong winds carried the cloud SW over El Caracol toward Escuintla (20 km from Pacaya). For 3-4 hours during the afternoon of 8 March, summit tephra production declined to moderate Strombolian explosions typical of Pacaya's long-term activity. Then lava fountaining, accompanied by increased seismicity, resumed over a period of hours in late afternoon when loud explosions were heard at a rate of about 20/minute. Activity decreased slightly early 9 March, but summit fountaining, explosions, and felt detonations continued. A column of sand- to block-sized tephra rose continuously from the crater to about 2,000 m height. Light ashfall on the S coast and near the Guatemala-El Salvador border (more than 80 km from Pacaya) was reported 9 March. Ash eruptions and strong NE winds persisted through 10 March, but activity had ended by the morning of 11 March.
A second lava flow began to emerge from a vent at 1,500 m altitude on the SW flank on 9 March at 1515. By 1930, the flow had moved about 1 km SW, and by 1640 the next day its front had reached 1260 m elevation while continuing to advance at 7 m/hour. The flow had reached 1220 m elevation by noon on 11 March, but was moving at less than 1 m/hour, and by 12 March it had stagnated. The flow cut a road and water line but did not reach inhabited areas.
During the eruption, about 75 m of the summit of MacKenney Cone was destroyed (figure 7). The crater's diameter was enlarged from 50-75 m before the eruption to an elliptical crater with horizontal dimensions of about 200 x 300-350 m. After the eruption, the crater floor was about 50 m below the rim. A single vent on the E end of the crater floor produced a strong white gas plume that rose several hundred meters.
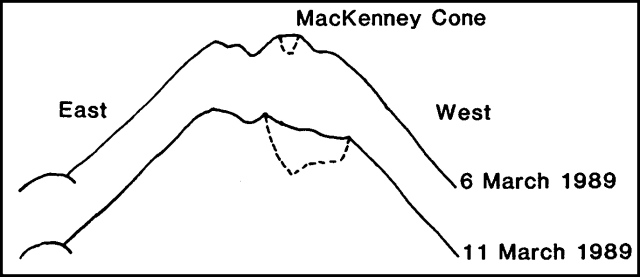 |
Figure 7. Profile of Pacaya looking south from Cerro Chino on 6 and 11 March, showing the changed morphology of MacKenney Cone. Courtesy of INSIVUMEH and the Univ of Puget Sound. |
Images of the eruption from NOAA's GOES satellite were obtained starting 9 March at 1800 (table 1). The plume extended roughly WSW-SW to 20 km off the Guatemala coast and was at least 3000 m high. On 10 March, surface winds blew the lower part of the plume S, while upper level winds (3000-5500 m altitude) carried the upper portions of the plume to the SW. At about 1300 the plume appeared to separate from the volcano. No plume was evident 11-13 March.
Table 1. Summary of Pacaya plume data from the GOES geostationary weather satellite, 9-10 March 1989. Courtesy of NOAA/NESDIS.
| Date | Time | Comments |
| 09 Mar 1989 | 1800-2100 | Plume extends WSW to ~20 km off the SW Guatemalan coast. |
| 10 Mar 1989 | 0600 | Lower part of plume extends S while higher altitude portion extends SW. |
| 10 Mar 1989 | 0600-0800 | Leading edge of plume just off the central coast of Guatemala. |
| 10 Mar 1989 | 1130 | Plume extends 180 km SW. Cloud top temperature of 7°C corresponds to altitude of 3,000 m. |
| 10 Mar 1989 | 1230-1300 | Plume seems to be separating from volcano. |
| 10 Mar 1989 | 1300-1400 | Definite separation from volcano. |
Information Contacts: E. Sánchez (Subdirector General); Otoniel Matías, Enrique Molina, Roberto Solís, Rodolfo Morales, and Jorge Girón, INSIVUMEH; Zurgen Philipp, Antigua, Guatemala; Albert Eggers and Keith Brunstad, Univ of Puget Sound, USA; Michael Doukas, USGS; Sheldon Kusselson and Otto Karst, SAB.
Gas bursts and minor Strombolian spattering but no lava flows
Gas bursts from MacKenney Crater's inner crater vent were observed during fieldwork between 1500 and 1730 on 4 January. The gas bursts, of varying intensity and duration, occurred about every 15 minutes. Some were accompanied by Strombolian spattering; the most energetic lasted several seconds and ejected spatter to 40 m height. A mound of agglutinated spatter was centered around the 1-m-wide vent. The inner crater was about 60 m in diameter and 30 m deep, with its S wall against the inner wall of MacKenney Crater. Rockfalls were frequent on the steep inner crater walls. Near the inner crater rim, the floor of MacKenney Crater was muddy and strewn with small blocks of spatter. Residents of the area said that this part of the crater floor had recently been occupied by a small lake. Active fumaroles were abundant along the upper E wall of MacKenney Crater. No active lava flows were evident.
Information Contacts: S. Halsor, Wilkes Univ; C. Chesner, Eastern Illinois Univ.
Renewed explosive activity builds new cone
Activity had been limited to degassing from fumaroles since the March 1989 eruption. Moderate steam emissions and a rumbling noise were noted during a summit climb on 29 November. Deep rumbling noises and a weak red glow within the crater were reported by nearby residents at the beginning of January, and geologists observed gas bursts and Strombolian spattering during 4 January fieldwork. Observation trips on 27 January and 4 February revealed a growing cone on the floor of MacKenney Crater, with intermittent explosive activity that occurred every 2-5 minutes.
Information Contacts: A. MacKenney, Guatemala City.
Continued weak Strombolian explosions; low SO2 flux
Volcanologists from INSIVUMEH and Michigan Tech visited Pacaya on 13, 14, 17, 18, and 28 February and 1, 2, 3, and 4 March, and flew over the volcano on 16 February. The following is from their report.
"Activity at Pacaya continued at a low level, consisting of brief (10-60 second), weak (ejecta typically thrown 2-100 m), Strombolian explosions with reposes of <1 to several minutes. All activity was from a small cone, 6 m high and 8 m wide at its rim, within MacKenney crater. The explosions were accompanied by gas emission (with jet-like noise) and often by fine ash clouds.
"On 17 February, during activity that was typical of the observation period, 78 COSPEC scans were made from a ground observation site 1.25 km from MacKenney crater (at Cerro Chino). Pacaya was emitting SO2 at an average rate of 30 t/d, with the measured range varying between 3 and 130 t/d. Higher fluxes were directly associated with observed small explosions. The new SO2 observations at Pacaya were much lower than values measured several times from 1972 until 1980 (Stoiber et al., 1983; reference under Santiaguito), which were generally between 250 and 1,500 t/d."
Information Contacts: Otoniel Matias and Rodolfo Morales, Sección de Volcanología, INSIVUMEH; W.I. Rose, Jimmy Diehl, Robert Andres, Michael Conway, and Gordon Keating, Michigan Technological Univ.
Strong Strombolian activity and small lava flows
Strong Strombolian activity that fed a tephra column 4.5 km high began at 1130 on 14 July and continued for about 3 hours. Lapilli fell S of the volcano and onto the towns of El Patrocinio (3.5 km W of the crater) and El Caracol (3 km SW). Two small lava flows were extruded, extending about 150 m to the N (roughly 200 m wide) and SW (about 10 m wide). The activity destroyed the small cone that had been growing within MacKenney Crater and ejected debris that had clogged much of its floor, leaving a significantly larger crater.
Information Contacts: E. Sánchez and Otoniel Matías, INSIVUMEH.
Eruption of lava and ash, attributed to opening of new crater
Press sources reported that an eruption of lava, gases, and ash occurred during the night of 16 September. The activity was attributed to the opening of a new crater. A "state of alert" was declared by INSIVUMEH due to the activity; no damage or injuries were reported.
Information Contacts: ACAN, Panama City, Panama.
Increased Strombolian activity and seismicity; aa lava
Fieldwork was conducted at the volcano by a group from the Univ de Genève (mid October-4 November), and scientists from Michigan Technological Univ and Guatemala (25 November).
The following is modified from a Univ de Genève report. Strombolian activity increased during October, to >400 recorded explosions/day. Scientists visting the volcano observed explosions every 30 seconds to 5 minutes (17 and 21 October), and counted up to 17 explosions during a 15-minute period (28 October). The explosions ejected incandescent material to 10-50 m above the 25-m-tall cone in MacKenney crater, and were visible on clear nights from Guatemala City (25 km NNE). The number of seismic events (recorded by a joint INSIVUMEH-Univ de Genève digital seismic station) increased steadily, from 147 on 13 October to 457 on 20 October, and averaged over 450 daily during the following several days. Tremor was recorded during periods of closely spaced explosions (including the 28th), with 5 hours of continuous tremor recorded on the 20th. As of 4 November, two lava flows were moving down the N flank of the volcano, and explosive activity was unchanged.
The following report is by Michael Conway. "Vertical Strombolian eruptions (lasting from seconds to <1 minute) from the crater of MacKenney cone occurred every 3-5 minutes, hurled incandescent bombs (to 2 m in diameter) to 150 m above the vent, and were accompanied by a jet-like sound. Black eruption clouds, with the coxcomb geometry characteristic of phreatomagmatic blasts, were rarely observed, suggesting that the conduit is moderately well sealed from infiltrating meteoric waters. Low-temperature fumaroles (up to 100°C) were active on the E summit of MacKenney cone, and patches (areas of one to tens of m2) of yellow sublimates were common.
"An aa lava flow was being extruded from a pit crater (50 m long, 10-15 m wide, and 2-5 m deep) on the N flank of MacKenney cone, 40-65 m below the summit; opening of the pit crater may be related to an eruptive episode that occurred on 16 September. A lava channel, 5 m wide and 2-4 m deep, delivered lava to the low-lying area between MacKenney cone and Cerro Chino. The lava flux was variable and flow velocities ranged, roughly, from 1 to 6 km/hour. Collapse of the lava flow front was common (slopes of the cone are about 30°), exposing fresh lava and sending hot block avalanches down the channel. The latest stage of lava flow activity began on 3 November and has erupted two flow units, one of which was still active. Lava flows erupted since March have effectively armored the N-central flank of the cone. A result of continued construction of MacKenney cone is that, for the first time, the cone is visible from San Francisco de Salas (2.5 km downslope, to the N)."
Information Contacts: Jean-Jacques Wagner, Thierry Basset, and Jean-Charles Gentile, Univ de Genève, Switzerland; Michael Conway, Michigan Technological Univ; Ricardo Mata, Guatemala City, Guatemala; E. Sánchez and Otoniel Matías, INSIVUMEH.
Strombolian activity and lava flows
Vigorous Strombolian activity continued during December and early January. Explosions occurred at a rate of about 1-2/minute in one 38-minute period of detailed observation during a 5 January summit visit. The explosions hurled incandescent globs of magma to 15-100 m above the crater. Four different lava flows were observed moving down the N slope of MacKenney Crater, before turning W at the break in slope with older lavas. The oldest of the moving flows was aa to blocky lava, which had apparently been active for several days before the visit. This flow was 450 m long, 35 m wide, and 4 m thick, with well-developed levees, and had essentially been separated from its source. Its front was at the base of the steep slopes of MacKenney Crater, where thick and extensive deposits of post-1987 lava created a nearly level flow field. At that point, it was actively collapsing and moved at about 1 m/hour during 5 hours of observation. One incandescent block that spalled off had a temperature of 967°C and a somewhat plastic character when struck by a heavy hammer.
A fast-moving, new flow was observed traveling 15 m/minute in the same channel as the oldest flow, but had not yet advanced to more than half the length of that flow. Lava flows and Strombolian explosions were again visible from Guatemala City in the early morning of 14 January.
The inactive crater and the small crusted-over lava lake, on the N side of MacKenney Crater, were also visited on 5 January. Two smaller lava flows were being emitted from the lava lake, just E of the second, fast-moving flow. These flows had reached lengths of 150 and 300 m, and one was readily accessible. Its temperature was 1086°C and it flowed from its vent at a rate of 6 m/minute. A 2-m-tall, sublimate-encrusted hornito, located near the lava lake, emitted 957°C gases rich in HCl.
Information Contacts: Stanley N. Williams, Marta Lucía Calvache, Stephen J. Schaefer, Timothy Ross, and other field trip participants, Louisiana State Univ, USA; Otoniel Matías, INSIVUMEH.
Strombolian eruptions and small lava flows; little SO2 emission
Strombolian eruptions occurred every 1-3 minutes and small lava flows were active during 3 hours of fieldwork on the morning of 6 February and a 10 February overflight by INSIVUMEH and Michigan Technological Univ volcanologists. Similar conditions had been reported on 5 January (15:12). The lava flows emerged from a S flank vent about 100 m below the summit of MacKenney Cone. Substantial growth during the past year had built MacKenney Cone to several tens of meters above the pre-1965 summit crater.
SO2 emissions (determined by COSPEC from neighboring Cerro Chino cone) averaged 23 ± 11 t/d on 6 February, with a range of 4-60 t/d. The previous measurements, on 17 February 1990, yielded a mean of 30 ± 28 t/d and a range of 3-131 t/d (15:03).
Information Contacts: Rodolfo Morales and Gustavo Chigna, Sección de Vulcanología, INSIVUMEH; W.I. Rose, Robert Andres, and Kimberly Kogler, Michigan Technological Univ.
Strombolian activity declines to ash emission as seismicity decreases
In comparison with observations made in early February (16:02), visits to the volcano in mid-March-early April revealed a decrease in eruptive activity. A small vent with night glow on the W flank (50 m below the summit), periodically the source of incandescent lava fragments that rolled down the upper flank, had disappeared by 21 March. Strombolian activity from a cinder cone in the W quarter of MacKenney Cone's 1987 crater ejected material to 100-150 m height. The number of explosions declined from about 20 to 1-2/hour over the mid March-early April observation period, and during the first week of April, the primary ejecta changed from lava spatter to ash. Some collapse occurred on the cone's interior walls. Two explosions, observed during a 3-hour period on 10 April, emitted ash clouds hundreds of meters high. Lava flow activity, prominent from mid-November through February (15:11-12 and 16:02), declined, and ceased entirely by 10 April. A decrease in seismicity, coincident with the decrease of eruptive activity, began about 1 April and continued as of 19 April.
Information Contacts: Otoniel Matías and Rodolfo Morales, Sección de Vulcanología, INSIVUMEH; Michael Conway, Michigan Technological Univ, Houghton, USA; P. Vetsch, SVG, Switzerland; Thierry Basset, Univ de Genève, Switzerland; Alan Deino, Berkeley Geochronology Laboratory, Institute of Human Origins, USA.
Explosive eruptions destroy cone and crater; crop damage; evacuations
Fourteen eruptions occurred during the most recent phase of strong explosive activity, 6 June-1 August, with the strongest and most destructive activity occurring 27-31 July. Activity was at low levels as of 15 August.
The following report from Philippe Rocher describes activity through mid-June.
"During the first half of 1991, activity was continuous and relatively quiet, with several small eruptions and lava flows from the main crater. This last cycle of activity began in November 1990. The continuous ejection of material built a cone that reached 400-500 m height. Although seismicity showed no significant changes in May, occassional pulses of increased surface activity occurred. On 11-15 May, explosion counts ranged from 1,170 to 1,730/day and a new lava flow was emitted. The cone reached 500 m high and lava traveled down the SE slope.
"On 6 June, explosive activity increased again, with explosions every 10-40 seconds and ash reaching 100-500 m heights. The next pulse occurred on 11 June. On the following day, strong explosions sent material to 500 m height and triggered avalanches that destroyed the summit of the cone. Lava flowed down the SW slope. Ash emissions to 500 m height and short lava flows characterized the next increase, lasting 4.5 hours on 14 June. On 16 June, a 10-hour episode of strong explosions ejected a black plume to 600 m height and caused avalanches that traveled to the foot of the volcano. Between the different eruptions, strong degassing continued, accompanied by B-type earthquakes and small, low-amplitude (about 1 mm) tremor episodes."
The following is from Eddy Sánchez.
"The most explosive and destructive activity during the current phase of activity began at 0100 on 27 July. Strombolian activity destroyed the main crater, and ejected ash and lapilli to the SW, principally affecting Caracol, Rodeo, and Patrocinio, the same towns affected by the eruption on 25 January 1987. Activity decreased at 0230." The press reported that three people were injured and 2,000 left homeless.
"Intense activity resumed at 1330-2230 on 30 July, with four cycles of moderate explosions, each cycle lasting 1.5 hours. Similar activity occurred the next day, when columns of fine ash and gas rose 400-1,000 m above MacKenney Crater. The last strong episode of Strombolian activity began at 0230 on 1 August, when ash clouds reached 700-1,000 m heights, with pulses and pauses of 30-60 minutes, and blocks (>=5 m in diameter) were ejected onto the flanks of the volcano.
"Local agriculture was significantly damaged by airfall from this recent phase of explosive activity. Corn and bean fields were destroyed, as well as part of the coffee crop. Airfall thicknesses ranged from 0.5 to 26 cm, with up to 5 cm in Rodeo and 15 cm in Santa Lucía Cotzumalguapa (figure 8). The ash was deposited as far as 55 km WSW (Pueblo Nuevo Tiquisate).
"During the last eruption, on 1 August, INSIVUMEH recommended to emergency agencies that the approximately 1,500 residents of Caracol, Rodeo, and Patrocinio be evacuated, due to the hazard of a new violent eruption. The next day, seismic and eruptive activity decreased considerably, allowing the evacuated people to return home. Activity continued to decrease quickly, with 40 B-type microearthquakes (frequency, 4-5 Hz, and amplitude, 2.0-2.5 mm) recorded daily on 7 August. Activity as of 15 August was considered at low levels."
Information Contacts: E. Sánchez, INSIVUMEH; Philippe Rocher, L.A.V.E., France; ACAN network, Panama City, Panama.
Vigorous explosions and lava fountaining
A strong explosive phase occurred on 22 August, after 3 weeks of relative quiet that followed strong explosive activity from 6 June to 1 August. Volcanologists visiting the summit observed an increase in fumarolic activity beginning at 1400, and the start of small explosions 20 minutes later. The frequency and sound of the explosions increased, and by 1425, lapilli and blocks were rising above the rim of the crater, before falling back into the interior. Between 1,500 and 1630 the explosions increased in size, feeding a continuous lava fountain 100-200 m high. The eruption entered its most vigorous period at 1700, with a black plume 1,000 m high, and explosions heard to 1 km from the crater. Activity declined 1710-1730, as lava fountaining was replaced by strong black plume emission that gradually ceased.
The summit was visited again on 20 September, two days after strong explosions were observed from Guatemala City (45 km N). Fresh bombs, flattened on impact, with crystal-rich interiors, covered the E part of MacKenney Cone. The explosions on 18 September coincided with the last in a 24-hour series of earthquakes that killed at least 25 people. The largest shock [M 6.1 at 5 km depth] was centered about [30 km NNW] of the volcano.
Information Contacts: Franck Pothé, Sallanches, France; Sección de Vulcanología, INSIVUMEH; USGS NEIC.
Small explosions and lava flow
The following, from Michael Conway, describes 11 November fieldwork by geologists from INSIVUMEH and MTU. On 10 November, a small-volume lava flow began to erupt from the summit of MacKenney cone at about 1600. By the evening of the following day, the flow had traveled 50-100 m down the cone's S flank. This was the first time in several years that a flow was erupted onto the S flank, indicating that the powerful explosive eruptions of July and August resulted in major changes in the vent geometry of MacKenney cone.
Several small eruptions observed on the afternoon of 11 November produced black plumes that rose as much as several hundred meters above the vent, generally accompanied by a jetting sound. Widely spaced (50-125 m) en echelon fractures were identified on the W flank of MacKenney cone. The fractures began 10-30 m below the summit and continued down the flank for roughly 50-100 m. A series of point-source fumaroles marked the fractures, which may have originated as the W part of the cone sagged into an evacuated shallow magma chamber following the powerful pyroclastic eruptions of July-August.
Information Contacts: Rodolfo Morales and Otoniel Matías, Sección de Vulcanología, INSIVUMEH; Michael Conway, Michigan Technological Univ, USA.
Stronger explosions; October lava extrusion continues
During 1991, 14 eruptive episodes were documented at Pacaya, with the strongest in July and August (figure 9 and 16:7 & 9). Continuous gas emission, punctuated by occasional explosive activity, characterized the activity until 28 September, when explosions began to eject pyroclastic material to 25-35 m above the main crater. Weak to moderate explosions were more frequent in October. Extrusion of lava onto the SW flank began on 27 October, and this flow remained active as of early January.
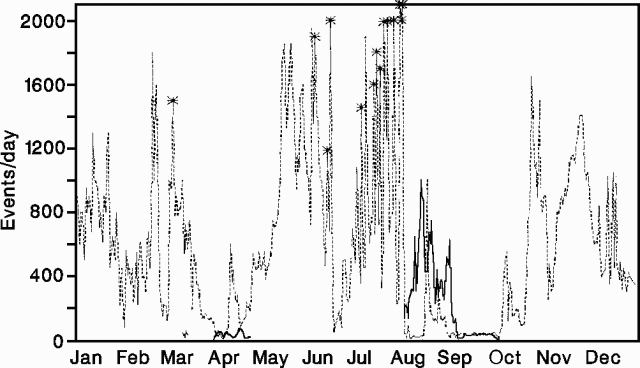 |
Figure 9. Number of seismically recorded explosions (dashed lines) and B-type events (solid lines) at Pacaya, 1991. Stars mark the strongest eruptive episodes. Courtesy of INSIVUMEH. |
Strong explosions on 8 January ejected substantial amounts of pyroclastic material to 200-400 m height. The explosions destroyed part of the active crater, and were accompanied by acoustic waves that were heard and felt over a radius of 15 km. Seismic activity increased for 7 hours on 8 January, with 80-150 recorded explosions/hour accompanied by tremor of constant frequency and higher amplitude. Explosion shocks and tremor declined after the 8 January activity. INSIVUMEH's volcanology section notified the Emergency Committee and recommended that appropriate precautions be taken. Preparations were made to evacuate the 5,000 residents nearest the volcano, but activity declined and none were evacuated. Vigorous explosions resumed on 13 January.
Information Contacts: Sección de Vulcanología, INSIVUMEH; Reuters.
Numerous explosions; lava flows; temporary evacuations
Activity was unusually high through May, with several thousand explosions recorded seismically every day (figure 10). Powerful pyroclastic episodes in early May temporarily forced the evacuations of villages near the W base of the volcano. During the first week of May, two lava flows were extruded from vents near the NW and S summit of MacKenney cone.
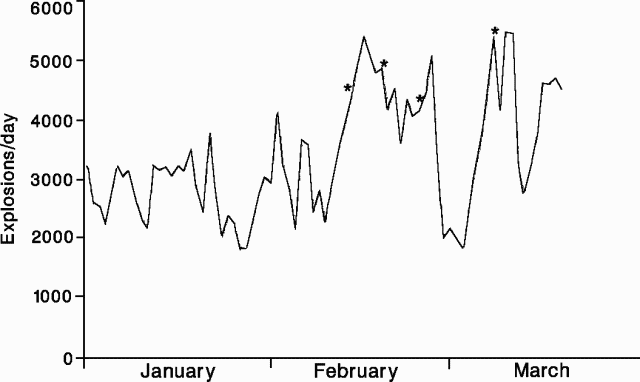 |
Figure 10. Daily number of explosions recorded seismically at Pacaya, January-March 1992. Stars mark the strongest eruptive episodes. Prepared by INSIVUMEH. |
Pacaya has erupted almost continuously since January-February 1990, when Strombolian activity was observed producing a new cone. Strong Strombolian activity destroyed the new cone and lava emission began in July 1990. Since then, lava emission has continued, and periodic increases in explosive activity have resulted in crop damage and the evacuation of up to 1,500 people.
Information Contacts: E. Sanchez and Otoniel Matías, INSIVUMEH, Guatemala City; Michael Conway, Michigan Technological Univ, USA; Rodolfo Morales, INSIVUMEH, Guatemala City.
Stronger explosive activity; lava flows
A new cycle of activity has begun since June, with increased energy released by explosions. Continuous degassing from the active (MacKenney) crater produced sustained whitish columns that rose 200-300 m. In July, explosion seismicity increased, with explosions occurring at intervals of 5-30 seconds (figure 11). The strongest were quite energetic, ejecting abundant pyroclastic material that rose 300-400 m above the crater, and generating acoustic waves that were heard and felt in nearby towns. A moderate amount of ash was carried about 5 km W and NW by winds (toward El Patrocinio and El Cedro).
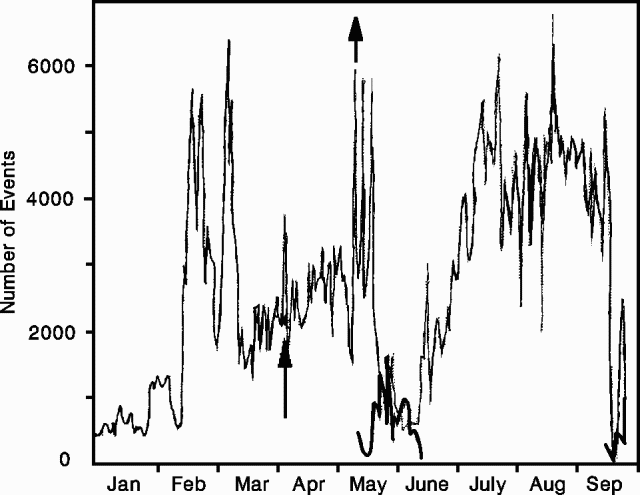 |
Figure 11. Number of explosion events (thin line) and B-type shocks (heavy line) recorded at Pacaya, January-early September 1992. Arrows mark the strongest explosive episodes. Courtesy of INSUVEMEH. |
Activity continued through August. Increased lava extrusion 22-23 August fed a flow that advanced 750 m down the W flank. Two others traveled 75 and 250 m to the SW. Explosions, generally moderate to strong, continued at a rate of 2-5/minute, generating sound waves. The Comité Nacional de Emergencia (CONE) was alerted to the possibility of a stronger eruption.
Activity intensified on 6 September between about 0900 and 1700. Vigorous lava extrusion produced two flows that descended 300 and 1,150 m down the W and SW flanks, respectively, accompanied by moderate Strombolian activity. Explosions from MacKenney Crater ejected abundant ash and fine sand within clouds of white fume that reached about 500 m height. Ash fell on towns about 3.5 km W to SW of the volcano (El Patrocinio, El Rodeo, and El Caracol). Activity then returned to normal levels, about 200-300 explosions per day.
INSIVUMEH officials warned that this pattern of activity could last several weeks and could precede a much stronger eruption. The authorities and people living around the volcano were advised to remain alert to emergency pronouncements issued by CONE. Powerful pyroclastic episodes had forced temporary evacuations of villages near the foot of the volcano in early May (17:05).
Information Contacts: Rodolfo Morales, Gustavo Chigna, and E. Sánchez, INSIVUMEH, Guatemala City.
Explosions and lava flows; summary of 1992-93 activity
During an overflight on 8 November 1993, Stephen O'Meara saw brief glimpses of MacKenney crater (figure 12) through breaks in the clouds. A small cone was seen at the center of the horseshoe-shaped MacKenney crater, which was breached to the S. Incandescent lava issued from a vent near the SW wall of MacKenney crater and flowed SE across the summit crater floor. The SE slope was covered by a fresh lava flow with overlapping lobes that extended two-thirds of the way down the flank. On 10 November, ash eruptions originating from one or more vents in MacKenney crater were observed from the S near Los Pocitos at intervals of about 30 seconds, with larger explosions occurring several times a minute to once every five minutes. At night three incandescent lava channels could be seen descending the SE flank.
Participants of the Santa María Decade Volcano Workshop observed MacKenney crater ash eruptions from vantage points on Pacaya's N caldera rim. The previous night, 12 November, strong detonations from Pacaya were heard in Antigua, Guatemala, 25 km NW. Following destruction of the upper cone by strong explosions in 1989 and 1991, MacKenney cone had rebuilt itself to a height comparable to that in 1991. Its summit was slightly higher than the pre-1965 cone immediately to the E (figure 12), and was again visible from San Francisco de Sales on the N flank. A line of fumaroles marked the mostly buried N rim of the 1989 crater. Fresh lava flows with pronounced levees from eruptions in 1990 and 1991 coated the N and NW flanks, and covered the moat floor between the caldera rim and MacKenney cone, almost burying the upslope side of the prominent spatter cone from a 1984 eruption (figure 12).
Explosions several times a minute to every few minutes ejected blocks and ash to heights of about 150 m, accompanied by detonations. Larger pulsating ash columns were also seen punching through the persistent summit cloud cap during brief observations the following day from 20 km E on the road to Cuilapa.
Summary of 1992 and 1993 activity. Following a period of increased activity June to September 1992 (17:08) explosive activity declined, although lava flows continued to travel about 1.5 km to the SW.
An increase in the amplitude of explosion seismicity took place at the end of October and beginning of November 1992. After 15 November, the frequency of explosions increased (figure 13), reaching 4,800-5,000 explosions/day around 25 December, and 7,800 explosions/day in early January 1993.
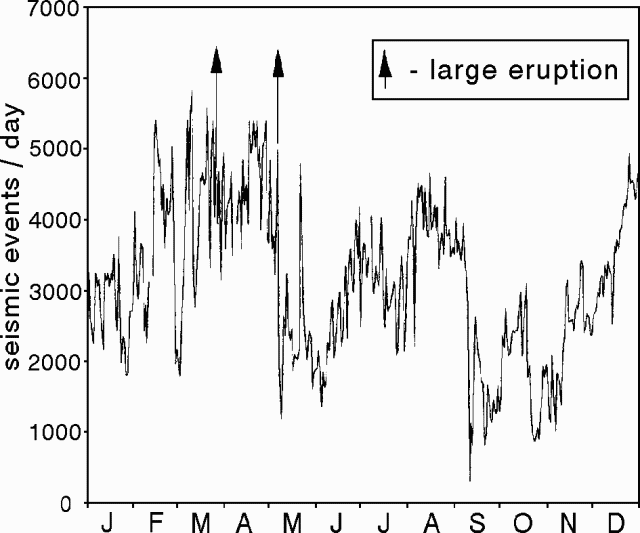 |
Figure 13. Daily number of explosions of Pacaya during 1992 determined from seismogram records. Vertical arrows mark large eruptions. Courtesy of Otoniel Matías (INSIVUMEH). |
On 10 January 1993, a large explosive eruption lasting 4 hours was accompanied by collapse of the S rim of MacKenney crater, producing a hot avalanche that traveled 3.5 km to the SW, cutting the road between El Caracol and Los Pocitos. The crater-rim collapse, the first since the birth of MacKenney crater in 1961, involved an area 75-80 m wide and 30 m deep. During the eruption, a small lava flow traveled down a 7-15 m deep channel formed by the crater-rim collapse to reach 1,600 m elevation.
Column collapse produced a nuée ardente that traveled 2 km SE to 1,600 m elevation, leaving a deposit just 7-10 cm thick. The color of ash in the 4-km-high eruption column changed from gray to red as it passed through a rain cloud. Ashfall was distributed NW to a depth of 6 cm at a distance of 5 km from the crater. Traces of ash fell in Guatemala City and beyond, causing some damage to jet aircraft turbines. Ashfall burned leaves to 2.3 km NE of the crater and dehydrated leaves to 5-7 km away, which later fell. Residents of villages in this region suffered irritation to the eyes and nose. In the two weeks following the eruption, wind-blown ash from the nuée ardente deposit reached heights of >3.5 km and was redistributed 40-45 km to the SW.
INSIVUMEH and CONE (Comitte Nacional de Emergencia) had predicted a strong eruption 3 days prior to 10 January, and the villages of El Caracol (3 km SW) and El Patrocinio (4 km W) were evacuated during the eruption. Following the eruption, typical activity continued at Pacaya, with the daily number of explosions decreasing intermittently from 7,000 to about 3,000/day by mid-year (figure 14). An increase in the amplitude of explosion seismicity in mid-May was not accompanied by stronger eruptions. Lava flows traveled almost continuously for about 1 km down the S flank from a source just below the breached S crater rim.
On the evening of 21 September, a vertical eruption column 2-2.5 km high with a 300-400 m incandescent base was accompanied by vigorous lava effusion and strong tremor. Lava fountains reached 700 m heights at the beginning of the 7-hour eruption, and were most vigorous for 9-15 minutes shortly after midnight. Ash fell at El Caracol, although no damage was recorded. Lava flows traveled 1 km to the S over the 10 January flows.
At the beginning of the second week of October the frequency and magnitude of activity increased for 9 hours. A dark ash column rose to a sustained height of 400 m, depositing ash to the W. The lower 200 m of the column, which reached heights of 700-800 m, was incandescent.
Information Contacts: Otoniel Matías, INSIVUMEH; Lee Siebert, Smithsonian Institution; Stephen O'Meara, Sky & Telescope.
Strombolian activity continues
Pacaya continued to erupt on a regular basis. Between late afternoon on 5 February and sunrise on 6 February, Stephen O'Meara photographed and videotaped various stages of moderate eruptive activity from a vantage point about 4 km SSW of the summit (about half-way between the villages of Los Pocitos and El Caracol). Strombolian activity had increased markedly since he visited the volcano in November 1993. Strombolian fountains rose 100-200 m, and some of the larger ash clouds rose upwards of 400 m. An incandescent lava flow emerged from a single opening in MacKenney crater and traveled down the SW flanks. That main flow then divided into two separate lobes, each of which had several rivulets. Incandescent boulders continually rolled down the flank from the fronts of these flows. The longest flow extended to about 1,800-m elevation.
Activity was strong in the late afternoon, weak in the morning, and throughout the night eruptions occurred about once every minute. In the afternoon, the ash plumes appeared dark gray or black and sometimes there were 3-4 ash ejections in rapid succession. Stronger ejections were usually inaudible, but when visible activity waned in the early evening, noises like "rolling thunder" and "a lions roar" prevailed. At other times the observers noted noises like "the ebb and flow of waves pounding a cliff." More powerful blasts in this interval produced detectible earth movements.
Information Contacts: Stephen O'Meara, Sky & Telescope.
Vigorous Strombolian explosions produce ashfalls and lava flows
Activity increased at 0400 on 12 October with vigorous Strombolian explosions. Approximately 5 cm of ash was deposited in El Patrocinio, ~4 km W (figure 12). Ash drifted as far as Santa Lucia Cotzumalguapa, ~45 km WSW on the Pacific lowlands. Although apparently declining on 14 October, Strombolian activity was continuing, an ash plume to 300 m above the vent persisted, and tremor was still being detected by the seismometer at Pacaya. As of 14 October, five lava flows active on MacKenney cone had reached the base of the edifice, two on the N, two on the W, and one on the S flank. Flow velocities were reported to be 10 m/hour. Heavy rains and cloud cover since the start of the increased activity have prevented detailed observations. The Comite Nacional de Emergencias (CONE) evacuated 142 people from the towns of El Patrocinio, El Caracol (3 km SW), and other nearby areas, to San Vincente de Pacaya (5 km NW).
Pacaya is a complex volcano constructed on the S rim of the 14 x 16 km Pleistocene Amatitlan Caldera. In 1565, the first recorded historical eruption from Pacaya caused ashfall for three days in Guatemala City. Following explosions in July and October 1965, Strombolian activity was generally continuous until March 1989 when explosive activity removed ~75 m of the MacKenney cone summit and enlarged the crater. Strombolian activity began again in January 1990 and has continued intermittently since then. This latest episode of activity, although smaller in terms of area impacted by tephra, is similar to the activity during July-August 1991, which again destroyed part of the cone and damaged towns W of the volcano.
Information Contacts: Eddy Sanchez, INSIVUMEH.
Eruption on 1 June produces ashfall and lava flows
Pacaya erupted between 0630 and 0700 on 1 June, sending up a 6-km-high plume. Hot ash burned vegetation and damaged radio-antenna equipment near the summit. A thin layer of ash extended a few kilometers from the vent, with ashfall reported 2.5 km N in San Francisco de Sales and 3.5 km W in El Patrocinio (figure 15). A plume visible at 0715 on GOES-8 satellite images was moving SE at ~19 km/hr, prompting a NOAA Volcano Hazard Alert at 1000. Analysis based on comparison of wind shear data and observed translation of the plume suggested that the plume rose to ~9 km altitude. Eddie Sanchez noted that venting ash destroyed the 1984 spatter cone (SEAN 10:03), called "El Hornito," located roughly midway between the N caldera rim (Cerro Chino) and the previously active MacKenney cone (figure 16). In place of El Hornito was a small crater venting lava, a substantial amount of which flowed S.
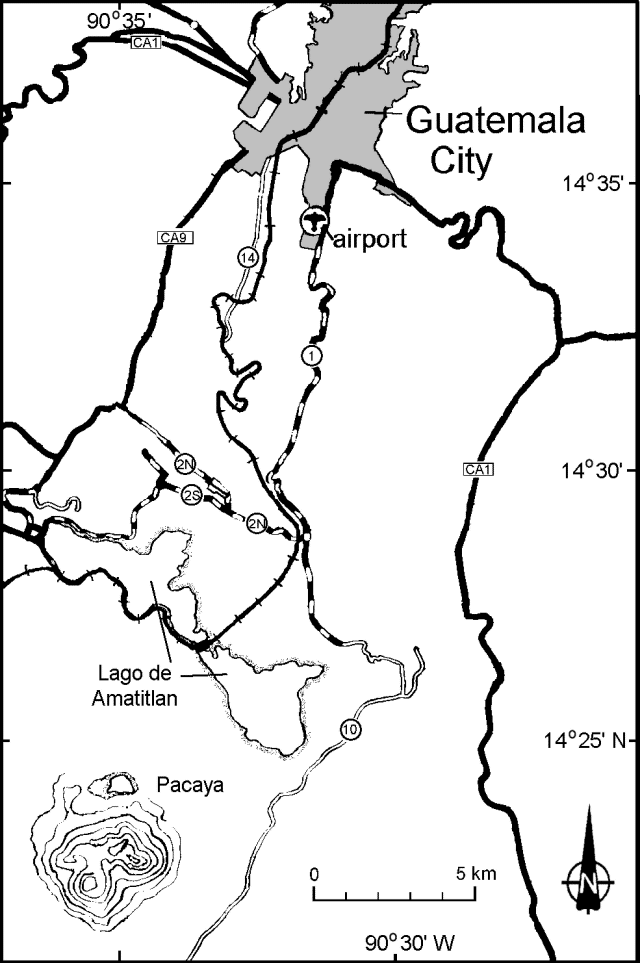 |
Figure 16. Location map showing Pacaya volcano, Guatemala City, the international airport, major roads, and other features. Contour lines are only shown around Pacaya (see figure 15). |
Otoniel Matias reported that on 10 June a small newly constructed spatter cone had collapsed. A news report described two strong explosions in the early afternoon and a thick column of smoke. Matias said that on 14 June more lava erupted, but compared to earlier phases there was less airborne ash and venting gases, and the plume reached only 150-200 m above the crater floor. In accord with this observation, SAB failed to image a plume at 0845 on 14 June; they estimate that a plume must have a height of >3,000 m for them to detect it. Matias went on to say that the 14 June eruption continued vigorously for two hours without pause. Lava continued to escape as of 16 June, and one or more lava flows had moved S for a distance of ~600 m.
Pacaya sits 30 km S of the center of Guatemala City (figure 15), with its population of >1.5 million. An eruption in 1989 produced a 4.5-km-tall eruption column that enlarged the MacKenney crater. Lava flows followed in 1990-91. Strong eruptive activity in June-August 1991 destroyed part of the MacKenney cone and damaged villages to the W. The volcano's olivine basaltic lavas have often flowed out of the collapsed SSW sector, traveling away from most of the nearby inhabited areas. The international airport (La Aurora) lies ~23 km from the crater and airplanes commonly fly over the volcano (figure 17).
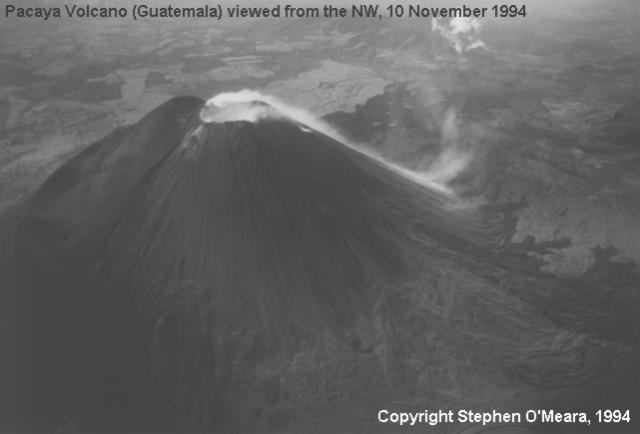 |
Figure 17. Aerial photograph of Pacaya viewed from the NW, 10 November 1994. Vapor rising from the MacKenney summit crater can be seen flowing down the S flank. Courtesy of Stephen O'Meara. |
Information Contacts: Eddie Sanchez and Otoniel Matias, Seccion Vulcanologia, INSIVUMEH, 7A Avenida 14-57, Zona 13, Guatemala City, Guatemala; Grace Swanson, Synoptic Analysis Branch - Room 401, NOAA/NESDIS, 5200 Auth Road, Camp Springs, MD 20746, USA.
Moderate Strombolian eruption; fountaining up to 500 m; lava flow
Pacaya erupted more forcefully than usual beginning late on 10 October. Based on an INSIVUMEH report, between about 2300 on 10 October and 0200 on 11 October Pacaya produced a moderate Strombolian eruption with sustained fountaining of incandescent materials up to 500 m high.
The plume's maximum height reached ~3.7 km altitude; within that plume the ash column rose to ~700 m. During the eruption winds blew from the NNE at 35 km/hour with gusts to 45 km/hour; they carried fine ash toward the town of Esquintla. A report from Puerto San Jose, a city on the Pacific coast ~60 km SW, indicated that the earlier dark ash cloud had thinned during the day.
The explosive eruption was followed by significant lava effusion from the crater. The longest lava flow traveled SW for 1.5 km over the surface of an older flow field. At 0300 the flow front's velocity was 100 m/hour; it came within 300 m of the relatively flat area reached by the 1991 lava flow. Lava ceased venting at dawn; however, the SW flow remained incandescent and slowly moving. Although eruptive strength diminished, some tremor persisted on 11 October. On that day satellite images (Band 2 on GOES-8) showed a small hot spot. An INSIVUMEH report on 14 October noted that ongoing eruptions continued into the morning of the 12th. After that the eruptive vigor and amount of tremor both dropped and no new lava vented from the crater.
On 16 October INSIVUMEH reported that Pacaya continued to expel abundant white steam. At that time there were no audible explosions, underground booming noises, or newly vented lava flows. Tremor was present, presumably related to the degassing seen at the surface. Eddy Sanchez noted that 38 people were evacuated from neighboring villages during the height of the eruption.
Information Contacts: Eddy Sanchez and Otoniel Matías, Seccion Vulcanologia, INSIVUMEH (Instituto Nacional de Sismologia, Vulcanologia, Meteorologia e Hydrologia of the Ministerio de Communicaciones, Transporte y Obras Publicas), 7A Avenida 14-57, Zona 13, Guatemala City, Guatemala; NOAA/NESDIS Satellite Analysis Branch, Room 401, 5200 Auth Road, Camp Springs, MD 20746, USA.
Eruption on 11 November drops over 3.5 cm of ash
INSIVUMEH reports further described volcanic activity in October (BGVN 21:09) and a more forceful eruption that began on 11 November. Seismic data were registered at a local, one-component station (exact location undisclosed).
Activity during October 1996. At about noon on 4 October the volcano produced a 20-minute- long eruption of pyroclastics that reached 100-150 m above the crater rim. Less sustained eruptions followed later that day.
A small phreatic eruption occurred the next day (between 1000 and 1330 on 5 October), throwing pyroclastics 300-400 m high and generating an ash-bearing column rising 600 m above MacKenney crater. After that, activity generally continued as smaller explosions. Specifically, these explosions occurred at intervals of 2-5 seconds, typically throwing incandescent material to 20-30 m; but at intervals of 1-3 minutes, more energetic explosions sent material to 150 m. In response to unbroken eruptions on the morning of 6 October, a sustained column developed that was 100 m tall.
On 7 October outbursts increased in vigor with incandescent discharges 70-150 m high and coffee-colored clouds blowing E. At the seismic station, strong harmonic tremor was recorded. As a result of these factors, an alert was given to authorities. On 8 October the tremor fluctuated in amplitude but continued and a sustained 15-minute eruption led to a column reaching 200 m above MacKenny crater. The vigor of eruptions dropped noticeably later on 8-9 October.
Between 2300 and 0200 on 10-11 October, a moderate Strombolian eruption took place (BGVN 21:09). Although previously unreported, pyroclastic flows during the eruption ran down Pacaya's N, E, and S flanks reaching the cone's base. Some forceful phases of the eruption sent ash to 700- and 800-m heights. Winds of 35 km/hour from the NNE, gusting to 45 km/hour, blew ash toward the towns of Esquintla, 25 km SW, and Puerto San Jose, 60 km SE. Fine ash was also detected as far away as the Salvadorian border, 120 km SSE. Tephra with grain sizes of 0.5-3 cm reached distances of 4-7 km from the source. Evacuees from the village of El Patrocinio (3.6 km W of the crater) returned on the afternoon of 11 October. That day seven hours of post-eruption tremor registered and a bluish white plume stood 30-70 m above the crater rim. The volcano was quiet between 12 and 13 October except for 30 microseisms with 3-7 second durations.
A swarm of microseisms during 0900-1900 on 14 October consisted of 70 events of 5-10 second duration. On 15-16 October the volcano was seismically quiet but on 17 October there was an 11-hour period when seven lava avalanches broke loose. These typically took 1-3 minutes to reach the base of the cone. Five more avalanches followed on 18 October, and others followed later as freshly erupted lava and debris moved downslope. On 19 and 20 October only sporadic microseisms registered (2-15 mm peak-to-peak with 5-15 second periods); these originated at 3-5 km depths beneath the cone. Various types of weak tremor reappeared again during 21-25 October with 3- to 15-minute durations.
During 19-25 October, except for the above-noted seismic events, there were no earthquakes registered; plumes were bluish to white, and rose to 300-350 m in height. Despite technical problems with the seismograph on 26 and 27 October, some microseisms were registered; on 28 October weak tremor occurred during the entire day and 5-15 type-B earthquakes took place each hour. Elevated but fluctuating seismicity continued through the end of October.
Vigorous blue-to-white columns poured out of the MacKenny crater on 26-28 October; these were carried by 25-35 km/hour N winds. Weak fumarolic emissions took place along the N segment of the cone's base. A steamy column rose to 100-150 m high and was blown S.
Activity during November 1996. After 2 November there were repeated explosions that sent puffs of steam 30-100 m above the MacKenny crater floor. Poor visibility kept observers from seeing whether pyroclastic material was ejected; however, during 1-7 November wide steam columns reached 300 m.
The week of 1-8 November included extensive intervals of weak tremor and other minor events; in the most extreme example, on 1 November, tremor was continuous. Other events included a series of type-A earthquakes that took place in an 18-hour interval on 3 November. This swarm consisted of 63 events at depths of 200-700 m. Type-B earthquakes were also common.
On 9 November tremor was relatively scarce, only about one hour in total duration, but on 10 November four hours of tremor took place. RSAM estimates made at 10-minute intervals were constant through 0900 on 11 November when the register reset.
Initial Strombolian explosive activity from MacKenny crater began at 0930 on 11 November. Although the crater was not visible, strong-to-moderate explosions could be heard 4 and 3 km away (at the villages of El Patrocinio and San Francisco de Sales, figure 18); these continued until 1142 when a 15-minute interval of stronger explosions began that included incandescent material thrown 70 m above the crater rim; at 1157 the explosions became more frequent (4-12 each minute) and stronger (throwing incandescent material ~100 m above the crater).
During the course of the 11 November eruption lava progressively rose to the crater rim, and about midday, coincident with a sustained burst of incandescent ejections, lava spilled out over the WSW flank. The associated incandescent material rose ~100 m and a steam column rose to ~200 m. By 1330 the lava flow had reached 450 m in length traveling in a SW direction, and the column of incandescent material rose ~300 m.
At 1645 on 11 November the eruptive column rose dramatically, reaching at least 1.1 km tall. Falling ash was reported as far away as the town of Esquintla (figure 18). Meanwhile, the escaping lava flow reached 1 km in length and small tongues of lava 200-300 m in length fell from the breach in the crater. Incandescent avalanches moved down the cone's S flank and some reached as far as the base. A Red alert was recommended at midday on 11 November; evacuations followed at nearby villages. About 1900 on 11 November the lava flow reached the cone's SE base, a distance of ~2 km. About this time, large lapilli rained down on the fields and forests of the region damaging vegetation.
Figure 18 shows the isopach map resulting from these 11 November eruptions. Within the 35 mm isopach tephra ranged from 2 x 3 cm to 4 x 6 cm. Inside the <1 mm isopach there were only traces of ash. Small eruptions continued into December.
Pacaya lies 30 km S of Guatemala City, an urban center with a population of over 1.5 million people. The volcano's olivine-basaltic lavas have often flowed out of the collapsed SSW sector travelling away from most inhabited areas.
Information Contacts: Eddy Sanchez and Otoniel Matías, Seccion Vulcanologia, INSIVUMEH (Instituto Nacional de Sismologia, Vulcanologia, Meteorologia e Hydrologia of the Ministerio de Communicaciones, Transporte y Obras Publicas), 7A Avenida 14-57, Zona 13, Guatemala City, Guatemala.
Strombolian eruptions and lava flows from MacKenney crater
Reports by Otoniel Matías of INSIVUMEH described volcanic activity after the 11 November eruption (BGVN 21:11) until 12 December. Seismic data were registered at a local one-component station (exact location undisclosed).
Activity during 11-30 November 1996. Heightened explosive Strombolian activity from MacKenney crater on 11 November was accompanied by abundant lava flows that covered most of the SW flank and traveled as far as 2 km from the volcano. The ash column reached 2 km, and deposited a 7-cm-thick layer of coarse tephra (1-3 cm in size) over the village of El Caracol (~4 km SW of the summit). Ash transported SW by strong winds fell in Escuintla and, as some local newspapers reported, in the Mexican city of Tapachula (300 km NW). At 2010 of the same day the eruption started dying down.
For the remainder of the month there was continuous emission of white-blue "smoke" at variable heights (50-300 m) above the crater. After the 11 November eruption seismicity was dominated by type-A volcano-tectonic swarms. During the next few days the swarm's foci deepened from 0.2-1 km to 5-10 km and then to 15-20 km and finally on 18 November, to 25-35 km. On 12 November a lava tongue ~2.5 km long was flowing S toward Cerro Buena Vista. On 13 November another small lava flow ~450 m long was observed on the SW flank.
During 15-18 November there were explosions of variable intensity every 1-3 minutes; the strongest explosions lasted 25-50 seconds and had amplitudes of 35-40 mm (peak-to-peak) and frequencies of 3-5 Hz. These explosions expelled pyroclastic material 75-150 m above the crater, depositing most material inside the crater.
On 20 November the seismic activity became characterized by harmonic tremor and type-B earthquakes, indicating magma movement toward the crater. The same day an eyewitness reported a red glow inside the main crater. Early on 21 November the white-blue column rose >500 m above MacKenney crater, but later that day decreased to ~300 m.
During 26-28 November the seismicity became characterized by alternating periods of activity followed by quiet for about 12 hours. The seismic activity shifted between seismo-tectonic swarms (one event every 2-10 minutes) and continuous tremor, suggesting that magma was ascending from depth and the confining rock was adjusting to the new stress field. After 28 November the activity was again dominated by seismo-tectonic events. Originating at depths of 0.2-1 km and up to M 1, there were 467 such events during a 24-hour observation period.
Activity during 1-12 December 1996. The white-blue column observed during November was also reported throughout this period at heights of 70-250 m. On 2, 3, and 4 December small explosions every 1-8 minutes were accompanied by ejection of incandescent material up to 100 m above MacKenney crater. This Strombolian activity was associated with harmonic tremor, although such tremors had appeared since the night of 1 December.
On 5 December puffs of steam lasting 5-7 minutes built up a column that rose 400 m. On 6 December, steam-and-ash expulsions of variable intensity turned brown in color and were observed at intervals of 2-10 minutes.
During 7-10 December the seismicity was characterized by tremor (mean amplitude, 2-5 mm; frequency, 3-4 Hz; and duration, 2-15 minutes) and type-A seismic events at 0.3-1 km depth. On 10-11 December steaming was observed on the N, W, and SW flanks of the MacKenney cone.
On 12 December white-blue emissions reached 300 m above the crater and drifted slowly SW for 5 km. That day, low-amplitude, low-frequency (0.5-1 Hz) harmonic tremor alternated with pulses of disharmonious tremor with amplitude 3-10 mm and 4-6 Hz frequency. During these pulses, steam-and-ash emissions occurred in association with considerable mass wasting inside the crater.
Information Contacts: Otoniel Matías, Seccion Vulcanologia, INSIVUMEH (Instituto Nacional de Sismologia, Vulcanologia, Meteorologia e Hydrologia of the Ministerio de Communicaciones, Transporte y Obras Publicas), 7A Avenida 14-57, Zona 13, Guatemala City, Guatemala.
Graduate students study gas emission and lava flow
Between 5 and 13 February graduate students from Northern Illinois University in collaboration with INSIVUMEH scientists conducted studies at Pacaya volcano. Focused fumarolic activity was observed at the summit, whereas diffuse gas emissions occurred around the SW flanks. Numerous micro-seismic earthquakes were recorded daily during this period.
Lava samples were collected from the 11 November 1996 flow. Analysis showed that the lava was a highly- vesicular, plagioclase-phyric basalt that resembles basaltic flows from previous eruptions.
Information Contacts: Otoniel Matías, Seccion Vulcanología, INSIVUMEH (Instituto Nacional de Sismología, Vulcanología, Meteorología e Hydrología of the Ministerío de Communicacíones, Transporte y Obras Publicas), 7A Avenida 14-57, Zona 13, Guatemala City, Guatemala; Barry Cameron and Shane Rundle, Department of Geology, Northern Illinois University, USA.
Eruptions continue in August and November
While visiting Guatemala City, Kent Johnson observed small explosions at Pacaya's summit on three hazy nights between 30 July and 4 August from vantage points ~40 km N of the volcano. The explosions sent lava clots into the air and lava flows down the side of the volcano; orange streaks of lava were observed traveling a short distance down the volcano's W slope. Through binoculars, the summit appeared orange with bright orange- yellow bursts occurring at ~5 minute intervals. During the day on 4 August, puffs of steam or ash were emitted from the summit. Hazy conditions made it difficult to photograph the emissions.
According to an 11 August aviation notice, Pacaya erupted around2100 on 9 August. Surface observations in Guatemala City indicated that the volcano was in eruption although no ash plumes were discerned in GOES-8 imagery during 11 August due to thunderstorms. Another aviation notice from Guatemala City reported an eruption at 0800 on 14 November. Although an ash cloud was reported by observers, the ash was not visible in GOES-8 visible or infrared imagery due to cloud cover.
Information Contacts: Satellite Analysis Branch, NOAA/NESDIS, Room 401, 5200 Auth Road, Camp Springs, MD 20746, USA; Kent Johnson, 7141 Jennifer Way, Sykesville, MD 21784 USA.
May eruption shrouds capital in ash, harms crops, and spreads NW
Pacaya erupted unusually vigorously on 20 May. As a result, ash falling in the adjacent highlands damaged crops; ash falling to the N choked the capital and its international airport; and ash located at about 10 km altitude entered the Gulf of Mexico and joined smoke from widespread forest fires. An airplane on final approach to landing at the Guatemala City airport hit ejecta, sustaining damage but landing without incident.
The outburst's greatest intensity occurred during the hours 1205-1900. For 30 hours prior to this outburst, relative quiet prevailed with the volcano generally emitting ash-bearing explosions of brown to coffee-brown color and very little incandescent lava. Beginning around 0930, explosions became continuous, and they proceeded to squirt and splatter abundant lava E and N of the active crater (MacKenney Crater).
An initial, higher-intensity phase began before noon, sending a gray ash column 800 m high. Such columns later reached roughly 1.5-2.0 km above the crater. The eruption was described in Spanish in a series of INSIVUMEH reports. Their update at 1400 on 20 May stated that ash with grain sizes up to 3-7 mm fell on Guatemala City (the capital), the center of which lies 30 km N of Pacaya. An update at 1700 told of 2.5 mm of ash at the international airport (La Aurora, ~23 km N of Pacaya) but eruptive plumes at the volcano had dropped to 200-300 m in height. The ash at the airport was described as 0.5-1.5 mm across and dark in color. About 1 mm of ash fell in part of the capital.
Although ash fell in the capital mainly during 1100-1700 on 20 May, the amount falling diminished around 1530, allowing the atmosphere to clear substantially. At 1700, Pacaya sent ash plumes 200-300 m above the summit, more typical of normal behavior at the volcano. At about 2000, the wind carried only very small particles toward the capital. Still, local vegetation tenuously held residual ash that could easily become wind blown. In response to the diminished eruptive vigor, at 2100 on 20 May the alert status was lowered from red to orange.
During the eruption, five lava flows or lobes formed, three oriented towards Cerro Chino. One of these reached 1.5 km in length and ~300-400 m in width. The two other flows proceeded down the N and S flanks for ~600 m. No lavas reached cultivated or populated areas. The eruption disrupted the crater sending blocks 2.5 m in diameter up to 1 km downslope (to "la meseta"). Ash thicknesses of 20-30 cm were reported in villages approximately 2-4 km from the volcano (including San Francisco de Sales, Calderas, Mesillas Altas, and El Bejucal).
Verbal conversations with INSIVUMEH's Eddie Sanchez indicated that ash fell on Guatemala City during 1100-1700 on 20 May. Also, volcanic bombs with masses up to 7 kg landed near Pacaya's summit (on Cerro Chino). They also learned that lapilli fell in a village a few kilometers away on Pacaya's flanks (San Francisco de Sales). Otoniel Mat¡as said the 20 May event prompted 252 people to evacuate local settlements. Authorities had several cautions for people in areas of ash fall: 1) drive at speeds below 30 km/hour; 2) avoid the use of their vehicle's windshield wipers because the ash would scratch glass; and 3) cover cisterns even though the ash was non-toxic.
Seismicity during the event on 20 May left records with amplitudes of 5-17 mm peak-to-peak and maintained RSAM values of 870 counts over 10-minute intervals.
The INSIVUMEH report at 1000 on 21 May described a substantial decrease in eruptive vigor but explosions still sent gray, ash-bearing plumes to ~800 m above the summit. A N wind with speeds of 12-17 km/hour carried ash to El Chupadero and El Caracol, spots located 2-2.5 km from the crater. This same morning, the longest lava flow had reached 1.1 km in length.
Other consequences. The previously mentioned aircraft was a commercial jet that was on final approach to the airport when it entered an ash cloud. A few seconds prior to landing, a Pacaya discharge burst forth propelling rocks into the air. Impact with these rocks damaged the pilot's forward windows (captain and first officer) but the landing was completed without further complications. Repairs and inspection were carried out over a 3-day interval; both the airline's technicians and a manufacturer's representative inspected the plane and found the engines undamaged.
At the airport, ash was removed by mechanical means (and to some extent thanks to rainfall) on 21, 22, and 23 May, returning to full service on Sunday 24 May. Rainfall during 22-24 May was never heavy but it apparently did much to wash the ash away. Not surprisingly, the ash clogged storm drains in the capital forcing crews to clean much of the 3-4 million tons of ash mechanically.
A news report in La Nación stated the National Coffee Association computed that the 20 May eruption caused "some $75 million in losses in the coffee harvest." This was the third time in recent history that Guatemala City had been ash choked: the two previous times, 1932 and 1974 were due to eruptions at Fuego, a stratovolcano that sits along the volcanic front roughly 30 km W of Pacaya.
Later activity. Other outbursts occurred during June. One on 14 June was somewhat weaker than the 20 May event; nevertheless it disrupted the crater's geometry and formed a distinct spatter cone. This outburst took place at 1045, exhaling for 10 minutes in conditions of little or no wind, sending brightly incandescent material to 1 km. The material fell harmlessly back on the crater area.
This type of comparatively short eruptive interval had been rare at Pacaya until recently; previous pulses were typically weaker and continued longer, often for 2-7 hours. The short blasts seen recently were thought to be related to water saturation of the ground associated with a wet rainy season; presumably, more groundwater has been driven toward the magma. The situation became difficult from a civil-defense policy perspective since these short, forceful pulses were typically unpredictable and could create conditions requiring rapid response in flank settlements.
Aviation reports. The NOAA/NESDIS Satellite Analysis Branch (SAB) produced tens of reports on Pacaya's mid-May and early June eruptions. For many of their reports before and well after the 20 May eruption, GOES-8 infrared, and multi spectral imagery did not indicate an ash plume, but channel 2 data often revealed a small hot spot. In accord with the rather sudden emergence of the eruption, no ash was detected during clear weather on GOES-8 visible, infrared, or multi spectral imagery through 1645 GMT on 20 May.
Hours later SAB reported a substantial ash cloud; it appeared in GOES-8 imagery taken at 1900 GMT on 20 May (table 2, first entry). Their same report noted that a sounding from Belize (station 78583) had yielded an estimated plume height of about 9-11 km altitude. The cloud extended 140 km NNE from the summit, reached a width of 46 km, and advanced NNE at about 120 km/hour. Table 2 shows a sample of some noteworthy reports posted during portions of 20-22 May.
Table 2. Several of the reports on Pacaya and its ash clouds during parts of 20-22 May put out by the NOAA/NESDIS Satellite Analysis Branch (SAB). Stated times are GMT. Courtesy of SAB.
| Report Date | Report Time (GMT) | Report Number | Observations |
| 20 May 1998 | 2125 | 98-018 | Ash cloud of dimensions and velocity discussed in text (extending to the point 16°N, 90°W). |
| 21 May 1998 | 0330 | 98-019 | The plume extended NE across Central America and into W Gulf of Mexico (from 19°N, 88°W to 21°N, 86°W ) and was 55 km wide. Plume height was about 9-12 km. |
| 21 May 1998 | 0915 | 98-020 | GOES-8 multi spectral imagery did not show any plume from the earlier eruption at 1900 GMT on May 20. The plume moved NW across Central America into the W Caribbean and dissipated as it approached W Cuba. |
| 21 May 1998 | 1535 | 98-021 | Surface observations at 1500 GMT indicated Pacaya in eruption. No plume visible on GOES-8. |
| 21 May 1998 | 1745 | 98-022 | Pacaya erupted through 1700. Although ash moved NE at about 50 knots, newly erupted ash was not discerned on GOES-8 imagery. As best as could be determined, the SIGMET issued earlier by Santo Domingo for ash to 10.4 km spread over large portions of the N Carribean was the result of ash resulting from the 1900 GMT 20 May Pacaya eruption. GOES-8 satellite imagery through 1645 GMT failed to reveal discernible ash in the Caribbean but the presence of thin diffuse ash could not be discounted. |
| 22 May 1998 | 0530 | 98-023 | Surface observations indicated an eruption from 1500 GMT on 21 May to 0530 GMT on 22 May with uncertain amounts of ash ejecting. Highly different wind velocities at different altitudes. Weather clouds obscured the satellite view of the eruption. |
| 22 May 1998 | 1430 | 98-026 | Surface observations repeatedly indicated that the eruption continued on 22 May during 0530-1300 GMT but no surface observations were reported during 0900-1200 GMT. Pilot reports around indicated ash near 9.1 km in the central Gulf of Mexico (near 24.3°N, 86.8°W). At some time during 1400-1430 GMT one pilot reported descending to an altitude of 8.2 km from 8.8 km to avoid volcanic ash. Another pilot reported no problem while flying at 10 km in the same area. At some time during 1415-1430 GMT a pilot located over 23.5°N, 86.8 observed a gray layer and smoky smell while flying at 8.8 km altitude. The pilot could not distinguish between volcanic ash and smoke. A velocity for ash moving over the central Gulf of Mexico was estimated based on upper air data from Key West, Florida: 55-65 km/hour directed ENE. |
Fires, El Nino, and smoky atmospheric conditions. During May and early June INSIVUMEH reported intervals of heavy rains and fog around Pacaya. Satellite data, now available on the web (SSEC, 1998 ), also revealed intervals of cloud cover. Despite this rain at Pacaya, thousands of fires remained burning throughout the region, ~40% of them located in the Petén, an area hundreds of kilometers to the N. These fires and associated atmospheric conditions warrant further discussion as they link to both public safety and the interest in understanding the Pacaya's contribution to the atmosphere.
According to news reports, smoke from forest fires burning out of control added to the airborne ash from 300-m-tall eruption columns during 15-18 May had caused breathing problems as far away as Houston, Texas. In addition, at least one news report said that reduced visibility had made airplane landing possible only through the use of instrument guidance in Guatemala City; Honduras was forced to close its two largest airports.
What follows came from a report by the U.S. Agency for International Development (21 May 1998). The report noted that since January, more than 10,650 fires have burned some 1,200 square miles [3,108 km2] in Mexico, an area nearly the size of the state of Rhode Island. As of 21 May, approximately 277 wildfires still raged throughout Guatemala.
"During 1998, Mexico and the entire Central American region have been affected by drought exacerbated by El Nino conditions. The drought has aggravated the effects of slash and burn agricultural practices in forest and grassland areas, leaving thousands of fires burning out of control. Tropical forest, usually too humid to burn, has become extremely vulnerable to fire. In addition to making the land more arid and therefore more flammable, the droughts have eliminated the cleaning effect that rains usually have on the region's air. The ground cover burning may be the driest ever recorded in this century, which has resulted in large quantities of smoke being emitted into the atmosphere. The fires have burned more than one million acres [>4,050 km2] and severely affected visibility and air quality in Mexico, Guatemala, Nicaragua, Honduras, El Salvador, and Costa Rica. In Guatemala, Honduras, and Nicaragua, an estimated 2,146 square miles [5,558 km2] have burned. The smoke from these fires also has entered the southern and Midwestern United States prompting local warnings for residents with respiratory conditions to limit their outdoor activities."
"According to NASA, more than 2,000 fires are currently raging in Guatemala. The U.S. Embassy in Guatemala City reported on May 19 that the fires are intensifying and are threatening human populations. The "red alert" on air quality declared by the Government of Guatemala (GOG) on May 15 remains in effect. Air quality monitors report that total suspended particulate levels in Guatemala City averaged 600 milligrams per cubic meter during the first two weeks of May, three times the World Health Organization maximum level. Since then, air quality has worsened significantly. According to the Embassy, the GOG's Ministry of Health's local health centers have found significant increases in respiratory ailments. The Ministry of Health says that the most heavily affected areas are Petén, Alta Verapaz, Baja Verapaz, and areas of Huehuetenango and Quiche. In Ixcan, 80% of the population are suffering from respiratory-related ailments, eye irritation, vomiting, and headaches, according to local community leaders."
References. SSEC, 1998, Real-time data, Volcano Watch (the world's ten most active volcanoes); Pacaya volcano, Guatemala: Graduate School, University of Wisconsin-Madison, Space Science and Engineering Center (SSEC), 1225 West Dayton Street, Madison, Wisconsin 53706 (URL: http://www.ssec.wisc.edu/data/volcano.html).
U.S. Agency for International Development, 21 May 1998, Fiscal Year (FY) 1998 Situation Report ##2, Mexico and Central America Fires [NAT-DSR:378][OFDA-02]: U.S. Agency for International Development, Bureau for Humanitarian Response (BHR), Office of U.S. Foreign Disaster Assistance (OFDA).
Information Contacts: Eddie Sanchez and Otoniel Matías, Seccion Vulconologia, INSIVUMEH (Instituto Nacional de Sismologia, Vulcanologia, Meteorologia e Hydrologia) of the Ministerio de Communicaciones, Transporte y Obras Publicas, 7A Avenida 14-57, Zona 13, Guatemala City, Guatemala; NOAA/NESDIS Satellite Analysis Branch, Room 401, 5200 Auth Road, Camp Springs, MD 20746, USA; La Nación, San José, Costa Rica; U.S. Agency for International Development, Bureau for Humanitarian Response (BHR), Office of U.S. Foreign Disaster Assistance (OFDA); Tom Fox, Air Navigation Bureau, International Civil Aviation Organization (ICAO), 999 University St., Montreal H3C 5H7, Canada (URL: https://www.icao.int/safety/airnavigation/); Tom Casadevall, U.S. Geological Survey, National Center, Reston, VA 20192.
Explosive activity resumes; summary of activity 1987-98
Explosive activity resumed on 2 January 1999 at Pacaya for the first time since the end of a major eruptive episode on 19 September 1998. Current activity has consisted of small explosions that ejected ash without incandescent material. Beginning on 8 January, the number of explosions increased from 100-200/day to more than 400/day, reaching a peak of ~ 550 on 21 January (figure 19). Explosion counts declined to ~200/day by the end of the month. Volcanologists from INSIVUMEH and the Smithsonian Institution observed frequent small ash eruptions during a 1 February visit. The explosions were not accompanied by detonations, and produced billowing gray-to-brown ash columns that rose ~100 m above the vent. They observed that two vents produced explosions; the largest explosions originated from the westernmost and lower of two vents in the breached crater. Intense fumarolic activity occurred from the inclined floor of the summit crater, its rim, and the outer flanks.
Significant changes to the morphology of MacKenney cone had occurred since a strong explosive eruption on 18-19 September 1998. That eruption left a major breach 20-25 m wide that extended SW. By the time of the 1 February visit, erosion had widened the breach to 70-80 m. At its head, the breach had nearly vertical walls more than 50 m deep, and formed a gully that extended more than 1 km down to ~1,800 m elevation. The NE side of the crater was also notched, but not nearly as deeply. Fractures and down-dropped blocks of summit agglutinate material along the crater rim also showed this SW-NE orientation in line with the location of two flank vents active during September 1998. The breach gives MacKenney cone a twin-peaked appearance when viewed from the W flank (figure 20). The present form of the crater increases the possibility of future eruptive or collapse events being directed toward the W-flank village of El Patrocinio (figure 21).
The accumulation of spatter and ejecta from the September 1998 explosions had built MacKenney cone to a height about 30-35 m above an older cone immediately SE of MacKenney crater. The older cone, the previous vantage point for observing explosive activity from Pacaya, had itself grown about 10 m in the past decade from the accumulation of ejecta from MacKenney crater. The height of MacKenney cone now exceeds that of Cerro Grande, a vegetated ~2,560-m-high prehistorical cone of Pacaya located 2 km NE of MacKenney.
September 1998 eruption. A major explosive and effusive eruption took place on 18-19 September (table 3). During the first 17 hours of the eruption, a 1.2-km-long lava flow descended WNW into the caldera moat and down the flank of the volcano to the Montanas las Granadillas area SW of Cerro Chino. From 1700-2200 an explosive eruption ejected ash columns to 5 km above the crater, producing ashfall to the SW and NNW. Fine ashfall caused the closing of the international airport in Guatemala City for 35 hours. About 1 m of volcanic bombs were deposited on the caldera rim. Pyroclastic avalanches of incandescent ejecta mantled the upper half of the cone. One 3-m-wide impact crater was formed at the base of the lava flow near El Patrocinio, and 1-m-wide impact craters were found as far as 5 km from the vent. During the final explosive phase, the SW rim of MacKenney crater collapsed, forming a debris avalanche that traveled 2 km down the SW flank to ~1,500 m elevation. Coarse blocks littered the surface of the deposit, whose light color contrasted with that of adjacent dark-colored lava flows.
Table 3. Summary of major eruptive events at Pacaya volcano from January 1987 to September 1998.
| Date | Description of Volcanic Activity |
| 21 Jan 1987 | Ash fell over areas of the villages of Amatitlan and Santa Elena Barillas. The villages of El Caracol and El Patrocinio were evacuated. |
| 25 Jan 1987 | 10-15 cm of ash fell over El Caracol, El Rodeo, and in part over El Patrocinio. |
| 14 Jun 1987 | Lava flow reached 2.5 km SW; 600 people evacuated. |
| 7-11 Mar 1989 | Two lava flows threatened to reach El Patrocinio and El Rodeo. A third lava flow traveled 3 km on the W flank. |
| 02 Apr 1990 | A 4-hour-long eruption deposited 10 cm of ash in El Patrocinio and El Caracol. |
| 15 Sep 1990 | Moderate intensity eruption caused a moderate ash fall over El Patrocinio. |
| 05 Mar 1991 | Minor ashfall in El Caracol and El Patrocinio. |
| 06, 14, 16 Jun 1991 | Continuing eruptive activity destroyed the active crater (MacKenney). |
| 08, 12, 14, 15 Jul 1991 | Moderate intensity eruption; minor ashfall over El Caracol (3 km from the crater). |
| 27 Jul 1991 | An eruption caused a 26-cm-thick ash layer to be deposited over El Caracol and El Patrocinio, 1.5 cm in Escuintla, and a thin layer in Santa Lucia Cotzumalguapa. |
| 01 Aug 1991 | A 3,000-m-high column caused ashfall over Barbarena and Cuilapa. |
| 10 Jan 1993 | Collapse in the active crater sent a glowing avalanche to the side of El Caracol. The post-collapse eruption column drifted toward Santa Lucia Barillas. The acidity of the ash damaged vegetation in the region. |
| 21 Sep 1993 | 4-hour eruption caused a minor ashfall over El Caracol. |
| 16 Mar 1994 | Eruption lasted until midnight and had an incandescent lava fountain 300 m high. Most of the ash fell on the volcano's flanks. |
| 15 Oct 1994 | Phreatomagmatic explosion; acid ashfall damaged vegetation in Santa Elena Barillas and Los Llanos. Population was affected by pulmonary and respiratory problems. |
| 07 Apr 1995 | A lahar completely covered a house and killed a little girl in Los Rios. The inhabitants were evacuated as 25-35-cm-thick volcanic sand was deposited over the village. As a result of a hazard study, many villagers had been previously evacuated. |
| 01-07 Jun 1995 | A debris avalanche caused by collapse of the W crater rim destroyed a radio station and partially burned the vegetation of Cerro Chino in a 4-km2 area. |
| 07 Jun 1995 | Lahars moving as a dense, dough-like mass, cut roads and wiped away a bridge. Consequently many families in El Patrocinio and Los Rios were evacuated and later part of the population was relocated in La Colima. |
| 17 Sep 1995 | A 1-km-high column from a phreatomagmatic explosion deposited 3 cm of fine ash in Santa Elena Barillas and a fine veil of volcanic dust in Barbarena and near Cuilapa. |
| 11 Oct 1996 | At dawn the eruption produced a sustained lava fountain 500-700 m high and lava flows as long as 1.5 km on the SE flank. The 35 km/h wind with blasts at 45 km/h caused a fine ash fall as far as Puerto San Jose, 60 km to the S on the Pacific Ocean. |
| 11 Nov 1996 | A 9-hour-long eruption produced a 2-km long lava flow and deposited 7-12 cm of ash near El Caracol and Finca El Rabon. El Rodeo received a 2-3 cm thick blanket of ash. It was necessary to evacuate the population of El Caracol, El Rodeo, and some women and children of El Patrocinio. |
| 20 May 1998 | A 5-hour eruption produced a 4-km-high ash column. S wind caused ashfall in the capital City, Ciudad de Guatemala (2 mm in the N and 4 mm in the S areas of the city). La Aurora International airport was closed for three days. Incandescent bombs and hot blocks ignited trees in the mountainous areas of Cerro Grande, 2 km NNE of MacKenney crater. 254 people were evacuated from San Francisco de Sales, El Cedro, and El Pepinal. Two people were injured by falling scoriaceous bombs in S.F. de Sales. |
| 14 Jun 1998 | A moderate eruption began at 0600 and lasted until 1900. An incandescent lava fountain was oscillating between 150 and 400 m high. A large ash column (600-800 m high) was blown to the S and produced scoriaceous ashfall in El Caracol. There was no need to evacuate. Condensation of atmospheric humidity due to the heat fed a cloud that reached 1,500-1,700 m in height. The Unidad Coordinadora Deptal de Escuintla del Ministerio de Agricoltura, Ganaderia y Alimentacion reported the loss of Q70,000 (US $10,000) from partial destruction of coffee, corn, and bean crops, and for purchase of food for livestock. Aircraft reported ash at 5,500 m. |
| 18 Jun 1998 | A 10-minute explosion at 1045 caused the ejection of semi-incandescent blocks (>= 35 cm) over all the volcano flanks. Then, 20 minutes later, fine ash lightly fell over the city of San Vincente Pacaya. |
| 18 Sep 1998 | The main eruption had one effusive and one explosive phase. The first lasted 17 hours, producing a 1,200-m-long tongue of lava that emerged from the WNW rim of the active crater and then deviated to the Montanas las Granadillas area SW of Cerro Chino. The second phase occurred from 1700 to 2200 hours. It expelled an ash column that reached 5,000 m altitude and produced ash and lapilli fall to the SW and NNW.A very thin film of fine ash (~ 1 mm) caused the La Aurora International airport to be closed again for 35 hours, after which it reopened with restrictions. Three lava flows accompanied the explosive phase; the first one, 400 m long, went WNW and reached the base of the cone. There it joined the second flow (from the N flank). The third lava flow departed from the second flow and went to the S toward El Caracol. During the proximal explosive phase the SW rim of the MacKenney crater collapsed, causing a debris avalanche 2 km long, and a cloud of hot ash and gases that burned vegetation in the distal reaches. |
Several lava flows accompanied the explosive activity (figure 22). The longest of these traveled ~4 km from a notch in the NE crater rim. The flow initially descended northward into the caldera moat where it was deflected by the caldera wall, flowed across the moat, and then down the SW flank to 1,760 m elevation before diverging around a small kipuka and scorching trees at its northern margin below Cerro Chino. Much of the caldera moat was covered by lava flows of the September eruption, and the prominent 1984 spatter cone low on the N flank was nearly buried.
At the end of the eruption, two small lava flows took place from flank vents on opposite sides of the cone. A vent on the upper NE flank at ~2,450 m elevation produced a short lava flow that reached the caldera moat. A vent on the lower SW flank at ~1,800 m elevation (figure 22) produced a short lava flow that divided into two lobes, one traveling to the SW and the other to the south.
Summary of 1987-1998 activity. Routine explosive activity characteristic of Pacaya occurred through much of the period from 1987 to the present but is not listed in table 3. Strong explosive eruptions in January 1987 and June 1991 destroyed the upper part of MacKenney cone, deepening and widening the crater, after which renewed eruptions reconstructed the cone. Major eruptions on 7 and 14 June 1995 destroyed the WNW side of the crater, leaving two notches at the summit. Debris from the 7 June collapse slammed into the caldera wall at Cerro Chino, 1 km NW of the summit, and produced a secondary hot cloud that swept over Cerro Chino, destroyed a radio antenna, and affected houses within 2 km of the active vent. The shockwave threw INSIVUMEH observer Pastor Alfaro down a slope, fracturing his leg. The 7 June event produced a 2.5-km-high plume. The second collapse on 14 June produced an avalanche that traveled SW toward El Rodeo and was accompanied by a 4-km-high plume. Lava flows subsequently traveled 2 km. Figure 23 shows RSAM plots for 1995-98.
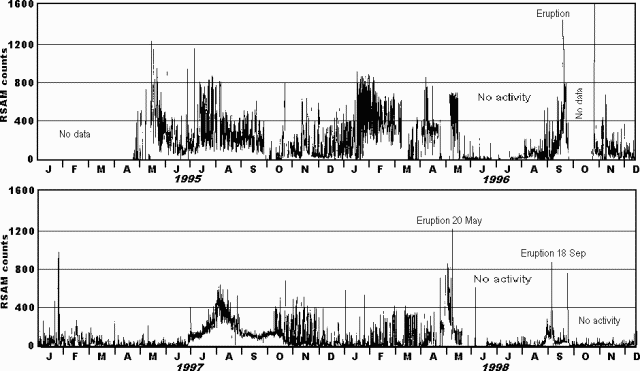 |
Figure 23. Plot of seismic activity at Pacaya as represented by Real-time Seismic Amplitude Measurement (RSAM) counts during January 1995-December 1998. Courtesy of INSIVUMEH. |
A strong explosive eruption on 20 May 1998 produced a 4-km-high ash column. Incandescent bombs burned trees on the SSW flank of Cerro Grande, 2 km N of the crater, and scoria fall damaged vegetation and crops. Two persons in the settlement of San Francisco de Sales, 2.5 km NE of the crater, were injured by falling scoria blocks. The ash plume was primarily blown to the NE, with a lesser plume to the SW (figure 24). Ash fell from 1300-1600 in the villages and towns within 5 km of the volcano. During 1400-1830 ash fell in the capital city of Guatemala, causing closure of the international airport. Ashfall covered an area of 800 km2, and had an estimated volume of ~2.3 x 10⁶ m3. The eruption caused the evacuation of 254 residents from surrounding villages to the town of San Vicente de Pacaya. Lava flows during the 20 May eruption traveled down the N, W, and SW flanks and had a volume of 6.3 x 10⁵ m3.
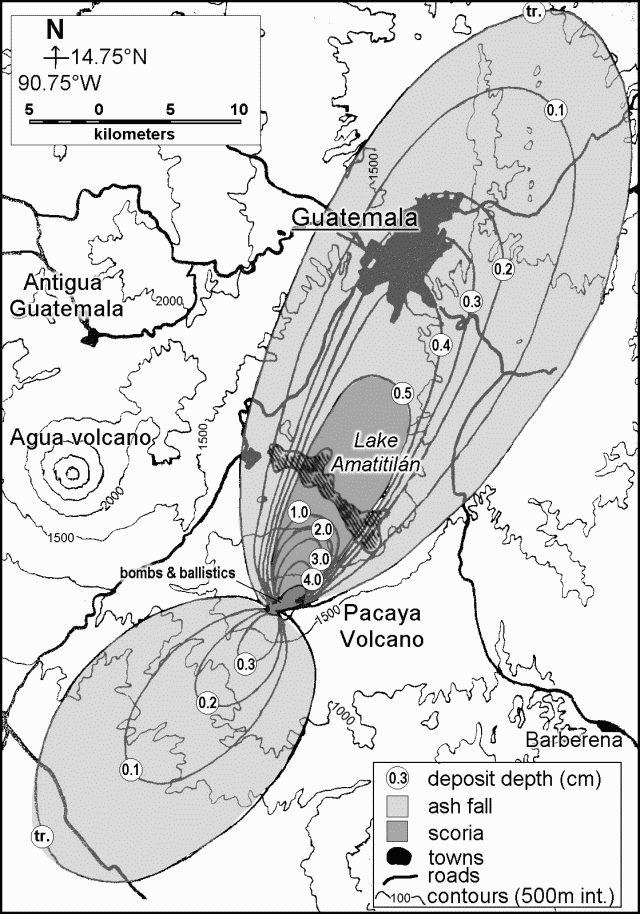 |
Figure 24. Isopachs of the 20 May 1998 explosive eruption from Pacaya volcano. Courtesy of Otoniel Matias, INSIVUMEH. |
Information Contacts: Otoniel Matias, Instituto Nacional de Sismologia, Vulcanologia, Meteorologia e Hydrologia (INSIVUMEH), Ministerio de Communicaciones, Transporte y Obras Publicas, 7A Avenida 14-57, Zona 13, Guatemala City, Guatemala; Lee Siebert and Paul Kimberly, Global Volcanism Program, National Museum of Natural History, Room E-442, Smithsonian Institution, Washington DC 20560-0119.
Mid-January eruption spawns lava flow, 8-km-high plume, and evacuations
An INSIVUMEH report noted that Pacaya, which erupts frequently, had been relatively quiet through at least 1 September 1999. At that time its behavior was fumarolic only and tremor registered sporadically.
The rest of this report covers the interval from late December to 16 January. Anomalously large explosions took place during the days preceding 23 December, when Strombolian eruptions sent material 300-500 m high. The explosions originated in a narrow depression 50-75 m long on the upper SW flank, facing the city of Patrocinio. The activity was observed from points on the S coast. Shallow explosions created earthquakes in and around the volcano.
Atmospheric conditions remained relatively stable; a clear, calm wind blew from the N at ~35 km/hour. On 29 December weak explosions deposited rocks and fine ash over the edifice, and a constant fumarole emitted white and blue colored gases. The explosions that day created a plume 25 m high. A lava flow extended 75 m from the crater rim toward the SW, in the direction of Patrocinio. Tremor and explosions also occurred.
In January 2000, Pacaya remained restless. Otto Garcia reported that on 14 January a period of Strombolian activity began with lava flows and small explosions. Then, on 16 January, a comparatively violent explosion took place. Photographs taken from the NW (figures 25-28) showed high tephra ejections, a dark plume, and lava flows. According to NOAA reports received by Garcia, the tephra-bearing plume reached ~8-km altitude after the eruption climaxed around 2245. Winds spread tephra S and SE to the provinces of Escuintala, Siquninala, and Santa Lucia Cotz, and as far as 50 km S of the volcano. Lava fountains that rose 500-750 m above the cone were visible from Guatemala City, ~35 km N; the vigorous outburst lasted ~4 hours. In nearby villages 1,500 residents were evacuated.
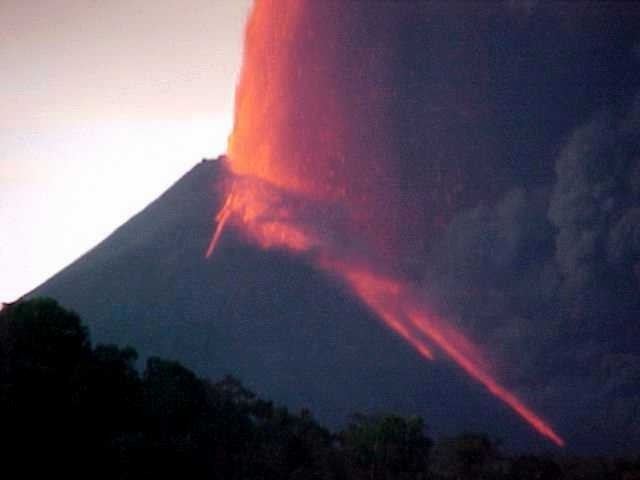 |
Figure 26. A daytime scene of the 16-17 January Pacaya eruption. The view is from the NW. Courtesy of Manolo Barillas (CONRED). |
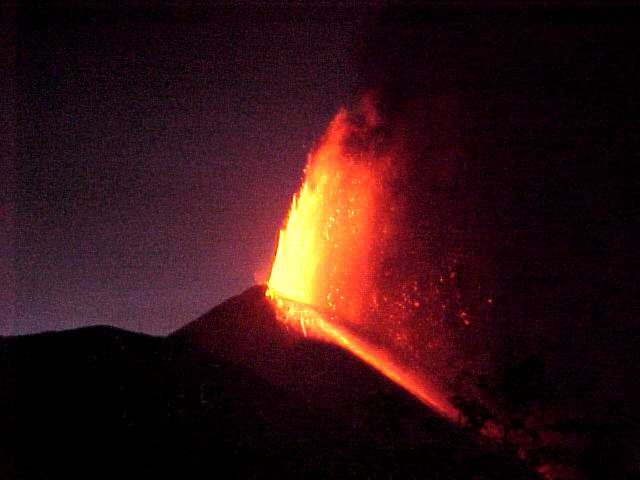 |
Figure 27. Pacaya's fountaining seen on the night of 16-17 January 2000. The view is from the NW. Courtesy of Manolo Barillas (CONRED). |
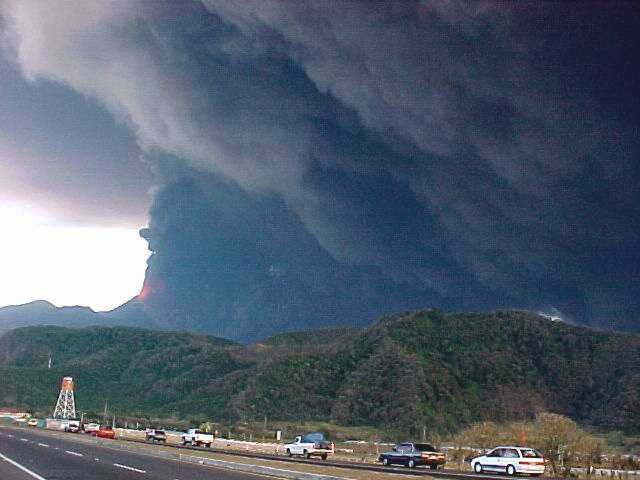 |
Figure 28. Dense, billowing ash clouds from Pacaya on 16 January 2000. Cars along the road between the towns of Amatitlán and Esquintla are in the foreground. Courtesy of Manolo Barillas (CONRED). |
The eruption was photogenic and appeared in numerous media reports. A CNN news report stated that by 17 January Eddie Sanchez of INSIVUMEH estimated that the lava flow had advanced 900 m down the mountain.
Tourist's photos and impressions. On the afternoon of 16 January guided tourist groups were visiting the volcano; some had ascended to an overlook when unusually energetic explosions occurred. One tourist, Gene Weast, wrote of his experience during the explosion in a brief letter that appeared on a website along with documenting photographs, including figure 29.
During the hike up the volcano, the guide cautioned the group to keep their distance from fresh lava, since such material had become larger and hotter in the last few days. Every 10 seconds an explosion from the summit sent rocks and lava 40-100 m high. As the sun began to set the explosions suddenly became louder, and chunks of lava (volcanic bombs) were thrown 0.5-1 km into the sky. Soon after the large explosions commenced, these bombs began to fall on the sides of the mountain. All of the guides and tourists ran back down the volcano and managed to escape the explosions safely.
Information Contacts: Eddie Sanchez and Otoniel Matias, Instituto Nacional de Sismología, Vulcanología, Meteorología e Hydrología (INSIVUMEH), Ministerio de Communicaciones, Transporte y Obras Publicas, 7A Avenida 14-57, Zona 13, Guatemala City, Guatemala; Otto García, 7a Avenida 14-44 zona 9, Edificio La Galeria, Oficina 11, 2do. Nivel, Guatemala, Guatemala; Manolo Barillas, Coordinadora Nacional para la Reducción de Desastres (CONRED), Avenida Hincapie 21-72 zona 13, Guatemala City, Guatemala; Gene Weast, 1061 SW Western Blvd., Corvallis, OR 97333 USA; Cable News Network (CNN) (URL: http://www.cnn.com/).
Map of new lava flows, satellite data, and perspective on the 16 January eruption
A vigorous new phase of explosive and effusive activity began at Pacaya in late 1999 (BGVN 24:12). The eruption began with Strombolian activity on 23 December 1999 and, by 16 January 2000, built a ~50-m-high cinder cone within the summit crater. On 4 January the lava had started to flow beyond the summit crater and, by 10 January, the lava extended 1 km down the SW flank. Subsequently, the summit crater fed a second lava flow that descended the 30-40° slopes along the N flank of Pacaya's central cone (figure 30). At the base of the cone, the lava channel bifurcated and the outer crater wall deflected the flows NW. Along its medial section, the southernmost channel was 5-7 m deep and 7-10 m wide. By 2130 on 14 January this portion of the flow had formed a tube. After exiting the channel and tube system, the lava formed a pond in the basin between the base of the cone and outer crater wall building a 200-m wide compound aa lava field ~1 km long. This field overlaid most of the lava field formed by the September 1998 eruption.
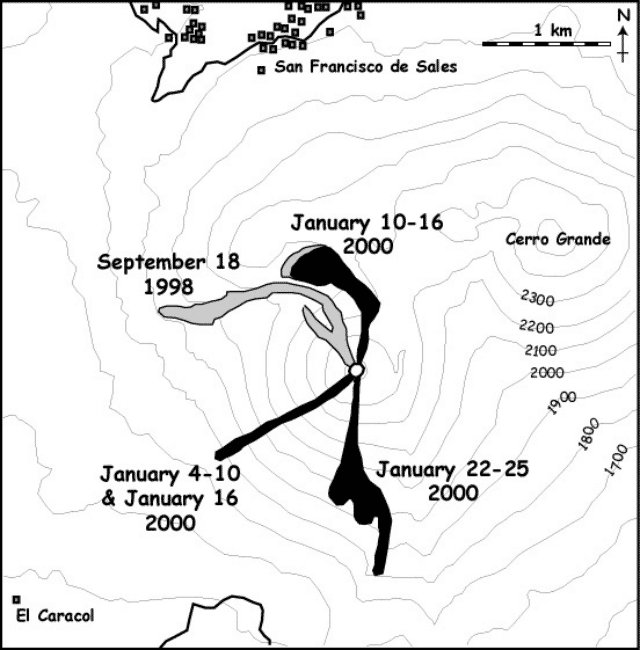 |
Figure 30. Sketch map of Pacaya showing flow fields active during September 1998 and January 2000. Courtesy of Otoniel Matías, Andy Harris, Bill Rose, Luke Flynn, and James Vallance. |
At 1615 on 16 January the eruption increased in intensity and changed from Strombolian to fountaining. These fountains fed ash plumes, which were observed on GOES images, and the cinder cone built earlier was destroyed during the first 5 minutes of the high intensity activity. Fountaining initially reached heights of 800 m but diminished to 300 m by 1830. Fallout from the fountains fed near-constant nuées ardentes and a lava flow that extended 600-700 m to the SW (figure 30). Within the summit crater lava fountaining appeared from about four vents, or possibly a fissure, with the highest and most vigorous fountains issuing from the southernmost sources. Fountains from these southernmost sources projected obliquely to the S. Strombolian activity returned around 2030.
The 16 January episode was one of the most spectacular at Pacaya in all of its current 35-year-long history of eruption. While the population of Guatemala City watched the fountaining, the fall of over 30 cm of tephra in the area S of the vent forced over 1,000 people to leave that area and closed the Aurora Airport that evening.
Activity in the morning of 19 January was characterized by low-level degassing but at 1325 an ash plume rose ~5 km above summit level. Ballistic block fall occurred during the first minute and a maximum temperatures of 97°C was measured at the base of the column a few minutes later. The plume spread mainly to the S, but wind shear caused spreading of the plume to the N and W. The intensity of ash emission began to wane and by 1415 the plume height had declined to 200-300 m and the ash plume temperature decreased to 24-35°C. Persistent ash emission continued from at least two sources within the summit crater throughout the afternoon with frequent larger pulses causing the plume to increase in height and temperature. Persistent ash emission continued to heights of ~50 m, with occasional puffs pushing the plume to ~100 m, causing higher temperatures and ash drifting 3-6 km to the S. Seismic records show that the high intensity portion of this eruption lasted 8 minutes followed by a 30-minute-long hiatus and then 7 to 8 pulses each lasting between 45 seconds and 4 minutes.
Seismic records indicated a renewal of activity in the late afternoon of 22 January. GOES hot spot monitoring tool (http://hotspot.higp.hawaii.edu/) indicated hot-spot activity beginning between 1725 and 1745 and relating to intracrater activity. A Landsat-7 Enhanced Thematic Mapper (ETM+) scene acquired at ~1030 on 23 January shows an intense thermal anomaly within the summit crater, a point source 180-240 m in diameter. The absence of an elongated anomaly extending from this source indicates that flow activity had not begun at that time.
By 24 January, Strombolian eruptions fed a persistent, diffuse plume of fine ash that rose ~1.5 km above the summit. Later observations on the same day showed vigorous, near-continuous Strombolian activity with explosions occurring at a rate of 19-28 events per minute and throwing incandescent bombs as large as 1-2 m in diameter and occasional ribbon spatter to heights of about 300 m. At nightfall observers from Guatemala City could see a continuous glow from the crater. Bombs from at least two vents landed within a few hundred meters from the vents on the N, S and W flanks; the ejecta on the S causing incandescent avalanches within 200-300 m of the crater as bombs tumbled down the steep slopes of the summit cone. Lava flow extended southward for 400-500 m, and turned SSE to SE at the base of the cone. For the first 400-500 m, the flow was mainly contained in a 5- to 10-m-wide channel with two heavily crusted sections, but at the break of slope of the cone an incandescent aa flow widened to ~200 m. The flow front contained three lobes, each 30-70 m wide and the longest of which advanced ~ 1 km from the vent (figure 30).
Although a persistent ash plume was observed from Guatemala City the following day (25 January), the plume had disappeared by 0900. A rapid decline in GOES-recorded hot spot radiance between 2143 on 24 January and 0056 on 25 January indicated that lava had ceased to flow.
At 1815 on the evening of 29 February, a second major eruption began. An ash column rose 2 km into the sky and then, at 2140, a column of erupting lava rose to ~700 m above the summit. Wind blew the ashes to the SSW, falling on the towns of Escuintla and Siquinala. The National Disaster network declared a red alert and surrounding communities were evacuated. A hot spot appeared on the GOES image around 2045 and a peak of activity was reached around 2200 which diminished sharply thereafter. However, by 1030 on 1 March, the hot spot intensity was still fairly high, albeit lower than the peak the previous evening.
On 1 March Andy Harris and co-workers in the HIGP/SOEST group noted a "big flash" in the GOES data depicting Pacaya. This appeared to develop from a hot spot that began around 2045 on 29 February (0245 on 1 March GMT), possibly as early as 2015. Peak hot spot activity (and the flash) was reached around 2202, and an ash cloud tracking NE (which extended seven to nine GOES pixels during 15 minutes) was apparent in imagery at that time. After 2202, the hot spot intensity fell sharply but as of 1032 on 1 March it still remained.
Harris also noted that their system issued an automated email notice for this event at 0424 GMT, just 22 minutes after acquiring the image. Since their system alerted them to the hot spot a few hours prior to the main flash and ash emission, this enabled them to watch as activity escalated.
Information Contacts: Otoniel Matías, INSIVUMEH, 7a Av. 14-57, Zona 13, Guatemala City, Guatemala; Andy Harris and Luke Flynn, HIGP/SOEST, University of Hawai'i, 2525 Correa Road, Honolulu, HI 96822, USA (URL: http://modis.higp.hawaii.edu/); Bill Rose, Department of Geological Engineering and Sciences, Michigan Technological University, Houghton, MI 49931, USA; James Vallance, Department of Civil Engineering and Applied Mechanics, McGill University, Montreal, Quebec H3A 2K6, Canada; Edouard Gegout, c/o European Volcanological Society, C.P.1-1211 Geneva 17, Switzerland.
Substantial increases in SO2 degassing
Activity at Pacaya was at a low level during 21-23 January 2001 based on field observations. Activity was characterized by persistent degassing only from a vent on the floor of the MacKenney cone crater. During the afternoon of 22 January, a low-resonance rumbling was noted within 100 m of the crater rim and continuous tremor was felt at the crater rim. Such activity had not been apparent during the previous afternoon.
On 22 February, according to a report from INSIVUMEH, a local seismometer recorded >600 tremors/day, up from <100 tremors/day in earlier weeks. At the same time, gaseous emission had increased from ~253 metric tons/day (equivalent to the SI unit megagrams per day, Mg/d) to ~550 metric tons/day and there was visible magma in the crater.
The SO2 flux was measured by COSPEC along the highway from Guatemala to Escuintla on 1, 15, and 28 February and on 8 March. The respective flux values in metric tons/day were 951, 1,740, 1,448, and 1,673. These flux rates suggested that although lava outpouring was almost nonexistent, degassing of SO2 was quite high. The average gas emission rate for the 20-year period of 1973-93 at Pacaya was estimated by Andres and others (1993) to be 260 metric tons/day.
Reference. Andres, R.J., Rose, W.I., Stoiber, R.E., Williams, S.N., Matías, O., Morales, R., 1993, A summary of sulfur dioxide emission rate measurements from Guatemalan volcanoes: Bull. Volc. 55, p. 379-388.
Information Contacts: Andy Harris and Luke Flynn, HIGP/SOEST, University of Hawai'i, 2525 Correa Road, Honolulu, HI 96822, USA (URL: http://modis.higp.hawaii.edu/); Mark Davies, School of Environmental Sciences, University of East Anglia, Norwich, NR4 7TJ, United Kingdom; Bill Rose, Gregg Bluth, and Jeremy Shannon, Department of Geological Engineering and Sciences, Michigan Technological University, Houghton, MI 49931, USA; Otoniel Matías and Gustavo Chigna, INSIVUMEH, 7a Av. 14-57, Zona 13, Guatemala City, Guatemala; Rafael W. Rodriguez, Regional Program Manager, U.S. Geological Survey, Hurricane Mitch Relief Program.
Costly 1999 aircraft-ash encounters due to ash plumes
At least two commercial aircraft flew through airborne ash near the Guatemala City airport on 21 May 1999. An eruption from Fuego that day was the first at that volcano since 1987 (BGVN 24:04). Although the aviator's reports attributed the ash from this encounter to Fuego, their aircraft intersected multiple ash plumes in widely different locations, and thus they may also have crossed plumes from Pacaya. The most likely plume near the southern approach to the airport (La Aurora, ~23 km N of Pacaya; ~40 km NE of Fuego) is from the almost constantly active Pacaya. In contrast, Fuego lies 32 km W of Pacaya and was the likely source of a plume intersected later during the flight, at higher altitude, and for much longer duration.
During the encounters the ~100 or more people on board the two aircraft, and many more on the ground, were at risk. Both encounters seriously damaged the aircraft but ended in safe landings without reported injuries. Volcanic ash can cause jet-engine failure, which creates a hazard not only to passengers, but to people on the ground as well. The risk in this situation was amplified by the airport's proximity to urban Guatemala City (population, >1.1 million).
This example leads to two conclusions discussed further below. First, ash avoidance methodology needs further refinement. Second, there exists an apparent bias towards under-reporting of aircraft-ash encounters, which could short-change their cost to air carriers, their perceived risk, and their funding allocation.
The original report of an aircraft-ash encounter was brought to our attention by Captain Edward Miller of the Air Line Pilots Association and provided on the condition that the air carrier remain anonymous. Bulletin editors also wish to acknowledge conversations with several additional anonymous contacts (commercial pilots). This case occurred in Guatemala; however, analogous situations exist at many airports adjacent to volcanoes. Modest eruptions from nearby volcanoes may be uncertain or difficult to see; they may be hard to detect or characterize; yet they still may yield mobile ash plumes carried by complex local winds to confront air traffic (Salinas, 2001; Hefter, 1998; Casadevall, 1994).
Although in most Bulletin reports we favor the use of local time to emphasize the reference frame of people on the scene, most of the source material (satellite and aviation) for this report refer to UTC (Coordinated Universal Time). UTC is the time on the Greenwich meridian (longitude zero), formerly GMT, a term which has fallen out of use. Accordingly, there are cases in this report that lack conversion to local time. Local time in Guatemala is 6 hours behind UTC.
Activity at Fuego and Pacaya. Fuego erupted on 21 May 1999 sending ash to the S, SE, and SW and ultimately dropping up to 40 cm of ash on local settlements (BGVN 24:04). The eruption occurred at 1800 local time (in terms of UTC, at 0000 the next day). Three hours later the eruption decreased and the Aeronautica Civil recommended that planes go no closer to Fuego than 40 km. One hour after that (at 2200 local, 0400 UTC), the atmospheric ash had settled, and Aeronautica Civil recommended flying no closer to Fuego than 15 km.
Bulletin reports for Pacaya in mid-1999 suggested relative calm, in harmony with the observation that it had chiefly been fuming. However, Pacaya is well-known for Strombolian outbursts. It lies directly in-line and only 23 km S of the N10°E-oriented airstrip. As is common for commercial aircraft there, the approaches described below passed very close to Pacaya. Pacaya typically has lower and smaller eruptions than Fuego, but because it lies so close to the southern approach to the airport, Pacaya's ash plumes easily enter the path of landing aircraft. The situation was particularly complex during this eruption because Fuego's ash was reported on cities that lie below the flight path as well as on the Pacaya's flanks.
Pilot's report of aircraft-ash encounter. What follows was taken from one flight crew's description of events and from later reports and dialog on the topic. In order to preserve the confidentiality of the airlines, the precise times of events on 21 May 1999 have been omitted. Pilots reported clear visibility and light wind, with both the capital and the airport in sight. They maneuvered the aircraft for a final approach from the S. Pilots were advised by air traffic control about erupted particulate ("volcanic sand") about 24 km (15 miles) SE of the airport, well away from their projected path to Runway 01. In addition, based on winds they detected as they neared the airport, the pilots concluded that the erupted particulate to the SE was downwind from their projected flight path to the airport. (In retrospect, this conclusion appears tenuous considering the possibility of either a fresh injection of ash from Fuego, or lingering ash in the trailing portion of the plume that lay to the SE.)
At ~32 km (20 miles) distance from the runway, the pilots maneuvered the plane through ~3,000 m (9,700 feet) altitude on a final approach to the airport with the plane's flaps partially extended (at ~15°, which slowed their aircraft to ~260 km/hour (160 mph), its auxiliary power unit (a small jet engine) on, and its landing gear down. Around this point in their descent, pilots saw bright yellow sparks through the windshield lasting a few seconds, a display unlike static electricity, but rather like that from a grinding wheel. This occurred again at 2,500 m (8,200 feet) altitude, but was more intense yet intermittent.
At this time, air-traffic control announced to the pilots that the aircraft landing in front of them had encountered volcanic particulate; they instructed the pilots to abort their landing and climb to 3,350 m (11,000 feet) altitude. Discussions of options and ash avoidance ensued between pilots and air-traffic control; ash had by this time accumulated on the runway, further complicating landing, even for approaches in the opposite direction. The pilots retracted the landing gear, accelerated to ~410 km/hour (~250 mph), began to climb, and after some discussion with air-traffic control, held on a course NE of the airport. They were subsequently cleared to climb to 6,700 m (22,000 feet) altitude and advised to proceed to an alternate airfield.
During the climb, at ~5,800 m (19,000 feet) altitude en-route to the alternate airport, the aircraft encountered volcanic particulate for 10 minutes. Within that interval the plane spent 2 minutes during ascent engulfed in denser and heavier particulate. During that period, window arcing was constant and the beam of their landing lights revealed a conspicuous cloud of reflecting particles. During ash ingestion the engines's speed lacked noticeable fluctuations. The aircraft exited the plume at about 6,100 m (20,000 feet) altitude and landed without encountering additional ash.
Upon landing, the pilots noticed reduced visibility through abraded windshields. Post-flight examination of the airplane revealed heavy damage, requiring the replacement of the engines (US $2 million each) and auxiliary-power-unit engine. (Note, however, that no deterioration in engine power or performance was noticed during the flight.) Other replaced parts included windshields, a heat exchanger, and coalescer bags. Minor damage was seen on the horizontal stabilizer and wing leading-edges.
Volcanic Ash Advisory Statements. The U.S. National Oceanic and Atmospheric Administration (NOAA), Satellite Services Division website contains two archived statements issued by the Volcanic Ash Advisory Center (VAAC) at Washington, D.C. for Fuego on 21-22 May 1999. The statements, issued to the aviation cummunity to warn of volcanic hazards, are intended for an audience accustomed to special terminology (figures 31 and 32). In the interest of advancing understanding of how volcanological and atmospheric data get transmitted to aviators, we offer brief explanations for many of the terms used (figure 31).
The Washington VAAC received first notification of the Fuego eruption from a routine surface weather observation from Guatemala City at 2000 local time (0200 UTC) on 22 May. They issued the first Volcanic Ash Advisory Statement a half-hour later (figure 31). Six hours later they issued the second Advisory Statement (figure 32). The Advisories were composed by staff of the Satellite Analysis Branch, one of the two NOAA components forming the Washington VAAC (Streett, 1999; Washington VAAC).
The section "Details of ash cloud" first says that the "surface observation from Guatemala City indicate that the Fuego volcano is in eruption" and that no additional information is available and then briefly describes in words observations that came from satellite imagery. The first sentence, "No eruption..." is self-explanatory, but highlights a limitation of the method in use that needs to be emphasized to aviators: an eruption may have occurred but its status is not revealed on the imagery. The sentence, "No eruption could be detected due to thunderstorm cloudiness covering the area around the volcano" is self-explanatory. Less clear is the term convective debris. It does not refer to ash; rather, it refers to remnants of thunderstorms. The gist of these latter two sentences is simply that the thunderstorms that covered the area made it challenging or impossible to see the ash on satellite imagery. Central American thunderstorm clouds typically can reach altitudes of more than 12,000 m (40,000 feet), and can mask or obscure airborne ash residing below that level.
Members of the Washington VAAC commented that this eruption demonstrates key problems that can arise when cloudy conditions prevent satellite detection of ash, foiling a primary mode of analysis. In such cases, they rely on ground observers (including observatories and weather observers), pilot reports, and reports from airlines. Thus, their ability to issue useful information in cloudy conditions depends on the quality of communications with local observers, the Meteorological Watch Office, volcanologists, geophysical observatories, and the aviation community.
The Advisory Statement listed México City weather balloon data acquired 1,050 km NW of Guatemala City. In retrospect, the Washington VAAC noted that they generally avoid using such distant sounding data. If a closer sounding cannot be found, they prefer to use upper-level wind forecasts taken from a numerical weather model. In any case, the scarcity of local sounding data presents a challenge to the realistic analysis of airborne ash.
The outlook section says to "see SIGMETS." SIGMETS are the true warnings to aircraft for SIGnificant METeorological events. They are issued by regional Meteorological Watch Offices (MWOs), in this case the MWO (for Guatemala) is in Tegucigalpa, Honduras. SIGMETS were lacking for this eruption; although the Washington VAAC tried to contact the MWO without response. Another complexity confronted at the VAAC is a lack of a single scale for communicating a volcano's hazard status.
Reporting of aviation ash encounters. In personal communications with Bulletin editors, airline personnel stated that many more encounters have occurred than have yet been tallied in publically accessible literature. In accord with those assertions, the 21 May 1999 encounters are absent from reports compiled by the International Civil Aviation Organization (ICAO, 2001). In that document (Appendix I, table 3A, p. I-12) Fuego fails to appear as a source vent for any aircraft-ash encounter. Pacaya is listed for two encounters, in January 1987 and in May 1998 (BGVN 23:05).
Even though the number of encounters was probably under-represented and thus reflects a minimum, ICAO (2001) notes that the international costs to aviation since 1982 summed to well in excess of $250 million. They noted, "In addition to its potential to cause a major aircraft accident, the economic cost of volcanic ash to international civil aviation is staggering. This involves numerous complete engine changes, engine overhauls, airframe refurbishing... aircraft downtime... [and] volcanic ash clearance from airports and the damage caused to equipment and buildings on the ground."
The incidents here suggest that there has been a strong bias toward under-reporting aircraft-ash encounters. If this tentative conclusion is correct, it implies consistent understatements of the hazard's magnitude. This, in turn, may have thwarted meaningful analysis of how and whether to proceed with designing more robust hazard-reduction systems. Accordingly, resources that could have been devoted to the problem have not yet been committed (see Gimmestad and others, 2001 for a discussion of a prototype on-board ash-detection instrument).
Communication challenges. While much of the aviation community needs to learn about volcanism rapidly, dependably, and with the aid of the Internet, some observers charged with reporting volcanic-ash hazards in Central and South America lack access to basic communication devices like reliable telephones and fax machines. To reduce the risks, the aviation, meteorological, remote sensing, and volcanological communities need to improve their ability to pass critical information to each other rapidly and precisely. The operational systems related to volcanic ash and aviation must transcend numerous boundaries (eg., languages, infrastructure, funding, governments, agencies, air carriers, pilots, aircraft manufactures, etc.). The systems need to portray complex, dynamic processes such as the rapid rise of an explosive plume, or large-scale ash-cloud movement.
Although the infrastructure for ash avoidance is greater than ever, members of the Washington VAAC have told Bulletin editors that they still depend heavily on people on the scene of the eruption to notify them promptly when eruptions occur. They said that thus far in parts of Central and South America a problem has been the expense of communication (eg., by phone, fax, and Internet). They also said that for the same regions the U.S. meteorological database regularly lacks pilot reports. Though serious, these problems have at least been identified and their solutions would appear to lack great technical or economic barriers.
The pilots involved in the May 1999 encounter recommended that far more emphasis be placed on forecasting and avoiding ash plumes. Other pilots cited the need for fast and accurate communications between those who observe eruptive activity and air traffic control personnel.
Issues like these continue to be an important subject at gatherings on the topic of ash hazards in aviation (Casadevall, 1994; Streett, D., 1999; Washington VAAC, 1999). The Airline Dispatcher's Federation (ADF) will participate in a 7-9 May 2002 conference and workshop: "Operational Implications of Airborne Volcanic Ash: Detection, Avoidance, and Mitigation." The gathering will provide the pilot and dispatcher with insights into volcanic ash, including its characteristics, affects on aircraft, detection/tracking, effective warning systems, and mitigation. A "hands-on" exercise will make this the first gathering of its kind to provide lab-style instruction on interpretation of satellite and wind data, and on models of ash trajectory and dispersion. Representatives from the Boeing company, and a host of US government agencies and non-governmental organizations will attend. The workshop will include lectures, demonstrations, laboratory exercises, and a simulated-eruption exercise involving volcanologists, forecasters, controllers, dispatchers, and pilots.
A second international symposium on ash and aviation safety is being planned by the U.S. Geological Survey, organized by Marianne Guffanti. It will be held in Washington, D.C. in September 2003.
References. Casadevall, T.J. (ed.), 1994, Proceedings of the First International Symposium on Volcanic Ash and Aviation Safety: U.S. Geological Survey Bulletin 2047, 450 p.
Gimmestad, G.G., Papanicolopoulos, C.D., Richards, M.A., Sherman, D.L., and West, L.L., 2001, Feasibility study of radiometry for airborne detection of aviation hazards, NASA/CR-2001-210855; Georgia Tech Research Institute, Atlanta, Georgia, 51 p. (URL: http://techreports.larc.nasa.gov/ltrs/PDF/2001/cr/).
Hefter, J.L., 1998, Verifying a volcanic ash forecasting model, Airline Pilot, v. 67, no. 5, pp. 20-23, 54.
International Civil Aviation Organization (ICAO), 2001, Manual on volcanic ash, radioactive material, and toxic chemical clouds, doc 9691-AN/954 (first edition): 999 University St., Montreal, Quebec, Canada H3C 5H7 (purchasing information: sales_unit@icao.int).
Rose, W.I., Bluth, J.S.G., Schneider, D.L., Ernst, G.G.J., Riley, C.M., Henderson, L.J., and McGimsey, R.G., 2001, Observations of volcanic clouds in the first few days of atmospheric residence: The 1992 eruptions of Crater Peak, Mount Spurr volcano, Alaska, Jour. of Geology, v. 109, p. 677-694.
Salinas, Leonard J., 2001, Volcanic ash clouds pose a real threat to aircraft safety: United Airlines, Chicago, Illinois (URL: http://www.dispatcher.org/library/VolcanicAsh.htm).
Simkin, T., and Siebert, L., 1994, Volcanoes of the World, 2nd edition: Geoscience Press in association with the Smithsonian Institution Global Volcanism Program, Tucson AZ, 368 p.
Streett, D., 1999, Satellite-based Volcanic Ash Advisories and an Ash Trajectory Model from the Washington VAAC: Eighth Conference on Aviation, Range, and Aerospace Meteorology, 10-15 January 1999, Dallas, Texas; American Meteorological Society, p. 290-294.
Washington VAAC, 1999, Operations of the Washington Volcanic Ash Advisory Center, in Aeronautical meteorological offices and their functions, and meteorological observation networks: Third Caribbean/South American Regional Air Navigation Meeting (Car/sam/ran/3); Buenos Aires, Argentina, 5 - 15 October, 1999; International Civil Aviation Organization (http://www.ssd.noaa.gov/ VAAC/PAPERS/carsam.html).
Information Contacts: Captain Edward Miller, Air Line Pilots Association (ALPA), Air Safety & Engineering Department, 535 Herndon Parkway, PO Box 1169, Herndon, VA 22070-1169, USA; Grace Swanson and Davida Streett, Washington VAAC, Satellite Analysis Branch (NOAA/NESDIS), 4700 Silver Hill Road, Stop 9910, Washington, DC 20233-9910, USA (URL: http://www.ssd.noaa.gov/); Bill Rose, Geological Engineering and Sciences, Michigan Technological University, Houghton, MI 49931, USA.
Lava lake activity during August 2000-June 2001 marks change in eruptive style
Large explosions occurred from MacKenney Crater on 16 January and 29 February 2000 (BGVN 25:01). Although an increase in SO2 degassing during February and March 2001 was reported (BGVN 26:04), the following provides additional information about activity from February 2000 through January 2002. The Washington VAAC reported that possible low-level ash around the summit was visible on GOES-8 satellite imagery on 30 May 2002.
Activity during March-November 2000. Hotspots on GOES images from the 29 February 2000 eruption were noted until 1 March 2000, after which they shrank until August 2000, although strong SO2 degassing continued at a level of ~1,500-2,000 metric tons/day (t/d).
In August 2000 ash eruptions took place for a week, after which a lava lake appeared in the summit crater during the last week of the month. The lava lake generated occasional booming sounds, ashfall, and the spattering of bombs. These were generally restricted to within MacKenney crater; they originated from an inner crater that was 20 m wide with 25-m-deep walls and ~50 m below the rim.
Gas emission increased to high levels beginning in November 2000, producing dense plumes that affected vegetation near the crater. The vigorous plumes were typically deflected by prevailing winds to the S and W where they damaged pine trees and corn fields in areas between El Caracol and Los Positos, 3 km W and 5.5 km S, respectively.
Activity during February 2001-June 2001. An increase in SO2 degassing during February and early March 2001 coincided with a significant increase in daily tremors (BGVN 26:04). On 22 February a local seismometer recorded >600 tremors/day, up from < 100 tremors/day in earlier weeks. At the same time, gaseous emission had increased from ~253 to ~550 t/d and there was visible magma in the crater. The SO2 flux was measured by COSPEC along the highway from Guatemala to Escuintla on 1, 15, and 28 February and on 8 March. The respective flux values in t/d were 951, 1,740, 1,448, and 1,673. These flux rates suggested that although lava outpouring was almost nonexistent, degassing of SO2 was quite high.
Nighttime incandescence from long-term lava lake activity was easily seen at a distance of several kilometers from August 2000 through June 2001 and was often visible from Guatemala and Escuintla cites (N and S of Pacaya, respectively). This marked a shift in eruptive style from the persistent Strombolian eruptions characteristic of Pacaya for several decades.
Activity during July 2001-November 2001. After June 2001, incandescence was no longer visible, but strong degassing continued, along with seismicity consisting of 250-380 B-type events/day. Erosion of the rim of the outer crater was accompanied by rock avalanches down the S flank of the cone. During September to October 2001 acid rain from the vigorous degassing affected areas to the N of Pacaya and burned leaves on vegetation in the El Cedro, San Francisco de Sales, and San José Calderas areas; residents in these areas reported that some birds had also died. On 31 October minor Strombolian explosions produced a little ash visible on satellite imagery during 1611-1820. A persistent plume reached 50-200 m above the crater, and ash fell S of the volcano. Since that time observers from INSIVUMEH reported only gas emission, and lava lake activity was not seen. On 14 November 2001 SO2 fluxes of 1,800 tons/day were measured at MacKenney Crater by INSIVUMEH.
Activity during January 2002. During field work on 12 January 2002, measurements were made of the active crater on MacKenney cone. Along a N-S transect the crater was 72 m wide at its narrowest point, and 94-100 m at its widest. The pit was ~80 m deep, and was the location of two sources of gas. Activity was characterized by persistent degassing. COSPEC measurements showed that SO2 emission rates remained high, ranging from 500 to more than 2,000 t/d. These rates were similar, but perhaps more variable, than one year earlier.
During 8-14 January 2002 geologists from INSIVUMEH and Michigan Technological University measured SO2 fluxes of ~1,200 tons/day in Pacaya's plumes (figure 33). Volcanologists who spent at night at the observatory reported seeing plume glow, presumably reflected light from a deeper lava source. The degassing produced a thick white plume, similar to that often generated by Masaya volcano in Nicaragua. The plume was seen drifting horizontally S from the crater on 29 January 2002 by volcanologists at the summit of Santa Ana volcano in El Salvador, 120 km E. This sustained level of degassing was in contrast to previous activity, during which the average gas emission rate for the 20-year period of 1973-93 was estimated by Andres and others (1993) to be a comparatively modest 260 t/d.
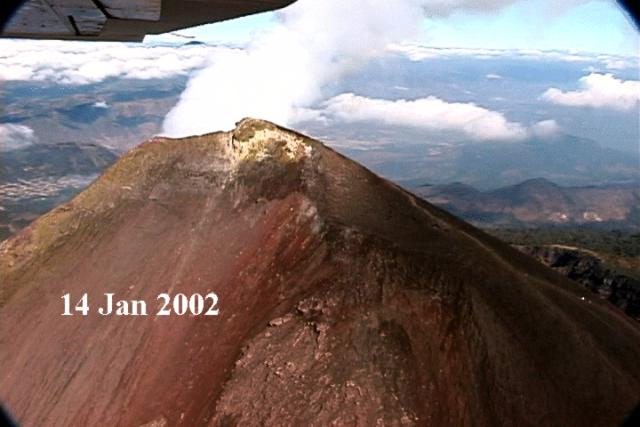 |
Figure 33. Aerial view taken on 14 January 2002 showing the upper part of Pacaya's Mackenney cone from the SE with a white gas plume blowing N. Courtesy of Matt Watson. |
General Reference. Andres, R.J., Rose, W.I., Stoiber, R.E., Williams, S.N., Matias, O., and Morales, R., 1993, A summary of sulfur dioxide emission rate measurements from Guatemalan volcanoes: Bulletin of Volcanology, v. 55, no. 5, p. 379-388.
Information Contacts: Gustavo Chigna and Otoniel Matías, Instituto Nacional de Sismologia, Vulcanologia, Meteorologia e Hydrologia (INSIVUMEH), 7a Av. 14-57, Zona 13, Guatemala City, Guatemala; William Rose, Matt Watson, Janelle Byman, Elly Bunzendahll, Lizzette Rodríguez, Ivonne Branan, and Gregg Bluth, Michigan Technological University, Houghton, MI 49931, USA; Lee Siebert and Paul Kimberly, Global Volcanism Program, Smithsonian Institution, Washington, DC 20560-0119, USA; Andrew Harris, Luke Flynn, Mark Davies, University of Hawaii, 2525 Correa Road, Honolulu, HI 96822, USA; Simon Carn, TOMS Volcanic Emissions Group, Joint Center for Earth Systems Technology (NASA/UMBC), University of Maryland, Baltimore County, 1000 Hilltop Circle, Baltimore, MD 21250, USA.
Frequent steam plumes
Although incandescence from the long-term lava lake ended after June 2001, SO2 emission rates remained high when measured in January 2002 (BGVN 27:07). On 30 May 2002, the Washington Volcanic Ash Advisory Center (VAAC) received a report from Guatemala City indicating that Pacaya was active. Satellite imagery showed possible low-level ash near the summit. A very thin SW-drifting plume was again visible in satellite imagery on 17 June 2002, but the composition of the plume was unknown. A faint hotspot at the summit was also visible on infrared imagery. Visual observation on the afternoon 24 August 2002 from the SW showed copious white steam emissions from the summit crater (figure 34).
 |
Figure 34. View of Pacaya looking NNE on 24 August 2002. Only white steam emissions were visible. Courtesy of Jacquelyn Gluck. |
The Washington VAAC reported that on 5 July 2003 at 0715, a very thin ash and/or gas plume was visible on satellite imagery at an altitude of ~ 3 km extending ~ 7.5 km SW. By 1430 the plume was no longer visible, possibly obscured by thunderstorm clouds in the area. INSIVUMEH reported that only steam was emitted. Visible imagery on 9 August 2003 showed a narrow plume below 3 km altitude extending SW from the volcano, but its composition was unknown.
Reports provided by INSIVUMEH during the latter half of October 2003 indicated that during 15-21 October constant steam and abundant emissions of water and gas were being blown to the NNW and W of the volcano. These emissions continued through the end of the month. On 23 October, during periods of visibility, observers saw a line of off-white smoke across the S flank, which was dispersed in the area of the lava field near the Chupadero and the Caracol rivers. The next day observers saw a heavy column of off-white smoke rising ~ 600 m over the MacKenney crater. The plume continued through 27 October, but only to a height of ~ 400 m. The heavy gaseous cloud continued at the same height through 30 October.
Information Contacts: Instituto Nacional de Sismologia, Vulcanologia, Meteorologia e Hydrologia (INSIVUMEH), 7a Av. 14-57, Zona 13, Guatemala City, Guatemala (URL: http://www.insivumeh.gob.gt/); Washington Volcanic Ash Advisory Center (VAAC), Satellite Analysis Branch (SAB), NOAA/NESDIS E/SP23, NOAA Science Center Room 401, 5200 Auth Road, Camp Springs, MD 20746, USA (URL: http://www.ospo.noaa.gov/Products/atmosphere/vaac/); Jacquelyn Gluck, Global Volcanism Program, Smithsonian Institiution, Washington DC, 20560, USA.
Steam clouds and tremor in 2004; incandescence and lava flows in 2005
Frequent steam plumes through 2002 and 2003 indicated that Pacaya was active, although incandescence from the long-term lava lake ended after June 2001. During the latter half of October 2003 constant steam and abundant emissions of water and gas were being blown to the NNW and W of the volcano (BGVN 28:10). All of the following information is derived from the reports of Instituto Nacional de Sismologia, Vulcanologia, Meteorologia e Hydrologia (INSIVUMEH).
Throughout November and December 2003 and the first half of 2004, abundant clouds and columns of white and off-white gases and steam were expelled from Pacaya, generally reaching less than 400 m above the volcano and dispersing mostly to the W and SW; these were occasionally visible from Guatemala City, 30 km to the NNE.
During June, July, and August 2004, near-continuous tremor and frequent long-period earthquakes were recorded at seismograph station PCG (~ 1.4 km to the W of Pacaya). On 14 June, weak incandescence was observed in the central crater of MacKenney Cone for the first time since August 2000. Pacaya continued to expel off-white smoke and/or steam which usually drifted to the S and SW and rose to 150-300 m above the volcano. On 19 July, ejection of small lava fragments began to form a cone in the bottom of the central crater of MacKenney Cone.
During September-November 2004, tremor increased somewhat (from ~ 2mm in June, July, and September to 4-7 mm in December), and white steam and/or gas plumes rose 300-500 m above MacKenney Cone. Incandescence was observed throughout this time and lava clasts were expelled from the MacKenney Cone on 7-9 December.
On 3 January 2005, small expulsions of incandescent lava clasts rose from the central crater, and a narrow lava flow from the S rim of the crater reached 75-100 m down the flank. Station PCG continued to register tremor, and incandescence and white plumes persisted. On 10 January, lava flowed ~ 30 m from the SW rim of the central crater of MacKenney Cone. On 12 January, two lava flows, one to the S ( ~ 125 m) and one to the SW (~ 50 m) left the central crater. Observers saw incandescent lava fragments rising <10 m above the mouth of the intra-crater cone, and "smoke" whiffs rising from the MacKenney Cone. During the last 5 days of January 2005, numerous small lava flows descended the S and SW flanks of the volcano.
During February, March, and April 2005, incandescence, tremor, and minor lava flows continued. On 2 February observers reported that avalanches from the lava flow fronts during the previous days formed a debris fan covering about 2/3 of the SW flank. On 28 February expulsion of incandescent lava fragments reached heights of 10-50 m for brief periods. On 1 March INSIVUMEH recommended that park officials prevent tourists from climbing Pacaya because of avalanches, lava expulsion, and gas emissions. In March and April explosions of lava reached 100 m in height, and smoke/gas emissions continued.
Lava emission continued during May. On 4 May, three flows were active, extending up to 100 m down the SW flank and 150 m W in the direction of Cerro Chino. On 9 May two active flows from the base of the intracrater cone reached 200 m down the W flank. Plumes from the MacKenney Cone rose as high as 800 m above the crater. Ejection of incandescent material continued throughout the month. Lava flows moving to the SW and W in the direction of Cerro Chino reached lengths of 150-250 m.
During early June, incandescent lava clasts were ejected as high as ~ 75 m above Pacaya's crater. An intra-crater lava flow extended ~ 300 m from the SW base of the central cone. On 6 June, a lava flow traveled ~ 200 m down the volcano's W flank. By 27 June a lava flow extended ~ 300 m down the SW flank. A white steam column rose ~ 150 m over the central crater and drifted SW. Incandescent lava expulsions reached heights of 15-50 m. On the night of 27 June two rivers of lava, 75 and 150 m long, were observed in front of Cerro Chino. Constant expulsions of pyroclastic material rose 20-30 m above the crater.
Lava flows in July traveled 200-300 m down the SW flank. Small plumes emitted from the volcano's central crater rose to low altitudes. Avalanches of incandescent volcanic blocks produced small ash clouds to low levels.
During 7-11 September, occasional Strombolian activity occurred. Volcanic bombs from two craters rose up to 30 m above their rims. Incandescence from lava flows on the SE flank was visible on several nights.
Information Contacts: Instituto Nacional de Sismologia, Vulcanologia, Meteorologia e Hydrologia (INSIVUMEH), 7a Av. 14-57, Zona 13, Guatemala City, Guatemala (URL: http://www.insivumeh.gob.gt/); Washington Volcanic Ash Advisory Center (VAAC), Satellite Analysis Branch (SAB), NOAA/NESDIS E/SP23, NOAA Science Center Room 401, 5200 Auth Road, Camp Springs, MD 20746, USA (URL: http://www.ospo.noaa.gov/Products/atmosphere/vaac/).
During 2005 lava overtopped the collapse scarp to the inhabited N slopes
Our last Bulletin report discussed events at Pacaya as late as September 2005 (BGVN 30:10). Starting in 2005, lava flows from the active cone (MacKenney cone) substantially altered the local morphology and the consequent risks. The larger Pacaya complex's SW side is marked by an arcuate collapse scarp with relief up to 200 m. In 2005, for the first time, lavas accumulated in sufficient thickness to cross the NE portion of this barrier. If lavas advance substantially N from this point, they would descend steep slopes and could endanger hikers and residents.
Gustavo Chigna, of the Instituto Nacional de Sismologia, Vulcanologia, Meteorología, e Hidrologia (INSIVUMEH), mapped the substantial lava field N of the summit in 2008. In places, the flows that accumulated during 2005-08 reached 100-150 m thick (figure 35). The flows chiefly emerged from a new fissure on the upper NNE flank, constructing a protrusion from the MacKenney cone. As the lavas advanced they curved W, many ultimately reaching the N to NW sides of the active cone. Material venting within that crater sometimes formed small ephemeral cones that reached above the high point on the enclosing crater rim, but they always collapsed later.
About 1,100 years ago Pacaya's SW side underwent a sector collapse, an event where a major part of the edifice collapsed, forming a debris avalanche that reached the Pacific coastal plain (Siebert and others, 2006). The edifice still bears an enormous scarp from this event. Within the horseshoe curve of this scarp, the MacKenney cone subsequently grew. It eventually rose to sufficient height to form the summit of the multi-peaked complex.
Although thick, rough-surfaced lava has emerged for years from the MacKenney cone to flow in various directions downslope, those during 2005-06 advanced in a new and unexpected way. In a manner similar to previous episodes, some of the N-flowing lavas descended into the depression and were confined to curve around the moat. In contrast, other lavas cooled and accumulated sufficiently to fill this portion of depression. The lavas ultimately overtopped the collapse scarp, and flowed onto the ancestral cone (figures 35 and 36).
Since restarting after about 76 years in 1961, the volcano has erupted lavas with only occasional breaks of months to a few years. The latest eruptive pulse began in 2004. The summit elevation of the MacKenney cone has varied due to the cone's repetitive growth and construction.
MODIS thermal alerts from the MODVOLC website were issued frequently for Pacaya during the reporting interval. The only months without alerts took place during the six-month interval of September 2005-February 2006, and December 2006. More precisely, these gaps in alerts spanned 29 August 2005-10 March 2006 and 29 November 2006-23 January 2007 (all local dates).
Pacaya resides just outside the southern topographic rim of Amatitlán caldera and ~ 30 km S of central Guatemala City (Lima and others, 2000). Maps of the setting and volcano appeared here most recently in BGVN 24:02 and 25:01. The National Park that includes Pacaya was created in July 1963 and it is a popular tourist destination (Bohnenberger, 1967). The trail along and to the meseta was crossed by lava flows during 2006 and later, hampering access and leading to risk concerns (figures 37-39).
INSIVUMEH reports. Gustavo Chigna (INSIVUMEH) sent a report summarizing activity during 2005 through May 2008. He noted Strombolian activity during 1961-2000, typically with two to three paroxysmal eruptions each year. Those eruptions included falls of both ash and ballistic blocks, production of lava flows, and abundant gases escaping at the vent in the MacKenney cone's central crater. Pyroclastic flows were also mentioned, but without details. This eruptive pattern changed in the year 2000. The paroxysmal eruptions of January 2000, and 29 February 2000, and those continuing until September 2008 all chiefly consisted of steam-rich and ash-poor explosions.
During January-March 2005 a new phase of activity developed where the active cone emitted small batches of lava. This phase accompanied the repeated building and destruction of intracrater cones.
Observers in March-April 2005 saw the growth of N-S oriented cracks on the MacKenney crater, reaching 100-150 m in length and sometimes longer. Many of the cracks were 30-70 cm wide at the surface, and inspection revealed their open portions penetrated downwards about 1-8 m. Associated with these cracks, a depression became established on MacKenney cone's N side.
A new vent began emissions during a few days in mid-March and on 1 April 2005. Lava emerged from cracks on the cone's ENE side. In just a few days, the flow field from this vent grew to ~ 800 m long (figure 35). It curved to the W following the moat or valley floor (a comparatively flat area also called los llanos). By about 1 August 2005 this venting had sent many lava flows into the adjacent parts of the depression on the MacKenney cone's N flank. The rapid rate of lava accumulation during August filled up much of this part of the depression and eventually overtopped the scarp.
As the flows began to advance over the collapse scarp, alarm spread among residents of San Francisco de Sales, the town 1 km N of the flow front. The flows soon returned to advancing more to the W in the area confined by the collapse scarp and in the depression along los llanos.
The following year, after the 29 August 2005 and 10 March 2006 interval without thermal alerts, lava advanced onto a higher part of the meseta adjacent to a monument. This event is documented in two photos taken 27 July and 3 August (figure 40). Photos taken in August 2006 of the meseta show that the trail largely flow-covered (figure 41).
The lava amassed between the MacKenney cone and meseta represented a rapid and remarkable morphologic change. Meseta historically provided an elevated viewpoint from which observations of Pacaya could be made. As a result of the new morphology, and assuming similar ongoing eruptions, hazards now confront N-flank villages and the main trail access route. INSIVUMEH plans to review hazard maps and strategies for this area.
References. Bohnenberger, O.H., 1967, Road log, Panajachel-Pacaya volcano, in Bonis, S. (ed.), Excursion Guidebook for Guatemala, Annual meeting Geol. Soc. Amer., IGN Guatemala, p. 25-30.
INSIVUMEH, 1970, Amatitlán, Guatemala map sheet, 1:50,000, HOJA 205911.
Lima Lobato, E.M., Fujino, T., and Palma Ayala J.C., 2000, Amatitlán geothermal field in Guatemala: Bull Geotherm Resour Council, v. 29, p. 215-220.
Momita, M., Fujino, T., Lima Lobato, E.M., and Palma, J., 2002, Conceptual model of Amatitlán, Guatemala: Chinetsu, v. 39, p. 11-32.
Siebert, L., Alvarado, G.E., Vallance, J.W., and van Wyk de Vries, B., 2006, Large-volume volcanic edifice failures in Central America and associated hazards, in Rose, W.I., Bluth, G.J.S., Carr, M.J., Ewert, J.W., Patino, L.C., and Vallance, J.W. (eds.), Volcanic hazards in Central America, Geol Soc Soc Amer Spec Pap, v. 412, p. 1-26.
Information Contacts: Gustavo Chigna, Instituto Nacional de Sismologia, Vulcanologia, Meteorologia e Hydrologia (INSIVUMEH), 7a Avenida 14-57, Zona 13, Guatemala City, Guatemala (URL: http://www.insivumeh.gob.gt/); Richard Roscoe (URL: http://www.photovolcanica.com); AnaLu de MacVean, Herbarium UVAL, Institute of Research, Universidad del Valle de Guatemala, 18 avenida 11-95 zona 15 V.H. III, Guatemala City, Guatemala (URL: http://herbario.uvg.edu.gt/).
Variable activity in 2009 and early 2010
Our last report on Pacaya was in August 2008 (BGVN 33:08), which covered activity through September 2008. Unless otherwise indicated, the following report is a compilation of reports from Instituto Nacional de Sismologia, Vulcanologia, Meteorologia e Hydrologia (INSIVUMEH).
During 8-14 October 2008, the pattern of previous activity continued with multiple lava flows on the W and SW flanks of MacKenney cone that traveled a maximum distance of 250 m and continued to fill in the area between the cone and Cerro Chino crater to the N. Avalanches occurred from the lava-flow fronts on 8 October. Fumarolic plumes drifted SW.
Based on analysis of satellite imagery, the Washington VAAC reported that on 2 November 2008 a possible ash-and-gas plume was emitted from Pacaya and drifted E. On 3 November, INSIVUMEH reported that fumarolic plumes drifted S at a low altitude. Ash occasionally entrained by strong winds drifted S. Multiple lava flows on the S and SW flanks of MacKenney cone traveled a maximum distance of 400 m on 3 and 4 November, and continued to fill in the area between the cone and Cerro Chino crater to the N. Fumarolic plumes drifted E on 4 November. On 20 November fumarolic plumes from Pacaya's MacKenney cone drifted S at a low altitude. Ash occasionally entrained by strong winds drifted S. Multiple lava flows on the S, W, and SW flanks of the cone traveled 50-300 m during 20-21 and 25 November.
On 12 December 2008 fumarolic plumes from Pacaya's MacKenney cone drifted NE at a low altitude. Three lava flows, 150, 250, and 800 m long, were observed from the S. Seismic data indicated small explosions at the crater.
On 30 January and 3 February 2009, white and blue fumarolic plumes from MacKenney cone drifted S and SW at a low altitude. One lava flow, 75-100 m long, traveled down the SW flank.
On 12, 16, and 17 March 2009, fumarolic plumes from MacKenney cone drifted S at a low altitude. Lava flows, 25-200 m long, traveled S, SW, and W. Explosions during March ejected greater amounts of material that was deposited in the crater, enlarging the cones there. On 23 March, visual and audible changes in Strombolian activity were noted. Vigorous degassing produced sounds resembled airplane engines.
In a report issued on 3 April 2009, INSIVUMEH stated that Strombolian explosions from MacKenney cone during the previous few days ejected material 25 m into the air. On 2 April, lava flow volume increased, sending four lava flows W and one SW; the flows traveled 25-200 m. The seismic network detected tremor and explosions. On 6 April, lava flows on the W flank traveled 150-300 m, causing lava to collect on the SW flank. Activity from MacKenney cone was continuous; one cone emitted gas and explosions about every 5-10 minutes, and a second cone ejected tephra 25 m high. On 7 April, one lava flow traveled 150 m W and one traveled 200 m SW. INSIVUMEH recommended that CONRED coordinate with authorities in Pacaya National Park to restrict visitors from climbing Pacaya. On 24 and 28 April, INSIVUMEH reported gas emissions from Pacaya's MacKenney cone; occasional ash explosions ejected tephra 15-25 m high. The seismic network detected tremor and explosions. A small spatter cone being built in the S part of the crater was 4 m high. Rumbling noises were heard 3-5 km away and degassing produced sounds resembling airplane engines. Lava flows traveled 50-400 m down the SW flank and fumarolic plumes drifted S. This pattern of activity continued throughout May 2009.
For the remainder of 2009, the pattern remained much the same. On 5, 8, and 9 June 2009, white and blue fumarolic plumes from Pacaya's MacKenney cone rose to as high as 400 m and drifted, S, W and SW. Multiple lava flows up to 600 m long, were emitted from an area on the lower S flank, SW from the main edifice and traveled S, SW and W. Incandescence at night was noted on 20 November and 18 December.
Similar activity continued in 2010. On 8, 11, and 12 January 2010, white and blue fumarolic plumes from Pacaya's MacKenney cone rose up 400 m and drifted S and SW. Multiple lava flows on the S, SW, and W flanks traveled 25-200 m. Incandescence was noted at night from one of the inter-crater cones on 8 January and from MacKenney cone on 11 and 12 January.
Information Contacts: Gustavo Chigna, Instituto Nacional de Sismologia, Vulcanologia, Meteorologia e Hydrologia (INSIVUMEH), 7a Avenida 14-57, Zona 13, Guatemala City, Guatemala (URL: http://www.insivumeh.gob.gt/); Washington Volcanic Ash Advisory Center (VAAC), Satellite Analysis Branch (SAB), NOAA/NESDIS E/SP23, NOAA Science Center Room 401, 5200 Auth Road, Camp Springs, MD 20746, USA (URL: http://www.ospo.noaa.gov/Products/atmosphere/vaac/).
Sudden, bomb-laden explosions of 27-28 May 2010; extra-crater lava flows
Pacaya, which in recent years has consistently erupted olivine-bearing high alumina basaltic lavas, erupted with remarkable violence on both 27 and 28 May 2010 with an explosion on the 27th lasting ~45 minutes. This was followed by a smaller explosion the next day that generated a plume assessed from satellite and meteorological data as reaching 13 km altitude. In this report we describe those events as explosions in order to distinguish them from the ongoing, decades-long, and often effusive eruption generally seen at Pacaya. The terms 'explosion' and 'explosive' appear warranted given such factors as the suddenness of escalation, the ~13 km plume altitude (~10 km over the summit when measured during the weaker explosion on the 28th, the density of projectiles, and the scale of the tephra fall. The term explosion seems consistent with common practice (Sparks, 1986; Fiske and others, 2009).
The following report emphasizes Pacaya's behavior in 2010, including the 27 and 28 May explosions and impacts continuing into early June 2010. Our last report (BGVN 34:12) discussed behavior into mid-January 2010. Some of the reporting came from reports of Guatemalan agencies (eg. INSIVUMEH and CONRED, acronyms spelled out in the Information contacts section at bottom), newspapers (eg. Prense Libra, 2010a, b), videos and photos, and cited manuscripts and papers. It especially benefited from a draft manuscript prepared by Rüdiger Escobar Wolf (REW, 2014) and graciously provided to Bulletin editors. REW also provided reviews, insights, and numerous tailored graphics but bears no responsibility for possible errors induced by Bulletin editors.
The explosions were preceded months to weeks earlier by extra-crater venting of lava flows on the E and SE flanks. The lava flows covered substantial areas after emerging effusively at two widely spaced vents in atypical extra-crater or crater-margin locations.
Subsections address the following topics: (1) the Guatemalan hazard agency CONRED's reports, (2) a sample of available video and photo documentation of Pacaya's behavior, (3) events prior to the 27 May explosion, (4) the explosions and some of the impacts, (5) the seismic record showing the pattern of escalation around the time of the explosions, (6) a brief summary of the critical initial aviation reports, and (7) a geotechnical slope stability study that suggests gravitational instability at Pacaya, particularly owing to the cone's magma pressure and seismic loading.
Pacaya , which has a record of eruptions dating back over 1,600 years, has been erupting the majority of the time since 1961, often emitting rough-surfaced lavas but also occasionally discharging explosions. The centerpiece of the National Park of the same name, it is the most often climbed volcano in Guatemala. There have been 69 prior Smithsonian-published reports describing behavior from 1969 to early January 2010 (CSLP 03-70 to BGVN 34:12). REW (2013) ranked the 27 May explosions as sub-plinean and the associated lava emissions as the largest since similar events in 1961.
Figure 42 shows two simplified regional maps of Guatemala and neighboring countries including Mexico, Belize, Honduras, and El Salvador.
The larger tephra blanket spread N, covering an area of more than 1,000 km2 including the bulk of the Guatemala City metropolitan area, the largest city in Central America, population ~3.5 million. The City's center lies ~25 km NNE of Pacaya's summit but a 5-km-wide strip of urban and suburban development now stretches from its older core (red square, figure 42)to ~9 km N of the summit. The tephra shut down La Aurora, the county's primary international airport and among the region's busiest, for 5 consecutive days.
The 27 May 2010 explosion destroyed or damaged nearly 800 houses in nearby communities, forcing ~2,000 residents to evacuate and injuring 59 people. A high density of ballistics fell on nearby hamlets and villages, particularly those 2.5-3.5 km N of the MacKenny cone (El Cedro, San Francisco de Sales, and Calderas). The ballistics had sufficient mass and velocity to puncture roofs with a density on the order of one puncture per square meter in some places. Many more smaller ballistics bent but did not penetrate the corrugated sheet metal roofs common in many of the region's dwellings. Some of the ballistics were sufficiently hot to start fires.
Ash caused widespread damage locally, and up to ~8 cm of ash fell on parts of metropolitan Guatemala City, the nation's capital, centered ~35 km NNW of Pacaya. Up to 20 cm of tephra accumulated at and near Pacaya. According to available census data, the population within 10 km of Pacaya was 57,000 (John Ewert, USGS-CVO, personal communication).
Accounts from Guatemalan meteorological stations reported that detectable ash from the 2010 explosions fell as far away as the Caribbean coast. Brianna Hetland was both a graduate student in volcanology and a US Peace Corps Volunteer in Guatemala during 2010-2012. Hetland noted in a message that she had spoken with another Volunteer who said ash had blanketed his neighborhood near Coban (in Samac, Alta Verapaz) ~180 m N of Pacaya (figure 42, bottom). Hetland documented post-eruptive conditions at Pacaya, composed a blog on the impact and clean up, and gave a talk on those aspects as well as multifaceted monitoring conducted by fellow students and faculty at Michigan Technological University (Hetland, 2012a, b; Walikainen, 2010).
Some of the impacts of the freshly fallen ash were amplified and other impacts were diminished by heavy rains and flooding due to Tropical Storm Agatha that struck the region 2 days later, with some areas receiving 0.9 m of rain. The floodwater run carried ash that dislodged debris, clogged drainage systems, left thick deposits on valley floors, and damaged many bridges. The scale of the combined disasters led to more analysis of hardships, mitigation, and economic impact than usual at many eruptions, as exemplified by the detailed assessments by Wardman and others (2012). Those authors visited in the aftermath from New Zealand in order to study impacts that might be analogous to hazards elsewhere. They found that one moderating impact of the rain was to cee crops, which were washed clean of ash and residual acids. The authors also found that that a prompt and efficient cleanup was initiated by the Capital municipality to remove tephra from the 2,100 km of roads in the Capital. An estimated 11,350,000 m3 of tephra was removed from the city's roads and rooftops.
Diminishing strombolian activity and lava flows in the crater area continued into at least late June 2010. By this time the emissions had become more like the generally effusive decades-long eruption, which was still ongoing when this was written in late 2014. In addition to the information here, Pacaya's discharge rates have been summarized for the years 2004-2010 on the basis of infrared satellite images (Morgan and others, 2013). As would be expected, a strong peak in radiance developed in late May 2010.
REW (2013) noted one death attributed to the explosion and tephra fall and 179 deaths attributed to the Tropical Storm. Two people died at Pacaya days prior to the explosion of 27 May 2010. Wardman and others (2013) mentioned two further deaths due to people cleaning tephra from roofs.
Geochemical analysis of material erupted on 27 and 28 May is not yet reported. As background, Matías and others (2012) describe Pacaya's recent lavas as all high-alumina basalts with SiO2 contents of 50-52.5 weight percent and MgO contents of 3-5 weight percent. Common phynocrysts (visible minerals) included plagioclase, olivine, and opaque minerals (Conway, 1995). There is a slight variation of CaO in this group of lavas, which suggests a phenocryst enrichment or depletion. The lava compositions have remained broadly similar since 1961, and for many previous lavas as well, although some more felsic compositions are represented at older flank eruptions (Eggers, 1971).
CONRED reports. Perspective on the disaster can be gained from the chronology and content of announcements issued by CONRED (the Guatemalan agency for disaster reduction; Coordinadora Nacional para la Reducción de Desastres, table 4). These will be referred to in text by "CONRED" followed by their bulletin number.
Table 4. A summary of key CONRED information bulletins issued relevant to Pacaya's May 2010 eruption (http://conred.gob.gt/). After Escobar Wolf (2012) in addition to a similar table by Wardman and others (2012). Not all bulletins are included in this table.
| Date | CONRED Bulletin | Summary |
| 10 Feb 2010 | 564 | Called attention to lavas emitted on the E to S flanks. |
| 17 May 2010 | 708 | Recommended the National Park restrict access to the lava flows. |
| 26 May 2010 | 726 | Eruptive activity increased during the day, generating plumes of 1 km above the vent that dispersed fine tephra onto neighboring villages. Recommended closing access to Park. Warned air traffic authorities about risks to aviation. |
| 27 May 2010 | 729 | Began to mobilize staff to villages near volcano around 1500 on the 27th, to discuss and implement pre-emptive evacuation. Seven shelters were prepared in San Vicente Pacaya to accommodate refugees. When the paroxysmal phase of eruption started (after 1900), evacuation of villages to the W (El Rodeo and El Patrocinio) was already underway, however, tephra and ballistics were dispersed primarily to the N and the villages of El Cedro, San Francisco de Sales and Calderas were the most severely affected. |
| 28 May 2010 | 731 | Declared Red Alert. As of 1239 on the 28th over 1600 people had been evacuated from the villages of San Francisco de Sales, El Rodeo, El Patrocinio, El Cedro, Calderas, and Caracolito. They moved to San Vicente Pacaya. Civil Aviation authorities closed La Aurora International Airport due to tephra fall. The Ministry of Education closed schools in Escuintla, Sacatepequez and Guatemala departments. Access to the National Park remained restricted. The municipality-level response agency (with a similar name, COMRED, not CONRED) was activated in Villa Canales. It set up shelters in the municipal auditorium, a church, and the municipal hall. Advised citizens on managing the tephra fall. |
| 28 May 2010 | 734 | Thus far the eruption had injured 59 people, killed 1, and prompted the evacuation of nearly 2000. |
| 08 May 2010 | 735 | In the afternoon at 1424 on the 28th, high eruptive vigor resumed and tephra again fell on Guatemala City, but in much smaller quantities than during the previous day. |
| 29 May 2010 | 748 | By this time, a total of 2635 people were in shelters due to the eruption; ~400 houses had been slightly damaged and 375, severely damaged. |
| 27 May 2011 | 1673 | One year later; a retrospective summary of civil defense responses to the eruption and the larger engulfing disaster, tropical storm Agatha. |
Events prior to the energetic 27 May explosion. Figure 43 highlights Pacaya's vent locations (1961 to 2009 vents as green dots), including the two new E and SE flank vents that emitted lava flows (red areas). Changes in eruption behavior preceded the 27-28 May explosions by several months.
From 2004 to around the end of 2009, Pacaya's eruptive intensity was often low. A clear sign of changes took place in February 2010 when lava flows emerged at vents on the S and SE flanks (table 4). These vents sit well outboard of the usual points of lava emission, which have in recent decades been limited to spots within the central crater, an area bounded by a large engulfing collapse scarp (a Somma rim; Eggers, 1969; figure 43). The two previously mentioned deaths occurred on 18 April when, according to the news, they were hit by a rock avalanched caused by an explosion. By 17 May, SE flank lava flows had reached 1.5 km long and the Park began restricting access (table 1). The scene on the SE flank appears in figure 44.
Earlier on the 27th (prior to the explosion), INSIVUMEH volcanologist Gustavo Chigna looked out over the crater area and counted at least 16 distinct vents emitting lava. Chigna was surprised, and his comment was something like 'It looked like water gushing out of a sieve.' That scale of new extrusive sites helped alert authorities that the volcano's behavior had escalated well beyond the norm and led to restricting public access to Pacaya.
During the 5 years prior to the 27 May 2010 explosion, sporadic vent openings limited to the MacKenney cone and adjacent areas (particularly the N crater) extruded lava flows (green dots, figure 43). Many of the resulting lava flows were each only active for periods of days to months. INSIVUMEH sometimes reported multiple simultaneous lava flows from distinct vents on the cone, which occurred, for example, during April 2009. Most of the lava was confined to the main crater or portions downslope and W of the E-bounding collapse scarp. The case in 2005 illustrated that the topographic boundary associated with the NE segment of the collapse scarp had diminished in places to the point where lava flows could cross the scarp (BGVN 33:08).
Around January 2010, Gustavo Chigna (INSIVUMEH) indicted the end of mainly lower effusive activity ongoing since 2004. The new upsurge fed several lava flows from vents on Pacaya's main cone. In harmony with this comment, the video by Crossman (2009) indicates that on 24 December 2009 the volcano emitted considerable lava. Venting was effusive and at both the MacKenney cone's summit and base. Visible plumes were nearly absent.
Table 5 lists a small sample of available videos taken at Pacaya that aid in documenting its behavior. The table includes videos taken before, during, or shortly after the 27 May explosion, with the two pre-explosion videos capturing behavior relevant to this subsection. The videos from other parts of the table are discussed in appropriate sections below.
Table 5. Some photos and videos that advance understanding of Pacaya behavior during December 2009 to about 2 June 2010 (a week after the explosion). The cases presented are a sample, not an exhaustive list. Compiled by Bulletin editors.
| Video (V) or Photo (P) and source | Date acquired / Date posted if clearly stated) |
Title; Content; URL How cited in text of this report |
| V; Patrick R. Crossman | 24 Dec 2009 / 24 Dec 2011 | Title: 'Hiking the Pacaya volcano in Guatemala' This video chronicles a group visiting Pacaya amid ongoing effusive volcanism in comparatively calm conditions and with people in many scenes. Some parts of the video depict a narrow (1- to 2-m wide), channelized, slowly moving lava flow. That flow appears to vent near the base of the MacKenney cone, devoid of visible plume, and traverses a region of low incline. The path of the molten flow is sinuous rather than linear. The visitors roast marshmallows in radiant heat from the flows. The video also cuts to scenes at the MacKenney cone's summit, where a larger flow several meters wide vents in a stable, effusive manner, also devoid of an associated plume. http://www.youtube.com/watch?v=Y62ZbfRBDmM Cited in text as Crossman, 2011 |
| V & P; H. Paul Moon (Zen Violence Films, LLC) | 01 April 2010 / 24 April. [Date confirmed with Moon and by comparison to his dated still photos] | Title: 'Pacaya Volcano, Guatemala [1080p HD]' Close up views showing copious lava flowing down the E flank from the new vent there. Accompanies GPS record of hiking track and still photos. Music accompanies the video. Dovetails with a Landsat image from about a week earlier, which also documents the E flank lavas. See text for more discussion. http://www.youtube.com/watch?v=Hr7VAVUBOhk http://vimeo.com/hpmoon/pacaya Associated link shows GPS path on a satellite image. Cited in text as Moon, 2010 |
| V; RT news channel (original authorship not provided) | -- / 28 May 2010 | Title: 'Video of Guatemala Pacaya volcano eruption' Compact, powerful strombolian explosions throwing molten ejecta vertically from multiple vents, or an elongate vent such as a fissure in Pacaya's crater (see photo below in figure 52). http://www.youtube.com/watch?v=fFoF57KX2yU Cited in text as RT News, 2010a |
| V; RT news channel (original authorship not provided) | --/ 30 May 2010 | Title: 'Raw video of damage caused by volcano eruptions in Guatemala and Ecuador' The video shows, for Pacaya, images of advancing lava flows and some distant views of the volcano in daylight with a moderate plume above it. There are many scenes of damage, evacuation, and human impact, including ash-loaded corrugated metal roofs that buckled; ash on airliners; brigades of people sweeping and carting off ash from city streets and an airport runway; and children sheltering in a relief center. http://www.youtube.com/watch?v=gmrVLHSS4mc http://www.youtube.com/watch?feature=player_detailpage&v=gmrVLHSS4mc Cited in text as RT News, 2010b |
| P; Boston.com | 27-31 May / 2 June 2010 | Title: 'A Rough Week for Guatemala' (in The Big Picture—News Stories in Photographs) "In just the past seven days, residents of Guatemala and parts of neighboring Honduras and El Salvador have had to cope with a volcanic eruption and ash fall, a powerful tropical storm, the resulting floods and landslides, and a frightening sinkhole in Guatemala City that swallowed up a small building and an intersection. Pacaya volcano started erupting lava and rocks on May 27th, blanketing Guatemala City with ash, closing the airport, and killing one television reporter who was near the eruption. Two days later, as Guatemalans worked to clear the ash, Tropical Storm Agatha made landfall bringing heavy rains that washed away bridges, filled some villages with mud, and somehow triggered the giant sinkhole--the exact cause is still being studied. (34 photos total)." (URL: http://www.boston.com/bigpicture/2010/06/a_rough_week_for_guatemala.html) Cited in text as Boston.com, 2010 |
| V; Tropical-rambler (clear authorship not provided) | 31 May 2010 / 31 May 2010 | Title: 'Erupción Volcán de Pacaya - Pacaya volcano Eruption' Helicopter views of flight generally towards, and then at, Pacaya, which was still in eruption, with initial views showing Agua volcano and parts of Lake Amatitlán. Low weather clouds covered extensive areas. This video captured a decidedly non-vertical, denser black plume from Pacaya feeding a lighter, tan colored more massive plume that appears to drop ash as it is carried to tens of kilometers downwind (directed E-SE-S). Shots include those of Cerro Chino and antenna towers there, and widespread steaming on the MacKenney cone that coalesced into large steam clouds low over much of the central crater area. http://www.youtube.com/watch?feature=player_detailpage&v=JIqlMy8Q-aQ Cited in text as Author unknown, 2010 |
| V; PrensaLibre.com | About 2-3 June 2010/ 10 June 2010 | Title: 'Espectacular erupción en el Pacaya' (Narration by news reporter referring to explosion as 1 week ago, thus the 'About 2-3 June' date in the previous column.) According to REW, this video shows lavas emitted at the new SE flank vent. Remarkable images, some seemingly shot from helicopter and others from the ground, showing copious channelized lava flows moving rapidly downslope to the SE. At the vent area there are three small vents discharging spatter from coalescing cones with very steep sides. Their glowing summit craters gave off occasional eruptions as well as occasional puffs of gases, glowing spatter, and possibly flames. Some shots show incandescent lava flows several kilometers long. Rising plumes sometimes display toroidal motion, rotational behavior reminiscent of dust devils. http://www.youtube.com/watch?v=CFpPB5TIRbk Cited in text as Prensa Libre, 2010 |
Figure 45 shows one of several Landsat views of the E flank in an infrared image acquired on 23 March 2010. It showed high thermal radiance in a narrow linear thermal anomaly headed E outboard of the usual eruptions confined to the crater. The E-flank area is devoid of vegetation, which rules out a local fire there, meaning that the anomaly was due to a lava flow. The number of clear (cloud-free) views of Pacaya available during March through June was limited. REW plotted this anomaly in a KMZ file format (red line, figure 46).
The new E flank (extra-crater) lava flow documented by Landsat on 23 March was the subject of a video by Moon (2010) taken on 1 April (table 4; see their excursion route on figure 46). The footage was shot during daylight hours at high resolution [1080p HD] and later processed to obtain vibrant red, orange, and yellow colors. The discharges were effusive and few visible emission clouds accompanied the lava flows seen in the video. A dark plume remained above the MacKenney cone's summit.
As seen in figures 47-50, the lava documented by Moon (2010) in photo and video was several meters wide and passing over irregular terrain. As seen from a distance (e.g. figure 47), some sectors of the flows channel stood well above the surrounding landscape. In the area visited, the lava remained confined behind jumbled but effective levees as it passed through and over the a'a' (rough textured) flow field.
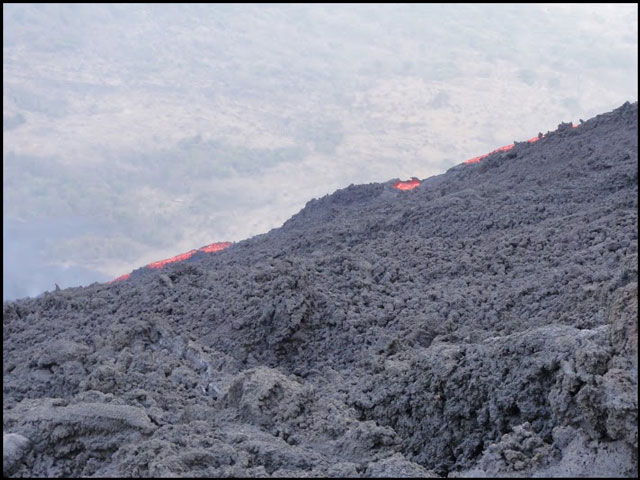 |
Figure 47. A 1 April 2010 photo of Pacaya's E flank lava flow seen in the distance as it descends across an a'a flow field. Courtesy of H. Paul Moon (see table 5). |
Figure 51 maps the inferred E flank lava flow axis and SE flank fissures on an oblique Google Earth view.
On 18 April 2010, according to a news report in the newspaper Prensa Libre, a Venezuelan tourist and her Guatemalan guide died on Pacaya. The news report stated the deceased were in the area of high risk when struck by material released from an explosion. Some of the other 14 people on the scene sustained injuries.
On 17 May 2010, observers saw abundant lava escaping from a new SE-flank vent (CONRED 708). A mound had formed at the vent area. The lava from this vent had by 17 May extended as far as 1.5 km. As seen on figure 43, the SE flank lava flows and their fissures ultimately fed lava flows trending roughly S for ~2.5 km then turning sharply (~90 degrees) to the W and extending in that direction another ~2.5 km.
CONRED 708 made a recommendation to the Pacaya National Park authority to restrict visitor access to the lava flows. The 17 May report noted that Pacaya's activity was considered to be relatively high, but it left out language suggesting a crisis at this point. According to the press, access to the volcano was restricted following the recommendation.
On 17 May, the newspaper Prensa Libre featured an undated night photo of the MacKenney cone taken from the N, presumably of this stage of Pacaya's eruption. It showed a dense spray of glowing material thrown from the MacKenney cone's summit and rising hundreds of meters. The cone's N rim contained a recently formed V-shaped notch (or trough). Out of that notch poured a broad lava flow. Several hundred meters down the MacKenney cone's N face, the broad flow split into two flows descending the cone's steep face on diverging paths. The notch in the cone stands out as a clear morphologic change associated with this time interval (~10 days prior to the 27 May explosion), and as will be seen below, it served as a conspicuous vent site for the fissure emissions documented during the explosions.
The day before the explosion, on 26 May, eruptive and seismic intensity both increased markedly. An eruptive plume reached 1 km above the vent and fine tephra fell on villages around the volcano (CONRED 726 on 26 May, table 4). CONRED recommended fully closing Pacaya National Park, and they warned aviation authorities of airborne ash near Pacaya. No call was yet made to evacuate residents living adjacent Pacaya.
Vigorous explosions starting 27 May 2010. Pacaya's eruptive vigor increased to the point of strong strombolian eruption, with the initial increase noted on the 27th in a morning report in Prensa Libre. More intense explosions occurred at around 1500 when observers noted explosions discharging about once per second and saw glowing material thrown ~1.5 km above the crater, and taller rising dark clouds carrying finer tephra that dispersed over nearby villages.
The exact start time of the intense 27 May explosion is variously reported, but available visual observations suggested to REW (2014) that it was during the interval 1800-1900. CONRED 729 indicated the climax (the explosion)began at 1900. Seismic data, discussed in a subsection below underwent the highest (RSAM) amplitudes during 1730-1830 local time on the 27th. Aviation reporting of satellite data on eruptive plumes, discussed in a subsection below, was initially ineffectual for the 27th owing to above-lying weather clouds.
What is clear is that the explosion late in the day on the 27th drove forth intense fire fountaining and vigorous ejection of tephra and ballistics.
Figure 52 shows a broad fire fountain frame taken from a Youtube video posted on 28 May—but it lacked an acquisition date (RT news channel, 2010a). REW interprets this video as taken during the major climax (explosion) during the night on the 27th. The eruption was clearly of fissure style at this point but the upper extent of the glowing material was possibly masked by ash clouds. Some of the textures within the glowing region are explained in the f caption and in the text below.
REW described the video source for figure 52 as taken looking at Cerro Chino (indicated on figure 43) from at or near the town of El Cedro, ~3 km to the NNW of the vent. The diffuse zones of near darkness in the midst of the fountains are rising ash clouds locally diminishing the glow. Thus it is clear from the dynamics seen on the video, that the glow of higher reaching clasts in the upper portions of this image could possibly be masked by dense ash plumes.
On the video, the orange streaks from glowing airborne pyroclasts track to points below that suggest emission from multiple vents or an elongate vent with continuous extent, rather than a single point source, a topic returned to below in the context of an elongate trough developed on the MacKenney cone. That said, REW points out that it is hard to get a good idea of the scale from this video and that videos taken from other locations seem to show a wider, and at times two different fountain jets. Available video and photographic data has thus far prohibited estimating the width of the fountain at this stage of the eruption. REW (2013) citing Hetland (personal communication) and CONRED 856 noted that associated with these emissions the major tephra fall began, and it soon spread tens of kilometers to the N.
Early in the explosion on the 27th (exact timing unknown), a news team from a national television station (Notisiete) endured a shower of ballistics. REW (2013) noted that they were in the vicinity of Cerro Chino at probably less than 1 km from the vent, the zone with critical infrastructure most impacted (figure 53). Although most of the news team survived, reporter Anibal Archila's death was apparently the result of direct impact from a large ballistic. His was the only icially confirmed death caused by the strong explosive phase. During a subsequent eruptive lull, a rescue team spent several dangerous hours in very close proximity to the vent, finding and rescuing missing people, and carrying out Archila's body.
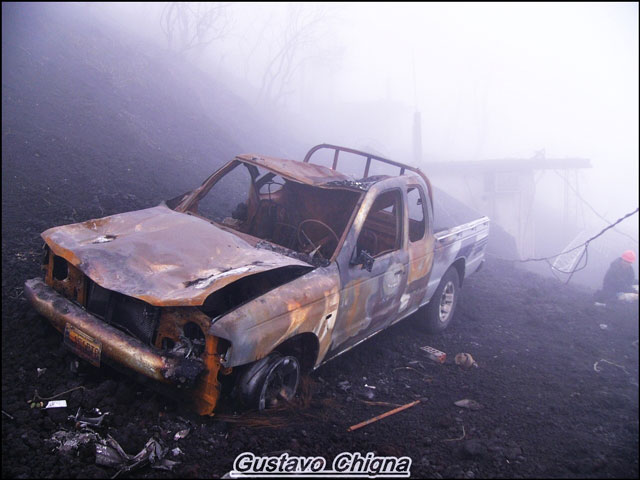 |
Figure 53. A truck parked directly N of the Pacaya's active crater at Cerro Chino as seen in the aftermath of the 27-28 May explosions. Courtesy of Gustavo Chigna (INSIVUMEH). |
Ballistics in excess of 0.5 m on their long axis fell at Cerro Chino and elsewhere within ~1 km of the vent area (figure 54). Some bombs on the ground reached sizes of 80 x 50 cm (Hetland personal communication) but part of that extent may have been due to splattering on impact. Farther away, the sizes of ballistics generally diminished with distance from the source. At Cerro Chino ballistic impacts broke concrete roofs, started fires in the radio shacks, and toppled antenna towers (REW, 2014; Wardman and others, 2010).
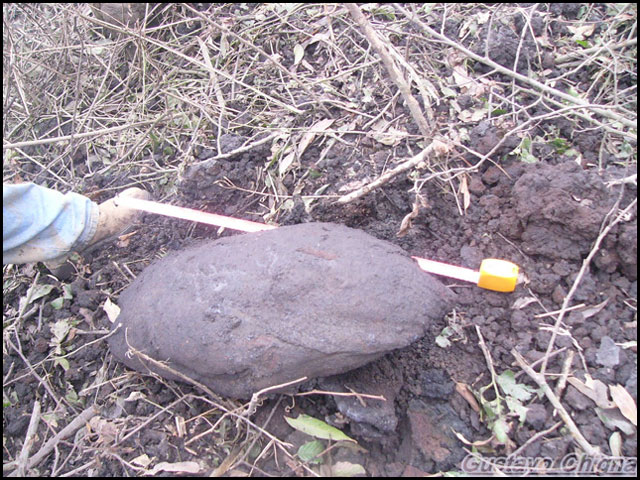 |
Figure 54. An example of a large bomb found in the near-source region. Courtesy of Gustavo Chigna (INSIVMEH). |
When the intense phase started on the 27th, the evacuation of villages to the W (El Rodeo and El Patrocinio) was already underway. During the hours after the explosion's onset on the 27th, more than 2,100 people were evacuated from the proximal villages to the town of San Vicente Pacaya (5 km NNW)(see related scenes in RT news, 2010 (b), table 4).
The settlements El Cedro, San Francisco de Sales, and Calderas, towns 2.5-3.5 km to the N, endured both ash as well as a dense barrage of hot ballistic bombs (figure 55). Many of the bombs were below 20 cm in diameter. Some of the ballistics pierced the corrugated (sheet metal or fiber cement) roofing common in Latin America. In some cases the ballistics also ignited fires that consumed most of the combustible contents of the buildings. Some roofs collapsed or buckled due to the load of deposited tephra.
The ballistics examined were of low density owing to vesicles larger than 1 mm in diameter. They contained sparse phenocrysts (often larger than 1 mm), most likely plagioclase (Hetland personal communication to REW and Hetland (2010).
REW (2013) noted that, from the observed damage to roofs in these villages, the density per unit area of impacts that pierced through the corrugated roofs averaged as high as on the order of 1 per square meter. Portions of the roofs in near-vent settlements also sustained many dents from bombs that delivered impacts with lower force. Although some communities were partially evacuated when many of the ballistics arrived, REW (2013) concluded that some residents remained within the communities and regions mostly affected.
Reports in Prensa Libre give insights into the scene of the evacuation and the barrage. Many of the residents evacuated on foot following narrow paths across the rugged rural terrain. Other residents remained behind in order to protect their belongings from theft. When the barrage came, those too close used whatever hard and resistant objects they could find to protect themselves, including hiding under furniture and using pots and pans to protect their heads. Some corroded metal roofs were weak prior to the eruption. Some people found refuge in buildings with heavier, concrete-slab roofs, which generally fared better.
Figure 56 shows an individual who clearly received medical attention, stitches, for a laceration on his forehead. According to REW (2013), Pacaya's 2010 ballistic barrage caused more injuries than any recent eruptions. That said, data remain scanty on injuries rates and kinds, resultant disabilities, accident location, etc., although Wardman and others (2012) compiled some statistics.
The AmatitlÁn geothermal plant, located ~3 km N of the MacKenney cone to the N of San Francisco de Sales received ~20 cm of mostly lapilli-sized tephra. As Wardman and others (2012) noted, "Ballistic bombs and blocks also bombarded the plant, causing extensive damage to the plant's roof and condenser fans. Fan blades were dented, bent and also suffered damage from abrasion. Minor denting of the intake and outlet pipe cladding was also reported however these impacts were superficial and did not require repair." A photo showed cladding bearing multiple closely spaced dents on the side of a large pipe; the largest dent, 20 cm across, had ruptured through the sheet metal.
Post-explosion assessment of the MacKenney cone shed new light on the form and significance of the previously mentioned notch across it (a linear NW-trending trough passing through the summit, figure 57).
The notch formed a prominent depression aligned both with the new SE-flank fissures and Cerro Chino cone on the outer NW crater rim. Portions of the RT video footage taken during vigorous stages of explosion suggests that at a paroxysmal stage of the explosion the trough served as an eruptive fissure emitting a vertically directed fountain as a curtain (table 5). REW (2013) also suggested that the eruptive fissure along the trough may have served as the vent for the ballistics that fell in previously mentioned settlements to the N.
The explosions broadest areal impact came from tephra fall. Figure 58 shows a close up of ash from a sample collected 22 km from the vent. Overall, the grain sizes ranged from sub-millimeter to centimeter size. An abundance of fine suspended particles in the air were not reported during or following the tephra fall.
As noted in table 4, in the afternoon on the 28th, high eruptive vigor resumed and tephra again fell on Guatemala City (CONRED 735). The ash fall on this day was lighter than on the 27th. Here aviation data (discussed below) did record the plume via satellite. The Washington Volcanic Ash Advisory Center (VAAC) noted (in their 6th advisory) an eruption in the afternoon on the 28th reaching (based on comparison of plume movement to modeling of winds aloft) ~13 km altitude.
During 29 May and onwards the intensity of volcanic activity decreased, with only relatively small eruptive plumes that occasionally produced minor tephra fall in the communities surrounding the volcano (CONRED 742). CONRED 748 noted that by the 29th, a total of 2,635 people were in shelters due to the eruption, with close to 800 home either damaged or destroyed. In the following days the attention of the emergency managers shifted from the eruption to the Tropical Storm Agatha, which had much broader extent and impact.
In the Pacaya and Guatamala City region, and along drainages carrying ash-charged run, both disasters combined. Lake AmatitlÁn rose, inundating low lying parts of the town with a water-and-ash mix (see photo documentation of impacts at Boston.com). Figure 59 is a photo taken ~12 km downstream of the Lake's outlet.
Seismic record. INSIVUMEH and REW (2013) suggested a climax on the 27th starting shortly before 1800 local time and lasting ~40 minutes.
The seismic signal (figure 60, upper panel) contained a few scattered high amplitude events during the morning of 27 May 2010. Seismicity rose significantly about 1200 on the 27th, about doubling the RSAM values recorded during the previous 13 hours.
The first of about 10 strong peaks (seen on both the upper and lower panels of figure 60) took place around 1230 on the 27th. Those peaks represented a large escalation in seismicity an approximate doubling of the RSAM values. The highest peak on the record took place during 1730 to 1830 on the 27th, a ~6-fold increase in RSAM over the background values acquired earlier on the 27th. During the middle part of the 1800-1900 interval there was a peculiar several-minute-long period with low seismicity conspicuous on the seismic record (upper panel). After that, a series of closely spaced peaks of generally decreasing amplitude followed and then seismicity decreased substantially, particularly around 2300-2400 on the 27th. A second escalation of broadly similar size to the earlier one came on the 28th peaking at 1100 and then dropping.
In a later analysis of seismicity, Mercado and others (2012 correlated waveforms for 5 months before and 9 months after the May 2010 eruption. They noted that "No correlation was found between the events of each day during the five-month period before the eruption, thus, establishing no relationship with the periods of correlation found after the eruption. The post-eruptive sources of seismicity discovered were not active before the eruptive event of May 27, 2010, and therefore these sources must be strictly post-eruptive in nature."
Aviation. Although there were 48 reports (Volcanic Ash Advisories, VAA's or simply 'advisories') issued by the Washington Volcanic Ash Advisory Center (VAAC) on Pacaya behavior during the interval 27 May to 26 June 2010, weather clouds frequently masked the plume from the key satellite observation platform, the GOES-13 satellite. Where satellite observations of the plume were scarce or lacking, most of the VAA's conveyed ground-based observations including media reports.
By the 3rd advisory, which was issued on the 28th, considerable ash had fallen at the International airport Aurora. There is some confusion as to the quantity of ash at the airport and over the region in general, but a photo on the 28th shows ash at the airport. Judging from ash load on the aircraft, the f walking just to the right of the aircraft, and adjacent tire tracks, the ash was on the order of ~1-cm thick (figure 61). This is in accord with INSIVUMEH's summary report that said 5-7 mm of ash had fallen during the entire explosive 27-28 May eruption at the airport. This is also in accord with REW (2014), which discusses the complexities of assessing tephra thicknesses in more detail, and presents a preliminary isopach map that shows the S fringes of the Guatemala City urban area with 10 cm of ash and many parts of the urban area farther N, including the airport, with on the order of 1 cm of ash.
What follows is a summary of the advisories issued during 27 through 28 May (UTC).
The VAA's frequently refer to the NAM (North American Mesoscale Model), a numerical model for short-term weather forecasting and in this case wind-velocity estimation. The model is run 4 times a day with 12 km horizontal resolution and with 1 hour temporal resolution, providing finer detail than other operational forecast models. An example of a model with less detail is the model called GFS (Global Forecast System), which predicts weather for many regions of the world, and was sometimes also used by the VAAC analysts.
The VAAC issued their 1st VAA for Pacaya during 2010 on May 27 at 1140 UTC, citing as key information sources GFS winds and INSIVUMEH. Eruption details noted small brief ash emissions near the summit at 1115 UTC. The ash cloud was not identifiable from the GOES-13 satellite owing to rain. The ash cloud was inferred to have remained low and near the volcano. GFS wind data suggested that for such a low ash cloud at that time, wind-directed transport would carry a plume S-SW and would only be significant for ~20 km. The analyst noted that eruption as then dominantly lava emission.
The 2nd advisory came out 7 hours later at 1845 UTC on the 27th indicating volcanic ash and gases to ~3.5 km altitude (noting ICAO as an information source). Ash was again not identifiable from the GOES-13 satellite owing to clouds.
The 3rd advisory, noting 'ongoing emission of volcanic ash and gases,' came out at 1257 UTC on the 28th, again lacking clear satellite identification of ash owing to clouds, in this case citing a thick tropical depression. This advisory relied on both a wind model (NAM winds) and an aviation meteorological report (a METAR). The advisory further noted media reports of ash on runways as discussed in the context of figure 61.
The 4th advisory was issued at 1554 UTC on the 28th, noting "increasing emissions" at 1515 UTC with INSIVUMEH reporting ash rising to 3.7 km altitude (FL 120) and spreading up to 27 km NW. Again, owing to extensive weather clouds, ash was again not visible from GOES-13 satellite.
The 5th advisory was issued at 1710 UTC on the 28th, noting "ongoing emissions" recorded at 1645 UTC. Plume has now become visible in [GOES-13] imagery and extends about 15 NMI [Nautical miles, 27 km] to the NNE of the summit. Plume top was at 3.7 km altitude (FL 120).
The 6th advisory was issued at 1915 UTC on the 28th, noting a large eruption recorded at 1815 UTC: "Large eruption seen to FL420 [42,000 feet, ~13 km altitude] based on NAM sounding for the area. Forecast winds remain mostly westerly to northwesterly. Winds at the time of observation blew the plume E at ~18 km/hr.
The 7th advisory was issued at 1930 UTC on the 28th (the last one that day); it repeated information about the eruption seen in imagery around 1815. In this advisory the wind was moving NW at 27 km/hr.
Slope stability study. Schaefer and others (2013) evaluated slope stability at Pacaya and commented on the possible implications of the trough across the MacKenney cone (figure 57). They consider the trough noted above as an example of a recent, smaller-volume collapse.
Specifically, they studied the SW flank of the edifice and developed a geomechanical model based upon field observations and laboratory tests of intact rocks from Pacaya. Their study included analysis of slope stability using numerical techniques and consideration of forces from gravity, magmatic pressure, and seismic loading as triggering mechanisms for slope failure.
Given the cone's structural and seismo-tectonic setting, the likely magma pressures, and the history of past behavior, they suggested Pacaya lacked substantial gravitational stability.
References. Bonis, S., 1993, Mapa Geologico de Guatemala Escala 1:250,000. Hoja ND 15 - 8 - G, "Guatemala". First edition (map). IGN, Guatemala.
Conway, M., 1995, Construction patterns and timing of volcanism at the Cerro Quemado, Santa María, and Pacaya volcanoes, Guatemala. Ph. D. Dissertation. Michigan Technological University, Houghton, Michigan. 152 pp.
Escobar Wolf, R, 2013 (Report in preparation, July 2013), The eruption of VolcÁn de Pacaya on May -June, 2010, Michigan Technological University, 31 pp.
Escobar-Wolf, R., & Tubman, S., in preparation, Compilation of historical and recent accounts of eruptions from volcan de Pacaya (XVI-IXX centuries).
Eggers, A., 1972, The geology and petrology of the AmatitlÁn quadrangle, Guatemala. Ph. D. Dissertation. Dartmouth College, Hanover, New Hampshire. 221 pp.
Eggers, A., 1969, Mapa Geologico de Guatemala Escala 1:50,000. Hoja 2059 II G, " AmatitlÁn ". First edition (map). IGN, Guatemala.
Fiske, R. S., Rose, T. R., Swanson, D. A., Champion, D. E., & McGeehin, J. P., 2009, Kulanaokuaiki Tephra (ca. AD 400-1000): Newly recognized evidence for highly explosive eruptions at Kīlauea Volcano, Hawai'i. Geological Society of America Bulletin, vol. 121, no. 5-6), pp. 712-728
Hetland, B., 2010a, Volcano Pacaya, Cleaning up the eruption of Pacaya, One roof at a time…; Online manuscript by Brianna "Adriana" Hetland, US Peace Corps Volunteer 2010-2012, (URL: http://www.geo.mtu.edu/~raman/Pacaya.Bri.pdf )
Hetland, B., 2010b, Erupción del VolcÁn de Pacaya 27 Mayo 2010; X Congreso Geológico de América Central, Antigua, Guatemala, November 10, 2010. [Power Point from talk at Geologic Conference; in Spanish] (URL: http://www.geo.mtu.edu/rs4hazards/conferencepresentations_files/conferenceshz.htm )
Kitamura S., and Matías O., 1995. Tephra stratigraphic approach to the eruptive history of Pacaya volcano, Guatemala. Science Reports-Tohoku University, Seventh Series: Geography. 45 (1): 1-41.
Matías Gómez, RO, Rose, WI, Palma, JL, Escobar-Wolf, R, 2012, Notes on a map of the 1961-2010 eruptions of VolcÁn de Pacaya, Guatemala. Geol Soc Am Digital Map Chart Series 10: 10 pp.
Matías , O., 2010, Volcanological map of the 1961 - 2009 eruption of Volcan de Pacaya, Guatemala. MS. Thesis. Michigan Technological University, Houghton, Michigan. 57 pp.
Mercado, D, Waite, G, and Rodriguez, L, 2012, Analysis of seismic patterns before and after the May 27, 2010 eruption of Pacaya volcano, Guatemala, Cities on Volcanoes 7 (COV7), Abstract volume, IAVCEI meeting (19-23 November 2012, Colima, Mexico) (URL: http://www.citiesonvolcanoes7.com/vistaprevia2.php?idab=510)
Morgan, HA, Harris, AJL, and L. Gurioli, 2013, Lava discharge rate estimates from thermal infrared satellite data for Pacaya Volcano during 2004-2010, Jour.of Volcanology and Geoth. Res., Vol. 264, pp. 1-11, ISSN 0377-0273, http://dx.doi.org/10.1016/j.jvolgeores.2013.07.008.
Prensa Libre, 2010 [19 April at 01:17 Nacionales]; Mueren tras explosion (URL: http://www.prensalibre.com/noticias/Mueren-explosion_0_246575377.html; http://tinyurl.com/2vvaj4j ) [in Spanish]
Prense Libre, 17 May 2010 [21:38 Nacionales], Restringen acceso al volcÁn de Pacaya (URL: http://www.prensalibre.com/noticias/Restringen-acceso-volcan-Pacaya_0_263373950.html; http://tinyurl.com/2wb8p9t) [in Spanish]
Prensa Libre, 27 May 2010 Aumenta actividad volcÁnica en el Pacaya (URL: http://www.prensalibre.com/noticias/volcan-pacaya-actividad-erupcion_0_269373197.html; http://tinyurl.com/246hohe)
Rose, W. I., Palma, J. L., Wolf, R. E., & Gomez, R. O. M., 2013, A 50 yr eruption of a basaltic composite cone: Pacaya, Guatemala. Geological Society of America Special Papers, 498, 1-21.
Schaefer, L. N., Oommen, T., Corazzato, C., Tibaldi, A., Escobar-Wolf, R., & Rose, W. I., 2013, An integrated field-numerical approach to assess slope stability hazards at volcanoes: the example of Pacaya, Guatemala. Bull Volcanol, 75, 720.
Sparks, R. S. J., 1986, The dimensions and dynamics of volcanic eruption columns. Bulletin of Volcanology, vol. 48, no. 1, pp. 3-15.
Wardman, J., Sword-Daniels, V., Stewart, C., & Wilson, T. M., 2012, Impact assessment of the May 2010 eruption of Pacaya volcano, Guatemala (No. 2012/09). GNS Science (New Zealand)
Walikainen, Dennis, 2010 [June 4], Eyewitness to Disasters: Graduate Student Reports from Guatemala (URL: http://www.mtu.edu/news/stories/2010/june/eyewitness-disasters-graduate-student-reports-guatemala.html)
Information Contacts: Rüdiger Escobar Wolf, Department of Geological Engineering and Sciences, Michigan Tech University, Houghton, MI 49931; INSIVUMEH Seccion Vulcanologia (Institute National de Sismologia, Vulcanologia, Meteorolgia, e Hidrologia) 7a Avenida, Zona 13, Guatemala City, Guatemala; Gustavo Chigna,.INSIVUMEH; CONRED (Coordinadora Nacional para la Reducción de Desastres) Avenida Hincapié 21-72, Zona 13 Guatemala, Ciudad de Guatemala; and Washington Volcanic Ash Advisory Center (VAAC), NOAA Satellite Analysis Branch, NOAA NESDIS OSPO, E/SP, NCWCP, 5830 University Research Court, College Park, MD 20740 (URL: http://www.ospo.noaa.gov/Products/atmosphere/vaac/).
Summary of 2004-2010 eruptions including a fatality in May 2010; lava flows in 2013-2014
Guatemala's Pacaya volcano has a 450-year record of observations of frequent activity, in addition to confirmed radiocarbon dating of eruptions over the last 1,500 years. Its location, approximately 30 km south of the capital of Guatemala City, makes it both a popular tourist attraction as a national park, and a hazard to the several million people that live within 50 km. Activity during the last 50 years has been characterized by extensive lava flows, bomb-laden Strombolian explosions, and large and small ash plumes that have dispersed ash to cities and towns across the region.
This report summarizes activity at Pacaya during the long-lived 2004-2010 eruptive episode, and continues with the details of activity during the next eruption between March 2013 and April 2014. Most of the information is provided by the Instituto Nacional de Sismologia, Vulcanologia, Meteorologia e Hydrologia (INSIVUMEH), the Coordinadora Nacional para la Reducción de Desastres (CONRED) of Guatemala, and the Washington Volcanic Ash Advisory Center (VAAC), which provides air traffic advisories. Information is also gathered from remote sensing satellite data provided through the University of Hawai'i's MODVOLC program and from Google Earth images.
Renewed Strombolian activity was observed on 19 July 2004 after two years of mostly steam emissions, and again in early December 2004. Intermittent Strombolian explosions accompanied near-continuous lava flows down most flanks of MacKenney Cone from December until 11 September 2005. An explosion on 9 March 2006 was the beginning of a new, lengthy episode characterized by extensive lava flows and few significant ash plumes. Multiple strong thermal anomalies were recorded every month from March 2006 through June 2010, excepting December 2006. It climaxed with a major explosion of ash and lava flows during 27- 28 May 2010, and ended with the last Strombolian explosions recorded on 26 October 2010. After two and a half years of quiet, a new period of Strombolian activity began on 5 March 2013, which included intermittent lava flows. This continued until an outbreak of more extensive lava flows during the second half of January 2014. After a final burst of lava flows in early March, a small ash plume on 10 April 2014 was the last reported activity for four months.
Activity during June 2004-September 2005. Renewed periods of near-continuous tremor and frequent long-period earthquakes were recorded during June- August 2004, after the end of visible incandescence from a long-lived lava lake in June 2001. Incandescence was first reported on 14 June 2004, followed by ejection of lava fragments from a vent at the bottom of the central crater of MacKenney Cone on 19 July (BGVN 30:10). Incandescence was observed during the next few months, and tephra was expelled from the cone during 7-9 December 2004.
A sequence of substantial lava flows was first observed by INSIVUMEH in January 2005; strong thermal signatures were initially captured by MODVOLC beginning on 24 December 2004 and persisted until 28 August 2005. During this period, most of the lava flows covered the NW, N, and NE flanks of the central crater, but some extended up to 300 m down the W and SW flanks (figure 62). An INSIVUMEH report from 2008 noted that in March and April 2005 the growth of N-S oriented cracks on the MacKenney Crater created a new vent on the cone's ENE side. In just a few days, the flow field from this vent grew to about 800 m long and curved westward down the N flank, filling much of the depression formed by the cracks in the subsequent months (BGVN 33:08).
Strombolian explosions reached 100 m above the crater, and avalanches of ejected incandescent blocks produced small ash clouds to low levels during much of 2005. Thermal anomalies ceased at Pacaya after 28 August 2005, although observations by INSIVUMEH of occasional Strombolian activity and ejected bombs were made until 11 September. After that, only weak incandescence was reported in early November and January 2006; a new Strombolian explosion occurred on 9 March 2006.
Activity during 2006-2009. The Strombolian explosions that began on 9 March 2006 ejected material tens of meters above the volcano in pulses of activity lasting 10-30 seconds; on 12 March material rose 250 m above MacKenney Cone. Significant lava flows began in late March, advancing about 150 m from the S and SW edges of the crater. A new flow on 13 April was reported by INSIVUMEH as issuing from a parasitic cone, at the ENE base of the main cone, and was 125 m long by 17 April. During the rest of 2006, lava flows from this vent reached lengths of more than 800 m NW of the summit cone and covered an area N, NE, and NW of the cone, known as the 'meseta' (plateau) popular with visitors to the Park (see figures 39, 40, and 41, BGVN 33:08). The Washington VAAC issued only one ash advisory in 2006, on 28 August, and noted possible ash emissions at 3 km altitude drifting 16 km W.
Throughout 2007, 2008, and 2009, multiple vigorous lava flows traveled in different directions from MacKenney Cone. The new lava flows that emerged from a vent on the ENE flank during March and April 2006 also continued to flow NE and N, and then curved to the W in multiple branches, covering large areas of the plateau between the active cone and the three older cones (Cerro Grande, Cerro Chiquito and Cerro Chino) to the N. These flows were most active through November 2008 (figure 63). Flows down the S and SW flanks continued intermittently and reached lengths of several hundred meters. They were most active between August 2008 and the end of 2009; reaching 800 m long in December 2008. Lava flow volume and explosive activity increased during April 2009; the flows traveled down the S and SW flanks for distances up to 400 m. During July, they traveled as far as 600 m down the flanks, and remained vigorous throughout the rest of the year.
Strombolian explosions were intermittent during this three year period, only reported a handful of times in January, June, and December 2007, February, May, and July 2008, and March and April 2009, with explosions of material to a few tens of meters above the summit cone. These explosions often created gas plumes reported by INSIVUMEH to altitudes of 2-3 km. They reported that material from explosions in March 2009 enlarged the cones in the summit crater, and vigorous degassing contributed to substantial noise. A small spatter cone, 4 m high, was detected in the S part of the crater in late April.
There were only three series of VAAC reports during 2007-2009, two in 2007 and one in 2008. A small ash plume was observed on 6 April 2007 at 4.6 km altitude that drifted less than 10 km SSE before dissipating. On 17 November 2007 a narrow plume was observed in satellite imagery extending 15-25 km NW of the summit at an altitude of 4.3 km. A brief emission of gas and possible ash was reported on 2 November 2008, but dissipated within three hours.
Activity during 2010. During January 2010, the lava flows that had descended the S, SW, and W flanks of MacKenney Cone since 2006 ceased flowing. Strombolian explosions were observed again in early February and new flows originating from a depression on the NE flank of the cone traveled 400 m down the E and NE flanks toward the meseta. Avalanches of blocks from the flow fronts set fire to local vegetation. Significant tephra explosions reached up to 150 m high in late February and lava flows traveled 800 m E (figure 64). Multiple lava flows on the SW flank of MacKenney cone on 20 May 2010 traveled 1.6 km, farther than previously recorded flows.
This increasing activity culminated in a large Strombolian eruption on 27 and 28 May 2010. On 29 May a 90-m-wide lava flow traveled SSE down the flank at an estimated rate of 100 m per hour and burned three houses on the Pacaya Grande ranch (see details in BGVN 39:05). The eruption was characterized in a report from CONRED as having constant explosions that ejected material 500 m into the air. INSIVUMEH reported a continuing series of explosions 5-10 seconds apart that ejected black ash up to 1 km above the crater on 28 May.
Numerous weather clouds prevented the Washington VAAC from determining an altitude of the ash plume until late on 28 May, when it was visible in satellite imagery at about 13 km altitude. Ash plumes drifted 20-30 km NW, causing ashfall as thick as 10 cm in areas downwind, including in Guatemala City, about 30 km NNE. INSIVUMEH reported 5-7 mm of ashfall during 27-28 May at the Aurora International Airport. CONRED reported on 28 May that about 1,600 people had been evacuated from six towns 3-4 km W, NNW, N, and NNE, and that the airport was closed. According to a map posted by CONRED, blocks fell in areas as far as 12 km NE, and ash was reported in areas E of Chinautla, 37 km NNE. Reuters News Agency reported that one person (a reporter) died and three children were missing.
The lava flow moving down the SSE flank of MacKenney Cone was shown by MODVOLC thermal alert pixels that persisted through much of June 2010 (figure 65). The lava flowed to within 450 m of several properties including El Chupadero, located 2-2.5 km S of the crater, and disrupted an access road from El Caracol (3 km SW) and Los Pocitos (5.5 km S).
Intermittent Strombolian activity continued into June 2010, with tephra ejected as high as 700 m above the crater. The lava flows on the SE flank remained active through mid-June and had traveled as far as 3.5 km before cooling. By late June, the cone was primarily emitting white and blue fumarolic plumes to several hundred meters. Significant ash emissions and small pyroclastic flows were again reported during the last two weeks of July, causing an evacuation of 150 people from nearby areas. A Washington VAAC report on 22 July noted a plume at an altitude of 4.1 km drifting N, that produced ashfall within 10 km. Strombolian explosions on 24 and 25 July were strong enough to cause a MODVOLC thermal alert pixel at the summit, and to eject tephra blocks onto the flanks.
The last eruptive events of this multi-year eruption were ash plumes emitted in August and Strombolian activity in October 2010. Small ash plumes rose to 800 m above the crater causing ashfall 5 km away on 2 and 3 August. This was followed by a burst of Strombolian explosions during 21-22 and 26 October. After this, only fumarolic emissions of primarily water vapor were reported at Pacaya until a plume of ash-and-gas was reported by INSIVUMEH on 5 March 2013.
A comparison of a geologic map prepared by INSIVUMEH's Rudiger Escobar Wolf in 2010 (also published in BGVN 39:05) and a Google Earth image from December 2010 readily shows the impact of the extensive flows at Pacaya during the 2006-2010 eruptive episode (figure 66).
Activity during March 2013-August 2014. Pacaya remained quiet between October 2010 and March 2013 except for intermittent pulses of seismicity and minor water vapor and gas emissions. An increase in explosions was noted beginning late in 2012, but only steam plumes were observed rising less than 500 m above the summit during January and February 2013. A single MODVOLC thermal alert pixel captured on 2 Feb 2013 to the SE of MacKenney Cone is likely the result of agricultural, not volcanic, activity.
The first report of renewed activity was on 5 March 2013 when INSIVUMEH noted that a thin plume of brown ash accompanied the fumarolic plumes, and dispersed to the S. Weak gas-and-ash plumes recurred several more times during March. On 24 April tephra was ejected 25 m high by weak explosions; incandescence and explosions were detected the next day and again on 29 April. Incandescence was regularly observed during May, and more substantial Strombolian activity started on 20 May and carried through to the end of the month. Tephra ejections rose to 25 m above the crater, and continuous explosions a few minutes apart that ejected bombs and generated rumbles, were heard 4 km away. An explosion on 30 May ejected ash and lapilli 200 m above the crater that was then deposited within 400 m of the crater.
Strombolian activity on 27 June 2013 again ejected small amounts of tephra that were deposited on the W flank. An investigation of the summit crater of MacKenney Cone during June determined that a 15 m high cone had been the source of the most recent explosive activity. An increase in seismicity in late July indicated the continued growth of the pyroclastic cone which had risen to 4 m above the crater rim by 24 July, doubling its total height from June to more than 30 m high. Weak explosions and incandescence were observed the next night, and a Strombolian eruption on 30 July lasted for four hours and ejected material 250 m above the cone. A diffuse ash plume drifted 2 km N, causing ashfall in areas downwind, and another ash plume drifted 5 km S. A prominent hot spot at the summit was reported by the Washington VAAC.
During 9 and 10 August seismicity increased again and Strombolian explosions ejected tephra 200 m above MacKenney Crater and onto the flanks, 400 m from the crater, causing small avalanches on the flanks. Another explosion during the night of 14-15 August produced a 300-m-long lava flow that traveled W from MacKenney Crater; new emissions of ash and gases to 500 m above the crater were reported by the Washington VAAC the next day. Tremors and explosions of incandescent material continued through August and the first half of September ejecting material and sending small ash plumes a few kilometers above the cone. Incandescence was reported as visible from the capital to the N by mid-September. Two MODVOLC thermal anomaly pixels were recorded on 30 August and 3 September confirming the increased thermal activity reported by INSIVUMEH.
In late November 2013 INSIVUMEH reported that activity remained unchanged with weak explosions, gas emissions and tephra ejections continuing. Pilots reported that ash plumes rose to 2.7 km and drifted 10 km SW. This continued into early January 2014 when activity at the main crater increased; seismographs recorded constant tremor, and beginning on 11 January, INSIVUMEH observed tephra explosions to 100 m, gas plumes to 600 m, and new craters on the E, S, and W flanks that produced extensive new lava flows. These flows emitted strong thermal anomaly signatures that were captured by MODVOLC for the next two weeks (figure 67).
At the beginning of this event (on 11 January) CONRED reported evacuations from Villa Canales (14 km NW), El Chupadero (2-2.5 km S), and San Vicente Pacaya (5 km NW). Lava flows had reached 3 km by 13 January. A report on 21 January noted that the S-flank lava flow was 3.6 km long and continued to slowly advance, burning vegetation (figure 68) between the Rodeo and Los Pocitos roads.
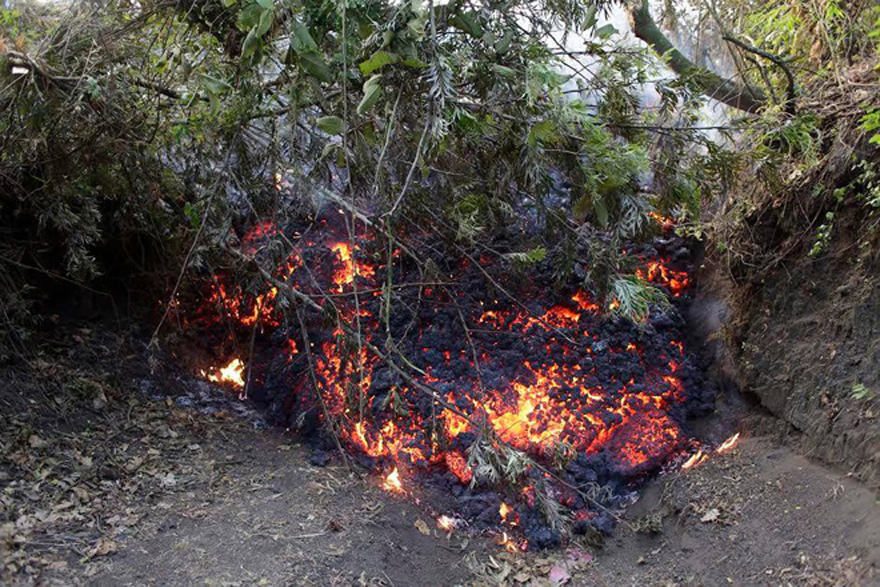 |
Figure 68. An a'a lava flow at Pacaya burning its way through a forest on 11 January 2014. Courtesy of CONRED. |
Volcanologists observed that the cone in MacKenney Crater had been completely destroyed during the January events, leaving a deep crater that produced fumarolic activity. The Washington VAAC noted an ash plume on 11 January that rose to 3.4 km and extended 55 km SSW from the summit. After that, a prominent hot spot was visible but there was no further indication of ash in satellite imagery. Separate Google Earth images captured in December 2013 and April 2014 show the extent of the new lava flows on the S flank of MacKenney Cone (figure 69) during January 2014.
The next episode of activity began with increased gas-and-vapor plumes during 27-28 February 2014 and included ejection of fine pyroclastic material 600 m S and SW from the crater. INSIVUMEH and CONRED noted increased activity on 2 March; at 0515 Strombolian activity at MacKenney Crater ejected material as high as 800 m and lava flows descended the W flank (figure 70). Explosions produced dense ash plumes that initially rose 2.5 km and drifted 15 km S, SW, and W. Ashfall was reported in El Rodeo (4 km WSW), Patrocinio (about 5 km W), and Francisco de Sales (5 km N). By the next day, activity had decreased, but lava flows traveled up to 1.3 km S and ejected tephra drifted 600 m S and SW. Small explosions and lava flows continued to be active for the next week. MODVOLC thermal alerts were captured around the summit on 2 and 3 March, but no additional thermal alerts were recorded in 2014. The Washington VAAC also noted emissions of gas and volcanic ash on 2 March that rose to 4.9 km altitude and extended over 200 km W before the end of the day. By 3 March an area of light ash remained 370 km W of the volcano off the southern Mexico coast and dissipated during the day.
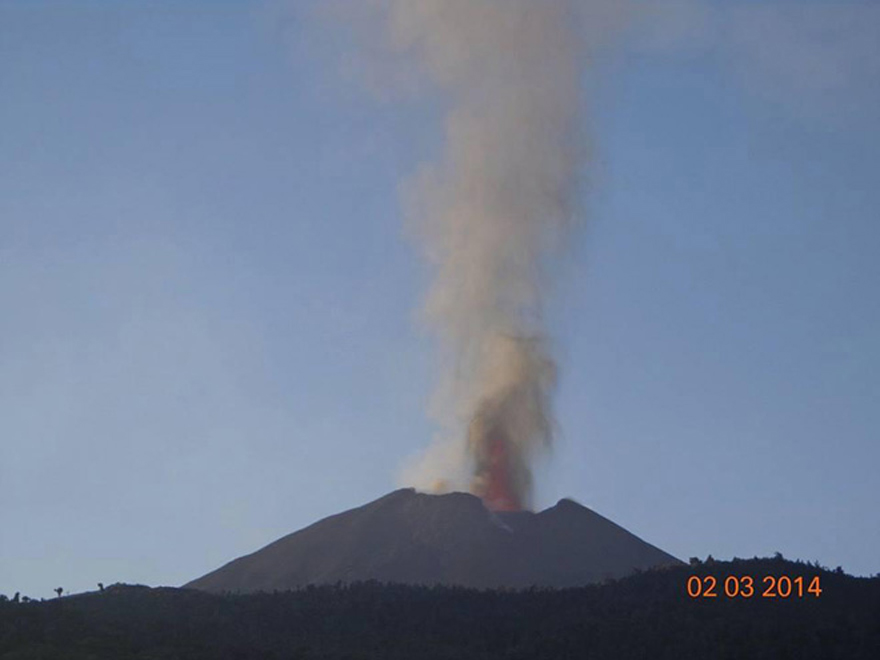 |
Figure 70. The eruption of Pacaya on 2 March 2014. The lava fountain (reddish) can be seen at the summit vent. Courtesy of CONRED. |
After INSIVUMEH reported a small ash plume on 10 April 2014, only minor episodes of increased seismicity and steam plumes rising a few tens of meters above the summit were observed through August.
Information Contacts: Instituto Nacional de Sismologia, Vulcanologia, Meteorologia e Hydrologia (INSIVUMEH), Unit of Volcanology, Geologic Department of Investigation and Services, 7a Av. 14-57, Zona 13, Guatemala City, Guatemala (URL: http://www.insivumeh.gob.gt/); Coordinadora Nacional para la Reducción de Desastres (CONRED), Av. Hincapié 21-72, Zona 13, Guatemala City, Guatemala (URL: http://conred.gob.gt/www/index.php); Washington Volcanic Ash Advisory Center (VAAC), Satellite Analysis Branch (SAB), NOAA/NESDIS OSPO, NOAA Science Center Room 401, 5200 Auth Rd, Camp Springs, MD 20746, USA (URL: http://www.ospo.noaa.gov/Products/atmosphere/vaac/, archive at: http://www.ssd.noaa.gov/VAAC/archive.html); Hawai'i Institute of Geophysics and Planetology (HIGP), MODVOLC Thermal Alerts System, School of Ocean and Earth Science and Technology (SOEST), Univ. of Hawai'i, 2525 Correa Road, Honolulu, HI 96822, USA (URL: http://modis.higp.hawaii.edu/); Google Earth (URL: https://www.google.com/earth/); Reuters News Agency (URL: http://www.reuters.com/article/us-guatemala-volcano-idUSTRE64R11M20100528?pageNumber=2).
Steady growth of intra-crater cone during 2016 fills MacKenney Crater
Guatemala's Pacaya volcano has a 450-year record of frequent historical observations of activity, in addition to confirmed radiocarbon dating of eruptions over 1,500 years. Its location approximately 30 km S of the capital of Guatemala City makes it both a popular tourist attraction as a National Park, and a hazard to the several million people that live within 50 km. Activity during the last 50 years has been characterized by extensive lava flows, bomb-laden Strombolian explosions, and ash plumes that have dispersed ash to cities and towns across the region.
Major lava flows and Strombolian activity in January and early March 2014 were previously reported (BGVN 42:04). This report describes activity for the remainder of 2014 through 2016. Information was provided by the Instituto Nacional de Sismologia, Vulcanologia, Meteorologia e Hydrologia (INSIVUMEH), the Coordinadora Nacional para la Reducción de Desastres (CONRED) of Guatemala, and the Washington Volcanic Ash Advisory Center (VAAC), which provides air traffic advisories. Satellite imagery and visitors to the volcano also provided evidence of activity.
Ash plumes were intermittent for the remainder of 2014 after the activity of January and March; they were reported on 10 April, 25 and 28 August, during 11-18 November, and on 22 December. Episodes of ash emissions in mid- and late January 2015 and up to 17 February marked the end of this episode. Renewed activity on 8 June 2015 included intermittent ash plumes and incandescence observed at the summit. Ash plumes were intermittent until 22 September but observations of incandescence grew more frequent and intense during the rest of the year. A small intra-crater cone was growing in mid-December 2015 at the center of MacKenney Crater. Strombolian activity from the cone continued throughout 2016. It was most active during June and July, depositing new ejecta on the N and W flanks of the volcano. Although it had quieted down by the end of the year, persistent degassing, steam plumes, and occasional incandescence were still observed. The intra-crater cone had filled much of MacKenney Crater by December 2016.
Activity during April-December 2014. Extensive lava flows in January and early March 2014 affected large areas on both the N and S flanks of Pacaya (BGVN 42:04). The volcano quieted down significantly after the first week in March. A plume with minor ash was observed rising to 2.6 km altitude and drifting approximately 1 km S and SW on 10 April. During the rest of April through late August 2014 only white and blueish-white plumes rose 50-150 m above the summit, and no thermal anomalies were reported.
INSIVUMEH reported on 25 and 28 August 2014 that small bursts of gray ash rose 200-700 m above the summit and drifted S and SW. Otherwise, only plumes of steam and magmatic gases were observed during August through early November. Small bursts with minor amounts of ash were reported again on 11, 16, and 18 November 2014 that rose a few hundred meters above the summit and drifted S and SW. Incandescence was observed at the summit crater on 9 December. Only steam and gas plumes were observed by INSIVUMEH for the rest of December 2014, but the Washington VAAC reported an emission of gases and possible minor ash to 3.4 km altitude (900 m above the summit) on 22 December drifting S for a few hours before dissipating.
Activity during 2015. Renewed seismic activity with numerous small ash emissions was reported in a special bulletin by INSIVUMEH on 14 January 2015. They noted that about 24 weak explosions with ash had occurred in recent days. In another special notice issued on 28 January, they reported that ash emissions originating from MacKenney Crater had drifted 4 km S and SW. They noted as many as 40 ash explosions within the previous 24 hours. Gas plumes were also observed from an area on the S flank.
Weak ash and steam emissions rising a few hundred meters above the summit were also reported on 1 February 2015. MODVOLC showed three thermal alert pixels on the SE flank on 10 February, but they were near an area of agricultural development and likely not be related to volcanism. Only steam emissions were reported by INSIVUMEH until 13 February when a new series of weak explosions sent dark gray ash plumes 500-700 m above the crater; the plumes were observed until 17 February. After this, INSIVUMEH reported only minor seismicity and steam-and-gas plumes through 5 June. Three MODVOLC pixels on 25 March, located on the E flank, were in agriculture areas similar to the February alerts.
Continuing ash explosions every three or four hours indicated renewed activity on 8 June 2015, as reported by INSIVUMEH. The seismic network detected signals consistent with collapse inside the crater along with ash emissions. Plumes with gas and minor ash were reported on 14, 16, and 18 June rising 50 m above the crater. Increased seismicity on 18 June led to noises that were audible 3 km away. For the rest of June and into the first week of July, ash was frequently dispersed around the crater from gas-and-ash plumes, and incandescence was visible on clear nights. Incandescence from MacKenny crater was reported again on 23 August. CONRED also reported that the low-frequency tremors that started in mid-June were continuing in mid-August.
Blue and white plumes, along with minor ash emissions, were observed drifting W of the summit crater on 1 September 2015, and the low-frequency tremors and incandescence continued on clear nights for the rest of the month. Two ash plumes, on 11 and 22 September, rose to 700 and 900 m above the crater. Although only a single MODVOLC thermal alert pixel appeared near the summit on 2 October, numerous observations of incandescence were made by INSIVUMEH during the month. Cloudy weather limited observations of incandescence during November to only the first and last weeks, but observations were nearly continuous during December.
A visit to the summit of Pacaya on 22 December 2015 by Volcano Discovery provided evidence of the activity responsible for the incandescence observed during the previous months (figure 71). During stronger intervals of activity, lava bombs were ejected 150-200 m above the crater rim, but generally fell back within the crater. A few fresh (days-to-weeks-old) bombs were seen near the eastern crater rim. Around the main vent at the bottom of the approximately 100-m-deep crater, a small cone, about 15 m tall, had formed. Bubbles of lava burst into fragments of spatter from the vent, building up the cone (figure 72). A small secondary vent at the eastern side of the cone also showed occasional spattering, mainly during phases of elevated activity at the main vent. Parts of the crater floor were covered by recent lava flows.
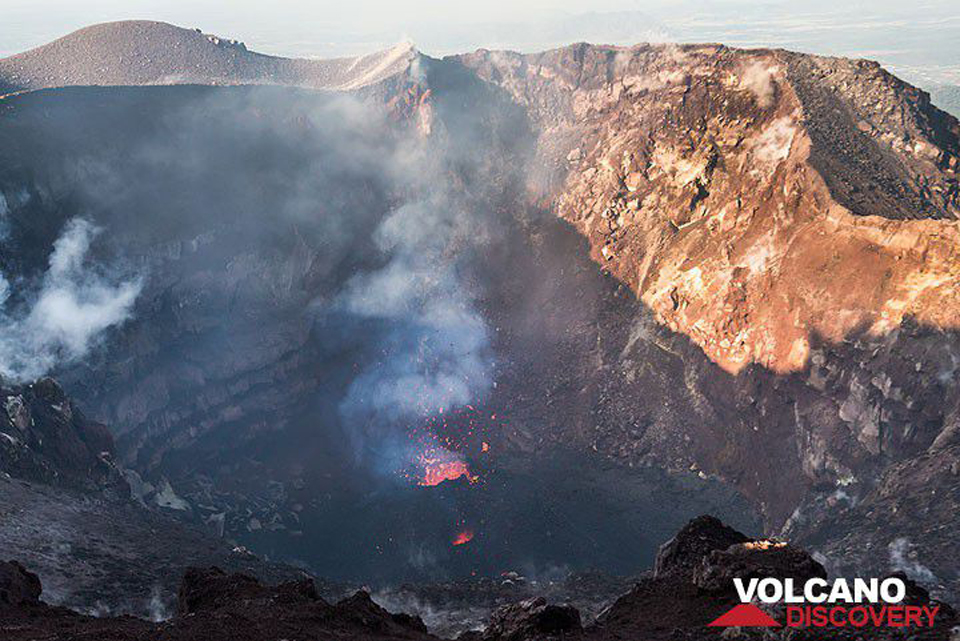 |
Figure 71. A small cinder cone with a vent 2-3 m wide is active on the floor of MacKenney Crater at the summit of Pacaya on 22 December 2015. Courtesy of Volcano Discovery (photo by Tom Pfeiffer). |
Activity during 2016. INSIVUMEH reported that during January 2016, Pacaya exhibited activity similar to 2015. Incandescence was visible at night during 20-27 January, and during this time a hot spot was captured at the summit in a Landsat image. A small collapse on the NW side of the inner crater generated a column of gray emissions that rose to 3 km altitude (500 m above the summit) on 20 January. A Landsat image on 12 February again showed incandescence and a steam plume rising 100 m above the crater. Incandescence reappeared on 20 February and persisted for the remainder of the month. Emissions from the main crater were primarily magmatic SO2 and steam; they generally rose 50-150 m above the crater and drifted N.
Incandescent activity at MacKenney Crater increased during March and April 2016. Landsat images showed incandescence aligned along a NW-SE trending fissure within the crater. MODVOLC thermal alert pixels appeared on 1, 19, and 26 March and again on 10 April; the 10 April thermal alert was readily visible as a hotspot in satellite imagery (figure 73). INSIVUMEH noted that the intra-crater cone continued to grow during March and April. The MIROVA Log Radiative Power data also registered a number of thermal anomalies during March and April (figure 74).
During May 2016 the intra-crater cone continued to grow, and minor Strombolian activity during the night was observed regularly by INSIVUMEH. Most of the activity occurred on the N flank, with some incandescence on the W flank at the end of the month. Seismicity continued at modest levels with occasional explosions resulting from minor collapses of the crater wall. Strombolian activity increased during June, although the degassing plume did not reach more than 400 m above the crater. The webcam recorded incandescent material accumulating on the NW flank.
Seismic activity during July 2016 remained constant, caused by degassing and Strombolian explosions which were observed during 7-10 July. Material was ejected 75 m above the crater during 23-24 July. Views of Pacaya from the NW and the S during July and August revealed minor fumarolic activity from the summit as well as evidence of the extensive January-March 2014 lava flows (figures 75 and 76). Incandescence continued to be observed at night and in satellite images during July and August, with debris from the Strombolian activity concentrated on the N and NW flanks.
By October 2016, observations of incandescence at the summit were less frequent. INSIVUMEH noted that intermittent incandescence continued for the rest of 2016 with new material accumulating within MacKenney Crater. Visitors to the intra-crater cone in early December 2016 noted strong degassing of steam, magmatic gases, and possible ash, but no Strombolian activity. The intra-caldera cone was significantly larger than when observed a year earlier (figure 77).
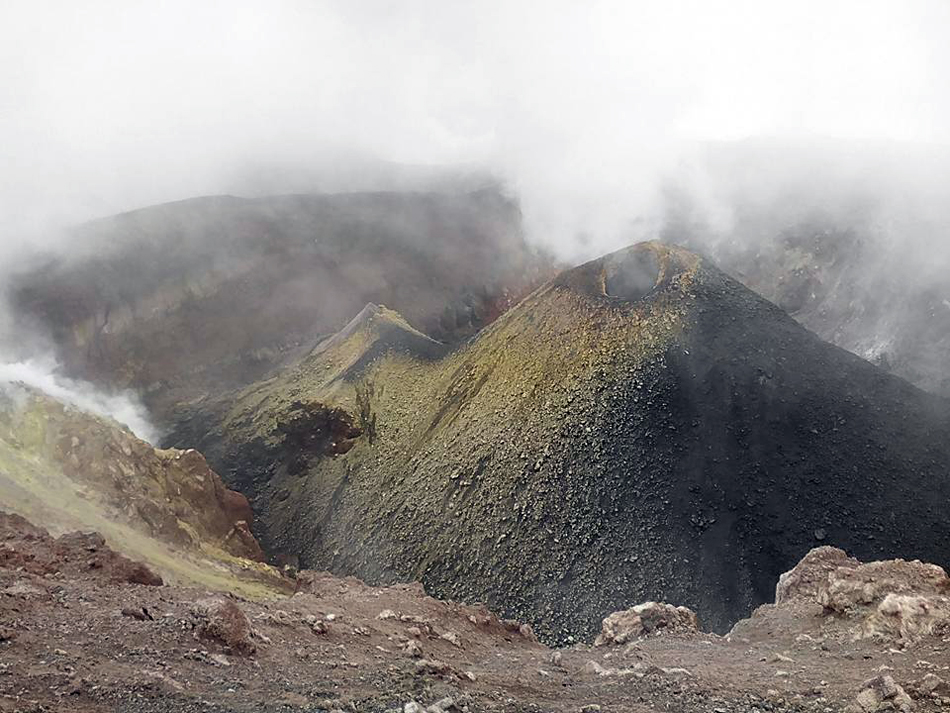 |
Figure 77. Intra-crater cone at Pacaya in early December 2016. Courtesy of Volcano Discovery (Image from Mynor Marroquin via @ClimaEnGuate / Twitter). |
Information Contacts: Instituto Nacional de Sismologia, Vulcanologia, Meteorologia e Hydrologia (INSIVUMEH), Unit of Volcanology, Geologic Department of Investigation and Services, 7a Av. 14-57, Zona 13, Guatemala City, Guatemala (URL: http://www.insivumeh.gob.gt/); Coordinadora Nacional para la Reducción de Desastres (CONRED), Av. Hincapié 21-72, Zona 13, Guatemala City, Guatemala (URL: http://conred.gob.gt/www/index.php); Hawai'i Institute of Geophysics and Planetology (HIGP), MODVOLC Thermal Alerts System, School of Ocean and Earth Science and Technology (SOEST), Univ. of Hawai'i, 2525 Correa Road, Honolulu, HI 96822, USA (URL: http://modis.higp.hawaii.edu/); MIROVA (Middle InfraRed Observation of Volcanic Activity), a collaborative project between the Universities of Turin and Florence (Italy) supported by the Centre for Volcanic Risk of the Italian Civil Protection Department (URL: http://www.mirovaweb.it/); European Space Agency (ESA) (URL: http://www.esa.int/ESA); Tom Pfeiffer, Volcano Discovery (URL: http://www.volcanodiscovery.com/).
Pyroclastic cone in MacKenney crater grows above crater rim, January-September 2017
Activity since 1961 at Pacaya has been characterized by extensive lava flows, bomb-laden Strombolian explosions, and ash plumes emerging from MacKenney crater and several vent fissures, impacting communities in the vicinity; several million people live within 50 km. After a few months of quiet, intermittent ash plumes and incandescence in early June 2015 marked the beginning of the latest eruptive episode, which has been ongoing since that time. Observations of incandescence increased during the second half of 2015, and the presence of a new pyroclastic cone, about 15 m in diameter at the center of MacKenney crater, was confirmed in mid-December 2015.
Strombolian activity from the cone continued throughout 2016. It was most active during June and July, depositing new ejecta onto the flanks. Although it had quieted down by the end of the year, persistent degassing, steam plumes, and occasional incandescence were still observed from the new cone. It had filled much of the crater by December 2016. This report describes the continued growth of the pyroclastic cone during January-September 2017, as well as new lava flows that emerged during February and March. Information was provided primarily by the Instituto Nacional de Sismologia, Vulcanologia, Meteorologia e Hydrologia (INSIVUMEH) and satellite thermal data.
The pyroclastic cone inside MacKenney crater continued to grow sporadically during January-September 2017. Weak explosions in January produced ejecta 15 m above the top of the cone as steam and gas emissions rose about 400 m above the crater rim. By early February the top of the cone had risen to 10 m above the crater rim. Ejecta ranging in size from millimeters to 50 cm rose up to 25 m above the cone. Three small lava flows emerged from the crater in early February and flowed down the NW flank a few hundred meters before cooling. Growth of the cone continued more slowly during March-August, but incandescence was still observed, and weak explosions deposited tephra around the sides of the cone. Increased explosive activity during August reduced the height of the cone to slightly below the crater rim, but renewed explosions during September built it back up again to 10 m above the rim a few weeks later.
During January 2017, activity increased slightly compared with December 2016, and included degassing, tremors, incandescence, and weak explosions from MacKenney crater. Steam-and-gas plumes rose to around 400 m above the crater rim and generally drifted about 5 km before dissipating. Incandescence in the crater grew more visible towards the end of the month; ejecta from the pyroclastic cone within crater rose as much as 15 m above the crater rim. Seismic RSAM values also increased from a maximum of 2,500 to 3,500 units. The first MODVOLC thermal alert since 10 April 2016 appeared on 10 January 2017. Eight more alerts appeared during January, every few days for the rest of the month.
Degassing during February 2017 sent plumes slightly higher to 500 m above the crater . The top of the pyroclastic cone had risen to about 10 m above the crater rim by early February, as compared to about 10 m below the crater rim a year earlier in February 2016 (figure 78). Ejecta from the cone ranged in size from millimeters to 50 cm, and rose to heights of 10-25 m above the top of the cone with constant activity (figure 79).
Three small lava flows were reported during February 2017, first emerging from the NW side of the crater from the fissure created during 2010 on 9 February 2017 and flowing NW towards Cerro Chino. Incandescent material was ejected 30-50 m above the crater rim and filled much of the crater. Lava travelled as far as 300 m down the NW flank. The dimensions of the flows were variable, but by the end of the month they were about 50 m long and 20 m wide. Ten MODVOLC thermal alerts were issued during February, indicating that activity was high inside and around the summit crater.
Steam plumes during March and April 2017 rose as high as 600 m above the crater rim. Lava flowed tens of meters outside the crater rim a few times at the end of March. The growth of the pyroclastic cone continued with Strombolian explosions of 10-25 m above the top of the cone during this time, and incandescence visible on clear nights. It was possible to see the new cone above the crater rim from the NW and W flanks (figure 80). Rumblings from the explosive activity were reported within 5 km of the cone. Although the three MODVOLC thermal alerts issued during the first week of March were the last through at least September 2017, weak explosions and nighttime incandescence continued during May as the pyroclastic cone continued to grow.
By June 2017, the steam plumes were rising about 800 m above the crater rim. The height of the pyroclastic cone remained at about 10 m above the crater rim, but continued to grow in volume and produce abundant steam and gas (figure 81). Similar emissions were reported during July, however, incandescence was only occasionally observed at night.
INSIVUMEH reported increased activity during August 2017 with the frequency of Strombolian explosions increasing to 5-7 per hour, and higher RSAM units recorded to 4,000; some material was ejected as high as 75 m above the crater rim, generating block avalanches as far as 100 m down the W flank. Explosions during 11 August reduced the height of the pyroclastic cone inside the crater such that it was no longer visible from the flank. Moderate to strong explosions were recorded a number of times during the month (figure 82).
Seismic and explosive activity remained high during September 2017. Two significant events were recorded. On 5 September RSAM values peaked at 5,000 units and remained elevated for about six hours before dropping back to average values around 2,000. This corresponded with a period of rebuilding of the pyroclastic cone within the crater. INSIVUMEH reported Strombolian explosions ejecting material as high as 100 m above the crater rim during 21-22 September. The second event lasted for about three days during 23 and 26 September when there was an increase in the rate of explosions, registering up to 40 per hour. After destruction of part of the cone during August, it was rebuilt to a level about 10 m above the crater rim again during this time.
Infrared thermal data generally agrees well with observations of increased activity and lava flows during January-March 2017 (figure 83). However, reports from INSIVUMEH indicate that explosive activity continued at the pyroclastic cone during April-September, although only the largest events during August and September created thermal signals that were captured in the MIROVA data.
Information Contacts: Instituto Nacional de Sismologia, Vulcanologia, Meteorologia e Hydrologia (INSIVUMEH), Unit of Volcanology, Geologic Department of Investigation and Services, 7a Av. 14-57, Zona 13, Guatemala City, Guatemala (URL: http://www.insivumeh.gob.gt/); MIROVA (Middle InfraRed Observation of Volcanic Activity), a collaborative project between the Universities of Turin and Florence (Italy) supported by the Centre for Volcanic Risk of the Italian Civil Protection Department (URL: http://www.mirovaweb.it/); Hawai'i Institute of Geophysics and Planetology (HIGP), MODVOLC Thermal Alerts System, School of Ocean and Earth Science and Technology (SOEST), Univ. of Hawai'i, 2525 Correa Road, Honolulu, HI 96822, USA (URL: http://modis.higp.hawaii.edu/).
Pyroclastic cone fills MacKenney crater; lava flows emerge from fissures around the crater rim
Extensive lava flows, bomb-laden Strombolian explosions, and ash plumes emerging from MacKenney crater have characterized persistent activity at Pacaya since 1961. The latest eruptive episode began with intermittent ash plumes and incandescence in June 2015; the growth of a new pyroclastic cone inside the summit crater was confirmed in mid-December 2015. Strombolian activity from the cone continued during 2016 and it grew sporadically through September 2017 (BGVN 42:12). Lava flows first emerged from fissures around the summit during January-April 2017. Explosions from the cone summit caused growth and destruction of the top of the cone; by the end of September it was about 10 m above the elevation of the crater rim. This report describes the continued growth of the pyroclastic cone and the increasing emergence of lava flows around the summit during October 2017-March 2018. Information was provided primarily by the Instituto Nacional de Sismologia, Vulcanologia, Meteorologia e Hydrologia (INSIVUMEH) and satellite thermal data.
Thermal activity was relatively quiet at Pacaya during October and November 2017. The pyroclastic cone inside MacKenney crater continued to grow as material from Strombolian explosions sent ejecta a few tens of meters above the cone and onto its flanks, slowly filling the area within the crater. In late November, small lava flows began to emerge from the crater. Material flowed from the 2010 fissure on the NW side of the crater, and also appeared from new lateral fissures on the W and SW flanks. Multiple small short-lived lava flows traveled a few hundred meters down the flanks with increasing frequency during January through March 2018. Strombolian activity from the summit of the cone occasionally reached over 100 m; by the end of March, the summit of the cone remained about 25 m above the crater rim, and much of the crater was filled with ejecta (figure 84).
Activity during October-December 2017. Activity during October 2017 consisted primarily of degassing with small plumes of steam and gas rising 100 m above the summit, and weak Strombolian explosions. . By the end of the month, the cone inside MacKenney crater rose about 10 m above the crater rim. At night, incandescent ejecta could be seen 25-100 m above the summit of the cone. During the last week of October strong winds dispersed the plumes SW and SE, and ashfall was reported 2 km from the crater in El Rodeo.
Steam and gas plumes generally rose no more than 25 m above the summit for the first 20 days of November 2017. Beginning on 21 November, more substantial steam and gas plumes, rising 500 m, were observed in the webcam (figure 85). An increase in tremor activity on 28 November coincided with an increase in explosive activity, a gray ash plume, and the appearance of a small lava flow on the NW flank that extended about 30 m. By the end of the month the cone had reached about 25 m above the rim of MacKenney crater and continued to grow from the accumulation of tephra fragments ranging in size from one millimeter to 50 cm that were ejected 25-100 m above the summit (figure 86). Explosions could be heard up to 1 km from the cone.
Strombolian explosions rising to 25 m continued in early December. On 10 December 2017, INSIVUMEH noted that there were two lava flows, one flowing on the SE flank with a length of 50-75 m and a second flowing NW towards Cerro Chino for 75-100 m. Strombolian explosions were reported 100 m above the summit of the cone on 15 December, and 25-50 m high on 25 December. The flow on the NW flank was about 100 m long on 26 December.
Activity during January-March 2018. Weak Strombolian activity continued from the cone during January 2018 with ejecta reaching 50 m above the summit. Small lava flows on the NW flank, generally only a few tens of meters long, were visible as incandescence at night (figure 87). While the height of the cone inside MacKenney crater remained about 25 m above the crater rim, material from the continuing low-level explosions had filled a large area of the crater by the end of the month. Blocks up to 1 m in diameter were also dislodged by the tremors and flow activity on the SW flank of MacKenney crater (figure 88). An increase in explosive activity beginning on 20 January resulted in audible explosions heard 2 km from the cone and fine ash deposited on the flanks. A new, larger flow also emerged from the crater early on 20 January and descended about 400 m down the SW flank, with material spalling off the front as it cooled. The following day, low-level Strombolian activity continued, and the flow remained active 200 m down the SW flank. During the last few days of January, the flow rate decreased, and the active flow was only 25 m long (figure 89).
Low-level steam and occasional gas plumes rising up to 300 m above the summit were typical during February 2018 (figure 90). In addition, intermittent lava flows continued to travel tens to a few hundred meters down the S, SW, and W flanks. A 25-m-long flow was observed on the SW flank on 2 February. On 8 February, a 150-m-long flow was noted, also on the SW flank. INSIVUMEH reported a 300-m-long lava flow from the NW area of crater on 9 February in the region of the 2010 fissure; it traveled NW towards Cerro Chino crater. A flow 75-100 m long was observed on the SW flank on 10 February; the next day 150-m-long flows were visible on both the SW and W flanks. Flows on both flanks were 100 m long on 12 February. A 30-m-long flow appeared on the SW flank on 13 February. The flow on the NW flank that began on 9 February was 20-m-wide and only 50 m long during the afternoon of 14 February. A flow was also visible on 14 February extending 250 m down the SW flank (figure 91).
Multiple lava flows on the SW flank ranged from 50-200 m long during 15-20 February. A flow on the W flank grew from 25 to 150 m during 17-23 February (figure 92). A flow reached 500 m down the SW flank on 25 February and after flow-front collapses was still 300 m long by the end of the month. A new surge of lava on 27 February emerged from the fissure on the NW flank of MacKenney crater and traveled 150 m towards Cerro Chino crater. Explosive activity remained constant; weak explosions, generally 3-5 times per hour, scattered ejecta on the flanks of the cone and created incandescence at night that often reached 15-35 m above the cone. The explosions also generated weak avalanches that sent material up to 1 m in diameter down the S and SW flanks to an area frequented by park visitors. Explosions were sometimes heard up to 3 km from the crater. Strombolian explosions increased in height towards the end of the month; they were reported at 150 m above the summit on 26 February.
Strombolian activity and persistent lava flows throughout March 2018 resulted in continued growth of the pyroclastic cone within the MacKenney crater. Low-level steam and gas plumes generally rose a few tens of meters above the summit; occasional plumes rose as high as 500 m. Small lateral fissures near the crater rim produced repeated small lava flows that generally flowed less than 250 m SW and W. Weak explosions averaging 3-5 per hour sent ejecta 10-50 m above the pyroclastic cone.
During the first week of March, flows on the SW flank were active as far as 500 m down the flank. A flow on 4 March was 65 m long, and one on 5 March ranged from 50-200 m long (figure 93). During the second week, two flows were active to 300 m down the W flank, and two others on the SW flank were 150-200 m long. A flow was reported 200 m down the E flank on 16 March. Multiple lava flows were visible during 17-23 March; one traveled 250 m down the SW flank, two others went 150 m down the W flank and remained active through the end of the month.
Information Contacts: Instituto Nacional de Sismologia, Vulcanologia, Meteorologia e Hydrologia (INSIVUMEH), Unit of Volcanology, Geologic Department of Investigation and Services, 7a Av. 14-57, Zona 13, Guatemala City, Guatemala (URL: http://www.insivumeh.gob.gt/); Google Earth (URL: https://www.google.com/earth/).
Frequent lava flows and Strombolian activity from April through September 2018
Pacaya is one of the most active volcanoes in Guatemala and is located 30 km south of the capital city. It has produced nearly continuous Strombolian eruptions, lava flows, and ash plumes for decades. The current activity is centered at the Mackenney cone and is largely directed towards the N due to the trough that developed during increased activity in 2010.
This report summarizes activity from April through September 2018, and is based on reports by Instituto Nacional de Sismología, Vulcanologia, Meteorología E Hidrologia (INSIVUMEH), Sistema de la Coordinadora Nacional para la Reducción de Desastres (CONRED), and satellite data. During this period, activity was dominated by gas plumes, Strombolian explosions, and numerous short lava flows that traveled mainly to the N to NW (see details below, table 6).
Activity remained constant through April (figure 94), with a significant increase at the end of the month. White and blue-white gas-and-steam plumes were frequently observed up to 800 m above the Mackenney crater with the dispersal depending on wind direction. There was a partial collapse of the cone within the Mackenney crater during the week of 7-13 April. Strombolian activity was constant, with explosions ejecting material up to 50 m above the crater, until 21 April when activity decreased due to a small collapse that occurred in the cone and temporarily sealed the conduit. After elevated seismicity that was the highest since 2014, activity increased again on 26 April when Strombolian explosions ejected material up to 150 m above the crater. On 28 April there were 25-50 explosions recorded per hour, reaching 200 m above the cone and generating shock waves observed by communities 4 km away. A lava flow reached 600 m in length, the longest lava flow since the 2010 eruption. This lava flow continued through to the end of the month. Throughout the month, between one and four lava flows were frequently active, with lengths varying from 50 to 500 m from the vent. Lava flows were distributed to the NW, W, SW, and S, and were sometimes accompanied by avalanches with blocks reaching 1 m in diameter.
Two new lava flows were seen moving down the NW flank on 3 May (figure 95). Activity in the first few days of May also included white and bluish white gas-and-steam plumes rising up to 900 m above the crater and frequent Strombolian explosions ejecting material to a maximum of 100 m above the crater. Increased weak-to-moderate explosions on 4 May ejected material 50-80 m above the crater and fed the NW-flank lava flows (figures 96 and 97). A slight increase in activity was noted 15-16 May, when constant explosions ejected material up to 50-70 m above the crater that were occasionally heard out to 3 km away. On 20 May approximately 50 explosions per hour were recorded, with material reaching 50-100 m above the crater. Elevated activity on 16 May produced a lava flow towards the W. Lava flows were observed on 1-3, 6, 12, and 16 May, with recorded lengths reaching 200-600 m on the NE, NW, and W flanks.
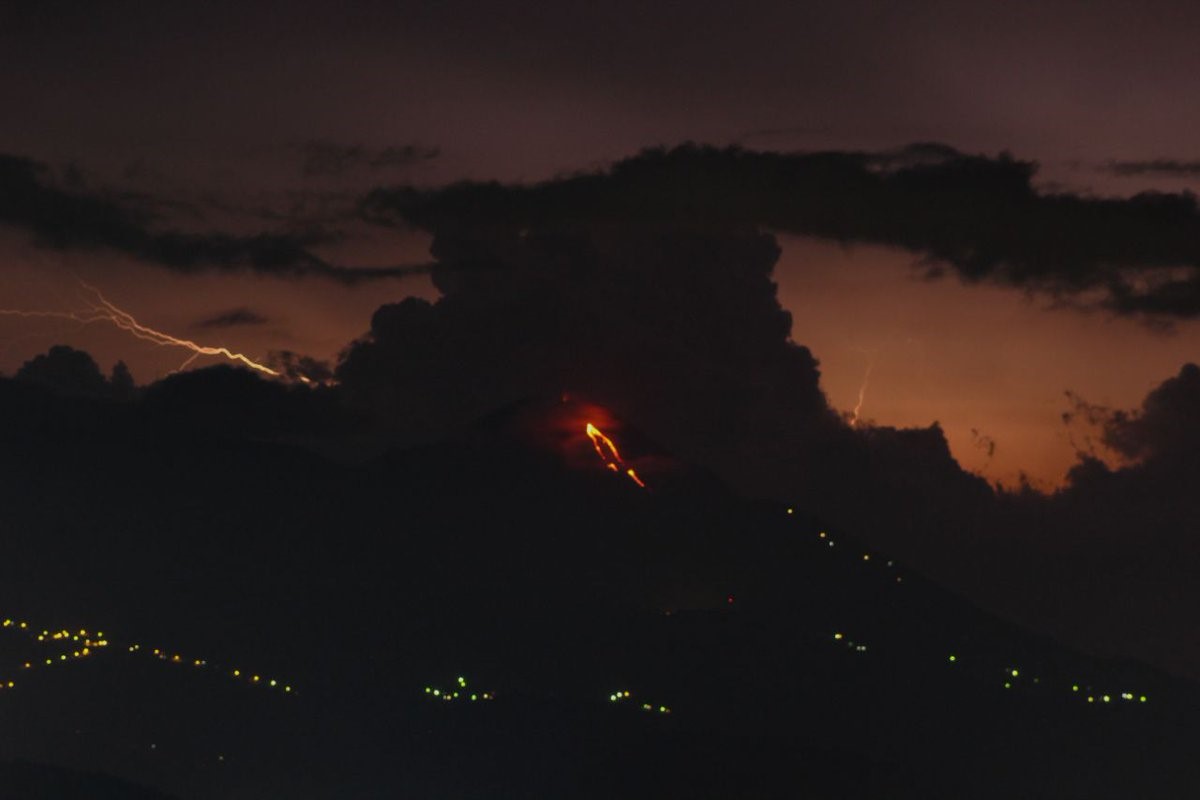 |
Figure 97. Incandescent lava flows on Pacaya visible at night on 4 May 2018. The lava flows are approximately 500 m in length. Photo courtesy of CONRED (Bulletin 762018, 4 May). |
White, blue-white, and gray-white plumes were frequently noted throughout June with heights above the crater ranging from 15 to 800 m. Strombolian activity continued, ejecting material up to maximum heights of 150 m, but more commonly 15-50 m above the crater. During 12-14 June ejecta reached 100-150 m above the crater, with explosions heard up to 10 km away on the 12th. An ash plume on the 13th reached 3.5 km above sea level and dispersed 10 km N and NW. A new lava flow was observed on 6-7 June accompanied by Strombolian explosions ejecting material up to 50 m above the crater (figure 98). No additional lava flows were reported this month.
Throughout July activity consisted of gas-and-steam plumes, Strombolian activity, and lava flows. White and blue-white plumes were low earlier in the month, but reached 300-450 m above the crater from 25 July to the end of the month. Strombolian explosions continued, ejecting material up to 5 to 50 m above the crater. Lava flows were frequently produced through July, with lengths ranging from 40-500 m from the vent, towards the SE, N, NW, and W. A decrease in activity was recorded on 4 July, which then increased again on 7 July. This increase produced a lava flow down to 400 m on the N flank, with an average width of 40 m.
Similar activity continued through August. White and blue-white plumes rose 50-600 m above the crater throughout the month. Strombolian activity continued, with explosions ejecting material 10-30 m above the crater, often reported as reaching low levels throughout August. One to two active lava flows were frequently described in daily reports, with lengths ranging from 75 to 500 m and traveling towards the NE, N, NW, and W. A slight increase in Strombolian activity occurred on the 27 August, generating 3-5 explosions per hour with some explosions heard up to 10 km away.
Frequent lava flows continued through September, with one to four active flows noted in daily reports (figure 99). Lava flow lengths ranged from 150 to 300 m and moved towards the N, NW, and W. White and blue-white plumes were observed reaching up to 800 m above the crater. Strombolian activity continued, ejecting material up to 10-30 m above the crater.
Overall, Pacaya produced numerous short (up to 600 m long) lava flows from April through September 2018 (figure 100), along with frequent degassing and fumarolic plumes, and Strombolian activity. Lava emissions and Strombolian activity were centered at the active Mackenney cone and vents on the NW flank. There was a significant reduction in lava flow extrusion in June, evident by the lack of MODVOLC thermal alerts (figure 101) and the reduction in MIROVA thermal energy detected (figure 102). Activity then remained frequent from July through September.
Table 6. Summary of activity at Pacaya during April-September 2018. Information compiled from INSIVUMEH and CONRED reports.
| Date | Summary of Observations (all heights are above the crater unless specified) |
| 01 Apr 2018 | Moderate white/blue plume dispersed to the S. Strombolian explosions ejected material up to 5-25 m. Two lava flows to the W and NW to 200 m. |
| 02 Apr 2018 | White/blue plume towards the S. Strombolian explosions ejected material up to 35 m. A lava flow continues on the NW flank to 250 m. |
| 04 Apr 2018 | White/blue plume up to 50 m, towards the N. Strombolian explosions ejected material up to 5-15 m. Two lava flows towards the NW to 150 m, and SW to 150 m. |
| 05 Apr 2018 | Moderate white/blue plume dispersed to the S. Strombolian explosions ejected material up to 5-25 m. Two lava flows to the W and NW to 200 m. |
| 06 Apr 2018 | White/blue plume towards the S. Strombolian explosions ejected material up to 40 m. Two lava flows to the S and SW to 200 m. |
| 08 Apr 2018 | White/blue plume up to 250 m towards the S. Strombolian explosions ejected material up to 5-15 m. Three lava flows to the NW, W, and SW, to 250, 200, and 150 m. |
| 09 Apr 2018 | Moderate white/blue plume up to 50 m, towards the S. Strombolian explosions ejected material up to 5-25 m. Two lava flows to the NW and SW to 150 and 50 m. |
| 07-13 Apr 2018 | Partial collapse of the cone forming in the Mackenney crater. |
| 10 Apr 2018 | Fumarole plume towards the S. Weak Strombolian explosions ejected material to 40 m. One lava flow to the SW and S to 250 m. |
| 11 Apr 2018 | Moderate steam plume. Strombolian explosions ejected material up to 30 m. Two lava flows to the SW and S to 200 and 350 m, with accompanied avalanches. |
| 13 Apr 2018 | Two Lava flows to the S and SW to 250 and 200 m. |
| 14 Apr 2018 | White plume to 400 m, dispersed to the NE. Strombolian explosions continue. Two lava flows to the NW to 200 and 250 m. |
| 15 Apr 2018 | White/blue plume towards the SE. One lava flow to the NW to 250 m. |
| 16 Apr 2018 | White plume dispersed towards the S. Strombolian explosions continue. Two lava flows to the NW and W to 150 and 200 m. |
| 17 Apr 2018 | White/blue plume to the S. Two lava flows to the NW and SW to ~250 m. Strombolian explosions eject incandescent material up to 40 m. |
| 18 Apr 2018 | White plume up to 200 m, dispersed towards the N. Strombolian explosions continue. Four lava flows, two to the NW to 100 and 150 m, and two to the W to 50 and 150 m. |
| 19 Apr 2018 | Increased lava effusion in recent days. Since 18 April, four new lava flows on the SW, W, and NW flanks to 200-500 m, accompanied by constant avalanches. Strombolian explosions ejected material up to 40-50 m. |
| 20 Apr 2018 | Incandescence from lava flows observed at night. |
| 21 Apr 2018 | White plume up to 50 m, dispersed towards the S. Strombolian explosions continue. The four lava flows have ceased. |
| 22 Apr 2018 | Degassing plume up to 50 m, towards the N. Some Strombolian explosions. |
| 23 Apr 2018 | Some Strombolian explosions. |
| 24 Apr 2018 | White/blue plume up to 50 m. Some Strombolian explosions. |
| 25 Apr 2018 | White/blue plume up to 25 m, dispersed to the S. Strombolian explosions eject material up to 5-50 m. |
| 26 Apr 2018 | White/blue plume up to ~800 m. Strombolian explosions eject material up to 25-50 m. |
| 27 Apr 2018 | Low white/blue plume to the S. Strombolian explosions eject material up to 5-50 m. |
| 28 Apr 2018 | Lava flow 500 m to the NW. Two to four weak Strombolian explosions per day with incandescent material reaching 50 m. |
| 29 Apr 2018 | White/blue degassing to low altitude. Lava flow 500 m to the NW. |
| 01 May 2018 | Over the past few days a new eruptive phase began. White/blue plume up to 150-200 m. Strombolian explosions ejected material up to 20 m. One lava flow towards Cerro Chino to 200-300 m. |
| 02 May 2018 | White/blue plume from the NW flank. Lava flow 500 m to the NW. |
| 03 May 2018 | Moderate white/blue plume up to 150-200 m. Strombolian explosions ejected material up to 20 m. One lava flow towards Cerro Chino to ~500 m. Incandescence observed. |
| 04 May 2018 | Change in eruptive behavior, generating constant weak-moderate explosions ejecting material up to 50-80 m above the Mackenney cone. |
| 06 May 2018 | Weak-moderate white/blue plume up to 100 m. Strombolian explosions ejected material up to 15 m. One 600 m lava flow to the NE. |
| 07 May 2018 | Strombolian explosions continue. |
| 09 May 2018 | White/blue plume up to 300 m, dispersed to the S. Strombolian explosions ejected material up to 50 m. Incandescence observed. |
| 10 May 2018 | Moderate white/blue plume up to 700 m. Strombolian explosions ejected material up to 25-100 m. |
| 11 May 2018 | White/blue plume up to 600 m. Strombolian explosions ejected material up to 15-50 m. |
| 12 May 2018 | Strombolian explosions sent material up to 50-75 m. Lava flow to the W. |
| 13 May 2018 | White/blue plume up to ~200 m, dispersed to the SW. Strombolian explosions eject material up to 25 m. Incandescence observed. |
| 14 May 2018 | Moderate white/blue plume to ~800 m, dispersed to the W. Strombolian explosions ejected material to 7-50 m. |
| 15 May 2018 | White plume to 600-700 m, dispersed towards the W. Strombolian explosions ejected material up to 10-50 m. |
| 16 May 2018 | Constant Strombolian explosions ejected material up to 50-70 m, explosions occasionally heard 3 km away. Activity increased and produced a lava flow on the W flank. |
| 17 May 2018 | White/blue plume up to 300-400 m, dispersed to the S. Strombolian explosions ejected material up to 25 m. Incandescence observed. |
| 18 May 2018 | White/blue plume up to 400 m, dispersed to the W. Strombolian explosions ejected material up to 5-15 m. |
| 19 May 2018 | White/blue plume up to 200 m, dispersed to the N. Strombolian explosions ejected material up to 10-50 m. |
| 20 May 2018 | Strombolian explosions at Mackenney crater ejected material up to 50 m. Small avalanches on W flank. |
| 21 May 2018 | White/blue degassing plume up to 100 m, dispersed towards the S. Strombolian explosions ejected material up to 25 m. Incandescence observed in the evening. |
| 22 May 2018 | Moderate white/blue degassing plume up to 900 m, dispersed towards the S. Strombolian explosions ejected material up to 5-10 m. |
| 23 May 2018 | White plume up to ~50 m, dispersed towards the S. Strombolian explosions ejected material up to 25 m. Incandescence observed. |
| 24 May 2018 | Moderate white/blue plume up to 500-600 m, dispersed towards the W. Strombolian explosions ejected material up to 5-10 m. Incandescence observed. |
| 25 May 2018 | White/blue plume up to 300 m, dispersed towards the N. Strombolian explosions ejected material up to 25 m. Incandescence observed. |
| 26 May 2018 | White plume up to 800 m, dispersed towards the E. Strombolian explosions ejected material up to 10-50 m. |
| 28 May 2018 | White/blue degassing plume up to 50 m, dispersed towards the S. Strombolian explosions ejected material up to 50-100 m. Incandescence observed. |
| 29 May 2018 | White/blue degassing plume up to 200 m, dispersed towards the S. Strombolian explosions ejected material up to 50-100 m, with ~50 explosions per hour. Incandescence observed. |
| 31 May 2018 | White/blue degassing plume up to 250 m, dispersed towards the S. |
| 01 Jun 2018 | White plume up to 500 m towards the N and NE. Strombolian explosions ejected material up to 15-50 m. |
| 02 Jun 2018 | White plume up to 200 m, dispersed towards the W. Strombolian explosions ejected material up to 15-50 m. |
| 03 Jun 2018 | White plume towards the W. Strombolian explosions ejected material up to 25-50 m. |
| 05 Jun 2018 | White/blue plume up to 400-600 m towards the W. Occasional weak explosions. |
| 06 Jun 2018 | New lava flow 50 m long by 20 m wide. Strombolian explosions eject material up to 50 m. White plume up to 200 m. |
| 07 Jun 2018 | White plume to up 200-300 m towards the N. The lava flow continues. |
| 08 Jun 2018 | Low white/blue plume towards the W. Strombolian explosions ejected material up to 15-50 m. |
| 09 Jun 2018 | White/blue degassing plume up to 400 m, dispersed towards the W. |
| 10 Jun 2018 | White/blue plume up to 300-400 m towards the SW. Strombolian explosions ejected material up to 15-50 m. |
| 11 Jun 2018 | White plume towards the W. Strombolian explosions increased and ejected material up to 20-40 m. |
| 12 June 2018 | Strombolian explosions eject material up to 150 m, generating sounds heard ~10 km away. |
| 13 June 2018 | White/blue degassing plume up to 150-300 m, dispersed towards the N. Strombolian explosions eject material up to 15-100 m. Ash plume up to 3.5 km above sea level, dispersed to the N and NE to 10 km. |
| 14 Jun 2018 | Gray/white plume up to 600-800 m, dispersed to the NE. Strombolian explosions eject material up to 15-100 m. |
| 16 Jun 2018 | Abundant white/blue plume up to 50 m, dispersed to the N and NW. Increased Strombolian explosions eject material up to 25-40 m. |
| 17 Jun 2018 | Some Strombolian explosions at the Mackenney crater. |
| 18 Jun 2018 | Abundant white/blue plumes up to 25 m towards the W. Increased Strombolian explosions ejected material up to 25-50 m. |
| 19 Jun 2018 | White plume up to 15 m towards the N. Strombolian explosions ejected material up to 5-25 m above the Mackenney crater. |
| 20 Jun 2018 | White/blue degassing plume up to 25 m, dispersed towards the N. Strombolian explosions ejected material up to 5-30 m. |
| 21 Jun 2018 | Moderate white/blue degassing plume up to 15 m, dispersed towards the N. Strombolian explosions ejected material up to 5-25 m. |
| 22 Jun 2018 | White/blue plume up to 25 m towards the S. Strombolian explosions ejected material up to 25-50 m. |
| 23 Jun 2018 | White/blue degassing plume up to 150 m, dispersed towards the W. Strombolian explosions ejected material up to 15, 50, and 70 m. |
| 24 Jun 2018 | Low white/blue degassing plume, dispersed towards the W. Strombolian explosions ejected material up to 25 m. |
| 25 Jun 2018 | Degassing plume from Mackenney crater up to 30 m towards the W. Small Strombolian explosions occurred. |
| 26 Jun 2018 | Strombolian explosions ejected material up to 15-30 m. |
| 27 Jun 2018 | Low white/blue degassing plume, dispersed towards the S. Strombolian explosions ejected material up to 5-25 m. |
| 28 Jun 2018 | Low white/blue degassing plume, dispersed towards the S. Strombolian explosions ejected material up to 5-25 m. |
| 29 Jun 2018 | White/blue plume up to 50 m. Strombolian explosions ejected material up to 25 m. |
| 30 Jun 2018 | Low white/blue degassing plume, dispersed towards the S. Strombolian explosions ejected material up to 15-25 m. |
| 01 Jul 2018 | White/blue plume up to 200 m towards the SW. Strombolian explosions ejected material up to 15-50 m. |
| 02 Jul 2018 | Low white/blue plume, dispersed towards the S. Strombolian explosions ejected material up to 15-25 m. |
| 03 Jul 2018 | Low white/blue plume, dispersed towards the S. Strombolian explosions ejected material up to 5-30 m. Increase in activity generated two lava flows, one 5 x 40 m flow towards the N, one 30 x 50 m towards the SE. |
| 04 Jul 2018 | Activity and lava flows decreasing. |
| 05 Jul 2018 | Strombolian explosions eject material up to 25 m. A lava flow 60 x 400 m continues. |
| 06 Jul 2018 | Strombolian explosions eject material up to 5-25 m. |
| 07 Jul 2018 | Lava flow from the Mackenney crater, 400 m long with an average width of 30 m, moving towards the N. |
| 08 Jul 2018 | Lava flow continues, now 500 m long. Strombolian explosions ejected material up to 30 m. Degassing plume to 30 m towards the SW. |
| 09 Jul 2018 | Strombolian explosions ejected material up to 5-25 m. Incandescence observed. |
| 10 Jul 2018 | Strombolian explosions ejected material up to 5-25 m. Incandescence observed. Lava flow continues towards the N. |
| 11 Jul 2018 | Strombolian explosions ejected material up to 25-50 m. Incandescence observed. Lava flow continues towards the N to ~350 m. |
| 12 Jul 2018 | Small Strombolian explosions continue. Lava flow continues towards the N to ~100 m. |
| 13 Jul 2018 | Small white plume dispersed to the S. Strombolian explosions ejected material up to 5-25 m. A Lava flow continues towards the N to 200 m. |
| 14 Jul 2018 | Incandescence observed. Strombolian explosions ejected material up to 15-40 m. A ~150 m lava flow moved towards the N. |
| 15 Jul 2018 | Lava flow on the N to NW flank down to ~400 m, accompanied by small avalanches. Strombolian explosions ejected material up to 15-75 m. |
| 16 Jul 2018 | Strombolian explosions ejected material up to 5-25 m. Incandescence observed. A lava flow descended towards the NW to ~400 m. |
| 17 Jul 2018 | Incandescence observed. Strombolian explosions eject material up to 25-50 m. A new lava flow moved towards the N. |
| 18 Jul 2018 | Degassing and Strombolian explosions produced material up to 25-30 m. A 500 m lava flow continued towards the N. |
| 19 Jul 2018 | Strombolian explosions ejected material to a low level. A 300 m lava flow descended towards the N. |
| 20 Jul 2018 | Low white/blue plume towards the S. Incandescence observed during the night/morning. Strombolian explosions ejected material up to 5-25 m. A 200 m lava flow moving towards Cerro Chino. |
| 21 Jul 2018 | White/blue plume displaced towards the W. Lava flow continues 300 m towards the N. |
| 22 Jul 2018 | White/blue plume dispersed towards the S. Strombolian explosions ejected material to a low level. A lava flow moved towards the NW to ~500 m. |
| 23 Jul 2018 | Strombolian explosions ejected material to a low level. A lava flow moved towards the NW to ~250 m. |
| 24 Jul 2018 | Low white/blue plume towards the S. Strombolian explosions ejected material up to 10-30 m. Lava flow to ~200 m towards Cerro Chino. |
| 25 Jul 2018 | White/blue plume up to 450 m, dispersed towards the S. Strombolian explosions ejected material to a low level. A 75 x 250 m lava flow moved towards the NW. |
| 26 Jul 2018 | White/blue plume up to 300 m, dispersed towards the W. Strombolian explosions ejected material to a low level. A lava flow moved towards the NW to 200 m. |
| 27 Jul 2018 | White plume up to 300 m, dispersed towards the W. Strombolian explosions ejected material to a low level. A lava flow moved towards the NW to 200 m. |
| 28 Jul 2018 | Moderate white/blue degassing plume dispersed towards the S. Strombolian explosions ejected material to a low level. A lava flow moved towards Cerro Chino to 150 m. |
| 29 Jul 2018 | White plume up to 300 m, dispersed towards the S. Strombolian explosions ejected material to a low level. Two lava flows moved towards the W to 50 and 150 m. |
| 30 Jul 2018 | Moderate white/blue degassing plume dispersed towards the S. Strombolian explosions ejected material to a low level. A lava flow moved towards Cerro Chino to 200 m. |
| 31 Jul 2018 | White plume up to 200 m, dispersed towards the S. Strombolian explosions ejected material to a low level. A lava flow moved 150 m towards the NW. |
| 01 Aug 2018 | White/blue plume up to 600 m, dispersed towards the W. Strombolian explosions ejected material to a low level. A lava flow moved towards Cerro Chino to 500 m. |
| 02 Aug 2018 | White/blue plume dispersed towards the N. Strombolian explosions ejected material to a low level. A lava flow moved towards Cerro Chino to 300 m. |
| 03 Aug 2018 | White/blue plume up to 50 m, dispersed towards the SW. Strombolian explosions ejected material to a low level. A lava flow moved towards Cerro Chino to 150 m. |
| 04 Aug 2018 | White plume dispersed towards the SE. Strombolian explosions ejected material up to 30 m. A lava flow moved towards the N to 300 m. |
| 05 Aug 2018 | Moderate white plume up to 100 m, dispersed towards the S. Strombolian explosions ejected material to a low level. A lava flow moved towards Cerro Chino to 300 m. |
| 06 Aug 2018 | White plume dispersed towards the SE. Strombolian explosions ejected material up to 30 m. Lava flow continues 300 m towards the N. |
| 07 Aug 2018 | Low white/blue plume dispersed towards the S. Strombolian explosions ejected material up to 10-50 m. Two lava flows to the NE to 200 and 400 m. |
| 08 Aug 2018 | Moderate white plume dispersed towards the S. Strombolian explosions ejected material to a low level. A lava flow moved towards Cerro Chino to 150 m. |
| 09 Aug 2018 | Moderate white/blue plume up to 250 m, dispersed towards the W. Strombolian explosions ejected material to a low level. A lava flow moved towards the W to 150 m. |
| 10 Aug 2018 | Moderate white/blue plume dispersed towards the S. Strombolian explosions ejected material to a low level. Two lava flows moved towards Cerro Chino to 75 and 300 m. |
| 11 Aug 2018 | Low white/blue plume, dispersed towards the S. Strombolian explosions ejected material up to 10-25 m. A lava flow moved towards Cerro Chino to 250 m. |
| 12 Aug 2018 | Moderate white/blue plume up to 500 m, dispersed towards the NW. Strombolian explosions ejected material to a low level. A lava flow moved towards Cerro Chino to 300 m. |
| 13 Aug 2018 | Small Strombolian explosions. Weak white/blue plume up to ~100 m. Lava flow ~300 m towards Cerro Chino. |
| 14 Aug 2018 | Strombolian explosions ejected material up to 25-30 m. Lava flow on the NW flank continues down to 300 m. |
| 15 Aug 2018 | Moderate white plume up to ~100 m, dispersed to the S. Strombolian explosions ejected material up to 5-20 m. Two lava flows moved towards Cerro Chino to 75 and 300 m. |
| 16 Aug 2018 | Low white/blue plume dispersed towards the S. Strombolian explosions ejected material low above the crater. 200 m lava flow on the N flank. |
| 17 Aug 2018 | Moderate white plume reached ~50 m and dispersed to the S. Two lava flows traveled towards Cerro Chino to ~75 to 300 m. |
| 18 Aug 2018 | Faint white/blue plume up to 300-400 m and dispersed to the SW. Strombolian explosions ejected material to a low height. One lava flow to the N to ~300 m. |
| 19 Aug 2018 | Moderate white/blue plume up to ~100 and 150 m and dispersed to the NW. Two lava flows active on the NW flank towards Cerro Chino to ~75 and 300 m. |
| 20 Aug 2018 | White plume up to 600 m, dispersed to the SW. Strombolian explosions ejected material up to 5-25 m. One lava flow to the N to ~300 m. |
| 21 Aug 2018 | White plume up to 600 m, dispersed to the W. One lava flow continues towards the N to ~300 m. |
| 22 Aug 2018 | Strombolian explosions ejected material to 25-30 m. The lava flow continues to 400 m on the N flank. |
| 23 Aug 2018 | White/blue moderate plume towards the S. Two lava flows traveled towards Cerro Chino to the NW. |
| 24 Aug 2018 | Strombolian explosions ejected material to a low height. Two lava flows traveled towards Cerro Chino to 200 and 300 m. |
| 25 Aug 2018 | Abundant degassing and explosions ejected material up to 30 m and deposited in the same crater. One 400 m lava flow on the N flank. |
| 26 Aug 2018 | Low white plume dispersing towards the S. Strombolian explosions ejected material to 5-30 m. One lava flow 350 m to the N. |
| 27 Aug 2018 | Slight increase of explosive activity, generating 3-5 explosions per hour. |
| 31 Aug 2018 | Degassing plume up to ~200 m, dispersed to the S. Strombolian explosions ejected material to a little above the crater. A lava flow moved towards the N to NW. |
| 01 Sep 2018 | White plume up to 800 m, dispersed towards the W. Strombolian explosions continue. A lava flow moved towards the N to 200 m. |
| 02 Sep 2018 | A 200-300 m lava flow was observed. |
| 03 Sep 2018 | Moderate white/blue plume up to 600 m, dispersed towards the NW. Incandescence was observed. A lava flow moved towards the NW to 200 m. |
| 04 Sep 2018 | White/blue plume up to 100 m, dispersed towards the W. Incandescence was observed. Two lava flows moved towards Cerro Chino. |
| 05 Sep 2018 | White/blue plume up to 800 m, dispersed towards the SW. Incandescence was observed. Two lava flows moved towards the NW to 100-200 m. |
| 06 Sep 2018 | Moderate white/blue plume dispersed towards the SW. Incandescence observed. Two lava flows moved towards the NW to 100-200 m. |
| 07 Sep 2018 | Moderate white/blue plume up to 50 m, dispersed towards the S. Incandescence observed. Two lava flows moved towards the NW to 200 m. |
| 08 Sep 2018 | Two lava flows observed from San Vicente. |
| 09 Sep 2018 | White/blue plume up to ~600 m towards the SW. Three lava flows 50, 150 and 300 m long. |
| 10 Sep 2018 | White/blue plume up to ~100 m, towards the N. Lava flow 300 m towards the NW. |
| 11 Sep 2018 | White/blue plume up to ~600 m, towards the N. Two lava flows ~150 and 200 m long towards Cerro Chino. |
| 12 Sep 2018 | White/blue plume up to ~300 m towards the S. Lava flow ~300 m towards Cerro Chino. Strombolian explosions ejected material up to 10-40 m. |
| 13 Sep 2018 | White/blue plume up to 50 m towards the N. During night/early morning incandescence was observed. Lava flow 200-300 m towards the NW-W. |
| 14 Sep 2018 | Strombolian explosions ejected material up to 5-25 m. Three lava flows to 150, 250, and 300 m towards Cerro Chino. |
| 15 Sep 2018 | Fumarole gases up to 500 m due to low winds. Three lava flows to 150, 250, and 300 m on the W flank. Strombolian explosions ejected material to 25 m. |
| 16 Sep 2018 | Fumarole degassing up to 300-400 m. Lava flow in the direction of Cerro Chino, 200 m in length. |
| 17 Sep 2018 | White/blue fumarole plume towards the S. Incandescence observed at night. Lava flow to 200 m towards the NW. |
| 18 Sep 2018 | Moderate blue/white degassing plume to low altitude. Strombolian explosions ejected material up to 5-25 m. Lava flow 200 m towards Cerro Chino. |
| 19 Sep 2018 | Moderate white/blue plume up to 50 m, dispersed towards the SW. Strombolian explosions ejected material up to 10-25 m. A lava flow moved towards the W. |
| 20 Sep 2018 | Degassing plume up to 500-600 m towards the W. Two lava flows towards Cerro Chino on NW flank down to 150 and 300 m. Strombolian explosions ejected material up to 15-30 m. |
| 21 Sep 2018 | Incandescence observed at the crater at night/early morning. Four lava flows down to 40, 150, and 200 m to the NW. |
| 22 Sep 2018 | Strombolian explosions ejected material up to 25-25 m. A lava flow moved towards Cerro Chino. |
| 23 Sep 2018 | Strombolian explosions ejected material up to 25-30 m. A lava flow moved towards Cerro Chino to 250-300 m. |
| 24 Sep 2018 | White/blue plume up to 100 m, dispersed towards the S. Two lava flows moved towards Cerro Chino to 75 and 150 m. |
| 25 Sep 2018 | Strombolian explosions ejected material up to 5-25 m. A lava flow moved 100-200 m to the NW. |
| 26 Sep 2018 | White plume dispersed towards the S. Incandescence observed. A lava flow moved towards Cerro Chino. |
| 27 Sep 2018 | Strombolian explosions ejected material up to 20 m. Two lava flows moved towards Cerro Chino to 250 and 300 m. |
| 28 Sep 2018 | A lava flow continued towards Cerro Chino. Incandescence was observed. |
| 28 Sep 2018 | Incandescence was observed. Strombolian activity continued. A lava flow moved towards Cerro Chino. |
Information Contacts: Instituto Nacional de Sismologia, Vulcanologia, Meteorologia e Hydrologia (INSIVUMEH), Unit of Volcanology, Geologic Department of Investigation and Services, 7a Av. 14-57, Zona 13, Guatemala City, Guatemala (URL: http://www.insivumeh.gob.gt/); Coordinadora Nacional para la Reducción de Desastres (CONRED), Av. Hincapié 21-72, Zona 13, Guatemala City, Guatemala (URL: http://conred.gob.gt/www/index.php); Hawai'i Institute of Geophysics and Planetology (HIGP) - MODVOLC Thermal Alerts System, School of Ocean and Earth Science and Technology (SOEST), Univ. of Hawai'i, 2525 Correa Road, Honolulu, HI 96822, USA (URL: http://modis.higp.hawaii.edu/); Sentinel Hub Playground (URL: https://www.sentinel-hub.com/explore/sentinel-playground); MIROVA (Middle InfraRed Observation of Volcanic Activity), a collaborative project between the Universities of Turin and Florence (Italy) supported by the Centre for Volcanic Risk of the Italian Civil Protection Department (URL: http://www.mirovaweb.it/).
Continuous activity from the cone in Mackenney crater; daily lava flows on the NW flank during October 2018-January 2019
Extensive lava flows, bomb-laden Strombolian explosions, and ash plumes emerging from MacKenney crater have characterized the persistent activity at Pacaya since 1961. The latest eruptive episode began with intermittent ash plumes and incandescence in June 2015; the growth of a new pyroclastic cone inside the summit crater was confirmed in mid-December 2015. The pyroclastic cone has continued to grow, rising above the crater rim in late 2017 and sending numerous flows down the flanks of the crater throughout 2018 (BGVN 43:11). Similar activity continued during October 2018-January 2019, covered in this report, with information provided primarily by Guatemala's Instituto Nacional de Sismologia, Vulcanologia, Meteorologia e Hydrologia (INSIVUMEH).
There were few variations in the eruptive activity at Pacaya during October 2018-January 2019. Virtually constant Strombolian activity from the summit of the pyroclastic cone within Mackenney crater produced ejecta that rose 5-30 m daily. Periods of increased activity occasionally increased the height of the ejecta to 50 m. Lava flows descended the NW flank of Mackenney cone towards Cerro Chino crater, usually one or two a day, sometimes three or four. They travelled 50-300 m down the flank; the longest reached 600 m in mid-October and 500 m at the end of January. Steam and gas plumes persisted from the summit; a single VAAC report mentioned dilute ash in mid-October. Plumes generally rose a few hundred meters above the summit, occasionally reaching 700-800 m. Incandescent avalanche blocks at the heads of the flows were sometimes as large as a meter in diameter and traveled far down the flanks.
Constant Strombolian activity during October 2018 from the pyroclastic cone within Mackenney crater was ejected up to 30 m above the summit of the cone throughout the month, with occasional more intense episodes rising 50 m. Lava flows were reported daily by INSIVUMEH on the NW flank from 50 to 300 m long. White and blue gas-and-steam emissions generally rose a few hundred meters from the summit of the pyroclastic cone and usually drifted S or N. The highest rose 800 m on 26 and 27 October. In a special report issued late on 12 October INSIVUMEH noted that seismicity had increased during the day; Strombolian explosions also increased and ejected material 25-50 m above the summit, producing block avalanches in the vicinity of the flows (figure 103). The cone within Mackenney crater continued to grow, reaching 75 m above the rim and nearly filling the crater at its base. According to the Washington VAAC, on 14 October a pilot reported minor ash emissions moving W at an estimated 650 m above the summit. Multi-spectral imagery showed a faint ash plume moving W at 3.4 km altitude, and a well-defined hotspot was seen in short-wave infrared imagery.
Similar activity persisted throughout November 2018 (figures 104 and 105). The Strombolian activity usually rose 5-30 m high; on 24 November INSIVUMEH reported ejecta 75 m high and the presence of four lava flows on the NW flank that traveled distances ranging from 50 to 200 m. Steam-and-gas emissions rose no more than 500 m above the summit. On 24 and 28 November incandescent avalanche blocks were observed at the fronts of the lava flows.
During December 2018, continuous Strombolian activity was observed 25 m high. Incandescent avalanche blocks were noted at the fronts of the lava flows more frequently than in previous months. One to three lava flows extending 50-300 m down the NW flank towards Cerro Chino were reported every day that the flanks were visible (figure 106). Late on 13 December INSIVUMEH released a special bulletin noting that explosions were heard as far as 8 km from Mackenney crater, and Strombolian activity rose 25-50 m. Constant tremor activity had been produced from the ongoing lava flows descending the flank; the incandescent avalanche blocks up to 1 m in diameter were falling from the front of the flows. By the end of December, the growing pyroclastic cone had filled the inside of Mackenney crater, reaching 75-100 m above the crater rim. In a special information report on 28 December, INSIVUMEH noted that changes in the eruptive patterns included an increase in seismic tremor along with more persistent and higher energy Strombolian activity from the active cone, which frequently sent material outside of the crater onto the flanks.
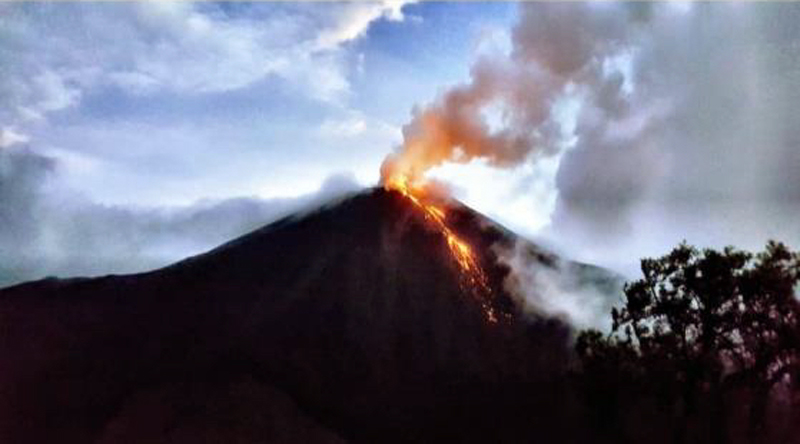 |
Figure 106. Lava flows traveled down the NW flank of Pacaya on 7 December 2018. Courtesy of INSIVUMEH (Informe mensual de la actividad volcanica, diciembre 2018, Volcan de Pacaya). |
There were no significant changes in activity during January 2019. Constant Strombolian activity rose 5-30 m above the summit; INSIVUMEH reported the height at 50 m on 7 January. Large incandescent avalanche blocks were noted at the front of the lava flows several times; one or two flows daily reached lengths of 100-300 m. The flow reported on 29 January reached 500 m, traveling down the NW flank towards Cerro Chino. Steam plumes, sometimes with bluish gas, rose generally to around 100 m above the summit, occasionally higher. Growth and destruction of the pyroclastic cone inside Mackenney crater continued as it had for the previous several months. The persistent Strombolian and lava flow activity was responsible for a strong thermal signature recorded in satellite data and plotted by the MIROVA project during the period (figure 107).
Information Contacts: Instituto Nacional de Sismologia, Vulcanologia, Meteorologia e Hydrologia (INSIVUMEH), Unit of Volcanology, Geologic Department of Investigation and Services, 7a Av. 14-57, Zona 13, Guatemala City, Guatemala (URL: http://www.insivumeh.gob.gt/); Coordinadora Nacional para la Reducción de Desastres (CONRED), Av. Hincapié 21-72, Zona 13, Guatemala City, Guatemala (URL: http://conred.gob.gt/www/index.php); MIROVA (Middle InfraRed Observation of Volcanic Activity), a collaborative project between the Universities of Turin and Florence (Italy) supported by the Centre for Volcanic Risk of the Italian Civil Protection Department (URL: http://www.mirovaweb.it/); Carlos Barrios (Twitter: @shekano, URL: https://twitter.com/shekano).
Lava flows and Strombolian explosions continued during February-July 2019
Pacaya is one of the most active volcanoes in Guatemala, with activity largely consisting of frequent lava flows and Strombolian activity at the Mackenney crater. This report summarizes continued activity during February through July 2019 based on reports by Guatemala's Instituto Nacional de Sismologia, Vulcanologia, Meteorologia e Hydrologia (INSIVUMEH) and Sistema de la Coordinadora Nacional para la Reducción de Desastres (CONRED), visiting scientists, and satellite data.
At the beginning of February activity included Strombolian explosions ejecting material up to 5 to 30 m above the Mackenney crater and a degassing plume up to 300 m. Multiple lava flows were observed throughout the month on the N, NW, and W flanks, reaching 350 m from the crater and resulting in avalanches from the flow fronts. Strombolian activity continued with sporadic to continuous explosions ejecting material 5-75 m above the Mackenney crater. Degassing produced plumes up to 300 m above the crater, and incandescence from the crater and lava flows were seen at night. Daniel Sturgess of Bristol University observed activity on the 24th, noting a 70-m-long lava flow with individual blocks from the front of the flow rolling down the flanks (figure 108). He reported that mild Strombolian explosions occurred every 10-20 minutes and ejected blocks, up to approximately 4 m in diameter, as high as 5-30 m above the crater and towards the northern flank.
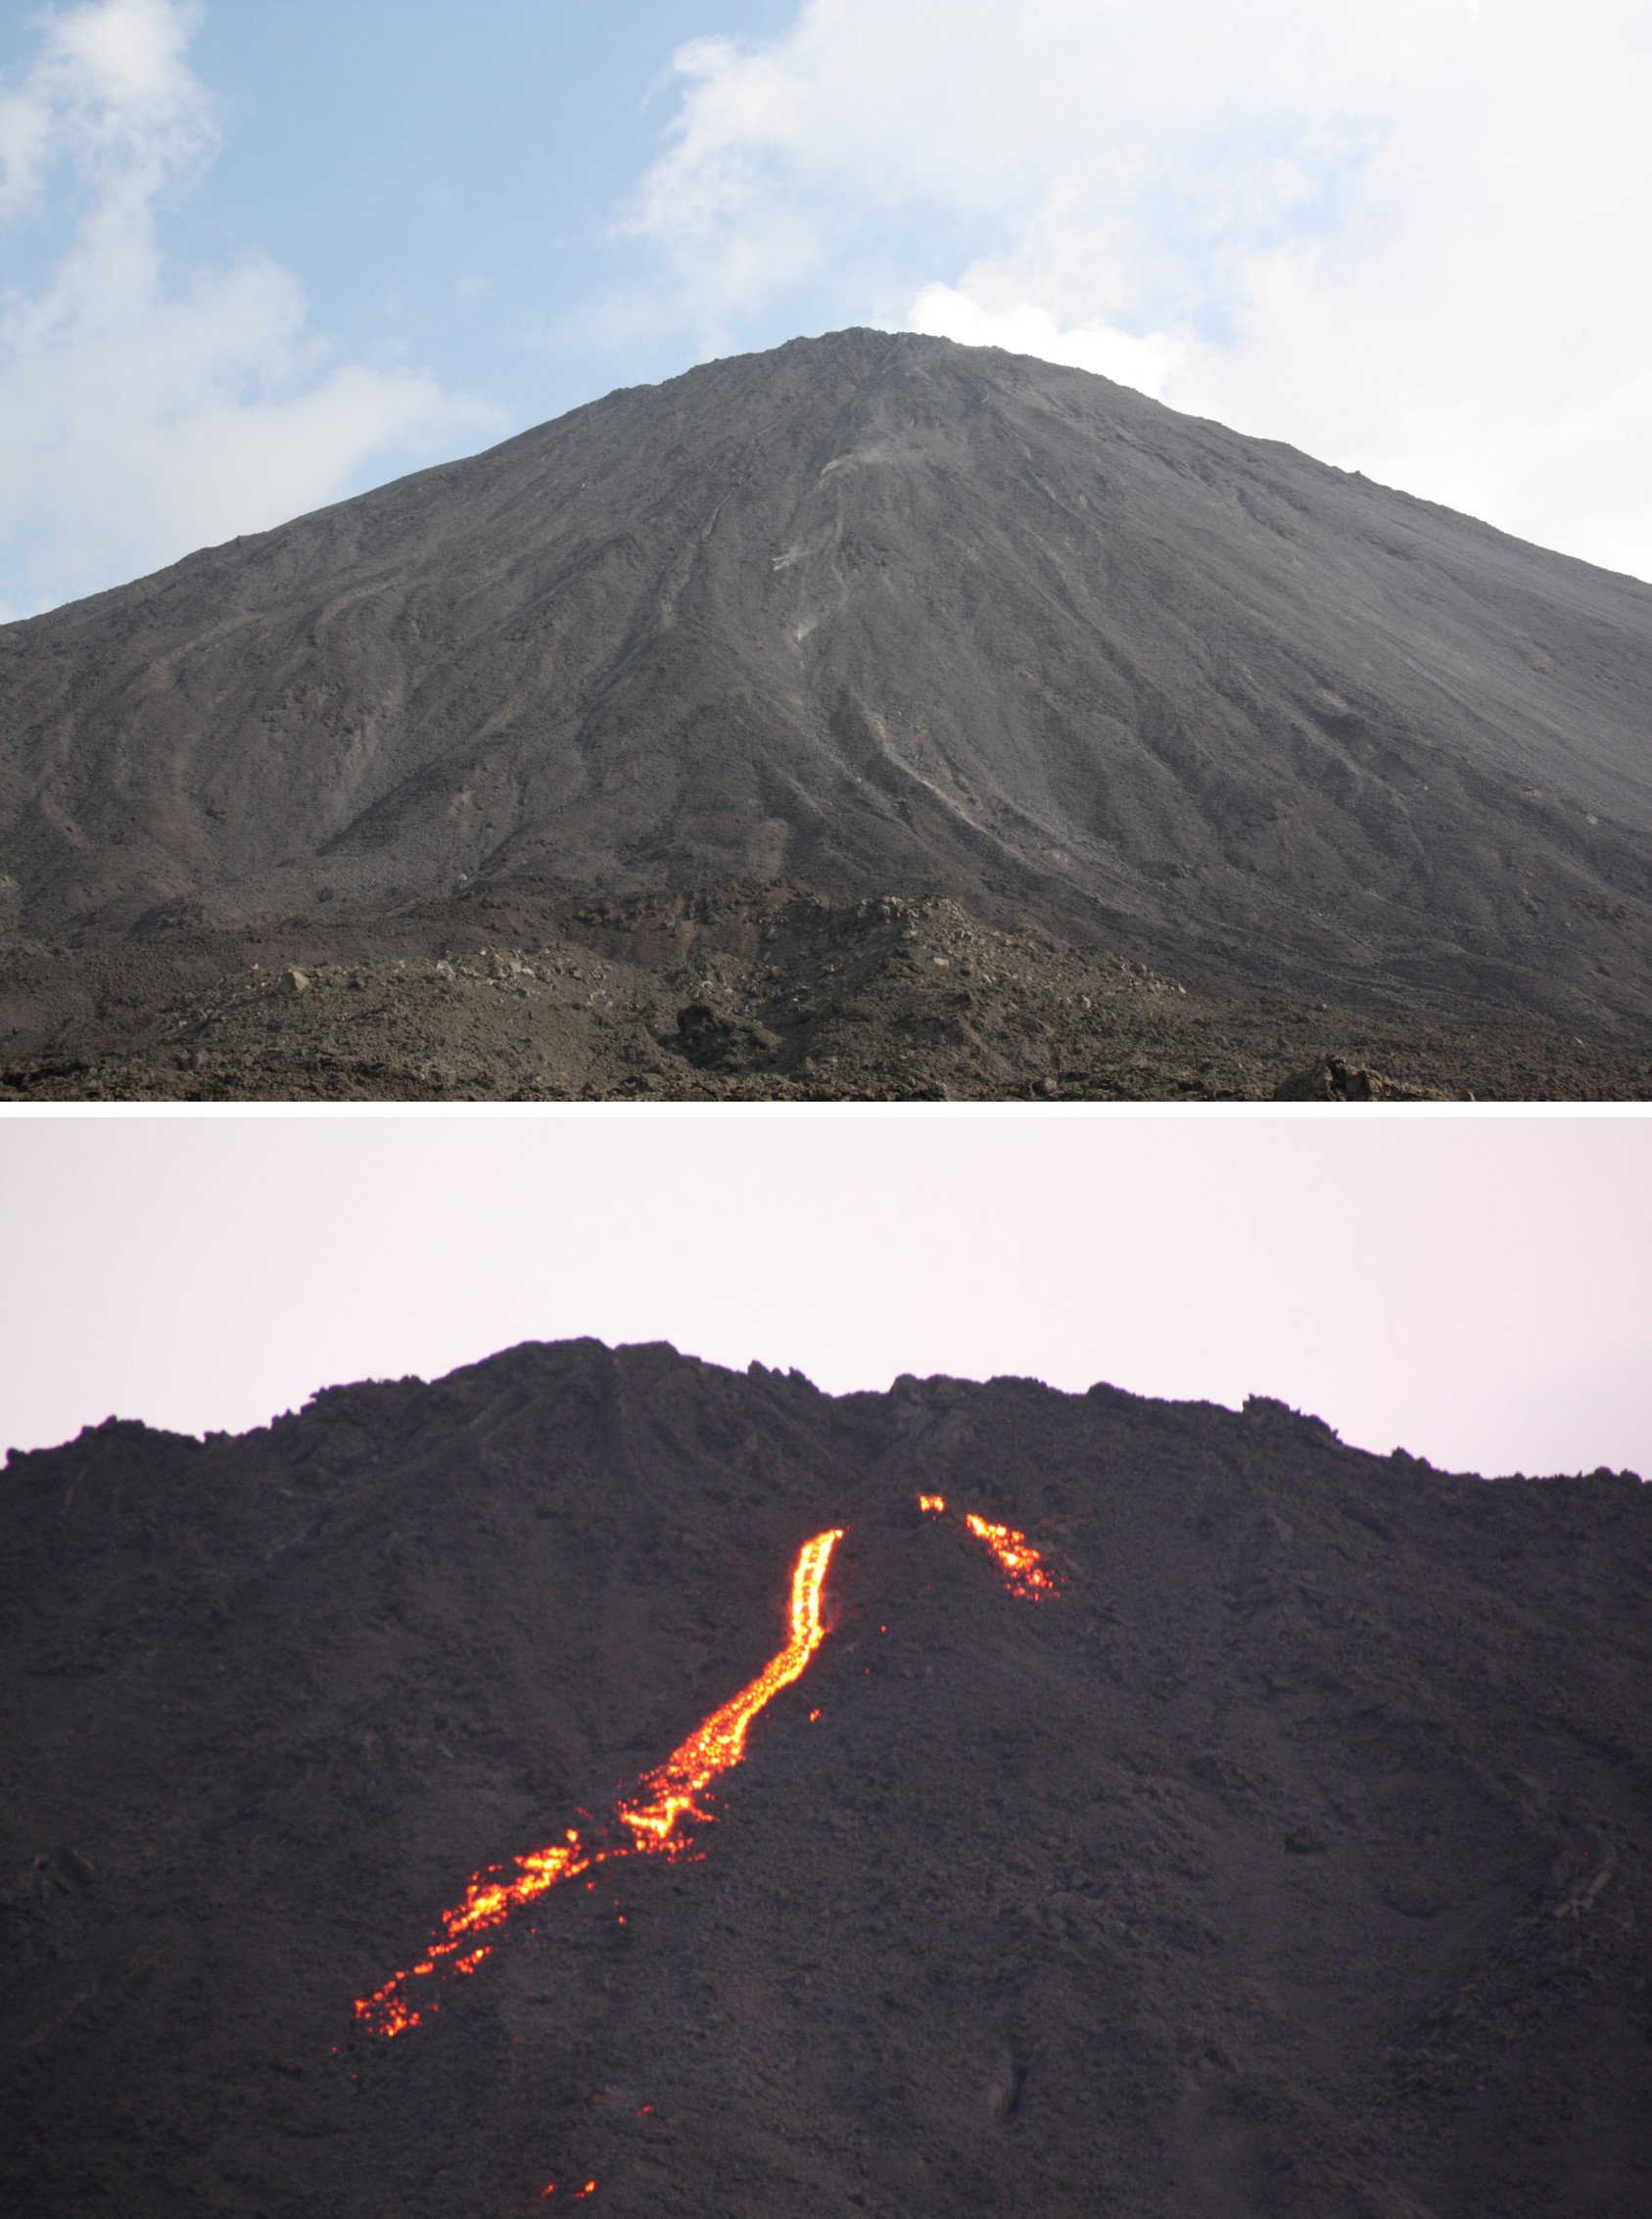 |
Figure 108. An active lava flow on the NW flank of Pacaya on 24 February 2019 with incandescence visible in lower light conditions. Courtesy of Daniel Sturgess, University of Bristol. |
Similar activity continued through March with multiple lava flows reaching a maximum of 200 m N and NW, and avalanches descending from the flow fronts. Ongoing Strombolian explosions expelled material up to 75 m above the Mackenney crater. Degassing produced a white-blue plume to a maximum of 900 m above the crater (figure 109) and incandescence was noted some nights.
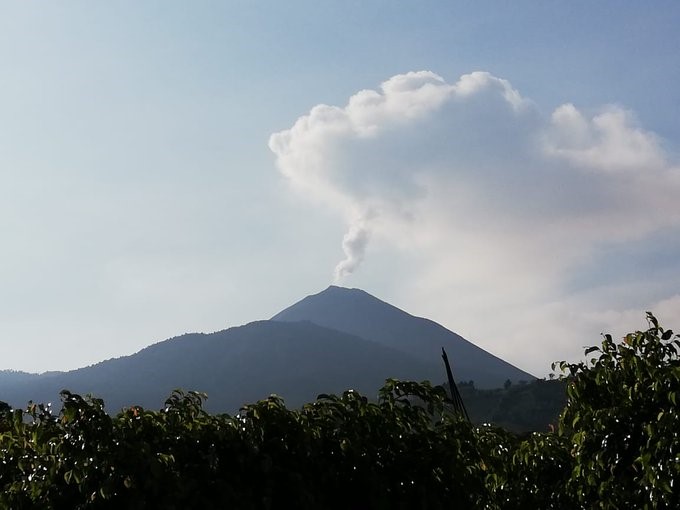 |
Figure 109. A degassing plume at Pacaya reaching 350 m above the crater and dispersing to the S on 19 March 2019. Courtesy of CONRED. |
During April lava flows continued on the N and NW flanks, reaching a maximum length of 300 m, with avalanches forming from the flow fronts. Degassing formed plumes up to 600 m above the crater that dispersed with various wind directions. Strombolian activity continued with explosions ejecting material up to 40 m above the crater. On the 2nd and 3rd weak rumbles were heard at distances of 4-5 km. Similar activity continued through May with lava flows reaching 300 m to the N, degassing producing plumes up to 600 m above the crater, and Strombolian explosions ejecting material up to 15 m above the crater.
Lava flows continued out to 300 m in length to the N and NW during June (figures 110 and 111). Strombolian activity ejected material up to 30 m above the crater and degassing resulted in plumes that reached 300 m. During July there were multiple active lava flows that reached a maximum of 300 m in length on the N and NW flanks (figure 112). Avalanches generated by the collapse of material at the front of the lava flows were accompanied by explosions ejecting material up to 30 m above the crater.
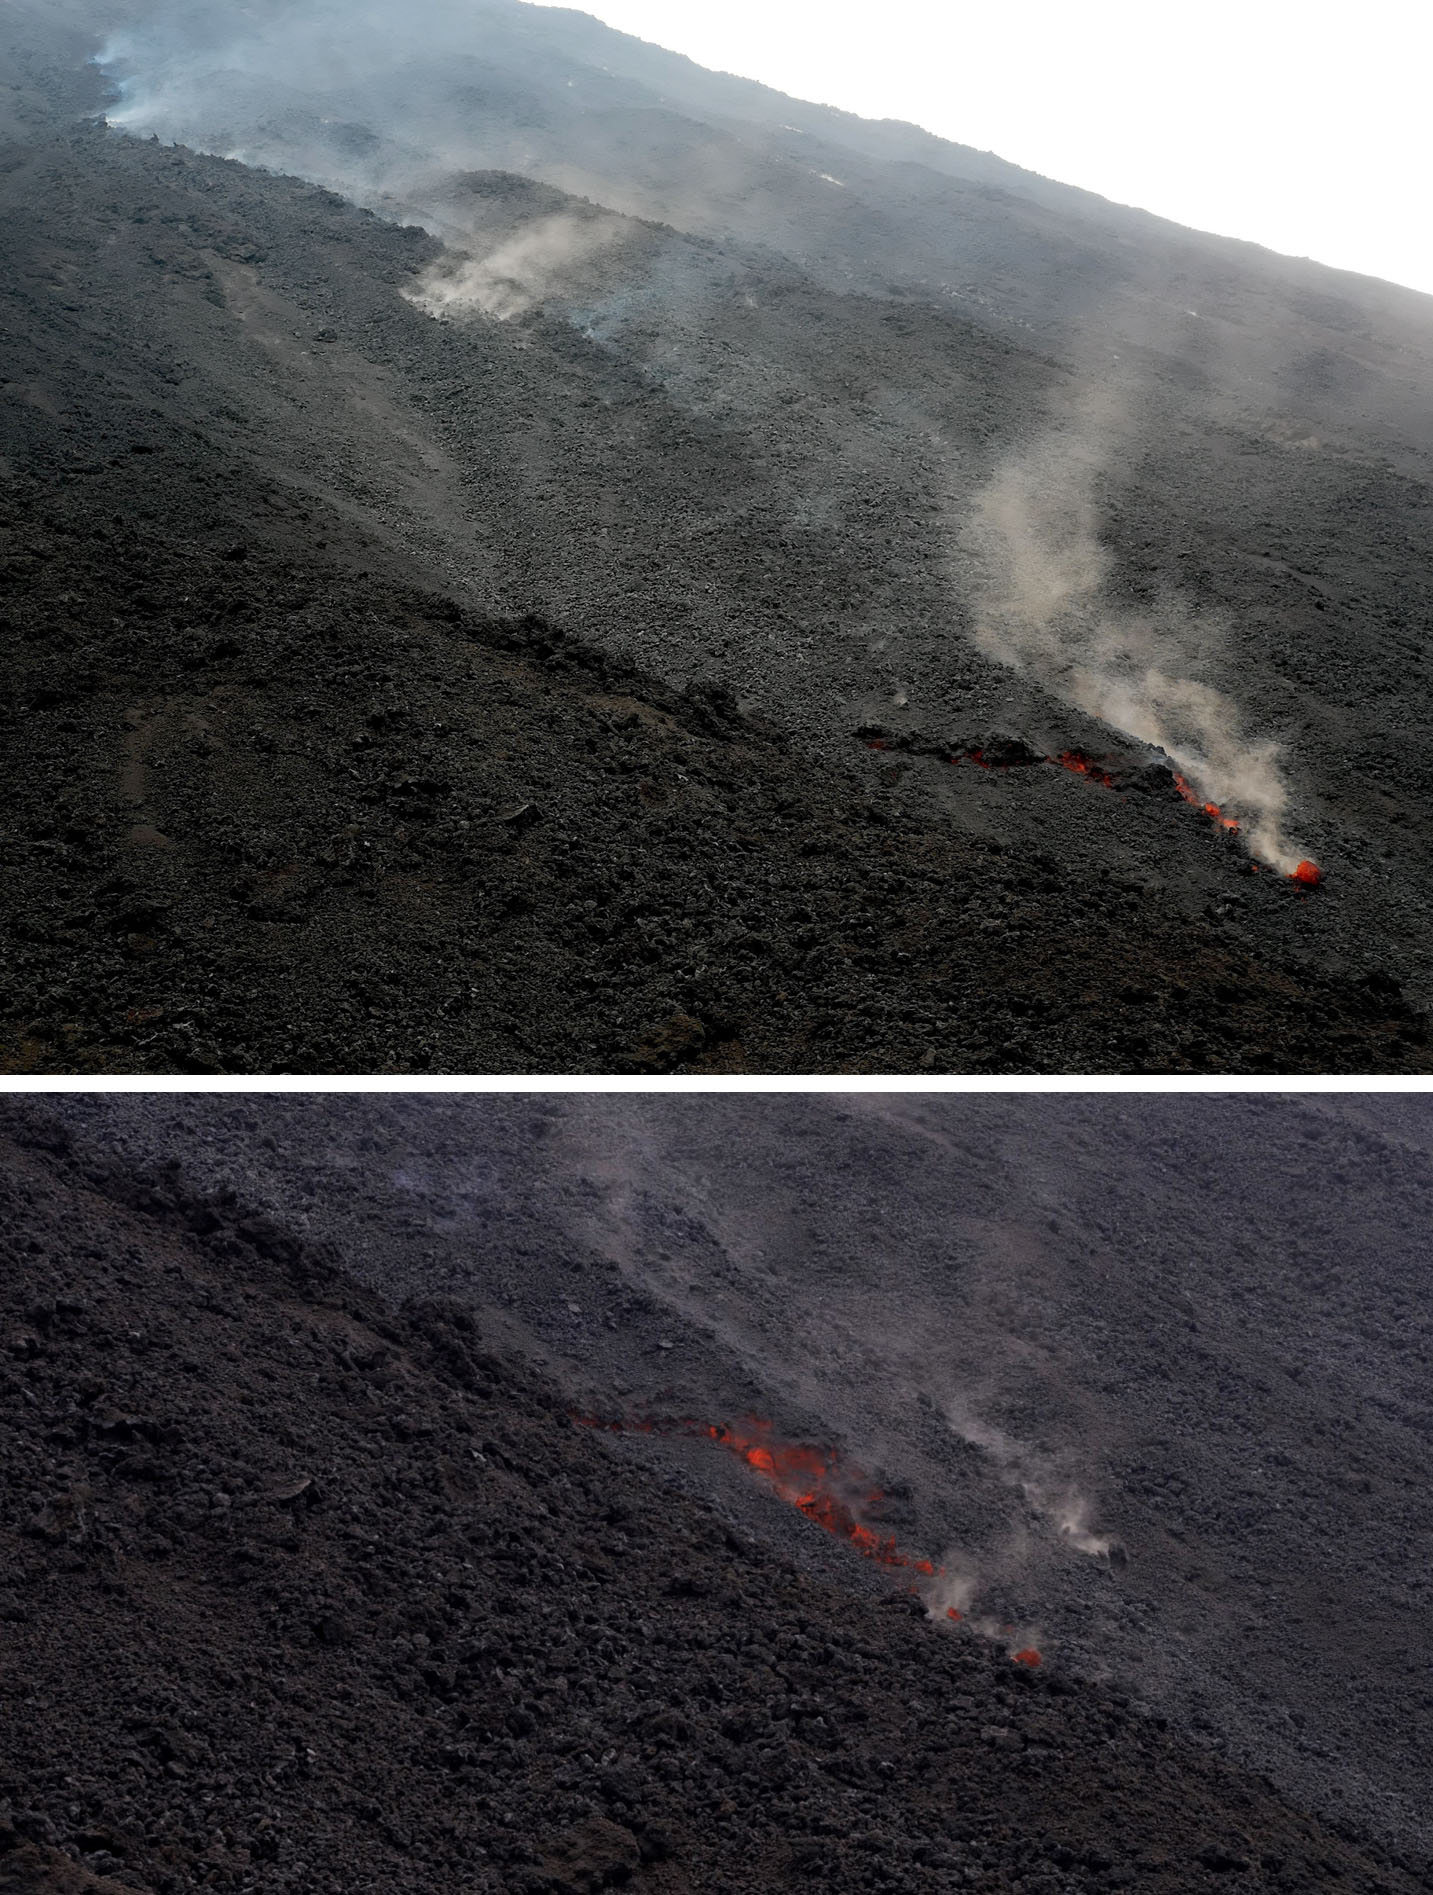 |
Figure 110. An active lava flow on Pacaya on 9 June 2019 with incandescent blocks rolling down the flank from the flow front. Courtesy of Paul Wallace, University of Liverpool. |
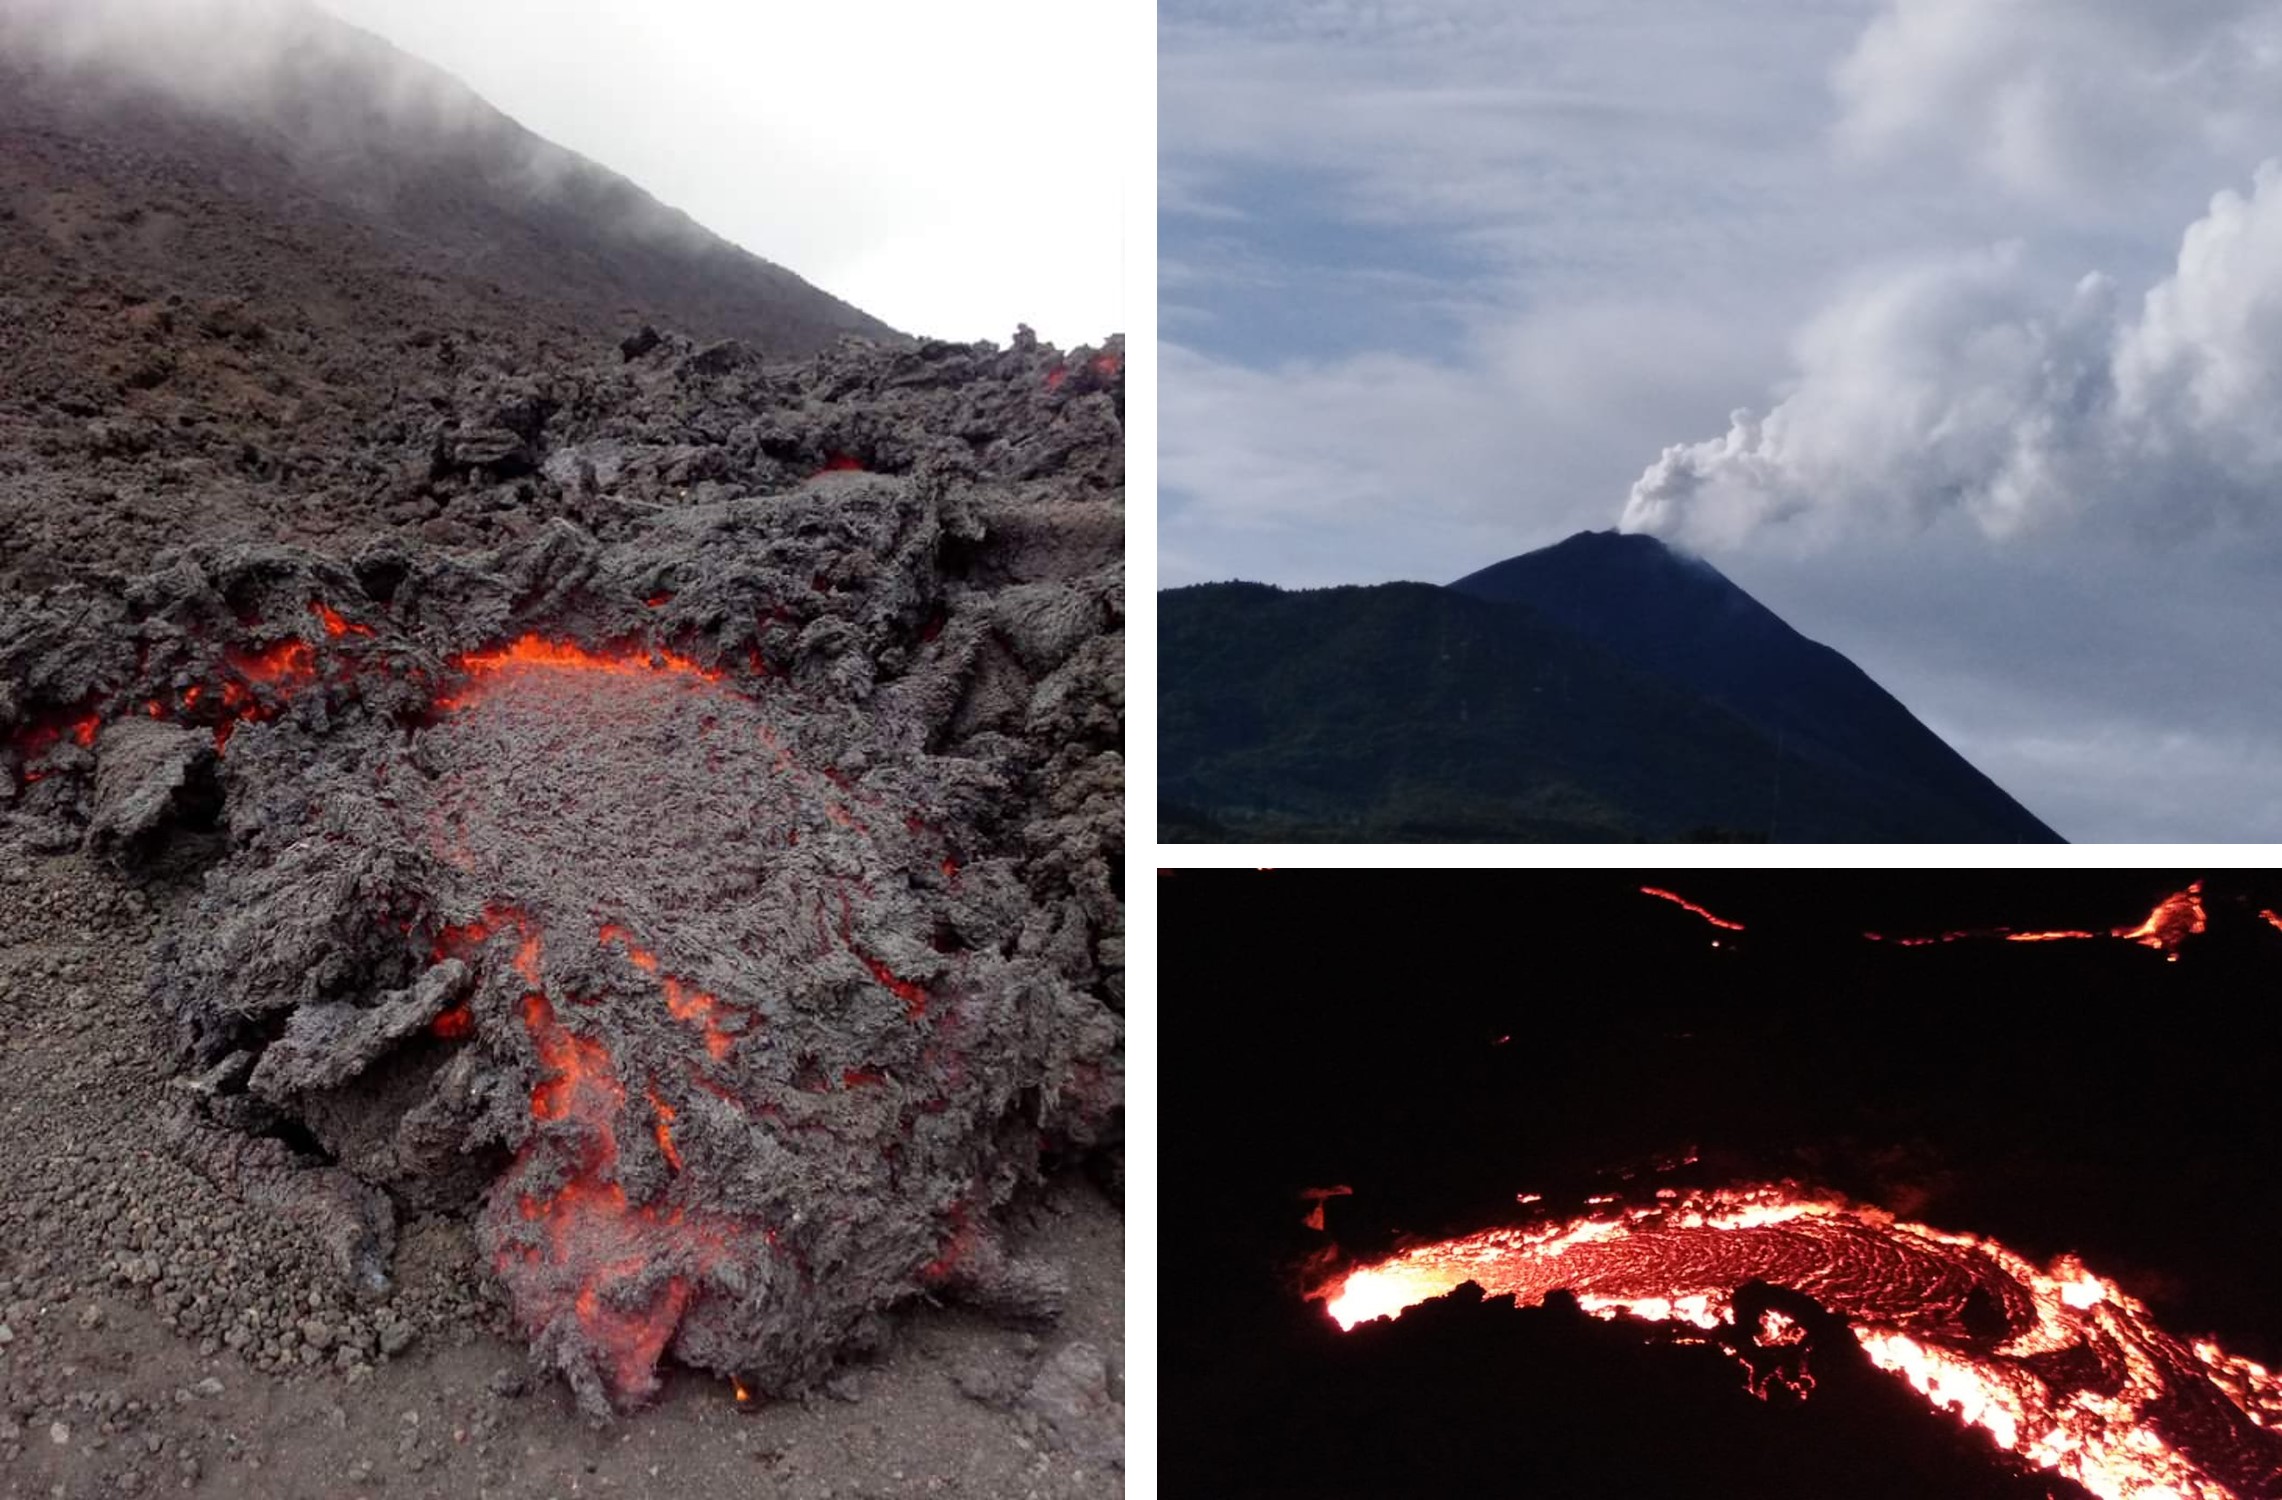 |
Figure 111. Activity at Pacaya on 22 June 2019 with a degassing plume dispersed to the W and a 300-m-long lava flow. Photos by Miguel Morales, courtesy of CONRED. |
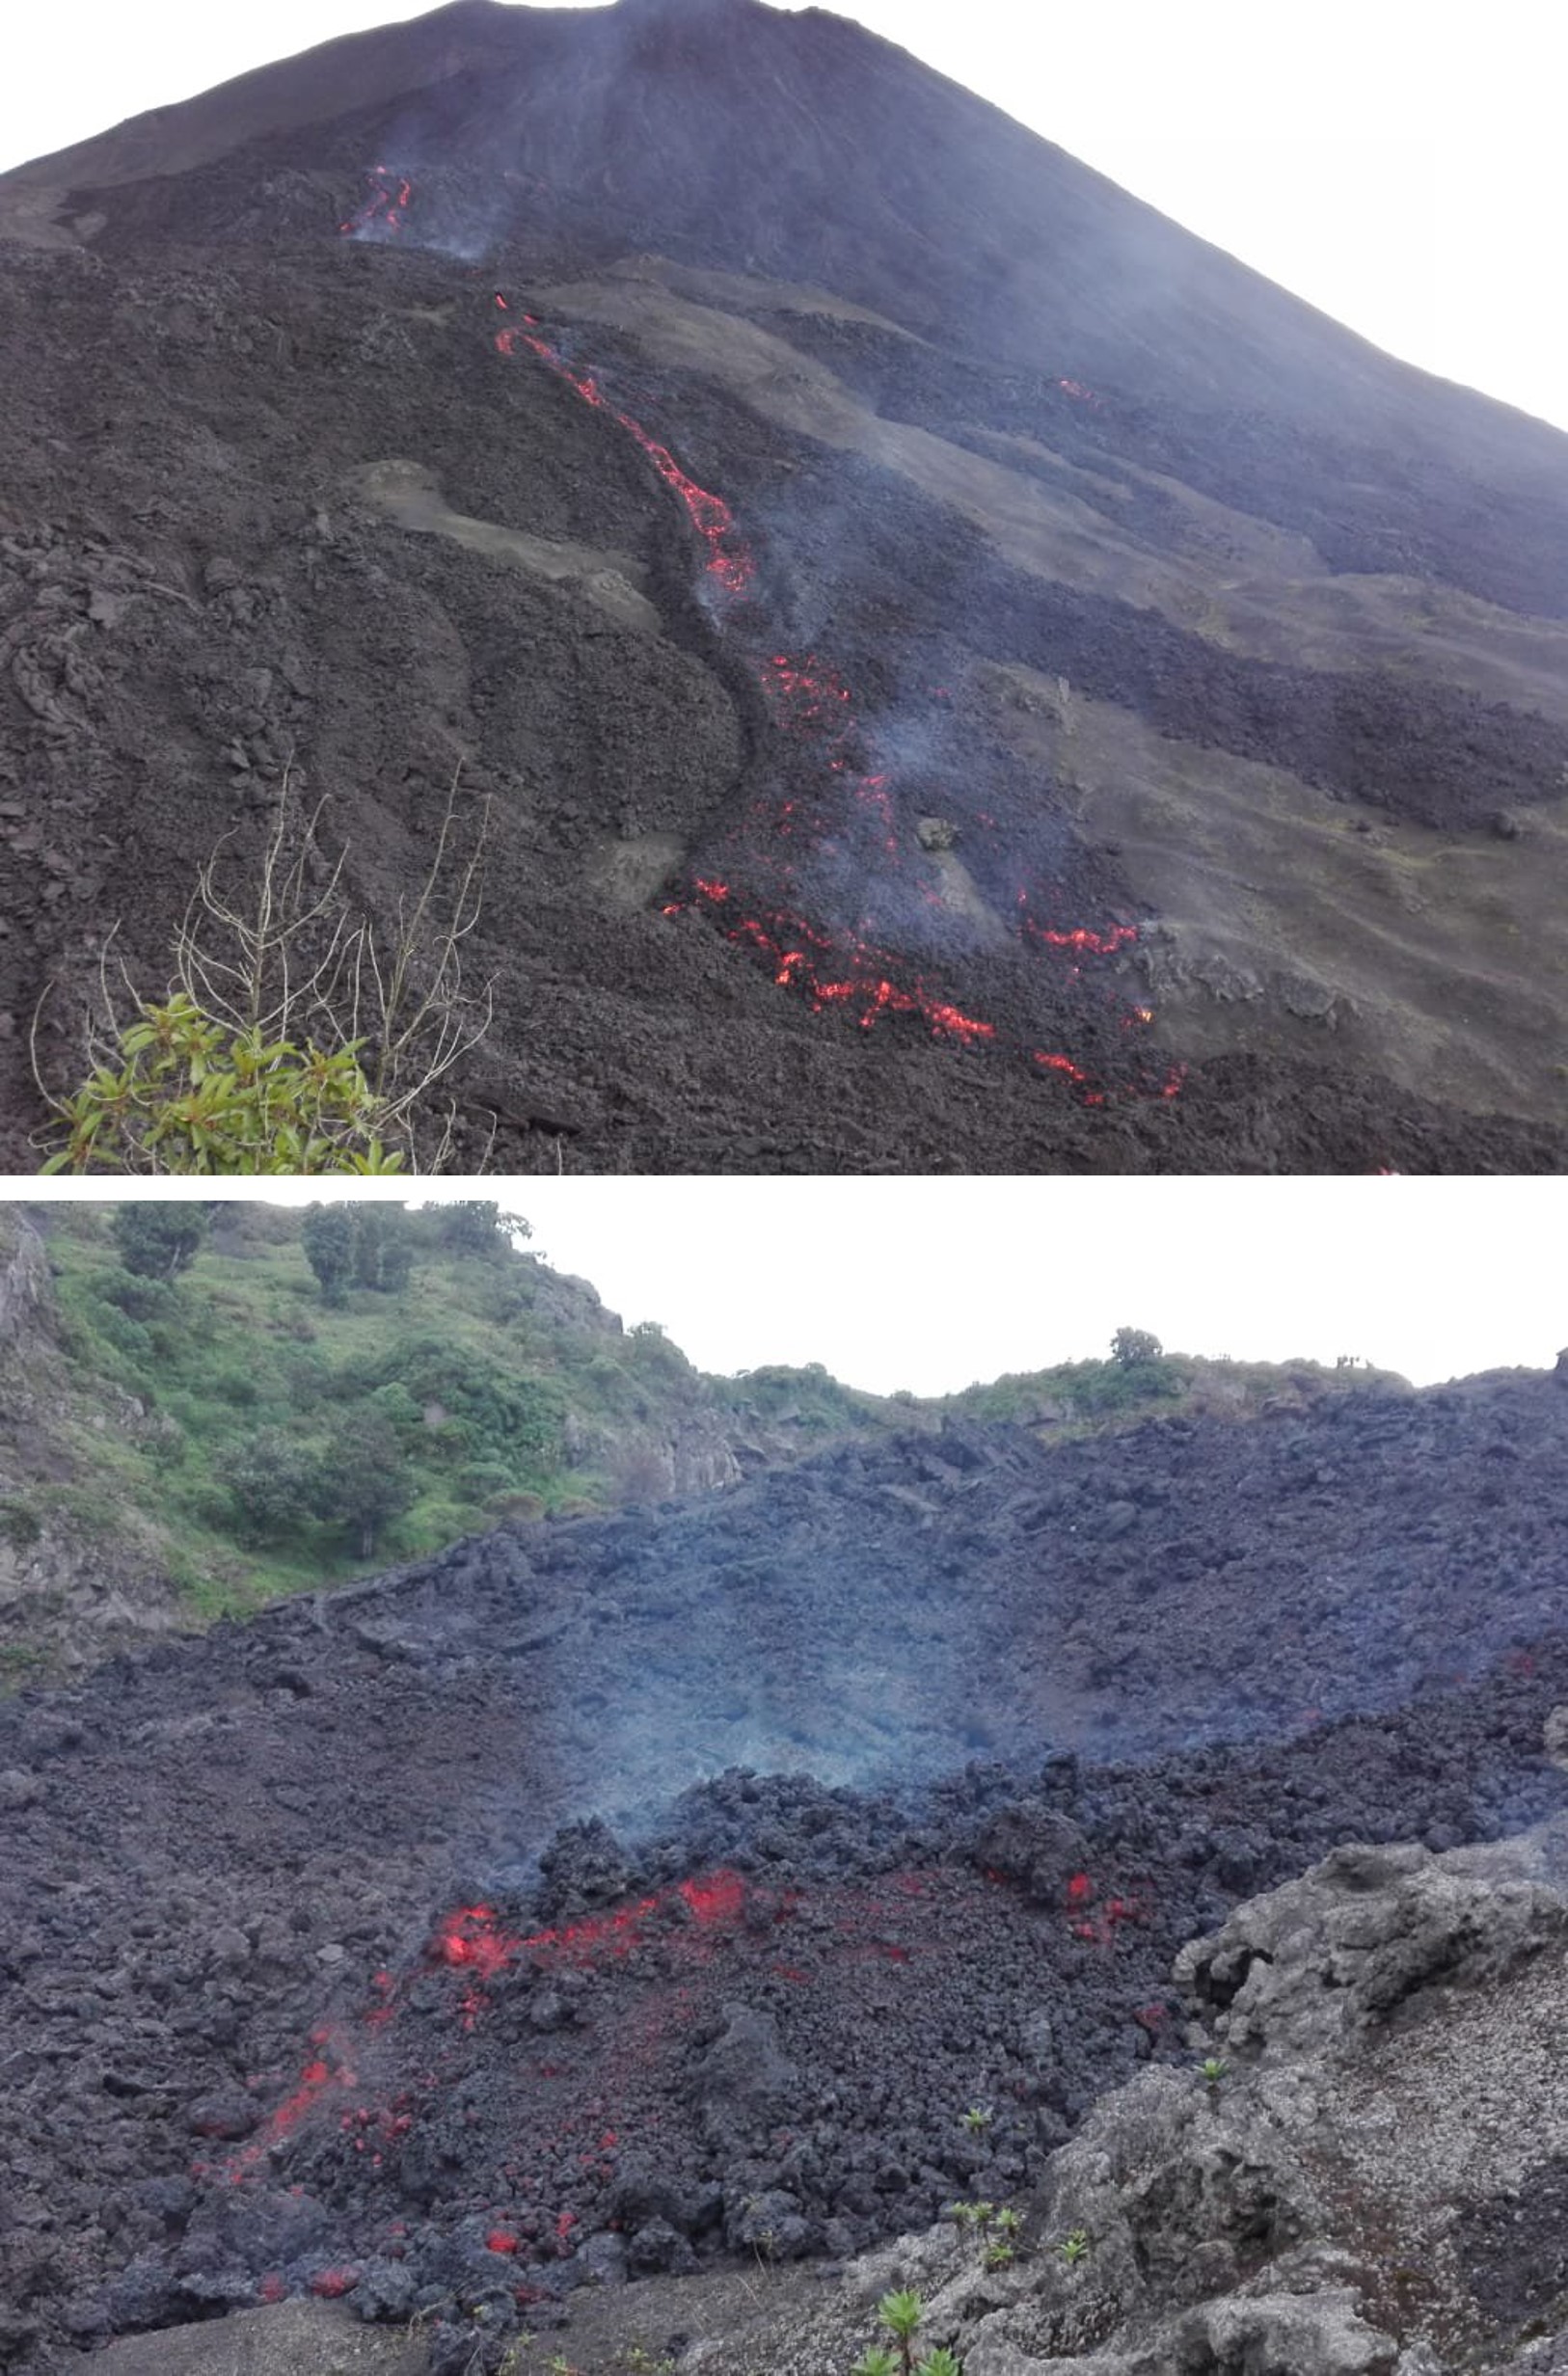 |
Figure 112. Two lava flows were active to the N and NW at Pacaya on 20 July 2019. Photos courtesy of CONRED. |
During February through July multiple lava flows and crater activity were detected in Sentinel-2 satellite thermal images (figures 113 and 114) and relatively constant thermal energy was detected by the MIROVA system with a slight decrease in the energy and frequency of anomalies during June (figure 115). The thermal anomalies detected by the MODVOLC system for each month from February through July spanned 6-30, with six during June and 30 during April.
Information Contacts: Instituto Nacional de Sismologia, Vulcanologia, Meteorologia e Hydrologia (INSIVUMEH), Unit of Volcanology, Geologic Department of Investigation and Services, 7a Av. 14-57, Zona 13, Guatemala City, Guatemala (URL: http://www.insivumeh.gob.gt/); Coordinadora Nacional para la Reducción de Desastres (CONRED), Av. Hincapié 21-72, Zona 13, Guatemala City, Guatemala (URL: http://conred.gob.gt/www/index.php); MIROVA (Middle InfraRed Observation of Volcanic Activity), a collaborative project between the Universities of Turin and Florence (Italy) supported by the Centre for Volcanic Risk of the Italian Civil Protection Department (URL: http://www.mirovaweb.it/); Hawai'i Institute of Geophysics and Planetology (HIGP) - MODVOLC Thermal Alerts System, School of Ocean and Earth Science and Technology (SOEST), Univ. of Hawai'i, 2525 Correa Road, Honolulu, HI 96822, USA (URL: http://modis.higp.hawaii.edu/); Daniel Sturgess, School of Earth Sciences, University of Bristol, Wills Memorial Building, Queens Road, Bristol BS8 1RJ, United Kingdom (URL: http://www.bristol.ac.uk/earthsciences/); Paul Wallace, Department of Earth, Ocean and Ecological Sciences, University of Liverpool, 4 Brownlow Street, Liverpool L69 3GP, United Kingdom (URL: https://www.liverpool.ac.uk/environmental-sciences/staff/paul-wallace/); Sentinel Hub Playground (URL: https://www.sentinel-hub.com/explore/sentinel-playground).
Continuous explosions, small cone, and lava flows during August 2019-January 2020
Pacaya is a highly active basaltic volcano located in Guatemala with volcanism consisting of frequent lava flows and Strombolian explosions originating in the Mackenney crater. The previous report summarizes volcanism that included multiple lava flows, Strombolian activity, avalanches, and gas-and-steam emissions (BGVN 44:08), all of which continue through this reporting period of August 2019 to January 2020. The primary source of information comes from reports by the Instituto Nacional de Sismologia, Vulcanologia, Meteorologia e Hydrologia (INSIVUMEH) in Guatemala and various satellite data.
Strombolian explosions occurred consistently throughout this reporting period. During the month of August 2019, explosions ejected material up to 30 m above the Mackenney crater. These explosions deposited material that contributed to the formation of a small cone on the NW flank of the Mackenney crater. White and occasionally blue gas-and-steam plumes rose up to 600 m above the crater drifting S and W. Multiple incandescent lava flows were observed traveling down the N and NW flanks, measuring up to 400 m long. Small to moderate avalanches were generated at the front of the lava flows, including incandescent blocks that measured up to 1 m in diameter. Occasionally incandescence was observed at night from the Mackenney crater.
In September 2019 seismicity was elevated compared to the previous month, registering a maximum of 8,000 RSAM (Realtime Seismic Amplitude Measurement) units. White and occasionally blue gas-and-steam plumes that rose up to 1 km above the crater drifted generally S as far as 3 km from the crater. Strombolian explosions continued, ejecting material up to 100 m above the crater rim. At night and during the early morning, crater incandescence was observed. Incandescent lava flows traveled as much as 600 m down the N and NW flanks toward the Cerro Chino crater (figure 116). On 21 September two lava flows descended the SW flank. Constant avalanches with incandescent blocks measuring 1 m in diameter occurred from the front of many of these lava flows.
Weak explosions continued through October 2019, ejecting material up to 75 m above the crater and building a small cone within the crater. White and occasionally blue gas-and-steam plumes rose 400-800 m above the crater, drifting W and NW and extending up to 4 km from the crater during the week of 26 October-1 November. Lava flows measuring up to 250 m long, originating from the Mackenney crater were descending the N and NW flanks (figure 117). Avalanches carrying large blocks 1 m in diameter commonly occurred at the front of these lava flows.
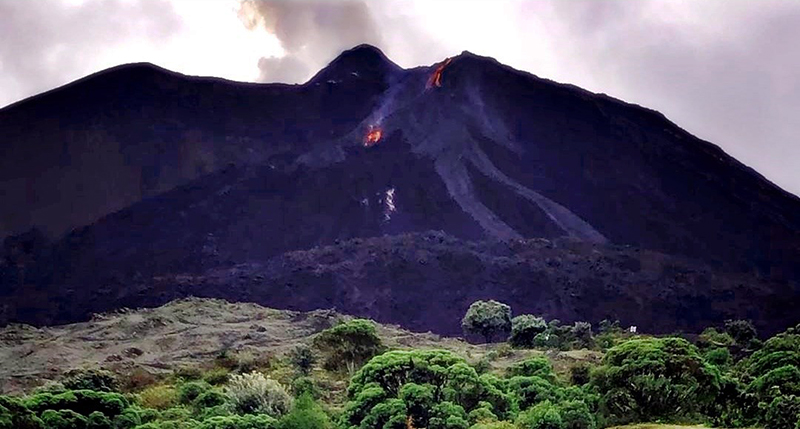 |
Figure 117. Photo of lava flows traveling down the flanks of Pacaya taken between 28 September 2019 and 4 October. Courtesy of INSIVUMEH (28 September 2019 to 4 October Weekly Report). |
Continuing Strombolian explosions in November 2019 ejected material 15-75 m above the crater, which then contributed to the formation of the new cone. White and occasionally blue gas-and-steam plumes rose 100-600 m above the crater drifting in different directions and extending up to 2 km. Multiple lava flows from the Mackenney crater moving down all sides of the volcano continued, measuring 50-700 m long. Avalanches were generated at the front of the lava flows, often moving blocks as large as 1 m in diameter. The number of lava flows decreased during 2-8 November and the following week of 9-15 November no lava flows were observed, according to INSIVUMEH. During the week of 16-22 November, a small collapse occurred in the Mackenney crater and explosive activity increased during 16, 18, and 20 November, reaching RSAM units of 4,500. At night and early morning in late November crater incandescence was visible. On 24 November two lava flows descended the NW flank toward the Cerro Chino crater, measuring 100 m long.
During December 2019, much of the activity remained the same, with Strombolian explosions originating from two emission points in the Mackenney crater ejecting material 75-100 m above the crater; white and occasionally blue gas-and-steam plumes to 100-300 m above the crater drifted up to 1.5 km downwind to the S and SW. Lava flows descended the S and SW flanks reaching 250-600 m long (figure 118). On 29 December seismicity increased, reaching 5,000 RSAM units.
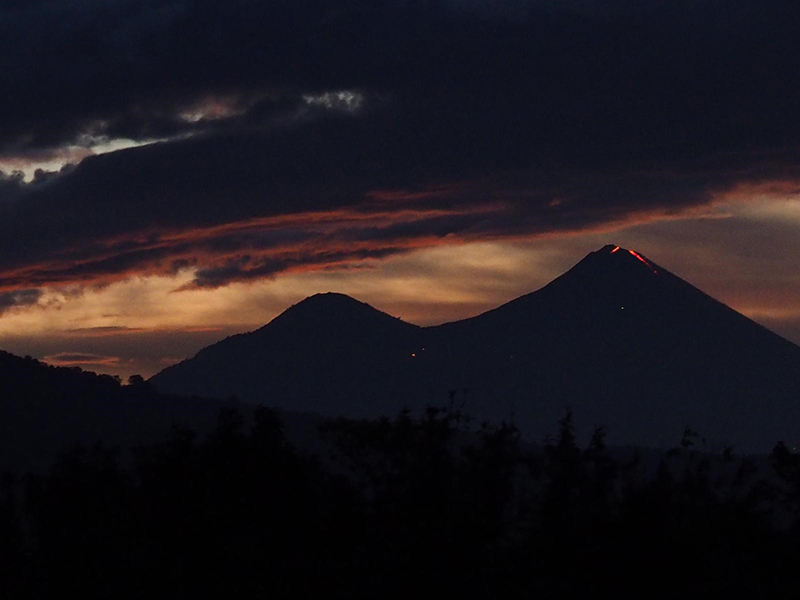 |
Figure 118. Lava flows moving to the S and SW at Pacaya on 31 December 2019. Courtesy of INSIVUMEH (28 December 2019 to 3 January 2020 Weekly Report). |
Consistent Strombolian activity continued into January 2020 ejecting material 25-100 m above the crater. These explosions deposited material inside the Mackenney crater, contributing to the formation of a small cone. White and occasionally blue fumaroles consisting of mostly water vapor were observed drifting in different directions. At night, summit incandescence and lava flows were visible descending the N, NW, and S flanks with the flow on the NW flank traveling toward the Cerro Chino crater.
During August 2019 through January 2020, multiple lava flows and bright thermal anomalies (yellow-orange) within the crater were seen in Sentinel-2 thermal satellite imagery (figures 119 and 120). In addition, constant strong thermal anomalies were detected by the MIROVA (Middle InfraRed Observation of Volcanic Activity) system during 21 February 2019 through January 2020 within 5 km of the summit (figure 121). A slight decrease in energy was seen from May to June and August to September. Energy increased again between November and December. According to the MODVOLC algorithm, 37 thermal alerts were recorded during August 2019 through January 2020.
Information Contacts: Instituto Nacional de Sismologia, Vulcanologia, Meteorologia e Hydrologia (INSIVUMEH), Unit of Volcanology, Geologic Department of Investigation and Services, 7a Av. 14-57, Zona 13, Guatemala City, Guatemala (URL: http://www.insivumeh.gob.gt/); MIROVA (Middle InfraRed Observation of Volcanic Activity), a collaborative project between the Universities of Turin and Florence (Italy) supported by the Centre for Volcanic Risk of the Italian Civil Protection Department (URL: http://www.mirovaweb.it/); Hawai'i Institute of Geophysics and Planetology (HIGP) - MODVOLC Thermal Alerts System, School of Ocean and Earth Science and Technology (SOEST), Univ. of Hawai'i, 2525 Correa Road, Honolulu, HI 96822, USA (URL: http://modis.higp.hawaii.edu/); Sentinel Hub Playground (URL: https://www.sentinel-hub.com/explore/sentinel-playground).
Strombolian explosions, multiple lava flows, and the formation of a small cone during February-July 2020
Pacaya, located in Guatemala, is a highly active volcano that has previously produced continuous Strombolian explosions, multiple lava flows, and the formation of a small cone within the crater due to the constant deposition of ejected material (BGVN 45:02). This reporting period updates information from February through July 2020 consisting of similar activity that dominantly originates from the Mackenney crater. Information primarily comes from reports by the Instituto Nacional de Sismologia, Vulcanologia, Meteorologia e Hydrologia (INSIVUMEH) in Guatemala and various satellite data.
Strombolian explosions were recorded consistently throughout this reporting period. During February 2020, explosions ejected incandescent material 100 m above the Mackenney crater. At night and during the early morning the explosions were accompanied by incandescence from lava flows. Multiple lava flows were active during most of February, traveling primarily down the SW and NW flanks and reaching 500 m on 25 February. On 5 February the lava flow on the SW flank divided into three flows measuring 200, 150, and 100 m. White and occasionally blue gas-and-steam emissions rose up to 2.7 km altitude on 11 and 14 February and drifted in multiple directions. On 16 February Matthew Watson utilized UAVs (Unmanned Aerial Vehicle) to take detailed, close up photos of Pacaya and report that there were five active vents at the summit exhibiting lava flows from the summit, gas-and-steam emissions, and small Strombolian explosions (figure 122).
Activity remained consistent during March with Strombolian explosions ejecting material 100 m above the crater accompanied by occasional incandescence and white and occasionally blue gas-and-steam emissions drifting in multiple directions. Multiple lava flows were detected on the NW and W flanks reaching as far as 400 m on 9-10 March.
In April, frequent Strombolian explosions were accompanied by active lava flows moving dominantly down the SW flank and white gas-and-steam emissions. These repeated explosions ejected material up to 100 m above the crater and then deposited it within the Mackenney crater, forming a small cone. On 27 April seismicity increased at 2140 due to a lava flow moving SW as far as 400 m (figure 123); there were also six strong explosions and a fissure opened on the NW flank in front of the Los Llanos Village, allowing gas-and-steam to rise.
During May, Strombolian explosions continued to eject incandescent material up to 100 m above the Mackenney crater, accompanied by active lava flows on 1-2, 17-18, 22, 25-26, and 29-30 May down the SE, SW, NW, and NE flanks up to 700 m on 30 May. White gas-and-steam emissions continued to be observed up to 100 m above the crater drifting in multiple directions. Between the end of May and mid-June, the plateau between the Mackenney cone and the Cerro Chiquito had become inundated with lava flows (figure 124).
Lava flows extended 700 m on 8 June down multiple flanks. On 9 June, a lava flow traveled N and NW 500 m and originating from a vent on the N flank about 100 m below the Mackenney crater. Active lava flows continued to originate from this vent through at least 19 June while white gas-and-steam emissions were observed rising 300 m above the crater. At night and during the early mornings of 24 and 29 June Strombolian explosions were observed ejecting incandescent material up to 200 m above the crater (figure 125). These explosions continued to destroy and then rebuild the small cone within the Mackenney crater with fresh ejecta. Active lava flows on the SW flank were mostly 100-600 m long but had advanced to 2 km by 30 June.
On 10 July a 1.2 km lava flow divided in two which moved on the NE and N flanks. On 11 July, another 800 m lava flow divided in two, on the N and NE flanks (figure 126). On 14 and 19 July, INSIVUMEH registered constant seismic tremors and stated they were associated with the lava flows. No active lava flows were observed on 18-19 July, though some may have continued to advance on the SW, NW, N, and NE flanks. On 20 July, lava emerged from a vent at the NW base of the Mackenney cone near Cerro Chino, extending SE. Strombolian explosions ejected incandescent material up to 200 m above the crater on 22 July, accompanied by active incandescent lava flows on the SW, N, NW, NE, and W flanks. Three lava flows on the NW flank were observed on 22-24 July originating from the base of the Mackenney cone. Explosive activity during 22 July vibrated the windows and roofs of the houses in the villages of San Francisco de Sales, El Patrocinio, El Rodeo, and others located 4 km from the volcano. The lava flow activity had decreased by 25 July, but remnants of the lava flow on the NW flank persisted with weak incandescence observed at night, which was no longer observed by 26 July. Strombolian explosions continued to be detected through the rest of the month, accompanied by frequent white gas-and-steam emissions that extended up to 2 km from the volcano; no active lava flows were observed.
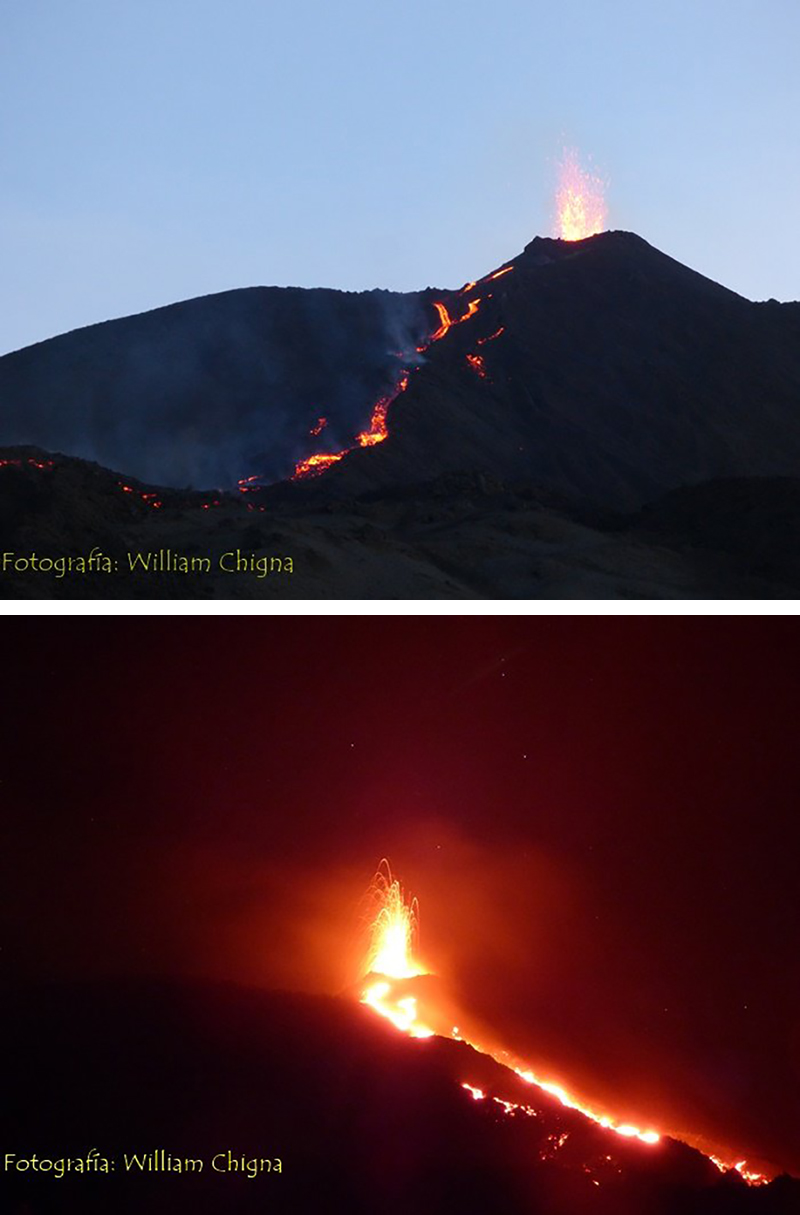 |
Figure 125. Photos of Pacaya on 11 July 2020 showing Strombolian explosions and lava flows moving down the N and NE flanks. Courtesy of William Chigna, CONRED, posted on 12 July 2020. |
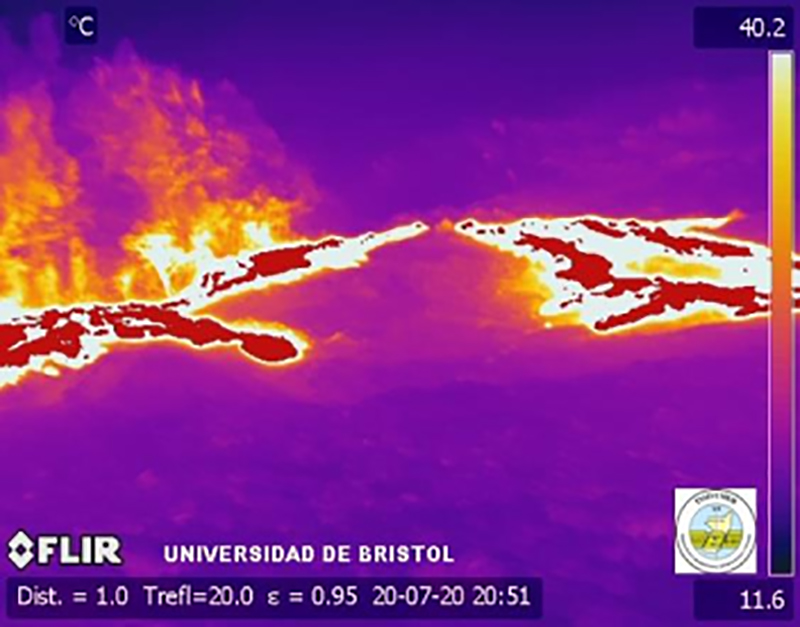 |
Figure 126. Infrared image of Pacaya on 20 July 2020 showing a hot lava flow accompanied by gas-and-steam emissions. Courtesy of INSIVUMEH (BEPAC 47 Julio 2020-22). |
During February through July 2020, multiple lava flows and thermal anomalies within the Mackenney crater were detected in Sentinel-2 thermal satellite imagery (figure 127). These lava flows were observed moving down multiple flanks and were occasionally accompanied by white gas-and-steam emissions. Thermal anomalies were also recorded by the MIROVA (Middle InfraRed Observation of Volcanic Activity) system during 10 August through July 2020 within 5 km of the crater summit (figure 128). There were a few breaks in thermal activity from early to mid-March, late April, early May, and early June; however, each of these gaps were followed by a pulse of strong and frequent thermal anomalies. According to the MODVOLC algorithm, 77 thermal alerts were recorded within the summit crater during February through July 2020.
Information Contacts: Instituto Nacional de Sismologia, Vulcanologia, Meteorologia e Hydrologia (INSIVUMEH), Unit of Volcanology, Geologic Department of Investigation and Services, 7a Av. 14-57, Zona 13, Guatemala City, Guatemala (URL: http://www.insivumeh.gob.gt/); MIROVA (Middle InfraRed Observation of Volcanic Activity), a collaborative project between the Universities of Turin and Florence (Italy) supported by the Centre for Volcanic Risk of the Italian Civil Protection Department (URL: http://www.mirovaweb.it/); Hawai'i Institute of Geophysics and Planetology (HIGP) - MODVOLC Thermal Alerts System, School of Ocean and Earth Science and Technology (SOEST), Univ. of Hawai'i, 2525 Correa Road, Honolulu, HI 96822, USA (URL: http://modis.higp.hawaii.edu/); Sentinel Hub Playground (URL: https://www.sentinel-hub.com/explore/sentinel-playground); Matthew Watson, School of Earth Sciences at the University of Bristol (Twitter: @Matthew__Watson, https://twitter.com/Matthew__Watson); William Chigna, CONRED (URL: https://twitter.com/william_chigna).
Explosions continue, and effusive activity increases during August-November 2020
Extensive lava flows, bomb-laden Strombolian explosions, and ash plumes emerging from Mackenney crater have characterized the persistent activity at Pacaya since 1961. The latest eruptive episode began with intermittent ash plumes and incandescence in June 2015; the growth of a new pyroclastic cone inside the summit crater was confirmed later that year. The pyroclastic cone has continued to grow, producing Strombolian explosions rising above the crater rim and frequent loud explosions. In addition, fissures on the flanks of the summit crater have produced an increasing number of lava flows traveling distances of over one kilometer down multiple flanks during 2019 and 2020 (figure 129). Increasing explosive and effusive activity during August-November 2020 is covered in this report with information provided by Guatemala's Instituto Nacional de Sismologia, Vulcanologia, Meteorologia e Hydrologia (INSIVUMEH), multiple sources of satellite data, and numerous photographs from observers on the ground.
After a brief pause in effusive activity at the end of July 2020, two lava flows appeared on the NW flank on 12 August. Another flow began on the NE flank ten days later, and multiple flows were active for the remainder of the month, some reaching 650 m long. Multiple lava flows issued from fissures on the N flank and elsewhere throughout September. A flow on the NE flank was reported as 1,200 m long and was visible from Guatemala City on 8 September. A new flow on the S flank was very active later in the month. Flows were persistent on most of the flanks throughout October; a flow appeared from a fissure on the W flank on 20 October and reached 1 km in length by 24 October. Block avalanches spalled off the front of the flows and generated small ash plumes. Multi-branched flows on the W and SW flanks from the W flank fissure remained active throughout November. The slowdown in effusive activity in late July and early August 2020 is apparent in the MIROVA thermal anomaly data, as is the significant increase in activity during September that persisted into November 2020 (figure 130).
The break in the lava flow activity that began on 25 July 2020 (BGVN 45:08) lasted until 12 August. During that time, steam plumes were reported rising 25-75 m above the summit and drifting generally S or SW as far as 6 km before dissipating. Strombolian explosions rose 25-150 m above the rim of Mackenney crater and ejecta reached 50 m from the rim; noises as loud as a train engine were heard in nearby communities. Incandescence was observed nearly constantly along with persistent seismic tremor activity. On 12 August two lava flows emerged on the NW flank, each reaching about 150 m long. Incandescence from the flows was visible each day through 21 August on the NW flank in the area just above Cerro Chino (figure 131). The active flows were 100-200 m long during this period. A new lava flow appeared on the NE flank and grew to 300 m in length on 22 August.
Multiple lava flows were active on the NW, N, and NE flanks for the rest of the August. Incandescence on 24 August from the NW-flank flow near Cerro Chino indicated it was 250-300 m long. During 27 and 28 August flows were reported on the N and NNE flanks, 600 and 300 m long, respectively (figure 132). Incandescent pulses were reported from the crater overnight on 28-29 August; the NW flank flow remained active and was 300 m long. MODVOLC reported three thermal alerts on 29 August. The next day, 30 August, incandescence from the 650-m-long N flank flow and 300-m-long NE flank flow continued. Constant crater incandescence accompanied dense gray ash emissions on 31 August; the lava flow on the N flank remained incandescent for 350-400 m, but there was no incandescence or degassing from the NE-flank flow on the last day of the month.
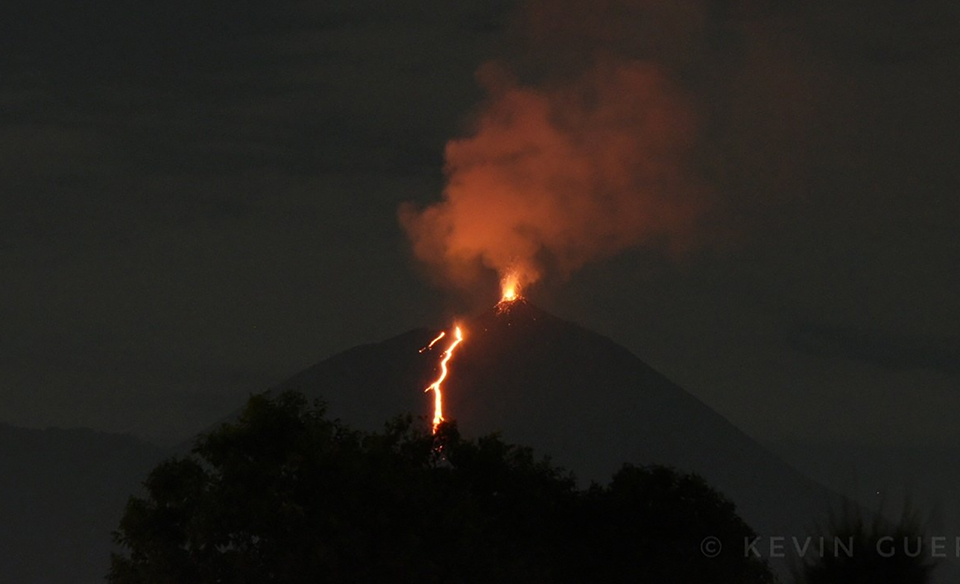 |
Figure 132. A 600-m-long lava flow was visible on the N flank of Pacaya as seen from Villa Nueva, part of Guatemala City, late on 27 August 2020. Courtesy of Sh!ft. |
White and blue steam and gas plumes were present daily throughout September 2020. They drifted in multiple directions as far as 8 km from the summit before dissipating. Strombolian activity was constant, building up the pyroclastic cone inside of Mackenney crater and sending ejecta as far as 50 m from the rim. Ejecta rose 50-150 m on most days; it was reported at 200 m high on 3, 9, and 14 September and was heard loudly and rattled windows nearby on 17 and 27 September. Constant crater incandescence with prolonged degassing of dense gray ash plumes was reported on 5, 10, 15, 17, and 21 September.
Multiple lava flows issued from fissures on the N flank and elsewhere throughout the month. Two lava flows on 1 September on the N flank were 50 and 350 m long. The next day three flows on the same flank were 300, 350, and 650 m long. On 3 September a new flow appeared on the E flank and extended 600 m from its source in addition to two flows on the N flank. For the next several days multiple flows were active on the N and NE flanks, reaching 450 m on the NE flank on 7 September. The next day the flow on the NE flank reached 1,200 m in length and was visible from Guatemala City. Activity continued with multiple flows 150-300 m long through 12 September (figure 133).
On 13 September 2020 the flows on the N and NE flanks reached 600 and 300 m long, while a third flow reached 150 m down the S flank. The flow on the S flank was the most active during 14-23 September, extending 550 m from its source and producing numerous block avalanches from the flow front (figure 134). During the last week of the month the focus of the flow activity returned to the NE, N, and NW flanks where multiple flows were reported, some up to 550 m long, along with constant Strombolian activity (figures 135). Increased thermal activity resulted in MODVOLC thermal alerts reported on seven days during the second half of the month.
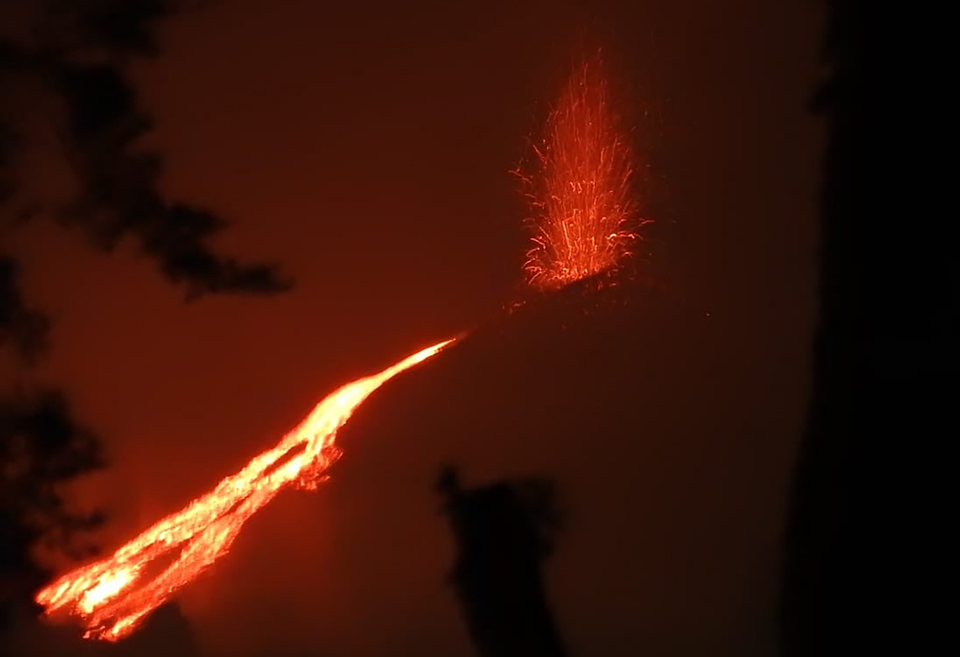 |
Figure 135. Strombolian explosions sent ejecta 40-70 m above the crater at Pacaya on 26 September 2020. In addition, a lava flow 200 m long descended the N flank. Courtesy of CONRED. |
Gas and steam plumes persisted throughout October 2020. They generally rose a few hundred meters above the summit and usually drifted S or W up to 10 km. Strombolian explosions continued daily, reported at 75-150 m high for most of the month. In a special report on 8 October INSIVUMEH noted increased Strombolian activity that sent bombs and fine ash 200-300 m above the crater, with ash emissions drifting 12 km W. During the last week of the month the ejecta reached 250 m high on several days. Loud noises and shock waves were periodically reported; vibrations were felt in San Francisco de Sales on 23 October and in areas to the S of Guatemala City on 27 October. INSIVUMEH reported ash emissions that drifted 8-10 km S and W from the summit on 23 October. The Washington VAAC reported ash emissions seen in satellite imagery drifting 15 km NE at 3.7 km altitude on 28 October. Weak sulfur dioxide emissions were recorded by the TROPOMI instrument on 6, 20, and 26 October (figure 136).
 |
Figure 136. Weak SO2 emissions from Pacaya were recorded by the TROPOMI instrument on the Sentinel 5P satellite on 6, 20, and 26 October 2020. Courtesy of NASA Global Sulfur Dioxide Monitoring Page. |
Numerous lava flows were active throughout the month of October 2020 on multiple flanks (figure 137). During 1-4 October INSIVUMEH reported one or two flows active on the N and NE flanks that were 100-500 m long (figure 138). On 4 October there was a 200-m-long flow on the S flank, and another flow on the W flank. The S-flank flow grew to 250 m long by 8 October, had block avalanches spalling off the front, and fine ash that was stirred up by the wind. The next day three flows were active; they were 400 m long on the NE flank, 300 m on the N flank, and 200 m on the W flank. The N-flank flow was the most active during 11-15 October, reaching 650 m long. The W-flank flow was very active from 20 October through the end of the month, issuing from a fissure at mid-flank. It reached 1 km in length by 24 October and burned vegetation at the flow front (figures 139). A flow on the NE flank was 350 m long on 26 October (figure 140). MODVOLC issued thermal alerts on 7 days of the month, including seven alerts on 5 October.
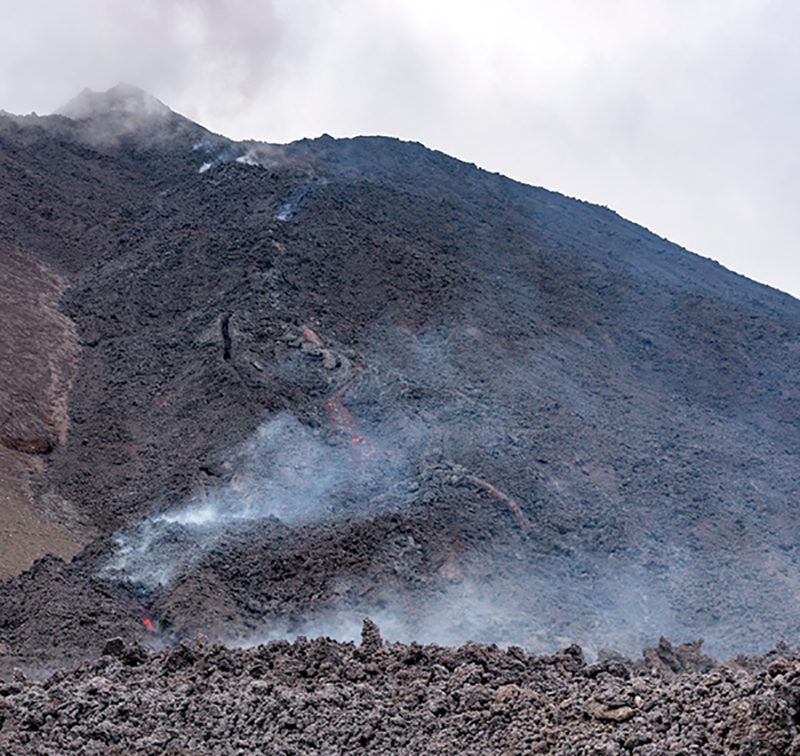 |
Figure 138. A lava flow 125 m long on the N flank of Pacaya was active on 1 October 2020. Courtesy of CONRED. |
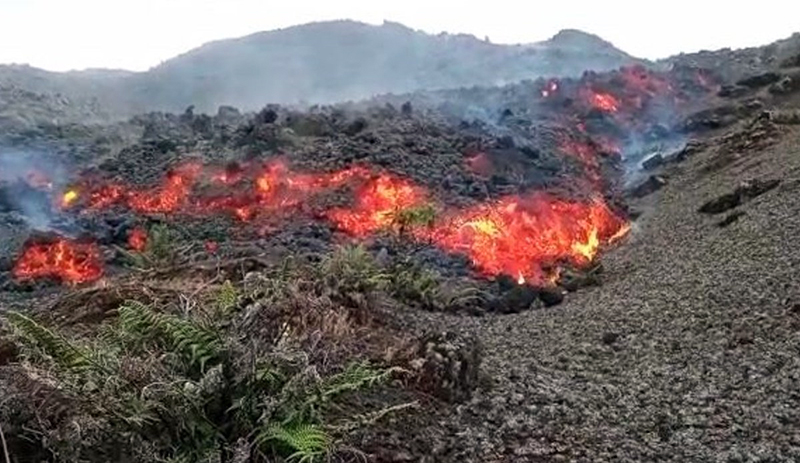 |
Figure 139. A flow on the W flank of Pacaya was over 1 km long by 24 October 2020 when it was burning vegetation as it traveled downslope. Courtesy of Noti7. |
Although the weather was cloudy for much of November 2020, white steam and blue gas plumes were visible drifting S or W from the summit on many days, some reaching 10 km from the volcano before dissipating. Sporadic Strombolian explosions rose 100-200 m above the pyroclastic cone inside Mackenney crater; the explosions were often accompanied by small ash plumes that rose a few hundred meters and drifted downwind 8-10 km before dissipating. A small SO2 plume was recorded in the TROPOMI satellite data on 8 November, the same day that INSIVUMEH and the Washington VAAC reported an ash emission drifting NE at 3.4 km altitude over the village of Los Llanos and others in the area (figure 141). An increase in activity reported by INSIVUMEH on 15 November consisted of Strombolian explosions sending material up to 300 m above the summit and ejecting bombs up to 100 m outside the crater.
Lava flows were still very active on the SW flank throughout November, emerging from a fissure a few hundred meters down from the summit that initially opened on 20 October. The main flow was 600 m long on 1 November and grew to 1,200 m long by 11 November (figure 142). On 5 November there were four separate branches of the SW-flank flow that were active. Block avalanches were common at the flow front. On 14 November a second flow was observed emerging from a fissure higher up on the SW flank from the earlier flow; they both were active for several days. INSIVUMEH issued a special report indicating increased effusion on 15 November from the SW-flank fissure. Block avalanches were occurring from the front of the 1-km-long flow, which had several branches. The blocks were 1-3 m in diameter and created small plumes of ash when moving as far as 500 m down the slope. An explosion during the night of 14-15 November at the SW-flank fissure created incandescent ejecta and ash emissions for several hours (figure 143). The flow remained active throughout the rest of November; on 26 November two flows were active from the main fissure, 500 and 400 m long (figure 144). On 30 November the main flow on the SW flank had three branches and extended 600 m from the mid-flank fissure.
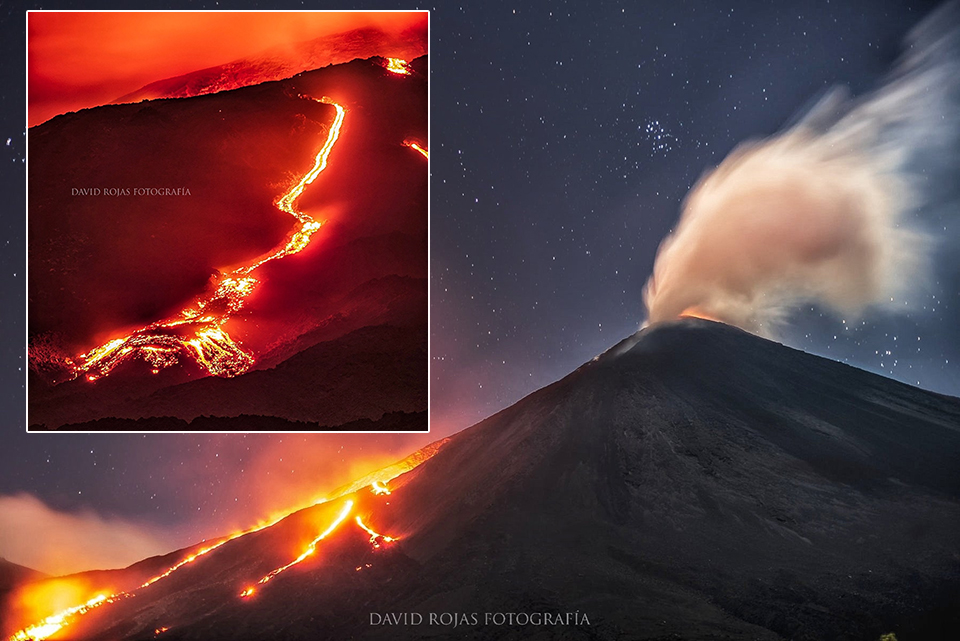 |
Figure 144. Two flows with multiple branches were active on the W and SW flanks of Pacaya on 26 November 2020. Both copyrighted photos courtesy of David Rojas, used with permission. |
Information Contacts: Instituto Nacional de Sismologia, Vulcanologia, Meteorologia e Hydrologia (INSIVUMEH), Unit of Volcanology, Geologic Department of Investigation and Services, 7a Av. 14-57, Zona 13, Guatemala City, Guatemala (URL: http://www.insivumeh.gob.gt/ ); Sentinel Hub Playground (URL: https://www.sentinel-hub.com/explore/sentinel-playground); Coordinadora Nacional para la Reducción de Desastres (CONRED), Av. Hincapié 21-72, Zona 13, Guatemala City, Guatemala (URL: http://conred.gob.gt/www/index.php) (URL: https://twitter.com/ConredGuatemala/status/1310057080162844673, https://conred.gob.gt/monitoreo-a-flujo-de-lava-en-el-volcan-pacaya/) ; NASA Global Sulfur Dioxide Monitoring Page, Atmospheric Chemistry and Dynamics Laboratory, NASA Goddard Space Flight Center (NASA/GSFC), 8800 Greenbelt Road, Goddard, Maryland, USA (URL: https://so2.gsfc.nasa.gov/); Hawai'i Institute of Geophysics and Planetology (HIGP) - MODVOLC Thermal Alerts System, School of Ocean and Earth Science and Technology (SOEST), Univ. of Hawai'i, 2525 Correa Road, Honolulu, HI 96822, USA (URL: http://modis.higp.hawaii.edu/); MIROVA (Middle InfraRed Observation of Volcanic Activity), a collaborative project between the Universities of Turin and Florence (Italy) supported by the Centre for Volcanic Risk of the Italian Civil Protection Department (URL: http://www.mirovaweb.it/); David Rojas, Guatemala (URL: https://www.instagram.com/davidrojasgtfoto/, https://twitter.com/DavidRojasGt/); Mariana Lemus, Guatemala (URL: https://www.instagram.com/marianalemusgt/); Noti7 (URL: https://twitter.com/Noti7Guatemala/status/1320169410833883136); Sh!ft (URL: https://twitter.com/kevingt_/status/1299204020662304768); Prensa Objetiva (URL: https://twitter.com/noticiasprensa/status/1328102695832612865).
Increasing activity with ash emissions, explosions, and lava flows on multiple flanks during December 2020-February 2021
Extensive lava flows, bomb-laden Strombolian explosions, and ash plumes emerging from Mackenney crater have characterized the persistent activity at Pacaya since 1961. The latest eruptive episode began with intermittent ash plumes and incandescence in June 2015; the growth of a new pyroclastic cone inside the summit crater was confirmed later that year. The cone has continued to grow, producing frequent loud Strombolian explosions rising above the crater rim and ongoing ash emissions. In addition, fissures on the flanks of the summit crater have been the source of an increasing number of lava flows traveling distances of over one kilometer down multiple flanks during 2019 and into 2021. Increasing explosive and effusive activity during December 2020-February 2021 is covered in this report with information provided by Guatemala's Instituto Nacional de Sismologia, Vulcanologia, Meteorologia e Hydrologia (INSIVUMEH), multiple sources of satellite data, and numerous photographs from observers on the ground.
Eruptive activity increased substantially during December 2020-February 2021. During December, ash emissions were reported fewer than half the days of the month; by February, dense ash emissions drifted many kilometers most days, and ashfall was reported numerous times in the surrounding communities. Strombolian explosions in December generally rose 50-125 m above the summit of the pyroclastic cone; by February they were commonly rising 300 m or more and sending ejecta 500 m from the summit. Numerous lava flows were reported on the NW, W, and S flanks during the period; a flow that emerged on the SSW flank on 7 January 2021 persisted through the end of February and was 800-1,200 m long. Strombolian activity also occurred at the fissure where the flow emerged, and incandescent blocks rolled hundreds of meters beyond the front of the flow. A steady increase in thermal activity was recorded with the MIROVA Log Radiative Power graph during December 2020 – February 2021 (figure 145). This corresponded to the persistent lava flows on multiple flanks and constant Strombolian activity. Multiple MODVOLC thermal alerts were issued many days each month during the period.
The Washington VAAC reported an ash emission at Pacaya that rose to 3.0 km altitude and drifted WSW on 3 December 2020; it dissipated within a few hours. INSIVUMEH reported daily gas and steam plumes that rose a few hundred meters and sometimes drifted as far as 10 km. They also reported ash emissions along with the gas and steam on 10, 12-14, 16-18, 24-25, and 28 December. The ash plumes usually rose 300-400 m and drifted a few kilometers with the wind. On the evening of 28 December ash reached populated places including San José El Rodeo. Strombolian explosions at the summit occurred daily and rose 50-125 m above the Mackenney crater rim (figure 146). Ejecta was reported to heights of 250 m on 13 December and 200 m on 21 December.
Lava flow activity continued on the SW flank throughout December 2020 and high winds remobilized ash on the flanks a number of times during the month. On 1 December the flow was about 675 m long and moving to the SW. Two branches were active the next day and three were reported on 6 December. A second flow appeared on the NW flank on 9 December on the plateau near Cerro Chino and grew to 250 m long (figure 147). Both flows had incandescent block avalanches spalling off their fronts and rolling at least 100 m. The SW-flank flow remained 450-550 m long through 11 December, and then grew to around 700 m the next day. Branches from both flows extended 700-1,000 m by 15 December and were moving NW, W, and SW. The NW-flank flow was growing through 16 December. Three 600-m-long branches were active on the SW-flank flow on 21 December. In a special bulletin released on 23 December, INSIVUMEH noted that the SW-flank flow was still active from the same mid-flank fissure where it originated on 20 October 2020, and consisted of 5-7 branches with lengths varying from 600-750 m (figure 148). For the remainder of December, multiple branches of the active SW-flank flow were between 525 and 650 m long, with block avalanches falling off the front that generated ash clouds.
In a special bulletin issued on 1 January 2021 INSIVUMEH reported an increase in eruptive activity that produced Strombolian explosions which sent ejecta 300 m high and up to 100 m from the summit. Constant rumblings like a train and shock waves were heard and felt in nearby communities. Strombolian explosions continued to rise 75-200 m above the rim throughout the month, and numerous gas emissions rose 100-300 m and drifted as far as 10 km (figure 149). Ash emissions were noted on 1, 6, 7, 11, 13, 18, 19, 21-23, 25, 27, and 31 January. On 7 January ash drifted SW at 3 km altitude and ejecta was reported 300 m from the summit. INSIVUMEH noted that the columns of ash reached 300-500 m above the crater that day, generating loud rumbling and shock waves that vibrated roofs and windows in nearby villages. On 12 January explosions sent material 300 m high. A VAAC report on 22 January noted an ash plume drifting NW from the summit at 3.4 km altitude. INSIVUMEH remarked in a special report that day that ash fell in San Vicente Pacaya and in San Francisco de Sales. The ash emissions on 25 January were brown to gray, sporadic overnight and more continuous in the early morning, drifting 1-4 km W. On 27 and 31 January ash drifted 10 km W.
Multiple lava flows emerged from the flanks of Pacaya during January 2021. The lava flow that began on 20 October 2020 on the W flank continued to be active through about 8 January with branches flowing 400-600 m W and SW. A flow on the SSW flank began on 2 January from a vent 200 m below the rim of Mackenney crater. By 6 January it was feeding 3-4 flows from the same point, each 400 m long with block avalanches falling off the fronts and moving W, SW, and S down the flanks (figure 150). In the morning of 7 January two flows were seen on the N flank, 200 and 50 m long. Later that night another flow appeared on the SSW flank that lengthened rapidly, reaching 425 m the next day, and was 1,200 m long on 9 January (figure 151). High temperatures were still present on the W and SW flanks from the earlier flows. The SSW flow reached 1,500 m in length on 10 January and fluctuated between 1,200 and 1,600 m through 17 January when Strombolian activity ejecting material 5-10 m high was reported from the fissure. More Strombolian activity at the fissure was noted on 22 January, and the flow remained 800-1,150 m long through the 23rd. The flow reached 1,700 m in length on 25 January; for the rest of the month, it was reported as 800-1,000 m long, with block avalanches traveling an additional 200-400 m from the flow front. Strombolian activity reached 65 m high from the fissure at the head of the flow on 28 January. On 30 January multiple branches of the SSW flow were visible from a vantage point south of the volcano (figure 152).
Increased Strombolian activity during February 2021 was accompanied by frequent ash emissions that rose to 3.0-3.5 km altitude. The explosions often reached 225 m above the crater rim, and higher during pulses of increased activity. On 5 February ash drifted W, NW, and SW about 4 km and ashfall was reported in San Francisco de Sales, Concepcion el Cedro, and Calderas. A pulse of increased Strombolian activity on 6 February sent ejecta 400-500 m around the pyroclastic cone and columns of ash drifted 6 km NW and N. Ashfall was reported in the same areas as the day before, plus in El Bejucal, Mesías Altas and other communities in that region. Abundant ash emissions were reported by INSIVUMEH overnight on 7-8 February; variable winds dispersed the ash 30 km to the NW and W and 10 km N (figure 153). The ash emissions were accompanied by ejecta that landed 300 m from the summit. By the next day, ash had drifted as far as 66 km W and NW and ashfall was reported in El Patrocinio, El Rodeo, and El Caracol. Prolonged rumbling as loud as an airplane engine was reported from strong degassing. The Washington VAAC reported ash emissions in satellite imagery on 9 February at 3.8 km altitude drifting NW about 65 km from the summit.
High levels of similar activity continued through 10 February when 500-m-high ejecta was observed inside Mackenney crater. An increase in the seismic amplitude on 11 February was accompanied by ash plumes rising to 3.0-3.2 km altitude and drifting 15-20 km W and SW. Ashfall was reported in Patrocinio and El Rodeo. The next day ashfall was reported in San Francisco de Sales, San Jose Calderas, and Concepción el Cedro. On 13 February the Washington VAAC reported ash plumes visible in satellite imagery at 4.3 km altitude moving ENE, and ash fell in Santa Elena Barillas, Mesillas Bajas, and Mesillas Altas as the wind carried ash 6 km W, N, and NE; ash on 14 February drifted 5 km E. A new pulse of activity late on 16 February, the third in a week, produced incandescent material 400 m high; high-pressure gas also created plane engine noises, with roofs and windows rattled in nearby communities. Ashfall from the event was reported in Los Llanos, Los Pocitos, El Cedro, and other communities within 4 km. Another pulse on 18 February sent ejecta 200 m high, variable winds sent ash primarily NE and S. Two more pulses of activity on the morning of 19 February were recorded as increases in seismic amplitude by the PCG5 seismic station (figure 154). The first pulse was accompanied by a new lava flow appearing on the NW flank. The second pulse coincided with ash emissions that rose 500 m above the crater and drifted 8 km S, producing ashfall in Los Pocitos and plantations in that vicinity.
Ash emissions from explosions on 20 February drifted 10-25 km S and SW, resulting in ashfall in El Rodeo and El Patrocinio. That evening incandescent material rose 300-400 m above the summit and ejecta reached 500 m down the flanks of the cone (figure 155). The next day ash plumes rose to 2.8-3.2 km altitude and drifted SW with ashfall reported in San Francisco de Sales, El Cedro, and other plantations in the area (figure 156). During 22-24 February ash emissions rose as high as 800 m above the summit and drifted 3-5 km W, SW, and S. Ashfall drifted over 30 km S and SW on 24 February with ashfall reported in the villages of Los Pocitos, Pacaya, El Rodeo, and El Patrocinio. Pulses of increased activity on 26 February produced an ash plume 2.5 km above the summit. With variable wind directions at different altitudes, the ash drifted both N and S. The Washington VAAC reported the plume drifting N at 3.9 km altitude. This activity was accompanied by incandescent explosions that rose 500 m above the Mackenney crater, and noises as loud as an airplane engine. Similar pulses of activity continued through the end of the month, producing ash plumes that rose to 3.5 km altitude and drifted W and SW; ashfall was reported in El Patrocinio on 28 February.
The lava flow on the SSW flank was about 900 m long at the beginning of February with block avalanches falling about 100 m from the front of the flow, and Strombolian explosions active at the fissure at the head of the flow. Two distinct branches of the flow were visible on 6 February, one 1,200 and one 800 m long; multiple branches were active throughout the month (figure 157). High levels of activity continued; during 10-12 February the flow was 1,200-1,300 m long and loose blocks were descending an additional 200 m. During 13-18 February high temperature zones were still present on the N and NW flanks from earlier flows. From 14-18 February the S-flank flow was 900-1,100 m long with multiple branches and Strombolian activity at the vent (figure 158). A new flow appeared briefly on the NW flank during 19-20 February. High-temperature zones remained on the NW flank during 22-24 February. The S-flank flow remained active throughout the rest of February and was 800-1,100 m long, with incandescent blocks traveling up to 600 m beyond the flow fronts (figure 159).
Information Contacts: Instituto Nacional de Sismologia, Vulcanologia, Meteorologia e Hydrologia (INSIVUMEH), Unit of Volcanology, Geologic Department of Investigation and Services, 7a Av. 14-57, Zona 13, Guatemala City, Guatemala (URL: http://www.insivumeh.gob.gt/ ); MIROVA (Middle InfraRed Observation of Volcanic Activity), a collaborative project between the Universities of Turin and Florence (Italy) supported by the Centre for Volcanic Risk of the Italian Civil Protection Department (URL: http://www.mirovaweb.it/); Hawai'i Institute of Geophysics and Planetology (HIGP) - MODVOLC Thermal Alerts System, School of Ocean and Earth Science and Technology (SOEST), Univ. of Hawai'i, 2525 Correa Road, Honolulu, HI 96822, USA (URL: http://modis.higp.hawaii.edu/); Washington Volcanic Ash Advisory Center (VAAC), Satellite Analysis Branch (SAB), NOAA/NESDIS OSPO, NOAA Science Center Room 401, 5200 Auth Rd, Camp Springs, MD 20746, USA (URL: www.ospo.noaa.gov/Products/atmosphere/vaac, archive at: http://www.ssd.noaa.gov/VAAC/archive.html); Sentinel Hub Playground (URL: https://www.sentinel-hub.com/explore/sentinel-playground); Deybin Fotografía (URL: https://www.facebook.com/Deybin-fotografía-2316704905277353, https://twitter.com/UniversoNews1/status/1347037016324792327); David Rojas (URL: https://twitter.com/DavidRojasGt/status/1360789438545149957); Luis Figueroa (URL: https://twitter.com/luisficarpediem/status/1363664541318598657); Berner Villela (URL: https://bernervillela.com/galerias/naturaleza, https://twitter.com/soy_502/status/1362846917743366146); Roberto Iboy (URL: https://twitter.com/IboyRoberto/status/1363688900401709057).
Ash emissions during March 2021 close airport; lava flows travel over 3 km, burning crops and blocking roads
Extensive lava flows, bomb-laden Strombolian explosions, and ash plumes from Mackenney crater have characterized the persistent activity at Pacaya since 1961. The latest eruptive period began with intermittent ash plumes and incandescence in June 2015; the growth of a new pyroclastic cone inside the summit crater was confirmed later that year and has continued, producing frequent loud Strombolian explosions rising above the crater rim and ongoing ash emissions. In addition, flank fissures have been the source of lava flows during 2019-2021. A significant increase in both effusive and explosive activity that began in February 2021 continued through mid-May. Activity during March-May 2021 is covered in this report with information provided by Guatemala's Instituto Nacional de Sismologia, Vulcanologia, Meteorologia e Hydrologia (INSIVUMEH), multiple sources of satellite data, and photographs from observers on the ground.
Summary of activity during March-May 2021. Incandescent explosions, ash emissions, and subsequent ashfall increased substantially at the beginning of March 2021 from the already increased levels during February. Explosions sent ejecta hundreds of meters high and hundreds of meters from the summit; ash plumes drifted tens to hundreds of kilometers and ashfall occurred almost daily in communities within tens of kilometers of Mackenney crater. The most extensive ash emissions forced closure of the International Airport in Guatemala City on 22 March. Ash emissions decreased during April and were intermittent into the first half of May, after which they tapered off.
Effusive activity also increased significantly during March 2021; by early in the month as many as three lava flows with multiple branches, all about 1 km long, were simultaneously active on multiple flanks. A new fast-moving flow appeared on the SW flank during the second half of March and rapidly reached 1.5 km in length, flowing NW then SW, ultimately extending over 3 km. It had multiple branches that caused vegetation fires, destroyed significant cropland, and crossed roads before stopping in mid-April. A new flow emerged along a similar path at the end of April and grew to over 2 km long in early May before activity at its source fissure ended on 17 May. High temperatures remained at many flow areas around the volcano for the rest of the month.
The high levels of activity are reflected in the MIROVA radiative power data for the period which show the increase in intensity to very high levels through mid-April, followed by a pulse in late April and early May that corresponds to explosions and lava flows. Thermal activity decreased significantly by the third week of May (figure 160). The MODVOLC thermal alert data shows a similar pattern with multiple alerts issued most days in March and for the first half of April, and another pulse of activity from 27 April-13 May. Significant sulfur dioxide emissions were recorded in satellite data several times in March and April and corresponded to periods of increased explosive and effusive activity (figure 161).
Activity during March 2021. A notable increase in seismicity early on 1 March 2021 coincided with increased Strombolian activity. Observatorio Volcán de Pacaya geologists observed explosions sending ejecta 500 m above the rim of Mackenney crater accompanied by plumes of ash and gas that reached 3.5 km altitude and drifted W and SW. For most of March high levels of Strombolian activity sent ejecta 200-400 m high each day, sometimes higher, reaching 800 m on 3 March, 800-1,000 m on 5 March, and 700 m on 10 March (figure 162). Sounds as loud as a train locomotive or plane engine from the explosions were frequently reported, and ejecta was sometimes scattered 500-600 m from the cone. Explosive activity with ejecta and ash emissions were also reported from the fissure feeding the lava flow on the S flank 300 m below Mackenney crater. On 14 March, ejecta from the fissure sent block avalanches 1,300 m down the S flank.
The increase in explosive activity also included an increase in dense ash emissions and resulting ashfall during March 2021. Ash plume heights ranged from 3 to 5.5 km altitude, and often drifted W, NW, or SW. The Washington VAAC reported an ash plume centered about 75 km WSW of the summit on 1 March. On 3 March a dense ash emission was drifting W from the summit at 3.7 km altitude. The next day ash was detected almost 100 km SW just off the Mexican Pacific coast before dissipating. The altitude of the ash emissions increased to 4.9 km on 5 March; puffs drifting W were visible in satellite images extending over 250 km from the summit the next day. Pulses of activity lasted between 15 minutes and 13 hours, and produced tephra fallout around the volcano, dense ash plumes that drifted 3-5 km, and finer ash plumes that drifted more than 60 km.
Explosions on 7 March caused lava fountains 100-500 m above the crater. The following day ash plumes were drifting 45 km SW at 3 km altitude. On 9 March ash plumes fanned out from the NW to the SW about 30 km from the summit before dissipating. From 11 March onward multiple daily discrete ash emissions extended at least 30-50 km WNW and SW from the summit at altitudes of 3.7-4.3 km altitude, and much farther on some days. The plumes reached 90 km WSW on 12 March, and 140 km W on 14 March. The next day, ash emissions extended over 100 km WSW, with remnants visible in satellite images almost 185 km away by the end of the day. On 16 March they drifted 170 km WNW at 4.3 km altitude and on 18 March the ash emissions were observed drifting SW at 3.4 km altitude extending 185 km from the summit. Dense gray-black emissions were accompanied by white steam emissions on 21 March (figure 163).
Dense ash clouds seen on 22 March 2021 were drifting rapidly SSE at 4.9 km altitude as far as 75 km, SE at 6.1 km altitude, and visible in satellite imagery moving E at 7.6 km altitude up to 25 km from the volcano. The next day they were drifting NE at 3 km altitude up to 90 km away, and SW at 4.6 km altitude. A narrow ash plume was detected in visible satellite imagery on 28 March drifting about 80 km NW of the summit before dissipating. Over the next two days a plume was detected moving SW at 3 km altitude about 130-150 km from the summit. In addition, another plume was drifting NW at 4.3 km altitude on 31 March causing dense ash to cover the summit of Fuego that was visible on webcams. The lower plume was visible over 300 km SW of Pacaya before it dissipated (figure 164).
Communities all around Pacaya were affected by ashfall many times throughout March 2021 (figure 165, table 7). Most of the communities were within 10 km of the summit, but ashfall reached more than 20 km away multiple times. During the bigger ashfall events, blocks more than 6 cm in diameter fell on the flanks of the volcano, while lapilli (2 mm to 6 cm) fell up to 5 km away, and fine ash was observed up to 30 km away (figure 166). The most significant ashfall events occurred during 22-23 March when ash drifted tens of kilometers in multiple directions and caused the closure of La Aurora International Airport in Guatemala City (figure 167).
Table 7. Communities reporting ashfall from Pacaya during March 2021. Information courtesy of INSIVUMEH.
| Date | Direction | Tephra Description | Community |
| 01 Mar 2021 | SW | Ash | El Patrocinio and others in that direction. |
| 03 Mar 2021 | SW | Ash | El Patrocinio and El Rodeo, SW flank. |
| 05 Mar 2021 | SW | Ash, lapilli (2 mm to 6 cm) and blocks greater than 6 cm | San Francisco de Sales, Cerro Chino, El Cedro, El Patrocinio and El Rodeo, ash in Los Rios and Los Jazmines communities, and in the municipalities of Palín (10 km WNW) and Escuintla (20 km SW). |
| 06 Mar 2021 | W, S | Ash | El Patrocinio and El Rodeo, SW flank. |
| 08 Mar 2021 | SW, S, SE | Ash | Pacaya village, El Chupadero farm, La Laguna farm and others in this area. |
| 10 Mar 2021 | W, SW | Coarse ash and lapilli | El Patrocinio, El Caracol. |
| 11 Mar 2021 | W, SW | Ash | El Patrocinio and San José El Rodeo in the municipality of San Vicente Pacaya. |
| 14 Mar 2021 | W, SW, NW | Ash | San José el Bejucal, San Antonio el Pepinal, San Francisco de Sales, Concepción el Cedro, San José Calderas, fine ash in the municipalities of Amatitlán (10 km N), Villa Nueva (15 km N), Mixco (30 km NNE) and the Capital city (25 km NNE). |
| 15 Mar 2021 | W, NW | Ash | Communities on the NW, W, SW flanks. |
| 16 Mar 2021 | NW, W | Ash, Lapilli | Fine ash to 2 cm long lapilli in El Patrocinio, San José El Rodeo and Concepción El Cedro, in the municipality of San Vicente Pacaya. Fine ash in the urban area of Amatitlán. |
| 17 Mar 2021 | SW, W, NW, N | Ash | El Rodeo, El Patrocinio, El Cedro, San Francisco de Sales, Amatitlán, Villa Nueva. |
| 18 Mar 2021 | S, SW | Ash | El Rodeo, El Patrocinio, Los Pocitos and others in these directions. |
| 22 Mar 2021 | E, SE, S, SW | Ash | El Rodeo, El Patrocinio, Los Pocitos, Los Dolores, Los Llanos, Santa Elena Barillas, Mesías Alta and Mesías Baja. |
| 23 Mar 2021 | S, NE | Lapilli, ash | Lapilli in San Francisco de Sales and San José Calderas. Ash reported in El Cedro, San Francisco de Sales, Mesías Bajas, Mesías Altas, Los Pocitos, Los Dolores, Santa Elena Barillas, and also Villa Nueva and the Capital Guatemala City. La Aurora International Airport (25 km NNE) closed. |
| 24 Mar 2021 | NE | Ash | Mesillas Altas and Mesillas Bajas. |
| 25 Mar 2021 | W, NW, NE, N | Ash | San Francisco de Sales, San Vicente Pacaya, Pepinal, El Cedro, Calderas, Mesías Alta, and Messías Baja. |
| 26 Mar 2021 | SW | Ash | El Rodeo and El Patrocinio. |
| 27 Mar 2021 | S | Ash | El Rodeo, El Patrocinio, Cedro, San Vicente Pacaya, and others in that area. |
| 28 Mar 2021 | S, SW | Ash | El Patrocinio. |
| 30 Mar 2021 | S | Ash | Communities on S flank including Finca El Chupadero and Los Pocitos. |
Lava flow activity also increased significantly during March 2021. At the end of February, an active flow on the S flank remained about 1 km long, shedding incandescent blocks hundreds of meters from its advancing front. By 3 March, three flows with multiple branches were active on the SSW flank; they were 800-1,000 m long (figure 168). On 5 and 6 March two flows with many branches extended 300-500 m down the S flank (figure 169). Flows were active on the SW, S, and SE flanks on 7 March. The S-flank-flow with two branches reached 1 km long by 8 March and had incandescent blocks constantly falling of the leading edge. It increased steadily in length, reaching 1.8 km by 16 March (figure 170).
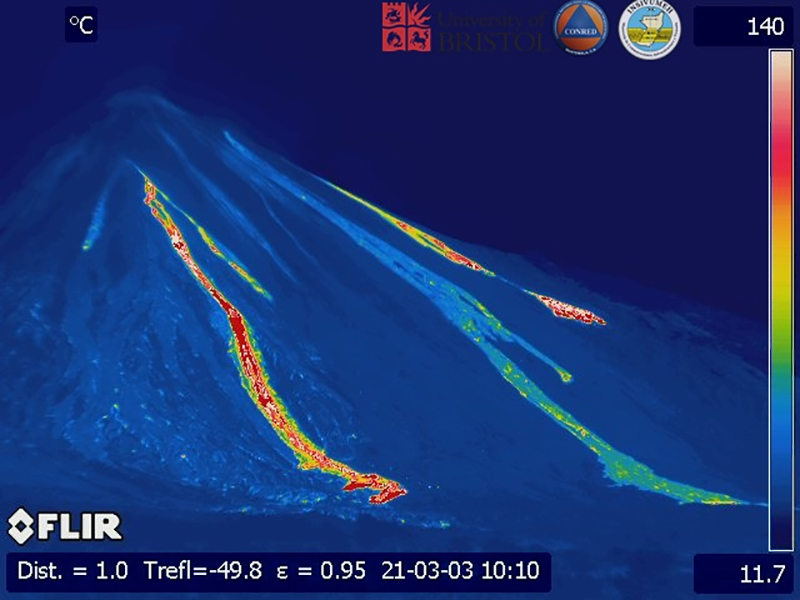 |
Figure 168. Three flows were active on the S and SW flanks of Pacaya on 3 March 2021, seen here with an infrared camera. Courtesy of INSIVUMEH. |
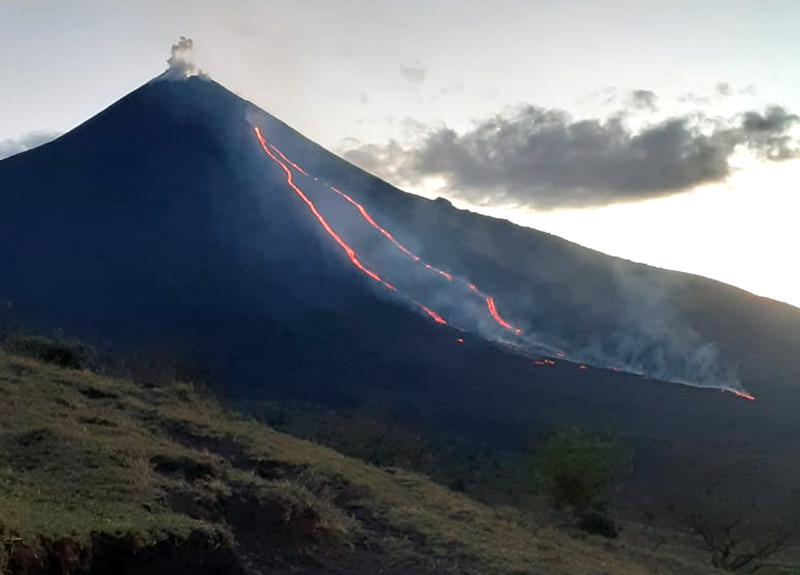 |
Figure 170. Two branches of the S-flank lava flow at Pacaya were each about 1.4 km long on 12 March 2021. Courtesy of INSIVUMEH (FOTOGRAFÍAS RECIENTES DE VOLCANES). |
Two new flows emerged from the S and SE flanks on the morning of 18 March (figure 171). The S-flank flow grew to 500 m and part of it overflowed outside the plateau. The SE-flank flow was 400 m long in front of the village of Los Llanos, causing fires in the vegetation which continued for several days (figure 172). On 20 March the SE flank flow caused a strong thermal signature in satellite imagery with incandescent blocks falling downslope far beyond the front (figure 173). During the night of 20-21 March, a new flow appeared on the SW flank and grew to 500 m long; the flow on the SE flank reached 850 m. The following day the rapidly growing SW-flank-flow reached 1,500 m long, causing vegetation fires on ranches in Las Granadillas.
Three flows were active on 22 March 2021, with existing flows on the SW (1,500 m) and SE flanks (300 m), and a new flow on the E (500 m) flank. By 25 March activity was focused on the SW-flank flow which had reached 2.5 km in length (figure 174). It was about 400 m wide and 2.5 m high, burning vegetation as it advanced, and causing damage on coffee and avocado plantations. By 31 March the flow exceeded 3 km in length with multiple active fronts. One of the flow fronts near the community of La Breña was still advancing, but the one at the Campo Alegre farm had stopped moving. The flow continued to cause fires, destroy crops and buildings, and block roads (figure 175).
Activity during April 2021. On 1 April 2021 remnant plumes from earlier ash emissions were moving SW over the Pacific about 400 km from the summit at 4.3 km altitude, while newer emissions were drifting S at 3.4 km altitude towards the coast. Continuous ash emissions were reported by the Washington VAAC through April 4 (figure 176) drifting tens of kilometers mostly SW at 3.5-4.5 km altitude. Ash drifted up to 20 km S and SW during the first week and caused frequent ashfall in communities on the SE, S, and SW flanks, with the most affected being Los Pocitos, El Rodeo, and El Patrocinio. A few moderate to strong explosions sent ejecta 100-500 m above the Mackenney crater. By 9 April ash emissions were more sporadic and tended to drift only 5-10 km SW, W, and NW, and no ashfall was reported. The VAAC reported occasional emissions observed in the webcam on 8 and 14 April. An ash plume was detected on 16 April moving NNW at 3.4 km altitude. Strombolian activity diminished and activity changed to primarily steam and gas plumes rising 200 m above the crater after this. A short episode of sporadic explosions during 24-29 April sent ejecta to 250 m above the crater, generated loud noises, and produced ash emissions that rose a few hundred meters and drifted several kilometers.
The SW-flank flow that began during 20-21 March remained active into early April and was 2.8-3 km long during the first week. It continued to advance during the second week and reached 3.7 km long with multiple active branches that were burning vegetation (figure 177). During 7-11 April it was advancing W and N in the area of La Breña and W and S in the area of El Patrocinio and El Rodeo on the Campo Alegre farm (figure 178). By 10 April this flow was 400 m from El Patrocinio and 250 m from San José El Rodeo. By 13 April it was burning avocado and coffee plantations 370 m from houses in El Patrocinio (figure 179). Another active front to the south was 250 m E of El Rodeo and had blocked the road between El Rodeo, El Caracol, and Los Pocitos. The seismic activity associated with the lava effusion decreased significantly beginning on 16 April.
During 18-20 April 2021 the branch near La Breña stopped advancing, and by 21 April the branch near El Patrocinio had stopped (figure 180), although temperatures remained high and gas emissions from vents along the flow continued in many places through the end of April. A lava flow appeared on the SE flank on 27 April, following a few days of renewed explosive activity, and grew to 175 m by 29 April. INSIVUMEH reported another new flow on the N flank on 29 April (figure 181); it advanced rapidly to the NW around Cerro Chino, and then turned towards the SW, reaching 1.6 km long by later in the day when the leading edge was located about 100 m from La Breña with several active flow fronts.
Activity during May 2021. Sporadic emissions of steam and gas with occasional ash were typical from Mackenney crater at the beginning of May 2021. Possible ash emissions were seen in satellite data on 1 May drifting W at 3.4 km altitude. Dense plumes, some with abundant ash, were reported on 8 May drifting W and S. Strombolian activity on 10 May from the NW-flank fissure was feeding the flow which began on 29 April; it sent ejecta 50-150 m high, and loud noises were heard. The Washington VAAC reported minor amounts of ash observed in satellite images moving SW from the summit during 10-13 May, when intermittent pulses of dense ash were reported drifting W and SW from the crater. Intermittent ash emissions rose to 3.7 km altitude on 14 May and were observed about 100 km SW before dissipating. Ash plumes drifted up to 5 km W on 15 and 16 May, causing ashfall during 16 and 17 May in El Patrocinio and El Rodeo (figure 182). During 18-21 May constant steam and gas, and periodic ash, emissions drifted 5-10 km NW and W at about 3 km altitude with ashfall reported in communities such as San Francisco de Sales, Concepción El Cedro, Aldea El Patrocinio, and San Miguel Petapa. For the remainder of May, small quantities of ash accompanied dense steam and gas emissions that rose 200-700 m above the summit and drifted W, SW, and S up to 5 km. El Patrocinio, El Rodeo, and other fincas in that area within 10 km reported ashfall on 26 May.
The N-flank flow that began on 29 April 2021 continued to advance into early May. It had originally flowed NW, then curved around Cerro Chino and headed W. It was 2 km long and advancing in the vicinity of La Breña on 3 May. On 5 May incandescent ejecta was observed at the fissure feeding the flow, which had advanced to the S of La Breña where incandescent blocks continued to fall off the front of the advancing flow. On 6 May the flow reached 2.3 km in length on the W flank, with only one of the fronts continuing to advance slowly. Small explosions were reported at the fissure. The lava flow continued to advance laterally in places as incandescent material spilled over the edges. Explosions from the fissure on 9 May threw material 15 m away as the flow continued moving slowly W (figure 183). By 11 May the flow was no longer advancing at its front but was still expanding due to overflows along its edges. Explosions from the fissure on 14 May launched ejecta 40 m (figure 184), and the flow front again moved slowly westward; by then it was about 2.3 km long (figure 185). Activity at the fissure ceased by 17 May.
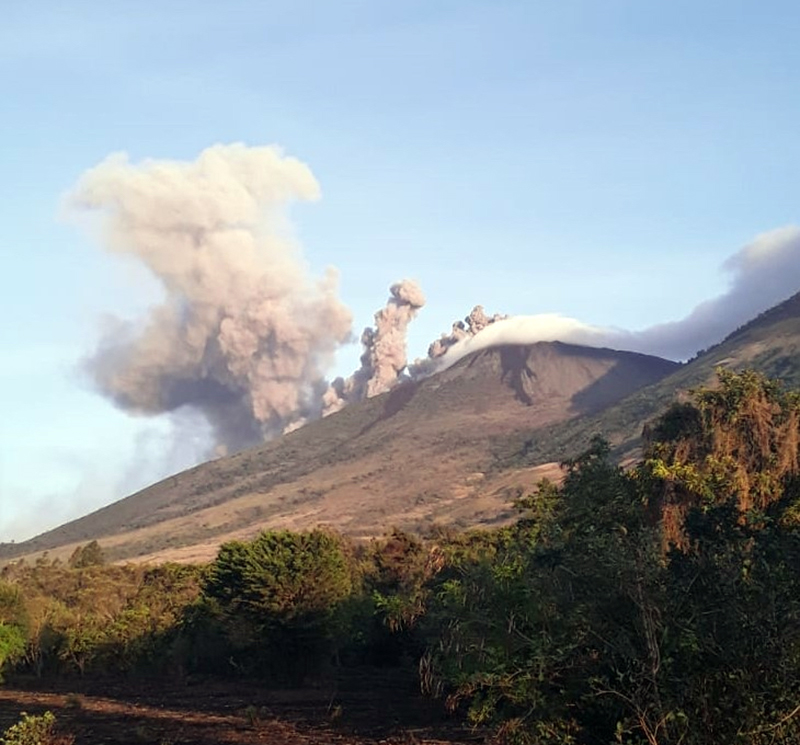 |
Figure 184. The fissure on the NW flank of Pacaya was still active on 14 May 2021. Explosions produced ash and ejecta that rose 40 m above the fissure. Courtesy of CONRED. |
Information Contacts: Instituto Nacional de Sismologia, Vulcanologia, Meteorologia e Hydrologia (INSIVUMEH), Unit of Volcanology, Geologic Department of Investigation and Services, 7a Av. 14-57, Zona 13, Guatemala City, Guatemala (URL: http://www.insivumeh.gob.gt/ ); Coordinadora Nacional para la Reducción de Desastres (CONRED), Av. Hincapié 21-72, Zona 13, Guatemala City, Guatemala (URL: http://conred.gob.gt/www/index.php, https://twitter.com/ConredGuatemala/status/1393207685756203011); Colred Los Llanos, Coordinadora local para la reduccion de desastres, Los Llanos, Villa Canales (URL: https://www.facebook.com/Colred-Los-Llanos-102105058094847); MIROVA (Middle InfraRed Observation of Volcanic Activity), a collaborative project between the Universities of Turin and Florence (Italy) supported by the Centre for Volcanic Risk of the Italian Civil Protection Department (URL: http://www.mirovaweb.it/); Hawai'i Institute of Geophysics and Planetology (HIGP) - MODVOLC Thermal Alerts System, School of Ocean and Earth Science and Technology (SOEST), Univ. of Hawai'i, 2525 Correa Road, Honolulu, HI 96822, USA (URL: http://modis.higp.hawaii.edu/); Washington Volcanic Ash Advisory Center (VAAC), Satellite Analysis Branch (SAB), NOAA/NESDIS OSPO, NOAA Science Center Room 401, 5200 Auth Rd, Camp Springs, MD 20746, USA (URL: www.ospo.noaa.gov/Products/atmosphere/vaac, archive at: http://www.ssd.noaa.gov/VAAC/archive.html); Sentinel Hub Playground (URL: https://www.sentinel-hub.com/explore/sentinel-playground); NASA Global Sulfur Dioxide Monitoring Page, Atmospheric Chemistry and Dynamics Laboratory, NASA Goddard Space Flight Center (NASA/GSFC), 8800 Greenbelt Road, Goddard, Maryland, USA (URL: https://so2.gsfc.nasa.gov/); Reuters Pictures (URL: https://twitter.com/reuterspictures/status/1367472450418704387); CNN (URL: https://www.cnn.com/2021/03/23/americas/guatemala-airport-volcano-closure-latam-intl/index.html); KTLA, (URL: https://ktla.com/news/nationworld/lava-from-guatemalas-pacaya-volcano-threatens-small-communities-that-live-nearby/); David Rojas, (URL: https://twitter.com/DavidRojasGt/status/1391592159221063680); Geo_Sci_Jerry (URL: https://twitter.com/SciJerry/status/1394083192773222406).
Lava flow activity ceases mid-May 2021; last ash explosion reported on 13 August 2021
Extensive lava flows, bomb-laden Strombolian explosions, and ash plumes from Mackenney crater have characterized persistent activity at Pacaya since 1961. The latest eruptive period began with intermittent ash plumes and incandescence in June 2015; the growth of a new pyroclastic cone inside the summit crater was confirmed later that year and continued, producing frequent loud Strombolian explosions and ash emissions through May 2021. In addition, flank fissures were the source of multiple kilometer-long lava flows during 2019-2021. A significant increase in both effusive and explosive activity that began in February 2021 continued through mid-May, decreased later that month, and was followed by minor ash emissions in June and August 2021. Activity during June-November 2021 is covered in this report with information provided primarily by Guatemala's Instituto Nacional de Sismologia, Vulcanologia, Meteorologia e Hydrologia (INSIVUMEH).
The last lava flow from the major eruptive events of 2020 and 2021 had begun on 29 April and grown to over 2 km long before activity at the fissure ceased on 17 May (figure 185, BGVN 46:06). Periodic ash emissions continued for the remainder of May, with the last reported ashfall on 26 May. Although no further significant eruptive activity was reported in terms of flows, incandescent ejecta, or ashfall from plumes, minor ash emission events were reported over the next few months. The MIROVA radiative power data for the period of January-November 2021 shows the high to very high levels of heat flow during the period of multiple active flows from January through mid-May, with an abrupt decline in energy after that. Cooling flows were the likely source of low levels of heat during July (figure 186).
Sporadic ashfall was reported around Mackenney crater on 8 June 2021. The Washington VAAC reported a possible ash emission on 11 June drifting SW 35 km from the summit at 3 km altitude. No ash emissions, flows, or incandescent ejecta were reported during July. INSIVUMEH issued a Special Bulletin on 4 August reporting on three moderate explosions that produced ash plumes that rose to 3.5 km altitude and drifted N about 12 km; ashfall was reported in Mesías Altas, Mesías Bajas, and Villa Canales. The large pyroclastic cone that had nearly filled the inside of Mackenney crater was largely destroyed and had its own crater nearly the width of the cone about 100 m deep when viewed by researchers from the University of Bristol at the end of July (figure 187). Two explosions on 13 August produced ash plumes that drifted 1 km S.
Though INSIVUMEH noted the presence of ash in emissions on 14 September 2021, there was no significant plume or ashfall. For the remainder of October and November 2021 steam and gas emissions rose 150-400 m above the crater rim and drifted up to 1.5 km S or SW; there were no further reports of ash, ejecta, lava flows, or incandescence from Mackenney crater. A comparison of Sentinel 2 satellite images from February 2020 and November 2021 shows the extent of some of the new lava flows produced during the heightened activity of that period (figure 188).
Information Contacts: Instituto Nacional de Sismologia, Vulcanologia, Meteorologia e Hydrologia (INSIVUMEH), Unit of Volcanology, Geologic Department of Investigation and Services, 7a Av. 14-57, Zona 13, Guatemala City, Guatemala (URL: http://www.insivumeh.gob.gt/ ); MIROVA (Middle InfraRed Observation of Volcanic Activity), a collaborative project between the Universities of Turin and Florence (Italy) supported by the Centre for Volcanic Risk of the Italian Civil Protection Department (URL: http://www.mirovaweb.it/); Sentinel Hub Playground (URL: https://www.sentinel-hub.com/explore/sentinel-playground).
|
|
||||||||||||||||||||||||||||
There is data available for 32 confirmed eruptive periods.
2015 Jun 7 ± 1 days - 2021 Aug 13 Confirmed Eruption (Explosive / Effusive) VEI: 1
| Episode 1 | Eruption (Explosive / Effusive) | MacKenney Crater | ||||||||||||||||||||||||||||||||||||||||||||||||||||||||||||||||||||||||||||||||||||||||||||||||||||||||||||||||||||||||||||||||||||||||||||||||||||||||||||||||||||||||||||||||||||||||||||||||||||||||||||||||||||||||||
|---|---|---|---|---|---|---|---|---|---|---|---|---|---|---|---|---|---|---|---|---|---|---|---|---|---|---|---|---|---|---|---|---|---|---|---|---|---|---|---|---|---|---|---|---|---|---|---|---|---|---|---|---|---|---|---|---|---|---|---|---|---|---|---|---|---|---|---|---|---|---|---|---|---|---|---|---|---|---|---|---|---|---|---|---|---|---|---|---|---|---|---|---|---|---|---|---|---|---|---|---|---|---|---|---|---|---|---|---|---|---|---|---|---|---|---|---|---|---|---|---|---|---|---|---|---|---|---|---|---|---|---|---|---|---|---|---|---|---|---|---|---|---|---|---|---|---|---|---|---|---|---|---|---|---|---|---|---|---|---|---|---|---|---|---|---|---|---|---|---|---|---|---|---|---|---|---|---|---|---|---|---|---|---|---|---|---|---|---|---|---|---|---|---|---|---|---|---|---|---|---|---|---|---|---|---|---|---|---|---|---|---|---|---|---|---|---|---|---|---|
| 2015 Jun 7 ± 1 days - 2016 Nov 1 ± 30 days | Evidence from Observations: Reported | ||||||||||||||||||||||||||||||||||||||||||||||||||||||||||||||||||||||||||||||||||||||||||||||||||||||||||||||||||||||||||||||||||||||||||||||||||||||||||||||||||||||||||||||||||||||||||||||||||||||||||||||||||||||||||
|
List of 42 Events for Episode 1 at MacKenney Crater
|
|||||||||||||||||||||||||||||||||||||||||||||||||||||||||||||||||||||||||||||||||||||||||||||||||||||||||||||||||||||||||||||||||||||||||||||||||||||||||||||||||||||||||||||||||||||||||||||||||||||||||||||||||||||||||||
| Episode 2 | Eruption (Explosive / Effusive) | MacKenney Cone | ||||||||||||||||||||||||||||||||||||||||||||||||||||||||||||||||||||||||||||||||||||||||||||||||||||||||||||||||||||||||||||||||||||||||||||||||||||||||||||||||||||||||
|---|---|---|---|---|---|---|---|---|---|---|---|---|---|---|---|---|---|---|---|---|---|---|---|---|---|---|---|---|---|---|---|---|---|---|---|---|---|---|---|---|---|---|---|---|---|---|---|---|---|---|---|---|---|---|---|---|---|---|---|---|---|---|---|---|---|---|---|---|---|---|---|---|---|---|---|---|---|---|---|---|---|---|---|---|---|---|---|---|---|---|---|---|---|---|---|---|---|---|---|---|---|---|---|---|---|---|---|---|---|---|---|---|---|---|---|---|---|---|---|---|---|---|---|---|---|---|---|---|---|---|---|---|---|---|---|---|---|---|---|---|---|---|---|---|---|---|---|---|---|---|---|---|---|---|---|---|---|---|---|---|---|---|---|---|---|---|---|---|---|
| 2017 Jan 10 - 2017 Jun 30 (on or before) | Evidence from Observations: Reported | ||||||||||||||||||||||||||||||||||||||||||||||||||||||||||||||||||||||||||||||||||||||||||||||||||||||||||||||||||||||||||||||||||||||||||||||||||||||||||||||||||||||||
|
List of 32 Events for Episode 2 at MacKenney Cone
|
|||||||||||||||||||||||||||||||||||||||||||||||||||||||||||||||||||||||||||||||||||||||||||||||||||||||||||||||||||||||||||||||||||||||||||||||||||||||||||||||||||||||||
| Episode 3 | Eruption (Explosive / Effusive) | MacKenney Crater | ||||||||||||||||||||||||||||||||||||||||||||||||||||||||||||||||||||||||||||||||||||||||||||||||||||||||||||||||||||||||||||||||||||||||||||||||||||||||||||||||||||||||||||||||||||||||||||||||||||||||||||||||||||||||||||||||||||||||||||||||||||||||||||||||||||||||||||||||||||||||||||||||||||||||||||||||||||||||||||||||||||||||||||||||||||||||||||||||||||||||||||||||||||||||||||||||||||||||||||||||||||||||||||||||||||||||||||||||||||||||||||||||||||||||||||||||||||||||||||||||||||||||||||||||||||||||||||||||||||||||||||||||||||||||||||||||||||||||||||||||||||||||||||||||||||||||||||||||||||||||||||||||||||||||||||||||||||||||||||||||||||||||||||||||||||||||||||||||||||||||||||||||||||||||||||||||||||||||||||||||||||||||||||||||||||||||||||||||||||||||||||||||||||||||||||||||||||||||||||||||||||||||||||||||||||||||||||||||||||||||||||||||||||||||||||||||||||||||||||||||||||||||||||||||||||||||||||||||||||||||||||||||||||||||||||||||||||||||||||||||||||||||||||||||||||||||||||||||||||||
|---|---|---|---|---|---|---|---|---|---|---|---|---|---|---|---|---|---|---|---|---|---|---|---|---|---|---|---|---|---|---|---|---|---|---|---|---|---|---|---|---|---|---|---|---|---|---|---|---|---|---|---|---|---|---|---|---|---|---|---|---|---|---|---|---|---|---|---|---|---|---|---|---|---|---|---|---|---|---|---|---|---|---|---|---|---|---|---|---|---|---|---|---|---|---|---|---|---|---|---|---|---|---|---|---|---|---|---|---|---|---|---|---|---|---|---|---|---|---|---|---|---|---|---|---|---|---|---|---|---|---|---|---|---|---|---|---|---|---|---|---|---|---|---|---|---|---|---|---|---|---|---|---|---|---|---|---|---|---|---|---|---|---|---|---|---|---|---|---|---|---|---|---|---|---|---|---|---|---|---|---|---|---|---|---|---|---|---|---|---|---|---|---|---|---|---|---|---|---|---|---|---|---|---|---|---|---|---|---|---|---|---|---|---|---|---|---|---|---|---|---|---|---|---|---|---|---|---|---|---|---|---|---|---|---|---|---|---|---|---|---|---|---|---|---|---|---|---|---|---|---|---|---|---|---|---|---|---|---|---|---|---|---|---|---|---|---|---|---|---|---|---|---|---|---|---|---|---|---|---|---|---|---|---|---|---|---|---|---|---|---|---|---|---|---|---|---|---|---|---|---|---|---|---|---|---|---|---|---|---|---|---|---|---|---|---|---|---|---|---|---|---|---|---|---|---|---|---|---|---|---|---|---|---|---|---|---|---|---|---|---|---|---|---|---|---|---|---|---|---|---|---|---|---|---|---|---|---|---|---|---|---|---|---|---|---|---|---|---|---|---|---|---|---|---|---|---|---|---|---|---|---|---|---|---|---|---|---|---|---|---|---|---|---|---|---|---|---|---|---|---|---|---|---|---|---|---|---|---|---|---|---|---|---|---|---|---|---|---|---|---|---|---|---|---|---|---|---|---|---|---|---|---|---|---|---|---|---|---|---|---|---|---|---|---|---|---|---|---|---|---|---|---|---|---|---|---|---|---|---|---|---|---|---|---|---|---|---|---|---|---|---|---|---|---|---|---|---|---|---|---|---|---|---|---|---|---|---|---|---|---|---|---|---|---|---|---|---|---|---|---|---|---|---|---|---|---|---|---|---|---|---|---|---|---|---|---|---|---|---|---|---|---|---|---|---|---|---|---|---|---|---|---|---|---|---|---|---|---|---|---|---|---|---|---|---|---|---|---|---|---|---|---|---|---|---|---|---|---|---|---|---|---|---|---|---|---|---|---|---|---|---|---|---|---|---|---|---|---|---|---|---|---|---|---|---|---|---|---|---|---|---|---|---|---|---|---|---|---|---|---|---|---|---|---|---|---|---|---|---|---|---|---|---|---|---|---|---|---|---|---|---|---|---|---|---|---|---|---|---|---|---|---|---|---|---|---|---|---|---|---|---|---|---|---|---|---|---|---|---|---|---|---|---|---|---|---|---|---|---|---|---|---|---|---|---|---|---|---|---|---|---|---|---|---|---|---|---|---|---|---|---|---|---|---|---|---|---|---|---|---|---|---|---|---|---|---|---|---|---|---|---|---|---|---|---|---|---|---|---|---|---|---|---|---|---|---|---|---|---|---|---|---|---|---|---|---|---|---|---|---|---|---|---|---|---|---|---|---|---|---|---|---|---|---|---|---|---|---|---|---|---|---|---|---|---|---|---|---|---|---|---|---|---|---|---|---|---|---|---|---|---|---|---|---|---|---|---|---|---|---|---|---|---|---|---|---|---|---|---|---|---|---|---|---|---|---|---|---|---|---|---|---|---|---|---|---|---|---|---|---|---|---|---|---|---|---|---|---|---|---|---|---|---|---|---|---|---|---|---|---|---|---|---|---|---|---|---|---|---|---|---|---|---|---|---|---|---|---|---|---|---|---|---|---|---|---|---|---|---|---|---|---|---|---|---|---|---|---|---|---|---|---|---|---|---|---|---|---|---|---|---|---|---|---|---|---|---|---|---|---|---|---|---|---|---|---|---|---|---|---|---|---|---|---|---|---|---|---|---|---|---|---|---|---|---|---|---|---|---|---|---|---|---|---|---|---|---|---|---|---|---|---|---|---|---|---|---|---|---|---|---|---|---|---|---|---|---|---|---|---|---|---|---|---|---|---|---|---|---|---|---|---|---|---|---|---|---|---|---|---|---|---|---|---|---|---|---|---|---|---|---|---|---|---|---|---|---|---|---|---|---|---|---|---|---|---|---|---|---|
| 2017 Aug 11 - 2021 Aug 13 | Evidence from Observations: Reported | ||||||||||||||||||||||||||||||||||||||||||||||||||||||||||||||||||||||||||||||||||||||||||||||||||||||||||||||||||||||||||||||||||||||||||||||||||||||||||||||||||||||||||||||||||||||||||||||||||||||||||||||||||||||||||||||||||||||||||||||||||||||||||||||||||||||||||||||||||||||||||||||||||||||||||||||||||||||||||||||||||||||||||||||||||||||||||||||||||||||||||||||||||||||||||||||||||||||||||||||||||||||||||||||||||||||||||||||||||||||||||||||||||||||||||||||||||||||||||||||||||||||||||||||||||||||||||||||||||||||||||||||||||||||||||||||||||||||||||||||||||||||||||||||||||||||||||||||||||||||||||||||||||||||||||||||||||||||||||||||||||||||||||||||||||||||||||||||||||||||||||||||||||||||||||||||||||||||||||||||||||||||||||||||||||||||||||||||||||||||||||||||||||||||||||||||||||||||||||||||||||||||||||||||||||||||||||||||||||||||||||||||||||||||||||||||||||||||||||||||||||||||||||||||||||||||||||||||||||||||||||||||||||||||||||||||||||||||||||||||||||||||||||||||||||||||||||||||||||||||
|
List of 390 Events for Episode 3 at MacKenney Crater
|
|||||||||||||||||||||||||||||||||||||||||||||||||||||||||||||||||||||||||||||||||||||||||||||||||||||||||||||||||||||||||||||||||||||||||||||||||||||||||||||||||||||||||||||||||||||||||||||||||||||||||||||||||||||||||||||||||||||||||||||||||||||||||||||||||||||||||||||||||||||||||||||||||||||||||||||||||||||||||||||||||||||||||||||||||||||||||||||||||||||||||||||||||||||||||||||||||||||||||||||||||||||||||||||||||||||||||||||||||||||||||||||||||||||||||||||||||||||||||||||||||||||||||||||||||||||||||||||||||||||||||||||||||||||||||||||||||||||||||||||||||||||||||||||||||||||||||||||||||||||||||||||||||||||||||||||||||||||||||||||||||||||||||||||||||||||||||||||||||||||||||||||||||||||||||||||||||||||||||||||||||||||||||||||||||||||||||||||||||||||||||||||||||||||||||||||||||||||||||||||||||||||||||||||||||||||||||||||||||||||||||||||||||||||||||||||||||||||||||||||||||||||||||||||||||||||||||||||||||||||||||||||||||||||||||||||||||||||||||||||||||||||||||||||||||||||||||||||||||||||||
2014 Aug 25 - 2015 Feb 17 Confirmed Eruption (Explosive / Effusive) VEI: 1
| Episode 1 | Eruption (Explosive / Effusive) | MacKenney Crater | ||||||||||||||||||||||||||||||||||||||||||||||||||||||||||
|---|---|---|---|---|---|---|---|---|---|---|---|---|---|---|---|---|---|---|---|---|---|---|---|---|---|---|---|---|---|---|---|---|---|---|---|---|---|---|---|---|---|---|---|---|---|---|---|---|---|---|---|---|---|---|---|---|---|---|---|
| 2014 Aug 25 - 2015 Feb 17 | Evidence from Observations: Reported | ||||||||||||||||||||||||||||||||||||||||||||||||||||||||||
|
List of 10 Events for Episode 1 at MacKenney Crater
|
|||||||||||||||||||||||||||||||||||||||||||||||||||||||||||
2013 Mar 5 - 2014 Apr 10 Confirmed Eruption (Explosive / Effusive) VEI: 2
| Episode 1 | Eruption (Explosive / Effusive) | MacKenney Crater | ||||||||||||||||||||||||||||||||||||||||||||||||||||||||||||||||||||||||||||||||||||||||||||||||||||||||||||||||||||||||||||||||||||||||||||||||||||||||||||||||||||||||||||||||||||||||||||||||||||||||||||||||||||||||||||||||||||||||||||||||||||||||
|---|---|---|---|---|---|---|---|---|---|---|---|---|---|---|---|---|---|---|---|---|---|---|---|---|---|---|---|---|---|---|---|---|---|---|---|---|---|---|---|---|---|---|---|---|---|---|---|---|---|---|---|---|---|---|---|---|---|---|---|---|---|---|---|---|---|---|---|---|---|---|---|---|---|---|---|---|---|---|---|---|---|---|---|---|---|---|---|---|---|---|---|---|---|---|---|---|---|---|---|---|---|---|---|---|---|---|---|---|---|---|---|---|---|---|---|---|---|---|---|---|---|---|---|---|---|---|---|---|---|---|---|---|---|---|---|---|---|---|---|---|---|---|---|---|---|---|---|---|---|---|---|---|---|---|---|---|---|---|---|---|---|---|---|---|---|---|---|---|---|---|---|---|---|---|---|---|---|---|---|---|---|---|---|---|---|---|---|---|---|---|---|---|---|---|---|---|---|---|---|---|---|---|---|---|---|---|---|---|---|---|---|---|---|---|---|---|---|---|---|---|---|---|---|---|---|---|---|---|---|---|---|---|---|---|---|---|---|---|---|---|---|---|---|---|---|---|---|---|---|
| 2013 Mar 5 - 2014 Apr 10 | Evidence from Observations: Reported | ||||||||||||||||||||||||||||||||||||||||||||||||||||||||||||||||||||||||||||||||||||||||||||||||||||||||||||||||||||||||||||||||||||||||||||||||||||||||||||||||||||||||||||||||||||||||||||||||||||||||||||||||||||||||||||||||||||||||||||||||||||||||
|
List of 48 Events for Episode 1 at MacKenney Crater
|
|||||||||||||||||||||||||||||||||||||||||||||||||||||||||||||||||||||||||||||||||||||||||||||||||||||||||||||||||||||||||||||||||||||||||||||||||||||||||||||||||||||||||||||||||||||||||||||||||||||||||||||||||||||||||||||||||||||||||||||||||||||||||
2006 Mar 9 - 2010 Oct 26 Confirmed Eruption (Explosive / Effusive) VEI: 3
| Episode 1 | Eruption (Explosive / Effusive) | MacKenney Cone | ||||||||||||||||||||||||||||
|---|---|---|---|---|---|---|---|---|---|---|---|---|---|---|---|---|---|---|---|---|---|---|---|---|---|---|---|---|---|
| 2006 Mar 9 - 2010 Oct 26 | Evidence from Observations: Reported | ||||||||||||||||||||||||||||
|
List of 4 Events for Episode 1 at MacKenney Cone
|
|||||||||||||||||||||||||||||
2004 Jul 19 (?) - 2005 Sep 11 Confirmed Eruption (Explosive / Effusive) VEI: 1
| Episode 1 | Eruption (Explosive / Effusive) | MacKenney Cone and lower S flank | |||||||||||||||||||||||||||||||||||||||||||||||||||||||||||||||||||||||||
|---|---|---|---|---|---|---|---|---|---|---|---|---|---|---|---|---|---|---|---|---|---|---|---|---|---|---|---|---|---|---|---|---|---|---|---|---|---|---|---|---|---|---|---|---|---|---|---|---|---|---|---|---|---|---|---|---|---|---|---|---|---|---|---|---|---|---|---|---|---|---|---|---|---|---|
| 2004 Jul 19 (?) - 2005 Sep 11 | Evidence from Observations: Reported | |||||||||||||||||||||||||||||||||||||||||||||||||||||||||||||||||||||||||
|
List of 13 Events for Episode 1 at MacKenney Cone and lower S flank
|
||||||||||||||||||||||||||||||||||||||||||||||||||||||||||||||||||||||||||
2002 May 30 - 2002 Jun 17 (?) Confirmed Eruption (Explosive / Effusive) VEI: 1 (?)
| Episode 1 | Eruption (Explosive / Effusive) | MacKenney Crater | |||||||||||||||||||||||
|---|---|---|---|---|---|---|---|---|---|---|---|---|---|---|---|---|---|---|---|---|---|---|---|---|
| 2002 May 30 - 2002 Jun 17 (?) | Evidence from Observations: Reported | |||||||||||||||||||||||
|
List of 3 Events for Episode 1 at MacKenney Crater
|
||||||||||||||||||||||||
2001 Oct 31 - 2001 Oct 31 Confirmed Eruption (Explosive / Effusive) VEI: 1
| Episode 1 | Eruption (Explosive / Effusive) | MacKenney Crater | |||||||||||||||||||||||
|---|---|---|---|---|---|---|---|---|---|---|---|---|---|---|---|---|---|---|---|---|---|---|---|---|
| 2001 Oct 31 - 2001 Oct 31 | Evidence from Observations: Reported | |||||||||||||||||||||||
|
List of 3 Events for Episode 1 at MacKenney Crater
|
||||||||||||||||||||||||
2000 Aug 16 ± 15 days - 2001 Jul 5 (?) Confirmed Eruption (Explosive / Effusive) VEI: 1
| Episode 1 | Eruption (Explosive / Effusive) | MacKenney Crater | ||||||||||||||||||||||||||||
|---|---|---|---|---|---|---|---|---|---|---|---|---|---|---|---|---|---|---|---|---|---|---|---|---|---|---|---|---|---|
| 2000 Aug 16 ± 15 days - 2001 Jul 5 (?) | Evidence from Observations: Reported | ||||||||||||||||||||||||||||
|
List of 4 Events for Episode 1 at MacKenney Crater
|
|||||||||||||||||||||||||||||
1990 Jan 4 (?) - 2000 Mar 1 Confirmed Eruption (Explosive / Effusive) VEI: 3
| Episode 1 | Eruption (Explosive / Effusive) | MacKenney Crater and flank vents | |||||||||||||||||||||||||||||||||||||||||||||||||||||||||||||||||||||||||||||||||||||||||||||||||||||||||||||||||||||||||||||||||||||||||||||||||||||||||
|---|---|---|---|---|---|---|---|---|---|---|---|---|---|---|---|---|---|---|---|---|---|---|---|---|---|---|---|---|---|---|---|---|---|---|---|---|---|---|---|---|---|---|---|---|---|---|---|---|---|---|---|---|---|---|---|---|---|---|---|---|---|---|---|---|---|---|---|---|---|---|---|---|---|---|---|---|---|---|---|---|---|---|---|---|---|---|---|---|---|---|---|---|---|---|---|---|---|---|---|---|---|---|---|---|---|---|---|---|---|---|---|---|---|---|---|---|---|---|---|---|---|---|---|---|---|---|---|---|---|---|---|---|---|---|---|---|---|---|---|---|---|---|---|---|---|---|---|---|---|---|---|---|---|---|
| 1990 Jan 4 (?) - 2000 Mar 1 | Evidence from Observations: Reported | |||||||||||||||||||||||||||||||||||||||||||||||||||||||||||||||||||||||||||||||||||||||||||||||||||||||||||||||||||||||||||||||||||||||||||||||||||||||||
|
List of 29 Events for Episode 1 at MacKenney Crater and flank vents
|
||||||||||||||||||||||||||||||||||||||||||||||||||||||||||||||||||||||||||||||||||||||||||||||||||||||||||||||||||||||||||||||||||||||||||||||||||||||||||
1965 Jul 4 - 1989 Mar 10 Confirmed Eruption (Explosive / Effusive) VEI: 3
| Episode 1 | Eruption (Explosive / Effusive) | MacKenney Crater and flank vents | |||||||||||||||||||||||||||||||||||||||||||||||||||||||||||||||||||||||||||||||||||||||||||||||||||||||||||||||||||||||||||||||||||||||||||||||
|---|---|---|---|---|---|---|---|---|---|---|---|---|---|---|---|---|---|---|---|---|---|---|---|---|---|---|---|---|---|---|---|---|---|---|---|---|---|---|---|---|---|---|---|---|---|---|---|---|---|---|---|---|---|---|---|---|---|---|---|---|---|---|---|---|---|---|---|---|---|---|---|---|---|---|---|---|---|---|---|---|---|---|---|---|---|---|---|---|---|---|---|---|---|---|---|---|---|---|---|---|---|---|---|---|---|---|---|---|---|---|---|---|---|---|---|---|---|---|---|---|---|---|---|---|---|---|---|---|---|---|---|---|---|---|---|---|---|---|---|---|---|---|---|---|
| 1965 Jul 4 - 1989 Mar 10 | Evidence from Observations: Reported | |||||||||||||||||||||||||||||||||||||||||||||||||||||||||||||||||||||||||||||||||||||||||||||||||||||||||||||||||||||||||||||||||||||||||||||||
|
List of 27 Events for Episode 1 at MacKenney Crater and flank vents
|
||||||||||||||||||||||||||||||||||||||||||||||||||||||||||||||||||||||||||||||||||||||||||||||||||||||||||||||||||||||||||||||||||||||||||||||||
1961 Mar 11 - 1961 Apr 15 (?) Confirmed Eruption (Explosive / Effusive) VEI: 2
| Episode 1 | Eruption (Explosive / Effusive) | Cachajinas vent (South flank, 1860 m) | |||||||||||||||||||||||||||||||||||||||||||
|---|---|---|---|---|---|---|---|---|---|---|---|---|---|---|---|---|---|---|---|---|---|---|---|---|---|---|---|---|---|---|---|---|---|---|---|---|---|---|---|---|---|---|---|---|
| 1961 Mar 11 - 1961 Apr 15 (?) | Evidence from Observations: Reported | |||||||||||||||||||||||||||||||||||||||||||
|
List of 7 Events for Episode 1 at Cachajinas vent (South flank, 1860 m)
|
||||||||||||||||||||||||||||||||||||||||||||
1885 Dec Confirmed Eruption (Explosive / Effusive) VEI: 2
| Episode 1 | Eruption (Explosive / Effusive) | ||||||||||||||||||||||||
|---|---|---|---|---|---|---|---|---|---|---|---|---|---|---|---|---|---|---|---|---|---|---|---|---|
| 1885 Dec - Unknown | Evidence from Observations: Reported | |||||||||||||||||||||||
|
List of 3 Events for Episode 1
|
||||||||||||||||||||||||
1846 Feb Confirmed Eruption (Explosive / Effusive) VEI: 2
| Episode 1 | Eruption (Explosive / Effusive) | Cerro Chino | ||||||||||||||||||||||||||||
|---|---|---|---|---|---|---|---|---|---|---|---|---|---|---|---|---|---|---|---|---|---|---|---|---|---|---|---|---|---|
| 1846 Feb - Unknown | Evidence from Observations: Reported | ||||||||||||||||||||||||||||
|
List of 4 Events for Episode 1 at Cerro Chino
|
|||||||||||||||||||||||||||||
[ 1830 ] Uncertain Eruption
| Episode 1 | Eruption (Explosive / Effusive) | |||||||||||||||||||
|---|---|---|---|---|---|---|---|---|---|---|---|---|---|---|---|---|---|---|---|
| 1830 - Unknown | Evidence from Unknown | ||||||||||||||||||
|
List of 2 Events for Episode 1
|
|||||||||||||||||||
1805 Confirmed Eruption (Explosive / Effusive) VEI: 2
| Episode 1 | Eruption (Explosive / Effusive) | |||||||||||||||||||||||||||||
|---|---|---|---|---|---|---|---|---|---|---|---|---|---|---|---|---|---|---|---|---|---|---|---|---|---|---|---|---|---|
| 1805 - Unknown | Evidence from Observations: Reported | ||||||||||||||||||||||||||||
|
List of 4 Events for Episode 1
|
|||||||||||||||||||||||||||||
1775 Jul 1 - 1775 Jul 23 (on or after) Confirmed Eruption (Explosive / Effusive) VEI: 3
| Episode 1 | Eruption (Explosive / Effusive) | Cerro Chino (SW flank and summit) | |||||||||||||||||||||||||||||||||
|---|---|---|---|---|---|---|---|---|---|---|---|---|---|---|---|---|---|---|---|---|---|---|---|---|---|---|---|---|---|---|---|---|---|---|
| 1775 Jul 1 - 1775 Jul 23 (on or after) | Evidence from Observations: Reported | |||||||||||||||||||||||||||||||||
|
List of 5 Events for Episode 1 at Cerro Chino (SW flank and summit)
|
||||||||||||||||||||||||||||||||||
[ 1760 ] Uncertain Eruption
| Episode 1 | Eruption (Explosive / Effusive) | ||||||||||||||
|---|---|---|---|---|---|---|---|---|---|---|---|---|---|---|
| 1760 - Unknown | Evidence from Unknown | |||||||||||||
|
List of 1 Events for Episode 1
|
||||||||||||||
[ 1717 ] Uncertain Eruption
| Episode 1 | Eruption (Explosive / Effusive) | ||||||||||||||
|---|---|---|---|---|---|---|---|---|---|---|---|---|---|---|
| 1717 - Unknown | Evidence from Unknown | |||||||||||||
|
List of 1 Events for Episode 1
|
||||||||||||||
1699 Jun 29 Confirmed Eruption (Explosive / Effusive) VEI: 2 (?)
| Episode 1 | Eruption (Explosive / Effusive) | |||||||||||||||||||
|---|---|---|---|---|---|---|---|---|---|---|---|---|---|---|---|---|---|---|---|
| 1699 Jun 29 - Unknown | Evidence from Observations: Reported | ||||||||||||||||||
|
List of 2 Events for Episode 1
|
|||||||||||||||||||
1693 Confirmed Eruption (Explosive / Effusive) VEI: 2 (?)
| Episode 1 | Eruption (Explosive / Effusive) | ||||||||||||||||||||||||
|---|---|---|---|---|---|---|---|---|---|---|---|---|---|---|---|---|---|---|---|---|---|---|---|---|
| 1693 - Unknown | Evidence from Observations: Reported | |||||||||||||||||||||||
|
List of 3 Events for Episode 1
|
||||||||||||||||||||||||
1690 Confirmed Eruption (Explosive / Effusive) VEI: 2 (?)
| Episode 1 | Eruption (Explosive / Effusive) | ||||||||||||||||||||||||
|---|---|---|---|---|---|---|---|---|---|---|---|---|---|---|---|---|---|---|---|---|---|---|---|---|
| 1690 - Unknown | Evidence from Observations: Reported | |||||||||||||||||||||||
|
List of 3 Events for Episode 1
|
||||||||||||||||||||||||
1687 Mar 26 - 1687 Mar 27 Confirmed Eruption (Explosive / Effusive) VEI: 2
| Episode 1 | Eruption (Explosive / Effusive) | |||||||||||||||||||||||||||||
|---|---|---|---|---|---|---|---|---|---|---|---|---|---|---|---|---|---|---|---|---|---|---|---|---|---|---|---|---|---|
| 1687 Mar 26 - 1687 Mar 27 | Evidence from Observations: Reported | ||||||||||||||||||||||||||||
|
List of 4 Events for Episode 1
|
|||||||||||||||||||||||||||||
1678 Aug (?) Confirmed Eruption (Explosive / Effusive) VEI: 2
| Episode 1 | Eruption (Explosive / Effusive) | |||||||||||||||||||||||||||||
|---|---|---|---|---|---|---|---|---|---|---|---|---|---|---|---|---|---|---|---|---|---|---|---|---|---|---|---|---|---|
| 1678 Aug (?) - Unknown | Evidence from Observations: Reported | ||||||||||||||||||||||||||||
|
List of 4 Events for Episode 1
|
|||||||||||||||||||||||||||||
[ 1677 Jul ] Uncertain Eruption
| Episode 1 | Eruption (Explosive / Effusive) | ||||||||||||||
|---|---|---|---|---|---|---|---|---|---|---|---|---|---|---|
| 1677 Jul - Unknown | Evidence from Unknown | |||||||||||||
|
List of 1 Events for Episode 1
|
||||||||||||||
1674 Jul Confirmed Eruption (Explosive / Effusive) VEI: 2
| Episode 1 | Eruption (Explosive / Effusive) | |||||||||||||||||||
|---|---|---|---|---|---|---|---|---|---|---|---|---|---|---|---|---|---|---|---|
| 1674 Jul - Unknown | Evidence from Observations: Reported | ||||||||||||||||||
|
List of 2 Events for Episode 1
|
|||||||||||||||||||
1671 Aug Confirmed Eruption (Explosive / Effusive) VEI: 2
| Episode 1 | Eruption (Explosive / Effusive) | |||||||||||||||||||
|---|---|---|---|---|---|---|---|---|---|---|---|---|---|---|---|---|---|---|---|
| 1671 Aug - Unknown | Evidence from Observations: Reported | ||||||||||||||||||
|
List of 2 Events for Episode 1
|
|||||||||||||||||||
1668 Aug - 1669 Jun 29 Confirmed Eruption (Explosive / Effusive) VEI: 2
| Episode 1 | Eruption (Explosive / Effusive) | ||||||||||||||||||||||||
|---|---|---|---|---|---|---|---|---|---|---|---|---|---|---|---|---|---|---|---|---|---|---|---|---|
| 1668 Aug - 1669 Jun 29 | Evidence from Observations: Reported | |||||||||||||||||||||||
|
List of 3 Events for Episode 1
|
||||||||||||||||||||||||
1664 Confirmed Eruption (Explosive / Effusive) VEI: 3
| Episode 1 | Eruption (Explosive / Effusive) | ||||||||||||||||||||||||||||||||||
|---|---|---|---|---|---|---|---|---|---|---|---|---|---|---|---|---|---|---|---|---|---|---|---|---|---|---|---|---|---|---|---|---|---|---|
| 1664 - Unknown | Evidence from Observations: Reported | |||||||||||||||||||||||||||||||||
|
List of 5 Events for Episode 1
|
||||||||||||||||||||||||||||||||||
1655 Jul Confirmed Eruption (Explosive / Effusive) VEI: 2
| Episode 1 | Eruption (Explosive / Effusive) | |||||||||||||||||||||||||||||
|---|---|---|---|---|---|---|---|---|---|---|---|---|---|---|---|---|---|---|---|---|---|---|---|---|---|---|---|---|---|
| 1655 Jul - Unknown | Evidence from Observations: Reported | ||||||||||||||||||||||||||||
|
List of 4 Events for Episode 1
|
|||||||||||||||||||||||||||||
1651 Feb 18 - 1651 Apr 13 Confirmed Eruption (Explosive / Effusive) VEI: 2
| Episode 1 | Eruption (Explosive / Effusive) | ||||||||||||||||||||||||||||||||||||||||||||
|---|---|---|---|---|---|---|---|---|---|---|---|---|---|---|---|---|---|---|---|---|---|---|---|---|---|---|---|---|---|---|---|---|---|---|---|---|---|---|---|---|---|---|---|---|
| 1651 Feb 18 - 1651 Apr 13 | Evidence from Observations: Reported | |||||||||||||||||||||||||||||||||||||||||||
|
List of 7 Events for Episode 1
|
||||||||||||||||||||||||||||||||||||||||||||
1623 (?) Confirmed Eruption (Explosive / Effusive) VEI: 3
| Episode 1 | Eruption (Explosive / Effusive) | ||||||||||||||||||||||||
|---|---|---|---|---|---|---|---|---|---|---|---|---|---|---|---|---|---|---|---|---|---|---|---|---|
| 1623 (?) - Unknown | Evidence from Observations: Reported | |||||||||||||||||||||||
|
List of 3 Events for Episode 1
|
||||||||||||||||||||||||
1565 Aug (?) Confirmed Eruption (Explosive / Effusive) VEI: 3
| Episode 1 | Eruption (Explosive / Effusive) | Cerro Chino, Pc-Pt 12 tephra | |||||||||||||||||||||||||||||||||||||||||||
|---|---|---|---|---|---|---|---|---|---|---|---|---|---|---|---|---|---|---|---|---|---|---|---|---|---|---|---|---|---|---|---|---|---|---|---|---|---|---|---|---|---|---|---|---|
| 1565 Aug (?) - Unknown | Evidence from Observations: Reported | |||||||||||||||||||||||||||||||||||||||||||
|
List of 7 Events for Episode 1 at Cerro Chino, Pc-Pt 12 tephra
|
||||||||||||||||||||||||||||||||||||||||||||
1360 ± 75 years Confirmed Eruption (Explosive / Effusive) VEI: 3 (?)
| Episode 1 | Eruption (Explosive / Effusive) | Cerro Chino, Pc-Pt 8 tephra | |||||||||||||||||||||||||||||||||
|---|---|---|---|---|---|---|---|---|---|---|---|---|---|---|---|---|---|---|---|---|---|---|---|---|---|---|---|---|---|---|---|---|---|---|
| 1360 ± 75 years - Unknown | Evidence from Isotopic: 14C (uncalibrated) | |||||||||||||||||||||||||||||||||
|
List of 5 Events for Episode 1 at Cerro Chino, Pc-Pt 8 tephra
|
||||||||||||||||||||||||||||||||||
1160 ± 75 years Confirmed Eruption (Explosive / Effusive) VEI: 3 (?)
| Episode 1 | Eruption (Explosive / Effusive) | MacKenney Crater, Pc-Pt 10 tephra | ||||||||||||||||||||||||||||||||||||||
|---|---|---|---|---|---|---|---|---|---|---|---|---|---|---|---|---|---|---|---|---|---|---|---|---|---|---|---|---|---|---|---|---|---|---|---|---|---|---|---|
| 1160 ± 75 years - Unknown | Evidence from Isotopic: 14C (uncalibrated) | ||||||||||||||||||||||||||||||||||||||
|
List of 6 Events for Episode 1 at MacKenney Crater, Pc-Pt 10 tephra
|
|||||||||||||||||||||||||||||||||||||||
0880 ± 500 years Confirmed Eruption (Explosive / Effusive) VEI: 3 (?)
| Episode 1 | Eruption (Explosive / Effusive) | Pc-Pt 5 tephra, Pacaya debris avalanche | ||||||||||||||||||||||||||||||||||||||
|---|---|---|---|---|---|---|---|---|---|---|---|---|---|---|---|---|---|---|---|---|---|---|---|---|---|---|---|---|---|---|---|---|---|---|---|---|---|---|---|
| 0880 ± 500 years - Unknown | Evidence from Correlation: Tephrochronology | ||||||||||||||||||||||||||||||||||||||
|
List of 6 Events for Episode 1 at Pc-Pt 5 tephra, Pacaya debris avalanche
|
|||||||||||||||||||||||||||||||||||||||
0400 ± 50 years Confirmed Eruption (Explosive / Effusive) VEI: 2
| Episode 1 | Eruption (Explosive / Effusive) | Pc-Pt 1 tephra | ||||||||||||||||||||||||||||
|---|---|---|---|---|---|---|---|---|---|---|---|---|---|---|---|---|---|---|---|---|---|---|---|---|---|---|---|---|---|
| 0400 ± 50 years - Unknown | Evidence from Isotopic: 14C (uncalibrated) | ||||||||||||||||||||||||||||
|
List of 4 Events for Episode 1 at Pc-Pt 1 tephra
|
|||||||||||||||||||||||||||||
This compilation of synonyms and subsidiary features may not be comprehensive. Features are organized into four major categories: Cones, Craters, Domes, and Thermal Features. Synonyms of features appear indented below the primary name. In some cases additional feature type, elevation, or location details are provided.
Synonyms |
||||
| Pecul | San Juan de Amatitlán | Apacagua | ||||
Cones |
||||
| Feature Name | Feature Type | Elevation | Latitude | Longitude |
| Cerra, La | Cone | |||
| Chino, Cerro | Pyroclastic cone | 2241 m | 14° 23' 26.00" N | 90° 36' 25.00" W |
| Grande, Cerro | Stratovolcano | 2541 m | 14° 23' 26.00" N | 90° 35' 11.00" W |
| Mackenney | Stratovolcano | 2569 m | 14° 22' 57.00" N | 90° 36' 5.00" W |
| Pacaya Viejo | Stratovolcano | |||
| Volcancito | Cone | |||
Craters |
||||
| Feature Name | Feature Type | Elevation | Latitude | Longitude |
| Amatitlán | Pleistocene caldera | |||
Domes |
||||
| Feature Name | Feature Type | Elevation | Latitude | Longitude |
| Chiquito, Cerro | Dome | 2427 m | 14° 23' 29.00" N | 90° 35' 36.00" W |
 This photo looking SE across the volcanic chain of Guatemala shows Fuego volcano, lightly dusted with snow, in the foreground, and the symmetrical Agua volcano at the upper left. Twin-peaked Pacaya volcano is located behind the right flank of Agua, and the broad massif in the distance above the summit of Fuego is Tecuamburro volcano. Fuego and Pacaya are two of Guatemala's most active volcanoes.
 The symmetrical, forested Volcán de Agua stratovolcano forms a prominent backdrop to both the historic former capital city of Antigua Guatemala and Guatemala City, the present capital. The 3760-m-high Agua volcano has a small, circular crater that is breached on the NNE side. Agua has had no historical eruptions, but a devastating mudflow on September 11, 1541, destroyed the first Guatemalan capital city, now known as Ciudad Vieja. This view from the NW also shows the twin-peaked Pacaya volcano behind the upper right flank of Agua.
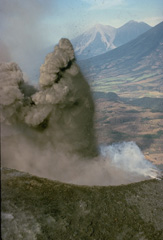 An explosion from MacKenney crater on Pacaya volcano ejects a dark, ash-rich column and individual blocks that are sometimes incandescent even during daylight hours. This December 1974 photo shows Fuego (left) and Acatenango (right) volcanoes in the background, behind the sloping flanks of Agua volcano.
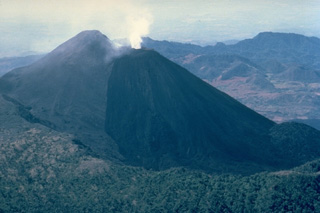 Eruptions from Pacaya, one of Guatemala's most active volcanoes, are frequently visible from Guatemala City, the nation's capital. The modern Pacaya volcano (MacKenney cone) has grown within an arcuate caldera rim (visible at the lower part of this 1983 photo from the NE) that was created by a massive landslide. During the past several decades, activity at Pacaya has consisted of frequent strombolian eruptions with intermittent lava flow extrusion on the flanks of McKenney cone, punctuated by occasional larger explosive eruptions.
 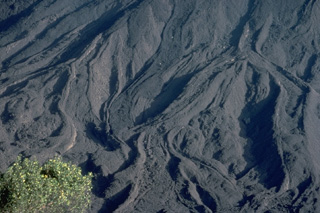 Fresh lava flows drape the slopes of MacKenney cone on Guatemala's Pacaya volcano. This March 1983 photo from Pacaya's caldera rim shows many individual flow lobes whose margins are outlined by prominent levees. A long-term eruption of Pacaya began in 1965. Frequent strombolian eruptions were often visible from Guatemala City, and lava flows such as these armored the slopes of the summit cone.
 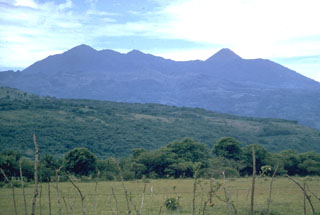 The Pacaya volcanic complex is seen here from the north. The rounded Cerro Grande lava dome forms the high point to the left. The peak to the right is the historically active cone of Pacaya. It was constructed within an arcuate crater whose rim forms the flat ridge on either side of the cone. This September 1962 photo was taken prior to a long-term eruption beginning in 1965 from a new vent on the western flank. Frequent eruptions built MacKenney cone, which grew to the height of the previous cone.
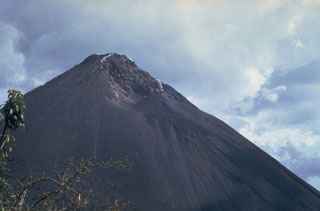 This February 1967 photo, taken from near Cerro Chino on the northern caldera rim, shows the morphology of the MacKenney crater early in the long-lived eruption that began at Pacaya in 1965. Neary continuous explosive activity with periodic lava effusion first began on 4 July 1965 from a 250-m-wide pit crater that had formed in 1962 without eruptive activity.
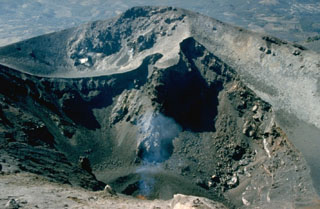 A small spatter cone ejects incandescent lava bombs at the bottom of MacKenney crater in early February 1990. Activity had resumed at Pacaya in early January after a long quiescence following a major explosive eruption 7-10 March 1989. This eruption removed the upper 75 m of MacKenney cone and enlarged the 50 x 75 m crater to the 200 x 350 m seen here.
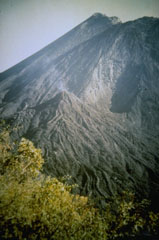 The cone in the center grew on the NE flank of MacKenney cone (background) during a long-term eruption that began in 1965. This small NE-flank vent was active from 5 August 1984 until 6 February 1985 and produced a 50-m-high cone that sent sinuous lava flows its flanks. Later eruptions buried most of the cone before it was destroyed by an explosion in 1995. This 1985 photo was taken by Alfredo MacKenney, the Guatemala City physician and volcano enthusiast for whom the cone was named.
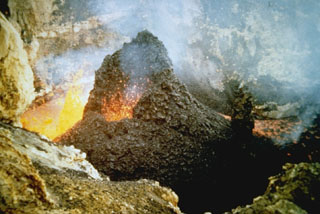 Spatter cones form when blobs of molten lava that are ejected from a vent solidify to form a steep-sided cone. This small spatter cone formed in MacKenney crater of Pacaya volcano in Guatemala on 10 February 1985, during an ongoing eruption that began in 1965. At the time of this photo, the spatter cone was 6-m high, ejecting incandescent volcanic bombs from its vent and extruding lava from its eastern (left) side.
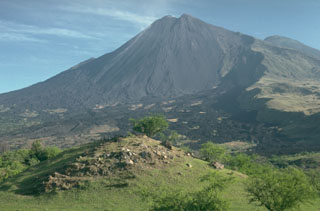 MacKenney cone, the historically active vent of Pacaya volcano in Guatemala, was constructed within a horseshoe-shaped crater produced by collapse of the summit of an ancestral volcano about 1,100 years ago. The SW crater rim forms the steep-sided scarp at the right. The blocky hill in the foreground is a hummock from the debris avalanche produced by the collapse. The avalanche extended for 25 km.
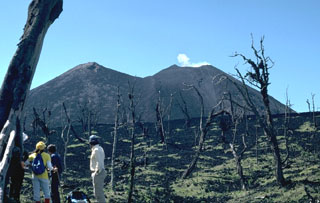 Near-continuous mild Strombolian explosions, such as the one producing the small plume above MacKenney crater at Pacaya to the right, have been punctuated by periodic larger explosions that eject incandescent bombs and large blocks. These trees on the Meseta (foreground) were stripped of vegetation by the larger explosions. The MacKenney cone to the right has been growing since 1965 on the flank of the older cone to the left.
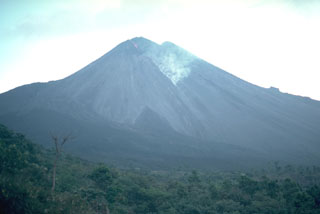 An ash plume generated by collapse of a lava flow front is seen on the SW flank of Pacaya in November 1988. Frequent Strombolian eruptions began at MacKenney cone in 1965 and were often accompanied by lava flows from summit or flank vents, which have traveled out to 6 km down the southern flank.
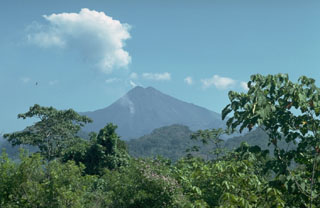 The flanks of Pacaya rise above foothills at the margin of the Pacific coastal plain of Guatemala. The summit is MacKenney cone, which was constructed within a collapse crater produced by the gravitational failure of an ancestral Pacaya edifice. The resulting debris avalanche traveled 25 km from the volcano to near the village of Las Chapernas on the coastal plain, beyond the point of this photo.
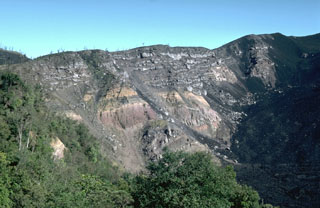 Large-scale collapse of the Pacaya summit sometime between about 1,550 and 600 years ago created a large horseshoe-shaped scarp. Collapse was followed by a large explosive eruption that produced widespread pyroclastic surges. This roughly 150-m-high section of the NW scarp exposes light-colored lava flows overlying pyroclastic deposits of the pre-collapse edifice. Subsequent eruptions have constructed a new cone within the caldera. Lava flows from MacKenney cone (out of view to the right) are slowly filling in the caldera moat.
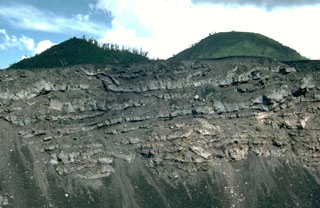 A sequence of thin lava flows forms the upper part of the Pacaya NE crater wall. These basaltic lava flows were erupted during the final stages of an ancestral Pacaya edifice, which collapsed sometime between about 1,550 and 600 years ago to form a large horseshoe-shaped crater. The upper approximately 50 m of the wall is seen in this view with Cerro Grande, an older dome of Pacaya, forming the rounded peak to the right with the Cerro Chiquito cone to the left.
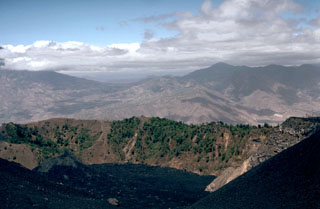 Cerro Chino produced a major eruption in 1775. This eruption began at vents on the SW flank (behind the crater in this view) and then migrated towards the summit. Powerful lava fountains were observed and ashfall was reported up to 200 km away. Recent lava flows are in the foreground.
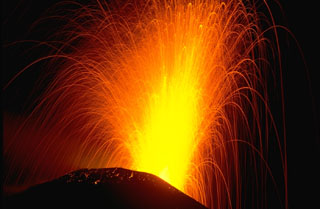 Strombolian explosions such as this one in November 1988 are typical at Pacaya. The ballistic traces of individual volcanic bombs that incrementally build MacKenney cone are seen in this time exposure. Cyclical activity lasting for several decades has consisted of long-term moderate explosive eruptions accompanied by periodic lava effusion that builds up the cone. This long-term moderate activity is punctuated by more infrequent larger explosions that destroy the upper part of the cone, after which the cone is reconstructed.
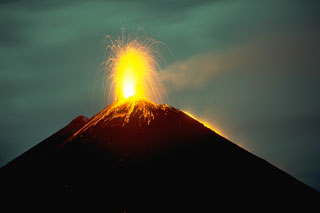 A period of Strombolian activity began at Pacaya in 1965 and continued for over 25 years. Nighttime explosions are often visible from Guatemala City, 40 km N. The accumulation of ejecta from frequent explosions periodically increases the height of MacKenney cone after it has been partially destroyed by intermittent larger explosions. This November 1988 photo also shows a lava flow descending the west flank (right).
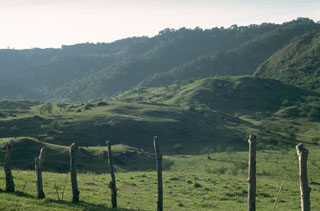 The hilly terrain in the foreground is part of a debris avalanche deposit that extends 25 km from the summit of Pacaya to the Pacific coastal plain. Part of the avalanche traveled more than 100 m up the side of the ridge in the background before coming to rest on the valley floor. The avalanche was accompanied by a pyroclastic surge whose deposits overlie the proximal 10 km.
 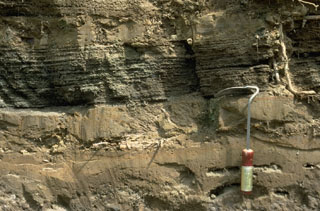 These fine-grained ash layers and coarser laminated scoria-bearing layers were deposited by pyroclastic surges following collapse of the summit of Pacaya. This surge deposit overlies the avalanche deposit and the topography in a 90 degree arc as far as 10 km SW of the summit.
 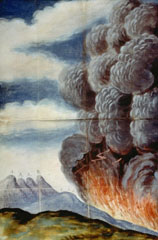 One of the largest historical eruptions of Pacaya, which occurred in 1775, is illustrated in this contemporary painting. The explosive eruption began on 1 July 1775 when several vents opened on the SW flank of Cerro Chino. A lava flow traveled to the south, eventually reaching 1,000 m elevation. The vents migrated towards the summit of Cerro Chino; one reference refers to activity at the summit 22 days into the eruption. Ashfall from this eruption was reported up to 200 km away.
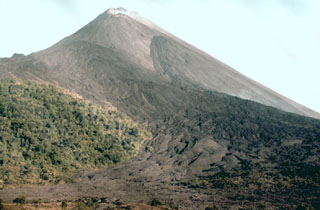 Recent lava flows cover the NW flank of Pacaya. Two prominent flow fields originating from flank vents can be seen in this 1987 photo. The vegetated slopes to the left are below Cerro Chino, a scoria cone on the rim of Pacaya's large horseshoe-shaped crater.
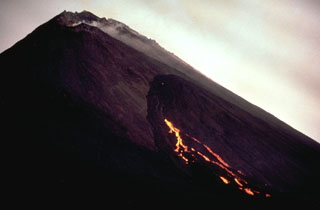 A lava flow extrudes from a WNW-flank vent on MacKenney cone at Pacaya on 10 January 1987. A weak gas plume can be seen from the summit crater, which was producing Strombolian eruptions at the same time.
 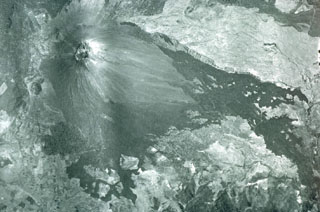 Vegetation-free MacKenney cone was constructed within a large 3 x 6 km crater. The eastern (right) and northern (top) rims are visible in this photo, and formed as a result of massive slope failure of an ancestral Pacaya edifice. Lava flows from MacKenney cone traveled to the west and south beyond the crater.
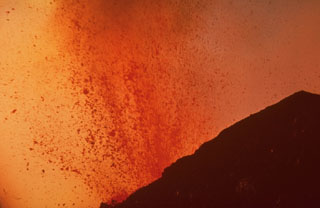 Molten lava bombs ejected from MacKenney crater at Pacaya fill most of this 1968 photo. Strombolian eruptions began at MacKenney crater in 1965 and continued for several decades.
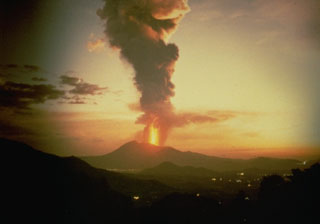 A lava fountain and ash plume rises above Pacaya, seen here in 1987 from the NW along the highway to Antigua Guatemala. Strombolian eruptions began in 1965 and were periodically interrupted by larger explosions such as this one, which deposited ash across wide areas.
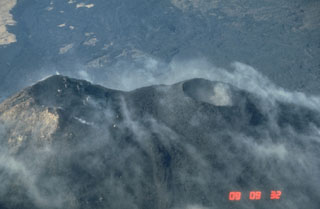 MacKenney crater (right), constructed NW of an older cone at the left, has been the source of most of Pacaya's historical eruptions. Frequent Strombolian eruptions repeatedly build up the cone after it is partially destroyed by intermittent larger explosions. An extensive lava flow field produced from MacKenney cone since 1965 is in the background of this 25 January 1987 view from the NE.
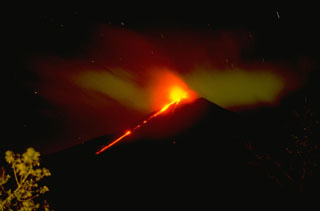 An incandescent lava flow from Pacaya is seen here moving down the SW flank with Strombolian explosions from the summit crater in November 1994.
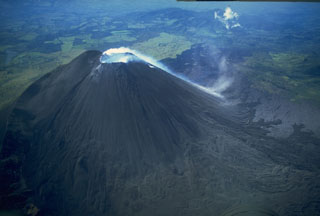 Gas emissions from the summit crater of the MacKenney cone of Pacaya descends its SW flank in this 10 November 1994 photo. Powerful explosions during 7-10 March 1989 that destroyed the upper 75 m of MacKenney cone, after which Strombolian activity resumed in early January 1990.
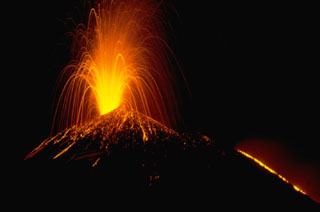 A Strombolian eruption at Pacaya volcano in Guatemala, November 1988. This time exposure shows the incandescent parabolic arcs of individual volcanic bombs explosively ejected from the vent. Larger bombs remain incandescent after they hit the surface of the cone and roll down its flanks. The orange line at the lower right is a lava flow extruding from a fissure on the upper NW flank of the MacKenney cone.
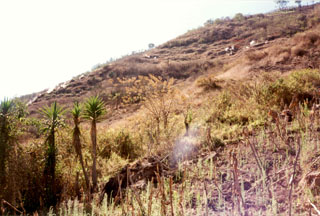 Steam rises from fumaroles at Laguna Caldera, within Amatitlán caldera near Pacaya. In addition to the fumaroles seen here near the southern margin of the caldera, hot springs are located at several places along the shore of Lake Amatitlán in the center of the caldera. This largely Pleistocene caldera has been the site of geothermal exploration because of the high heat flow in the system.
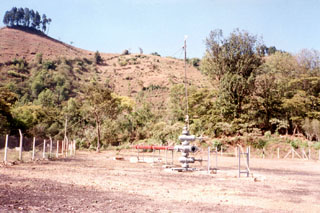 The geothermal well AMF-1 within Amatitlán caldera near Pacaya is seen here with the Laguna Caldera fault scarp in the background. Geothermal development within this 14 x 16 km Pleistocene caldera was providing electrical power to Guatemala's capital city, which overlies deposits from Amatitlán caldera.
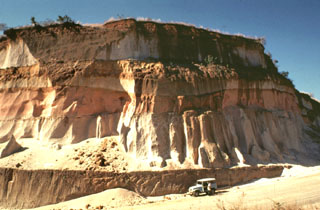 Thick units of the 84,000-year-old Los Chocoyos Ash are exposed south of Guatemala City, more than 100 km from its source at Atitlán caldera. Three units are visible here. The pinkish unit across the center of is the oxidized top of the pyroclastic flow deposit. The bottom two white units are the top and bottom halves of the deposit. The two fall deposits above the Los Chocoyos Ash are unit E from Amatitlán caldera and the younger unit C from Volcán de Agua.
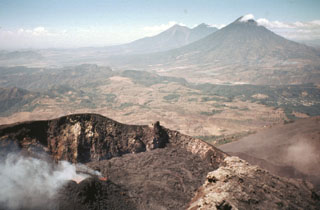 The Pacaya MacKenney crater contains spatter cones that have produced lava flows, and gas plumes like the one seen here. This photo taken in May 1981 shows the broad several-hundred-meter wide crater rim. From 9 May to 2 June lava flows from the spatter cones covered the crater floor and flowed through notch in the NW crater rim. In the background are Fuego and Acatenango (right-center) and Volcán de Agua (right).
 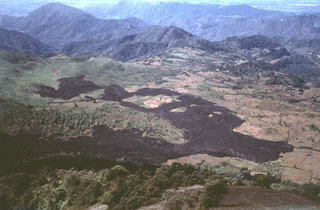 In February 1972 a lava flow from vents at the base of MacKenney cone at Pacaya descended the western flanks and covered farmlands on the caldera floor. The flow was diverted around topographic irregularities, forming several large kipukas. Lava effusion began on 2 February and lasted until the 27th. This December 1972 photo was taken from the summit of MacKenney cone with a village to the upper right
 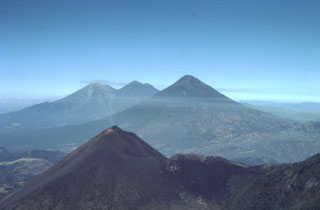 This view from the east shows four major volcanoes located within 45 km of Guatemala City. In the foreground is Pacaya, which has been in frequent eruption since 1965. The modern cone (left) partially overlaps the rim of a large caldera. The large volcano in the midground horizon is Volcán de Agua. In the background is Acatenango (right) and Fuego (left).
 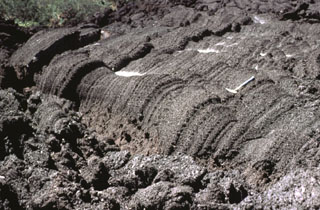 This lava flow surface were formed when still-fluid lava was squeezed through an irregular crack in previously solidified crust. Note the rock hammer at the right-center for scale. Frequent lava extrusion has occurred at Pacaya since 1965.
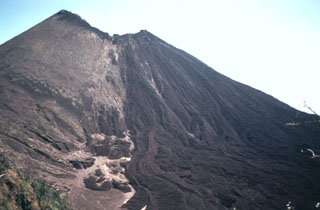 In May 1981 lava flows overtopped a notch in the NW rim of MacKenney crater and flowed down the northern flank. This view from Meseta on the caldera rim shows multiple individual flow lobes with levees. The dark lava field to the right contrasts with the tephra-covered slopes of the cone to the left. This period of frequent lava extrusion lasted from 9 May until 2 June.
 The Volcán de Pacaya massif rises above the capital city of Guatemala, located only 30 km to the north. The rounded, forested lava dome of Cerro Grande forms the high point at the left. The next highest peak to the right is the historically active vent of Pacaya, with the right-hand summit being the MacKenney cone, which has been active since 1965. Eruptions of Pacaya are often visible from Guatemala City.
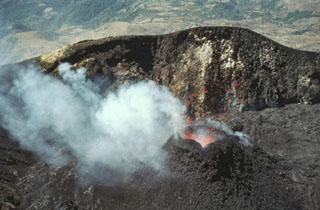 Incandescent lava spatter is ejected from a small cone in MacKenney crater in February 1981. Lava flows from the cone filled the crater floor and flowed out through a notch in the crater rim.
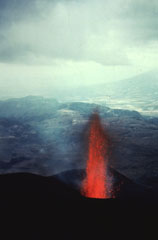 Incandescent lava rises from MacKenney crater early in the 1965-89 Pacaya eruption. The date of the photo is not certain but may have been around 1967. This view looks west from the summit of MacKenney cone with the flank of Volcán de Agua in the distance.
 Strombolian eruptions at a spatter cone in Pacaya’s MacKenney crater. Lava flows through a notch in the crater and descends the northern flank. The date of the photo is uncertain, but may have been around 1967.
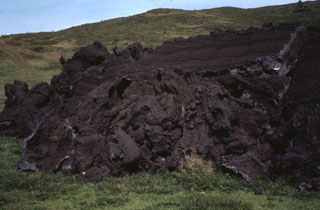 The front of the 1972 lava flow ends on grassy slopes on the southern flank of MacKenney cone at Pacaya. The rock hammer to the upper right provides scale next to the top of the flow front that formed when still-fluid lava was squeezed through an irregular crack in previously solidified crust.
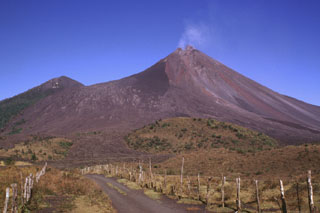 Lava flows were erupted in late 1998, seen across the upper left-hand flank of the degassing MacKenney cone at Pacaya in February 1999. They originated from vents at the summit and upper flanks of the cone and descended into the caldera before being deflected by the caldera wall to the west. The hill on the left horizon is Cerro Chino, a scoria cone constructed on the NW crater rim. Strong explosive eruptions in 1998 created a notch in the summit of MacKenney cone and the deep gully that extends diagonally down to the right.
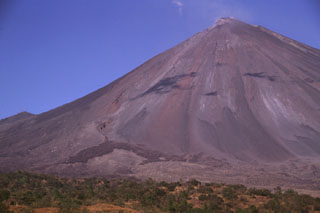 Frequent eruptions from MacKenney crater at Pacaya have kept the flanks free of vegetation. The summit towers more than 1 km above its base. The darker area to the lower left in this February 1999 photo is a September 1998 lava flow that originated from a vent on the lower SW flank that bifurcated into lobes that traveled to the SW and S. The lighter area below the flow extending to the right margin of the photo is a debris avalanche deposit that formed when the summit crater rim collapsed.
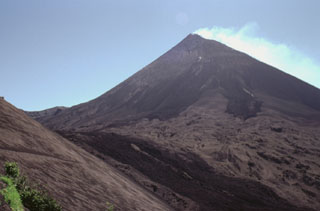 The degassing MacKenney cone at Pacaya is seen here from the NW below Cerro Chino scoria cone, whose ash-covered flank appears to the left. Darker lava flows that were erupted in 1998 descend from the summit and down the moat to the left. This flow and the two dark lobes above were erupted during the 18-19 September 1998 eruption. Lighter tephra deposits between the flows cover previous lava flows.
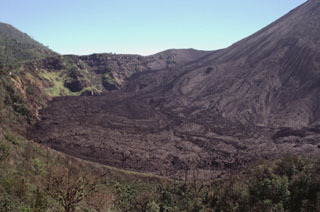 Lava flows erupted in September 1998 cover the floor of the caldera moat of Pacaya. The caldera wall here is about 100 m high. Frequent lava flows from MacKenney cone, whose flank is to the right, have been gradually forming deposits to tens of meters higher than it was a decade ago. Eruptions at MacKenney cone have been frequent since its initial eruption in 1965. The ridge in the foreground is the crater rim of Cerro Chino.
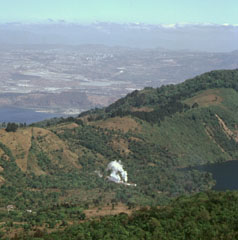 A steam plume rising from a geothermal site in Amatitlán caldera is seen here from the caldera rim of Pacaya, with Guatemala City in the background. Laguna Calderas contains the lake to the right and beyond the ridge to the left is part of Lake Amatitlán. The 14 x 16 km Amatitlán caldera produced a large number of major explosive eruptions that covered the current site of Guatemala City with pyroclastic flows during the late Pleistocene. The caldera retains a high heat flow that is being exploited for geothermal energy.
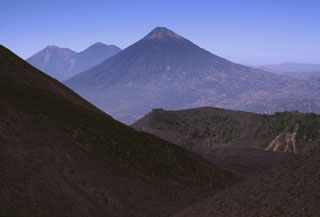 Volcán de Agua is in the center of this photo and lava flows from MacKenney cone form the slope in the foreground. They have filled in the moat of the Pacaya caldera almost to the level of the lower Cerro Chino crater rim, with the communication antennas along the summit in the midground. The two volcanoes on the left horizon are Fuego (left), one of the most active in Guatemala, and Acatenango (right).
 Tephra deposits from periodic larger eruptions of Pacaya coat a roof on Cerro Chino. A major eruption on 7 June 1995 caused the WNW side of Pacaya's crater to collapse, producing debris that slammed into the caldera wall at Cerro Chino, 1 km NW of the summit. A secondary hot cloud swept over Cerro Chino, destroyed a radio antenna, and affected houses within 2 km of the active vent.
 Thick sequences of tephra from Amatitlán caldera are exposed in roadcuts in the Guatemala City area, note INSIVUMEH geologist Otoniel Matías for scale at the lower right. This exposure is located south of the capital city, along the road to Palin. Major explosive eruptions from Amatitlán caldera have been dated to between about 300,000 to less than 23,000 years ago. The northern caldera rim is buried by thick pyroclastic deposits and underlies portions of Guatemala City.
 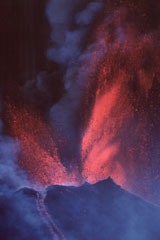 Vigorous lava fountaining occurred during a major eruptive episode the afternoon of 16 January 2000, initially reaching heights of 800 m then diminishing to 300 m. Fallout from the fountains fed near-constant avalanches and lava flows that traveled to the SW and N. Typical Strombolian activity resumed around 2030 that day. More or less continuous activity had resumed at Pacaya in January 1990 after 9-month-long quiescence.
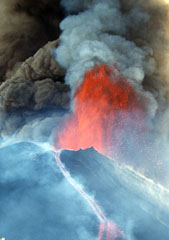 A lava fountain and ash plumes erupt above MacKenney crater at Pacaya during a major eruptive episode on 16 January 2000. A lava flow is also descending the northern flank of the cone. After a quiescent period of nine months, eruptive activity had been more or less continuous at Pacaya since January 1990. Activity has consisted of frequent moderate eruptions that constructed the summit cone, punctuated by occasional larger explosions such as this one that enlarge the crater and reduce the height of the cone.
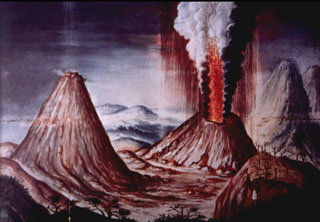 This contemporary painting of the 1775 Pacaya eruption of shows a lava fountain and ash plume rising above Cerro Chino. The perspective of the painting is from Meseta on the NE rim of Pacaya's large summit caldera. To the left is MacKenney cone, and to the far right is Volcán de Agua. An explosive eruption, one of the largest in historical time from Pacaya, began on 1 July 1775 and produced extensive ashfall and a lava flow.
 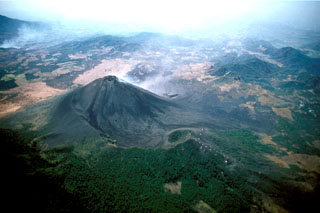 An aerial view from the NNW shows gas emanating from the MacKenney cone. The rim of the large horseshoe-shaped crater within which the cone was constructed is visible in the foreground, partially covered by Cerro Chino scoria cone on the right. The crater formed by collapse of Pacaya during the late-Holocene and produced a debris avalanche that traveled down the Metapa river drainage to the SE, reaching as far as the Pacific coastal plain 25 km away.
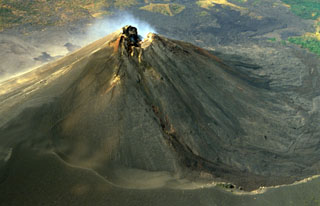 The degassing MacKenney cone summit crater of Pacaya is shown in this February 1999 aerial view from the north. A trail in the foreground is along the rim of a large horseshoe-shaped crater inside which the cone was constructed. Lava flows from the summit crater and flank vents of MacKenney cone have traveled into the moat and subsequently been deflected to the west and south.
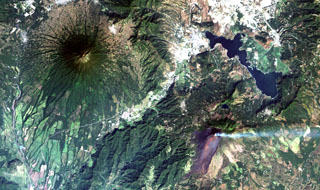 Steaming Pacaya volcano (lower right) lies across a valley from symmetrical Agua volcano (upper left). Pacaya was constructed near the southern margin of Amatitlán caldera, whose SE rim lies near the right-center margin. The 14 x 16 km wide caldera was formed during a series of major silicic explosive eruptions between about 300,000 and 23,000 years ago. The irregular margins of Lake Amatitlán are constrained on the SW side by post-caldera lava domes. The outskirts of Guatemala City lie at the upper right.
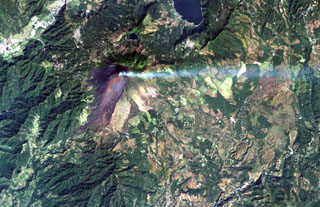 A volcanic plume extends to the east from MacKenney crater at Pacaya volcano in this December 8, 2000 Landsat image. The unvegetated modern cone was constructed within a scarp (visible south of the summit) left by a major edifice collapse at Pacaya volcano about 1100 years ago. The avalanche swept 25 km down the Río Metapa drainage (lower left) to the Pacific coastal plain. Pacaya was constructed near the southern rim of Amatitlán caldera, partially filled by Lake Amatitlán at the top right.
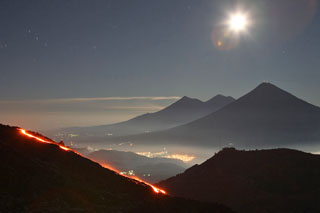 This time-lapse night view of Pacaya's MacKenney cone is looking towards the W in December 2007. The lower-relief Cerro Chino of the Pacaya complex in the right foreground, and in the background from right to left are Volcán de Agua, Acatenango, and Fuego.
 This February 2018 panorama shows the relative positions of several eastern Guatemalan volcanoes. From left to right are Fuego, Acatenango, Agua, and Pacaya.
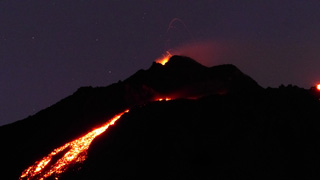 Lava flows down the upper eastern flank of Pacaya are visible in this photo from the night of 17 February 2020. Incandescent lava fountaining from the active Mackenney cone above is the source of the flow.
The following 25 samples associated with this volcano can be found in the Smithsonian's NMNH Department of Mineral Sciences collections, and may be availble for research (contact the Rock and Ore Collections Manager). Catalog number links will open a window with more information.
| Catalog Number | Sample Description | Lava Source | Collection Date |
|---|---|---|---|
| NMNH 111213 | Basalt | -- | -- |
| NMNH 111214 | Basalt | -- | -- |
| NMNH 113058 | Volcanic Ash | -- | -- |
| NMNH 113072 | Basalt | -- | -- |
| NMNH 113073 | Basalt | -- | -- |
| NMNH 113074 | Basalt | -- | -- |
| NMNH 113100-29 | Basalt (?) | CERRO CHINO | -- |
| NMNH 113100-30 | Basalt (?) | CERRO CHINO | -- |
| NMNH 113100-31 | Volcanic Ash | -- | -- |
| NMNH 113100-32 | Volcanic Ash | -- | -- |
| NMNH 113100-33 | Volcanic Ash | -- | -- |
| NMNH 113100-34 | Pumice | -- | -- |
| NMNH 113100-35 | Anorthite | -- | -- |
| NMNH 113100-36 | Glassy Volcanic Cinder | -- | -- |
| NMNH 113100-37 | Pumice | -- | -- |
| NMNH 113100-38 | Olivine | -- | -- |
| NMNH 113100-39 | Airfall Volcanic Ash | -- | -- |
| NMNH 113100-40 | Pumice | -- | -- |
| NMNH 113100-41 | Basalt (?) | -- | -- |
| NMNH 113100-42 | Lava | -- | -- |
| NMNH 116141 | Basaltic Scoria | -- | -- |
| NMNH 117127 | Volcanic Ash | -- | -- |
| NMNH 117176 | Lava | -- | 1 Feb 1999 |
| NMNH 121271-00 | Anorthite | -- | -- |
| NMNH 122261-00 | Anorthite | -- | -- |
| Copernicus Browser | The Copernicus Browser replaced the Sentinel Hub Playground browser in 2023, to provide access to Earth observation archives from the Copernicus Data Space Ecosystem, the main distribution platform for data from the EU Copernicus missions. |
| MIROVA | Middle InfraRed Observation of Volcanic Activity (MIROVA) is a near real time volcanic hot-spot detection system based on the analysis of MODIS (Moderate Resolution Imaging Spectroradiometer) data. In particular, MIROVA uses the Middle InfraRed Radiation (MIR), measured over target volcanoes, in order to detect, locate and measure the heat radiation sourced from volcanic activity. |
| MODVOLC Thermal Alerts | Using infrared satellite Moderate Resolution Imaging Spectroradiometer (MODIS) data, scientists at the Hawai'i Institute of Geophysics and Planetology, University of Hawai'i, developed an automated system called MODVOLC to map thermal hot-spots in near real time. For each MODIS image, the algorithm automatically scans each 1 km pixel within it to check for high-temperature hot-spots. When one is found the date, time, location, and intensity are recorded. MODIS looks at every square km of the Earth every 48 hours, once during the day and once during the night, and the presence of two MODIS sensors in space allows at least four hot-spot observations every two days. Each day updated global maps are compiled to display the locations of all hot spots detected in the previous 24 hours. There is a drop-down list with volcano names which allow users to 'zoom-in' and examine the distribution of hot-spots at a variety of spatial scales. |
|
WOVOdat
Single Volcano View Temporal Evolution of Unrest Side by Side Volcanoes |
WOVOdat is a database of volcanic unrest; instrumentally and visually recorded changes in seismicity, ground deformation, gas emission, and other parameters from their normal baselines. It is sponsored by the World Organization of Volcano Observatories (WOVO) and presently hosted at the Earth Observatory of Singapore.
GVMID Data on Volcano Monitoring Infrastructure The Global Volcano Monitoring Infrastructure Database GVMID, is aimed at documenting and improving capabilities of volcano monitoring from the ground and space. GVMID should provide a snapshot and baseline view of the techniques and instrumentation that are in place at various volcanoes, which can be use by volcano observatories as reference to setup new monitoring system or improving networks at a specific volcano. These data will allow identification of what monitoring gaps exist, which can be then targeted by remote sensing infrastructure and future instrument deployments. |
| Volcanic Hazard Maps | The IAVCEI Commission on Volcanic Hazards and Risk has a Volcanic Hazard Maps database designed to serve as a resource for hazard mappers (or other interested parties) to explore how common issues in hazard map development have been addressed at different volcanoes, in different countries, for different hazards, and for different intended audiences. In addition to the comprehensive, searchable Volcanic Hazard Maps Database, this website contains information about diversity of volcanic hazard maps, illustrated using examples from the database. This site is for educational purposes related to volcanic hazard maps. Hazard maps found on this website should not be used for emergency purposes. For the most recent, official hazard map for a particular volcano, please seek out the proper institutional authorities on the matter. |
| IRIS seismic stations/networks | Incorporated Research Institutions for Seismology (IRIS) Data Services map showing the location of seismic stations from all available networks (permanent or temporary) within a radius of 0.18° (about 20 km at mid-latitudes) from the given location of Pacaya. Users can customize a variety of filters and options in the left panel. Note that if there are no stations are known the map will default to show the entire world with a "No data matched request" error notice. |
| UNAVCO GPS/GNSS stations | Geodetic Data Services map from UNAVCO showing the location of GPS/GNSS stations from all available networks (permanent or temporary) within a radius of 20 km from the given location of Pacaya. Users can customize the data search based on station or network names, location, and time window. Requires Adobe Flash Player. |
| DECADE Data | The DECADE portal, still in the developmental stage, serves as an example of the proposed interoperability between The Smithsonian Institution's Global Volcanism Program, the Mapping Gas Emissions (MaGa) Database, and the EarthChem Geochemical Portal. The Deep Earth Carbon Degassing (DECADE) initiative seeks to use new and established technologies to determine accurate global fluxes of volcanic CO2 to the atmosphere, but installing CO2 monitoring networks on 20 of the world's 150 most actively degassing volcanoes. The group uses related laboratory-based studies (direct gas sampling and analysis, melt inclusions) to provide new data for direct degassing of deep earth carbon to the atmosphere. |
| Large Eruptions of Pacaya | Information about large Quaternary eruptions (VEI >= 4) is cataloged in the Large Magnitude Explosive Volcanic Eruptions (LaMEVE) database of the Volcano Global Risk Identification and Analysis Project (VOGRIPA). |
| EarthChem | EarthChem develops and maintains databases, software, and services that support the preservation, discovery, access and analysis of geochemical data, and facilitate their integration with the broad array of other available earth science parameters. EarthChem is operated by a joint team of disciplinary scientists, data scientists, data managers and information technology developers who are part of the NSF-funded data facility Integrated Earth Data Applications (IEDA). IEDA is a collaborative effort of EarthChem and the Marine Geoscience Data System (MGDS). |